Embed Size (px)
Citation preview
UNIVERSITY OF CAMBRIDGE
MICROBIALDEGRADATION OF RDX
Helena M. B. Seth-Smith
Trinity Hall
2002
This thesis is submitted for the degree of Doctor of Philosophy. This dissertation is the result ofmy own work and includes nothing which is the outcome of work done in collaboration exceptwhere specifically indicated in the text.
ii
“Science – that sister who, at all events, does not laugh in your face,
but always repays you, though sometimes in rather hollow coin,
for the attentions bestowed upon her”
Victor Hugo
Hunchback of Notre Dame
1831
iii
Acknowledgements
First of all I’d like to dedicate this work to my mother. She’d be pleased (I hope!),although she’d probably have preferred to be alive to read it. She’d probably be a bit proud ofme too, and I guess I owe her a lot.
Before I really start blubbering, I’d like to move on to the great folks at the Institute ofBiotechnology. Cheers to Neil for supporting me throughout my Ph.D. and for agreeing to sendme to far flung bits of the world to learn things without which this thesis wouldn’t be nearly as fatas it is! Cheers to Suz especially (adviser, encourager and landlady extraordinaire!), and alsoloads to Amrik, both of whom gave me lots of ideas and support throughout my Ph.D. I alsoreally appreciate the help I got at the University of Witswatersrand, from Professor Dabbs and allhis students. Thanks to Nerissa, Zor, Birgitte, Richard, Emma, Debs, Ian, Leila, Fred andeveryone else who’s been in the lab at any stage in the past four years for providing me with help,extracurricular intrigue and other fun. And the tortured people – those from whom I havedemanded advice on thesis drafts – you may never be the same again, but my thesis is all thebetter for it, so thanks muchly: Elaine, Neil, Suz, Rich, Holty and Paul. It seems that Neil’s lab atBiotech has come to the end of an era, and I’m glad to have been part of it.
My Dad has to be thanked for always being enthusiastic about everything! He’s brilliantto talk a problem through with, and I’ve appreciated his help and advice on loads of things.Thanks to flatmates Miz and Suzy for cheering me up when necessary and showing a vagueinterest in what I’ve been doing.
And to Paul, who’s had to put up with my stressedness over the past few months, and hasbeen lovely all the time, even when his attempts to get me to relax have been thwarted! You’vecertainly had the brunt of it! So now this is over it’ll be as wonderful as the past two years havebeen again! And I guess that Biotech has another gold star for having thrown us together in thefirst place!
I’ll remember you all when I’m rich and famous!!!
iv
Abstract
Large amounts of land and groundwater have been polluted through the manufacture,
detonation and disposal of explosives. Explosives are xenobiotic compounds, being toxic to
biological systems, and their recalcitrance leads to persistence in the environment. The methods
currently used for the remediation of explosive contaminated sites are expensive and can result in
the formation of toxic products. Bioremediation, using characterized bacteria or isolated
enzymes, holds potential for explosive remediation. Enzymes which can degrade or transform
two of the three classes of explosives, nitrate esters and nitroaromatics, have been identified, but
no enzymes with activity against the nitramine explosives have been characterized. Of the
nitramines, RDX is currently the most widely used military explosive and is of particular
environmental concern because of its mobility in soil.
The aim of this project is to isolate bacteria able to degrade RDX aerobically, and to
characterize the basis of this ability. Nineteen bacteria which could degrade RDX as a sole
source of nitrogen were isolated. All the isolates were identified as unique strains of rhodococci
and their ability to degrade RDX was compared. Rhodococcus rhodochrous strain 11Y was
chosen for further characterization.
Rhodococcus rhodochrous strain 11Y can remove RDX from culture at a rate comparable
to the best characterized strains to date. The activity against RDX is present in cells grown in the
absence of RDX, and is increased threefold in its presence. Three of the six nitrogens from RDX
are utilized for growth, but related nitramine explosives cannot be used by strain 11Y as sources
of nitrogen. Products of RDX degradation by strain 11Y were identified as nitrite, formate and
formaldehyde, which do not correlate entirely with the proposed mechanisms of aerobic RDX
breakdown.
A genomic library from strain 11Y was transformed into a non RDX degrading strain of
R. rhodochrous, and RDX degrading clones were selected for by enrichment using RDX as a sole
source of nitrogen. A fragment of DNA which was able to confer upon this strain the ability to
degrade RDX was isolated and found to contain three open reading frames. Subcloning
identified the fragment necessary for activity against RDX, containing a cytochrome P450-like
gene with a flavodoxin domain at the N-terminal end, designated xplA. A reductase-like gene,
designated xplB, was found immediately upstream. The use of a P450 in RDX degradation was
proved functionally using a P450 specific inhibitor. This is the first time that a gene responsible
for the degradation of RDX has been cloned and identified. P450s are often responsible for the
degradation or detoxification of xenobiotic compounds, and commonly operate through
hydroxylation of the substrate. The function of the fused flavodoxin domain in electron transport
has not been demonstrated, but would represent a novel class of P450 system. The expression of
XplA and XplB has been achieved in E. coli, although active recombinant proteins were not
obtained.
v
Abbreviations
bp base pair(s)cDNA complementary DNACL20 2,4,6,8,10,12-hexonitrohexazaisowurtzitaneDEPC diethyl pyrocarbonateDNX hexahydro-1,3-dinitroso-5-nitro-1,3,5-triazinedH2O ultra high pressure purified waterDMF N,N-dimethylformamideDNA deoxyribose nucleic aciddNTP dinucleotide triphosphateDstl Defence science and technology laboratoryEDTA ethylenediaminetetraacetic acidEPA Environmental Protection AgencyFAD flavin adenine dinucleotideFMN flavin mononucleotideGCG Genetics Computer GroupGTN glycerol trinitrate, nitroglycerineHMX high melting explosive, octahydro-1,3,5,7-tetranitro-1,3,5.7-tetrazocineHPLC high performance liquid chromatographyIPTG isopropyl-β-D-thiogalactopyranosidekb kilobase pair(s)kDa kilodaltonLA Luria Bertani agarLB Luria Bertani brothMNX hexahydro-1-nitroso-3,5-dinitro-1,3,5-triazineNED N-(1-naphthyl)ethylenediamineOD600 optical density at 600 nmORF open reading framePAGE polyacrylamide gel electrophoresisPAH polyaromatic hydrocarbonPCR polymerase chain reactionPEG polyethylene glycolPETN pentaerithritol tetranitratePVDF polyvinyl difluoriderDNA ribosomal DNARDX royal demolition explosive, hexahydro-1,3,5-trinitro-1,3,5-triazineRf retardation factorRNA ribose nucleic acidRT reverse transcriptaseSDS sodium dodecyl sulphatesp. speciesTAE Tris-acetate-EDTATE Tris-EDTATES N-tris[hydroxymethyl]methyl-2-aminoethanesulfonic acidTLC thin layer chromatographyTm melting temperatureTNT 2,4,6-trinitrotolueneTNX hexahydro-1,3,5-trinitroso -1,3,5-triazinetRNA transfer RNAX-gal 5-bromo-4-chloro-3-indolyl-β-D-galactopyranoside
vi
Publication arising from this work
Seth-Smith, H.M.B., Rosser, S.J., Basran, A., Travis, E.R., Dabbs, E.R., Nicklin, S. and
Bruce, N.C. (2002) Cloning, Sequencing and Characterization of the Hexahydro-1,3,5-trinitro-
1,3,5-triazine Degradation Gene Cluster from Rhodococcus rhodochrous. Appl. Environ.
Microbiol. 68:4764-4771.
vii
Table of Contents
Acknowledgements iiiAbstract ivAbbreviations vPublication arising from this work viTable of contents vii
1. Introduction 11.1 Explosives 11.2 Development of explosives 11.3 Toxicity of explosives 41.4 Explosives as environmental pollutants 51.5 Methods for soil decontamination 7
1.5.1 Incineration 71.5.2 Composting 7
1.6 Biodegradation of explosives 91.6.1 Nitrate ester explosives 91.6.2 Nitroaromatic explosives 111.6.3 Nitramine explosives 11
1.7 RDX degradation 131.7.1 Physico-chemical breakdown of RDX 141.7.2 Biodegradation of RDX 161.7.3 Products of RDX breakdown 21
1.8 Applications of explosive degrading enzymes 221.9 Aims of this study 23
2. General materials and methods 242.1 Reagents 242.2 Organisms, plasmids and growth conditions 24
2.2.1 Bacterial strains 242.2.2 Plasmids 242.2.3 Media 25
2.3 General cloning techniques 252.3.1 Preparation of genomic and plasmid DNA 252.3.2 Gel electrophoresis of DNA 262.3.3 Restriction endonuclease digestion of DNA 262.3.4 Purification of DNA fragments from agarose 262.3.5 DNA ligation 272.3.6 Polymerase chain reaction amplification 272.3.7 Transformation of E. coli hosts 272.3.8 Nucleotide sequencing and analysis 27
2.4 Analytical techniques 282.4.1 Spectrophotometry 282.4.2 Thin layer chromatography 282.4.3 High performance liquid chromatography 282.4.4 Griess assay 29
viii
2.4.5 Ion chromatography 292.4.6 Analysis of formaldehyde 29
3. Isolation, identification and characterization of bacteria possessing RDXdegrading activity 303.1 Background 303.2 Materials and methods 32
3.2.1 Isolation and purification of RDX degrading strains 323.2.2 Removal of RDX from growth medium 323.2.3 Zones of clearance on RDX plates 323.2.4 Utilization of RDX as a carbon and nitrogen source 323.2.5 Identification of bacterial isolates 333.2.6 Antibiotic resistance testing 343.2.7 TNT tolerance testing 343.2.8 Extraction of large plasmids 343.2.9 Resting cell incubations of bacterial isolates 35
3.3 Results 363.3.1 Isolation and purification of 19 RDX degrading strains 363.3.2 Utilization of RDX as a carbon and nitrogen source 403.3.3 Identification of bacterial isolates 413.3.4 Antibiotic resistance profiles 453.3.5 Tolerance of bacterial isolates to TNT 483.3.6 Plasmid extractions from isolates 493.3.7 Comparison of the RDX degradation rates of bacterial isolates 50
3.4 Discussion 56
4. Characterization of Rhodococcus rhodochrous strain 11Y on RDX 614.1 Background 614.2 Materials and methods 62
4.2.1 Growth of strain 11Y on RDX as a nitrogen source 624.2.2 Determination of nitrogens from RDX used by strain 11Y 624.2.3 Inducibility of RDX degrading ability 624.2.4 Strain 11Y tolerance of HMX and CL20 624.2.5 Determination of growth on HMX and CL20 as nitrogen sources 634.2.6 Resting cell incubations of strain 11Y 63
4.3 Results 644.3.1 Growth of strain 11Y on RDX as a nitrogen source 644.3.2 Number of nitrogens from RDX used by strain 11Y 654.3.3 Inducibility of strain 11Y RDX degrading activity 66
4.3.4 Growth of strain 11Y on other nitramine explosives 67
4.3.5 Products of resting cell incubations of strain 11Y with RDX 684.4 Discussion 70
5. Cloning, sequencing and analysis of the gene cluster responsible for RDXdegrading ability 745.1 Background 745.2 Materials and methods 76
ix
5.2.1 Library construction 765.2.2 Microtitre plate assays of E. coli 765.2.3 Transfer of library into rhodococcal host 775.2.4 Growth of strain CW25(pHSX1) on RDX 785.2.5 Primers used for sequencing and subcloning pHSX1 795.2.6 Subcloning insert to determine RDX degrading region 795.2.7 RNA manipulation 805.2.8 Resting cell incubations with metyrapone 81
5.3 Results 825.3.1 Construction of strain 11Y library in E.coli 825.3.2 Screening of library in E.coli 855.3.3 Transfer of library into rhodococcal host 875.3.4 Screening of library in rhodococcal host 895.3.5 Growth of strain CW25(pHSX1) on RDX 925.3.6 Restriction analysis of insert conferring RDX degrading ability 945.3.7 Sequence analysis of insert conferring RDX degrading ability 955.3.8 Subcloning insert to determine RDX degrading region 975.3.9 Sequence analysis of amino acid translation of ORFs 1025.3.10 RT-PCR analysis of xplA and xplB transcription 1065.3.11 Evidence for P450 function using an inhibitor 109
5.4 Discussion 111
6. Heterologous expression of XplA and XplB 1176.1 Background 1176.2 Materials and methods 118
6.2.1 Expression constructs 1186.2.2 Expression strains and growth conditions 1196.2.3 Preparation of crude extracts 1196.2.4 Protein concentration determination 1206.2.5 SDS-PAGE electrophoresis 1206.2.6 Activity assay 1206.2.7 Electroblotting and N-terminal sequencing 120
6.3 Results 1226.3.1 Expression of XplA and XplB in E. coli hosts 1226.3.2 Identity analysis of expressed proteins 129
6.4 Discussion 130
7. Final discussion 134
References 139
Chapter 1 - Introduction
1
Chapter 1. Introduction
1.1 Explosives
Explosives are materials which, when suitably initiated, result in the rapid release of
energy. Detonation of the solid explosive generates expanding hot gases. This expansion creates
a shock wave which exerts high pressures on the surroundings, causing an explosion. Explosives
generally have high nitrogen and oxygen contents which aid the formation of the gaseous
products, typically including carbon dioxide, carbon monoxide, oxygen, nitrogen and water
vapour.
The development of explosives has sought to provide both greater power and greater
control. Mass production of some of these compounds over the last century has led to extensive
contamination of land, which now requires remediation.
1.2 Development of explosives
The history of explosives discussed here extends from the mixture of gunpowder to the
industrialization of the explosive developing and manufacturing processes, and is presented in
more detail by Brown 42.
Gunpowder is the first explosive known to be formulated, a combination of potassium
nitrate (saltpetre), sulphur and charcoal discovered by the Chinese in the mid ninth century.
News of this “black powder” travelled to the West and the recipe was revealed to the public by
Roger Bacon in 1260. Although used initially in what are now known as fireworks, gunpowder
was also instrumental in the development of the first gun, from China in 1280. Gunpowder’s
destructive power has since been harnessed for more productive purposes; the first instance of its
use in mining is recorded in Hungary in 1627.
Glycerol trinitrate (nitroglycerine or GTN) was developed by Ascanio Sobrero in 1847. It
was first characterized as a medicine and is still used in the treatment of angina pectoris. Today
GTN is better known as a powerful explosive. It is an example of a nitrate ester explosive,
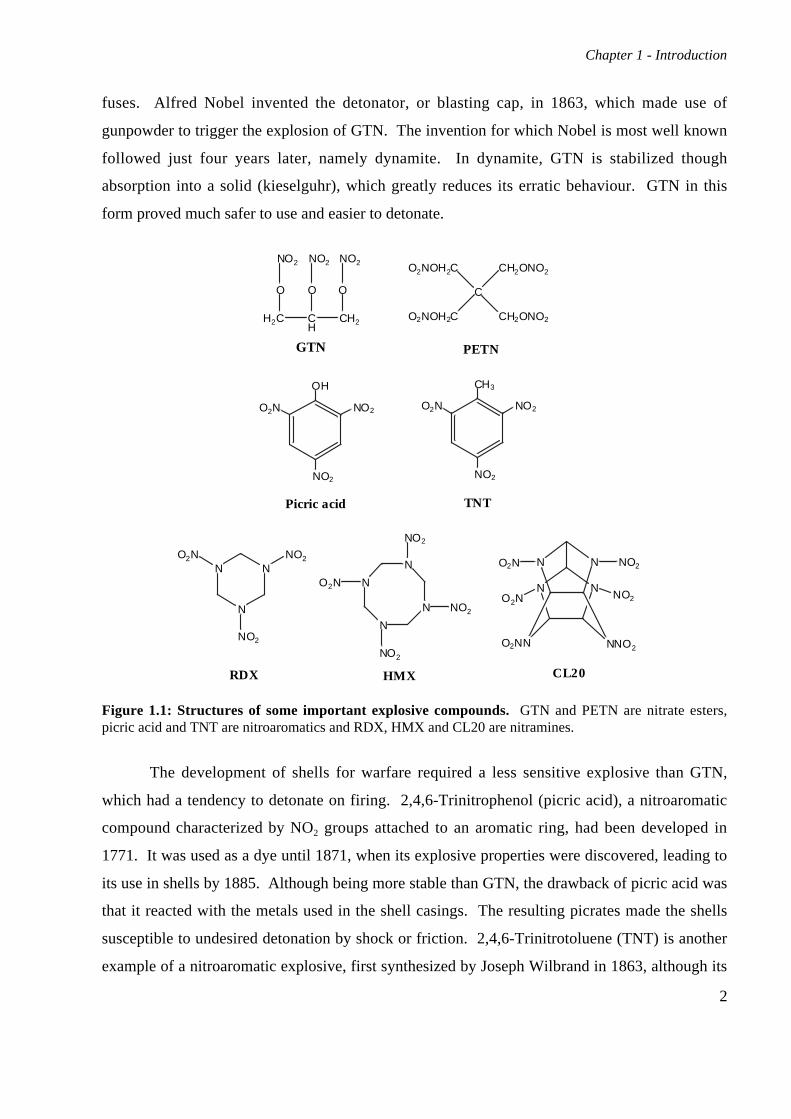
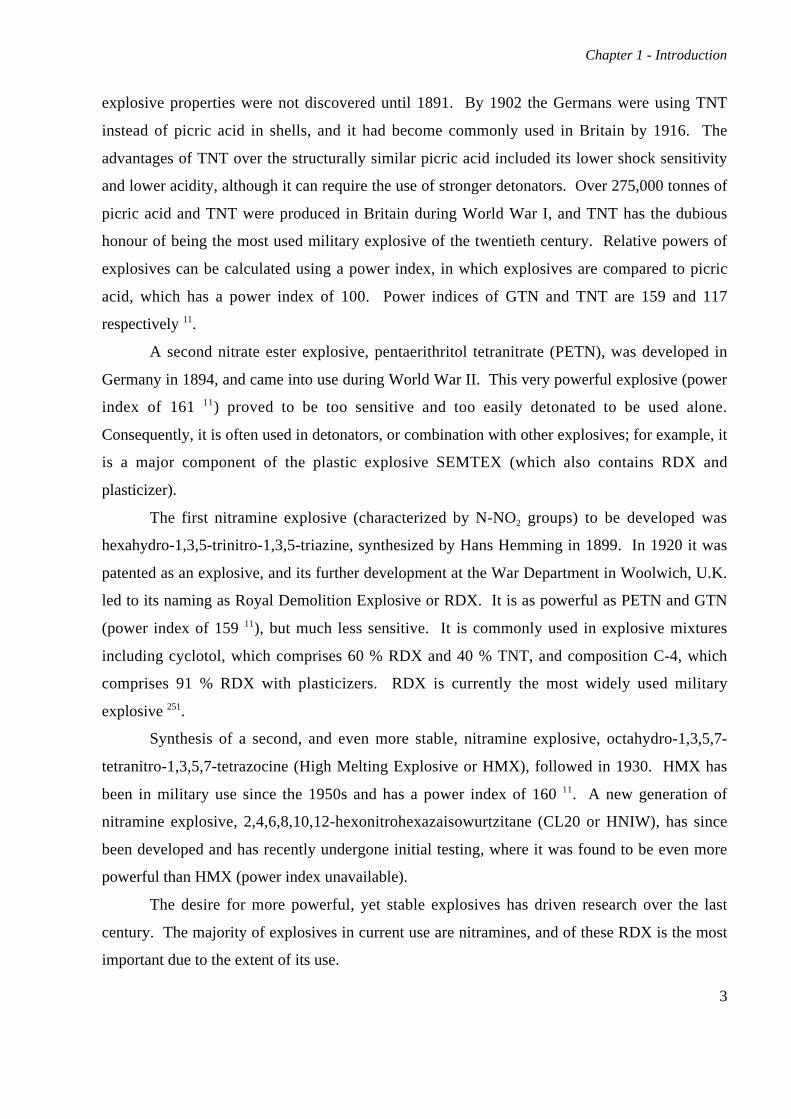
characterized by the O-NO2 bond. Structures of examples from all classes of important
explosives are shown in Figure 1.1. GTN was found to be a very unpredictable explosive,
capable of either exploding when not desired, or of not exploding when detonated. Part of the
problem was due to the unreliable methods used to initiate detonation, namely by fire or with
Chapter 1 - Introduction
2
fuses. Alfred Nobel invented the detonator, or blasting cap, in 1863, which made use of
gunpowder to trigger the explosion of GTN. The invention for which Nobel is most well known
followed just four years later, namely dynamite. In dynamite, GTN is stabilized though
absorption into a solid (kieselguhr), which greatly reduces its erratic behaviour. GTN in this
form proved much safer to use and easier to detonate.
Figure 1.1: Structures of some important explosive compounds. GTN and PETN are nitrate esters,picric acid and TNT are nitroaromatics and RDX, HMX and CL20 are nitramines.
The development of shells for warfare required a less sensitive explosive than GTN,
which had a tendency to detonate on firing. 2,4,6-Trinitrophenol (picric acid), a nitroaromatic
compound characterized by NO2 groups attached to an aromatic ring, had been developed in
1771. It was used as a dye until 1871, when its explosive properties were discovered, leading to
its use in shells by 1885. Although being more stable than GTN, the drawback of picric acid was
that it reacted with the metals used in the shell casings. The resulting picrates made the shells
susceptible to undesired detonation by shock or friction. 2,4,6-Trinitrotoluene (TNT) is another
example of a nitroaromatic explosive, first synthesized by Joseph Wilbrand in 1863, although its
N
N
NNO2
NO2
O2N
RDX
N
N
N
N
NO2
NO2
NO2
O2N
HMX
N N
O2NN NNO2
N NO2N
O2N NO2
NO2
CL20
CH3
NO2
NO2
O2N
H2C CH
CH2
O O O
NO2 NO2 NO2
C
CH2ONO2
CH2ONO2O2NOH2C
O2NOH2C
TNT
Nitrogly cerin PETN
OH
NO2
NO2
O2N
Picric acid
GTN
Chapter 1 - Introduction
3
explosive properties were not discovered until 1891. By 1902 the Germans were using TNT
instead of picric acid in shells, and it had become commonly used in Britain by 1916. The
advantages of TNT over the structurally similar picric acid included its lower shock sensitivity
and lower acidity, although it can require the use of stronger detonators. Over 275,000 tonnes of
picric acid and TNT were produced in Britain during World War I, and TNT has the dubious
honour of being the most used military explosive of the twentieth century. Relative powers of
explosives can be calculated using a power index, in which explosives are compared to picric
acid, which has a power index of 100. Power indices of GTN and TNT are 159 and 117
respectively 11.
A second nitrate ester explosive, pentaerithritol tetranitrate (PETN), was developed in
Germany in 1894, and came into use during World War II. This very powerful explosive (power
index of 161 11) proved to be too sensitive and too easily detonated to be used alone.
Consequently, it is often used in detonators, or combination with other explosives; for example, it
is a major component of the plastic explosive SEMTEX (which also contains RDX and
plasticizer).
The first nitramine explosive (characterized by N-NO2 groups) to be developed was
hexahydro-1,3,5-trinitro-1,3,5-triazine, synthesized by Hans Hemming in 1899. In 1920 it was
patented as an explosive, and its further development at the War Department in Woolwich, U.K.
led to its naming as Royal Demolition Explosive or RDX. It is as powerful as PETN and GTN
(power index of 159 11), but much less sensitive. It is commonly used in explosive mixtures
including cyclotol, which comprises 60 % RDX and 40 % TNT, and composition C-4, which
comprises 91 % RDX with plasticizers. RDX is currently the most widely used military
explosive 251.
Synthesis of a second, and even more stable, nitramine explosive, octahydro-1,3,5,7-
tetranitro-1,3,5,7-tetrazocine (High Melting Explosive or HMX), followed in 1930. HMX has
been in military use since the 1950s and has a power index of 160 11. A new generation of
nitramine explosive, 2,4,6,8,10,12-hexonitrohexazaisowurtzitane (CL20 or HNIW), has since
been developed and has recently undergone initial testing, where it was found to be even more
powerful than HMX (power index unavailable).
The desire for more powerful, yet stable explosives has driven research over the last
century. The majority of explosives in current use are nitramines, and of these RDX is the most
important due to the extent of its use.
Chapter 1 - Introduction
4
1.3 Toxicity of explosives
In addition to their destructive capacity, explosives commonly have toxic effects on
biological systems. The nitrate esters, including PETN and GTN, are toxic to mammals mainly
through their vasodilatory effects and ability to cause methaemoglobinaemia, which affects the
ability of red blood cells to transport oxygen 296. GTN has been used medically, in small doses,
as a vasodilator for over 100 years 296; the effects are thought to be due to the action of nitric
oxide (NO) produced by metabolism of GTN 269. Low levels of exposure in humans lead to
headaches and nausea and occasionally to vomiting and abdominal pains 15. Throughout the
industrial production of these compounds, no fatalities or chronic effects have been reported
through exposure to nitrate esters, although there have been some cases of dermatitis 296.
Symptoms of nitrate ester exposure in animal studies include decreases in blood pressure and
respiratory problems 296. Acute exposure can lead to death as a result of respiratory or cardiac
arrest 296, and GTN has an acute oral LD50 (dose lethal to 50 % of test animals) of 0.5-0.9 g/kg
body weight in rats 207. GTN has been designated a class C carcinogen by the U.S.
Environmental Protection Agency (EPA), indicating potential carcinogenicity, although evidence
from both animal models and humans is limited 251. There is very little data on the toxic effects
of PETN, and no LD50 is referred to in the literature. PETN is a less potent vasodilator than GTN296 and appears to be relatively non-toxic 251.
TNT is a mutagen and causes liver damage. In humans, TNT can cause dermatitis,
vomiting, toxic hepatitis and liver damage, methaemoglobinaemia and aplastic anaemia, which
affects blood cell production 15, 196, 251. Those who worked with TNT during World War I were
known as “canaries” due to the yellowing of the skin from jaundice caused by this “TNT
poisoning”. Ninety-six workers in the U.K. died from exposure to TNT 42. Picric acid, a similar
nitroaromatic explosive, can cause dermatitis in low doses, with higher doses affecting the
kidneys and liver 15. Oral LD50 values for TNT and picric acid in rats are 0.8 – 1.3 g/kg and 0.2
g/kg respectively 1, 156. TNT has toxic effects as determined using earthworm reproduction tests248, and work on the luminescent bacterium Vibrio fischeri has deemed TNT to be “very toxic” to
aquatic organisms 82. Several mutagenicity studies have been carried out using TNT and its
prominent metabolites on both Salmonella strains and mammalian cell lines 182 106, 300, 331. These
studies have found TNT to be mutagenic, some of the metabolites more so than the TNT itself.
However, the evidence is limited, there is no epidemiological evidence of cancer among TNT
workers, and consequently it has also been given a carcinogen classification of C 251.
Chapter 1 - Introduction
5
The effects of RDX on mammals are generally characterized by convulsions. Supplying
RDX to both dogs and rats results in irritability and convulsions as symptoms of chronic toxicity,
and death in the rats was associated with congestion in the gastro-intestinal tract and lungs 47, 318
(oral rat LD50 of 0.07 – 0.12 g/kg 286). RDX toxicity can also cause weight loss associated with a
reduction of food intake in rats 191, and RDX has been used as a rat poison 225. There have been
several reported cases of RDX toxicity in humans. Workers in RDX factories in Germany, Italy
and U.S.A. have been seen to suffer symptoms including convulsions, unconsciousness, vertigo
and vomiting after exposure, usually through the inhalation of RDX powder 161. A study on a
child who ingested plasticized RDX and developed seizures found that RDX can transport easily
into the central nervous system (CNS) 335. More recent reports of men purposefully chewing the
plastic explosives C-4 or SEMTEX, which contain high levels of RDX, show them to develop
grand mal seizures with associated headaches or amnesia 109, 131. Recovery from these episodes is
complete and no recurrence of symptoms is seen in the absence of further exposure. Tests using
freshwater invertebrates, green algae, fathead minnow, earthworm reproduction and luminescent
bacterium Vibrio fischeri have found RDX to be toxic, but less so than TNT 49, 50, 82, 228, 248.
Although studies testing RDX on both Salmonella and mammalian cell lines have shown that it is
not mutagenic 106, 182, it is designated a class C carcinogen 251.
Limited data shows that HMX is likely to be less toxic then RDX. Some effects on the
CNS have been demonstrated in rats, but at significantly higher doses than for RDX 251 (oral rat
LD50 of 6.5-7.6 g/kg 150). Some toxic effects of HMX have been seen using aquatic organisms,
bacteria and the earthworm reproduction test 82, 249. HMX has a class D carcinogen designation,
meaning that there is no evidence of carcinogenicity from animal studies 251. Toxicological
exposure limits have not been determined for all explosives, as working practice which avoids
skin contact or inhalation appears to be sufficient to prevent harm to explosive workers 296.
All explosives are toxic to varying degrees. Most are classed as potential carcinogens and
other toxic effects have been seen in munitions workers and animal studies. The dangers
associated with exposure to explosives should not be underestimated.
1.4 Explosives as environmental pollutants
Explosives are present as contaminants on land as a result of their manufacture, their
deployment, and from weapons decommissioning. Explosives are highly recalcitrant compounds,
resistant to degradation in situ, meaning that the contamination persists. Most countries have not
Chapter 1 - Introduction
6
yet addressed the problem of explosive contamination, but where it has been catalogued, the
problem is significant. Two studies sponsored by the U.S. Army Environmental Center have
listed the installations at which problems exist in the U.S., and the extent of the problem 41, 177.
The German government has also begun to characterize its explosive contaminated sites,
although many of these are now residential and industrial areas 291. The U.K., Canada and
Australia have begun site characterization, but the problem does not appear to have been
appreciated in the rest of the world. Explosives of concern as environmental pollutants have been
listed as TNT, RDX and HMX 177. Of these, HMX is generally found at concentrations far lower
than those of RDX and TNT in contaminated soil and groundwater 279, 293. RDX and TNT are
found in similar concentrations on average, with HMX at concentrations at least an order of
magnitude lower. Several soil studies have therefore concentrated on RDX and TNT as the
major pollutants 14, 267, 337. The nitrate esters are rarely found in the environment at concentrations
high enough to require treatment 155.
In the U.S., 115 sites at 25 installations have been identified where explosives
contamination exists, and the amount of soil affected has been estimated at 669,000 cubic yards
(511,517 cubic metres), equivalent to approx. 45,000 tonnes 41. The amount of explosive
contamination present in the soil is also enormous. At the Nebraska Ordnance Plant (NOP),
concentrations of up to 5.2 g TNT per kg soil and 27 g RDX per kg soil have been found. These
data show that contamination massively exceeds the clean up levels recommended by the U.S.
Environmental Protection Agency of 17.2 mg TNT and 5.2 mg RDX per kg soil 151.
The contamination problem worsens with the effect of leaching, as the water beneath the
soil (groundwater) becomes polluted, which can lead to the spreading of the explosives. The
degree to which the explosive remains in the soil or is mobilized and taken through to
groundwater depends on its solubility and the degree to which it sorbs to the soil. TNT and RDX
have low aqueous solubility (maximum 100 mg/l and 38 mg/l respectively at 20 oC 195) meaning
that groundwater is often saturated with the explosives. TNT sorbs to soil quite strongly, but
RDX binds less tightly 267, 281, 337 (TNT Kd (dissociation constant)= 6.4 – 12.0 l/kg, RDX Kd = 0.8
l/kg 277). RDX contamination is therefore less easily contained than TNT, and RDX has been
observed to move further than TNT in groundwater 226, 281. RDX is now of primary concern due
to its ability to migrate quickly through the soil matrix.
Chapter 1 - Introduction
7
The degree of pollution of soil and groundwater demonstrated here is a serious
environmental problem which needs to be addressed. The two major targets for remediation are
RDX and TNT, both of which have been manufactured in vast quantities over the last century.
They are commonly found co-contaminating munition sites and are both toxic to mammals and
aquatic organisms. The toxicity of these compounds means not only that these sites cannot be
used for alternate purposes until they have been cleaned up, but also that remediation is necessary
to control the movement of these compounds in groundwater, with RDX being the more urgent
problem in this respect. Remediation is urgently required for these contaminated sites.
1.5 Methods for soil decontamination
Limited information regarding the remediation of explosive contaminated sites is
available to the public. Some data from the U.S. regarding the clean up of contaminated
installations can be obtained, and the two methods currently being used are presented.
1.5.1 Incineration
Incineration is the most commonly used method for the clean up of explosive
contaminated soil; several sites have already been remediated using this technology 155. The
process involves removing soil from the site to incinerate it and the contaminating explosives 313.
In practice, however, complete combustion rarely occurs, with the result that explosive residues
require disposal or further treatment 105. Even if explosives fully combust, some harmful
compounds form: nitrous oxides (NOx), carbon monoxide (CO), hydrogen chloride (HCl) and
possibly dioxins 313. In addition to the effects that these compounds may have on health, leading
to poor public acceptance, the costs of incineration are very high: each ton of soil to be
remediated has been estimated to cost $ 800 ($ 725 per tonne soil) 103.
1.5.2 Composting
Composting of contaminated soil uses resident soil microbes to degrade the contaminants.
Composted soil may be supplemented with organic matter (which reduces the concentration of
the contaminant and provides carbon sources for the microbes), have its moisture content
controlled and be aerated at intervals 350. The temperature often increases during composting as a
function of microbial activity, creating better conditions for the degradation of the contaminants.
Chapter 1 - Introduction
8
RDX and TNT levels have been found to decrease substantially during composting 115, 116,
154, 333, 350. Conditions vary between studies; explosives removal has been seen in nonaerated and
aerated piles 116, with slightly greater removal under thermophilic conditions (55 oC) than
mesophilic (35 oC) 333. Very few studies address the identities of metabolites; carbon dioxide is a
product, identified using 14C-RDX 154, and the reduction of the nitro groups to give nitroso
derivatives of RDX: hexahydro-1-nitroso-3,5-dinitro-1,3,5-triazine (MNX) and hexahydro-1,3-
dinitroso-5-nitro-1,3,5-triazine (DNX) along with methanol and formaldehyde 105 has been
observed. TNT tends to undergo transformations rather than mineralization 44. These products
bind to the soil and become unextractable 105, meaning that not all the compounds will be
removed, which may be unacceptable for complete remediation.
The benefit of composting is that the toxicity and mutagenicity of the composted soil and
the leachate is much reduced when compared to the original contaminated soil 115, 116, 154.
However, there have been no detailed investigations into the products formed or the specific
bacteria responsible for the removal of the explosives. Indigenous bacteria will vary from site to
site and may break explosives down in different ways. Composting is also an expensive process
as it requires the movement of soil to form piles, amendment of the soil and possibly regular
aeration. However, at an estimated cost of $ 300 per ton ($ 272 per tonne) soil 155, it is not as
expensive as incineration.
The two methods currently used for remediating explosive contaminated sites,
incineration and composting, appear to remove the parent compound, but many of the products
are uncharacterized and may be toxic. Both methods require moving the material, either for
mixing or for ex situ treatment. This greatly increases the costs of the remediation, and both are
expensive methods. Given the large amount of land still requiring remediation, and the costs of
the existing technologies, new technologies are required for the low cost remediation of
explosives.
Studies on composting do suggest, however, that soil microbial populations can break
down explosive compounds, and possibly detoxify them. This provides the idea of using soil
micro-organisms as a resource for remediation, but only after better characterization.
Chapter 1 - Introduction
9
1.6 Biodegradation of explosives
Micro-organisms are able to degrade a wide range of compounds, including xenobiotics
which have been introduced into the environment relatively recently 283. Modern explosives have
been used extensively over the last century, becoming known as serious environmental pollutants
in the past few decades. Most explosive compounds contain chemical groups, such as the
nitramine group, which were not previously found in nature. It could be proposed that the
novelty of these compounds would mean that the environmental microflora would not possess
enzymes which could degrade or transform them. However, composting has demonstrated that
micro-organisms are able to remove explosives from soil. These micro-organisms therefore hold
great potential for the effective remediation of explosives, and potentially the breakdown of these
compounds to harmless products.
The use of specific bacterial strains to remediate explosives could be a more effective
method than either incineration or composting. Using characterized bacteria, under defined
conditions, the products of degradation can be determined and specific isolates which break the
compound down into non-toxic products can be selected for use. Either the organisms
themselves, or the relevant enzymes, can be used in bioremediation. A description of the main
biotransformation and biodegradation routes of the three classes of explosives is presented, and
reviews on this subject can be found 88, 112, 136, 162, 252, 290, 322.
1.6.1 Nitrate ester explosives
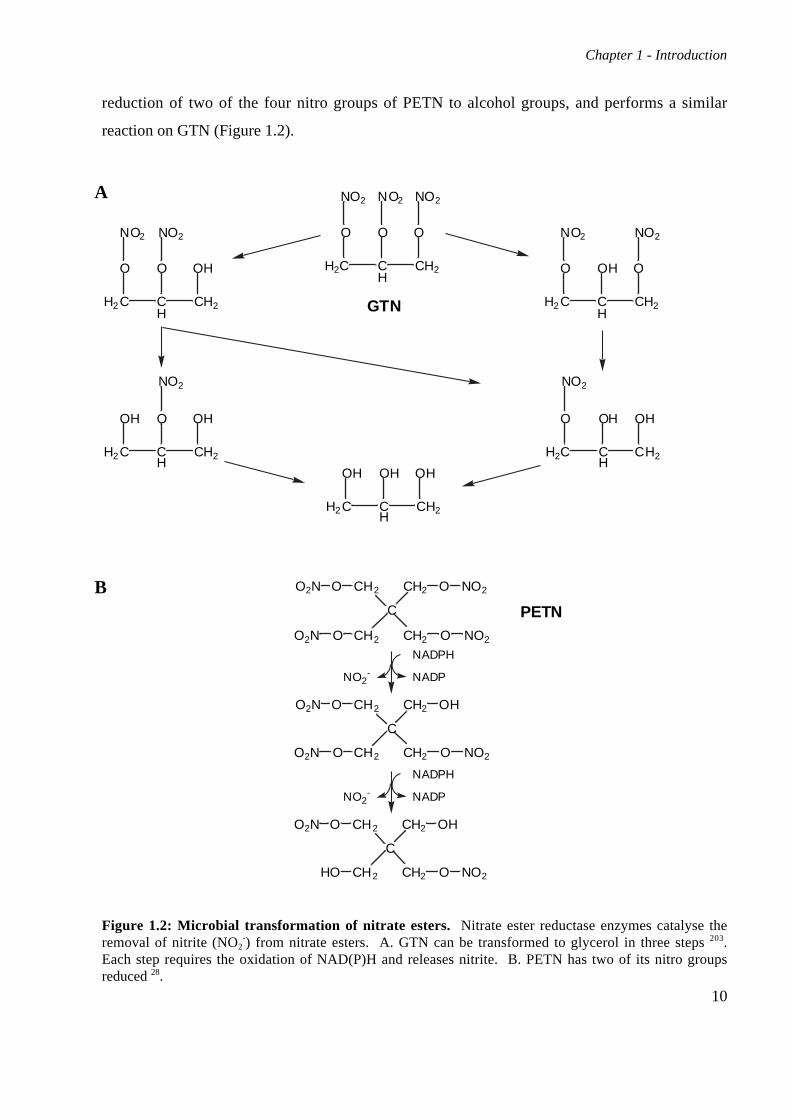
Biodegradation of nitrate esters occurs through successive denitrations, each nitro group
reacting more slowly than the previous one 23, 55, 328. The degradation of GTN can eventually lead
to the production of glycerol in some cases 55, 203, which can then be used as a carbon source 2, 55,
284 (Figure 1.2). This type of activity has been observed under both aerobic and anaerobic
conditions, using mixed cultures or pure strains including Pseudomonas sp., Agrobacterium
radiobacter and Bacillus sp. 2, 23, 55, 203, 328-330. Enzymes which catalyse this reaction have been
isolated from nitrate ester degrading organisms, and all have been found to be similar reductases29, 99, 287.
There is very little information on microbial activity towards PETN. Enterobacter
cloacae strain PB2 was isolated from contaminated soil through its ability to use PETN as a sole
source of nitrogen; this strain can also obtain nitrogen from GTN 28. The enzyme responsible for
this activity is PETN reductase, a homologue of old yellow enzyme 99. It can catalyse the
Chapter 1 - Introduction
10
reduction of two of the four nitro groups of PETN to alcohol groups, and performs a similar
reaction on GTN (Figure 1.2).
Figure 1.2: Microbial transformation of nitrate esters. Nitrate ester reductase enzymes catalyse theremoval of nitrite (NO2
-) from nitrate esters. A. GTN can be transformed to glycerol in three steps 203.Each step requires the oxidation of NAD(P)H and releases nitrite. B. PETN has two of its nitro groupsreduced 28.
H2C CH
CH2
O O OH
NO2 NO2
H2C CH
CH2
OH O OH
NO2
H2C CH
CH2
O O O
NO2 NO2 NO2
H2C CH
CH2
OH OH OH
H2C CH
CH2
O OH O
NO2 NO2
H2C CH
CH2
O OH OH
NO2
GTN
A
BC
CH2
CH2CH2
CH2
O
OO
O NO2
NO2O2N
O2N
C
CH2
CH2CH2
CH2
OH
OO
O
NO2O2N
O2N
C
CH2
CH2CH2
CH2
OH
OHO
OO2N
NO2
NADPH
NADPNO2-
NO2-
NADPH
NADP
PETN
Chapter 1 - Introduction
11
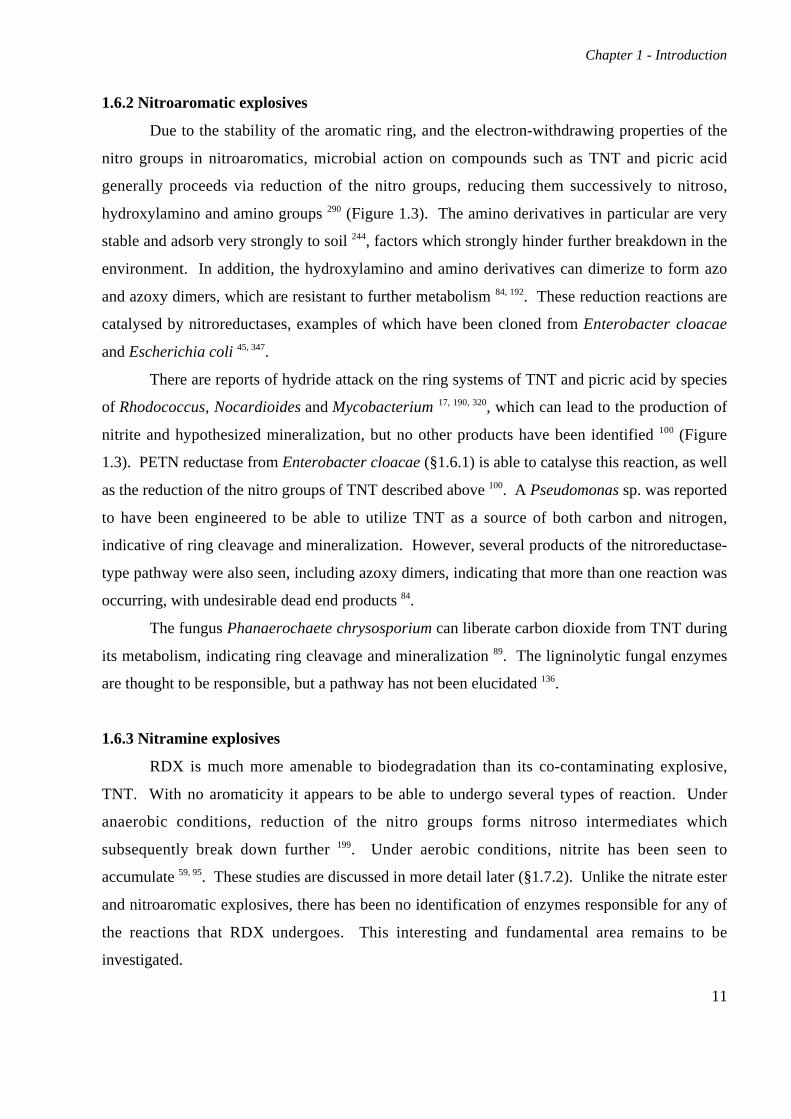
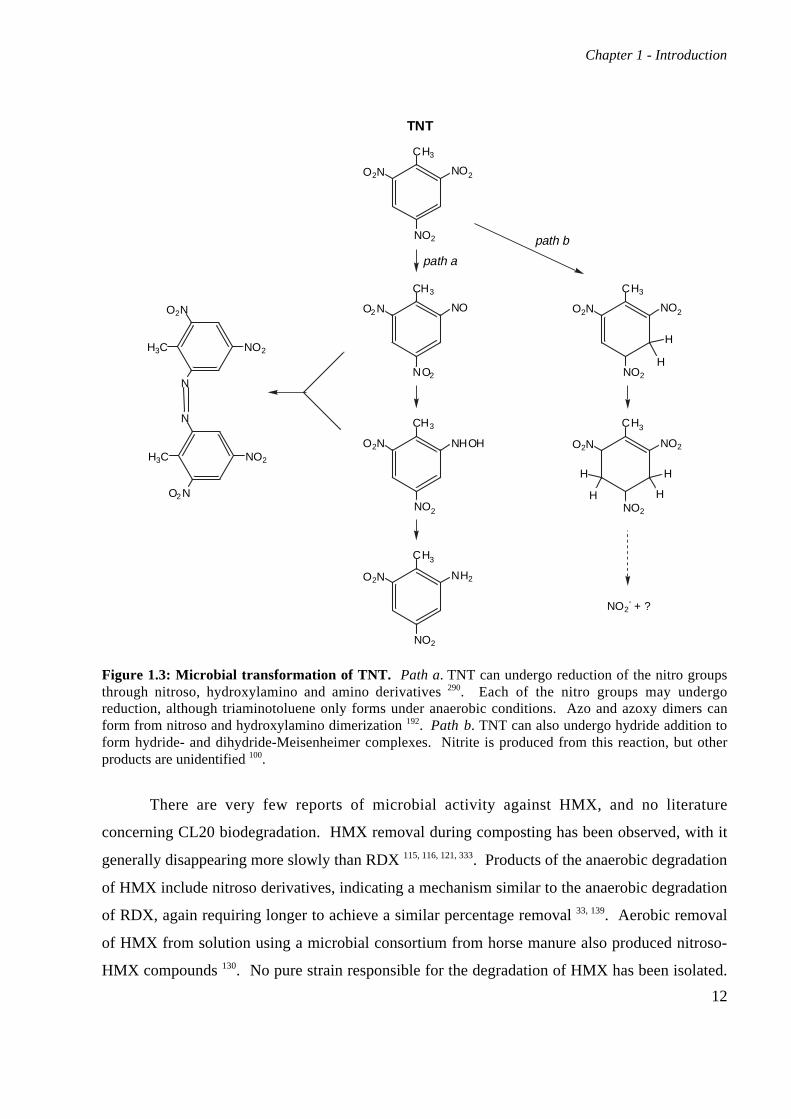
1.6.2 Nitroaromatic explosives
Due to the stability of the aromatic ring, and the electron-withdrawing properties of the
nitro groups in nitroaromatics, microbial action on compounds such as TNT and picric acid
generally proceeds via reduction of the nitro groups, reducing them successively to nitroso,
hydroxylamino and amino groups 290 (Figure 1.3). The amino derivatives in particular are very
stable and adsorb very strongly to soil 244, factors which strongly hinder further breakdown in the
environment. In addition, the hydroxylamino and amino derivatives can dimerize to form azo
and azoxy dimers, which are resistant to further metabolism 84, 192. These reduction reactions are
catalysed by nitroreductases, examples of which have been cloned from Enterobacter cloacae
and Escherichia coli 45, 347.
There are reports of hydride attack on the ring systems of TNT and picric acid by species
of Rhodococcus, Nocardioides and Mycobacterium 17, 190, 320, which can lead to the production of
nitrite and hypothesized mineralization, but no other products have been identified 100 (Figure
1.3). PETN reductase from Enterobacter cloacae (§1.6.1) is able to catalyse this reaction, as well
as the reduction of the nitro groups of TNT described above 100. A Pseudomonas sp. was reported
to have been engineered to be able to utilize TNT as a source of both carbon and nitrogen,
indicative of ring cleavage and mineralization. However, several products of the nitroreductase-
type pathway were also seen, including azoxy dimers, indicating that more than one reaction was
occurring, with undesirable dead end products 84.
The fungus Phanaerochaete chrysosporium can liberate carbon dioxide from TNT during
its metabolism, indicating ring cleavage and mineralization 89. The ligninolytic fungal enzymes
are thought to be responsible, but a pathway has not been elucidated 136.
1.6.3 Nitramine explosives
RDX is much more amenable to biodegradation than its co-contaminating explosive,
TNT. With no aromaticity it appears to be able to undergo several types of reaction. Under
anaerobic conditions, reduction of the nitro groups forms nitroso intermediates which
subsequently break down further 199. Under aerobic conditions, nitrite has been seen to
accumulate 59, 95. These studies are discussed in more detail later (§1.7.2). Unlike the nitrate ester
and nitroaromatic explosives, there has been no identification of enzymes responsible for any of
the reactions that RDX undergoes. This interesting and fundamental area remains to be
investigated.
Chapter 1 - Introduction
12
Figure 1.3: Microbial transformation of TNT. Path a. TNT can undergo reduction of the nitro groupsthrough nitroso, hydroxylamino and amino derivatives 290. Each of the nitro groups may undergoreduction, although triaminotoluene only forms under anaerobic conditions. Azo and azoxy dimers canform from nitroso and hydroxylamino dimerization 192. Path b. TNT can also undergo hydride addition toform hydride- and dihydride-Meisenheimer complexes. Nitrite is produced from this reaction, but otherproducts are unidentified 100.
There are very few reports of microbial activity against HMX, and no literature
concerning CL20 biodegradation. HMX removal during composting has been observed, with it
generally disappearing more slowly than RDX 115, 116, 121, 333. Products of the anaerobic degradation
of HMX include nitroso derivatives, indicating a mechanism similar to the anaerobic degradation
of RDX, again requiring longer to achieve a similar percentage removal 33, 139. Aerobic removal
of HMX from solution using a microbial consortium from horse manure also produced nitroso-
HMX compounds 130. No pure strain responsible for the degradation of HMX has been isolated.
TNT
NO2
NO2
O2N
CH3
NO
NO2
O2 N
CH3
O2N
NO2
N
H3C
N
NO2
O2 N
H3CNHOH
NO2
O2N
CH3
NH2
NO2
O2N
CH3
NO2
NO2
O2N
CH3
H
H
NO2
NO2
O2N
CH3
H
H
H
H
NO2- + ?
path a
path b
Chapter 1 - Introduction
13
The reduced microbial activities against these compounds may be due to their solubilities, which
are lower than that of RDX, the greater steric effects within transition states, and the higher bond
dissociation energy of the N-NO2 bond which results from this 138, or perhaps greater resistance to
transport across bacterial membranes. If the mechanism by which the nitramines are degraded
are different, it may be that micro-organisms have not been sufficiently exposed to either HMX
or CL20 to date, and that the numbers of bacteria able to degrade the explosives will increase
over the coming decades.
Enzymes able to break down or transform two classes of explosives, nitrate esters and
nitroaromatics, have been characterized. Transgenic plants containing these enzymes have been
created and found to be able to degrade these explosive compounds or remove them from
medium (§1.8). This represents a major advance in explosive remediation. No such system
exists for the nitramine explosives, and work in this area is urgently required. The degradation of
nitramines, especially that of the widely used and common pollutant RDX, clearly requires
further investigation.
1.7 RDX degradation
The products formed from the various methods of breakdown of a compound can give
useful information on the weakest bonds, the groups most likely to be attacked and the most
likely mechanisms underlying its degradation. Despite the amount of work that has been done on
RDX breakdown, surprisingly few pathways to explain the degradation have been proposed. A
survey of the postulated mechanisms of RDX breakdown is given by Hawari 138 who proposes
that when the first bond in the molecule is broken, the molecule is destabilized to such an extent
that it undergoes spontaneous decomposition. The N-N bond is described as the most likely
target for degradation, as it is relatively weak compared to the rest of the molecule, with a bond
dissociation energy of 48 kcal/mol compared to the C-N and C-H bond energies of 85 and 94
kcal/mol respectively 138.
Chapter 1 - Introduction
14
1.7.1 Physico-chemical breakdown of RDX
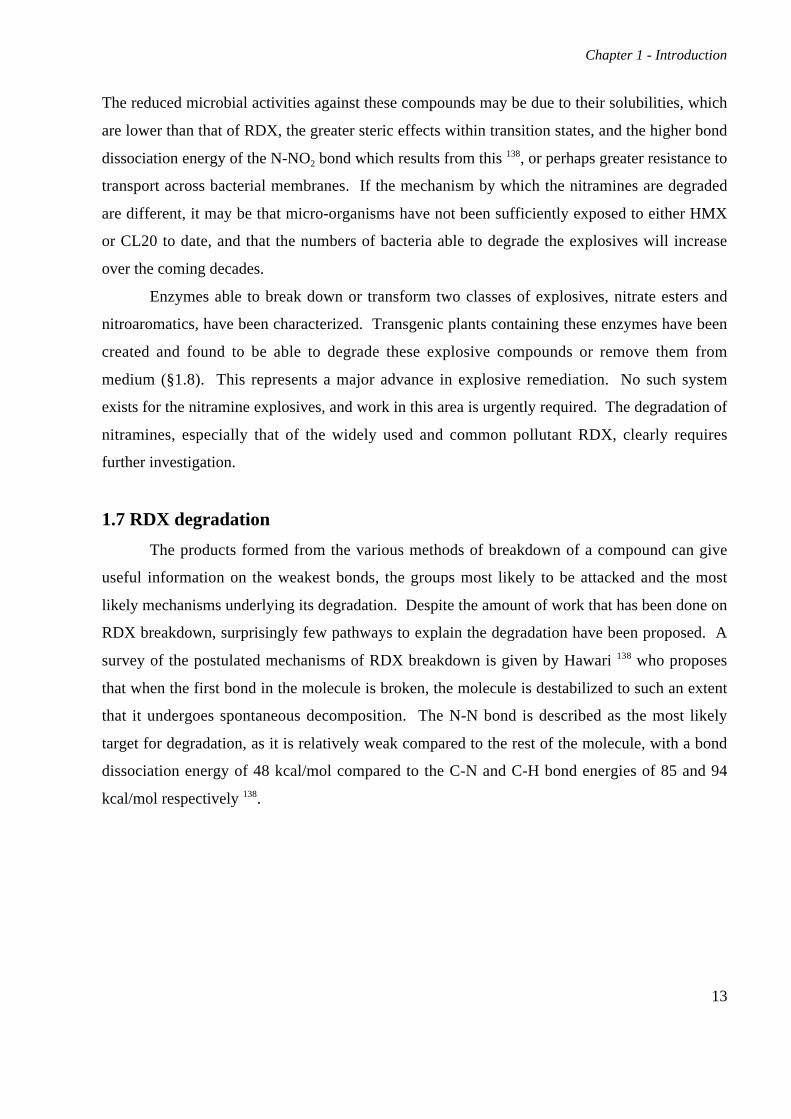
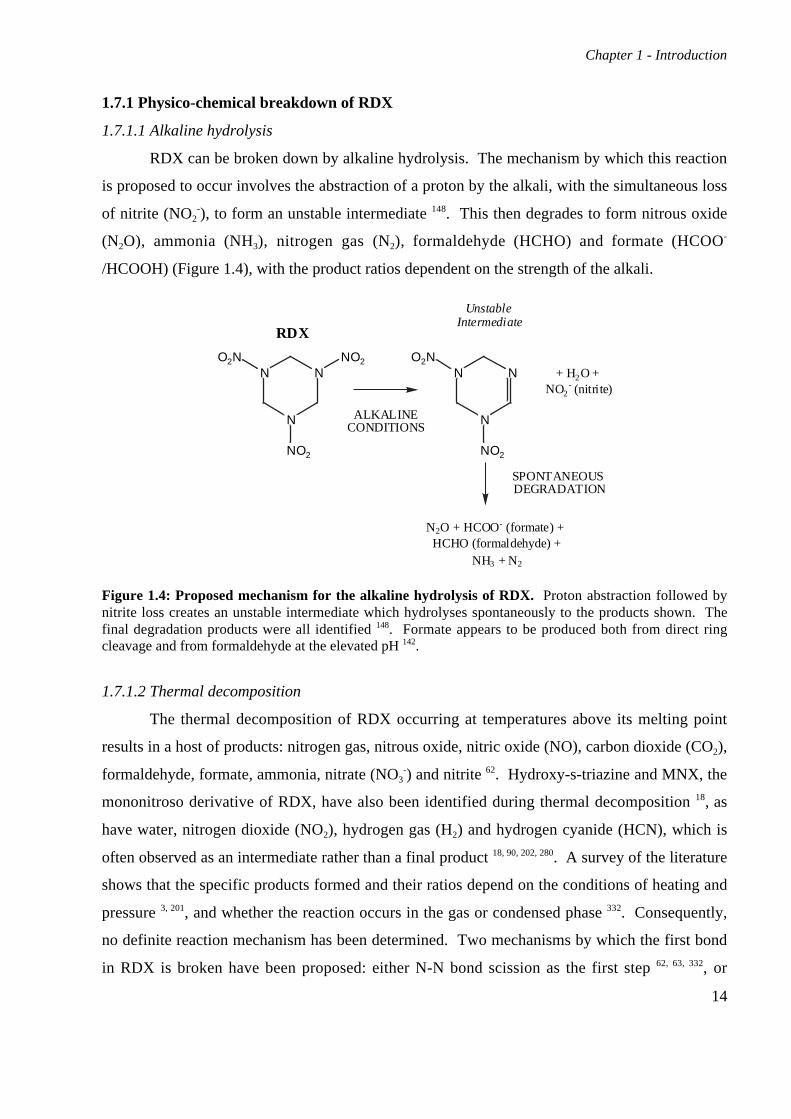
1.7.1.1 Alkaline hydrolysis
RDX can be broken down by alkaline hydrolysis. The mechanism by which this reaction
is proposed to occur involves the abstraction of a proton by the alkali, with the simultaneous loss
of nitrite (NO2-), to form an unstable intermediate 148. This then degrades to form nitrous oxide
(N2O), ammonia (NH3), nitrogen gas (N2), formaldehyde (HCHO) and formate (HCOO-
/HCOOH) (Figure 1.4), with the product ratios dependent on the strength of the alkali.
Figure 1.4: Proposed mechanism for the alkaline hydrolysis of RDX. Proton abstraction followed bynitrite loss creates an unstable intermediate which hydrolyses spontaneously to the products shown. Thefinal degradation products were all identified 148. Formate appears to be produced both from direct ringcleavage and from formaldehyde at the elevated pH 142.
1.7.1.2 Thermal decomposition
The thermal decomposition of RDX occurring at temperatures above its melting point
results in a host of products: nitrogen gas, nitrous oxide, nitric oxide (NO), carbon dioxide (CO2),
formaldehyde, formate, ammonia, nitrate (NO3-) and nitrite 62. Hydroxy-s-triazine and MNX, the
mononitroso derivative of RDX, have also been identified during thermal decomposition 18, as
have water, nitrogen dioxide (NO2), hydrogen gas (H2) and hydrogen cyanide (HCN), which is
often observed as an intermediate rather than a final product 18, 90, 202, 280. A survey of the literature
shows that the specific products formed and their ratios depend on the conditions of heating and
pressure 3, 201, and whether the reaction occurs in the gas or condensed phase 332. Consequently,
no definite reaction mechanism has been determined. Two mechanisms by which the first bond
in RDX is broken have been proposed: either N-N bond scission as the first step 62, 63, 332, or
N
N
NNO2
NO2
O2N
RDX
N
N
N
NO2
O2N+ H2O +
NO2- (nitrite)
N2O + HCOO- (formate) + HCHO (formaldehyde) +
NH3 + N2
ALKALINECONDITIONS
Unstable Intermediate
SPONTANEOUS DEGRADATION
Chapter 1 - Introduction
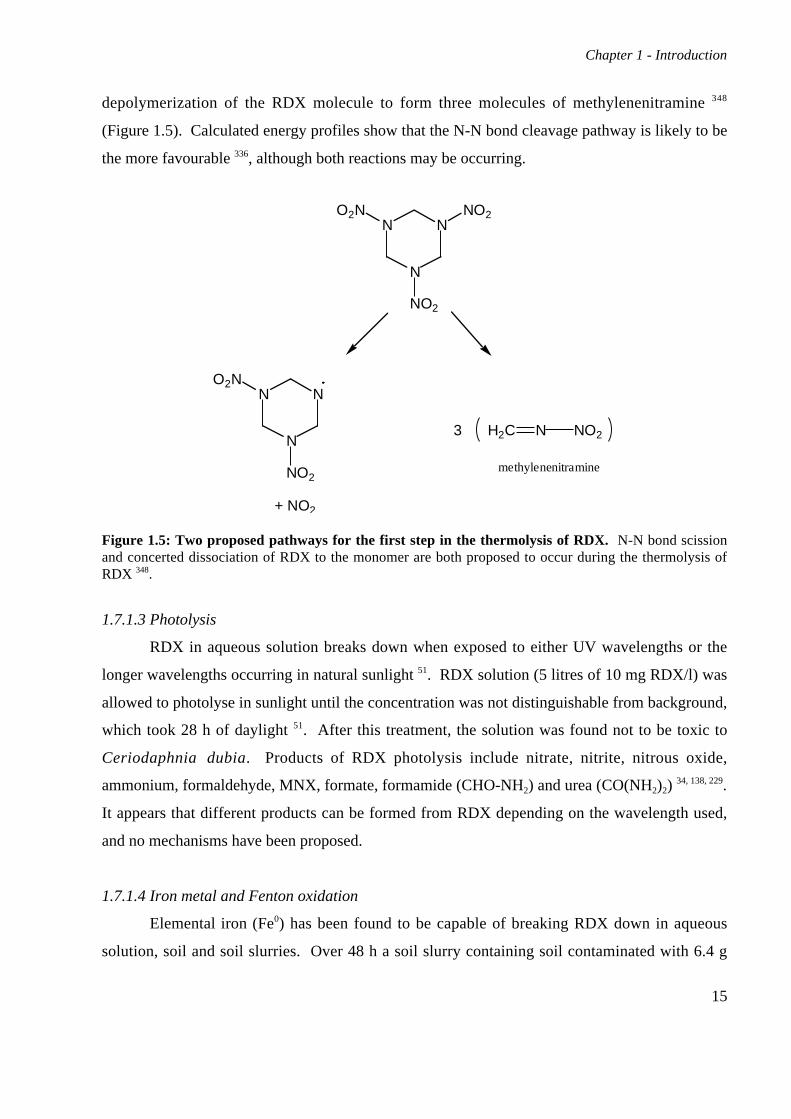
15
depolymerization of the RDX molecule to form three molecules of methylenenitramine 348
(Figure 1.5). Calculated energy profiles show that the N-N bond cleavage pathway is likely to be
the more favourable 336, although both reactions may be occurring.
N
N
NNO2
NO2
O2N
N
N
N
NO2
O2N
+ NO2
N NO2H2C3
methylenenitramine
Figure 1.5: Two proposed pathways for the first step in the thermolysis of RDX. N-N bond scissionand concerted dissociation of RDX to the monomer are both proposed to occur during the thermolysis ofRDX 348.
1.7.1.3 Photolysis
RDX in aqueous solution breaks down when exposed to either UV wavelengths or the
longer wavelengths occurring in natural sunlight 51. RDX solution (5 litres of 10 mg RDX/l) was
allowed to photolyse in sunlight until the concentration was not distinguishable from background,
which took 28 h of daylight 51. After this treatment, the solution was found not to be toxic to
Ceriodaphnia dubia. Products of RDX photolysis include nitrate, nitrite, nitrous oxide,
ammonium, formaldehyde, MNX, formate, formamide (CHO-NH2) and urea (CO(NH2)2) 34, 138, 229.
It appears that different products can be formed from RDX depending on the wavelength used,
and no mechanisms have been proposed.
1.7.1.4 Iron metal and Fenton oxidation
Elemental iron (Fe0) has been found to be capable of breaking RDX down in aqueous
solution, soil and soil slurries. Over 48 h a soil slurry containing soil contaminated with 6.4 g
Chapter 1 - Introduction
16
RDX/kg was remediated using 10 % Fe0 to within EPA recommended limits (§1.4) 151. The only
product detected was ammonium, with no nitrate or nitrite present. However, both these latter
nitrogen containing compounds can be reduced to ammonium by Fe0 and nitrite is seen when
RDX is rapidly passed through a column containing Fe0 282, indicating that nitrite is an initial
product. A more detailed study of RDX removal by Fe0 under aqueous conditions showed low
levels of the nitroso derivatives: MNX, DNX and hexahydro-1,3,5-trinitroso-1,3,5-triazine
(TNX) being produced 282. These intermediates were lost after 96 h and ammonium was seen
being produced throughout the course of the experiment. This may indicate that two mechanisms
are at work, one allowing the release of ammonium and another reducing the nitro groups.
Fenton oxidation uses Fe2+ with H2O2 to produce hydroxyl radicals which carry out the
oxidation of target compounds. Products of the treatment of RDX with Fenton’s reagent include
formate, nitrate, ammonium, the tentatively identified methylenedinitramine (C(NHNO2)2),
nitrogen and formaldehyde 24, 353. No nitrite was seen, but it is suggested to be the product of the
first reaction step, being oxidized to nitrate immediately 353. The formate is proposed to be a
result of the action of Fenton’s reagent on formaldehyde, rather than an independent ring
cleavage product 353.
1.7.2 Biodegradation of RDX
1.7.2.1 Anaerobic biodegradation of RDX
Biodegradation of RDX was initially studied under anaerobic conditions, and it was
thought for a long time that RDX removal could only occur anaerobically 199. RDX removal from
culture was first observed in 1973 using a system containing purple photosynthetic bacteria 289;
the anaerobic photosynthetic activity was thought to be responsible for a possible reduction of the
compound. Since then, anaerobic RDX degradation has been observed using microbial consortia
from contaminated material and sewage sludge 103, 137, 199, 274, 275, 308, and has also been performed
under nitrate reducing 98 and sulfate reducing 30, 31 conditions. These cultures generally take
between one week and two months to degrade RDX, when supplied at concentrations ranging
from 0.015 mM to 0.17 mM. The most rapid degradation of RDX using anaerobic sludge
reported 90 % removal of 0.27 mM RDX within 2 days 137.
In addition to this use of mixed cultures, the vast majority being uncharacterized in terms
of the microbes present, some investigations have concentrated on anaerobic pure cultures.
Clostridium bifermentans was the first pure strain capable of the anaerobic degradation of RDX
Chapter 1 - Introduction
17
to be isolated 243. It was purified from an anaerobic consortium and found to be able to remove
0.23 mM RDX to 25 % of its original concentration within 24 h. Morganella morganii, which
fully removed 0.33 mM RDX within 27 days, was chosen as the most efficient isolate of three
from the family Enterobacteriaceae, which were found to transform RDX under oxygen-depleted
conditions 167. Several strains which could biotransform RDX anaerobically were isolated from
horse manure, the most effective being Serratia marcescens which removed 0.23 mM RDX over
10 days 345. During this work on RDX degrading anaerobes, several intermediates and
products have been identified, from which pathways of RDX degradation have been put forward.
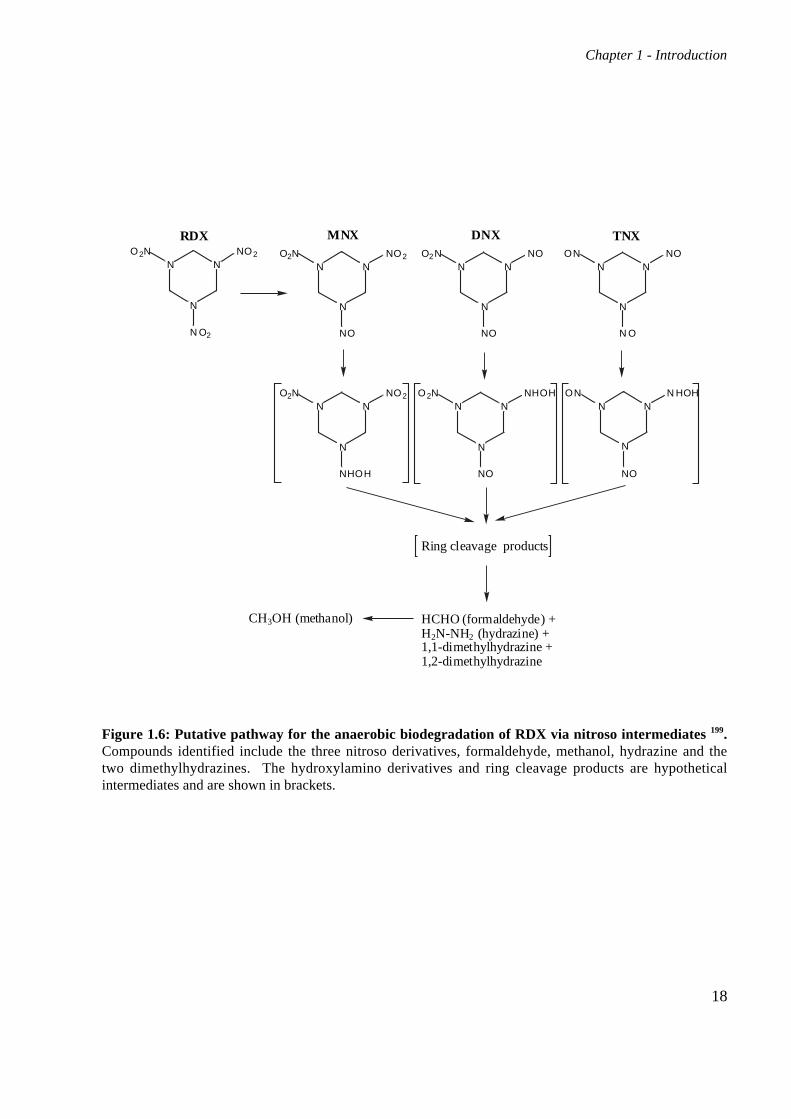
Using sewage sludge as a source of microbes, 0.23 mM RDX was removed from
anaerobically incubated nutrient broth over a period of 7 days 199. Analysis of the compounds
formed led to the proposal of a pathway involving the production of nitroso intermediates from
RDX through sequential reductions of the nitro groups (Figure 1.6). MNX is produced first,
followed by DNX and TNX, all of which were isolated by high performance liquid
chromatography (HPLC) and identified using gas chromatography-mass spectrometry (GC-MS).
Further reduction is hypothesized to create hydroxylamino-substituted derivatives, with
subsequent ring cleavage resulting in the observed products: formaldehyde, methanol (CH3OH),
hydrazine (H2N-NH2), 1,1-dimethylhydrazine and 1,2-dimethylhydrazine. The hydrazines are
known mutagens, but were present only in very low quantities and have not been identified since
in anaerobic systems 137. There have also been queries as to whether the hydrazines were
correctly identified, and subsequent studies have found them to be unstable 138. The nitroso
intermediates have been identified in several other studies during anaerobic RDX degradation 98,
137, 167, 345. The enzyme responsible may be similar to a type I nitroreductase from Enterobacter
cloacae, which has been found to oxidize NADPH in the presence of RDX, albeit at a very low
rate (68.7 nmol/min/mg protein), indicating that the RDX is being reduced 168.
Further elucidation of intermediates produced from anaerobic RDX degradation with
sewage sludge has led to the proposal of a second mechanism of RDX breakdown, which may
occur in parallel with the reductive pathway 137. This involves cleavage of the ring directly to
methylenedinitramine and bis(hydroxymethyl)nitramine, which break down to formaldehyde and
nitramine (NO2-NH2). Bacteria present in the sludge are then thought to convert these to the end
products carbon dioxide, methane (CH4) and nitrous oxide (Figure 1.7)
Chapter 1 - Introduction
18
Figure 1.6: Putative pathway for the anaerobic biodegradation of RDX via nitroso intermediates 199.Compounds identified include the three nitroso derivatives, formaldehyde, methanol, hydrazine and thetwo dimethylhydrazines. The hydroxylamino derivatives and ring cleavage products are hypotheticalintermediates and are shown in brackets.
MNX DNXRDX TNX
N
N
NNO
NO
O2NN
N
NNO2
N O2
O2N
N
N
NNO
N O
ONN
N
NNO2
NO
O2N
N
N
NNHOH
NO
O2NN
N
NN HOH
NO
ONN
N
NNO2
NHOH
O2N
CH3OH (methanol) HCHO (formaldehyde) +H2N-NH2 (hydrazine) +1,1-dimethylhydrazine +1,2-dimethylhydrazine
Ring cleavage products
Chapter 1 - Introduction
19
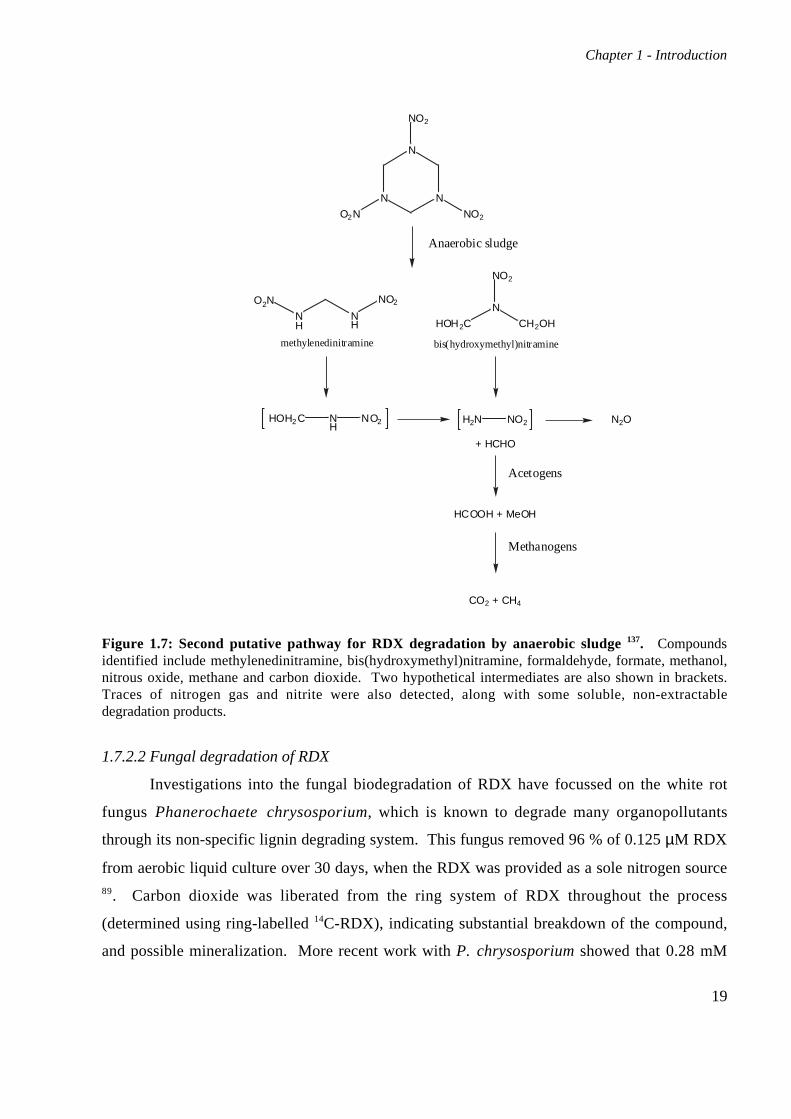
Figure 1.7: Second putative pathway for RDX degradation by anaerobic sludge 137. Compoundsidentified include methylenedinitramine, bis(hydroxymethyl)nitramine, formaldehyde, formate, methanol,nitrous oxide, methane and carbon dioxide. Two hypothetical intermediates are also shown in brackets.Traces of nitrogen gas and nitrite were also detected, along with some soluble, non-extractabledegradation products.
1.7.2.2 Fungal degradation of RDX
Investigations into the fungal biodegradation of RDX have focussed on the white rot
fungus Phanerochaete chrysosporium, which is known to degrade many organopollutants
through its non-specific lignin degrading system. This fungus removed 96 % of 0.125 µM RDX
from aerobic liquid culture over 30 days, when the RDX was provided as a sole nitrogen source89. Carbon dioxide was liberated from the ring system of RDX throughout the process
(determined using ring-labelled 14C-RDX), indicating substantial breakdown of the compound,
and possible mineralization. More recent work with P. chrysosporium showed that 0.28 mM
NH
NH
NO2O2N
HOH2 C NH
NO2
N N
N
NO2
NO2
O2N
H2N NO2
HOH2C CH2OH
N
NO2
N2O
+ HCHO
HCOOH + MeOH
CO2 + CH4
Anaerobic sludge
Acetogens
Methanogens
methylenedinitramine bis(hydroxymethyl)nitramine
Chapter 1 - Introduction
20
RDX could be fully degraded over 50 days, with metabolites including nitrous oxide and traces
of MNX and methanol 276.
1.7.2.3 Aerobic biodegradation of RDX
The first reported aerobic degradation of RDX was published in 1983 and identified three
pure strains of Corynebacterium capable of growing on RDX as a sole nitrogen source 338. The
fastest of these strains removed 0.18 mM RDX from culture over 32 h. Since then, a consortium
of bacteria from contaminated soil was reported to degrade 38 % of 100 mM RDX over 5 days303, and a pure aerobic bacterial strain, also isolated from contaminated soil, was found to be able
to remove 0.23 mM RDX from culture over 40 h 157. Using this pure strain, the accumulation of
an unidentified metabolite was detected using HPLC 157, and it has since been tentatively
identified as NO2-NH-NH-CHO, which would indicate that ring cleavage had occurred 138.
Stenotrophomonas maltophilia strain PB1 removed 0.27 mM RDX over 7 days 27, during which
two metabolites were identified: C3H9N3O5 and methylenedinitramine 138. The activity was
reported to be inducible and to require reducing power provided by sugars 27. All these strains
grew on RDX when it was supplied as a sole source of nitrogen, and none of them were able to
use RDX as a source of carbon.
The most thoroughly described aerobic RDX degrading bacterium is Rhodococcus sp.,
strain DN22 59. This strain was isolated from explosive contaminated soil, and uses RDX as sole
nitrogen source, degrading 0.16 mM within 20 h. The activity is repressed by growth on
ammonium as a nitrogen source and is thought to be plasmid-borne 60. Characterization of the
metabolites produced from RDX by this strain has been performed recently, leading to the
proposal of the first pathway for aerobic RDX biodegradation 95. No nitroso intermediates were
identified, strongly suggesting that aerobic RDX biodegradation follows a different path to
anaerobic biodegradation. The mechanism proposed (Figure 1.8) involves denitration as a first
step to form a hypothetical intermediate identical to that postulated in the alkaline hydrolysis
pathway. After a series of hypothetical intermediates, two compounds are formed; one, the
hypothetical NH2CHO, which breaks down further to ammonium and formaldehyde resulting in
the liberation of carbon dioxide, and the second, C2H5N3O3, which accumulates as a dead end
product.
Chapter 1 - Introduction
21
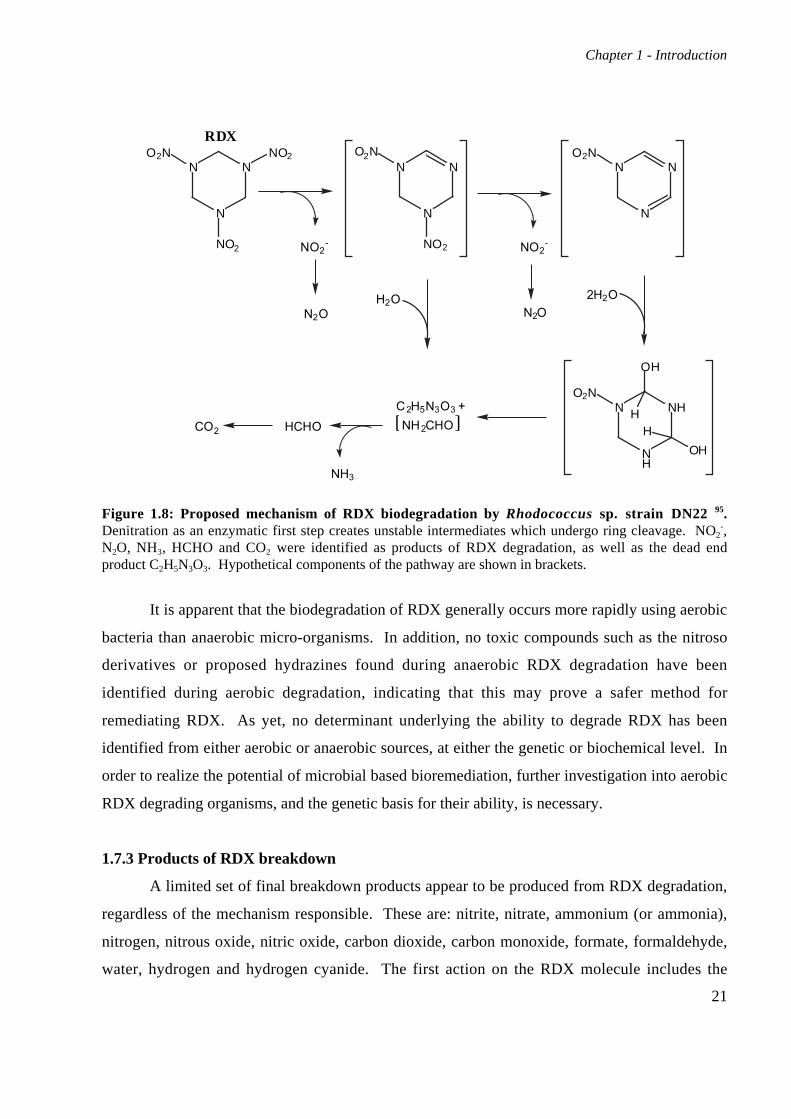
Figure 1.8: Proposed mechanism of RDX biodegradation by Rhodococcus sp. strain DN22 95.Denitration as an enzymatic first step creates unstable intermediates which undergo ring cleavage. NO2
-,N2O, NH3, HCHO and CO2 were identified as products of RDX degradation, as well as the dead endproduct C2H5N3O3. Hypothetical components of the pathway are shown in brackets.
It is apparent that the biodegradation of RDX generally occurs more rapidly using aerobic
bacteria than anaerobic micro-organisms. In addition, no toxic compounds such as the nitroso
derivatives or proposed hydrazines found during anaerobic RDX degradation have been
identified during aerobic degradation, indicating that this may prove a safer method for
remediating RDX. As yet, no determinant underlying the ability to degrade RDX has been
identified from either aerobic or anaerobic sources, at either the genetic or biochemical level. In
order to realize the potential of microbial based bioremediation, further investigation into aerobic
RDX degrading organisms, and the genetic basis for their ability, is necessary.
1.7.3 Products of RDX breakdown
A limited set of final breakdown products appear to be produced from RDX degradation,
regardless of the mechanism responsible. These are: nitrite, nitrate, ammonium (or ammonia),
nitrogen, nitrous oxide, nitric oxide, carbon dioxide, carbon monoxide, formate, formaldehyde,
water, hydrogen and hydrogen cyanide. The first action on the RDX molecule includes the
N
N
NNO2
NO2
O2NRDX
N
N
N
NO2
O2N
NO2-
N2O
NO2-
N2O
NH2CHO
C2H5N3O3 +
HCHOCO2
NH3
H2O 2H2O
N
N
NO2N
N
NH
NHO2N
OH
OH
HH[ ]
Chapter 1 - Introduction
22
following: proton abstraction liberating nitrite, N-N bond scission, concerted breakdown to
monomer, reduction of nitro groups to nitroso and C-N bond cleavage. Some of the
intermediates from some of the pathways have been determined, and the end products identified
indicate that the molecule is eventually mineralized after the breakage of any bond. Competing
chemical or biological reactions appear to be responsible for the diversity of products seen.
1.8 Applications of explosive degrading enzymes
Once the enzyme responsible for a particular reaction has been identified and purified, it
is possible to characterize the mechanism by which the enzyme performs that reaction, without
the complications of side reactions that occur using whole cells or cell extract. The products of
the reaction can be determined which, for the purposes of bioremediation, should be non toxic
and preferably indicate the mineralization of the compound. Once characterized, possible further
uses for an enzyme can be investigated.
There is considerable interest in phytoremediation, using plants to decontaminate soil and
groundwater. In particular, plants engineered with bacterial enzymes have generated a great deal
of interest. Bacteria have the metabolic capabilities to break down xenobiotic compounds, such
as explosives, where plants generate large amounts of biomass, penetrating deep into soil, are
self-sustaining and have the potential to encourage public acceptance in the area of
bioremediation.
PETN reductase from Enterobacter cloacae (§1.6.1) has been engineered into tobacco
plants. These transgenic plants have enhanced tolerance to both GTN and TNT, compared to
wildtype plants which exhibit a range of toxic effects under the same conditions. The transgenic
plants are also able to denitrate GTN much more efficiently than the wildtype 101. More recently,
tobacco plants have been engineered with another bacterial enzyme, nitroreductase 45. These
plants have enhanced resistance to TNT toxicity and enhanced uptake of the explosive,
effectively remediating the medium in which they are grown 127.
Chapter 1 - Introduction
23
1.9 Aims of this study
The aim of this project is to isolate aerobic bacterial strains capable of degrading RDX.
Bacteria from explosive contaminated areas in particular may have developed the ability to break
down RDX in order to use it as a nutrient source. Comparisons of these bacteria may identify a
strain suitable for study at the genetic level. The isolation of the gene(s) responsible for RDX
degrading activity will be attempted.
Isolation and characterization of a gene encoding a protein which is able to degrade RDX
would represent a new stage in explosive bioremediation. As RDX is such a major contaminant
of land and groundwater, this technology is greatly needed as a step towards the biodegradation
of this pollution.
Chapter 2 – General materials and methods
24
Chapter 2. General materials and methods
2.1 Reagents
The reagents used in this study were purchased from Anachem (Luton, Bedfordshire, U.K.),
Fisher (Loughborough, Leicestershire, U.K.), Life Technologies (Paisley, U.K.) or Sigma (Dorset,
U.K.) unless otherwise stated. All reagents were of analytical grade or above. DNA modifying
enzymes and restriction endonucleases were purchased from New England Biolabs (Hitchin,
Hertfordshire, U.K.), Roche (Lewes, East Sussex, U.K.) or Stratagene (Amsterdam, The
Netherlands) unless specified otherwise. RDX, TNT, HMX and CL20 (> 95 % purity) were kindly
provided by the Defence Science and Technology Laboratory (Dstl), Fort Halstead, U.K.
Oligonucleotide primers were synthesized by Sigma-Genosys Ltd. (Cambridge, U.K.). All aqueous
buffers and solutions were prepared using Elga (High Wycombe, Buckinghamshire, U.K.) purelab
maxima ultra high pressure purified water (dH2O).
2.2 Organisms, plasmids and growth conditions
2.2.1 Bacterial strains
Bacterial isolates were obtained through selective enrichments on minimal medium with RDX
as a sole nitrogen source from explosive contaminated soil, supplied by Dstl (§3.2.1). Strain 11Y
was provided by Dr. Amrik Basran (Institute of Biotechnology). Rhodococcus rhodochrous CW25,
described in Quan and Dabbs 238, was kindly provided by Professor Eric R. Dabbs (University of
Witwatersrand, South Africa) for use as a rhodococcal cloning host. Escherichia coli One Shot
TOP10 strain, chemically competent (Invitrogen, Paisley, U.K.), was used as a cloning host. E. coli
expression strains used were: BL21(DE3) (Stratagene), B834(DE3) (Novagen, Madison, Wisconsin,
U.S.A.) and Rosetta(DE3) (Novagen).
2.2.2 Plasmids
The Rhodococcus - E. coli shuttle vector pDA71 was provided as a kind gift by Professor Eric
R. Dabbs and was used in the construction of rhodococcal genomic libraries. PCR products
containing A-overhangs were routinely cloned into pCR-2.1 TOPO vector according to the
manufacturer’s protocol (Invitrogen, Paisley, U.K.) before sequencing. The vectors pGEM -5Zf+
Chapter 2 – General materials and methods
25
and pGEM -7Zf+ (Promega, Southampton, U.K.) were used in cloning and sequencing. Vectors
pET-11a and pET-16b (Novagen) were used for expression.
2.2.3 Media
Isolates were grown on defined liquid minimal medium which consisted of 40 mM potassium
phosphate buffer (pH 7.2) containing 10 mM glycerol, 5 mM glucose, 5 mM succinate, trace
elements and RDX or NH4Cl as a sole nitrogen source at concentrations mentioned in relevant
sections. Stock 80 mM potassium phosphate buffer contained 3.1 g KH2PO4 and 9.9 g K2HPO4 per
litre dH2O. All components were sterilized individually for 20 min at 15 psi and 121 oC in a SAL
autoclave (SAL, Bradford, U.K.) and added aseptically. Trace elements 250 were added aseptically
and RDX stock (1 M in N,N-dimethylformamide (DMF)) was diluted appropriately. The medium
was supplemented with 40 µg/ml chloramphenicol when required for specific experiments. Cultures
were grown at 30 oC using a rotary shaker at 110 rpm.
Solid media (RDX zone of clearance plates) were prepared in order to visualize utilization of
RDX. Electrophoresis grade agarose (Life Technologies, Paisley, U.K.) was added to the medium at
2 % w/v and RDX was added at a concentration of 5 mM. This was poured over a layer of 0.6 %
w/v agarose in 40 mM potassium phosphate buffer, which was used in order to provide support and
improve visualization.
Strains were also grown in Luria Bertani broth (LB) 257 at 37 oC using a rotary shaker at 180
rpm. The medium was supplemented with 40 µg/ml chloramphenicol, 100 µg/ml carbenicillin, 200
µg/ml isopropyl-β-D-thiogalactopyranoside (IPTG) and 25 µg/ml 5-bromo-4-chloro-3-indolyl-β-D-
galactopyranoside (X-gal) as required for specific experiments. Solid media (Luria Bertani agar,
LA) were derived from LB by the addition of 15 g/l Bacto-agar (Difco, Oxford, U.K.).
Bacterial isolates and recombinant strains were maintained by regular subculture onto
minimal medium or LA plates and stored at 4 oC. Stocks of the organisms were also stored in 15-30
% v/v glycerol at –80 oC.
2.3 General cloning techniques
2.3.1 Preparation of genomic and plasmid DNA
Total DNA was prepared from rhodococcal strains by a method adapted from Ausubel et al.,
1994 9. Cells were resuspended in Tris-EDTA (TE) buffer containing freshly added lysozyme (from
Chapter 2 – General materials and methods
26
chicken albumin) at a concentration of 10 mg/ml. This was incubated for 2 h at 37 oC to promote
cell lysis prior to routine DNA extraction. The DNA was stored at –20 oC in dH2O.
Plasmid DNA was routinely prepared from E. coli by boiling lysis or alkaline lysis 260.
Plasmid DNA of high purity for sequencing applications was prepared using the QIAprep spin
Miniprep kit (Qiagen, Crawley, West Sussex, U.K.).
The DNA concentration was determined by measuring the absorbance at 260 nm, taking 1
absorbance unit to equal 50 µg/ml of double stranded DNA 10. The purity of the DNA preparation
was determined by calculating the ratio of the absorbance at 280 nm to 260 nm, a ratio of 1.8 or
above indicating a pure sample of DNA 10.
2.3.2 Gel electrophoresis of DNA
DNA fragments were separated by agarose gel electrophoresis using 1 % w/v agarose in
Tris-acetate-EDTA (TAE) buffer 258. The loading dye consisted of 0.15 % w/v bromophenol blue,
0.5 % w/v sodium dodecyl sulphate (SDS), 0.15 M ethylenediaminetetraacetic acid (EDTA) and 50
% v/v glycerol, and was added to the sample to a final dilution of 20 % v/v. DNA was visualized by
adding 10 µg/ml ethidium bromide to the gel and viewing under ultraviolet. Fragment size was
determined by comparison with a 1 kb plus ladder (Gibco BRL, Paisley, U.K.) that had been run
alongside the lanes of interest.
2.3.3 Restriction endonuclease digestion of DNA
Restriction endonuclease digestion of DNA was routinely performed over a period of 3 h to
overnight at the optimum temperature (usually 37 oC) in a volume of 10 – 20 µl, using 1 unit of
enzyme per µg DNA. Double digests were performed using buffers compatible with both restriction
enzymes according to the manufacturer’s protocol. Complete digestion was verified using agarose
gel electrophoresis.
2.3.4 Purification of DNA fragments from agarose
Fragments were excised from the agarose gel, and purified using the QIAquick gel
extraction kit (Qiagen) according to the manufacturer’s instructions.
Chapter 2 – General materials and methods
27
2.3.5 DNA ligation
DNA ligations were performed using 50-100 ng vector DNA and a ratio of 1:3 vector
concentration to insert ends, with the DNA heated to 45 oC for 5 min before snap chilling on ice.
The ligations were performed either using T4 DNA ligase at 16-18 oC overnight or Quick ligation
kit at room temperature for 5 min, according to the manufacturer’s protocol (both New England
Biolabs).
2.3.6 Polymerase chain reaction amplification
Polymerase chain reaction (PCR) amplification for screening purposes was performed using
taq DNA polymerase (Roche), and for cloning purposes using PfuTurbo DNA polymerase
(Stratagene) according to the supplied protocols. The synthesized primers were dissolved in dH2O
and stored at –20 oC in a stock solution of 10 pmol/µl. PCR reactions (50 µl) contained 1-100 ng
DNA template, 50 pmoles of each PCR primer and dNTPs at a final concentration of 0.25 mM each.
The thermocycler used was the PCR express from Hybaid (Hybaid, Ashford, U.K.). PCR conditions
consisted of 95 oC for 2 min to denature the template, followed by 30 cycles of 95 oC for 30 s
(denaturation of template), varied temperatures for 30 s (primer annealing) and 72 oC for 1-4 min
(extension). A final cycle of 72 oC for 10 min was used for extension. Precise conditions of
annealing temperature and extension time were determined based on the primer melting temperature
(Tm) and fragment length respectively, and are given in the relevant sections.
2.3.7 Transformation of E. coli hosts
Heat shock competent cells were made by CaCl2 treatment as described in Sambrook et al. 259
or purchased from Invitrogen. E. coli hosts were routinely transformed by heat shock according to
the method of Sambrook et al. 259 or the manufacturer’s protocol. Recombinant plasmid-containing
colonies were identified using blue-white selection where possible.
2.3.8 Nucleotide sequencing and analysis
Automated DNA sequencing was performed by the Protein and Nucleic Acid Chemistry
Facility, Department of Biochemistry, University of Cambridge, or the Department of Genetics,
University of Cambridge. The software package Sequencher 3.1.1 (Gene Codes Corporation, Inc.)
was used to analyse the sequence. Sequences were compared to other sequences in the GenBank or
Swissprot databases using the BLAST package at http://www.ncbi.nlm.nih.gov/blast/ 5 and the
Chapter 2 – General materials and methods
28
Wisconsin Package Version 10.2 (Genetics Computer Group (GCG), Madison, Wisconsin, U.S.A.).
Shading was supplied by Boxshade server (http://www.ch.embnet.org/software/BOX_form.html)
and Clustal X was used for 16S rDNA sequence alignments 305.
2.4 Analytical techniques
2.4.1 Spectrophotometry
Spectrophotometric work was performed using a Shimadzu UV-160A UV-Visible Recording
Spectrophotometer (Shimadzu Corporation, Japan). All samples were blanked against reagent.
2.4.2 Thin layer chromatography
Thin layer chromatography (TLC) of RDX was performed using 200 µm polyester plates
pre-coated with ultraviolet absorbing silica gel (Machery-Nagel, Germany). Each sample (20 µl)
was spotted a distance of 2 cm from the base of the plate and allowed to dry before separation with a
mobile phase of chloroform: acetone 2:1 v/v 341. The plate was sprayed with 1 M NaOH, placed at
80 oC for 15 min to promote the alkaline hydrolysis of RDX 342 and sprayed with freshly made
Griess reagent 264. The nitrite resulting from the alkaline hydrolysis was observed as pink spots.
Griess reagent consisted of 0.8 g sulphanilamide, 0.04 g N-(1-naphthyl)ethylenediamine (NED) and
0.8 ml orthophosphoric acid, made up to 10 ml with dH2O. RDX migrates with an Rf value of 0.80
using the conditions described 341, and standards were used to compare migration distances.
2.4.3 High performance liquid chromatography
High performance liquid chromatography (HPLC) measurements were performed with a
Waters system consisting of a 510 pump, a 7120 WISP 48-vial autosampler and a 2487 dual λ
wavelength detector (Waters, Hertsford, U.K.). Samples (100-200 µl) were separated with 5-µm C18
reversed-phase column (250 x 4.6 mm; HPLC Technology, Welwyn Garden City, U.K.) with a
guard column of the same packing material to protect the main column. A reverse-phase isocratic
mobile phase consisting of HPLC-grade acetonitrile: water (50:50, v/v) was passed through a 0.45
µm filter under vacuum and degassed before use and delivered at a flow rate of 0.7-1 ml/min. RDX
elution was monitored at 205 nm. The RDX peak was identified by comparison of the retention
time with an authentic standard. Standards of authentic RDX ranging in concentration from 2.5 to
20 nmoles were treated in an identical manner to assay samples and were run before each set of
samples. Waters Millennium software was used to integrate the area under the peaks. Standard
Chapter 2 – General materials and methods
29
curves of concentration versus peak area were constructed for each run of samples and used to
convert peak area data of samples to concentrations of RDX.
2.4.4 Griess assay
Analysis of nitrite was performed using the Griess assay 264. Samples (200 µl) were added to
560 µl dH2O and 200 µl sulphanilamide solution (1 % sulphanilamide in 7 % HCl), to which 40 µl
NED solution (0.5 % NED) was added, and the mixture inverted several times. The sample was
assayed at 540 nm, blanked against reagent and the concentration of nitrite calculated from a
standard curve of sodium nitrite which was performed with each batch of samples.
2.4.5 Ion chromatography
Nitrite, nitrate, formate and ammonium were analysed by ion chromatography using a
Dionex system comprising an AS40 autosampler and a DX-120 ion chromatograph (Dionex,
Sunnyvale, California, U.S.A.). Integrations were performed using Dionex PeakNet software.
Samples (25 µl) were assayed for anions with 8 mM Na2CO3/1 mM NaHCO3 as the eluent using an
AS14A column (250 x 4 mm, Dionex), and cations using a CS12A column (250 x 4 mm, Dionex)
with 20 mM methane sulphonic acid as the eluent, both at a flow rate of 1 ml/min. Standards were
run using the supplied anion and cation authentic standards (Dionex) diluted 1/5, 1/10, 1/50 and
1/100, with the anion standards supplemented with nitrite and formate where appropriate. Standard
curves were constructed of calculated concentration versus peak area and used to convert peak area
data of samples to concentrations of ions.
2.4.6 Analysis of formaldehyde
Formaldehyde was analysed using the Hantzsch spectrophotometric assay 214. The reagent
consisted of 0.206 % v/v acetylacetone, 15.4 % w/v ammonium acetate and 0.284 % v/v acetic acid,
which was added 1:1 to the sample, incubated for 10 min at 58 oC and absorbance was measured at
412 nm. Standards of formaldehyde at concentrations of 0, 10, 20, 50, 100 and 250 µM in the
relevant assay buffer were assayed and used to construct a standard curve of concentration against
absorbance at 412 nm. This was used to determine concentrations of formaldehyde in the samples
from absorbance readings.
Chapter 3 – Isolation of bacteria with RDX degrading activity
30
Chapter 3. Isolation, identification and characterization of bacteria
possessing RDX degrading activity
3.1 Background
The isolation of bacteria with specific degradative activities is commonly performed using
selective enrichments, with inocula from contaminated soils. Soil environments are often nutrient
limited, and bacteria can develop the ability to scavenge nutrients from polluting compounds,
breaking them down in the process. Selective enrichment works by inoculating a source of bacteria
into a medium with a defined composition to encourage the growth of specific types of bacteria.
Usually the bacteria with the desired degradative ability can grow because they alone can utilize a
component of the medium. There are many examples of bacterial isolation using this method in the
literature. Rhodococcus sp. strain QT-1 was isolated from contaminated soil samples and found to
degrade 1,3-dinitrobenzene 81. Many chlorobenzene degraders were isolated from contaminated
groundwater and identified as gram positive strains or Pseudomonas species 218. Pseudomonas
strain, 4NT, capable of the degradation of 4-nitrotoluene, was isolated from contaminated soil 125.
Further chlorobenzene degraders were isolated from chlorobenzene contaminated wells, whereas
uncontaminated wells yielded none with this ability 219. This study, in particular, illustrates the
presence of bacteria possessing the phenotype of interest in areas where the compound is abundant,
and the absence of this phenotype in the absence of the compound. The bacteria may possess these
activities in order to detoxify the harmful compounds or to obtain nutrients from them in the form of
breakdown products. The search for bacteria able to degrade RDX often uses soil contaminated
with RDX as a source of micro-organisms (§1.7.2).
In cases where the isolation of the genes which allow these bacteria to degrade xenobiotic
compounds are reported, many are found to be carried on plasmids or transposons. Where more
than one gene is required for the degradation of a xenobiotic compound using a pathway, these
genes are often found in clusters. Examples include the gene cluster for biphenyl degradation in
several strains 104, 204, 292, the nah cluster for naphthalene degradation 117, 340, and the xyl cluster for
toluene/ xylene degradation 96. The clustering of genes which are all involved in a degradative
pathway will be favoured in that individual pathway components are less useful than the full
complement, leading to selective pressure keeping all the components together, and to enable more
effective regulation of the genes. However, not all genes involved in a pathway are found together,
Chapter 3 – Isolation of bacteria with RDX degrading activity
31
as exemplified by the dntABD genes for 2,4-dinitrotoluene degradation, which are not clustered,
although they are all found on a 180 kb plasmid in Pseudomonas sp. strain DNT 298. Other
degradation genes located on plasmids include the genes for alkane, isopropylbenzene, and
polyaromatic hydrocarbon (PAH) degradation in strains of Rhodococcus and Pseudomonas 72, 93, 312.
The presence of these genes on plasmids is thought to aid their mobility within a bacterial
population, which also accounts for the presence of such genes on transposons. The bph genes in
Alcaligenes eutrophus are carried on a 59 kb transposon 292, and the genes for the degradation of
chlorocatechol in A. eutrophus and alkane in P. putida are each found between two insertion
sequences 222, 312. A review of these catabolic transposons can be found in Tan 301.
RDX is a serious environmental contaminant, and biodegradation has great potential for its
remediation. To date, several studies have characterized microbial growth on RDX, and aerobic
bacteria appear to form fewer toxic by-products than anaerobic bacteria from RDX degradation, and
to perform the degradation more rapidly (§1.7.2). Of the aerobic RDX degrading bacteria reported,
all are able to utilize RDX as a sole source of nitrogen 27, 59, 157 but not as a source of carbon. These
bacteria include Stenotrophomonas maltophilia PB1 27 and Rhodococcus sp. strain DN22 59, both
isolated from contaminated soil.
Previously, an RDX degrading bacterium, designated strain 11Y, was isolated by Professor
Bruce’s group (Professor N. Bruce, personal communication) from explosive contaminated soil
through its ability to grow on RDX as a sole source of nitrogen. It is a gram positive strain; partial
16S rDNA gene sequencing and phylogenetic comparison identified it as a species of Rhodococcus.
National Collection of Industrial and Marine Bacteria (NCIMB) identification found it to be a non-
sporulating, non-motile organism, oxidase negative and catalase positive; cell wall and fatty acid
analysis showed the presence of mycolic acids which confirmed it to be a strain of Rhodococcus
rhodochrous, and it has been designated NCIMB 40820. It is desirable to isolate and identify
further strains of RDX degrading bacteria, which may give us an insight into the range of bacteria
which are possess this activity, and possibly the range of mechanisms by which this occurs.
The isolation and comparison of bacterial strains which can utilize RDX as a sole nitrogen
source are described in this chapter.
Chapter 3 – Isolation of bacteria with RDX degrading activity
32
3.2 Materials and methods
3.2.1 Isolation and purification of RDX degrading strains
Enrichments were performed in minimal medium with 1 mM RDX provided as the sole
nitrogen source and the three carbon sources described (§2.2.3). Contaminated samples were used
to inoculate the medium, which was grown for 7 days at 30 oC. Subcultures were performed four
times, each time diluting 50 fold into fresh medium, and growing for 7 days at 30 oC. Serial
dilutions of the final enrichment cultures were spread onto LA plates. Pure bacterial strains were
obtained as individual colonies picked from these plates.
3.2.2 Removal of RDX from growth medium
Strains were used to inoculate 5 ml minimal medium containing 1 mM RDX as the sole
nitrogen source and three carbon sources. After 5 days at 30 oC, 0.5 ml samples of the media were
taken and centrifuged at maximum speed for 2 min. The supernatant was mixed vigorously with 0.5
ml ethyl acetate to extract the RDX and centrifuged for 5 min at maximum speed. The solvent layer
was taken and the solvent evaporated at 60 oC. The residue was dissolved in 20 µl acetone and
subjected to TLC (§2.4.2). Positive control cultures were inoculated with Rhodococcus
rhodochrous strain 11Y, known to remove RDX. Two negative controls were performed: a sterile
culture and a bacterium known not to degrade RDX, R. rhodochrous strain CW25.
3.2.3 Zones of clearance on RDX plates
Each bacterial strain was grown in minimal medium containing 1 mM RDX for 3 days.
Each culture (1 ml) was harvested and resuspended in 20 µl 40 mM phosphate buffer (pH 7.2) to a
high cell density. An aliquot (10 µl) of each isolate was placed on an RDX zone of clearance plate
(§2.2.3) which was incubated at 30 oC until zones of clearance became apparent. A positive control
using strain 11Y and a negative control using the non RDX degrader strain CW25 were performed.
3.2.4 Utilization of RDX as a carbon and nitrogen source
Strains were incubated for 12 days in minimal medium containing no sources of carbon and
5 mM RDX. RDX was assayed by TLC as above, after 5 days and 12 days incubation. Strain
CW25 and a sterile culture were included as negative controls for RDX breakdown. No positive
controls were available, as no bacteria have been isolated which are able to use RDX as a source of
carbon.
Chapter 3 – Isolation of bacteria with RDX degrading activity
33
3.2.5 Identification of bacterial isolates
3.2.5.1 Phenotypic characteristics
All bacterial strains were streaked to single colonies on LA and grown for 3 days at 30 oC.
Colonies were assessed phenotypically for colour, morphology, size, whether or not they appeared
mucoid, and to what degree.
3.2.5.2 Gram reaction determination 236
Biomass was taken from LA plates and mixed for 1 min on a glass slide with 3 % w/v KOH.
Gram negative strains were identified by a viscous stringy appearance of the mixture, indicating
lysis under these conditions. Gram positive strains do not form this viscous gel.
3.2.5.3 16S rDNA identification
A set of oligonucleotide primers specifically designed for annealing to sequences of bacterial
16S rRNA genes were used to amplify nearly full-length 16S rDNA from each of the bacterial
isolates. Primers fD1 and rD1, designed around the 5’ and 3’ ends (respectively) of bacterial 16S
rDNA to produce an approx. 1.6 kb fragment 327, were purchased from Sigma-Genosys Ltd. (Table
3.1). Primer fD1 has an engineered Sal I site, and rD1 an engineered BamH I site.
Table 3.1: Primers used for PCR and sequencing of 16S rDNA fragment. Engineered restriction sitesare shown in bold.
Primer Sequence Tm (oC)
fD1 327 5’ CCGAATTCGTCGACAACAGAGTTTGATCCTGGCTCAG 3’ 82.4
rD1 327 5’ CCCGGGATCCAAGCTT AAGGAGGTGATCCAGCC 3’ 82.7
H2f 5’ AGCAGCCGCGGTAATAC 3’ 54
PCR amplification of DNA was performed using total DNA prepared from each isolate
(§2.3.1) as the template. PCR cycles were performed as described (§2.3.6) using an annealing
temperature of 55-62 oC and an extension time of 2 min. The approx. 1.6 kb PCR product amplified
from each bacterial isolate was gel purified, cloned into pCR-2.1 TOPO vector and transformed
into the E. coli host TOP10. In order to confirm the size of the insert, plasmids were extracted and
digested with Sal I and BamH I, which cut within the engineered ends of the fragment. The inserts
were sequenced using the standard M13F and M13R primers which prime within the lacZ gene of
Chapter 3 – Isolation of bacteria with RDX degrading activity
34
the pCR-2.1 TOPO vector. The chromatograms obtained were analysed using Sequencher to
verify or correct the base assignments that had been made automatically. A further primer, H2f
(Table 3.1), was designed to a conserved region within the resulting sequences, and the plasmids
sequenced using primer H2f to complete the internal sequence of the 16S rDNA gene. The
sequence data were aligned into a single contiguous stretch of DNA (contig) with the use of
Sequencher , and the contigs obtained were subjected to BLAST searches. Bacterial identification
was based on the most homologous 16S rDNA sequences returned.
3.2.6 Antibiotic resistance testing
Plates of LA (20 ml) containing the appropriate concentrations of antibiotic were made.
The concentrations of antibiotics used were chosen as the concentrations surrounding the commonly
used doses described in Ausubel et al. 8; those not listed were used at a range of concentrations
between 10-100 µg/ml (Table 3.5). Isoniazid was used in concentrations ranging from 50 – 200
µg/ml, around the concentration of 100 µg/ml specified for use when growing cells for
electroporation 164. Bacteria tested included all the RDX degrading isolates, R. rhodochrous strain
CW25 and E. coli. Cells were streaked onto each concentration of antibiotic and growth assessed
after 5 days at 30 oC.
3.2.7 TNT tolerance testing
LA plates containing TNT of concentrations varying from 0.005 – 0.65 mM were prepared at
concentrations: 0.005, 0.01, 0.05, 0.1, 0.5 and 0.65 mM. Bacteria tested included all the RDX
degrading isolates, R. rhodochrous strain CW25 and E. coli. Cells were streaked onto each
concentration and growth assessed after 5 days at 30 oC.
3.2.8 Extraction of large plasmids
Large plasmids were extracted from rhodococcal strains using the protocol of Hansen et al.128. Cells were grown overnight in 40 ml LB, harvested, rinsed in 10 ml of 10 mM sodium
phosphate buffer, pH 7.0 and resuspended in 1.35 ml of 25 % w/v sucrose in 50 mM Tris pH 8.0.
An aliquot (100 µl) of 10 mg/ml lysozyme in 250 mM Tris pH 8.0 was added and the sample
inverted four times before being incubated on ice for 5 min. An aliquot (0.5 ml) of 250 mM EDTA
pH 8.0 was added, the sample was inverted eight times, incubated for 15 s at 55 oC, inverted five
times and 0.5 ml 3N NaOH was added. The sample was inverted for 3 min, 0.5 ml 2 M Tris pH 7.0
Chapter 3 – Isolation of bacteria with RDX degrading activity
35
was added and the sample was inverted ten times. A further 0.5 ml 2 M Tris pH 7.0 was added and
the sample was again inverted ten times. SDS 20 % w/v in TE (0.65 ml) was added, followed by
1.25 ml 5 M NaCl. The sample was inverted 20 times, incubated at 4 oC overnight, then centrifuged
at 12,000 rpm for 30 min at 4 oC. To the supernatant, 1.5 ml 42 % w/v polyethylene glycol (PEG)
6000 in 10 mM sodium phosphate buffer, pH 7.0 was added, mixed in with a plastic pipette and this
was incubated at 4 oC overnight. The sample was centrifuged for 5 min at 2,500 rpm using an SS34
rotor in a Sorvall RC5C centrifuge (Sorvall, Kendro, Bishop’s Stortford, U.K.) and the pellet
resuspended in 150 µl dH2O.
3.2.9 Resting cell incubations of bacterial isolates
Cultures (1 litre) of minimal medium containing 0.5 mM RDX as a sole nitrogen source and
three carbon sources were inoculated with 5 day starter cultures of RDX grown bacteria. Cultures
were grown at 30 oC and assayed for RDX presence twice daily by HPLC. Twenty four hours after
complete removal of RDX, cultures were harvested by centrifugation at 10,000 rpm for 10 min at 4oC. Cells were rinsed twice in 40 mM phosphate buffer pH 7.5 and resuspended in 40 mM
phosphate buffer pH 7.5 to 0.5 g wet weight/ml. Aliquots (0.9 ml) of 40 mM phosphate buffer pH
7.5 containing 0.25 mM RDX (final concentration) were placed into 7 ml Bijoux containers and
equilibrated at 30 oC, as were the resuspended cells. Aliquots (100 µl) of cells were added to the
Bijoux containers and incubated, shaking at 110 rpm, for 0, 5, 10, 20, 30 and 60 min at 30 oC.
Reactions were stopped by the precipitation of protein through the addition of 1 ml 10 % v/v glacial
acetic acid and incubation on ice for 10 min. The resulting supernatant was assayed for RDX
concentration by HPLC (§2.4.3) and nitrite concentration using the Griess assay (§2.4.4). Negative
controls included sterile RDX sampled after 60 min, and cells incubated in the absence of RDX,
sampled after 0, 30 and 60 min.
Chapter 3 – Isolation of bacteria with RDX degrading activity
36
3.3 Results
3.3.1 Isolation and purification of 19 RDX degrading strains
Material from areas of heavy RDX and HMX contamination were supplied by Dstl and used
as the source for isolating RDX degrading bacteria by selective enrichment. Samples were obtained
from several sites: soil next to munitions factories where dust from the floor was swept out, soil
from areas where explosives were steamed out of shells, and detritus from munition contaminated
drains (Table 3.2). The medium used for selective enrichment was similar to that used in the
successful isolation of a gram negative RDX degrading bacterium by Binks et al. 27. This medium
contained 1 mM RDX as a sole nitrogen source, and was buffered at pH 7.2 which is within the pH
range at which many bacteria isolated from the environment are able to grow.
Following four subcultures in selective medium, the culture was plated onto rich medium
and individual colonies picked. Seventy three pure bacterial strains were obtained from the
enrichments.
3.3.1.1 Removal of RDX from growth medium
Bacterial growth is typically assessed by optical density at 600 nm, but as 1 mM RDX is
above its aqueous solubility limit of 0.27 mM (60 mg/l at 30 oC) 195, turbidity results from the
presence of the undissolved RDX as crystals, as well as the bacterial growth. RDX removal from
medium by the bacterial isolates was therefore assessed by TLC to determine which were able to
break down the RDX. RDX breakdown would be necessary for release of nitrogen containing
compounds for bacterial growth. RDX was visualized through alkaline hydrolysis and detection of
resulting nitrite by Griess assay on the TLC plate. Any nitro-containing metabolites produced
should also be visualized by this method. The result of a typical TLC analysis of 6 strains is shown
in Figure 3.1. Presence of a pink spot indicates that the bacterial isolate was not able to break down
RDX. Positive controls containing Rhodococcus rhodochrous strain 11Y showed RDX removal,
and negative controls, which were either sterile or inoculated with non RDX degrader R.
rhodochrous strain CW25, showed no removal of RDX.
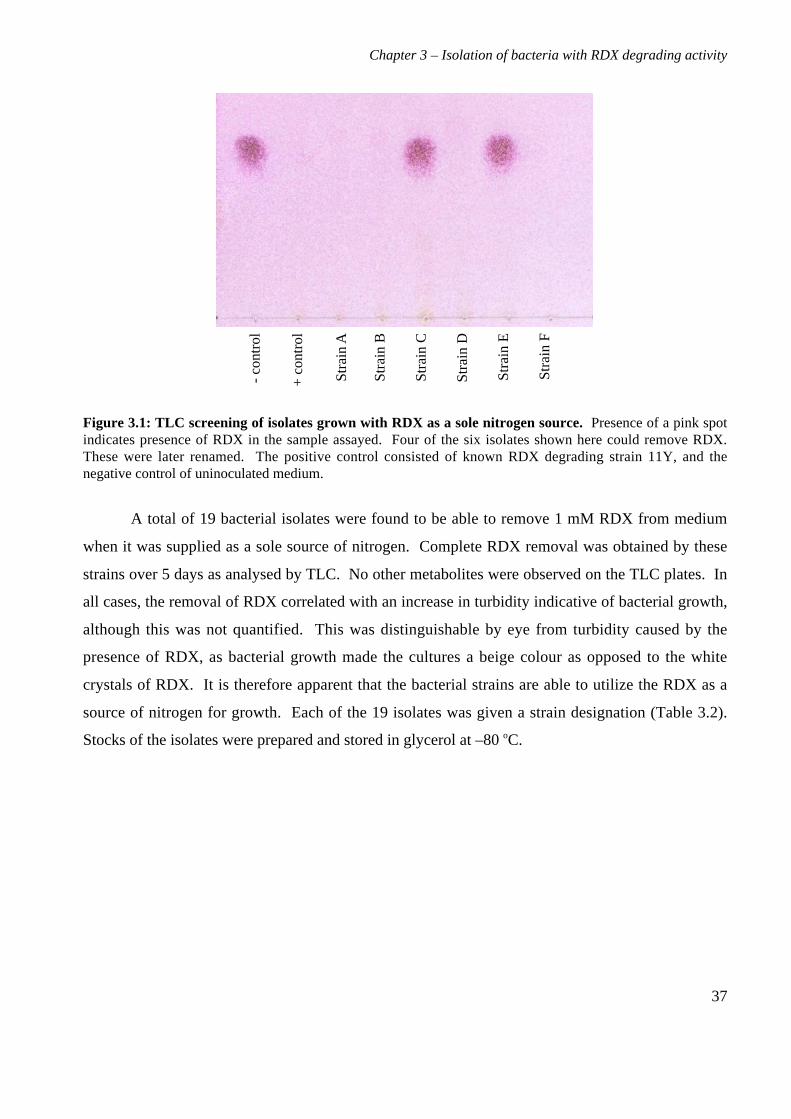
Chapter 3 – Isolation of bacteria with RDX degrading activity
37
Str
ain
A
Str
ain
B
Str
ain
C
Str
ain
D
Str
ain
E
Str
ain
F
+ c
ontr
ol
- co
ntro
l
Figure 3.1: TLC screening of isolates grown with RDX as a sole nitrogen source. Presence of a pink spotindicates presence of RDX in the sample assayed. Four of the six isolates shown here could remove RDX.These were later renamed. The positive control consisted of known RDX degrading strain 11Y, and thenegative control of uninoculated medium.
A total of 19 bacterial isolates were found to be able to remove 1 mM RDX from medium
when it was supplied as a sole source of nitrogen. Complete RDX removal was obtained by these
strains over 5 days as analysed by TLC. No other metabolites were observed on the TLC plates. In
all cases, the removal of RDX correlated with an increase in turbidity indicative of bacterial growth,
although this was not quantified. This was distinguishable by eye from turbidity caused by the
presence of RDX, as bacterial growth made the cultures a beige colour as opposed to the white
crystals of RDX. It is therefore apparent that the bacterial strains are able to utilize the RDX as a
source of nitrogen for growth. Each of the 19 isolates was given a strain designation (Table 3.2).
Stocks of the isolates were prepared and stored in glycerol at –80 oC.
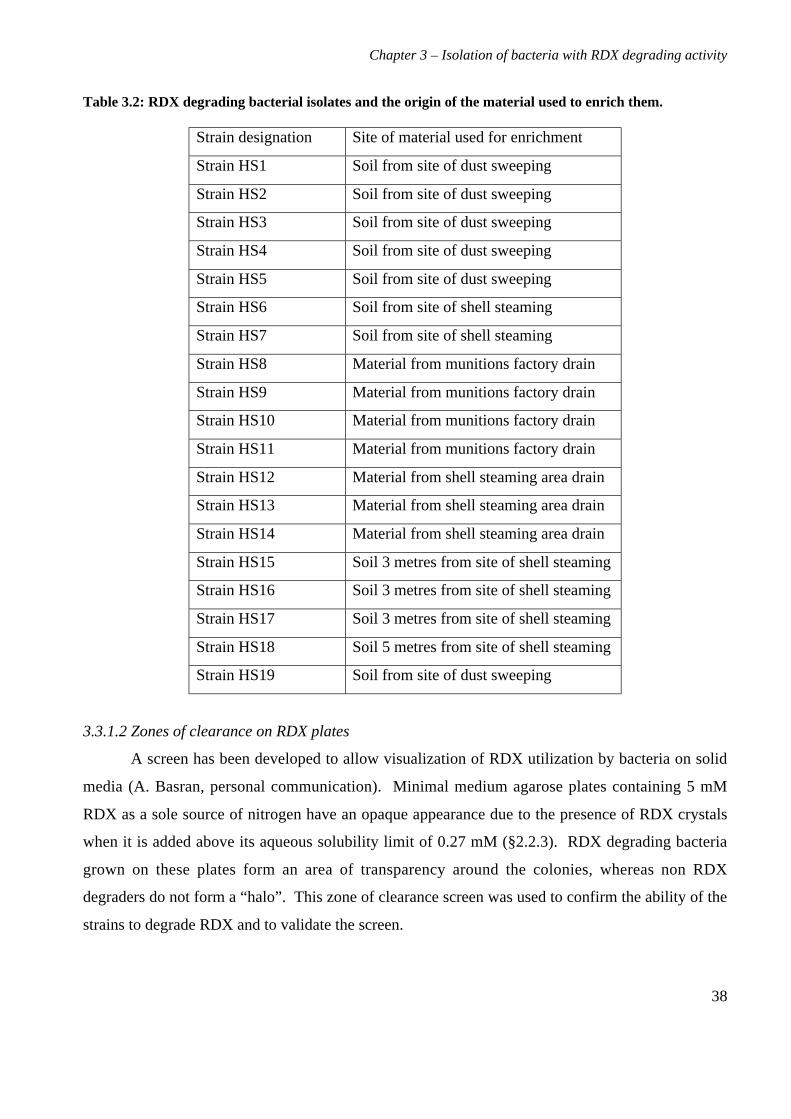
Chapter 3 – Isolation of bacteria with RDX degrading activity
38
Table 3.2: RDX degrading bacterial isolates and the origin of the material used to enrich them.
Strain designation Site of material used for enrichment
Strain HS1 Soil from site of dust sweeping
Strain HS2 Soil from site of dust sweeping
Strain HS3 Soil from site of dust sweeping
Strain HS4 Soil from site of dust sweeping
Strain HS5 Soil from site of dust sweeping
Strain HS6 Soil from site of shell steaming
Strain HS7 Soil from site of shell steaming
Strain HS8 Material from munitions factory drain
Strain HS9 Material from munitions factory drain
Strain HS10 Material from munitions factory drain
Strain HS11 Material from munitions factory drain
Strain HS12 Material from shell steaming area drain
Strain HS13 Material from shell steaming area drain
Strain HS14 Material from shell steaming area drain
Strain HS15 Soil 3 metres from site of shell steaming
Strain HS16 Soil 3 metres from site of shell steaming
Strain HS17 Soil 3 metres from site of shell steaming
Strain HS18 Soil 5 metres from site of shell steaming
Strain HS19 Soil from site of dust sweeping
3.3.1.2 Zones of clearance on RDX plates
A screen has been developed to allow visualization of RDX utilization by bacteria on solid
media (A. Basran, personal communication). Minimal medium agarose plates containing 5 mM
RDX as a sole source of nitrogen have an opaque appearance due to the presence of RDX crystals
when it is added above its aqueous solubility limit of 0.27 mM (§2.2.3). RDX degrading bacteria
grown on these plates form an area of transparency around the colonies, whereas non RDX
degraders do not form a “halo”. This zone of clearance screen was used to confirm the ability of the
strains to degrade RDX and to validate the screen.
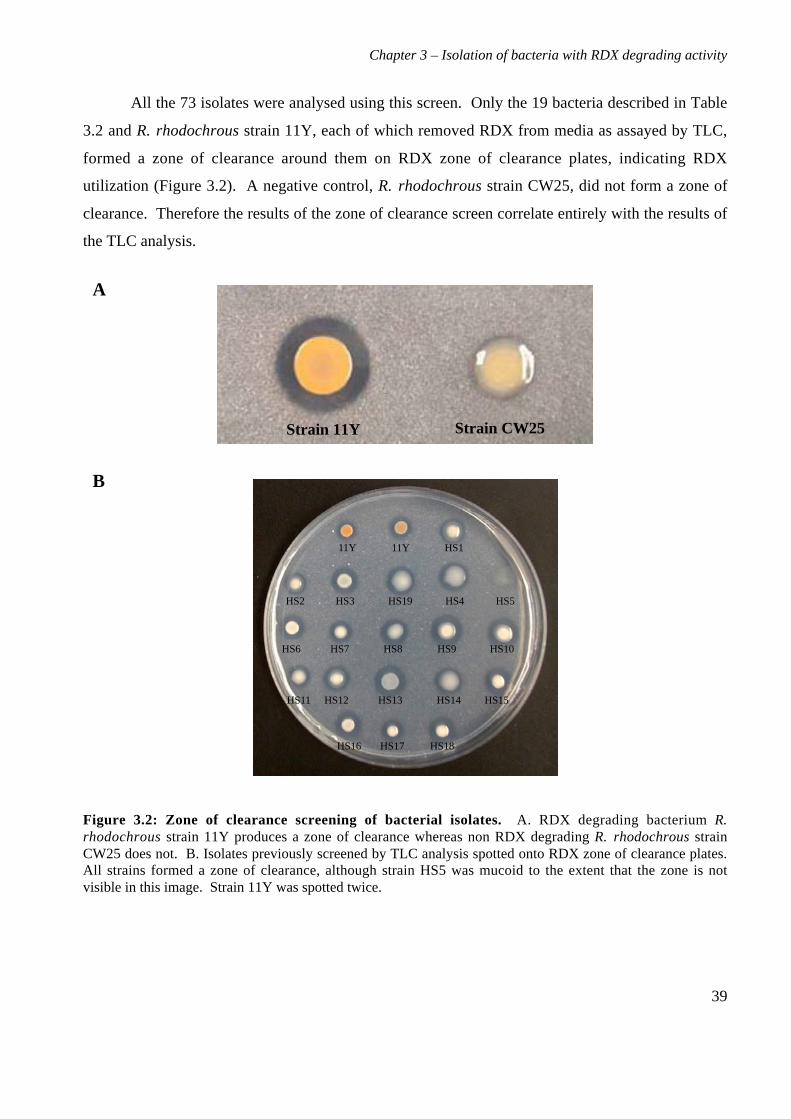
Chapter 3 – Isolation of bacteria with RDX degrading activity
39
All the 73 isolates were analysed using this screen. Only the 19 bacteria described in Table
3.2 and R. rhodochrous strain 11Y, each of which removed RDX from media as assayed by TLC,
formed a zone of clearance around them on RDX zone of clearance plates, indicating RDX
utilization (Figure 3.2). A negative control, R. rhodochrous strain CW25, did not form a zone of
clearance. Therefore the results of the zone of clearance screen correlate entirely with the results of
the TLC analysis.
11Y HS1
HS2 HS3 HS19 HS4 HS5
HS6 HS7 HS8 HS9 HS10
HS11 HS12 HS13 HS14 HS15
HS16 HS17 HS18
11Y
Figure 3.2: Zone of clearance screening of bacterial isolates. A. RDX degrading bacterium R.rhodochrous strain 11Y produces a zone of clearance whereas non RDX degrading R. rhodochrous strainCW25 does not. B. Isolates previously screened by TLC analysis spotted onto RDX zone of clearance plates.All strains formed a zone of clearance, although strain HS5 was mucoid to the extent that the zone is notvisible in this image. Strain 11Y was spotted twice.
A
B
Strain 11Y Strain CW25
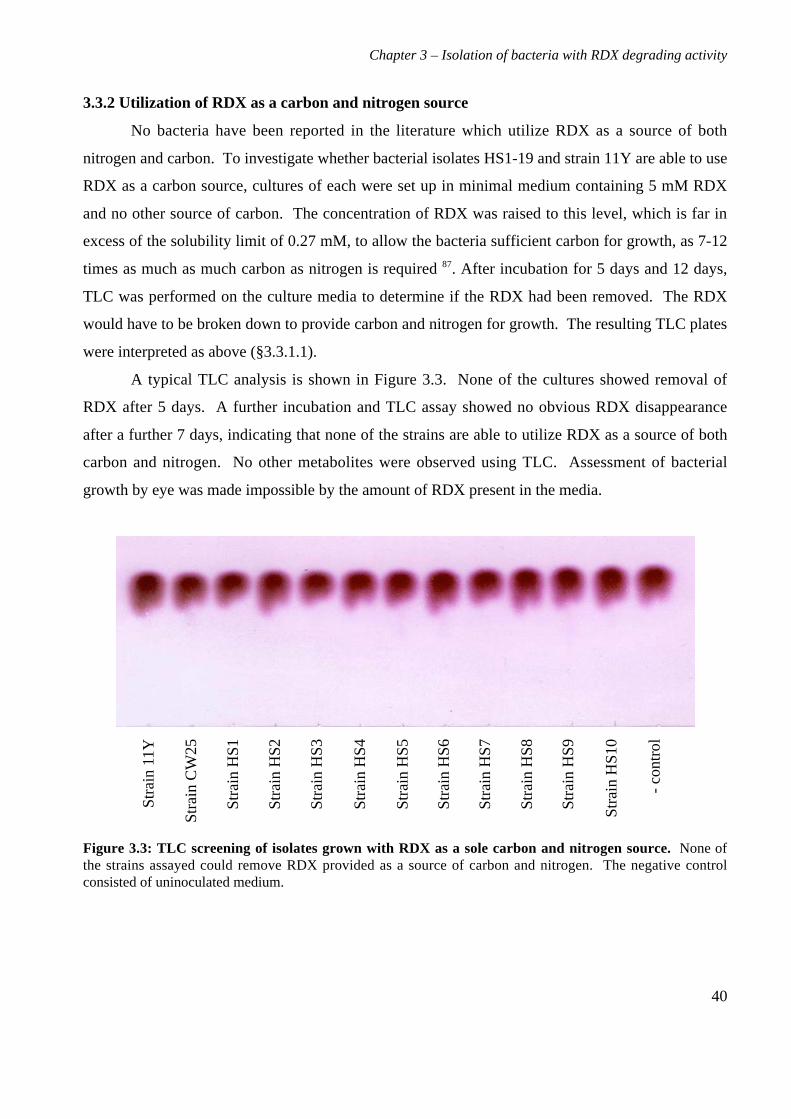
Chapter 3 – Isolation of bacteria with RDX degrading activity
40
3.3.2 Utilization of RDX as a carbon and nitrogen source
No bacteria have been reported in the literature which utilize RDX as a source of both
nitrogen and carbon. To investigate whether bacterial isolates HS1-19 and strain 11Y are able to use
RDX as a carbon source, cultures of each were set up in minimal medium containing 5 mM RDX
and no other source of carbon. The concentration of RDX was raised to this level, which is far in
excess of the solubility limit of 0.27 mM, to allow the bacteria sufficient carbon for growth, as 7-12
times as much as much carbon as nitrogen is required 87. After incubation for 5 days and 12 days,
TLC was performed on the culture media to determine if the RDX had been removed. The RDX
would have to be broken down to provide carbon and nitrogen for growth. The resulting TLC plates
were interpreted as above (§3.3.1.1).
A typical TLC analysis is shown in Figure 3.3. None of the cultures showed removal of
RDX after 5 days. A further incubation and TLC assay showed no obvious RDX disappearance
after a further 7 days, indicating that none of the strains are able to utilize RDX as a source of both
carbon and nitrogen. No other metabolites were observed using TLC. Assessment of bacterial
growth by eye was made impossible by the amount of RDX present in the media.
Str
ain
11Y
Str
ain
CW
25
Str
ain
HS
1
Str
ain
HS
2
Str
ain
HS
3
- co
ntro
l
Str
ain
HS
4
Str
ain
HS
5
Str
ain
HS
6
Str
ain
HS
7
Str
ain
HS
8
Str
ain
HS
9
Str
ain
HS
10
Figure 3.3: TLC screening of isolates grown with RDX as a sole carbon and nitrogen source. None ofthe strains assayed could remove RDX provided as a source of carbon and nitrogen. The negative controlconsisted of uninoculated medium.
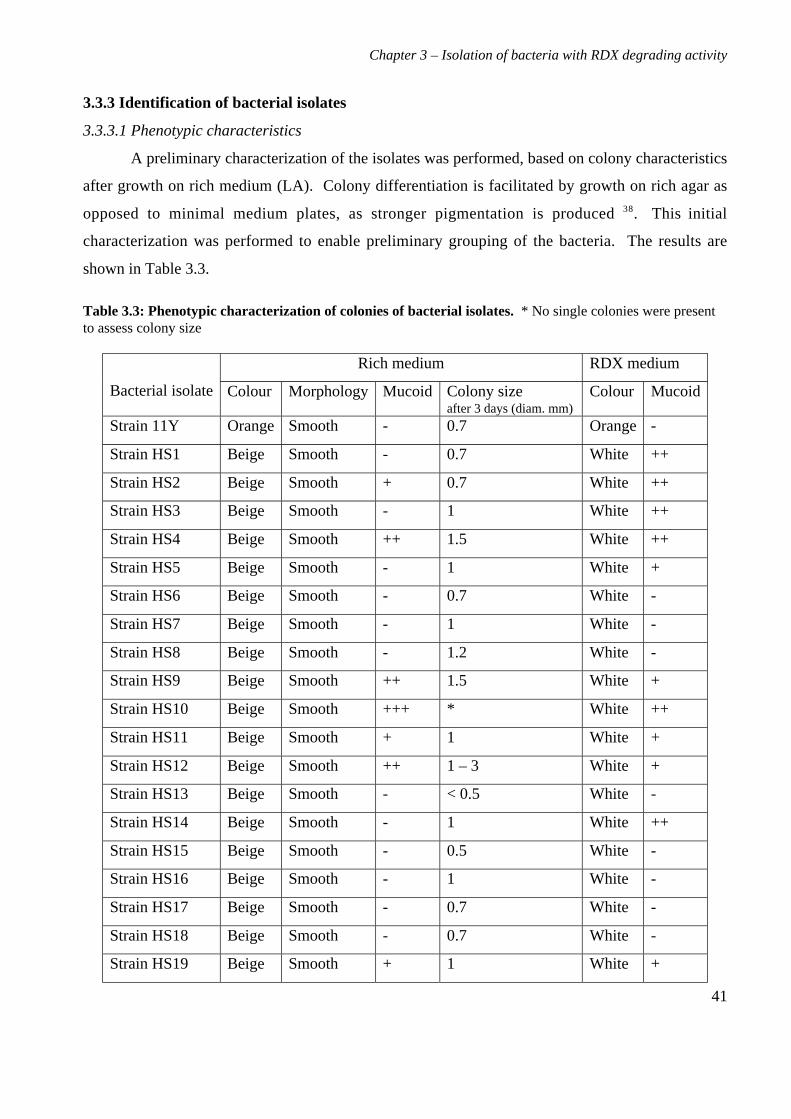
Chapter 3 – Isolation of bacteria with RDX degrading activity
41
3.3.3 Identification of bacterial isolates
3.3.3.1 Phenotypic characteristics
A preliminary characterization of the isolates was performed, based on colony characteristics
after growth on rich medium (LA). Colony differentiation is facilitated by growth on rich agar as
opposed to minimal medium plates, as stronger pigmentation is produced 38. This initial
characterization was performed to enable preliminary grouping of the bacteria. The results are
shown in Table 3.3.
Table 3.3: Phenotypic characterization of colonies of bacterial isolates. * No single colonies were presentto assess colony size
Rich medium RDX medium
Bacterial isolate Colour Morphology Mucoid Colony sizeafter 3 days (diam. mm)
Colour Mucoid
Strain 11Y Orange Smooth - 0.7 Orange -
Strain HS1 Beige Smooth - 0.7 White ++
Strain HS2 Beige Smooth + 0.7 White ++
Strain HS3 Beige Smooth - 1 White ++
Strain HS4 Beige Smooth ++ 1.5 White ++
Strain HS5 Beige Smooth - 1 White +
Strain HS6 Beige Smooth - 0.7 White -
Strain HS7 Beige Smooth - 1 White -
Strain HS8 Beige Smooth - 1.2 White -
Strain HS9 Beige Smooth ++ 1.5 White +
Strain HS10 Beige Smooth +++ * White ++
Strain HS11 Beige Smooth + 1 White +
Strain HS12 Beige Smooth ++ 1 – 3 White +
Strain HS13 Beige Smooth - < 0.5 White -
Strain HS14 Beige Smooth - 1 White ++
Strain HS15 Beige Smooth - 0.5 White -
Strain HS16 Beige Smooth - 1 White -
Strain HS17 Beige Smooth - 0.7 White -
Strain HS18 Beige Smooth - 0.7 White -
Strain HS19 Beige Smooth + 1 White +
Chapter 3 – Isolation of bacteria with RDX degrading activity
42
All environmental isolates were beige in colour on rich media plates, except 11Y. The
colour of the strains was altered by growth on minimal media plates containing RDX, where all
were paler, of a white appearance, again with 11Y being the exception by retaining its orange
colour. All the strains formed smooth colonies as opposed to rough and the major variations
between strains were in colony size and the extent to which they were mucoid. Several of the strains
were very mucoid; strain HS10 to the extent that there were no single colonies to use for
measurement of the diameter. Colony size varied between 0.5-3 mm in diameter after 3 days
growth. When placed on minimal medium, several of the strains became more mucoid than they
had been on rich medium.
3.3.3.2 Gram reaction determination
A preliminary identification of the bacteria was carried out to determine whether they were
gram positive or gram negative. The method used for Gram reaction determination 236 is based on
differences in the cell wall composition of gram positive and negative strains. The cell wall of gram
negative strains are lysed with the use of 3 % KOH, whereas gram positive strains are not. This is
not a staining technique, but appears to give fewer anomalous results than Gram staining 236.
Controls were performed consisting of a known gram positive (R. rhodochrous strain CW25) and a
known gram negative bacterium (E. coli).
The E. coli strain produced a viscous string with 3 % w/v KOH treatment, demonstrating
lysis. None of the bacterial isolates described here were lysed by this treatment, indicating that all
are gram positive.
3.3.3.3 16S rDNA identification
The isolates were further identified through the sequencing of their 16S ribosomal RNA
genes (rDNA). 16S rDNA sequences are highly conserved and are commonly used to determine
phylogenetic relatedness, as they are representative of the variation within the whole genome 111. In
addition to identifying the 19 bacterial isolates described above, the full 16S rRNA gene sequence
from Rhodococcus rhodochrous strain 11Y (§3.1) was also determined to permit full phylogenetic
comparisons between all RDX degrading isolates.
The 16S rRNA gene was amplified through PCR of genomic DNA from each strain using
primers fD1 and rD1 (Table 3.1) to give a product of approx. 1.6 kb, containing nearly the entire
gene sequence.
Chapter 3 – Isolation of bacteria with RDX degrading activity
43
The highest homology matches returned from BLAST searches showed that the bacterial
isolates fall into three groups. All the isolates from this study were found to be more closely related
to each other than to strain 11Y. To demonstrate the degree of relatedness of the bacterial isolates,
the sequences of the bacteria with homologous 16S rDNA sequences were retrieved from the
databases and aligned with sequences from the bacterial isolates using the PileUp software (GCG).
A phylogenetic tree showing the relatedness of all strains was constructed from this alignment using
ClustalX 305 and viewed using NJPlot 227 (Figure 3.4).
The strains showing highest homology to each of the bacterial strains are given in Table 3.4.
Thirteen of the strains had sequences with greatest homology to Rhodococcus erythropolis
(accession number U82667) 343. 16S rDNA sequences from the four strains HS3, HS6, HS10 and
HS13 showed highest homology to the 16S rDNA of Rhodococcus sp. strain DN22, a previously
characterized RDX degrader (X89240) 59. Two of the strains, HS1 and HS7, had a 16S rRNA gene
with highest homology to a nitrile metabolizing Rhodococcus sp. (AF420422) 38. Within these
groups, the 16S rDNA sequences of all isolates varied from the other strains by 1 – 8 nucleotides,
except those of HS8 and HS18 which were identical. Strain 11Y was found to have a highest
homology match with a Rhodococcus zopfii strain able to degrade phenol, toluene, biphenyl and
chlorinated benzenes (AF191343) 294, 344. However, previous characterization of the strain by
NCIMB using cell wall and fatty acid analysis confirmed strain 11Y to be a strain of R.
rhodochrous. Both these species fall into the genus subgroup R. rhodochrous, within which precise
identification of species is not easy 111. Therefore strain 11Y will be referred to as a strain of R.
rhodochrous, according to the NCIMB identification.
There is no pattern connecting isolates with particular 16S rDNA homologies to specific
contaminated areas. The contaminated samples used for enrichment, with the exception of soil from
shell steaming sites, can be seen to contain bacteria with highest homologies to more than one
bacterium (comparing Table 3.4 with Table 3.2). All the bacteria are very closely related from 16S
rDNA sequence comparison.
Comparing 16S rDNA identification with the colony phenotypes determined above, there is
no obvious correlation. It appears that strains with similar 16S rDNA sequences have different
colony morphologies.
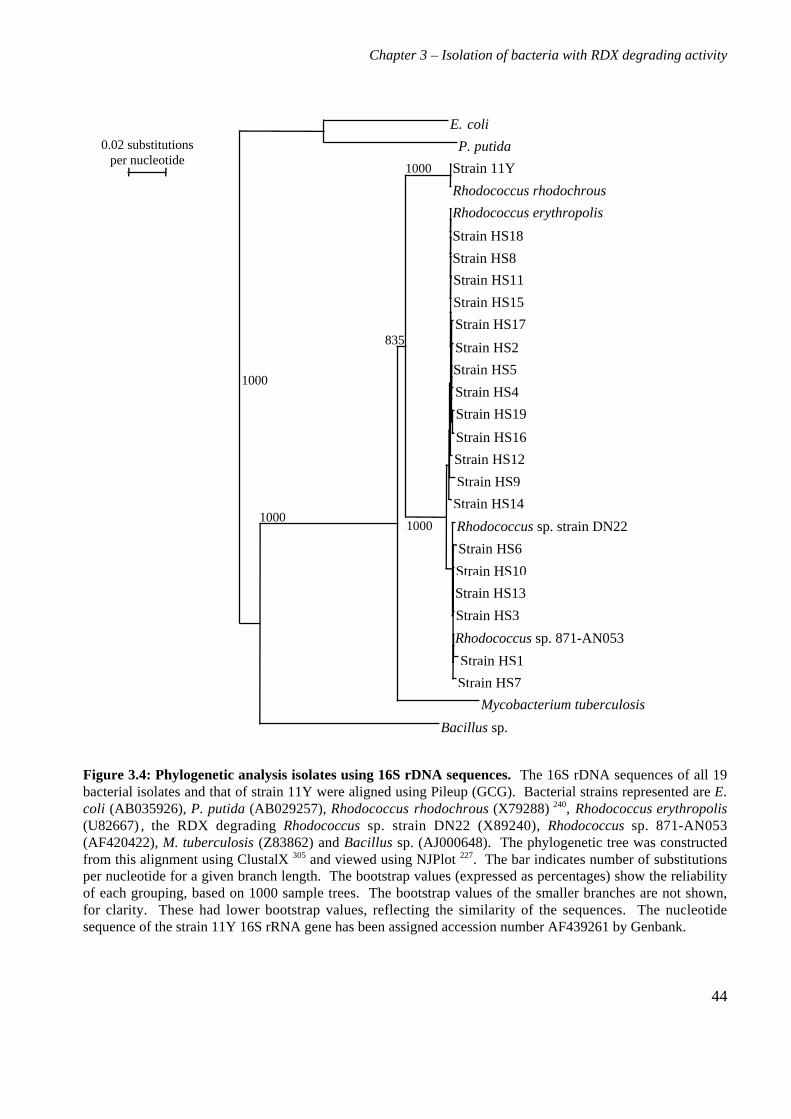
Chapter 3 – Isolation of bacteria with RDX degrading activity
44
Figure 3.4: Phylogenetic analysis isolates using 16S rDNA sequences. The 16S rDNA sequences of all 19bacterial isolates and that of strain 11Y were aligned using Pileup (GCG). Bacterial strains represented are E.coli (AB035926), P. putida (AB029257), Rhodococcus rhodochrous (X79288) 240, Rhodococcus erythropolis(U82667) , the RDX degrading Rhodococcus sp. strain DN22 (X89240), Rhodococcus sp. 871-AN053(AF420422), M. tuberculosis (Z83862) and Bacillus sp. (AJ000648). The phylogenetic tree was constructedfrom this alignment using ClustalX 305 and viewed using NJPlot 227. The bar indicates number of substitutionsper nucleotide for a given branch length. The bootstrap values (expressed as percentages) show the reliabilityof each grouping, based on 1000 sample trees. The bootstrap values of the smaller branches are not shown,for clarity. These had lower bootstrap values, reflecting the similarity of the sequences. The nucleotidesequence of the strain 11Y 16S rRNA gene has been assigned accession number AF439261 by Genbank.
Mycobacterium tuberculosis
Rhodococcus sp. 871-AN053
Bacillus sp.
Rhodococcus erythropolis
Rhodococcus rhodochrous
Strain HS7
Strain HS1
Strain HS3
Strain HS13
Strain HS10
Strain HS6
Rhodococcus sp. strain DN22
Strain HS14
Strain HS9
Strain HS12
Strain HS16
Strain HS19
Strain HS4
Strain HS5
Strain HS2
Strain HS17
Strain HS15
Strain HS11
Strain HS8
Strain HS18
Strain 11Y
1000
1000
835
1000
P. putida
E. coli
1000
0.02 substitutionsper nucleotide
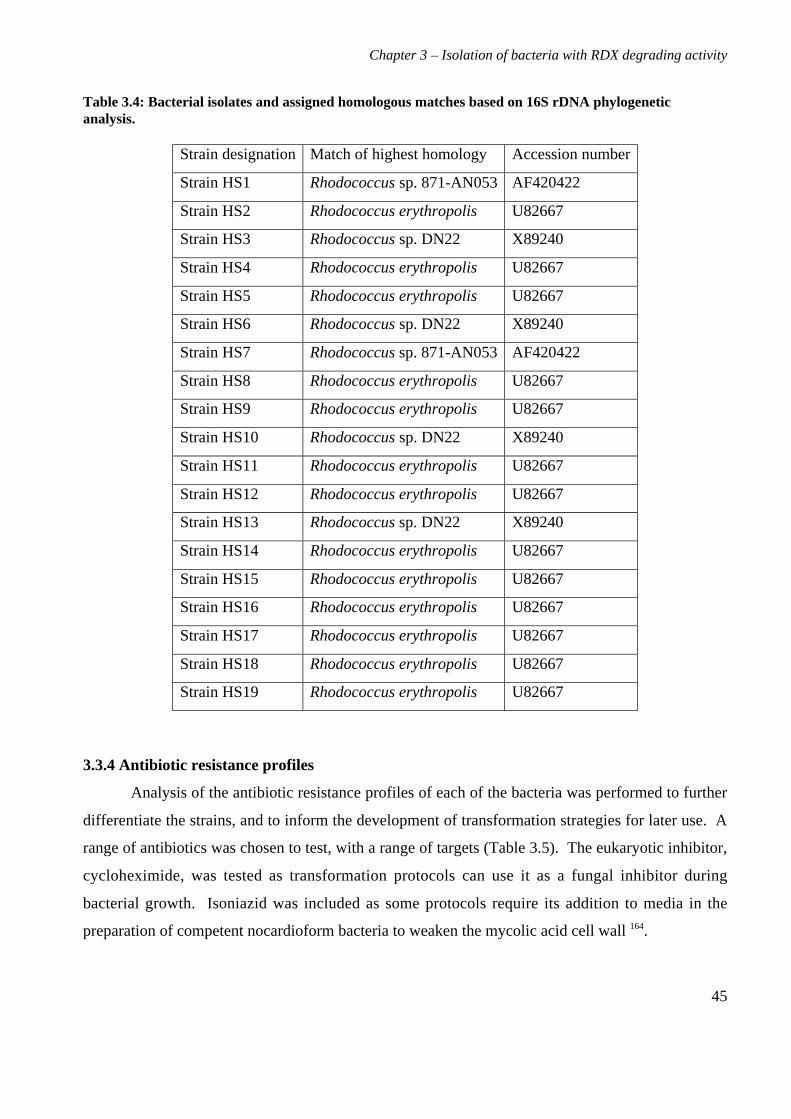
Chapter 3 – Isolation of bacteria with RDX degrading activity
45
Table 3.4: Bacterial isolates and assigned homologous matches based on 16S rDNA phylogeneticanalysis.
Strain designation Match of highest homology Accession number
Strain HS1 Rhodococcus sp. 871-AN053 AF420422
Strain HS2 Rhodococcus erythropolis U82667
Strain HS3 Rhodococcus sp. DN22 X89240
Strain HS4 Rhodococcus erythropolis U82667
Strain HS5 Rhodococcus erythropolis U82667
Strain HS6 Rhodococcus sp. DN22 X89240
Strain HS7 Rhodococcus sp. 871-AN053 AF420422
Strain HS8 Rhodococcus erythropolis U82667
Strain HS9 Rhodococcus erythropolis U82667
Strain HS10 Rhodococcus sp. DN22 X89240
Strain HS11 Rhodococcus erythropolis U82667
Strain HS12 Rhodococcus erythropolis U82667
Strain HS13 Rhodococcus sp. DN22 X89240
Strain HS14 Rhodococcus erythropolis U82667
Strain HS15 Rhodococcus erythropolis U82667
Strain HS16 Rhodococcus erythropolis U82667
Strain HS17 Rhodococcus erythropolis U82667
Strain HS18 Rhodococcus erythropolis U82667
Strain HS19 Rhodococcus erythropolis U82667
3.3.4 Antibiotic resistance profiles
Analysis of the antibiotic resistance profiles of each of the bacteria was performed to further
differentiate the strains, and to inform the development of transformation strategies for later use. A
range of antibiotics was chosen to test, with a range of targets (Table 3.5). The eukaryotic inhibitor,
cycloheximide, was tested as transformation protocols can use it as a fungal inhibitor during
bacterial growth. Isoniazid was included as some protocols require its addition to media in the
preparation of competent nocardioform bacteria to weaken the mycolic acid cell wall 164.
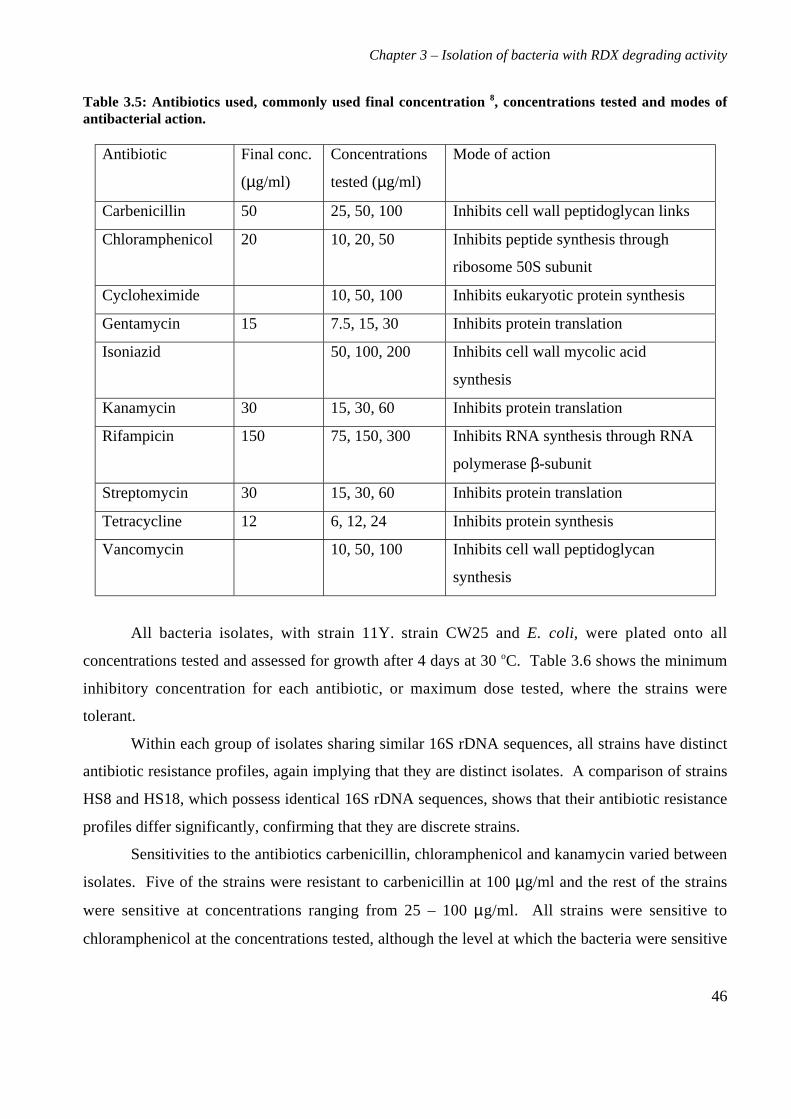
Chapter 3 – Isolation of bacteria with RDX degrading activity
46
Table 3.5: Antibiotics used, commonly used final concentration 8, concentrations tested and modes ofantibacterial action.
Antibiotic Final conc.
(µg/ml)
Concentrations
tested (µg/ml)
Mode of action
Carbenicillin 50 25, 50, 100 Inhibits cell wall peptidoglycan links
Chloramphenicol 20 10, 20, 50 Inhibits peptide synthesis through
ribosome 50S subunit
Cycloheximide 10, 50, 100 Inhibits eukaryotic protein synthesis
Gentamycin 15 7.5, 15, 30 Inhibits protein translation
Isoniazid 50, 100, 200 Inhibits cell wall mycolic acid
synthesis
Kanamycin 30 15, 30, 60 Inhibits protein translation
Rifampicin 150 75, 150, 300 Inhibits RNA synthesis through RNA
polymerase β-subunit
Streptomycin 30 15, 30, 60 Inhibits protein translation
Tetracycline 12 6, 12, 24 Inhibits protein synthesis
Vancomycin 10, 50, 100 Inhibits cell wall peptidoglycan
synthesis
All bacteria isolates, with strain 11Y. strain CW25 and E. coli, were plated onto all
concentrations tested and assessed for growth after 4 days at 30 oC. Table 3.6 shows the minimum
inhibitory concentration for each antibiotic, or maximum dose tested, where the strains were
tolerant.
Within each group of isolates sharing similar 16S rDNA sequences, all strains have distinct
antibiotic resistance profiles, again implying that they are distinct isolates. A comparison of strains
HS8 and HS18, which possess identical 16S rDNA sequences, shows that their antibiotic resistance
profiles differ significantly, confirming that they are discrete strains.
Sensitivities to the antibiotics carbenicillin, chloramphenicol and kanamycin varied between
isolates. Five of the strains were resistant to carbenicillin at 100 µg/ml and the rest of the strains
were sensitive at concentrations ranging from 25 – 100 µg/ml. All strains were sensitive to
chloramphenicol at the concentrations tested, although the level at which the bacteria were sensitive
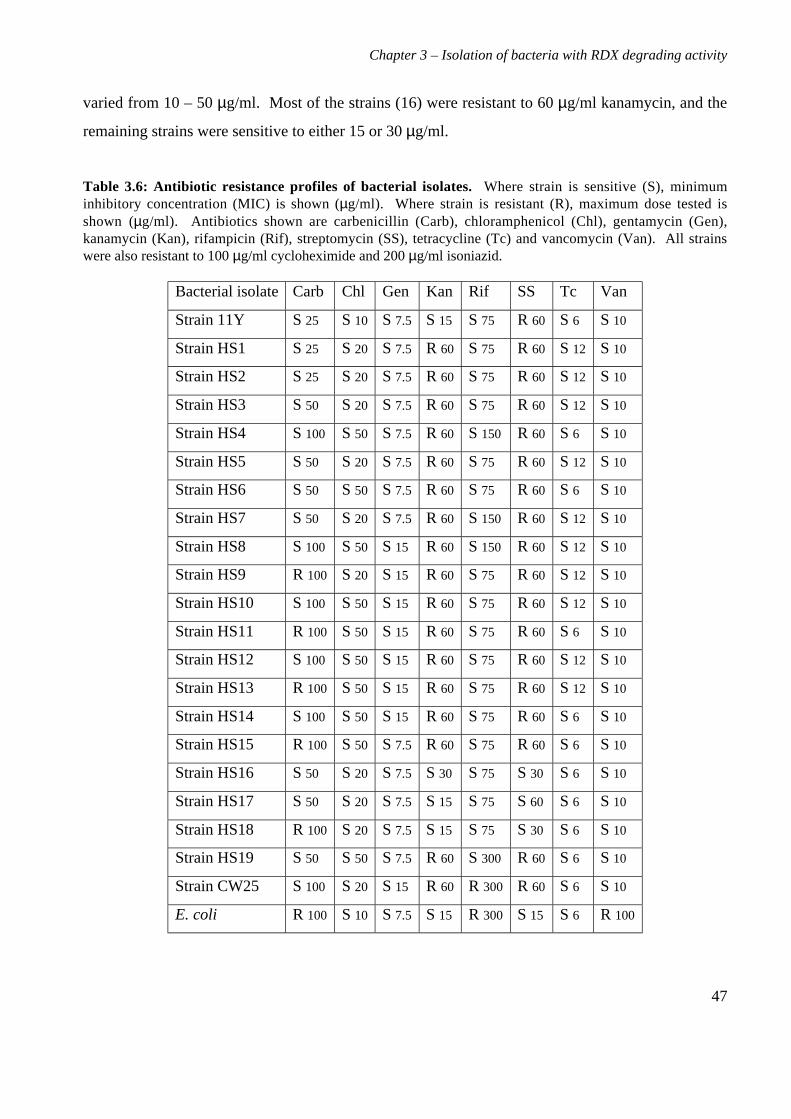
Chapter 3 – Isolation of bacteria with RDX degrading activity
47
varied from 10 – 50 µg/ml. Most of the strains (16) were resistant to 60 µg/ml kanamycin, and the
remaining strains were sensitive to either 15 or 30 µg/ml.
Table 3.6: Antibiotic resistance profiles of bacterial isolates. Where strain is sensitive (S), minimuminhibitory concentration (MIC) is shown (µg/ml). Where strain is resistant (R), maximum dose tested isshown (µg/ml). Antibiotics shown are carbenicillin (Carb), chloramphenicol (Chl), gentamycin (Gen),kanamycin (Kan), rifampicin (Rif), streptomycin (SS), tetracycline (Tc) and vancomycin (Van). All strainswere also resistant to 100 µg/ml cycloheximide and 200 µg/ml isoniazid.
Bacterial isolate Carb Chl Gen Kan Rif SS Tc Van
Strain 11Y S 25 S 10 S 7.5 S 15 S 75 R 60 S 6 S 10
Strain HS1 S 25 S 20 S 7.5 R 60 S 75 R 60 S 12 S 10
Strain HS2 S 25 S 20 S 7.5 R 60 S 75 R 60 S 12 S 10
Strain HS3 S 50 S 20 S 7.5 R 60 S 75 R 60 S 12 S 10
Strain HS4 S 100 S 50 S 7.5 R 60 S 150 R 60 S 6 S 10
Strain HS5 S 50 S 20 S 7.5 R 60 S 75 R 60 S 12 S 10
Strain HS6 S 50 S 50 S 7.5 R 60 S 75 R 60 S 6 S 10
Strain HS7 S 50 S 20 S 7.5 R 60 S 150 R 60 S 12 S 10
Strain HS8 S 100 S 50 S 15 R 60 S 150 R 60 S 12 S 10
Strain HS9 R 100 S 20 S 15 R 60 S 75 R 60 S 12 S 10
Strain HS10 S 100 S 50 S 15 R 60 S 75 R 60 S 12 S 10
Strain HS11 R 100 S 50 S 15 R 60 S 75 R 60 S 6 S 10
Strain HS12 S 100 S 50 S 15 R 60 S 75 R 60 S 12 S 10
Strain HS13 R 100 S 50 S 15 R 60 S 75 R 60 S 12 S 10
Strain HS14 S 100 S 50 S 15 R 60 S 75 R 60 S 6 S 10
Strain HS15 R 100 S 50 S 7.5 R 60 S 75 R 60 S 6 S 10
Strain HS16 S 50 S 20 S 7.5 S 30 S 75 S 30 S 6 S 10
Strain HS17 S 50 S 20 S 7.5 S 15 S 75 S 60 S 6 S 10
Strain HS18 R 100 S 20 S 7.5 S 15 S 75 S 30 S 6 S 10
Strain HS19 S 50 S 50 S 7.5 R 60 S 300 R 60 S 6 S 10
Strain CW25 S 100 S 20 S 15 R 60 R 300 R 60 S 6 S 10
E. coli R 100 S 10 S 7.5 S 15 R 300 S 15 S 6 R 100
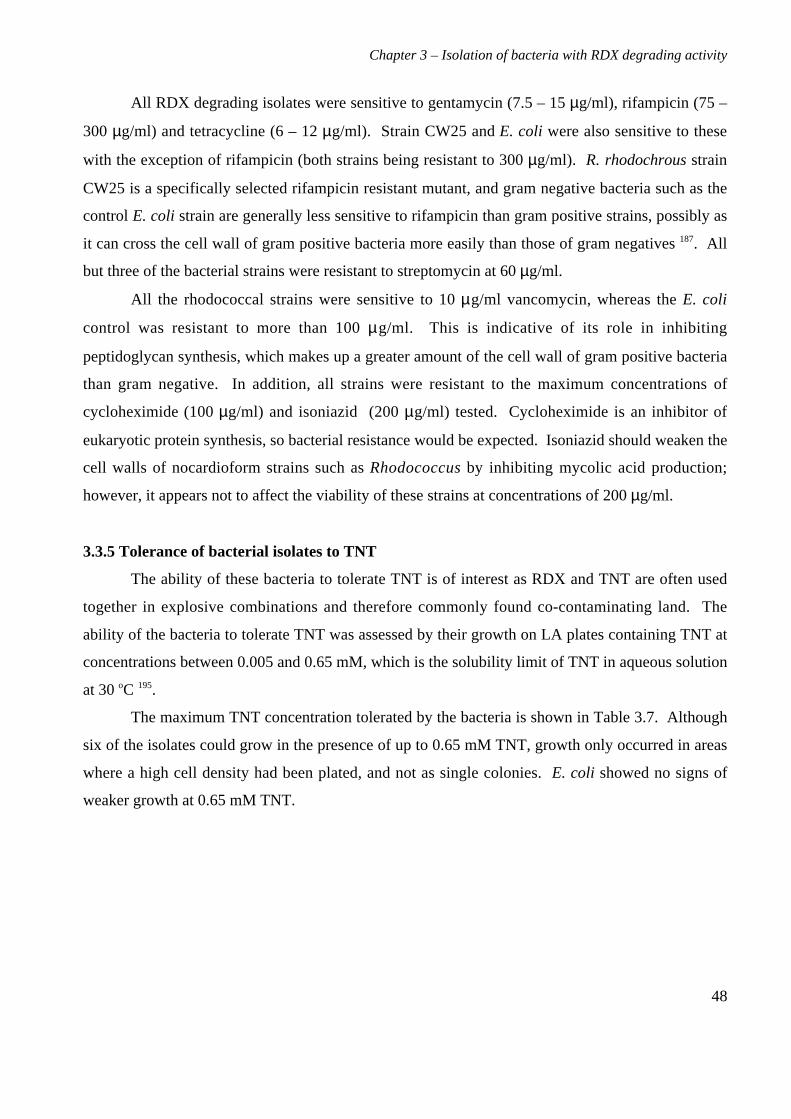
Chapter 3 – Isolation of bacteria with RDX degrading activity
48
All RDX degrading isolates were sensitive to gentamycin (7.5 – 15 µg/ml), rifampicin (75 –
300 µg/ml) and tetracycline (6 – 12 µg/ml). Strain CW25 and E. coli were also sensitive to these
with the exception of rifampicin (both strains being resistant to 300 µg/ml). R. rhodochrous strain
CW25 is a specifically selected rifampicin resistant mutant, and gram negative bacteria such as the
control E. coli strain are generally less sensitive to rifampicin than gram positive strains, possibly as
it can cross the cell wall of gram positive bacteria more easily than those of gram negatives 187. All
but three of the bacterial strains were resistant to streptomycin at 60 µg/ml.
All the rhodococcal strains were sensitive to 10 µg/ml vancomycin, whereas the E. coli
control was resistant to more than 100 µg/ml. This is indicative of its role in inhibiting
peptidoglycan synthesis, which makes up a greater amount of the cell wall of gram positive bacteria
than gram negative. In addition, all strains were resistant to the maximum concentrations of
cycloheximide (100 µg/ml) and isoniazid (200 µg/ml) tested. Cycloheximide is an inhibitor of
eukaryotic protein synthesis, so bacterial resistance would be expected. Isoniazid should weaken the
cell walls of nocardioform strains such as Rhodococcus by inhibiting mycolic acid production;
however, it appears not to affect the viability of these strains at concentrations of 200 µg/ml.
3.3.5 Tolerance of bacterial isolates to TNT
The ability of these bacteria to tolerate TNT is of interest as RDX and TNT are often used
together in explosive combinations and therefore commonly found co-contaminating land. The
ability of the bacteria to tolerate TNT was assessed by their growth on LA plates containing TNT at
concentrations between 0.005 and 0.65 mM, which is the solubility limit of TNT in aqueous solution
at 30 oC 195.
The maximum TNT concentration tolerated by the bacteria is shown in Table 3.7. Although
six of the isolates could grow in the presence of up to 0.65 mM TNT, growth only occurred in areas
where a high cell density had been plated, and not as single colonies. E. coli showed no signs of
weaker growth at 0.65 mM TNT.
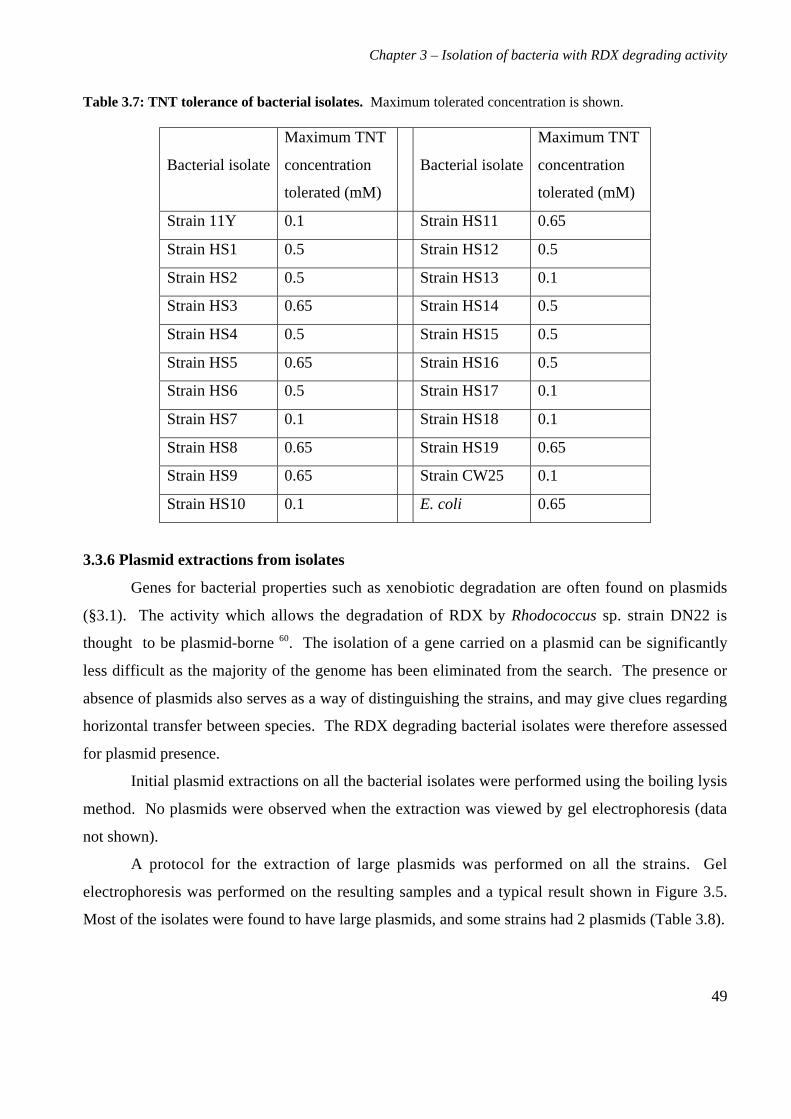
Chapter 3 – Isolation of bacteria with RDX degrading activity
49
Table 3.7: TNT tolerance of bacterial isolates. Maximum tolerated concentration is shown.
Bacterial isolate
Maximum TNT
concentration
tolerated (mM)
Bacterial isolate
Maximum TNT
concentration
tolerated (mM)
Strain 11Y 0.1 Strain HS11 0.65
Strain HS1 0.5 Strain HS12 0.5
Strain HS2 0.5 Strain HS13 0.1
Strain HS3 0.65 Strain HS14 0.5
Strain HS4 0.5 Strain HS15 0.5
Strain HS5 0.65 Strain HS16 0.5
Strain HS6 0.5 Strain HS17 0.1
Strain HS7 0.1 Strain HS18 0.1
Strain HS8 0.65 Strain HS19 0.65
Strain HS9 0.65 Strain CW25 0.1
Strain HS10 0.1 E. coli 0.65
3.3.6 Plasmid extractions from isolates
Genes for bacterial properties such as xenobiotic degradation are often found on plasmids
(§3.1). The activity which allows the degradation of RDX by Rhodococcus sp. strain DN22 is
thought to be plasmid-borne 60. The isolation of a gene carried on a plasmid can be significantly
less difficult as the majority of the genome has been eliminated from the search. The presence or
absence of plasmids also serves as a way of distinguishing the strains, and may give clues regarding
horizontal transfer between species. The RDX degrading bacterial isolates were therefore assessed
for plasmid presence.
Initial plasmid extractions on all the bacterial isolates were performed using the boiling lysis
method. No plasmids were observed when the extraction was viewed by gel electrophoresis (data
not shown).
A protocol for the extraction of large plasmids was performed on all the strains. Gel
electrophoresis was performed on the resulting samples and a typical result shown in Figure 3.5.
Most of the isolates were found to have large plasmids, and some strains had 2 plasmids (Table 3.8).
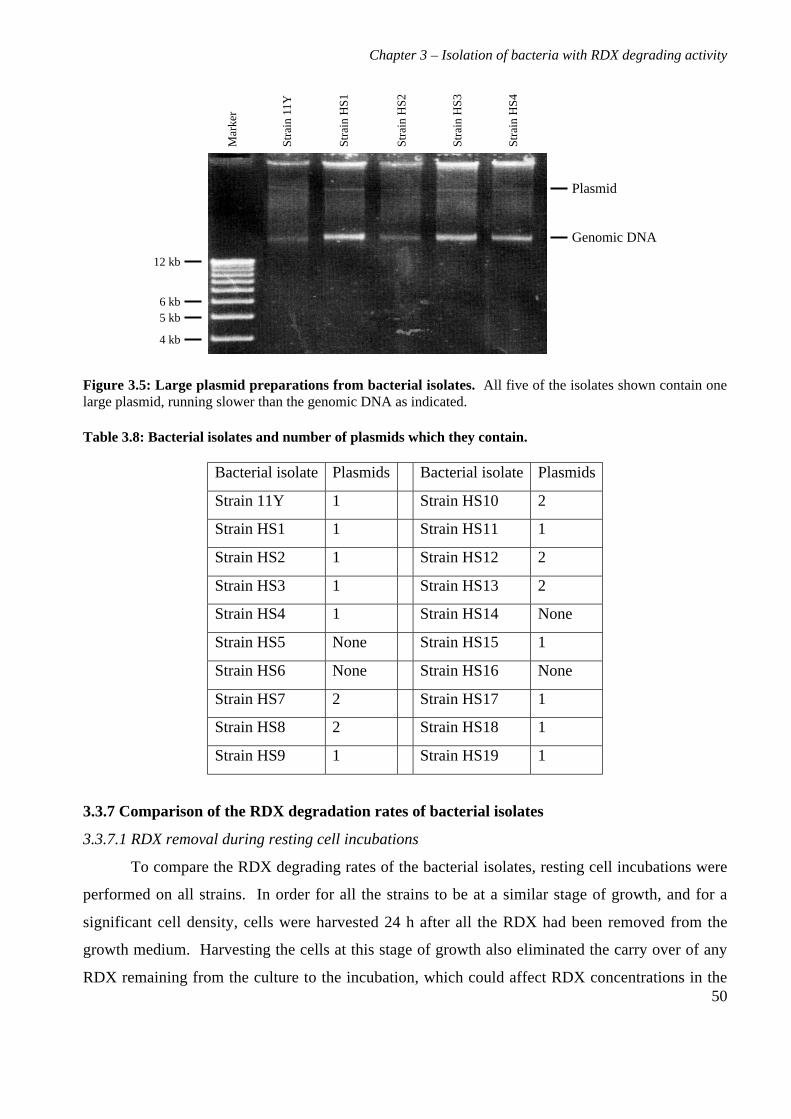
Chapter 3 – Isolation of bacteria with RDX degrading activity
50
12 kb
6 kb
4 kb
5 kb
Genomic DNA
Plasmid
Str
ain
11Y
Str
ain
HS
1
Str
ain
HS
2
Str
ain
HS
3
Str
ain
HS
4
Mar
ker
Figure 3.5: Large plasmid preparations from bacterial isolates. All five of the isolates shown contain onelarge plasmid, running slower than the genomic DNA as indicated.
Table 3.8: Bacterial isolates and number of plasmids which they contain.
Bacterial isolate Plasmids Bacterial isolate Plasmids
Strain 11Y 1 Strain HS10 2
Strain HS1 1 Strain HS11 1
Strain HS2 1 Strain HS12 2
Strain HS3 1 Strain HS13 2
Strain HS4 1 Strain HS14 None
Strain HS5 None Strain HS15 1
Strain HS6 None Strain HS16 None
Strain HS7 2 Strain HS17 1
Strain HS8 2 Strain HS18 1
Strain HS9 1 Strain HS19 1
3.3.7 Comparison of the RDX degradation rates of bacterial isolates
3.3.7.1 RDX removal during resting cell incubations
To compare the RDX degrading rates of the bacterial isolates, resting cell incubations were
performed on all strains. In order for all the strains to be at a similar stage of growth, and for a
significant cell density, cells were harvested 24 h after all the RDX had been removed from the
growth medium. Harvesting the cells at this stage of growth also eliminated the carry over of any
RDX remaining from the culture to the incubation, which could affect RDX concentrations in the
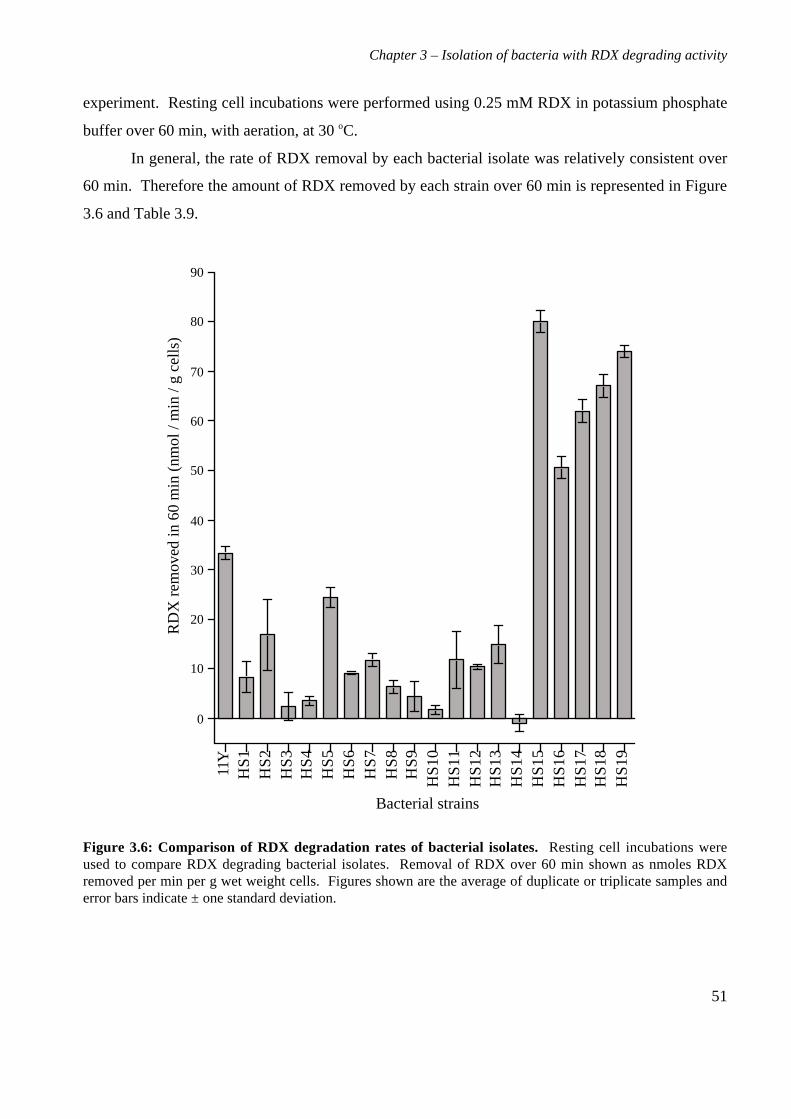
Chapter 3 – Isolation of bacteria with RDX degrading activity
51
experiment. Resting cell incubations were performed using 0.25 mM RDX in potassium phosphate
buffer over 60 min, with aeration, at 30 oC.
In general, the rate of RDX removal by each bacterial isolate was relatively consistent over
60 min. Therefore the amount of RDX removed by each strain over 60 min is represented in Figure
3.6 and Table 3.9.
0
10
20
30
40
50
60
70
80
90
11Y
HS
1H
S2
HS
3H
S4
HS
5H
S6
HS
7H
S8
HS
9H
S1
0H
S1
1H
S1
2H
S1
3H
S1
4H
S1
5H
S1
6H
S1
7H
S1
8H
S1
9
Bacterial strains
RD
X r
emov
ed in
60
min
(nm
ol /
min
/ g
cells
)
Figure 3.6: Comparison of RDX degradation rates of bacterial isolates. Resting cell incubations wereused to compare RDX degrading bacterial isolates. Removal of RDX over 60 min shown as nmoles RDXremoved per min per g wet weight cells. Figures shown are the average of duplicate or triplicate samples anderror bars indicate ± one standard deviation.
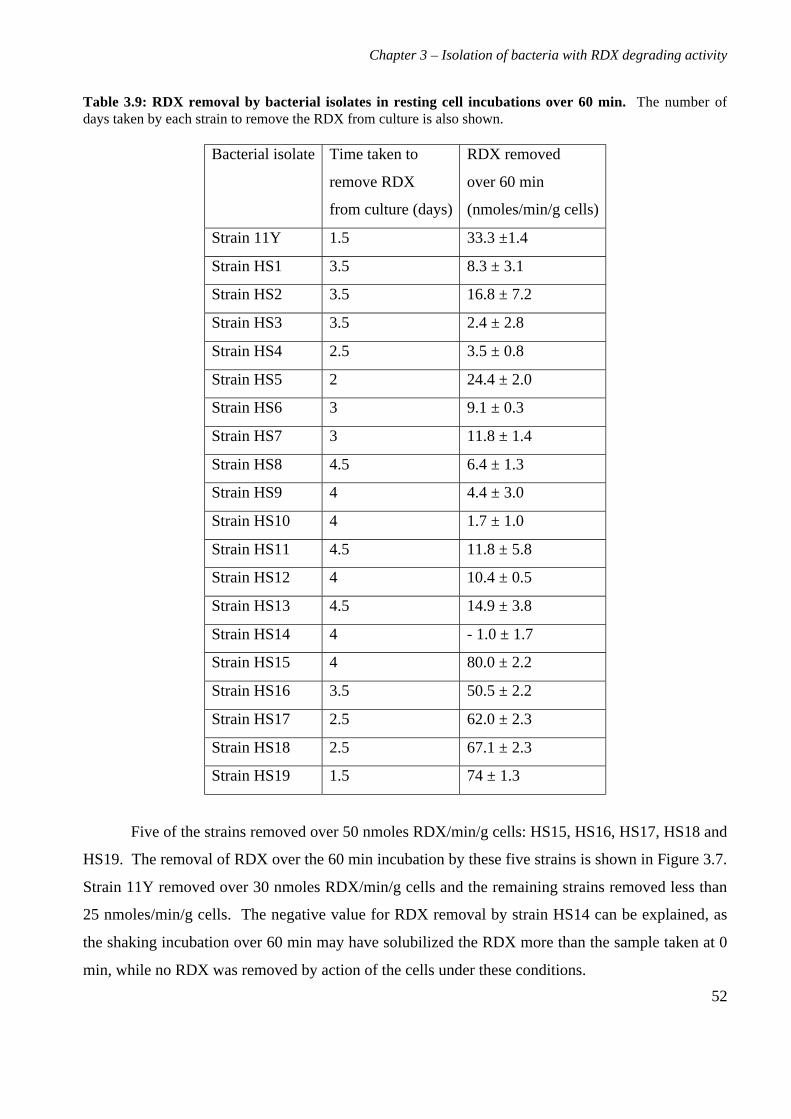
Chapter 3 – Isolation of bacteria with RDX degrading activity
52
Table 3.9: RDX removal by bacterial isolates in resting cell incubations over 60 min. The number ofdays taken by each strain to remove the RDX from culture is also shown.
Bacterial isolate Time taken to
remove RDX
from culture (days)
RDX removed
over 60 min
(nmoles/min/g cells)
Strain 11Y 1.5 33.3 ±1.4
Strain HS1 3.5 8.3 ± 3.1
Strain HS2 3.5 16.8 ± 7.2
Strain HS3 3.5 2.4 ± 2.8
Strain HS4 2.5 3.5 ± 0.8
Strain HS5 2 24.4 ± 2.0
Strain HS6 3 9.1 ± 0.3
Strain HS7 3 11.8 ± 1.4
Strain HS8 4.5 6.4 ± 1.3
Strain HS9 4 4.4 ± 3.0
Strain HS10 4 1.7 ± 1.0
Strain HS11 4.5 11.8 ± 5.8
Strain HS12 4 10.4 ± 0.5
Strain HS13 4.5 14.9 ± 3.8
Strain HS14 4 - 1.0 ± 1.7
Strain HS15 4 80.0 ± 2.2
Strain HS16 3.5 50.5 ± 2.2
Strain HS17 2.5 62.0 ± 2.3
Strain HS18 2.5 67.1 ± 2.3
Strain HS19 1.5 74 ± 1.3
Five of the strains removed over 50 nmoles RDX/min/g cells: HS15, HS16, HS17, HS18 and
HS19. The removal of RDX over the 60 min incubation by these five strains is shown in Figure 3.7.
Strain 11Y removed over 30 nmoles RDX/min/g cells and the remaining strains removed less than
25 nmoles/min/g cells. The negative value for RDX removal by strain HS14 can be explained, as
the shaking incubation over 60 min may have solubilized the RDX more than the sample taken at 0
min, while no RDX was removed by action of the cells under these conditions.
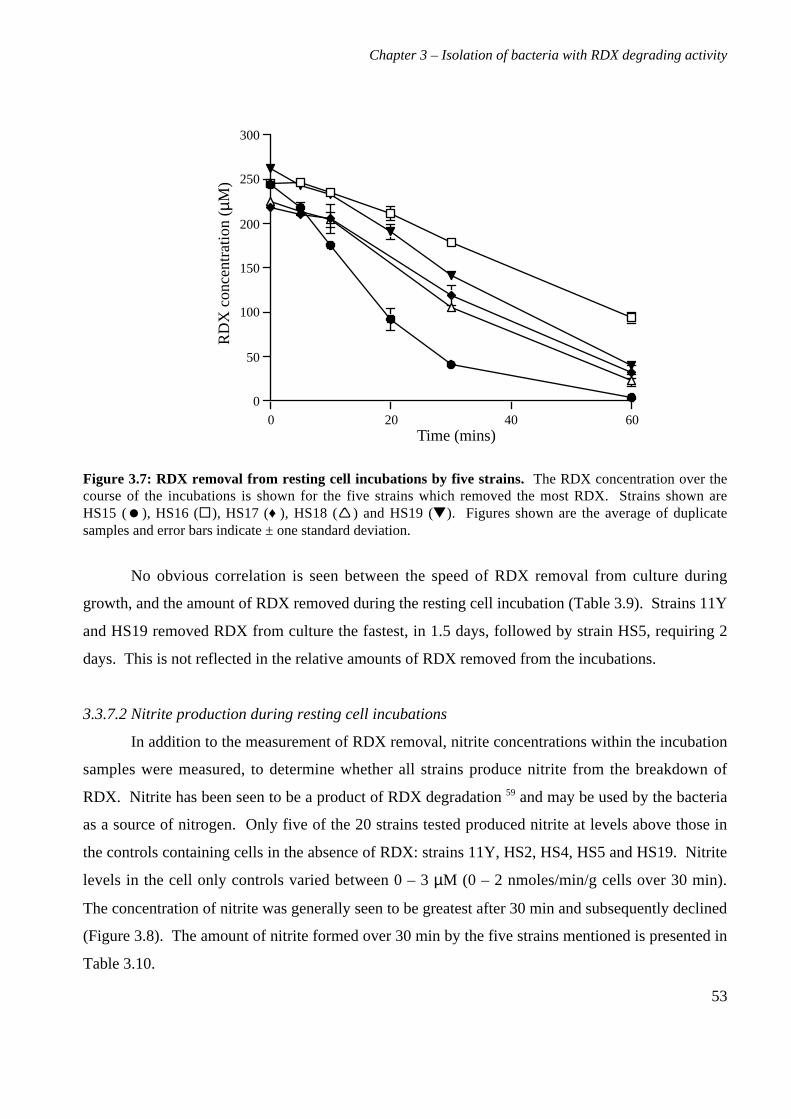
Chapter 3 – Isolation of bacteria with RDX degrading activity
53
0
50
100
150
200
250
300
0 20 40 60Time (mins)
RD
X c
once
ntra
tion
(µM)
Figure 3.7: RDX removal from resting cell incubations by five strains. The RDX concentration over thecourse of the incubations is shown for the five strains which removed the most RDX. Strains shown areHS15 (), HS16 (), HS17 (♦ ), HS18 () and HS19 (). Figures shown are the average of duplicatesamples and error bars indicate ± one standard deviation.
No obvious correlation is seen between the speed of RDX removal from culture during
growth, and the amount of RDX removed during the resting cell incubation (Table 3.9). Strains 11Y
and HS19 removed RDX from culture the fastest, in 1.5 days, followed by strain HS5, requiring 2
days. This is not reflected in the relative amounts of RDX removed from the incubations.
3.3.7.2 Nitrite production during resting cell incubations
In addition to the measurement of RDX removal, nitrite concentrations within the incubation
samples were measured, to determine whether all strains produce nitrite from the breakdown of
RDX. Nitrite has been seen to be a product of RDX degradation 59 and may be used by the bacteria
as a source of nitrogen. Only five of the 20 strains tested produced nitrite at levels above those in
the controls containing cells in the absence of RDX: strains 11Y, HS2, HS4, HS5 and HS19. Nitrite
levels in the cell only controls varied between 0 – 3 µM (0 – 2 nmoles/min/g cells over 30 min).
The concentration of nitrite was generally seen to be greatest after 30 min and subsequently declined
(Figure 3.8). The amount of nitrite formed over 30 min by the five strains mentioned is presented in
Table 3.10.
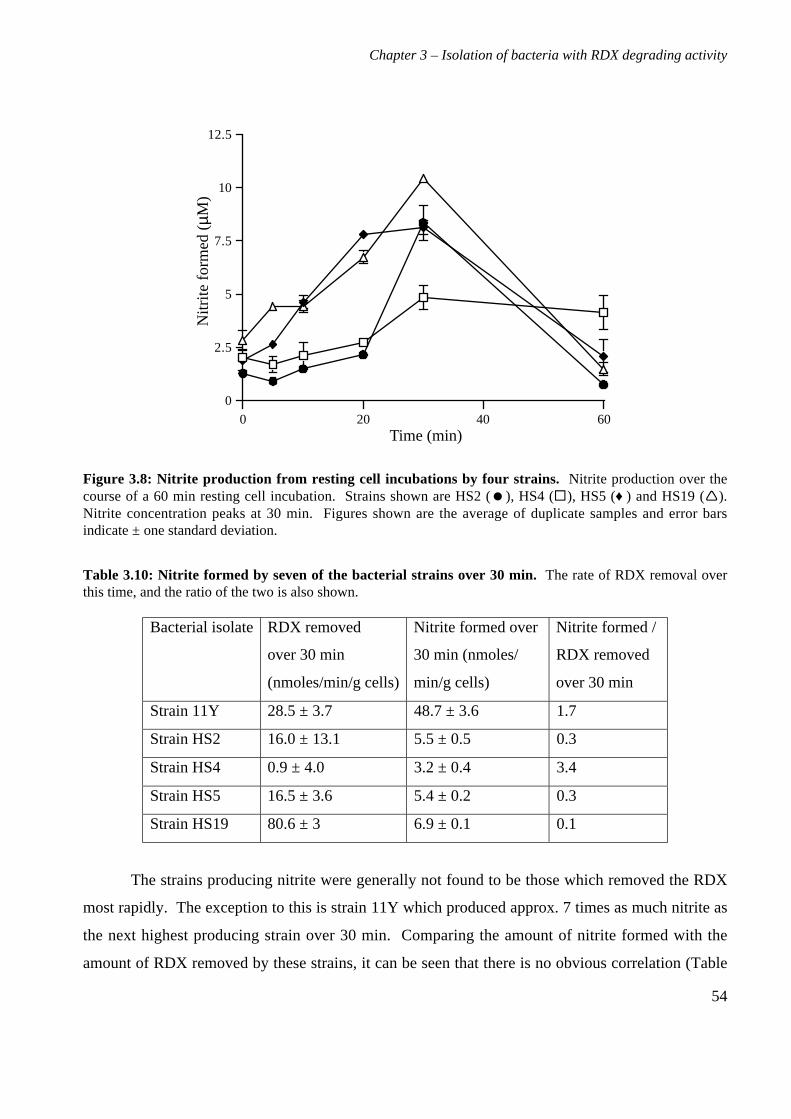
Chapter 3 – Isolation of bacteria with RDX degrading activity
54
0
2.5
5
7.5
10
12.5
0 20 40 60Time (min)
Nitr
ite fo
rmed
(µM
)
Figure 3.8: Nitrite production from resting cell incubations by four strains. Nitrite production over thecourse of a 60 min resting cell incubation. Strains shown are HS2 (), HS4 (), HS5 (♦ ) and HS19 ().Nitrite concentration peaks at 30 min. Figures shown are the average of duplicate samples and error barsindicate ± one standard deviation.
Table 3.10: Nitrite formed by seven of the bacterial strains over 30 min. The rate of RDX removal overthis time, and the ratio of the two is also shown.
Bacterial isolate RDX removed
over 30 min
(nmoles/min/g cells)
Nitrite formed over
30 min (nmoles/
min/g cells)
Nitrite formed /
RDX removed
over 30 min
Strain 11Y 28.5 ± 3.7 48.7 ± 3.6 1.7
Strain HS2 16.0 ± 13.1 5.5 ± 0.5 0.3
Strain HS4 0.9 ± 4.0 3.2 ± 0.4 3.4
Strain HS5 16.5 ± 3.6 5.4 ± 0.2 0.3
Strain HS19 80.6 ± 3 6.9 ± 0.1 0.1
The strains producing nitrite were generally not found to be those which removed the RDX
most rapidly. The exception to this is strain 11Y which produced approx. 7 times as much nitrite as
the next highest producing strain over 30 min. Comparing the amount of nitrite formed with the
amount of RDX removed by these strains, it can be seen that there is no obvious correlation (Table
Chapter 3 – Isolation of bacteria with RDX degrading activity
55
3.10). This is also evident from strains HS15-HS18, which degraded up to 80 nmoles RDX/min/g
cells without the production of any nitrite above control levels. These results indicate that nitrite
may not be produced by all bacteria from RDX breakdown and if it is, the rates at which it is
removed vary greatly.
Chapter 3 – Isolation of bacteria with RDX degrading activity
56
3.4 Discussion
Nineteen bacterial strains capable of utilizing RDX as a sole source of nitrogen have been
isolated from explosive contaminated soil. Previous literature has indicated that the isolation of
aerobic RDX degrading bacteria is not easy: in 1981 it was stated that RDX degradation could not
occur aerobically 199, and each study to date has reported the isolation of only one aerobic strain
from enrichments. Very few pure aerobic bacterial strains have been described as being able to
degrade RDX (§1.7.2.3). The large number of bacteria isolated in this study shows that there are
many environmental bacteria which can degrade RDX and utilize it as a sole source of nitrogen, and
that their isolation by selective enrichment is possible.
The inability of any of the strains to use RDX as a carbon source is not surprising, as it can
be considered to be a one-carbon substrate, in that no breakdown products of RDX are likely to
contain carbon-carbon bonds. Only methylotrophic bacteria are able to utilize these one-carbon
substrates for growth 188, and methylotrophy is not a universal property of bacteria. Bacterial
utilization of RDX as a carbon source has never been documented, and this activity would not be
expected unless an RDX degrading methylotroph were isolated.
Xenobiotic degrading strains isolated from contaminated soil are often found to be species of
Pseudomonas or Rhodococcus, and the selective enrichment conditions used should have been
favourable for both. Pseudomonads, rhodococci and closely related species have been found to be
capable of the degradation of the herbicide atrazine, phenols, halogenated phenols, chlorinated
herbicides and substituted benzenes 16, 91, 124, 325, 339.
Initial analysis of the strains, using phenotypic characteristics, showed that all strains were
beige and had smooth colonies, and that several had a mucoid phenotype. It is not uncommon for
colony morphology to change depending on the medium provided 38 which explains the observation
that several of the strains became more mucoid on plating onto minimal medium plates containing
RDX. Gram reaction determination showed that all isolates are gram positive. Identification was
performed using 16S rDNA comparisons; this showed that all strains of the bacteria are strains of
rhodococci, which is consistent with the above characteristics 36.
The genus Rhodococcus is found within the order Actinomycetales, and comprises twelve
described species 111. Actinomycetes in general are well represented in the soil microbial population
and are commonly found in soil at counts of 106 per gram, but are not limited to a soil habitat, also
being isolated from activated sludge, freshwater and marine habitats 110. Rhodococci are defined by
several characteristics: gram positive, aerobic, non-motile, high G+C content and the ability to
Chapter 3 – Isolation of bacteria with RDX degrading activity
57
metabolize many substrates; however they are generally defined by their cell wall and envelope
composition 36. More recently, 16S rDNA analysis has become the method of choice for the
determination of phylogenetic relatedness, as transfer of 16S genes between species is very rare, and
the variation between 16S genes of different species is representative of the variation between the
genomes 111.
Rhodococci have been reported to be able to degrade many xenobiotics including phenols,
halogenated phenols, aromatic acids, halogenated alkanes, substituted benzenes, anilines and
quinolines 91. In addition, there are reports of the biotransformations of hydrocarbons, aromatic
compounds, nitriles and epoxides 325. Various rhodococcal species can transform or degrade
pentachlorophenol 311, the herbicides atrazine and s-ethyl dipropylthiocarbamate 1 6, and
polychlorinated biphenyls 197. Strains of R. rhodochrous have xenobiotic degrading abilities towards
styrene and toluene 324, 2-ethoxyphenol and 4-methoxybenzoate 163, and 1-chloroalkane 179. The
biotransformations of nitriles by rhodococci is of particular interest, as rhodococcal nitrile
hydrolases can catalyse the production of acrylamide from acrylonitrile 46, which is being exploited
industrially through the use of R. rhodochrous J1 in acrylamide manufacture 172. Rhodococci may
possess a lignin degrading system, similar to that reported in Phanaerochaete chrysosporium
(§1.7.2.2), which may be responsible for their ability to degrade such a wide range of compounds 64,
110.
The identification of all the isolates as rhodococci, in addition to the reported rhodococcal
RDX degrader, strain DN22 59, indicates that the majority of culturable environmental bacteria
possessing the ability to degrade RDX are rhodococci. This could be due to specific features of the
strains that enable, for example, uptake of the explosive, or could be due to species specific
horizontal gene transfer within the environment. The genomes of rhodococci have been reported to
be very flexible, readily undergoing recombination and conjugation, with most strains carrying one
or more plasmids, which may increase the likelihood of gene transfer occurring 189.
The isolation of all gram positive bacteria presents some difficulties with respect to
molecular genetical analysis, as their genetics have not been well studied in general and there are
few tools available for use with them. Gram positive bacteria also tend to be less easy to manipulate
than gram negative bacteria in terms of transformation and protein purification.
The antibiotic resistance profiles showed that all isolates are unique, as none of the strains
within the same 16S rDNA classification groups have identical profiles. This information may also
be useful in cloning work to aid the choice of vectors for use in these strains in possible knockout
Chapter 3 – Isolation of bacteria with RDX degrading activity
58
and complementation tests. In particular, as most strains were sensitive to the concentrations of
chloramphenicol, gentamycin, rifampicin, tetracycline and vancomycin tested, vectors conferring
resistance to these antibiotics will be of use. Few of the RDX degrading bacterial isolates were able
to tolerate TNT up to its solubility limit of 0.65 mM. When growth did occur at this concentration it
was only when the cells were present at a high density. This may be due to the possible lack of
exposure of the isolates to TNT in the environment.
Rhodococcal xenobiotic degradation genes are sometimes found on large plasmids 16, 72, 76, 176,
179. A plasmid of undetermined size is reported to carry the RDX degrading genes of Rhodococcus
sp. strain DN22 60. Of the reported rhodococcal plasmids, many are in the size range 80 – 200 kb 69,
72, 76, 179, and some of these are linear. A comprehensive list demonstrating the vast range in plasmid
size, can be found in Larkin et al. 189. One strategy for identifying the genes which allow the
bacterial isolates to carry out RDX degradation would be to cure the bacteria of the plasmids and, if
the bacteria lose their ability to utilize RDX, to isolate the genes responsible from the plasmid,
which narrows the search.
Although many of the bacterial isolates were found to carry plasmids, it was not possible to
isolate plasmids from all the strains, indicating that some of the strains may carry RDX degrading
genes within their genomic DNA. The size of the extracted plasmids was not determined, but their
extraction was not achieved using the boiling lysis method, which may have been due to their large
size. The estimation of plasmid size by gel electrophoresis would require the extraction and
electrophoresis of several large plasmids of known size with which to create a standard curve,
although using this method the size determinations are only approximate 128. The strains may have
also contained linear plasmids, which are sometimes found in rhodococci 189 and can carry
degradation genes 102. These would probably have not been isolated by the method used, as it is
thought that the extracted plasmids are in the covalently closed circular form, which would not be
produced by linear plasmids. As linear plasmids were not analysed, and some of the strains may not
have been carrying plasmids, it was decided not to attempt either a plasmid curing or a plasmid gene
library approach, although care should be taken in future to isolate total DNA and avoid the loss of
large plasmids in any DNA preparations.
Comparisons of the rates at which all bacterial isolates removed 250 µM RDX from resting
cell incubations showed a wide range of values, with six of the strains operating at significantly
higher rates than the rest. Several showed very little or no RDX removal, which may have been to
do with harvesting at less than optimal growth stages. The stage of growth may have significantly
Chapter 3 – Isolation of bacteria with RDX degrading activity
59
affected the rate at which the strain was able to break down RDX, with particular relevance to strain
HS14. However, it was not possible to perform resting cell incubations for each strain throughout
the stages of growth, and for that reason the experiment was standardized. There are few reports of
resting cell incubations of pure aerobic strains with RDX with which to compare these strains.
Stenotrophomonas maltophilia strain PB1 would only degrade RDX in the presence of sugars, and
removed up to 40 µg/ml (180 µM) over 15 h 27. Rhodococcus sp. strain DN22 removed 150 µM
RDX over 3.5 h, 100 µM of that within the first hour 59. The fastest of the isolates from this study
compare favourably with these values, showing removal of up to 250 µM within 1 h.
There was no correlation between the amounts of nitrite produced and RDX removed, which
could be due to differing activities of nitrite reductase, or alternate mechanisms of RDX
degradation.
It is worth noting that the more mucoid strains failed to form pellets as tight as the less
mucoid strains during harvesting and the subsequent rinses. This may have resulted in carry over of
buffer during wet weight determination meaning that equivalently less cell paste was added to each
sample and a lower rate of RDX removal was observed. However, given the experimental design,
this was unavoidable.
It was necessary to select one bacterial strain for further study, as not all the isolated bacteria
could be characterized in detail given the time limitations of the project. The characteristics of the
chosen isolate should allow further studies to be relatively fast and easy, and allow cloning within
that bacterium if a mutation and complementation approach were to be taken. A desirable strain
would therefore degrade RDX quickly, possess suitable antibiotic sensitivity profiles for plasmid
transformation and be a non-mucoid strain, as these tend to be easier to transform (Prof. E. Dabbs,
personal communication).
For these reasons, Rhodococcus rhodochrous strain 11Y was chosen for further study. This
is not a mucoid strain, has a good rate of RDX removal from both growth medium (1.5 days) and
resting cell incubations, degrading a significant amount of RDX over a 60 min incubation (sixth best
strain). In addition, strain 11Y was sensitive to the lowest concentrations tested of potentially useful
antibiotics. A preliminary survey of E. coli - Rhodococcus shuttle vectors shows that many rely on
conferring resistance to ampicillin (equivalent to carbenicillin), chloramphenicol or kanamycin 70, 73,
77, 79, 85, 135, 146, 270, 317, 349. Strain 11Y was sensitive to all these at the following concentrations:
Chapter 3 – Isolation of bacteria with RDX degrading activity
60
carbenicillin (25 µg/ml), chloramphenicol (10 µg/ml) and kanamycin (15 µg/ml). These properties
favour strain 11Y as a potential plasmid host, if this should be required.
If metabolite identification from the whole cell breakdown of RDX is to be attempted, strain
11Y may also be a good choice as it produced large amounts of nitrite in resting cell incubation.
This, and other metabolites, could be quantified and used to compare to proposed routes of RDX
degradation. Strain 11Y was therefore chosen for further investigation.
The results demonstrate the relative ease of isolation of RDX degrading bacteria, and the
prominence of rhodococci among these. Future comparison of these strains may provide
information on whether the genetic basis of the ability to degrade RDX is common to all the
isolates, and how it may have been transferred between strains. However, this is beyond the scope
of this project. Further characterization of Rhodococcus rhodochrous strain 11Y is required.
Chapter 4 – Characterization of Rhodococcus rhodochrous strain 11Y
61
Chapter 4. Characterization of Rhodococcus rhodochrous strain 11Y
on RDX
4.1 Background
Twenty RDX degrading bacteria were compared in the last chapter and of these one strain
has been chosen for further characterization: Rhodococcus rhodochrous strain 11Y. The ability of
strain 11Y to degrade RDX as a sole nitrogen source shall be investigated, and this may indicate its
potential for use in bioremediation. The speed of RDX degradation can be assessed by measuring
growth on RDX, and the amount of nitrogen used for growth per molecule of RDX provided can be
calculated by comparing growth of strain 11Y on RDX with growth on an alternative nitrogen
source. Preliminary characterization of the regulation of the RDX degrading ability can be
performed by determining whether the activity is induced in the presence of RDX.
It is also useful to investigate the ability of strain 11Y to degrade other nitramine explosives
with similar structures to RDX. This may prove useful for future remediation purposes, and might
give information on the mechanism of degradation. Few studies have addressed the biodegradation
of HMX, and there is no literature regarding microbial action on CL20 (§1.6.3).
Studying the mechanism of RDX biodegradation can provide information on the fate of the
RDX: whether it is being mineralized, or degraded to other compounds which may themselves be
recalcitrant or toxic. It is therefore necessary to analyse the breakdown products of RDX by strain
11Y. These can then be used to compare to products seen in other studies, and to determine whether
any of the currently proposed pathways for RDX biodegradation are applicable to strain 11Y.
Chapter 4 – Characterization of Rhodococcus rhodochrous strain 11Y
62
4.2 Materials and methods
4.2.1 Growth of strain 11Y on RDX as a nitrogen source
Rhodococcus rhodochrous strain 11Y was grown in 1 litre minimal medium with three
carbon sources and 0.25 mM RDX as the sole source of nitrogen at 30 oC, inoculated with a 24 h
seed culture which had been grown in the same medium, under the same conditions. Samples of 2
ml were removed from the cultures at regular intervals throughout the growth cycle. Bacterial
growth was measured by determination of culture optical density at 600 nm, with appropriate
dilution of the culture when necessary. Degradation of RDX was assayed by monitoring the
decrease in concentration by HPLC. Bacterial cells were removed by centrifugation and the
supernatant (100 µl) analysed by HPLC. Nitrite and ammonium concentrations were assayed using
ion chromatography. Controls consisted of a sterile culture, and a culture of the non RDX degrader
R. rhodochrous strain CW25.
4.2.2 Determination of nitrogens from RDX used by strain 11Y
Strain 11Y was grown on minimal medium containing three carbon sources and varying
concentrations of NH4Cl and RDX. Concentrations of NH4Cl used were 0, 0.25, 0.5, 0.75, 1, 1.25
and 1.5 mM. Concentrations of RDX used were 0, 0.042, 0.083, 0.125, 0.167, 0.208 and 0.25 mM
which correspond to 0, 0.25, 0.5, 0.75, 1, 1.25 and 1.5 mM nitrogen supplied respectively. Growth
was measured regularly over three weeks using OD600, and the maximum OD reached by each
culture recorded and plotted.
4.2.3 Inducibility of RDX degrading ability
Strain 11Y was grown from a 4 day starter culture in minimal medium containing three
carbon sources and either 3 mM NH4Cl or 1 mM RDX as a sole source of nitrogen at 30 oC for 2
days. HPLC was used to confirm that all RDX had been removed from the RDX grown culture.
Cells were harvested and rinsed twice in 40 mM phosphate buffer pH 7.2. Cells were resuspended
in phosphate buffer to 0.5 g wet weight/ml, and resting cell incubations were performed, with the
samples assayed for RDX and nitrite concentration by HPLC and Griess assay (§3.2.9).
4.2.4 Strain 11Y tolerance of HMX and CL20
Strain 11Y was streaked onto LA plates containing CL20 or HMX at concentrations of 0,
0.5, 1, 5 and 10 mM. Growth was assessed after 5 days and 8 days.
Chapter 4 – Characterization of Rhodococcus rhodochrous strain 11Y
63
4.2.5 Determination of growth on HMX and CL20 as nitrogen sources
Strain 11Y was used to inoculate minimum medium containing varying concentrations of
NH4Cl, HMX, CL20 and no nitrogen source. HMX and CL20 were diluted from stocks routinely
made in DMF. Concentrations used were: NH4Cl – 0.5, 1, 1.5 mM, CL20 – 0.5, 1, 5 mM, HMX –
1, 5 mM. OD600 values were measured regularly over a period of 3 weeks, and the maximum values
recorded. A control using DMF as a sole nitrogen source was performed.
4.2.6 Resting cell incubations of strain 11Y
Cells were grown to late-log phase (48 h), harvested and rinsed in 40 mM potassium
phosphate buffer, pH 7.2. Cells were used at a final concentration of 0.05 g wet weight/ml and
incubated in 25 ml 40 mM potassium phosphate buffer pH 7.2 with 0.25 mM RDX at 30 oC with
inversion every 5 min. Samples were taken at intervals, centrifuged immediately at 4 oC for 1 min
and the supernatant was assayed immediately on the anion Dionex column for nitrate, nitrite and
formate. Further samples taken at the same time had an equal volume of 10 % v/v glacial acetic
acid added followed by a 10 min incubation on ice to precipitate any protein present and the
resulting supernatant was analysed for RDX by HPLC, for ammonium by cation Dionex, and for
formaldehyde (§2.4.6). Controls contained either cells incubated in the absence of RDX, or RDX
incubated in the absence of cells.
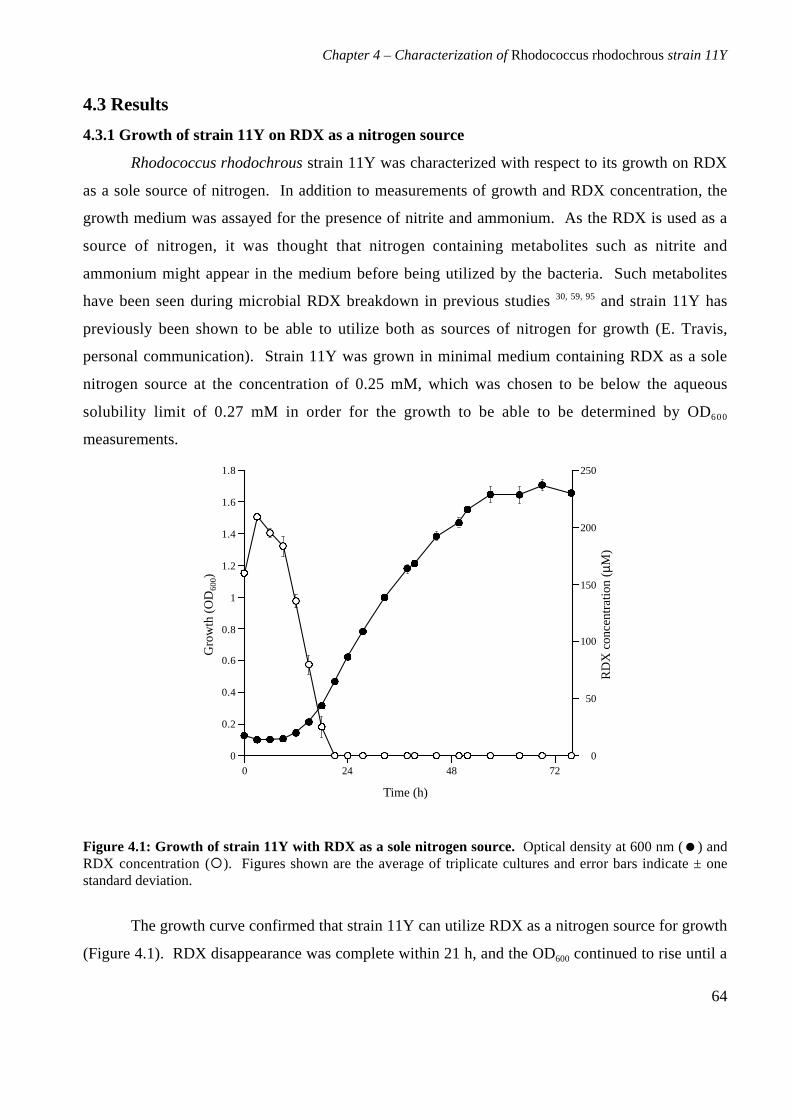
Chapter 4 – Characterization of Rhodococcus rhodochrous strain 11Y
64
4.3 Results
4.3.1 Growth of strain 11Y on RDX as a nitrogen source
Rhodococcus rhodochrous strain 11Y was characterized with respect to its growth on RDX
as a sole source of nitrogen. In addition to measurements of growth and RDX concentration, the
growth medium was assayed for the presence of nitrite and ammonium. As the RDX is used as a
source of nitrogen, it was thought that nitrogen containing metabolites such as nitrite and
ammonium might appear in the medium before being utilized by the bacteria. Such metabolites
have been seen during microbial RDX breakdown in previous studies 30, 59, 95 and strain 11Y has
previously been shown to be able to utilize both as sources of nitrogen for growth (E. Travis,
personal communication). Strain 11Y was grown in minimal medium containing RDX as a sole
nitrogen source at the concentration of 0.25 mM, which was chosen to be below the aqueous
solubility limit of 0.27 mM in order for the growth to be able to be determined by OD600
measurements.
0
50
100
150
200
250
0
0.2
0.4
0.6
0.8
1
1.2
1.4
1.6
1.8
0 24 48 72
Time (h)
Gro
wth
(O
D 600
)
RD
X c
once
ntra
tion
(µM)
Figure 4.1: Growth of strain 11Y with RDX as a sole nitrogen source. Optical density at 600 nm () andRDX concentration (). Figures shown are the average of triplicate cultures and error bars indicate ± onestandard deviation.
The growth curve confirmed that strain 11Y can utilize RDX as a nitrogen source for growth
(Figure 4.1). RDX disappearance was complete within 21 h, and the OD600 continued to rise until a
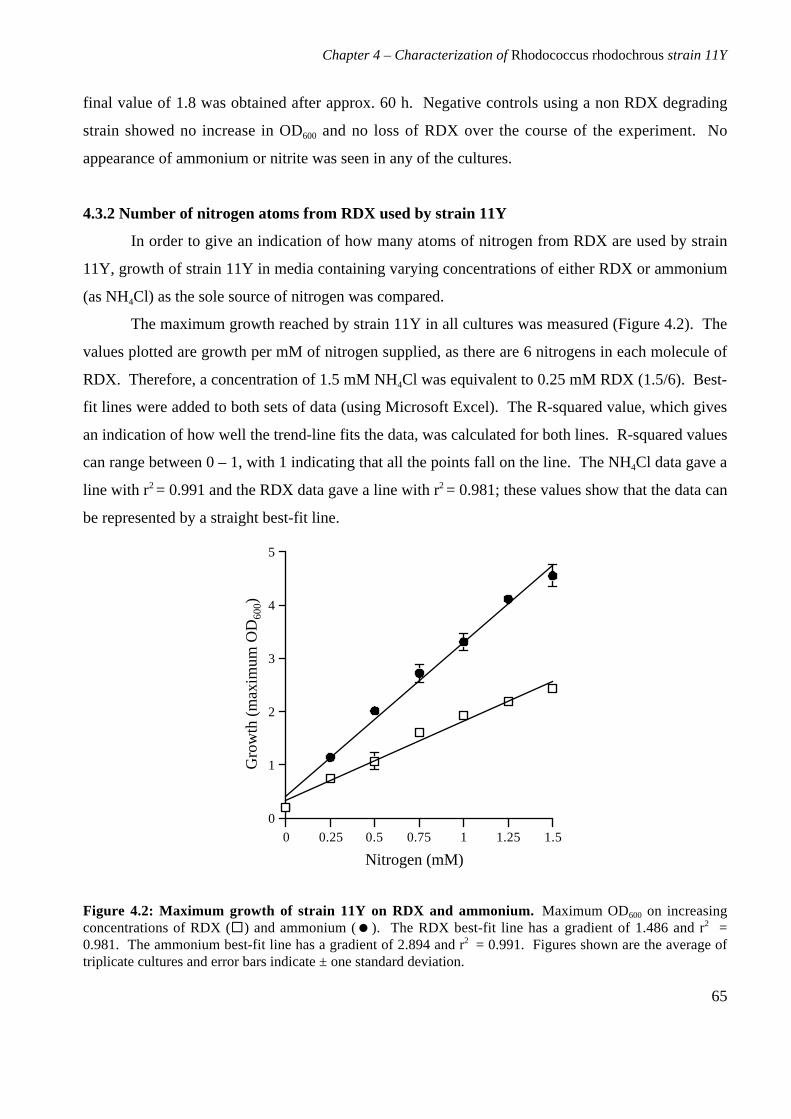
Chapter 4 – Characterization of Rhodococcus rhodochrous strain 11Y
65
final value of 1.8 was obtained after approx. 60 h. Negative controls using a non RDX degrading
strain showed no increase in OD600 and no loss of RDX over the course of the experiment. No
appearance of ammonium or nitrite was seen in any of the cultures.
4.3.2 Number of nitrogen atoms from RDX used by strain 11Y
In order to give an indication of how many atoms of nitrogen from RDX are used by strain
11Y, growth of strain 11Y in media containing varying concentrations of either RDX or ammonium
(as NH4Cl) as the sole source of nitrogen was compared.
The maximum growth reached by strain 11Y in all cultures was measured (Figure 4.2). The
values plotted are growth per mM of nitrogen supplied, as there are 6 nitrogens in each molecule of
RDX. Therefore, a concentration of 1.5 mM NH4Cl was equivalent to 0.25 mM RDX (1.5/6). Best-
fit lines were added to both sets of data (using Microsoft Excel). The R-squared value, which gives
an indication of how well the trend-line fits the data, was calculated for both lines. R-squared values
can range between 0 – 1, with 1 indicating that all the points fall on the line. The NH4Cl data gave a
line with r2 = 0.991 and the RDX data gave a line with r2 = 0.981; these values show that the data can
be represented by a straight best-fit line.
Nitrogen (mM)
Gro
wth
(m
axim
um O
D 600)
0
1
2
3
4
5
0 0.25 0.5 0.75 1 1.25 1.5
Figure 4.2: Maximum growth of strain 11Y on RDX and ammonium. Maximum OD600 on increasingconcentrations of RDX () and ammonium (). The RDX best-fit line has a gradient of 1.486 and r2 =0.981. The ammonium best-fit line has a gradient of 2.894 and r2 = 0.991. Figures shown are the average oftriplicate cultures and error bars indicate ± one standard deviation.
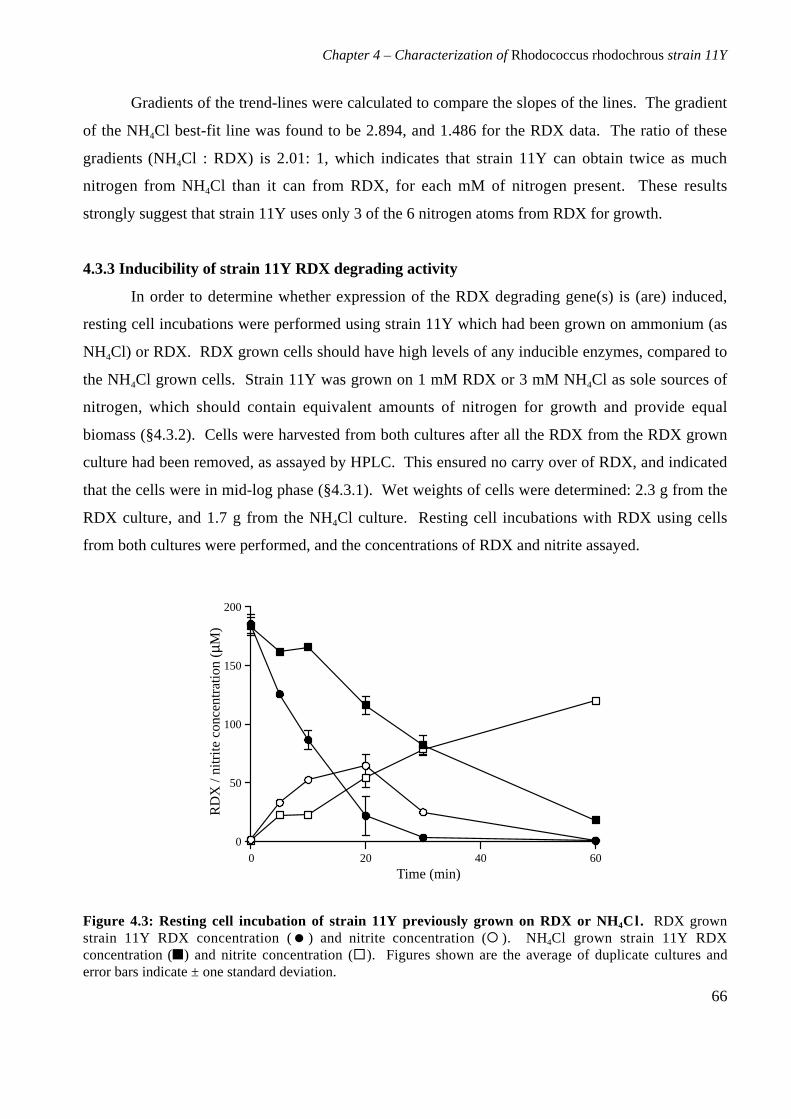
Chapter 4 – Characterization of Rhodococcus rhodochrous strain 11Y
66
Gradients of the trend-lines were calculated to compare the slopes of the lines. The gradient
of the NH4Cl best-fit line was found to be 2.894, and 1.486 for the RDX data. The ratio of these
gradients (NH4Cl : RDX) is 2.01: 1, which indicates that strain 11Y can obtain twice as much
nitrogen from NH4Cl than it can from RDX, for each mM of nitrogen present. These results
strongly suggest that strain 11Y uses only 3 of the 6 nitrogen atoms from RDX for growth.
4.3.3 Inducibility of strain 11Y RDX degrading activity
In order to determine whether expression of the RDX degrading gene(s) is (are) induced,
resting cell incubations were performed using strain 11Y which had been grown on ammonium (as
NH4Cl) or RDX. RDX grown cells should have high levels of any inducible enzymes, compared to
the NH4Cl grown cells. Strain 11Y was grown on 1 mM RDX or 3 mM NH4Cl as sole sources of
nitrogen, which should contain equivalent amounts of nitrogen for growth and provide equal
biomass (§4.3.2). Cells were harvested from both cultures after all the RDX from the RDX grown
culture had been removed, as assayed by HPLC. This ensured no carry over of RDX, and indicated
that the cells were in mid-log phase (§4.3.1). Wet weights of cells were determined: 2.3 g from the
RDX culture, and 1.7 g from the NH4Cl culture. Resting cell incubations with RDX using cells
from both cultures were performed, and the concentrations of RDX and nitrite assayed.
0
50
100
150
200
0 20 40 60
Time (min)
RD
X /
nitr
ite c
once
ntra
tion
(µM)
Figure 4.3: Resting cell incubation of strain 11Y previously grown on RDX or NH4Cl. RDX grownstrain 11Y RDX concentration ( ) and nitrite concentration ( ). NH4Cl grown strain 11Y RDXconcentration () and nitrite concentration (). Figures shown are the average of duplicate cultures anderror bars indicate ± one standard deviation.
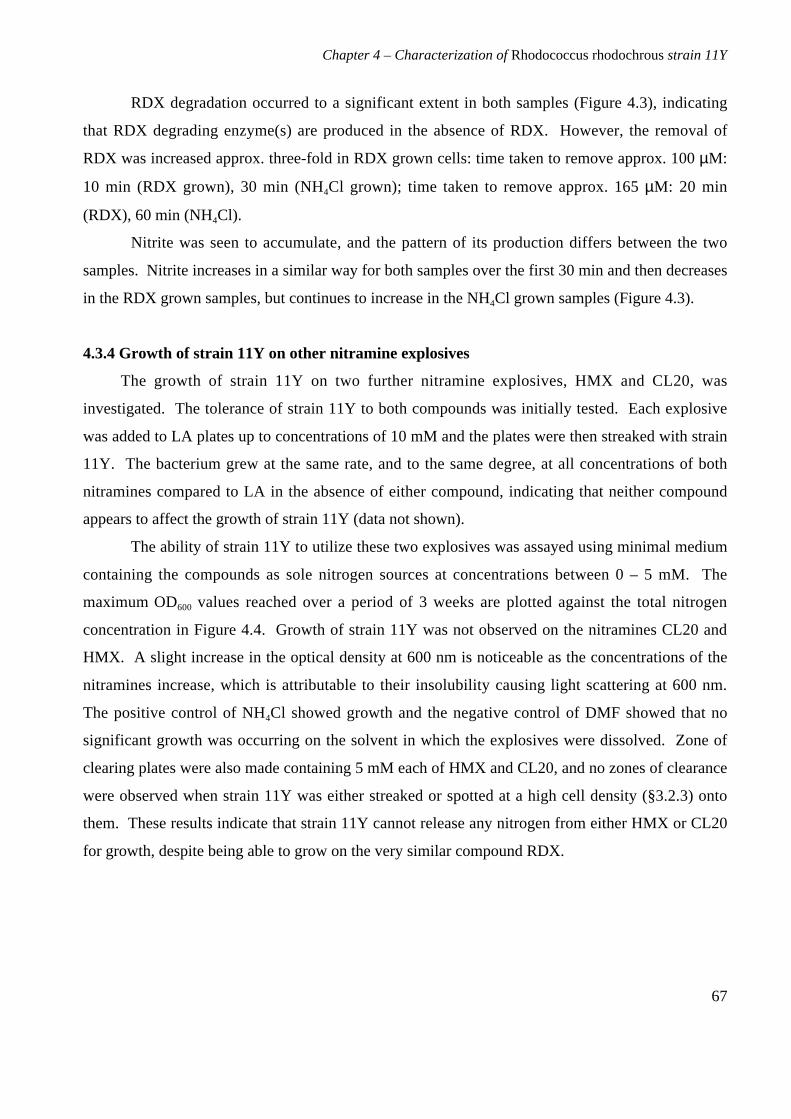
Chapter 4 – Characterization of Rhodococcus rhodochrous strain 11Y
67
RDX degradation occurred to a significant extent in both samples (Figure 4.3), indicating
that RDX degrading enzyme(s) are produced in the absence of RDX. However, the removal of
RDX was increased approx. three-fold in RDX grown cells: time taken to remove approx. 100 µM:
10 min (RDX grown), 30 min (NH4Cl grown); time taken to remove approx. 165 µM: 20 min
(RDX), 60 min (NH4Cl).
Nitrite was seen to accumulate, and the pattern of its production differs between the two
samples. Nitrite increases in a similar way for both samples over the first 30 min and then decreases
in the RDX grown samples, but continues to increase in the NH4Cl grown samples (Figure 4.3).
4.3.4 Growth of strain 11Y on other nitramine explosives
The growth of strain 11Y on two further nitramine explosives, HMX and CL20, was
investigated. The tolerance of strain 11Y to both compounds was initially tested. Each explosive
was added to LA plates up to concentrations of 10 mM and the plates were then streaked with strain
11Y. The bacterium grew at the same rate, and to the same degree, at all concentrations of both
nitramines compared to LA in the absence of either compound, indicating that neither compound
appears to affect the growth of strain 11Y (data not shown).
The ability of strain 11Y to utilize these two explosives was assayed using minimal medium
containing the compounds as sole nitrogen sources at concentrations between 0 – 5 mM. The
maximum OD600 values reached over a period of 3 weeks are plotted against the total nitrogen
concentration in Figure 4.4. Growth of strain 11Y was not observed on the nitramines CL20 and
HMX. A slight increase in the optical density at 600 nm is noticeable as the concentrations of the
nitramines increase, which is attributable to their insolubility causing light scattering at 600 nm.
The positive control of NH4Cl showed growth and the negative control of DMF showed that no
significant growth was occurring on the solvent in which the explosives were dissolved. Zone of
clearing plates were also made containing 5 mM each of HMX and CL20, and no zones of clearance
were observed when strain 11Y was either streaked or spotted at a high cell density (§3.2.3) onto
them. These results indicate that strain 11Y cannot release any nitrogen from either HMX or CL20
for growth, despite being able to grow on the very similar compound RDX.
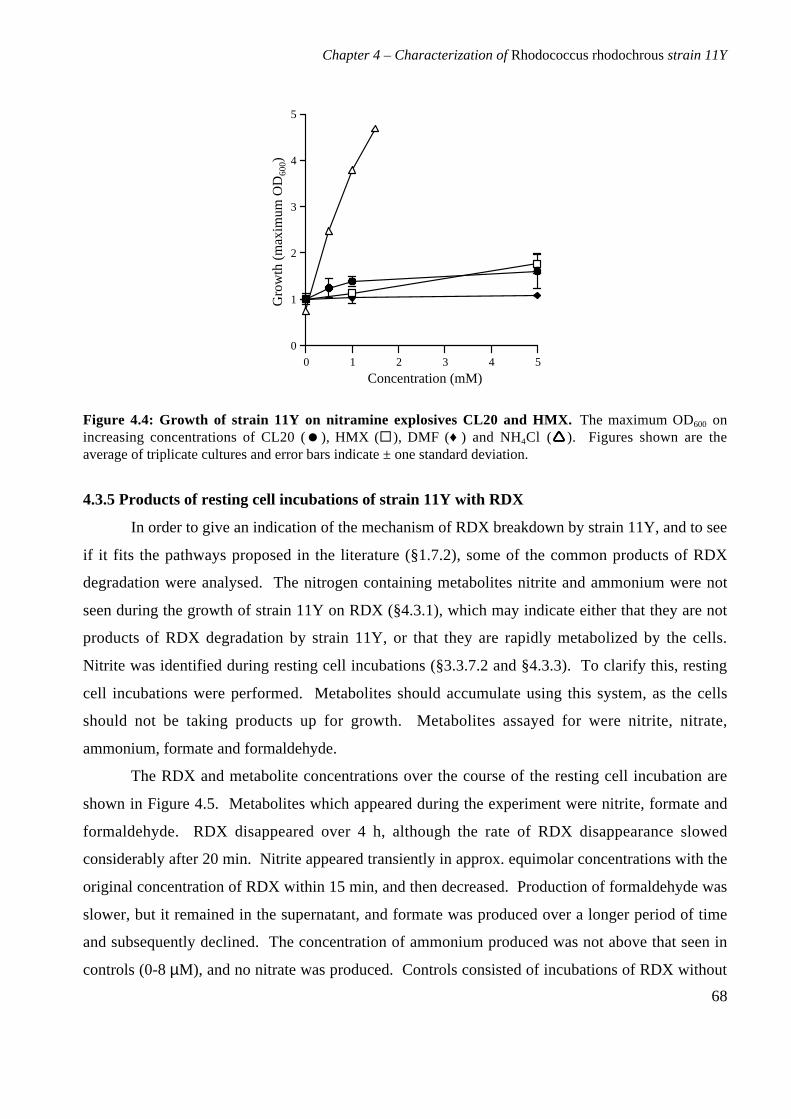
Chapter 4 – Characterization of Rhodococcus rhodochrous strain 11Y
68
0
1
2
3
4
5
0 1 2 3 4 5
Concentration (mM)
Gro
wth
(m
axim
um O
D 600)
Figure 4.4: Growth of strain 11Y on nitramine explosives CL20 and HMX. The maximum OD600 onincreasing concentrations of CL20 (), HMX (), DMF (♦ ) and NH4Cl (). Figures shown are theaverage of triplicate cultures and error bars indicate ± one standard deviation.
4.3.5 Products of resting cell incubations of strain 11Y with RDX
In order to give an indication of the mechanism of RDX breakdown by strain 11Y, and to see
if it fits the pathways proposed in the literature (§1.7.2), some of the common products of RDX
degradation were analysed. The nitrogen containing metabolites nitrite and ammonium were not
seen during the growth of strain 11Y on RDX (§4.3.1), which may indicate either that they are not
products of RDX degradation by strain 11Y, or that they are rapidly metabolized by the cells.
Nitrite was identified during resting cell incubations (§3.3.7.2 and §4.3.3). To clarify this, resting
cell incubations were performed. Metabolites should accumulate using this system, as the cells
should not be taking products up for growth. Metabolites assayed for were nitrite, nitrate,
ammonium, formate and formaldehyde.
The RDX and metabolite concentrations over the course of the resting cell incubation are
shown in Figure 4.5. Metabolites which appeared during the experiment were nitrite, formate and
formaldehyde. RDX disappeared over 4 h, although the rate of RDX disappearance slowed
considerably after 20 min. Nitrite appeared transiently in approx. equimolar concentrations with the
original concentration of RDX within 15 min, and then decreased. Production of formaldehyde was
slower, but it remained in the supernatant, and formate was produced over a longer period of time
and subsequently declined. The concentration of ammonium produced was not above that seen in
controls (0-8 µM), and no nitrate was produced. Controls consisted of incubations of RDX without
Chapter 4 – Characterization of Rhodococcus rhodochrous strain 11Y
69
cells, or cells without RDX. These showed low levels of formate (maximum 22 µM formed from
cells in the absence of RDX) and formaldehyde (maximum 33 µM formed from cells in absence of
RDX). No nitrite was observed and no RDX was degraded in the absence of strain 11Y. No other
products were observed using the HPLC and ion chromatography procedures described.
0
50
100
150
200
0 60 120 180 240
Time (min)
Met
abol
ite c
once
ntra
tion
(µM)
Figure 4.5: Resting cell incubation products of strain 11Y on RDX. RDX concentration () nitriteconcentration (), formate concentration (♦ ), and formaldehyde concentration (). Figures shown are theaverage of triplicate cultures and error bars indicate ± one standard deviation.
Chapter 4 – Characterization of Rhodococcus rhodochrous strain 11Y
70
4.4 Discussion
Rhodococcus rhodochrous strain 11Y has been found to grow on, and remove 250 µM RDX
from culture within 21 h. Comparing this rate of RDX disappearance to those using other strains
and consortia is made difficult by the different conditions and concentrations of RDX used. Most
reported anaerobic consortia and pure strains take from a week to over a month to produce
significant decreases in RDX concentration 30, 32, 98, 103, 199, 274, 275, 308, 345. The aerobic fungus
Phanerochaete chrysosporium degraded approx. 96 % of the 0.125 µM RDX in its growth medium
over 30 days 89, taking 60 days when the RDX concentration was increased to 280 µM 276. Aerobic
strains appear to be able to degrade RDX more quickly: 180 µM within 32 h using a coryneform
bacterium 338, 230 µM within 160 h using Stenotrophomonas maltophilia strain PB1 27, and 200 µM
within 40 h using the unidentified strain A 157. Comparing strain 11Y to a similar bacterial strain,
the rate at which it removes RDX is similar to that of Rhodococcus sp. strain DN22 which
eliminated 160 µM RDX within 20 h 59. A lag period of approx. 12 h was observed with strain 11Y,
even though the bacteria used to inoculate the media had been grown on RDX. It is possible that the
bacteria in the starter culture had reached stationary phase, which would explain the lag. The
growth of the bacteria for many hours after the disappearance of RDX is probably due to the
continued utilization of nitrogen containing products of RDX degradation. The attempt to identify
whether nitrite or ammonium accumulated in the growth medium and were possibly responsible for
this continued growth showed that neither was present throughout the course of the experiment.
This would imply either that other nitrogen containing products must be present, or that any nitrogen
source was not released by the bacteria into the medium, being metabolized slowly intracellularly to
allow growth to continue for a further 36 h.
Comparing growth on ammonium with growth on RDX indicated that strain 11Y uses 3
moles of nitrogen from each mole of RDX. The same ratio has been observed with other aerobic
bacterial systems 27, 59. With the data obtained, it is impossible to tell which form(s) the nitrogen
takes before being utilized by the bacteria. N2O has been proposed as a significant product of RDX
breakdown 276, and may account for some or all of the nitrogens not taken up. One of the products
of RDX degradation which is likely to be used as a nitrogen source by the bacteria is nitrite, which
was identified in the growth culture of Rhodococcus sp. strain DN22 59 but not that of strain 11Y,
although it has been identified during resting cell incubations of RDX with strain 11Y. The absence
of nitrite from the growth medium may be due to a more efficient nitrite reductase in strain 11Y than
strain DN22, leading to a more rapid turnover of nitrite.
Chapter 4 – Characterization of Rhodococcus rhodochrous strain 11Y
71
Many bacterial systems which enable bacteria to degrade xenobiotics are induced by the
compound which they can degrade. These include the styrene oxidizing enzyme from Rhodococcus
rhodochrous 324, the triazine hydrolase from R. corallinus 209, the naphthalene dioxygenase of
Rhodococcus sp. 4, the pyrene degradation genes in Mycobacterium 1 6 5 and ETBE degrading
enzymes in R. ruber 53. In the cases when induction in these strains was measured by activity, it was
undetectable in the absence of the inducer, increasing greatly in its presence, and when measured by
SDS-PAGE there was a dramatic increase in intensity of a specific band after induction. RDX
degradation has previously been observed to be inhibited in the presence of ammonium, using
strains of corynebacteria 338 and rhodococci 59. In this latter study, resting cell incubations performed
with cells grown on ammonium showed very little RDX removal compared to cells grown on RDX,
although cells grown on nitrite or nitrate showed an intermediate level of RDX removal 59. Binks et
al. 27 observed diauxic growth on minimal medium containing both RDX and an additional nitrogen
source, using a mixed culture containing S. maltophilia strain PB1. The activity towards RDX in
strain 11Y was seen to be present in cells grown on ammonium, and it increased approx. three-fold
in cells grown on RDX. This indicates that biodegradation of RDX using strain 11Y will occur even
in the presence of alternative nitrogen sources, which may make strain 11Y a useful strain for
investigation. Nitrite was produced during these resting cell incubations, although decreased after
30 min using cells grown on RDX, and continued to accumulate using cells grown on ammonium.
The differences in nitrite uptake may indicate the upregulation of an enzyme required to utilize the
nitrite, such as an assimilatory nitrite reductase, whose involvement has also been invoked in a
previous study 59, and which has been found to be inducible by nitrite or nitrate in many bacterial
species 194.
There are several other explosives containing the same nitramine group as RDX. R.
rhodochrous strain 11Y was not able to grow on the two nitramine compounds tested. Both HMX
and CL20 were supplied to strain 11Y as sole sources of nitrogen, and no growth was observed.
Whether this is to do with an inability of the larger molecules to interact with an enzyme active site,
or an inability to get into the cell in the first place could only be determined using purified enzyme.
There is only limited information regarding the biodegradation of these compounds, with no reports
of biological action on CL20 and only a few reports of HMX degradation by aerobic and anaerobic
consortia 130, 139.
Metabolites identified during cell growth or in resting cell incubations can give clues to the
mechanism of RDX degradation. Anaerobic biodegradation of RDX has been reported to occur
Chapter 4 – Characterization of Rhodococcus rhodochrous strain 11Y
72
through sequential reduction of the nitro groups to nitroso, followed by possible, unstable,
hydroxylamino intermediates and ring cleavage (Figure 1.6). This mechanism was postulated by
McCormick et al. 199 using anaerobic sludge, and some or all of the nitroso intermediates have been
seen in other anaerobic studies 98, 137, 167, 345. End products of this route appear to include
formaldehyde or methanol and potentially toxic hydrazine derivatives, and it has been suggested that
a type I nitroreductase is responsible for this activity 168. However, aerobic bacterial degradation
would seem not to follow this route as no nitroso intermediates have been observed during the
aerobic degradation of RDX using bacteria.
The metabolites identified during the degradation of RDX by strain 11Y are nitrite,
formaldehyde and formate. The production of small organic molecules, such as formaldehyde and
formate indicate that the RDX has been degraded rather than transformed. All the above
metabolites have been identified in the breakdown of RDX by thermal decomposition, alkaline
hydrolysis and photolysis (§1.7.1), and of the mechanisms proposed for the degradation of RDX by
these routes, two involve the initial cleavage of the N-N bond (Figures 1.4 and 1.5). This
mechanism would fit in with the observation that the first metabolite produced during the resting
cell incubations with strain 11Y was nitrite. Denitration of RDX as a first, important, step in its
breakdown has been suggested in a scheme put forward by Fournier et al. 95 working on
Rhodococcus sp. strain DN22 (§1.7.2.3). This reaction would destabilize the RDX to the extent that
a spontaneous ring cleavage would occur 138. Using strain DN22, products observed include nitrite,
nitrous oxide, ammonium, formaldehyde, carbon dioxide and a dead end product (Figure 1.8), which
do not correlate entirely with those seen using strain 11Y. The differences may be due to different
competing reactions within the bacteria after the initial denitration.
No formate is observed during RDX degradation by strain DN22, but it is produced by strain
11Y. This may be because strain DN22 possesses a more efficient formate dehydrogenase than
strain 11Y; formate dehydrogenase enzymes are widely found in bacteria, catalysing the oxidation
of formate to carbon dioxide 234. Previous work on RDX degradation using anaerobic sludge has
identified formate as a product, and proposed a role for acetogens in its formation from
formaldehyde 138. This reaction is catalysed by formaldehyde dehydrogenase enzymes, which are
ubiquitous, found in plants, animals and bacteria 12, 122, and an inducible formaldehyde
dehydrogenase has been characterized in Rhodococcus erythropolis 86 which is closely related to
strain 11Y. Therefore it seems likely that this reaction could be occurring within strain 11Y.
However, the formate may be produced independently of the formaldehyde, as the formaldehyde
Chapter 4 – Characterization of Rhodococcus rhodochrous strain 11Y
73
concentration does not decrease during the resting cell incubation, while the formate concentration
increases. Both formate and formaldehyde are produced from the alkaline hydrolysis, photolysis
and thermal decomposition of RDX 62, 138, 148, 229, indicating that formate can result directly from RDX
breakdown.
Ammonium was absent from the resting cell incubations with strain 11Y, although it was
formed from RDX breakdown by strain DN22. Strain 11Y may not produce ammonium from the
breakdown of RDX, but if it does its assimilation, through the action of the enzymes glutamine and
glutamate synthetase 205, may be faster in strain 11Y than strain DN22. Nitrous oxide was not
assayed for, and no other intermediates or dead end metabolites were observed using the HPLC
parameters described.
The decrease in the rate of RDX disappearance after 20 min of the incubation could be due
to the metabolites affecting the cells deleteriously. In particular, a large amount of nitrite was
produced at that time and it may have toxic effects on the bacteria 247. Further characterization of
this pathway is necessary to ensure that full mineralization is occurring, meaning that there are no
dead end products, and that no toxic by-products accumulate. Given that toxic nitroso compounds
are formed during anaerobic biodegradation, and a dead end product is found using Rhodococcus
strain DN22, use of strain 11Y may be confirmed to be the safest method of RDX bioremediation
characterized to date.
Chapter 5 – Cloning of the RDX degradation gene cluster
74
Chapter 5. Cloning, sequencing and analysis of the gene cluster
responsible for RDX degrading ability
5.1 Background
The characterization of Rhodococcus rhodochrous strain 11Y with respect to its growth on
RDX has been described, and some of the metabolites it produces from the degradation of RDX
have been elucidated. This chapter describes the cloning of the gene(s) responsible for the RDX
degradation using a molecular genetic approach. This will involve the creation of a DNA library
from strain 11Y and the transfer of the library to a non RDX degrading host in order to obtain clones
which have gained the ability to degrade RDX .
The molecular biology and genetics of rhodococci are not well characterized and few tools
for genetic manipulation have been developed for use within this genus. Escherichia coli is the
preferred host for genetic manipulation as it has been more thoroughly characterized and there are
more tools available for use with it, so several E. coli – Rhodococcus shuttle vectors have been
developed, which are able to be maintained in both strains. The plasmids can be manipulated in the
more amenable E. coli host, and transferred to a rhodococcal host where genes of rhodococcal origin
are more likely to be expressed. E. coli – Rhodococcus shuttle vectors are created from cryptic
rhodococcal plasmids (and their derivatives) fused to E. coli cloning plasmids such that origins of
replication for maintenance in both organisms are present 70, 73, 77, 79, 85, 135, 146, 270, 317, 349. These vectors
have been used to clone rhodococcal genes involved in dibenzothiophene desulphurization 230,
herbicide EPTC degradation 271, isopropylbenzene degradation 164, rifampicin resistance 7, azo dye
degradation 143 and cocaine degradation 40. Such shuttle vectors have also been used to introduce
fragments into rhodococcal hosts for heterologous expression of proteins from related species, or to
study upstream sequences 174, 175, 193, 198, 210, 272.
The E. coli – Rhodococcus shuttle vector pDA71 (or its predecessor pDA37 70) was used in
the cloning of four of the rhodococcal genes listed above, and was chosen for library construction in
this study. Plasmid pDA71 (Figure 5.1) was constructed from pEcoR251 35 and rhodococcal
plasmid pDA21 70, 71, 238. The plasmid carries a gene for ampicillin resistance (bla) and a positive
selection system. If the EcoR I suicide gene is not disrupted by the insertion of a fragment of DNA
in one of its unique cloning sites, Bgl II, Hind III or Pst I, EcoR I endonuclease is produced which
cleaves the host cell DNA 54. Thus only plasmids carrying an insert allow their host to survive when
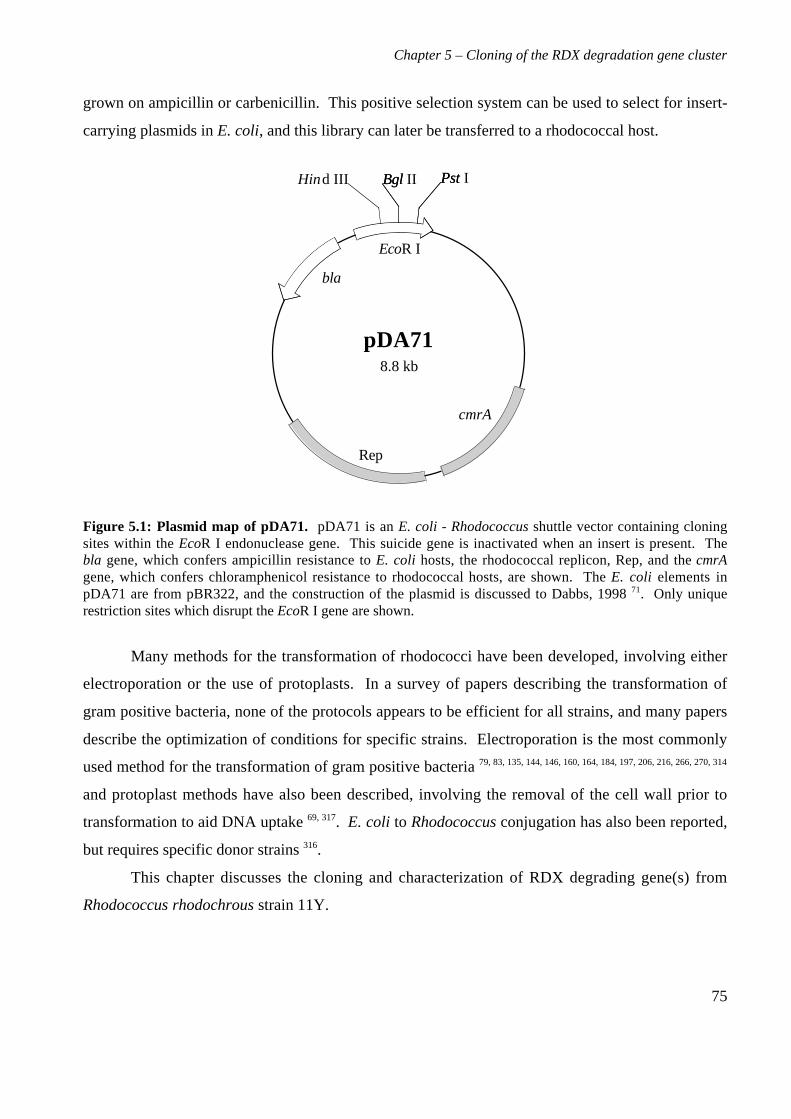
Chapter 5 – Cloning of the RDX degradation gene cluster
75
grown on ampicillin or carbenicillin. This positive selection system can be used to select for insert-
carrying plasmids in E. coli, and this library can later be transferred to a rhodococcal host.
Figure 5.1: Plasmid map of pDA71. pDA71 is an E. coli - Rhodococcus shuttle vector containing cloningsites within the EcoR I endonuclease gene. This suicide gene is inactivated when an insert is present. Thebla gene, which confers ampicillin resistance to E. coli hosts, the rhodococcal replicon, Rep, and the cmrAgene, which confers chloramphenicol resistance to rhodococcal hosts, are shown. The E. coli elements inpDA71 are from pBR322, and the construction of the plasmid is discussed to Dabbs, 1998 71. Only uniquerestriction sites which disrupt the EcoR I gene are shown.
Many methods for the transformation of rhodococci have been developed, involving either
electroporation or the use of protoplasts. In a survey of papers describing the transformation of
gram positive bacteria, none of the protocols appears to be efficient for all strains, and many papers
describe the optimization of conditions for specific strains. Electroporation is the most commonly
used method for the transformation of gram positive bacteria 79, 83, 135, 144, 146, 160, 164, 184, 197, 206, 216, 266, 270, 314
and protoplast methods have also been described, involving the removal of the cell wall prior to
transformation to aid DNA uptake 69, 317. E. coli to Rhodococcus conjugation has also been reported,
but requires specific donor strains 316.
This chapter discusses the cloning and characterization of RDX degrading gene(s) from
Rhodococcus rhodochrous strain 11Y.
Pst Bgl Bgl Pst d III
cmrA
Rep
bla
Eco
pDA718.8 kb
R I
Hin II I
Chapter 5 – Cloning of the RDX degradation gene cluster
76
5.2 Materials and methods
5.2.1 Library construction
5.2.1.1 Preparation and partial digestion of DNA
Total DNA prepared from strain 11Y (§2.3.1) was used in trial digestions with Sau3A I
using 10 µg DNA in a total volume of 10 µl, at an enzyme concentration of 0.1 unit per µl, at 37 oC
for 20, 40, 60 and 80 min. The reaction was stopped by the addition of EDTA pH 7.5 to a final
concentration of 20 mM 159. The size ranges of the resulting digestions were determined by gel
electrophoresis. Partial digestion was optimized at 30 min, and a 10x scale up performed. Gel
electrophoresis confirmed that the scale up had the same range of fragment sizes as the trial
digestion.
5.2.1.2 DNA fragment size fractionation on sucrose gradients
Fragments of Sau3A I digested DNA were size fractionated using an adaptation of the
method described in 8. Solutions containing 10 %, 15 %, 20 %, 25 %, 30 %, 35 % and 40 % w/v
sucrose were made in a buffer of 100 mM sodium chloride, 20 mM Tris pH 8.0 and 10 mM EDTA
pH 8.0. Aliquots (550 µl) of each were layered in a gradient from 40 % to 10 % in a Beckman 11 x
60 mm centrifuge tube and left to equilibrate overnight at 4 oC. DNA was layered on top and spun
for 3 h at 60,000 rpm at 20 oC in a Beckman SW60Ti rotor using a Beckman XL-90 ultracentrifuge
(Beckman, High Wycombe, Buckinghamshire, UK.). The bottom of the centrifuge tube was pierced
with a 0.8 mm diameter syringe needle, fractions were collected from decreasing sucrose
concentrations and samples from each fraction were visualized on an agarose gel. DNA was
precipitated from fractions containing the desired size ranges by incubating on ice for 10 min with
T500 dextran at a final concentration of 200 µg/ml, sodium acetate pH 6.0 to 0.3 M and 2 volumes
of ethanol and resuspended in 200 µl dH2O. A further precipitation was performed, and the DNA
resuspended in 50 µl dH2O.
5.2.2 Microtitre plate assays of E. coli
Microtitre plates were used with 150 µl LB containing 100 µg/ml carbenicillin in each well.
Five library transformants were used to inoculate each well, the plate was covered and incubated at
37 oC overnight. Samples from this plate were transferred to method A and B plates using microtitre
plate replicating tools. Method A plates contained 150 µl LB, 100 µg/ml carbenicillin and 0.5 mM
RDX in each well, method B plates contained the above without the RDX. Both were covered and
Chapter 5 – Cloning of the RDX degradation gene cluster
77
incubated at 30 oC overnight. Lysozyme (20 µl of a 50 mg/ml stock) was added to each well of
method B plates, which were incubated at 37 oC for 2 h. Aliquots (50 µl) of 440 mM Tris pH 8.0
and 3 mM RDX were added to each well and the plate was incubated at 30 oC for 3-4 h. Plates from
both methods were assayed for the presence of nitrite. Sulphanilamide solution (50 µl of 1 % w/v
sulphanilamide, 6.7 % v/v concentrated HCl) was added to each well and incubated for 5-10 min, 20
µl N-(1-naphthyl)ethylenediamine (NED) solution (0.5 % w/v NED) was added and the reaction
was allowed to proceed for 10 min. The presence of any pink coloration was recorded. A positive
control of the known RDX degrader, strain 11Y, was used, as was a sterile negative control. An
uninoculated well with added lysozyme was used to determine any interaction between lysozyme
and the components of the Griess assay, and no pink colouration was seen.
5.2.3 Transfer of library into rhodococcal host
5.2.3.1 Electroporation method 1 164
Strain CW25 was grown in 100 ml LB containing 1.8 % w/v sucrose, 1.5 % w/v glycine and
0.01 % w/v isonicotinic acid hydrazide (isoniazid) at 30 oC to an OD600 of 3, cooled on ice, harvested
by centrifugation at 8000 rpm at 4 oC for 15 min, washed twice in ice cold sterile water and
resuspended in 1 ml 30 % w/v polyethylene glycol (PEG) 6000. Aliquots of 100 µl were mixed
with up to 1 µg DNA, transferred to a chilled 0.2 cm electroporation cuvette and incubated on ice
for 10 min. Electroporation was performed at 2.4 kV, 400 Ω, 2.5 µF using a Biorad MicroPulser
(Biorad, Hemel Hempstead, Hertfordshire, U.K.). LB (1 ml) was added immediately after
electroporation and the cells incubated at 30 oC for 3 h before being plated onto selective medium
and incubated further at 30 oC.
5.2.3.2 Electroporation method 2 135
Strain CW25 was grown in 10 ml LB containing 1.8 % w/v sucrose and 1.5 % w/v glycine at
30 oC to mid-exponential phase (15 h), harvested by centrifugation at 6500 rpm at 4 oC for 10 min,
washed 3 times in ice cold, sterile water, resuspended in 1 ml ice cold water and kept on ice.
Aliquots (10 µl) were mixed with 1 µg DNA in a chilled 0.2 ml electroporation cuvette and kept on
ice. Electroporation was performed at 2.4 kV as above. After electroporation the cells were
incubated on ice for 10 min followed by a 10 min heat shock at 37 oC. The cells were recovered in 1
ml LB at 30 oC for 2 h before being plated onto selective medium and incubated further at 30 oC.
Chapter 5 – Cloning of the RDX degradation gene cluster
78
5.2.3.3 Electroporation method 3 160
Strain CW25 was grown in 50 ml LB containing 1.8 % w/v sucrose and 1.5 % w/v glycine at
30 oC to an OD600 of 0.5, harvested, washed twice in ice cold water and resuspended in 2.5 ml ice
cold water. Aliquots of 400 µl of cells were mixed with up to 1 µg DNA and incubated at 40 oC for
5 min. The electroporation mixture was placed into 0.2 mm cuvettes and electroporation was
performed at 2.4 kV as above. LB (600 µl) was added to the cells after electroporation and recovery
was performed at 30 oC for 4 h before plating onto selective medium.
5.2.3.4 PEG-mediated protoplast method 69
Strain CW25 was grown in LBSG medium (1 % w/v tryptone, 0.5 % w/v yeast extract, 0.5
% w/v sodium chloride, 10.3 % w/v sucrose and 3 % w/v glycine) to an OD600 of 2-3 and stored for
up to 1 month at 4 oC. A 50 µl volume of cells was used for each transformation. Cells were rinsed
twice in autoclaved B buffer (0.3 M sucrose, 0.01 M MgCl2 and 0.025 M N-
tris[hydroxymethyl]methyl-2-aminoethanesulfonic acid (TES) pH 7.2) and resuspended in the
original volume of B buffer containing 5 mg/ml lysozyme. After 90 min incubation at 37 oC, cells
were rinsed gently in freshly made P buffer (B buffer with 2 % v/v 1 M CaCl2 and 1 % v/v 0.03 M
KH2PO4), gently resuspended in the original volume of P buffer and 2 µl plasmid DNA was added
(approx. 0.7 µg). After 5 min, an equal volume of PPEG (P buffer with 50 % w/v PEG 6000) was
gently mixed in and left for 5 min. The cells were spread onto cold regeneration plates (as LBSG,
with glycine omitted and 1.5 % w/v agar and 0.4 % w/v MgCl2 added. After autoclaving, and
immediately before pouring the plates 2 % v/v 1 M CaCl2, 1 % v/v 0.03 M KH2PO4 and 1.7 % v/v
0.25 M TES pH 7.2 were added). After a 12 h recovery at 30 oC, chloramphenicol was introduced
underneath the agar, using a sterile spatula, to a final concentration in the agar of 40 µg/ml. Cells
were incubated at 30 oC for approx. 7 days, until distinct colonies appeared.
5.2.4 Growth of strain CW25(pHSX1) on RDX
Strains CW25 and CW25(pHSX1) were grown on minimal medium containing three carbon
sources and 0.25 mM RDX. Chloramphenicol (40 µg/ml) was added to the growth medium of strain
CW25(pHSX1). RDX concentrations were measured by taking samples at regular intervals,
assaying by HPLC and comparing to standard curves of RDX concentrations run with every set of
samples. Nitrite an ammonium were assayed using ion chromatography. Negative controls were
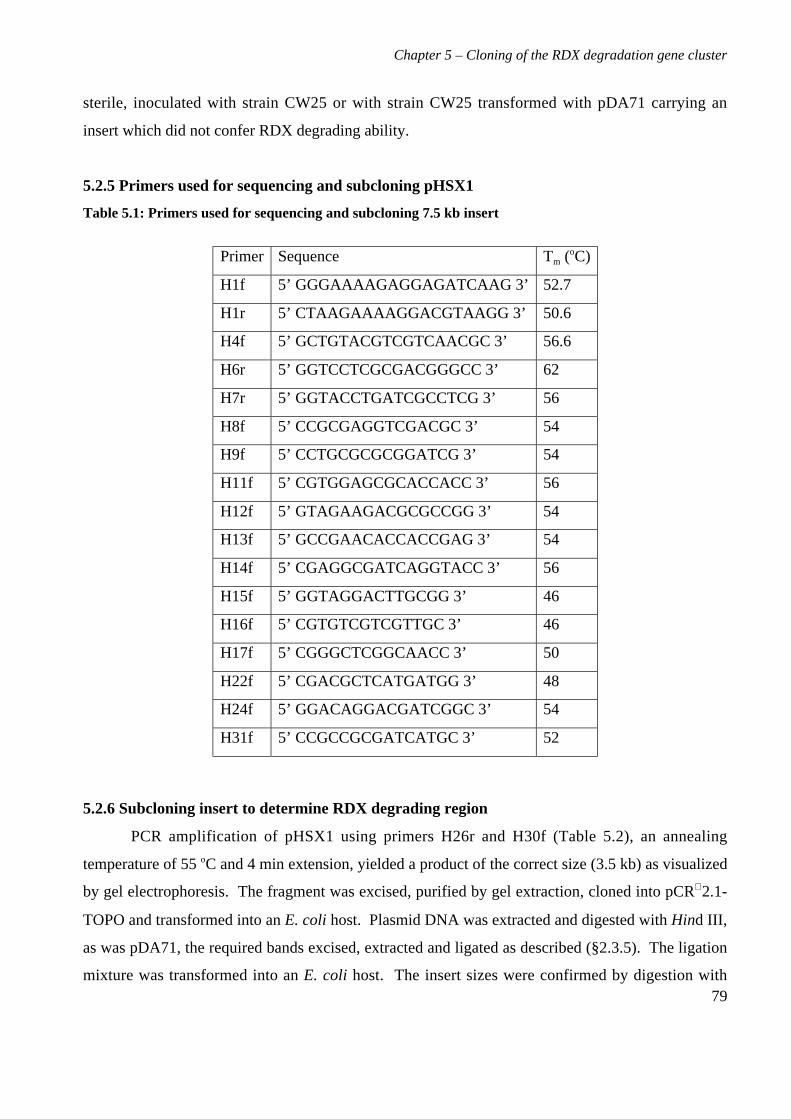
Chapter 5 – Cloning of the RDX degradation gene cluster
79
sterile, inoculated with strain CW25 or with strain CW25 transformed with pDA71 carrying an
insert which did not confer RDX degrading ability.
5.2.5 Primers used for sequencing and subcloning pHSX1
Table 5.1: Primers used for sequencing and subcloning 7.5 kb insert
5.2.6 Subcloning insert to determine RDX degrading region
PCR amplification of pHSX1 using primers H26r and H30f (Table 5.2), an annealing
temperature of 55 oC and 4 min extension, yielded a product of the correct size (3.5 kb) as visualized
by gel electrophoresis. The fragment was excised, purified by gel extraction, cloned into pCR 2.1-
TOPO and transformed into an E. coli host. Plasmid DNA was extracted and digested with Hind III,
as was pDA71, the required bands excised, extracted and ligated as described (§2.3.5). The ligation
mixture was transformed into an E. coli host. The insert sizes were confirmed by digestion with
Primer Sequence Tm (oC)
H1f 5’ GGGAAAAGAGGAGATCAAG 3’ 52.7
H1r 5’ CTAAGAAAAGGACGTAAGG 3’ 50.6
H4f 5’ GCTGTACGTCGTCAACGC 3’ 56.6
H6r 5’ GGTCCTCGCGACGGGCC 3’ 62
H7r 5’ GGTACCTGATCGCCTCG 3’ 56
H8f 5’ CCGCGAGGTCGACGC 3’ 54
H9f 5’ CCTGCGCGCGGATCG 3’ 54
H11f 5’ CGTGGAGCGCACCACC 3’ 56
H12f 5’ GTAGAAGACGCGCCGG 3’ 54
H13f 5’ GCCGAACACCACCGAG 3’ 54
H14f 5’ CGAGGCGATCAGGTACC 3’ 56
H15f 5’ GGTAGGACTTGCGG 3’ 46
H16f 5’ CGTGTCGTCGTTGC 3’ 46
H17f 5’ CGGGCTCGGCAACC 3’ 50
H22f 5’ CGACGCTCATGATGG 3’ 48
H24f 5’ GGACAGGACGATCGGC 3’ 54
H31f 5’ CCGCCGCGATCATGC 3’ 52
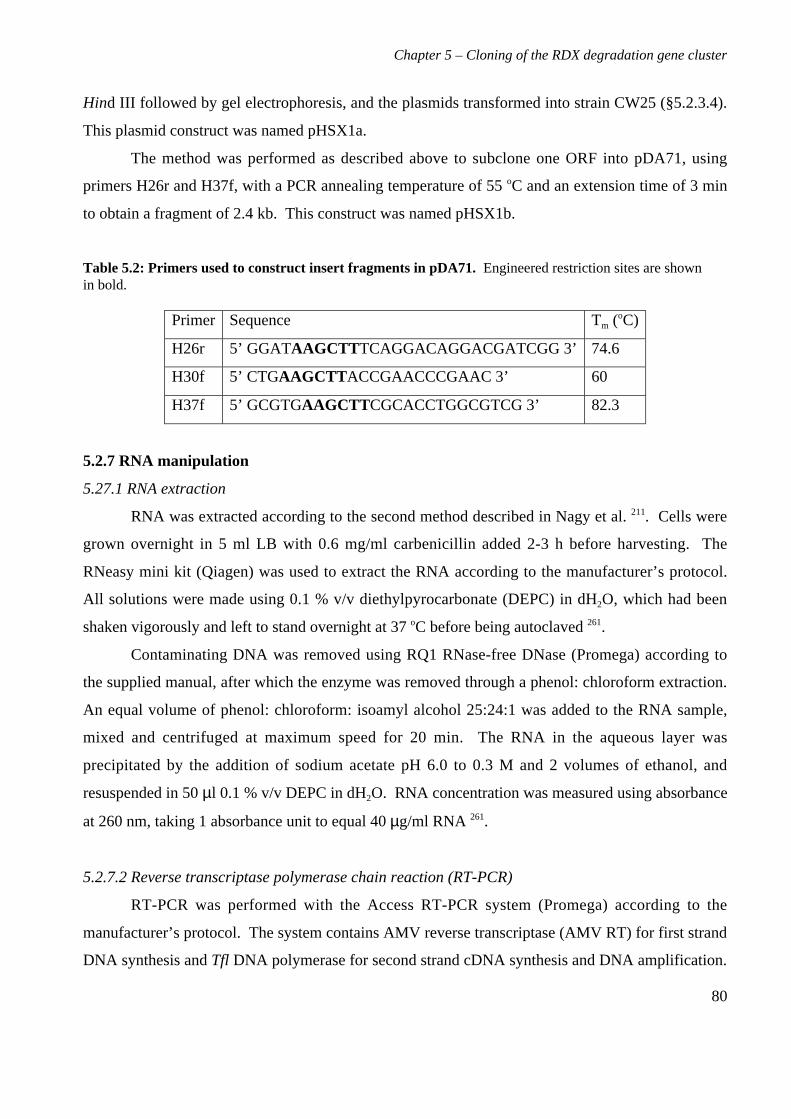
Chapter 5 – Cloning of the RDX degradation gene cluster
80
Hind III followed by gel electrophoresis, and the plasmids transformed into strain CW25 (§5.2.3.4).
This plasmid construct was named pHSX1a.
The method was performed as described above to subclone one ORF into pDA71, using
primers H26r and H37f, with a PCR annealing temperature of 55 oC and an extension time of 3 min
to obtain a fragment of 2.4 kb. This construct was named pHSX1b.
Table 5.2: Primers used to construct insert fragments in pDA71. Engineered restriction sites are shownin bold.
Primer Sequence Tm (oC)
H26r 5’ GGATAAGCTT TCAGGACAGGACGATCGG 3’ 74.6
H30f 5’ CTGAAGCTT ACCGAACCCGAAC 3’ 60
H37f 5’ GCGTGAAGCTT CGCACCTGGCGTCG 3’ 82.3
5.2.7 RNA manipulation
5.27.1 RNA extraction
RNA was extracted according to the second method described in Nagy et al. 211. Cells were
grown overnight in 5 ml LB with 0.6 mg/ml carbenicillin added 2-3 h before harvesting. The
RNeasy mini kit (Qiagen) was used to extract the RNA according to the manufacturer’s protocol.
All solutions were made using 0.1 % v/v diethylpyrocarbonate (DEPC) in dH2O, which had been
shaken vigorously and left to stand overnight at 37 oC before being autoclaved 261.
Contaminating DNA was removed using RQ1 RNase-free DNase (Promega) according to
the supplied manual, after which the enzyme was removed through a phenol: chloroform extraction.
An equal volume of phenol: chloroform: isoamyl alcohol 25:24:1 was added to the RNA sample,
mixed and centrifuged at maximum speed for 20 min. The RNA in the aqueous layer was
precipitated by the addition of sodium acetate pH 6.0 to 0.3 M and 2 volumes of ethanol, and
resuspended in 50 µl 0.1 % v/v DEPC in dH2O. RNA concentration was measured using absorbance
at 260 nm, taking 1 absorbance unit to equal 40 µg/ml RNA 261.
5.2.7.2 Reverse transcriptase polymerase chain reaction (RT-PCR)
RT-PCR was performed with the Access RT-PCR system (Promega) according to the
manufacturer’s protocol. The system contains AMV reverse transcriptase (AMV RT) for first strand
DNA synthesis and Tfl DNA polymerase for second strand cDNA synthesis and DNA amplification.
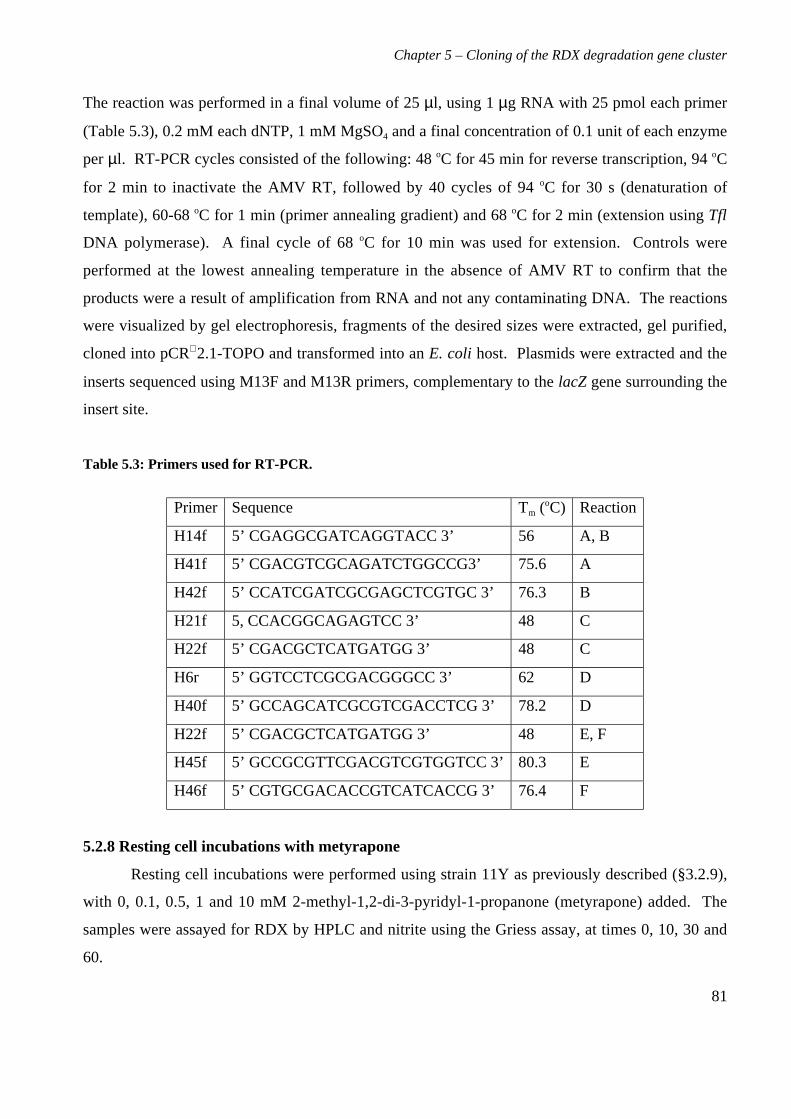
Chapter 5 – Cloning of the RDX degradation gene cluster
81
The reaction was performed in a final volume of 25 µl, using 1 µg RNA with 25 pmol each primer
(Table 5.3), 0.2 mM each dNTP, 1 mM MgSO4 and a final concentration of 0.1 unit of each enzyme
per µl. RT-PCR cycles consisted of the following: 48 oC for 45 min for reverse transcription, 94 oC
for 2 min to inactivate the AMV RT, followed by 40 cycles of 94 oC for 30 s (denaturation of
template), 60-68 oC for 1 min (primer annealing gradient) and 68 oC for 2 min (extension using Tfl
DNA polymerase). A final cycle of 68 oC for 10 min was used for extension. Controls were
performed at the lowest annealing temperature in the absence of AMV RT to confirm that the
products were a result of amplification from RNA and not any contaminating DNA. The reactions
were visualized by gel electrophoresis, fragments of the desired sizes were extracted, gel purified,
cloned into pCR 2.1-TOPO and transformed into an E. coli host. Plasmids were extracted and the
inserts sequenced using M13F and M13R primers, complementary to the lacZ gene surrounding the
insert site.
Table 5.3: Primers used for RT-PCR.
Primer Sequence Tm (oC) Reaction
H14f 5’ CGAGGCGATCAGGTACC 3’ 56 A, B
H41f 5’ CGACGTCGCAGATCTGGCCG3’ 75.6 A
H42f 5’ CCATCGATCGCGAGCTCGTGC 3’ 76.3 B
H21f 5, CCACGGCAGAGTCC 3’ 48 C
H22f 5’ CGACGCTCATGATGG 3’ 48 C
H6r 5’ GGTCCTCGCGACGGGCC 3’ 62 D
H40f 5’ GCCAGCATCGCGTCGACCTCG 3’ 78.2 D
H22f 5’ CGACGCTCATGATGG 3’ 48 E, F
H45f 5’ GCCGCGTTCGACGTCGTGGTCC 3’ 80.3 E
H46f 5’ CGTGCGACACCGTCATCACCG 3’ 76.4 F
5.2.8 Resting cell incubations with metyrapone
Resting cell incubations were performed using strain 11Y as previously described (§3.2.9),
with 0, 0.1, 0.5, 1 and 10 mM 2-methyl-1,2-di-3-pyridyl-1-propanone (metyrapone) added. The
samples were assayed for RDX by HPLC and nitrite using the Griess assay, at times 0, 10, 30 and
60.
Chapter 5 – Cloning of the RDX degradation gene cluster
82
5.3 Results
5.3.1 Construction of strain 11Y library in E. coli
The approach taken to clone the gene(s) which allow(s) Rhodococcus rhodochrous strain
11Y to degrade RDX involved the creation of a library from strain 11Y DNA, and the transfer of
this library to a non RDX degrading host strain. If one of the library clones, each of which carry a
fragment of DNA from strain 11Y, develops the ability to degrade RDX, it must be due to the
presence of a fragment containing the gene(s) which allow strain 11Y to degrade RDX.
To obtain a representative library, overlapping fragments are required. For this, a restriction
enzyme which cuts very frequently must be chosen, such as one which has a recognition site of only
four base pairs. An enzyme commonly used for library construction is Sau3A I, which has the
recognition sequence GATC and produces cohesive ends that are compatible with those created by
BamH I and Bgl II. Therefore DNA cut with Sau3A I can be ligated to pDA71 cut with Bgl II
(§5.1). A partial digestion of DNA with Sau3A I results in a wide range of different fragments to
result, one or several of which will hopefully carry the gene(s) of interest. The degree of partial
digestion which will give the sizes of fragments required must be determined through trial
digestions. Total DNA was used in order to provide fragments of any large plasmids present, as
well as fragments of genomic DNA.
The desired range of partially digested DNA fragment sizes chosen was 5-10 kb so that any
fragments would contain intact genes, regulatory regions and possibly clustered genes (§3.1). In
order to obtain the 5-10 kb fragments, strain 11Y DNA was partially digested, and a size
fractionation was performed on a sucrose gradient. Thirty one fractions were obtained, and those
which contained fragments between 5-10 kb were identified through gel electrophoresis (Figure
5.2), precipitated, resuspended in water and pooled. Several ligations of the fragments to Bgl II
digested pDA71, and transformations of the ligation mixtures into E. coli were performed, and a
total of approx. 23,000 transformants obtained. Stocks of the library in the E. coli host were made
and stored in glycerol at –80 oC (§2.2.3).
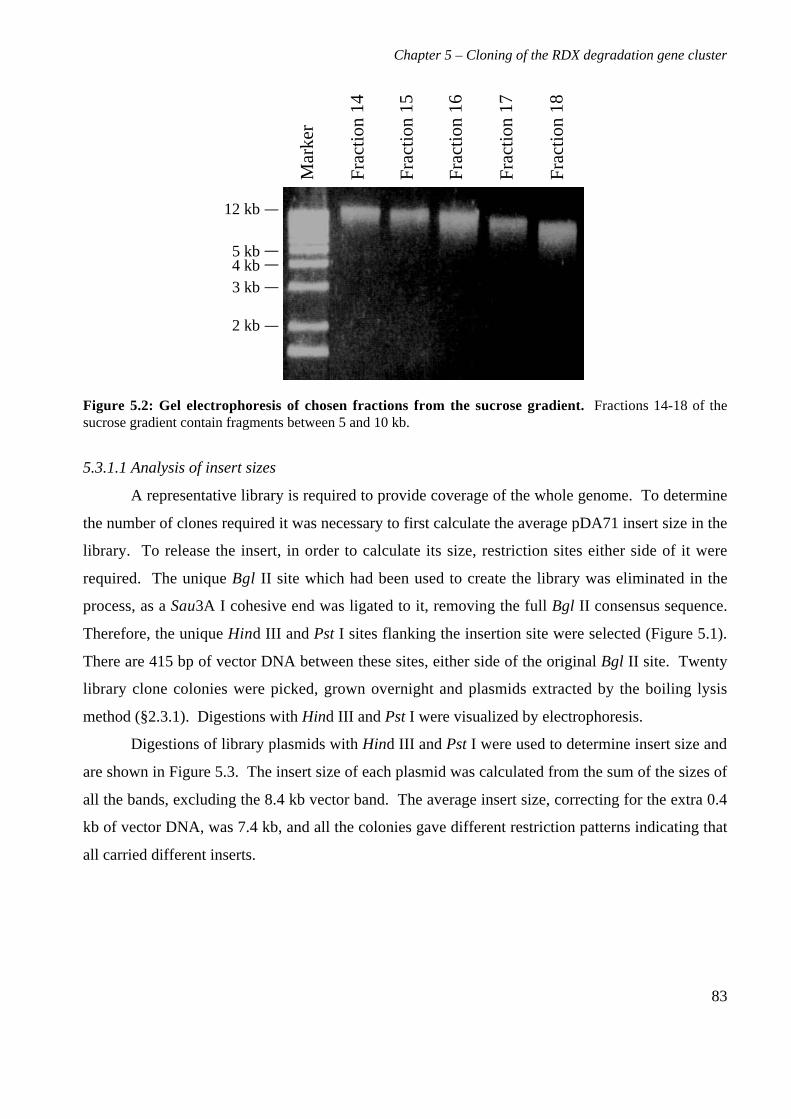
Chapter 5 – Cloning of the RDX degradation gene cluster
83
2 kb
3 kb4 kb
12 kb_
__
_
_5 kb
Fra
ctio
n 14
Fra
ctio
n 15
Fra
ctio
n 16
Fra
ctio
n 17
Fra
ctio
n 18
Mar
ker
Figure 5.2: Gel electrophoresis of chosen fractions from the sucrose gradient. Fractions 14-18 of thesucrose gradient contain fragments between 5 and 10 kb.
5.3.1.1 Analysis of insert sizes
A representative library is required to provide coverage of the whole genome. To determine
the number of clones required it was necessary to first calculate the average pDA71 insert size in the
library. To release the insert, in order to calculate its size, restriction sites either side of it were
required. The unique Bgl II site which had been used to create the library was eliminated in the
process, as a Sau3A I cohesive end was ligated to it, removing the full Bgl II consensus sequence.
Therefore, the unique Hind III and Pst I sites flanking the insertion site were selected (Figure 5.1).
There are 415 bp of vector DNA between these sites, either side of the original Bgl II site. Twenty
library clone colonies were picked, grown overnight and plasmids extracted by the boiling lysis
method (§2.3.1). Digestions with Hind III and Pst I were visualized by electrophoresis.
Digestions of library plasmids with Hind III and Pst I were used to determine insert size and
are shown in Figure 5.3. The insert size of each plasmid was calculated from the sum of the sizes of
all the bands, excluding the 8.4 kb vector band. The average insert size, correcting for the extra 0.4
kb of vector DNA, was 7.4 kb, and all the colonies gave different restriction patterns indicating that
all carried different inserts.
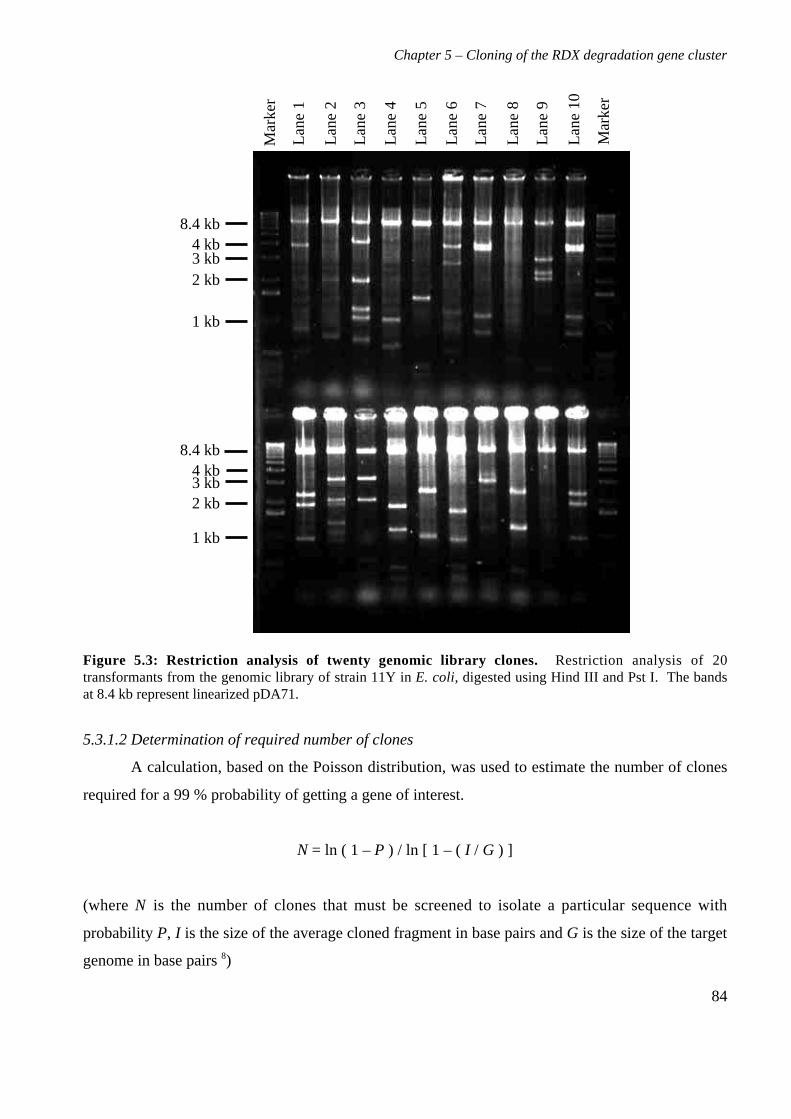
Chapter 5 – Cloning of the RDX degradation gene cluster
84
8.4 kb
8.4 kb
1 kb
1 kb
2 kb
4 kb3 kb
2 kb
4 kb3 kb
Lane
1
Lane
2
Lane
3
Lane
4
Lane
5
Lane
6
Lane
7
Lane
8
Lane
9
Lane
10
Mar
ker
Mar
ker
Figure 5.3: Restriction analysis of twenty genomic library clones. Restriction analysis of 20transformants from the genomic library of strain 11Y in E. coli, digested using Hind III and Pst I. The bandsat 8.4 kb represent linearized pDA71.
5.3.1.2 Determination of required number of clones
A calculation, based on the Poisson distribution, was used to estimate the number of clones
required for a 99 % probability of getting a gene of interest.
N = ln ( 1 – P ) / ln [ 1 – ( I / G ) ]
(where N is the number of clones that must be screened to isolate a particular sequence with
probability P, I is the size of the average cloned fragment in base pairs and G is the size of the target
genome in base pairs 8)
Chapter 5 – Cloning of the RDX degradation gene cluster
85
The size of strain 11Y genome was unknown but an estimated value of 6 Mb was used. This
was approximated from known genome sizes of related bacteria 25, 57, 58, 65, 232, 242.
Using the average insert size of 7.4 kb calculated above (§5.3.1.1), 3732 clones should
provide a 99 % probability of isolating any particular gene. With 23,000 transformants produced
from strain 11Y DNA, this library was considered to be highly representative.
5.3.2 Screening of library in E. coli
As the library was in an E. coli host, and cloning techniques in E. coli are better developed
than those in rhodococci, the isolation of an RDX degrading clone from the library in E. coli was
attempted. If the RDX degrading protein(s) were found to be active in an E. coli host, it would
remove the need for subsequent transformation of the library into a rhodococcal host.
The presence of an RDX degrading clone could not be assessed using a growth screen. The
only identified nitrogen containing metabolite from the breakdown of RDX by the mechanism of
strain 11Y is nitrite (§4.3.5), which E. coli is not able to use as a nitrogen source when grown
aerobically 56. Therefore, alternative screens were devised to allow the detection of activity against
RDX, without requiring the bacteria to be able to use it as a source of nitrogen.
To ensure that the E. coli TOP10 cells were able to grow in the presence of RDX, cells were
plated onto LA containing 5 mM RDX. Growth was assessed after 2 days and was found to be
unaffected when compared to growth on LA containing no RDX. Therefore, under the conditions
required for this screen, RDX does not appear to affect the growth of E. coli.
5.3.2.1 Zone of clearance on adapted RDX plate
To determine whether the activity against RDX is being expressed in any of the E. coli
clones, an adaptation of the zone of clearance plate screen was used. LA containing 100 µg/ml
carbenicillin made up the bottom layer, to encourage growth of the cells and achieve a sufficient
biomass of each clone to potentially allow for expression of RDX degrading genes. The top layer
consisted of phosphate buffer and agarose containing 5 mM RDX. Glycerol stocks of the library in
E. coli were spread onto these plates at a dilution of 10–7 to give approx. 300 colonies/plate, and the
plates grown at 30 oC for up to 9 days.
A total of approx. 11,000 library clones were screened on 35 plates. Each colony grew to a
diameter of approx. 3 mm indicating that the cells could obtain nutrients from the LA layer for
growth, but none produced a zone of clearance (data not shown).
Chapter 5 – Cloning of the RDX degradation gene cluster
86
5.3.2.2 Microtitre plate assays using whole cells and cell extract
A more sensitive screen was devised, assaying for the production of nitrite from RDX
breakdown using the Griess assay. The library in E. coli was screened in 96 well microtitre plates
for the ability of both whole cells (method A) and crude cell extract (method B) to produce nitrite
from RDX. Crude cell extract was used to allow the RDX to interact with any expressed
degradation enzymes in the absence of a cell wall, which could possibly inhibit RDX uptake.
Method A involved the growth of E. coli library clones in LA with RDX overnight and
assayed for nitrite production. Method B involved the growth of E. coli library clones in LA in the
absence of RDX. After overnight growth, lysozyme was added to each well to lyse the culture and
produce a crude cell extract. RDX was then added and the nitrite presence assayed after 3-4 h
incubation.
A representative library of 3,800 clones was screened using both methods. A typical
microtitre plate result is shown in Figure 5.4. In some cases a faint pink coloration (a positive result
of the Griess assay, indicating nitrite presence) was observed, but this was not reproducible when
repeated. The faint pink wells were always at the edges of the plate and commonly at the corners.
The positive control using strain 11Y showed an intense pink colouration.
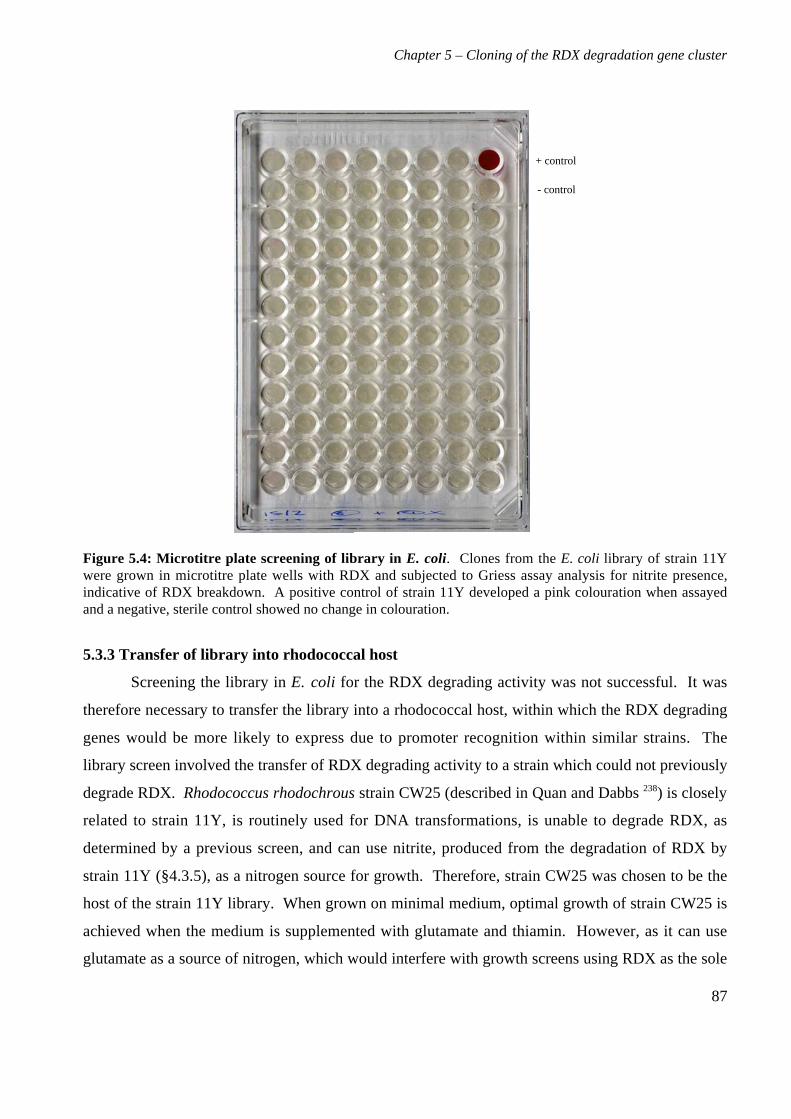
Chapter 5 – Cloning of the RDX degradation gene cluster
87
+ control
- control
Figure 5.4: Microtitre plate screening of library in E. coli. Clones from the E. coli library of strain 11Ywere grown in microtitre plate wells with RDX and subjected to Griess assay analysis for nitrite presence,indicative of RDX breakdown. A positive control of strain 11Y developed a pink colouration when assayedand a negative, sterile control showed no change in colouration.
5.3.3 Transfer of library into rhodococcal host
Screening the library in E. coli for the RDX degrading activity was not successful. It was
therefore necessary to transfer the library into a rhodococcal host, within which the RDX degrading
genes would be more likely to express due to promoter recognition within similar strains. The
library screen involved the transfer of RDX degrading activity to a strain which could not previously
degrade RDX. Rhodococcus rhodochrous strain CW25 (described in Quan and Dabbs 238) is closely
related to strain 11Y, is routinely used for DNA transformations, is unable to degrade RDX, as
determined by a previous screen, and can use nitrite, produced from the degradation of RDX by
strain 11Y (§4.3.5), as a nitrogen source for growth. Therefore, strain CW25 was chosen to be the
host of the strain 11Y library. When grown on minimal medium, optimal growth of strain CW25 is
achieved when the medium is supplemented with glutamate and thiamin. However, as it can use
glutamate as a source of nitrogen, which would interfere with growth screens using RDX as the sole
Chapter 5 – Cloning of the RDX degradation gene cluster
88
nitrogen source, and it can grow in the absence of either supplement, neither were subsequently
used.
5.3.3.1 Electroporation to transform cells
A literature survey of rhodococcal transformation techniques was performed, to determine
the conditions most likely to provide a large number of transformants. The methods vary with
respect to stage at which the cells are harvested, treatment of the cells prior to electroporation and
treatment of the cells after electroporation. The overriding theme from the survey is that no method
appears to work for all rhodococcal hosts and that in many cases the conditions need to be optimized
for the specific host strain. With so many parameters to vary, there is a lot of choice in which
electroporation protocol to use.
The method described in Kesseler et al. 164 involves growing strain CW25 cells to saturation
in LB containing sucrose and glycine, which inhibits peptidoglycan synthesis, supplemented with
isoniazid to inhibit mycolic acid synthesis. Both of these cause the rhodococcal cell wall to weaken
and increase the likelihood of foreign DNA uptake by the cell. The cells are resuspended in PEG
which increases the effective DNA concentration and thus transformation efficiency. A maximum
efficiency of 373 CFU (colony forming units) per µg DNA was achieved, which was much lower
than the figure of 105 which should have been possible. Altogether 166 colonies were obtained by
this method, on 6 plates.
To get a higher transformation efficiency, the method described in Hashimoto et al. 135 was
used, adapted by growing the cells in the medium described above, rather than MYP as specified.
Cells were harvested at mid-exponential phase, after 15 h. No PEG is used in this method; instead
the cells are resuspended in ice cold, sterile water. Approximately the same electroporation
conditions are used, but the recovery period involves 10 min incubation on ice, followed by 10 min
at 37 oC, and a further 2 h in rich medium at 30 oC. Only 2 transformants were obtained using this
method using 1 µg DNA, instead of a predicted 107 CFU per µg DNA.
Finally, an electroporation method described in Kalscheuer et al. 160 was used. LB
containing sucrose and glycine was again used to grow the cells, which were harvested at an OD600
of 0.5 and incubated with DNA at 40 oC for 5 min (heat shocked) before electroporation. A
maximum transformation efficiency of 349 CFU per µg DNA was attained, which is still much
lower than expected. This method was also not reproducible using strain CW25, with some attempts
resulting in no transformants.
Chapter 5 – Cloning of the RDX degradation gene cluster
89
None of the electroporation protocols attempted provided sufficient numbers of clones to
enable screening of the library. Another transformation method was required.
5.3.3.2 PEG-mediated protoplast method to transform cells
A protoplast method of transformation was attempted, performed with the help of Professor
Eric Dabbs at the University of Witwatersrand, South Africa. Strain CW25 was grown in LBSG to
weaken the cell wall. The cell wall of the host was removed with the use of lysozyme, creating
protoplasts; this, with the use of PEG to increase the effective concentration of DNA, aids DNA
uptake. Several thousand transformants were obtained per plate, giving a transformation efficiency
of approx. 5000 CFU per µg DNA. Due to the transfer of the library from E. coli to a rhodococcal
host, 5-6 times as many transformants were required as were previously calculated (§5.3.1.2) for a
good chance of representing all clones (E. R. Dabbs, personal communication). A total of approx.
50,000 transformants were finally obtained, giving a representative library. The clones were rinsed
off the regeneration plates using LB, pooled and vortexed to mix. The pooled library was halved
and divided into aliquots, each aliquot of which should have contained representatives of each clone.
The aliquots were stored with glycerol as stocks at –80 oC.
5.3.4 Screening of library in rhodococcal host
5.3.4.1 Selective enrichment in RDX medium
Selective enrichment was used to screen the rhodococcal library for RDX degrading clones.
Minimal medium containing three carbon sources and 1 mM RDX as the sole source of nitrogen
was inoculated with the library, to encourage the growth of transformants expressing RDX
degradation gene(s) (§3.1). Four aliquots of library clones in strain CW25 were used to inoculate
four flasks of selective medium, which were grown at 30 oC for 2 weeks. The flasks were
subcultured and grown for a further 2 weeks.
TLC analysis of the media of subcultured flasks (§3.2.2) showed that no RDX remained in
two of the flasks (data not shown). The flasks that showed loss of RDX contained medium with
higher turbidity than the flasks which showed no loss of RDX, indicating that growth was occurring
in these flasks. Samples from these two flasks were spread onto LA plates containing
chloramphenicol, and placed at 30 oC. The clones on these plates formed a lawn which was streaked
to single colonies.
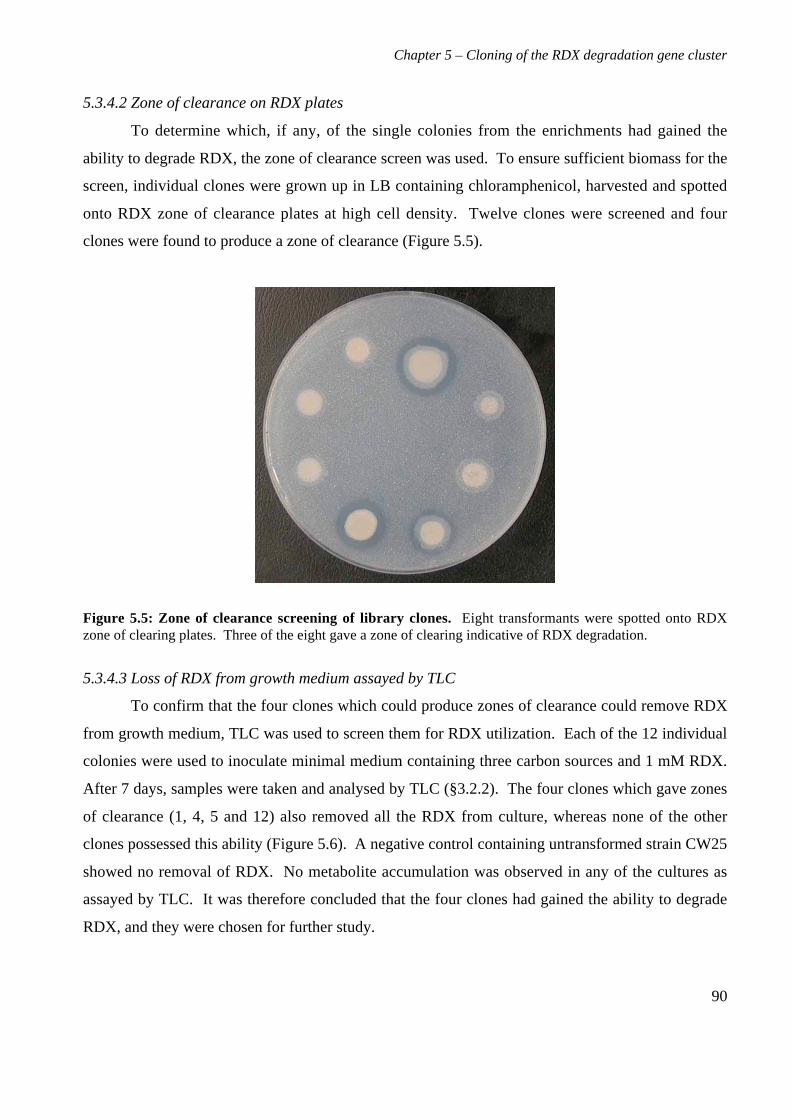
Chapter 5 – Cloning of the RDX degradation gene cluster
90
5.3.4.2 Zone of clearance on RDX plates
To determine which, if any, of the single colonies from the enrichments had gained the
ability to degrade RDX, the zone of clearance screen was used. To ensure sufficient biomass for the
screen, individual clones were grown up in LB containing chloramphenicol, harvested and spotted
onto RDX zone of clearance plates at high cell density. Twelve clones were screened and four
clones were found to produce a zone of clearance (Figure 5.5).
Figure 5.5: Zone of clearance screening of library clones. Eight transformants were spotted onto RDXzone of clearing plates. Three of the eight gave a zone of clearing indicative of RDX degradation.
5.3.4.3 Loss of RDX from growth medium assayed by TLC
To confirm that the four clones which could produce zones of clearance could remove RDX
from growth medium, TLC was used to screen them for RDX utilization. Each of the 12 individual
colonies were used to inoculate minimal medium containing three carbon sources and 1 mM RDX.
After 7 days, samples were taken and analysed by TLC (§3.2.2). The four clones which gave zones
of clearance (1, 4, 5 and 12) also removed all the RDX from culture, whereas none of the other
clones possessed this ability (Figure 5.6). A negative control containing untransformed strain CW25
showed no removal of RDX. No metabolite accumulation was observed in any of the cultures as
assayed by TLC. It was therefore concluded that the four clones had gained the ability to degrade
RDX, and they were chosen for further study.
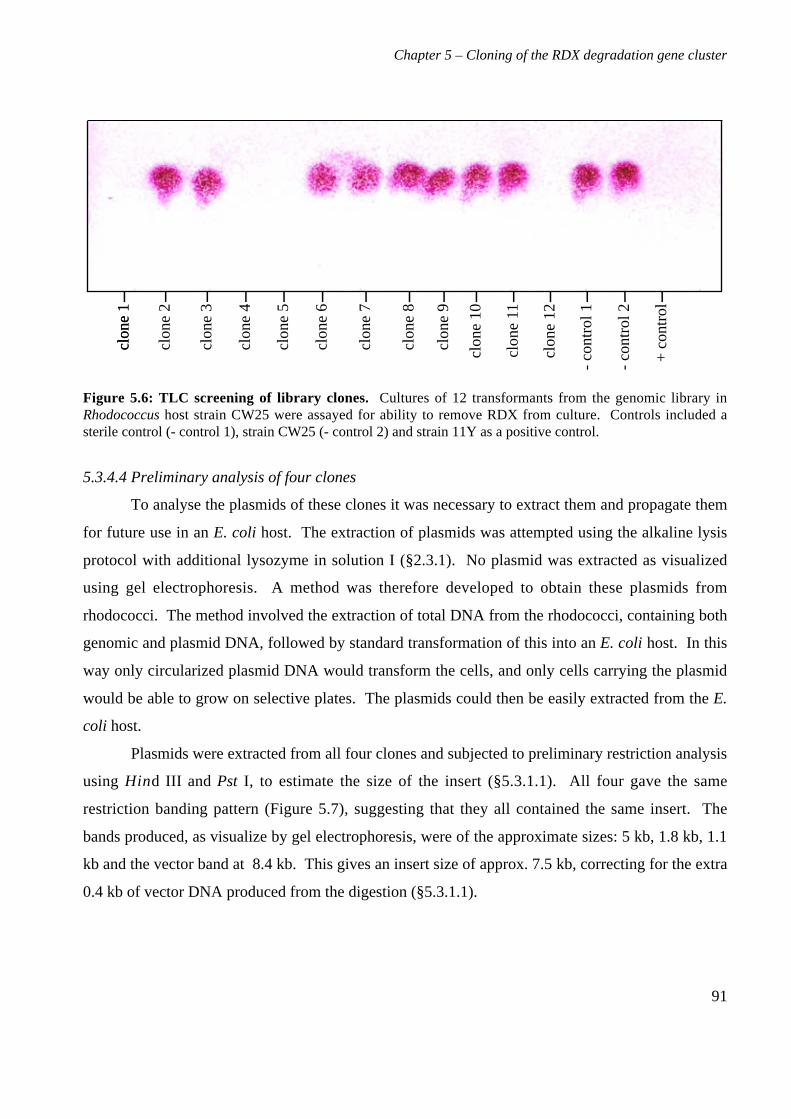
Chapter 5 – Cloning of the RDX degradation gene cluster
91
clon
e 1
- co
ntro
l 2
+ c
ontr
ol
I III I I I I III III I
clon
e 7
clon
e 6
clon
e 5
clon
e 3
clon
e 4
clon
e 2
clon
e 1
clon
e 8
clon
e 12
clon
e 11
clon
e 10
clon
e 9
- co
ntro
l 1
Figure 5.6: TLC screening of library clones. Cultures of 12 transformants from the genomic library inRhodococcus host strain CW25 were assayed for ability to remove RDX from culture. Controls included asterile control (- control 1), strain CW25 (- control 2) and strain 11Y as a positive control.
5.3.4.4 Preliminary analysis of four clones
To analyse the plasmids of these clones it was necessary to extract them and propagate them
for future use in an E. coli host. The extraction of plasmids was attempted using the alkaline lysis
protocol with additional lysozyme in solution I (§2.3.1). No plasmid was extracted as visualized
using gel electrophoresis. A method was therefore developed to obtain these plasmids from
rhodococci. The method involved the extraction of total DNA from the rhodococci, containing both
genomic and plasmid DNA, followed by standard transformation of this into an E. coli host. In this
way only circularized plasmid DNA would transform the cells, and only cells carrying the plasmid
would be able to grow on selective plates. The plasmids could then be easily extracted from the E.
coli host.
Plasmids were extracted from all four clones and subjected to preliminary restriction analysis
using Hind III and Pst I, to estimate the size of the insert (§5.3.1.1). All four gave the same
restriction banding pattern (Figure 5.7), suggesting that they all contained the same insert. The
bands produced, as visualize by gel electrophoresis, were of the approximate sizes: 5 kb, 1.8 kb, 1.1
kb and the vector band at 8.4 kb. This gives an insert size of approx. 7.5 kb, correcting for the extra
0.4 kb of vector DNA produced from the digestion (§5.3.1.1).
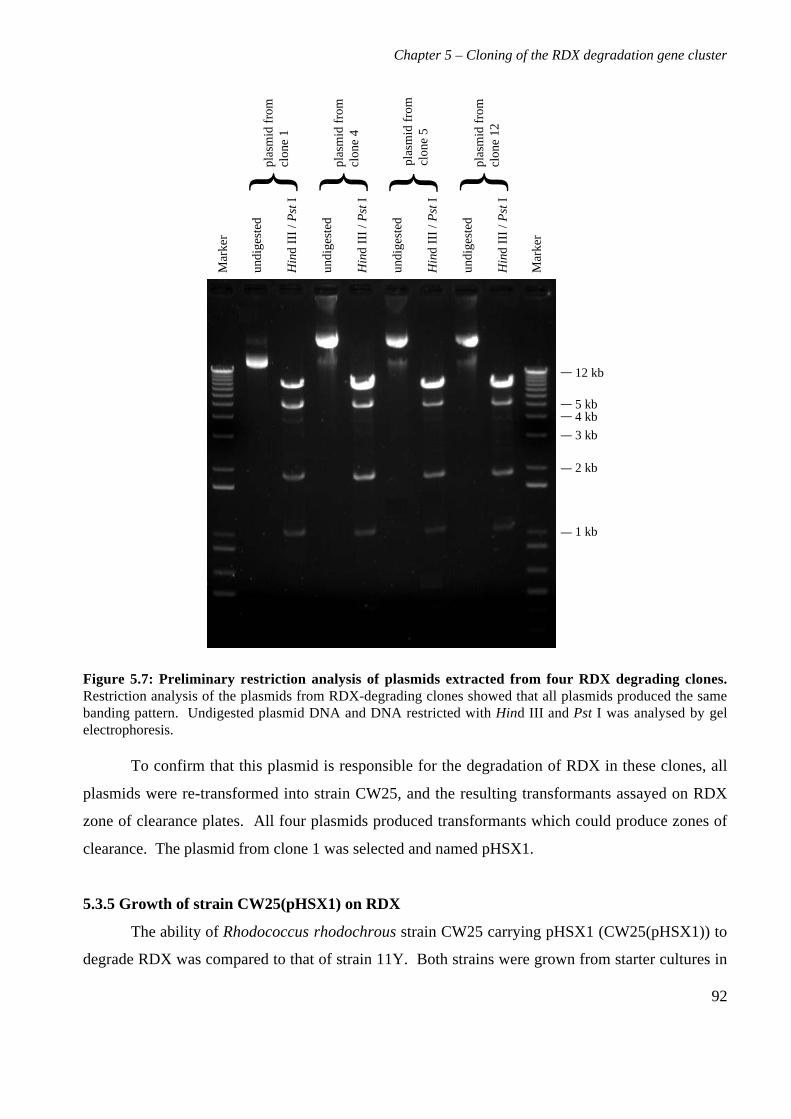
Chapter 5 – Cloning of the RDX degradation gene cluster
92
Hin
d III
/ P
st I
2 kb
3 kb
4 kb
12 kb_
__
_
_
1 kb
undi
gest
ed
_ 5 kb
plas
mid
from
cl
one
1
plas
mid
from
cl
one
5
Mar
ker
Mar
ker
Hin
d III
/ P
st I
undi
gest
ed
Hin
d III
/ P
st I
undi
gest
ed
Hin
d III
/ P
st I
undi
gest
ed
plas
mid
from
cl
one
4
plas
mid
from
cl
one
12
Figure 5.7: Preliminary restriction analysis of plasmids extracted from four RDX degrading clones.Restriction analysis of the plasmids from RDX-degrading clones showed that all plasmids produced the samebanding pattern. Undigested plasmid DNA and DNA restricted with Hind III and Pst I was analysed by gelelectrophoresis.
To confirm that this plasmid is responsible for the degradation of RDX in these clones, all
plasmids were re-transformed into strain CW25, and the resulting transformants assayed on RDX
zone of clearance plates. All four plasmids produced transformants which could produce zones of
clearance. The plasmid from clone 1 was selected and named pHSX1.
5.3.5 Growth of strain CW25(pHSX1) on RDX
The ability of Rhodococcus rhodochrous strain CW25 carrying pHSX1 (CW25(pHSX1)) to
degrade RDX was compared to that of strain 11Y. Both strains were grown from starter cultures in
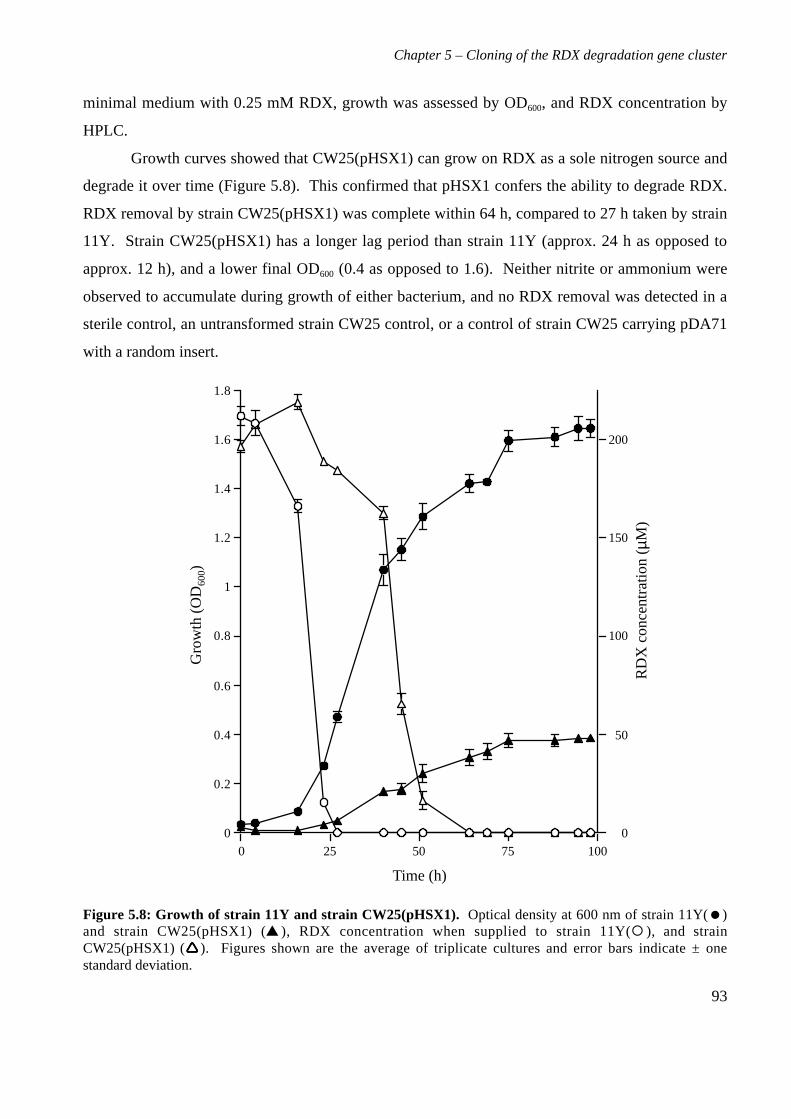
Chapter 5 – Cloning of the RDX degradation gene cluster
93
minimal medium with 0.25 mM RDX, growth was assessed by OD600, and RDX concentration by
HPLC.
Growth curves showed that CW25(pHSX1) can grow on RDX as a sole nitrogen source and
degrade it over time (Figure 5.8). This confirmed that pHSX1 confers the ability to degrade RDX.
RDX removal by strain CW25(pHSX1) was complete within 64 h, compared to 27 h taken by strain
11Y. Strain CW25(pHSX1) has a longer lag period than strain 11Y (approx. 24 h as opposed to
approx. 12 h), and a lower final OD600 (0.4 as opposed to 1.6). Neither nitrite or ammonium were
observed to accumulate during growth of either bacterium, and no RDX removal was detected in a
sterile control, an untransformed strain CW25 control, or a control of strain CW25 carrying pDA71
with a random insert.
0
50
100
150
200
0
0.2
0.4
0.6
0.8
1
1.2
1.4
1.6
1.8
0 25 50 75 100
Time (h)
Gro
wth
(O
D 600
)
RD
X c
once
ntra
tion
(µM)
Figure 5.8: Growth of strain 11Y and strain CW25(pHSX1). Optical density at 600 nm of strain 11Y()and strain CW25(pHSX1) ( ), RDX concentration when supplied to strain 11Y( ), and strainCW25(pHSX1) (). Figures shown are the average of triplicate cultures and error bars indicate ± onestandard deviation.
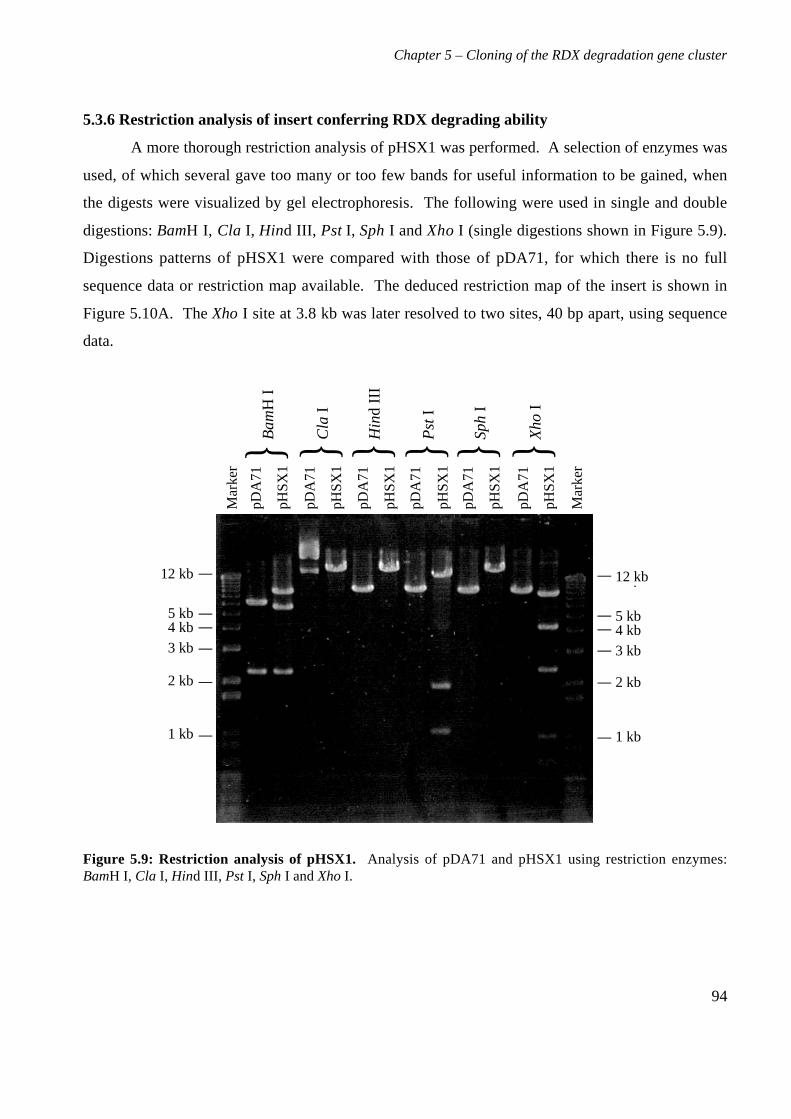
Chapter 5 – Cloning of the RDX degradation gene cluster
94
5.3.6 Restriction analysis of insert conferring RDX degrading ability
A more thorough restriction analysis of pHSX1 was performed. A selection of enzymes was
used, of which several gave too many or too few bands for useful information to be gained, when
the digests were visualized by gel electrophoresis. The following were used in single and double
digestions: BamH I, Cla I, Hind III, Pst I, Sph I and Xho I (single digestions shown in Figure 5.9).
Digestions patterns of pHSX1 were compared with those of pDA71, for which there is no full
sequence data or restriction map available. The deduced restriction map of the insert is shown in
Figure 5.10A. The Xho I site at 3.8 kb was later resolved to two sites, 40 bp apart, using sequence
data.
2 kb
3 kb4 kb
12 kb_
__
_
_
1 kb
_ 5 kb
2 kb
3 kb4 kb
12 kb_
__
_
_
1 kb
_5 kb
Ba
mH
I
Mar
ker
Mar
ker
pHS
X1
pDA
71
pDA
71
pDA
71
pDA
71
pDA
71
pDA
71
pHS
X1
pHS
X1
pHS
X1
pHS
X1
pHS
X1
Cla
I
Hin
d III
Pst
I
Sp
h I
Xh
o I
Figure 5.9: Restriction analysis of pHSX1. Analysis of pDA71 and pHSX1 using restriction enzymes:BamH I, Cla I, Hind III, Pst I, Sph I and Xho I.
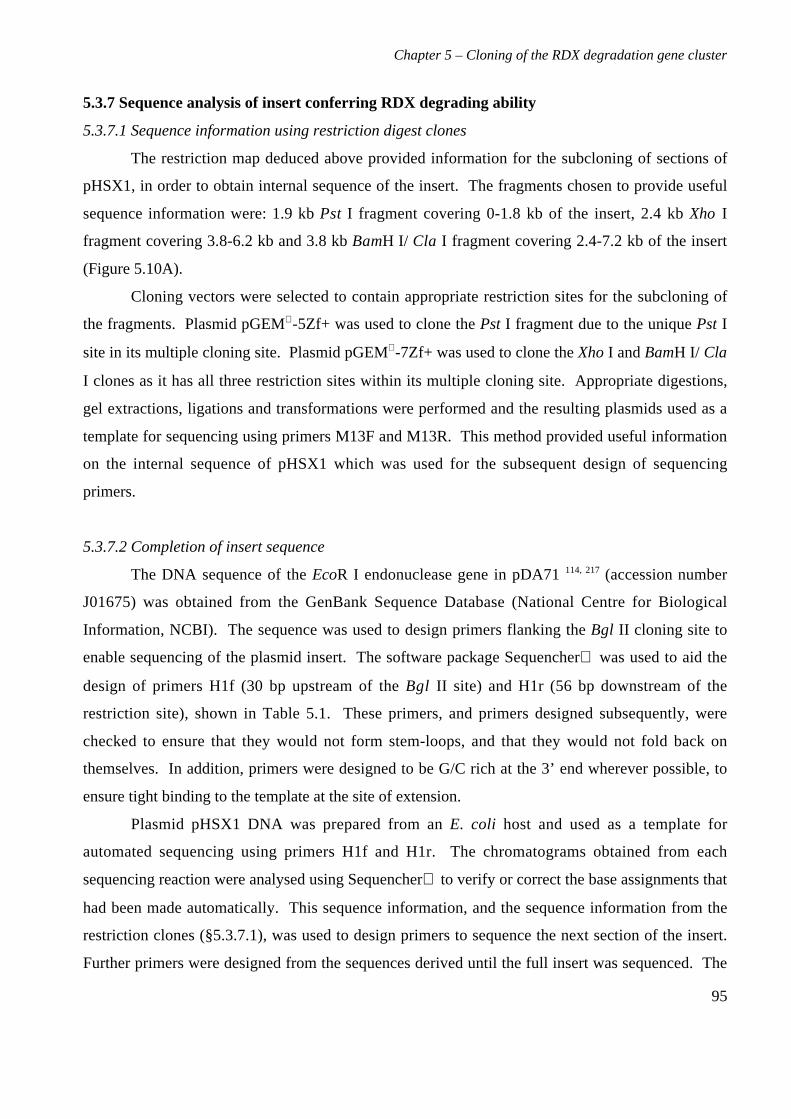
Chapter 5 – Cloning of the RDX degradation gene cluster
95
5.3.7 Sequence analysis of insert conferring RDX degrading ability
5.3.7.1 Sequence information using restriction digest clones
The restriction map deduced above provided information for the subcloning of sections of
pHSX1, in order to obtain internal sequence of the insert. The fragments chosen to provide useful
sequence information were: 1.9 kb Pst I fragment covering 0-1.8 kb of the insert, 2.4 kb Xho I
fragment covering 3.8-6.2 kb and 3.8 kb BamH I/ Cla I fragment covering 2.4-7.2 kb of the insert
(Figure 5.10A).
Cloning vectors were selected to contain appropriate restriction sites for the subcloning of
the fragments. Plasmid pGEM -5Zf+ was used to clone the Pst I fragment due to the unique Pst I
site in its multiple cloning site. Plasmid pGEM -7Zf+ was used to clone the Xho I and BamH I/ Cla
I clones as it has all three restriction sites within its multiple cloning site. Appropriate digestions,
gel extractions, ligations and transformations were performed and the resulting plasmids used as a
template for sequencing using primers M13F and M13R. This method provided useful information
on the internal sequence of pHSX1 which was used for the subsequent design of sequencing
primers.
5.3.7.2 Completion of insert sequence
The DNA sequence of the EcoR I endonuclease gene in pDA71 114, 217 (accession number
J01675) was obtained from the GenBank Sequence Database (National Centre for Biological
Information, NCBI). The sequence was used to design primers flanking the Bgl II cloning site to
enable sequencing of the plasmid insert. The software package Sequencher was used to aid the
design of primers H1f (30 bp upstream of the Bgl II site) and H1r (56 bp downstream of the
restriction site), shown in Table 5.1. These primers, and primers designed subsequently, were
checked to ensure that they would not form stem-loops, and that they would not fold back on
themselves. In addition, primers were designed to be G/C rich at the 3’ end wherever possible, to
ensure tight binding to the template at the site of extension.
Plasmid pHSX1 DNA was prepared from an E. coli host and used as a template for
automated sequencing using primers H1f and H1r. The chromatograms obtained from each
sequencing reaction were analysed using Sequencher to verify or correct the base assignments that
had been made automatically. This sequence information, and the sequence information from the
restriction clones (§5.3.7.1), was used to design primers to sequence the next section of the insert.
Further primers were designed from the sequences derived until the full insert was sequenced. The
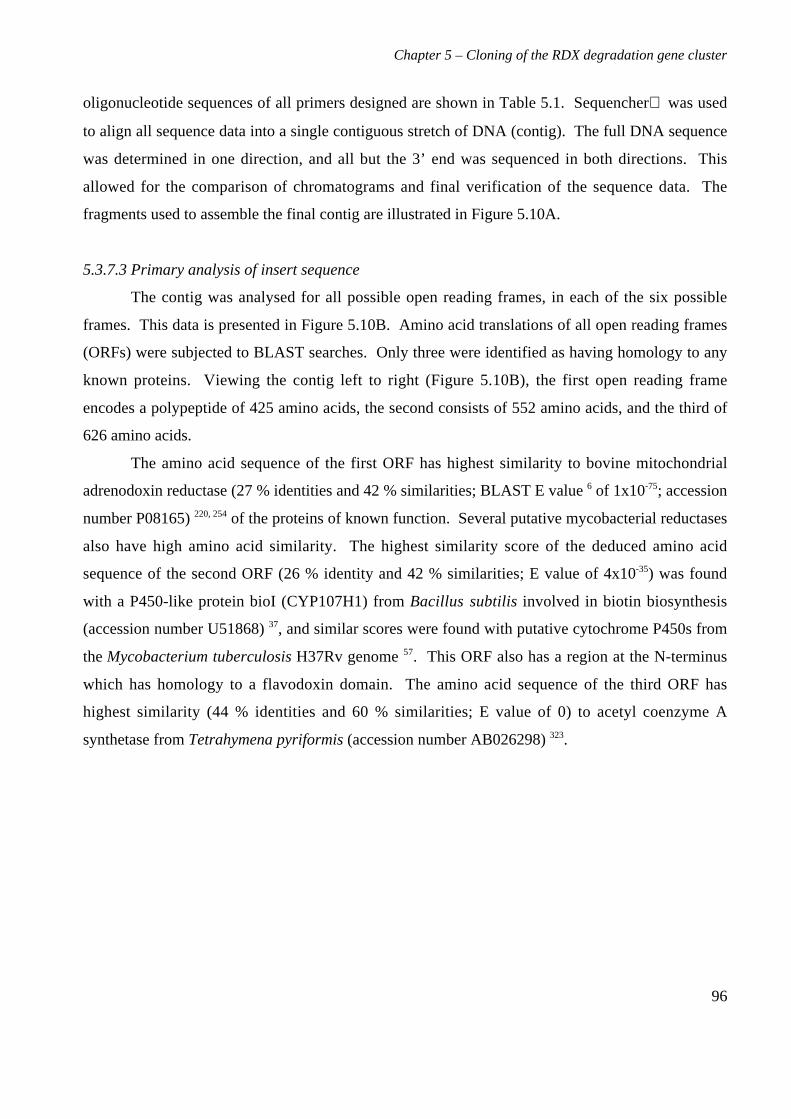
Chapter 5 – Cloning of the RDX degradation gene cluster
96
oligonucleotide sequences of all primers designed are shown in Table 5.1. Sequencher was used
to align all sequence data into a single contiguous stretch of DNA (contig). The full DNA sequence
was determined in one direction, and all but the 3’ end was sequenced in both directions. This
allowed for the comparison of chromatograms and final verification of the sequence data. The
fragments used to assemble the final contig are illustrated in Figure 5.10A.
5.3.7.3 Primary analysis of insert sequence
The contig was analysed for all possible open reading frames, in each of the six possible
frames. This data is presented in Figure 5.10B. Amino acid translations of all open reading frames
(ORFs) were subjected to BLAST searches. Only three were identified as having homology to any
known proteins. Viewing the contig left to right (Figure 5.10B), the first open reading frame
encodes a polypeptide of 425 amino acids, the second consists of 552 amino acids, and the third of
626 amino acids.
The amino acid sequence of the first ORF has highest similarity to bovine mitochondrial
adrenodoxin reductase (27 % identities and 42 % similarities; BLAST E value 6 of 1x10-75; accession
number P08165) 220, 254 of the proteins of known function. Several putative mycobacterial reductases
also have high amino acid similarity. The highest similarity score of the deduced amino acid
sequence of the second ORF (26 % identity and 42 % similarities; E value of 4x10-35) was found
with a P450-like protein bioI (CYP107H1) from Bacillus subtilis involved in biotin biosynthesis
(accession number U51868) 37, and similar scores were found with putative cytochrome P450s from
the Mycobacterium tuberculosis H37Rv genome 57. This ORF also has a region at the N-terminus
which has homology to a flavodoxin domain. The amino acid sequence of the third ORF has
highest similarity (44 % identities and 60 % similarities; E value of 0) to acetyl coenzyme A
synthetase from Tetrahymena pyriformis (accession number AB026298) 323.
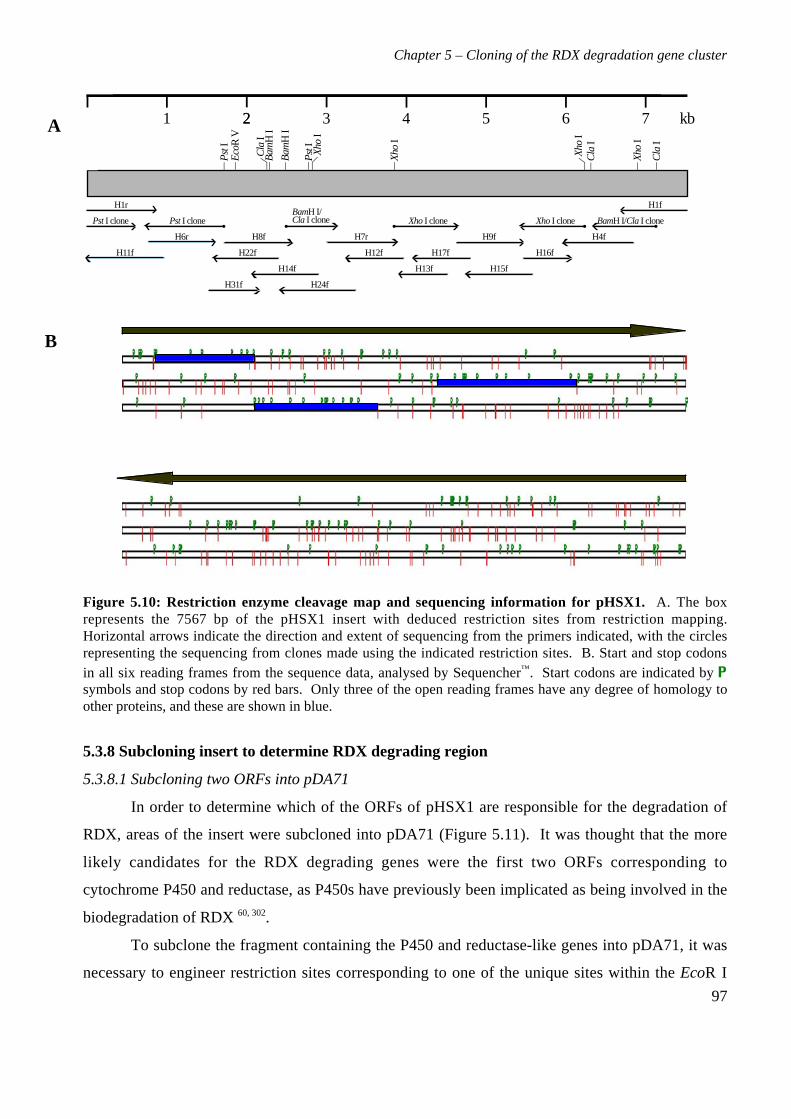
Chapter 5 – Cloning of the RDX degradation gene cluster
97
1 2 32 4 5 6 70 kb
Pst
I
Pst
I
Eco
R V
Bam
H I
Bam
H I
Cla
I
Cla
I
Cla
I
Xho
I
Xho
I
Xho
I
Xho
I
H1r H1fBamH I/Cla I clonePst I clone
H6r
H11f
H8f H7r H9f H4f
H12f
H13fH14f H15f
H16fH17fH22f
H24fH31f
Pst I clone BamH I/Cla I cloneXho I clone Xho I clone
Figure 5.10: Restriction enzyme cleavage map and sequencing information for pHSX1. A. The boxrepresents the 7567 bp of the pHSX1 insert with deduced restriction sites from restriction mapping.Horizontal arrows indicate the direction and extent of sequencing from the primers indicated, with the circlesrepresenting the sequencing from clones made using the indicated restriction sites. B. Start and stop codonsin all six reading frames from the sequence data, analysed by Sequencher™. Start codons are indicated by Psymbols and stop codons by red bars. Only three of the open reading frames have any degree of homology toother proteins, and these are shown in blue.
5.3.8 Subcloning insert to determine RDX degrading region
5.3.8.1 Subcloning two ORFs into pDA71
In order to determine which of the ORFs of pHSX1 are responsible for the degradation of
RDX, areas of the insert were subcloned into pDA71 (Figure 5.11). It was thought that the more
likely candidates for the RDX degrading genes were the first two ORFs corresponding to
cytochrome P450 and reductase, as P450s have previously been implicated as being involved in the
biodegradation of RDX 60, 302.
To subclone the fragment containing the P450 and reductase-like genes into pDA71, it was
necessary to engineer restriction sites corresponding to one of the unique sites within the EcoR I
A
B

Chapter 5 – Cloning of the RDX degradation gene cluster
98
endonuclease gene into the sequence. Sequence data of the relevant section was analysed for
restriction sites and it was found that this region contains recognition sites for both Pst I and Bgl II.
Neither of these enzymes could be used, as digestion with either would fragment the insert region.
Therefore Hind III sites were engineered at either end of the insert for use with the Hind III cloning
site within pDA71. As the promoter regions of these genes are unknown, the full region upstream of
the genes within pHSX1 was maintained in the subclone.
PCR primers were designed to amplify the required sections of the insert, from the beginning
of the existing insert in pHSX1, 426 bp upstream of the first ORF, to the transcription termination
site of the second. Hind III restriction sites were engineered within the primers such that PCR
products created using these primers could be restricted using Hind III, creating overhangs
compatible with Hind III-digested pDA71. The primers were designated H26r and H30f (Table
5.2). The PCR product resulting from this reaction was cloned into the Hind III site of pDA71 as
described to create pHSX1a. This construct was transformed into strain CW25 using the PEG-
mediated protoplast method.
Transformants of strain CW25 containing pHSX1a were screened on zone of clearing plates
for RDX degrading activity. All transformants had the ability to form zones of clearance, indicating
that it is the cytochrome P450 and reductase-like genes which confer this ability, and that the acetyl
CoA synthase gene is not involved.
5.3.8.2 Subcloning one ORF into pDA71
A further subcloning experiment was performed to see if the reductase-like gene is required
for the activity, or if the P450-like gene is the unique component. As before, as much of the
upstream sequence was maintained as possible. Therefore a primer was designed to be
complementary to a region 697 bp upstream of the P450-like gene ATG start codon. Although the
3’ end of the reductase-like gene is present, only the P450-like gene should be expressed from this
fragment. This primer had a Hind III site engineered into it as before, and was designated H37f
(Table 5.2). A PCR product was obtained using primers H37f and H26r, and cloning was performed
as above.
The plasmid resulting from the cloning of this PCR product into pDA71 was designated
pHSX1b, and gave a zone of clearance when present in host strain CW25. This indicates that it is
the expression of the P450-like gene which is responsible for the ability of strain 11Y to degrade
RDX, and that strain CW25 is able to provide any other components required for activity.
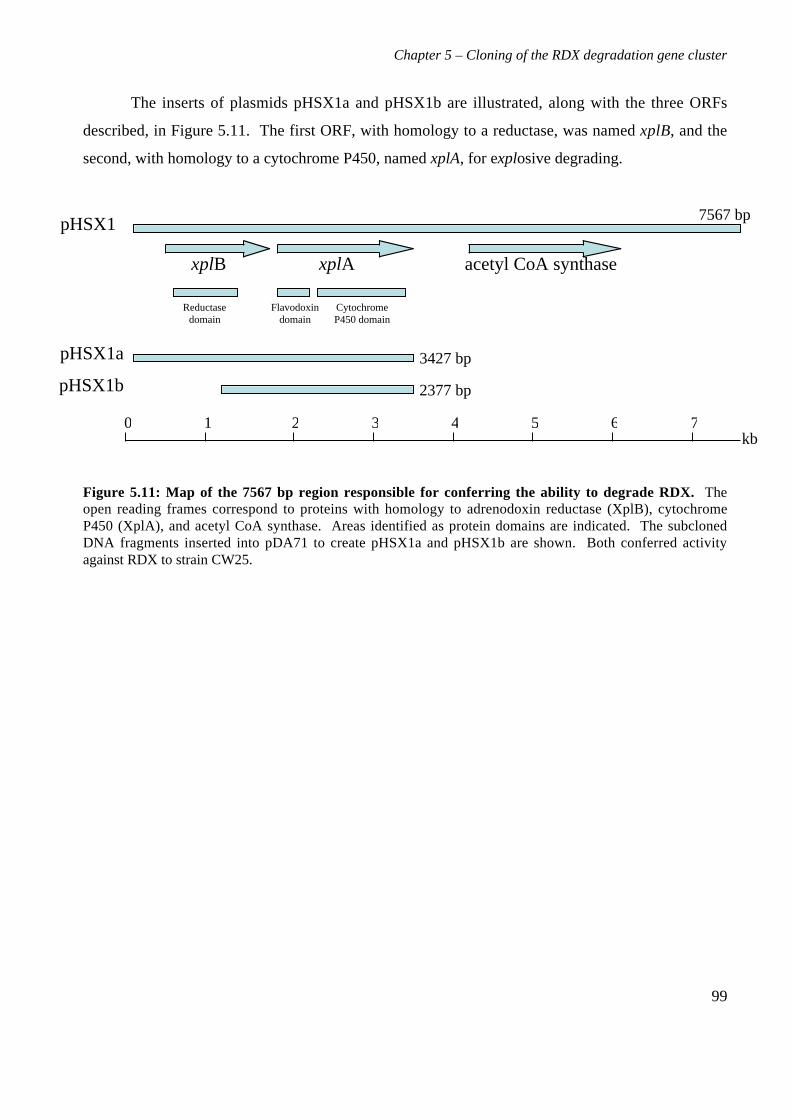
Chapter 5 – Cloning of the RDX degradation gene cluster
99
The inserts of plasmids pHSX1a and pHSX1b are illustrated, along with the three ORFs
described, in Figure 5.11. The first ORF, with homology to a reductase, was named xplB, and the
second, with homology to a cytochrome P450, named xplA, for explosive degrading.
Figure 5.11: Map of the 7567 bp region responsible for conferring the ability to degrade RDX. Theopen reading frames correspond to proteins with homology to adrenodoxin reductase (XplB), cytochromeP450 (XplA), and acetyl CoA synthase. Areas identified as protein domains are indicated. The subclonedDNA fragments inserted into pDA71 to create pHSX1a and pHSX1b are shown. Both conferred activityagainst RDX to strain CW25.
xplB xplA acetyl CoA synthase
7567 bp
pHSX1a
pHSX1b
pHSX1
2377 bp
3427 bp
Flavodoxindomain
CytochromeP450 domain
Reductasedomain
1 2 3kb
4 5 6 70
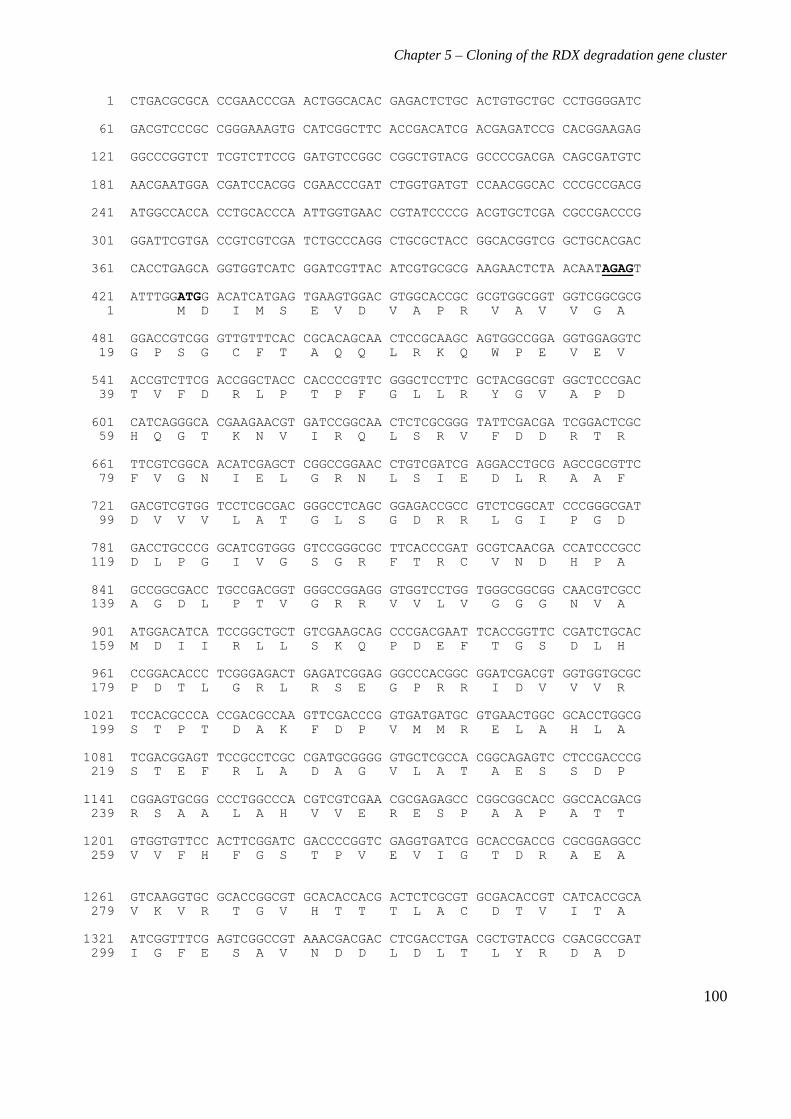
Chapter 5 – Cloning of the RDX degradation gene cluster
100
1 CTGACGCGCA CCGAACCCGA ACTGGCACAC GAGACTCTGC ACTGTGCTGC CCTGGGGATC
61 GACGTCCCGC CGGGAAAGTG CATCGGCTTC ACCGACATCG ACGAGATCCG CACGGAAGAG
121 GGCCCGGTCT TCGTCTTCCG GATGTCCGGC CGGCTGTACG GCCCCGACGA CAGCGATGTC
181 AACGAATGGA CGATCCACGG CGAACCCGAT CTGGTGATGT CCAACGGCAC CCCGCCGACG
241 ATGGCCACCA CCTGCACCCA ATTGGTGAAC CGTATCCCCG ACGTGCTCGA CGCCGACCCG
301 GGATTCGTGA CCGTCGTCGA TCTGCCCAGG CTGCGCTACC GGCACGGTCG GCTGCACGAC
361 CACCTGAGCA GGTGGTCATC GGATCGTTAC ATCGTGCGCG AAGAACTCTA ACAATAGAGT
421 ATTTGGATGG ACATCATGAG TGAAGTGGAC GTGGCACCGC GCGTGGCGGT GGTCGGCGCG 1 M D I M S E V D V A P R V A V V G A
481 GGACCGTCGG GTTGTTTCAC CGCACAGCAA CTCCGCAAGC AGTGGCCGGA GGTGGAGGTC 19 G P S G C F T A Q Q L R K Q W P E V E V
541 ACCGTCTTCG ACCGGCTACC CACCCCGTTC GGGCTCCTTC GCTACGGCGT GGCTCCCGAC 39 T V F D R L P T P F G L L R Y G V A P D
601 CATCAGGGCA CGAAGAACGT GATCCGGCAA CTCTCGCGGG TATTCGACGA TCGGACTCGC 59 H Q G T K N V I R Q L S R V F D D R T R
661 TTCGTCGGCA ACATCGAGCT CGGCCGGAAC CTGTCGATCG AGGACCTGCG AGCCGCGTTC 79 F V G N I E L G R N L S I E D L R A A F
721 GACGTCGTGG TCCTCGCGAC GGGCCTCAGC GGAGACCGCC GTCTCGGCAT CCCGGGCGAT 99 D V V V L A T G L S G D R R L G I P G D
781 GACCTGCCCG GCATCGTGGG GTCCGGGCGC TTCACCCGAT GCGTCAACGA CCATCCCGCC 119 D L P G I V G S G R F T R C V N D H P A
841 GCCGGCGACC TGCCGACGGT GGGCCGGAGG GTGGTCCTGG TGGGCGGCGG CAACGTCGCC 139 A G D L P T V G R R V V L V G G G N V A
901 ATGGACATCA TCCGGCTGCT GTCGAAGCAG CCCGACGAAT TCACCGGTTC CGATCTGCAC 159 M D I I R L L S K Q P D E F T G S D L H
961 CCGGACACCC TCGGGAGACT GAGATCGGAG GGCCCACGGC GGATCGACGT GGTGGTGCGC 179 P D T L G R L R S E G P R R I D V V V R
1021 TCCACGCCCA CCGACGCCAA GTTCGACCCG GTGATGATGC GTGAACTGGC GCACCTGGCG 199 S T P T D A K F D P V M M R E L A H L A
1081 TCGACGGAGT TCCGCCTCGC CGATGCGGGG GTGCTCGCCA CGGCAGAGTC CTCCGACCCG 219 S T E F R L A D A G V L A T A E S S D P
1141 CGGAGTGCGG CCCTGGCCCA CGTCGTCGAA CGCGAGAGCC CGGCGGCACC GGCCACGACG 239 R S A A L A H V V E R E S P A A P A T T
1201 GTGGTGTTCC ACTTCGGATC GACCCCGGTC GAGGTGATCG GCACCGACCG CGCGGAGGCC 259 V V F H F G S T P V E V I G T D R A E A
1261 GTCAAGGTGC GCACCGGCGT GCACACCACG ACTCTCGCGT GCGACACCGT CATCACCGCA 279 V K V R T G V H T T T L A C D T V I T A
1321 ATCGGTTTCG AGTCGGCCGT AAACGACGAC CTCGACCTGA CGCTGTACCG CGACGCCGAT 299 I G F E S A V N D D L D L T L Y R D A D
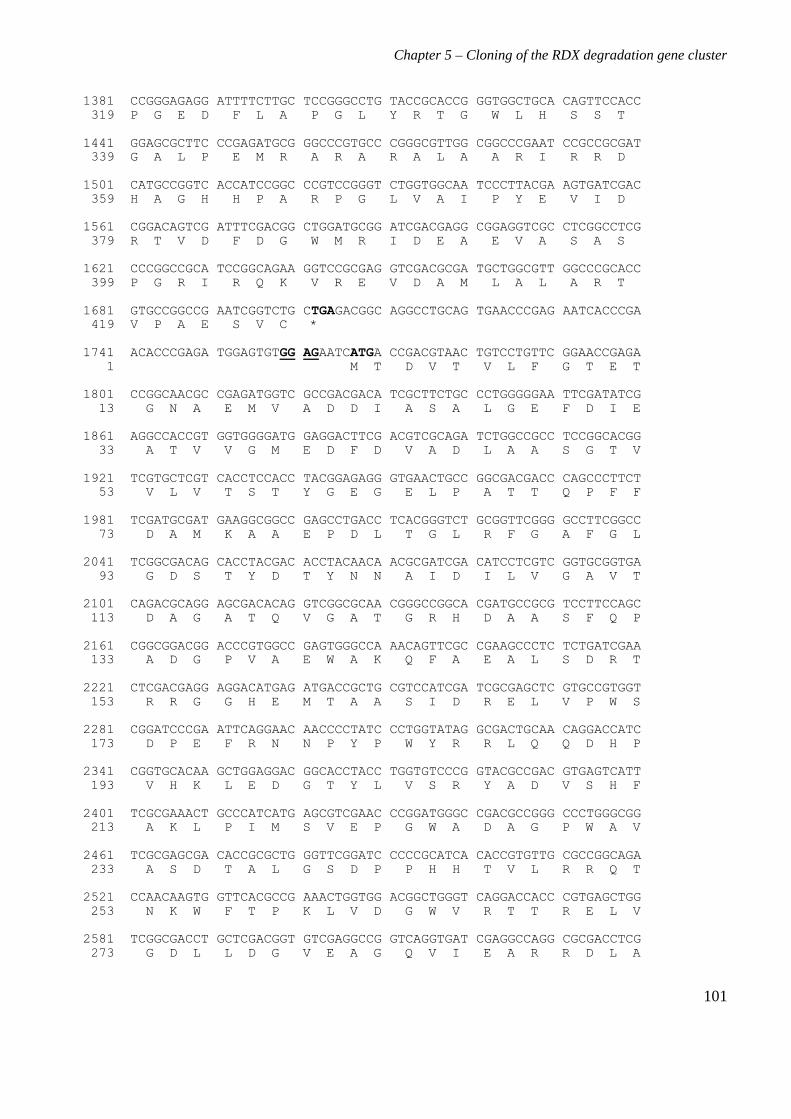
Chapter 5 – Cloning of the RDX degradation gene cluster
101
1381 CCGGGAGAGG ATTTTCTTGC TCCGGGCCTG TACCGCACCG GGTGGCTGCA CAGTTCCACC 319 P G E D F L A P G L Y R T G W L H S S T
1441 GGAGCGCTTC CCGAGATGCG GGCCCGTGCC CGGGCGTTGG CGGCCCGAAT CCGCCGCGAT 339 G A L P E M R A R A R A L A A R I R R D
1501 CATGCCGGTC ACCATCCGGC CCGTCCGGGT CTGGTGGCAA TCCCTTACGA AGTGATCGAC 359 H A G H H P A R P G L V A I P Y E V I D
1561 CGGACAGTCG ATTTCGACGG CTGGATGCGG ATCGACGAGG CGGAGGTCGC CTCGGCCTCG 379 R T V D F D G W M R I D E A E V A S A S
1621 CCCGGCCGCA TCCGGCAGAA GGTCCGCGAG GTCGACGCGA TGCTGGCGTT GGCCCGCACC 399 P G R I R Q K V R E V D A M L A L A R T
1681 GTGCCGGCCG AATCGGTCTG CTGAGACGGC AGGCCTGCAG TGAACCCGAG AATCACCCGA 419 V P A E S V C *
1741 ACACCCGAGA TGGAGTGTGG AGAATCATGA CCGACGTAAC TGTCCTGTTC GGAACCGAGA 1 M T D V T V L F G T E T
1801 CCGGCAACGC CGAGATGGTC GCCGACGACA TCGCTTCTGC CCTGGGGGAA TTCGATATCG 13 G N A E M V A D D I A S A L G E F D I E
1861 AGGCCACCGT GGTGGGGATG GAGGACTTCG ACGTCGCAGA TCTGGCCGCC TCCGGCACGG 33 A T V V G M E D F D V A D L A A S G T V
1921 TCGTGCTCGT CACCTCCACC TACGGAGAGG GTGAACTGCC GGCGACGACC CAGCCCTTCT 53 V L V T S T Y G E G E L P A T T Q P F F
1981 TCGATGCGAT GAAGGCGGCC GAGCCTGACC TCACGGGTCT GCGGTTCGGG GCCTTCGGCC 73 D A M K A A E P D L T G L R F G A F G L
2041 TCGGCGACAG CACCTACGAC ACCTACAACA ACGCGATCGA CATCCTCGTC GGTGCGGTGA 93 G D S T Y D T Y N N A I D I L V G A V T
2101 CAGACGCAGG AGCGACACAG GTCGGCGCAA CGGGCCGGCA CGATGCCGCG TCCTTCCAGC 113 D A G A T Q V G A T G R H D A A S F Q P
2161 CGGCGGACGG ACCCGTGGCC GAGTGGGCCA AACAGTTCGC CGAAGCCCTC TCTGATCGAA 133 A D G P V A E W A K Q F A E A L S D R T
2221 CTCGACGAGG AGGACATGAG ATGACCGCTG CGTCCATCGA TCGCGAGCTC GTGCCGTGGT 153 R R G G H E M T A A S I D R E L V P W S
2281 CGGATCCCGA ATTCAGGAAC AACCCCTATC CCTGGTATAG GCGACTGCAA CAGGACCATC 173 D P E F R N N P Y P W Y R R L Q Q D H P
2341 CGGTGCACAA GCTGGAGGAC GGCACCTACC TGGTGTCCCG GTACGCCGAC GTGAGTCATT 193 V H K L E D G T Y L V S R Y A D V S H F
2401 TCGCGAAACT GCCCATCATG AGCGTCGAAC CCGGATGGGC CGACGCCGGG CCCTGGGCGG 213 A K L P I M S V E P G W A D A G P W A V
2461 TCGCGAGCGA CACCGCGCTG GGTTCGGATC CCCCGCATCA CACCGTGTTG CGCCGGCAGA 233 A S D T A L G S D P P H H T V L R R Q T
2521 CCAACAAGTG GTTCACGCCG AAACTGGTGG ACGGCTGGGT CAGGACCACC CGTGAGCTGG 253 N K W F T P K L V D G W V R T T R E L V
2581 TCGGCGACCT GCTCGACGGT GTCGAGGCCG GTCAGGTGAT CGAGGCCAGG CGCGACCTCG 273 G D L L D G V E A G Q V I E A R R D L A
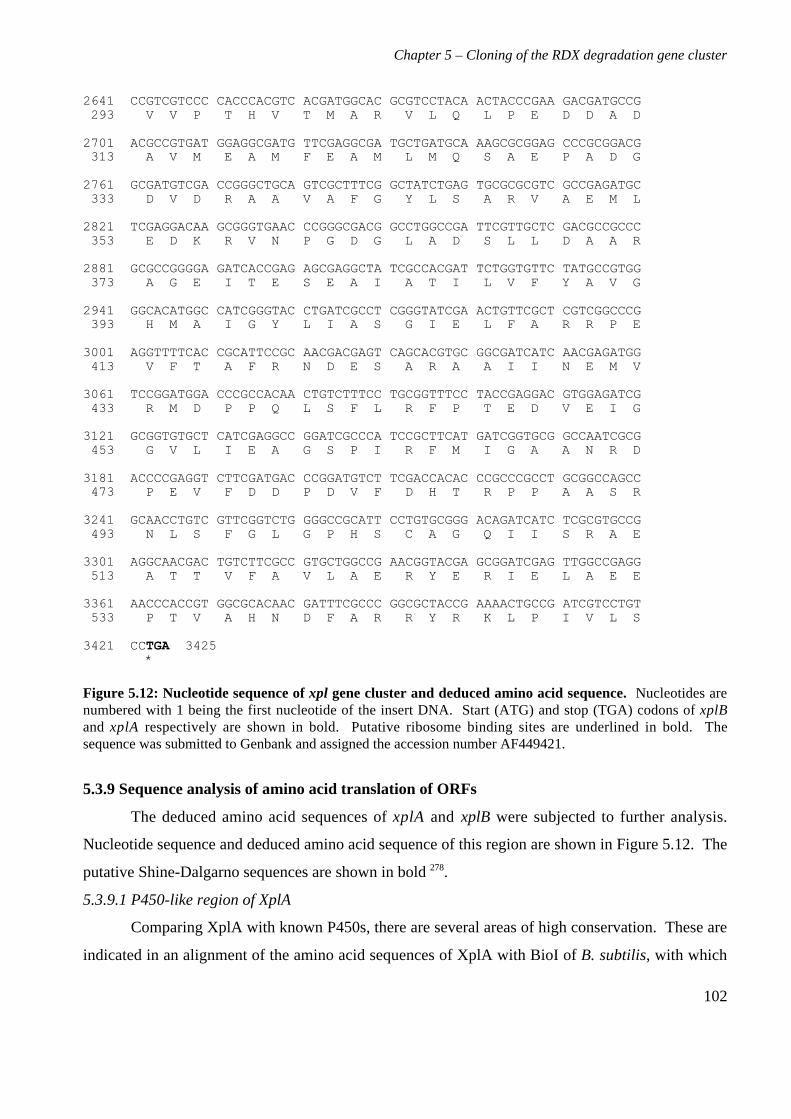
Chapter 5 – Cloning of the RDX degradation gene cluster
102
2641 CCGTCGTCCC CACCCACGTC ACGATGGCAC GCGTCCTACA ACTACCCGAA GACGATGCCG 293 V V P T H V T M A R V L Q L P E D D A D
2701 ACGCCGTGAT GGAGGCGATG TTCGAGGCGA TGCTGATGCA AAGCGCGGAG CCCGCGGACG 313 A V M E A M F E A M L M Q S A E P A D G
2761 GCGATGTCGA CCGGGCTGCA GTCGCTTTCG GCTATCTGAG TGCGCGCGTC GCCGAGATGC 333 D V D R A A V A F G Y L S A R V A E M L
2821 TCGAGGACAA GCGGGTGAAC CCGGGCGACG GCCTGGCCGA TTCGTTGCTC GACGCCGCCC 353 E D K R V N P G D G L A D S L L D A A R
2881 GCGCCGGGGA GATCACCGAG AGCGAGGCTA TCGCCACGAT TCTGGTGTTC TATGCCGTGG 373 A G E I T E S E A I A T I L V F Y A V G
2941 GGCACATGGC CATCGGGTAC CTGATCGCCT CGGGTATCGA ACTGTTCGCT CGTCGGCCCG 393 H M A I G Y L I A S G I E L F A R R P E
3001 AGGTTTTCAC CGCATTCCGC AACGACGAGT CAGCACGTGC GGCGATCATC AACGAGATGG 413 V F T A F R N D E S A R A A I I N E M V
3061 TCCGGATGGA CCCGCCACAA CTGTCTTTCC TGCGGTTTCC TACCGAGGAC GTGGAGATCG 433 R M D P P Q L S F L R F P T E D V E I G
3121 GCGGTGTGCT CATCGAGGCC GGATCGCCCA TCCGCTTCAT GATCGGTGCG GCCAATCGCG 453 G V L I E A G S P I R F M I G A A N R D
3181 ACCCCGAGGT CTTCGATGAC CCGGATGTCT TCGACCACAC CCGCCCGCCT GCGGCCAGCC 473 P E V F D D P D V F D H T R P P A A S R
3241 GCAACCTGTC GTTCGGTCTG GGGCCGCATT CCTGTGCGGG ACAGATCATC TCGCGTGCCG 493 N L S F G L G P H S C A G Q I I S R A E
3301 AGGCAACGAC TGTCTTCGCC GTGCTGGCCG AACGGTACGA GCGGATCGAG TTGGCCGAGG 513 A T T V F A V L A E R Y E R I E L A E E
3361 AACCCACCGT GGCGCACAAC GATTTCGCCC GGCGCTACCG AAAACTGCCG ATCGTCCTGT 533 P T V A H N D F A R R Y R K L P I V L S
3421 CCTGA 3425 *
Figure 5.12: Nucleotide sequence of xpl gene cluster and deduced amino acid sequence. Nucleotides arenumbered with 1 being the first nucleotide of the insert DNA. Start (ATG) and stop (TGA) codons of xplBand xplA respectively are shown in bold. Putative ribosome binding sites are underlined in bold. Thesequence was submitted to Genbank and assigned the accession number AF449421.
5.3.9 Sequence analysis of amino acid translation of ORFs
The deduced amino acid sequences of xplA and xplB were subjected to further analysis.
Nucleotide sequence and deduced amino acid sequence of this region are shown in Figure 5.12. The
putative Shine-Dalgarno sequences are shown in bold 278.
5.3.9.1 P450-like region of XplA
Comparing XplA with known P450s, there are several areas of high conservation. These are
indicated in an alignment of the amino acid sequences of XplA with BioI of B. subtilis, with which
Chapter 5 – Cloning of the RDX degradation gene cluster
103
it has most homology, and P450cam of P. putida, which is often used as a P450 paradigm, in Figure
5.13. Generally the C-termini of P450s are more highly conserved than the N-termini.
The haem binding region has the s ignature FXXGXXXCXG
(http://drnelson.utmem.edu/PIR.P450.description.html), which is more specifically described on the
PROSITE database (http://ca.expasy.org/prosite/ 149) as [FW]-[SGNH]-x-[GD]-x-[RKHPT]-x-C-
[LIVMFAP]-[GAD] (accession number PS00086). The haem binding region of XplA (residues
496-505) fulfils the requirements of both signatures. The cysteine residue within the signature is the
haem binding ligand 263 and is absolutely conserved. Arg-249, Glu-430, Arg-433 and Arg-443
(numbers refer to XplA) are also conserved 133, 223. The oxygen binding region consensus A-[AG]-x-
[ED]-T (http://drnelson.utmem.edu/PIR.P450.description.html), present in many cytochrome P450s,
is not complete in XplA. This region lines up with the residues V-G-H-M-A in XplA (residues 397-
401).
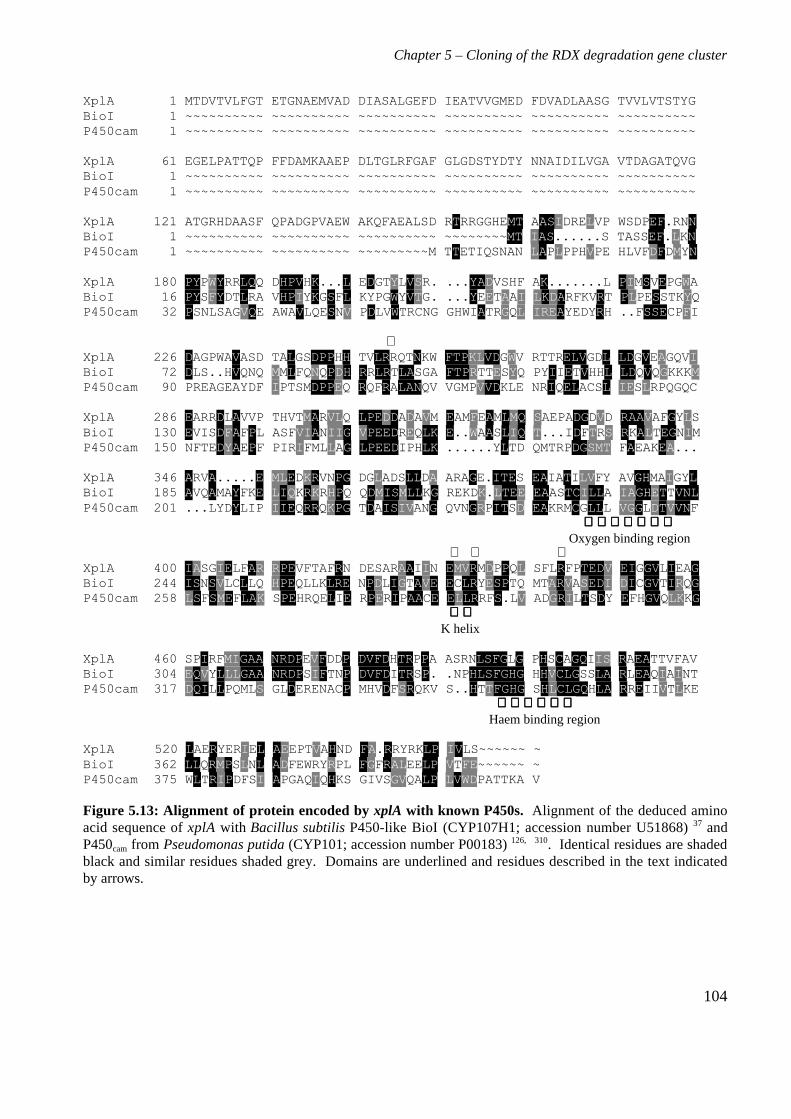
Chapter 5 – Cloning of the RDX degradation gene cluster
104
XplA 1 MTDVTVLFGT ETGNAEMVAD DIASALGEFD IEATVVGMED FDVADLAASG TVVLVTSTYGBioI 1 ~~~~~~~~~~ ~~~~~~~~~~ ~~~~~~~~~~ ~~~~~~~~~~ ~~~~~~~~~~ ~~~~~~~~~~P450cam 1 ~~~~~~~~~~ ~~~~~~~~~~ ~~~~~~~~~~ ~~~~~~~~~~ ~~~~~~~~~~ ~~~~~~~~~~
XplA 61 EGELPATTQP FFDAMKAAEP DLTGLRFGAF GLGDSTYDTY NNAIDILVGA VTDAGATQVGBioI 1 ~~~~~~~~~~ ~~~~~~~~~~ ~~~~~~~~~~ ~~~~~~~~~~ ~~~~~~~~~~ ~~~~~~~~~~P450cam 1 ~~~~~~~~~~ ~~~~~~~~~~ ~~~~~~~~~~ ~~~~~~~~~~ ~~~~~~~~~~ ~~~~~~~~~~
XplA 121 ATGRHDAASF QPADGPVAEW AKQFAEALSD RTRRGGHEMT AASIDRELVP WSDPEF.RNNBioI 1 ~~~~~~~~~~ ~~~~~~~~~~ ~~~~~~~~~~ ~~~~~~~~MT IAS......S TASSEF.LKNP450cam 1 ~~~~~~~~~~ ~~~~~~~~~~ ~~~~~~~~~M TTETIQSNAN LAPLPPHVPE HLVFDFDMYN
XplA 180 PYPWYRRLQQ DHPVHK...L EDGTYLVSR. ...YADVSHF AK.......L PIMSVEPGWABioI 16 PYSFYDTLRA VHPIYKGSFL KYPGWYVTG. ...YEETAAI LKDARFKVRT PLPESSTKYQP450cam 32 PSNLSAGVQE AWAVLQESNV PDLVWTRCNG GHWIATRGQL IREAYEDYRH ..FSSECPFI
⇓XplA 226 DAGPWAVASD TALGSDPPHH TVLRRQTNKW FTPKLVDGWV RTTRELVGDL LDGVEAGQVIBioI 72 DLS..HVQNQ MMLFQNQPDH RRLRTLASGA FTPRTTESYQ PYIIETVHHL LDQVQGKKKMP450cam 90 PREAGEAYDF IPTSMDPPEQ RQFRALANQV VGMPVVDKLE NRIQELACSL IESLRPQGQC
XplA 286 EARRDLAVVP THVTMARVLQ LPEDDADAVM EAMFEAMLMQ SAEPADGDVD RAAVAFGYLSBioI 130 EVISDFAFPL ASFVIANIIG VPEEDREQLK E..WAASLIQ T...IDFTRS RKALTEGNIMP450cam 150 NFTEDYAEPF PIRIFMLLAG LPEEDIPHLK ......YLTD QMTRPDGSMT FAEAKEA...
XplA 346 ARVA.....E MLEDKRVNPG DGLADSLLDA ARAGE.ITES EAIATILVFY AVGHMAIGYLBioI 185 AVQAMAYFKE LIQKRKRHPQ QDMISMLLKG REKDK.LTEE EAASTCILLA IAGHETTVNLP450cam 201 ...LYDYLIP IIEQRRQKPG TDAISIVANG QVNGRPITSD EAKRMCGLLL VGGLDTVVNF Oxygen binding region
⇓ ⇓ ⇓XplA 400 IASGIELFAR RPEVFTAFRN DESARAAIIN EMVRMDPPQL SFLRFPTEDV EIGGVLIEAGBioI 244 ISNSVLCLLQ HPEQLLKLRE NPDLIGTAVE ECLRYESPTQ MTARVASEDI DICGVTIRQGP450cam 258 LSFSMEFLAK SPEHRQELIE RPERIPAACE ELLRRFS.LV ADGRILTSDY EFHGVQLKKG K helix
XplA 460 SPIRFMIGAA NRDPEVFDDP DVFDHTRPPA ASRNLSFGLG PHSCAGQIIS RAEATTVFAVBioI 304 EQVYLLLGAA NRDPSIFTNP DVFDITRSP. .NPHLSFGHG HHVCLGSSLA RLEAQIAINTP450cam 317 DQILLPQMLS GLDERENACP MHVDFSRQKV S..HTTFGHG SHLCLGQHLA RREIIVTLKE Haem binding region
XplA 520 LAERYERIEL AEEPTVAHND FA.RRYRKLP IVLS~~~~~~ ~BioI 362 LLQRMPSLNL ADFEWRYRPL FGFRALEELP VTFE~~~~~~ ~P450cam 375 WLTRIPDFSI APGAQIQHKS GIVSGVQALP LVWDPATTKA V
Figure 5.13: Alignment of protein encoded by xplA with known P450s. Alignment of the deduced aminoacid sequence of xplA with Bacillus subtilis P450-like BioI (CYP107H1; accession number U51868) 37 andP450cam from Pseudomonas putida (CYP101; accession number P00183) 126, 310. Identical residues are shadedblack and similar residues shaded grey. Domains are underlined and residues described in the text indicatedby arrows.
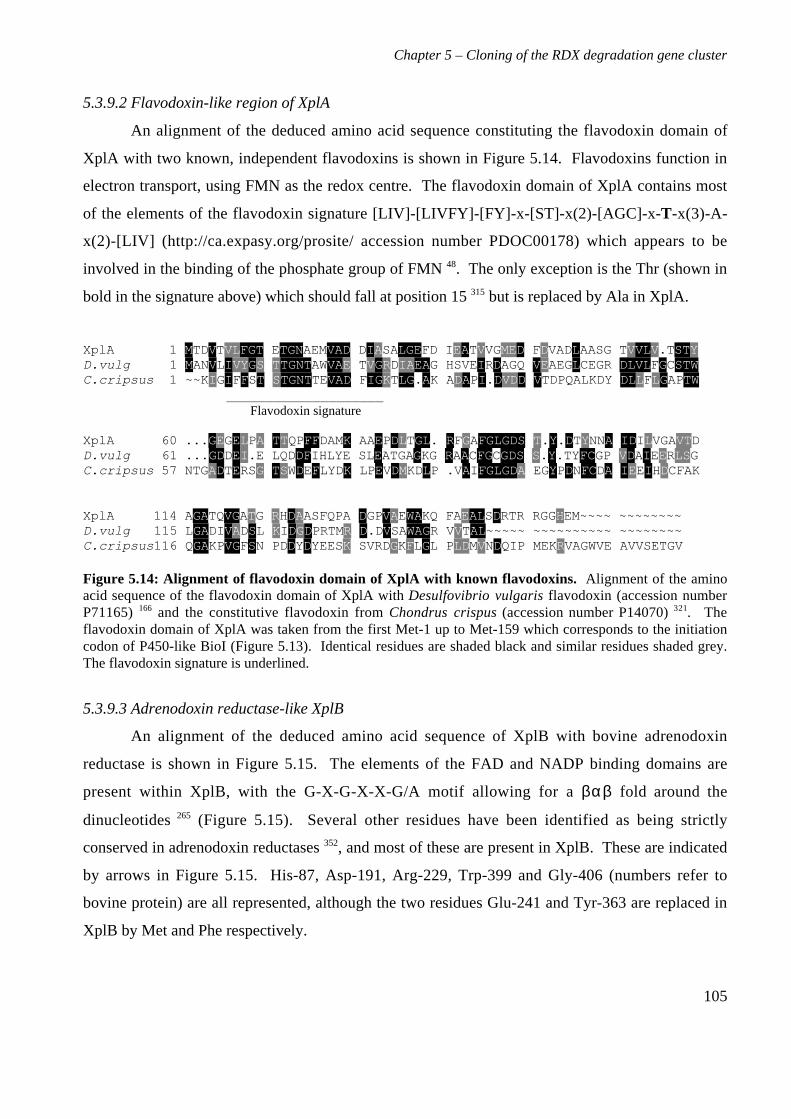
Chapter 5 – Cloning of the RDX degradation gene cluster
105
5.3.9.2 Flavodoxin-like region of XplA
An alignment of the deduced amino acid sequence constituting the flavodoxin domain of
XplA with two known, independent flavodoxins is shown in Figure 5.14. Flavodoxins function in
electron transport, using FMN as the redox centre. The flavodoxin domain of XplA contains most
of the elements of the flavodoxin signature [LIV]-[LIVFY]-[FY]-x-[ST]-x(2)-[AGC]-x-T-x(3)-A-
x(2)-[LIV] (http://ca.expasy.org/prosite/ accession number PDOC00178) which appears to be
involved in the binding of the phosphate group of FMN 48. The only exception is the Thr (shown in
bold in the signature above) which should fall at position 15 315 but is replaced by Ala in XplA.
XplA 1 MTDVTVLFGT ETGNAEMVAD DIASALGEFD IEATVVGMED FDVADLAASG TVVLV.TSTYD.vulg 1 MANVLIVYGS TTGNTAWVAE TVGRDIAEAG HSVEIRDAGQ VEAEGLCEGR DLVLFGCSTWC.cripsus 1 ~~KIGIFFST STGNTTEVAD FIGKTLG.AK ADAPI.DVDD VTDPQALKDY DLLFLGAPTW ____________________ Flavodoxin signature
XplA 60 ...GEGELPA TTQPFFDAMK AAEPDLTGL. RFGAFGLGDS T.Y.DTYNNA IDILVGAVTDD.vulg 61 ...GDDEI.E LQDDFIHLYE SLEATGAGKG RAACFGCGDS S.Y.TYFCGP VDAIEERLSGC.cripsus 57 NTGADTERSG TSWDEFLYDK LPEVDMKDLP .VAIFGLGDA EGYPDNFCDA IEEIHDCFAK
XplA 114 AGATQVGATG RHDAASFQPA DGPVAEWAKQ FAEALSDRTR RGGHEM~~~~ ~~~~~~~~D.vulg 115 LGADIVADSL KIDGDPRTMR D.DVSAWAGR VVTAL~~~~~ ~~~~~~~~~~ ~~~~~~~~C.cripsus116 QGAKPVGFSN PDDYDYEESK SVRDGKFLGL PLDMVNDQIP MEKRVAGWVE AVVSETGV
Figure 5.14: Alignment of flavodoxin domain of XplA with known flavodoxins. Alignment of the aminoacid sequence of the flavodoxin domain of XplA with Desulfovibrio vulgaris flavodoxin (accession numberP71165) 166 and the constitutive flavodoxin from Chondrus crispus (accession number P14070) 321. Theflavodoxin domain of XplA was taken from the first Met-1 up to Met-159 which corresponds to the initiationcodon of P450-like BioI (Figure 5.13). Identical residues are shaded black and similar residues shaded grey.The flavodoxin signature is underlined.
5.3.9.3 Adrenodoxin reductase-like XplB
An alignment of the deduced amino acid sequence of XplB with bovine adrenodoxin
reductase is shown in Figure 5.15. The elements of the FAD and NADP binding domains are
present within XplB, with the G-X-G-X-X-G/A motif allowing for a βαβ fold around the
dinucleotides 265 (Figure 5.15). Several other residues have been identified as being strictly
conserved in adrenodoxin reductases 352, and most of these are present in XplB. These are indicated
by arrows in Figure 5.15. His-87, Asp-191, Arg-229, Trp-399 and Gly-406 (numbers refer to
bovine protein) are all represented, although the two residues Glu-241 and Tyr-363 are replaced in
XplB by Met and Phe respectively.
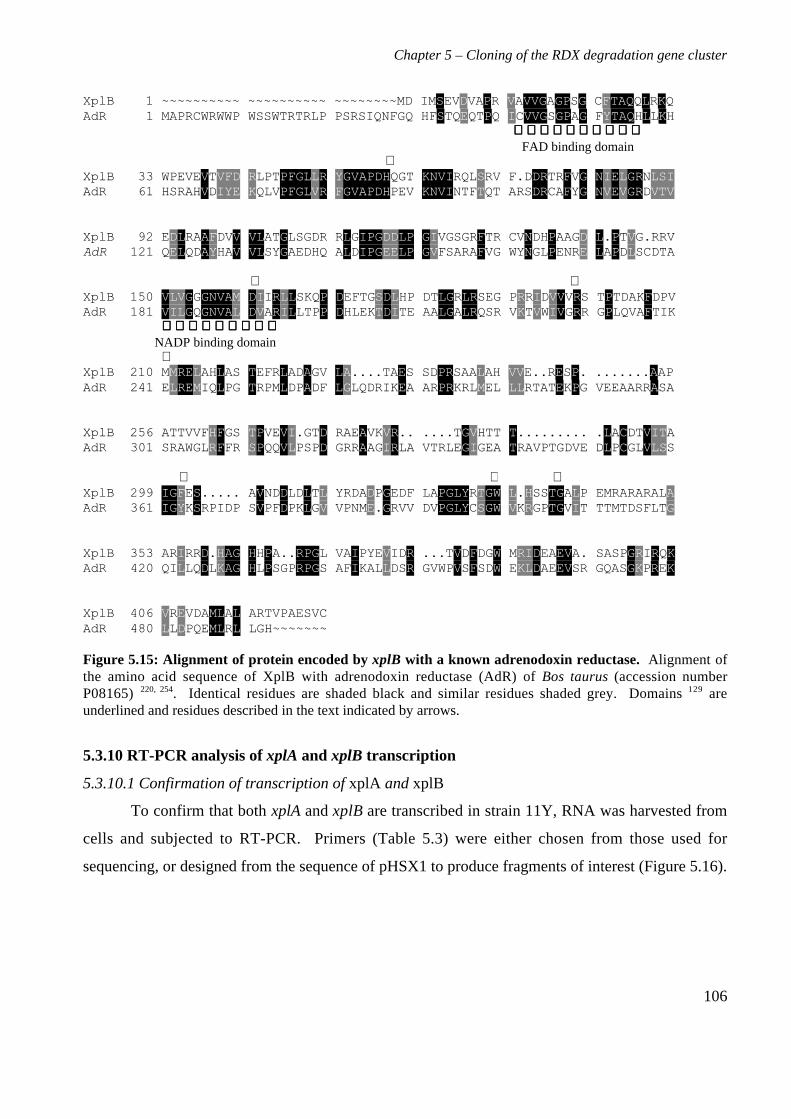
Chapter 5 – Cloning of the RDX degradation gene cluster
106
XplB 1 ~~~~~~~~~~ ~~~~~~~~~~ ~~~~~~~~MD IMSEVDVAPR VAVVGAGPSG CFTAQQLRKQAdR 1 MAPRCWRWWP WSSWTRTRLP PSRSIQNFGQ HFSTQEQTPQ ICVVGSGPAG FYTAQHLLKH
FAD binding domain ⇓XplB 33 WPEVEVTVFD RLPTPFGLLR YGVAPDHQGT KNVIRQLSRV F.DDRTRFVG NIELGRNLSIAdR 61 HSRAHVDIYE KQLVPFGLVR FGVAPDHPEV KNVINTFTQT ARSDRCAFYG NVEVGRDVTV XplB 92 EDLRAAFDVV VLATGLSGDR RLGIPGDDLP GIVGSGRFTR CVNDHPAAGD L.PTVG.RRVAdR 121 QELQDAYHAV VLSYGAEDHQ ALDIPGEELP GVFSARAFVG WYNGLPENRE LAPDLSCDTA ⇓ ⇓XplB 150 VLVGGGNVAM DIIRLLSKQP DEFTGSDLHP DTLGRLRSEG PRRIDVVVRS TPTDAKFDPVAdR 181 VILGQGNVAL DVARILLTPP DHLEKTDITE AALGALRQSR VKTVWIVGRR GPLQVAFTIK NADP binding domain ⇓XplB 210 MMRELAHLAS TEFRLADAGV LA....TAES SDPRSAALAH VVE..RESP. .......AAPAdR 241 ELREMIQLPG TRPMLDPADF LGLQDRIKEA ARPRKRLMEL LLRTATEKPG VEEAARRASA
XplB 256 ATTVVFHFGS TPVEVI.GTD RAEAVKVR.. ....TGVHTT T......... .LACDTVITAAdR 301 SRAWGLRFFR SPQQVLPSPD GRRAAGIRLA VTRLEGIGEA TRAVPTGDVE DLPCGLVLSS
⇓ ⇓ ⇓XplB 299 IGFES..... AVNDDLDLTL YRDADPGEDF LAPGLYRTGW L.HSSTGALP EMRARARALAAdR 361 IGYKSRPIDP SVPFDPKLGV VPNME.GRVV DVPGLYCSGW VKRGPTGVIT TTMTDSFLTG
XplB 353 ARIRRD.HAG HHPA..RPGL VAIPYEVIDR ...TVDFDGW MRIDEAEVA. SASPGRIRQKAdR 420 QILLQDLKAG HLPSGPRPGS AFIKALLDSR GVWPVSFSDW EKLDAEEVSR GQASGKPREK
XplB 406 VREVDAMLAL ARTVPAESVCAdR 480 LLDPQEMLRL LGH~~~~~~~
Figure 5.15: Alignment of protein encoded by xplB with a known adrenodoxin reductase. Alignment ofthe amino acid sequence of XplB with adrenodoxin reductase (AdR) of Bos taurus (accession numberP08165) 220, 254. Identical residues are shaded black and similar residues shaded grey. Domains 129 areunderlined and residues described in the text indicated by arrows.
5.3.10 RT-PCR analysis of xplA and xplB transcription
5.3.10.1 Confirmation of transcription of xplA and xplB
To confirm that both xplA and xplB are transcribed in strain 11Y, RNA was harvested from
cells and subjected to RT-PCR. Primers (Table 5.3) were either chosen from those used for
sequencing, or designed from the sequence of pHSX1 to produce fragments of interest (Figure 5.16).
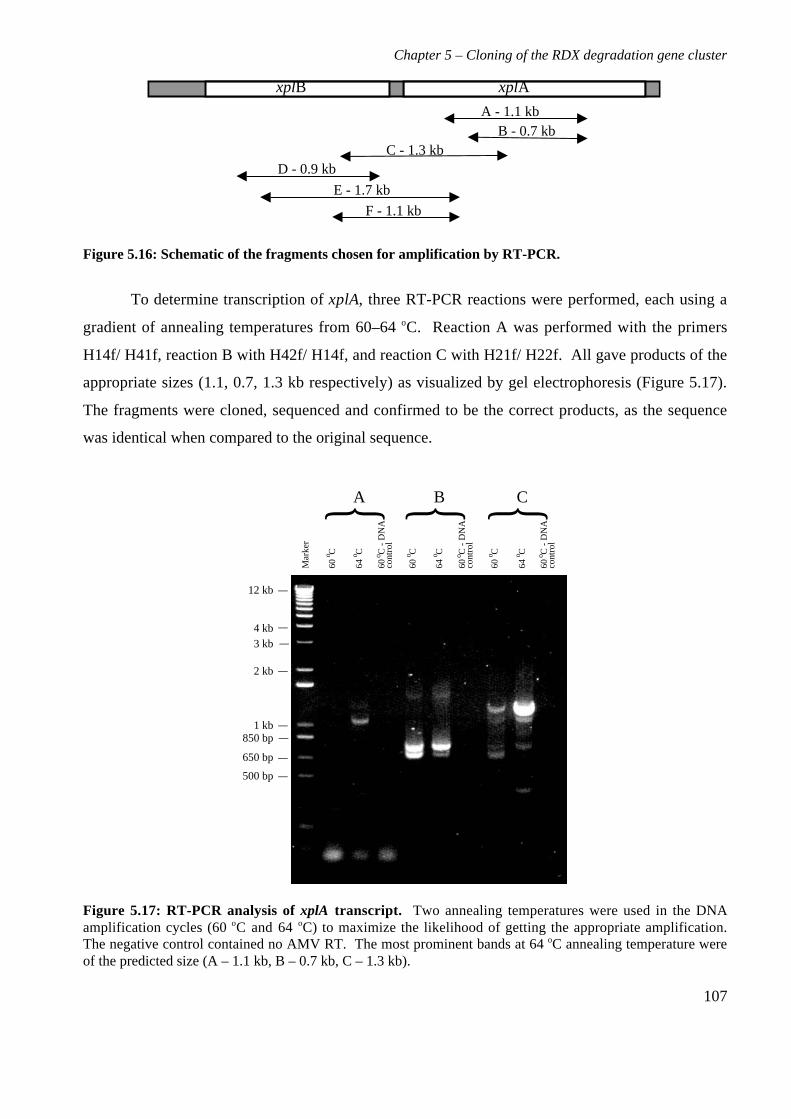
Chapter 5 – Cloning of the RDX degradation gene cluster
107
Figure 5.16: Schematic of the fragments chosen for amplification by RT-PCR.
To determine transcription of xplA, three RT-PCR reactions were performed, each using a
gradient of annealing temperatures from 60–64 oC. Reaction A was performed with the primers
H14f/ H41f, reaction B with H42f/ H14f, and reaction C with H21f/ H22f. All gave products of the
appropriate sizes (1.1, 0.7, 1.3 kb respectively) as visualized by gel electrophoresis (Figure 5.17).
The fragments were cloned, sequenced and confirmed to be the correct products, as the sequence
was identical when compared to the original sequence.
Mar
ker
60 C o
64 C o
60 C
- D
NA
co
ntro
l o
60 C o
60 C o
64 C o
64 C o
A B C
_
_
__
_
___
12 kb
2 kb
1 kb
3 kb4 kb
850 bp
650 bp
500 bp
60 C
- D
NA
co
ntro
l o
60 C
- D
NA
co
ntro
l o
Figure 5.17: RT-PCR analysis of xplA transcript. Two annealing temperatures were used in the DNAamplification cycles (60 oC and 64 oC) to maximize the likelihood of getting the appropriate amplification.The negative control contained no AMV RT. The most prominent bands at 64 oC annealing temperature wereof the predicted size (A – 1.1 kb, B – 0.7 kb, C – 1.3 kb).
xplAxplB
A - 1.1 kbB - 0.7 kb
C - 1.3 kb
F - 1.1 kb
E - 1.7 kb
D - 0.9 kb
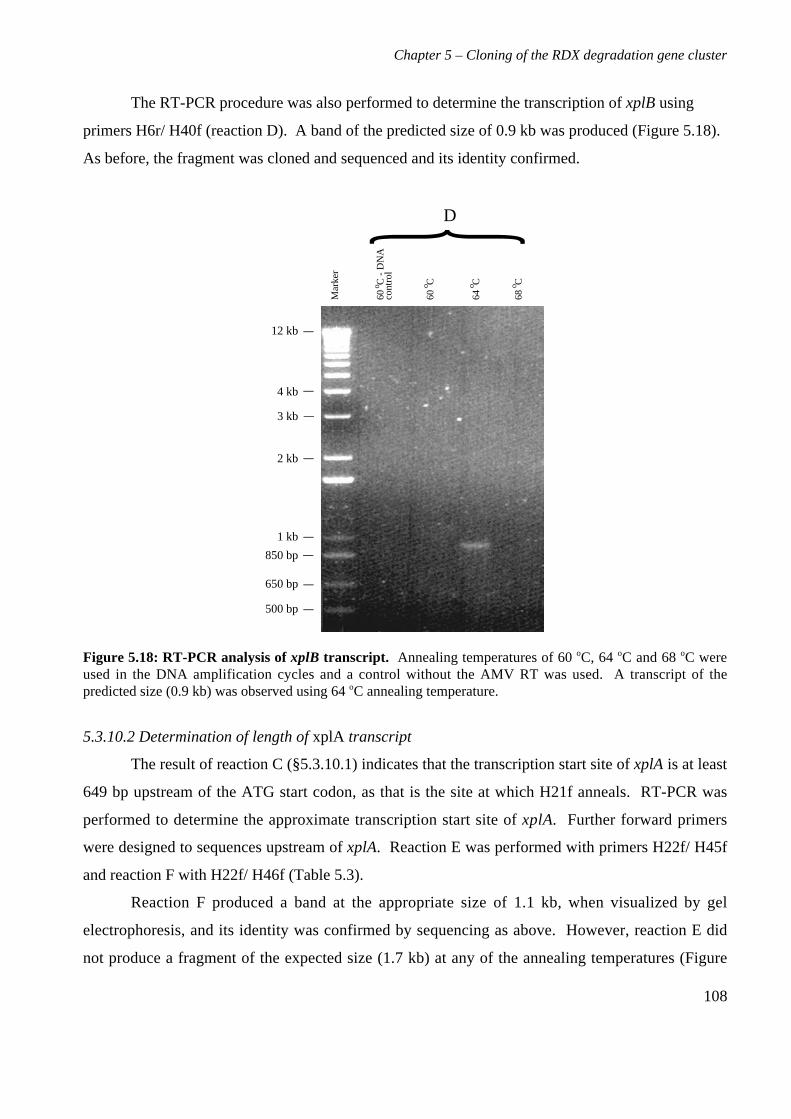
Chapter 5 – Cloning of the RDX degradation gene cluster
108
The RT-PCR procedure was also performed to determine the transcription of xplB using
primers H6r/ H40f (reaction D). A band of the predicted size of 0.9 kb was produced (Figure 5.18).
As before, the fragment was cloned and sequenced and its identity confirmed.
_
_
__
_
_
__
12 kb
2 kb
1 kb
3 kb
4 kb
850 bp
650 bp
500 bp
60 C o
64 C o
60 C
- D
NA
co
ntro
l o
68 C o
Mar
ker
D Figure 5.18: RT-PCR analysis of xplB transcript. Annealing temperatures of 60 oC, 64 oC and 68 oC wereused in the DNA amplification cycles and a control without the AMV RT was used. A transcript of thepredicted size (0.9 kb) was observed using 64 oC annealing temperature.
5.3.10.2 Determination of length of xplA transcript
The result of reaction C (§5.3.10.1) indicates that the transcription start site of xplA is at least
649 bp upstream of the ATG start codon, as that is the site at which H21f anneals. RT-PCR was
performed to determine the approximate transcription start site of xplA. Further forward primers
were designed to sequences upstream of xplA. Reaction E was performed with primers H22f/ H45f
and reaction F with H22f/ H46f (Table 5.3).
Reaction F produced a band at the appropriate size of 1.1 kb, when visualized by gel
electrophoresis, and its identity was confirmed by sequencing as above. However, reaction E did
not produce a fragment of the expected size (1.7 kb) at any of the annealing temperatures (Figure
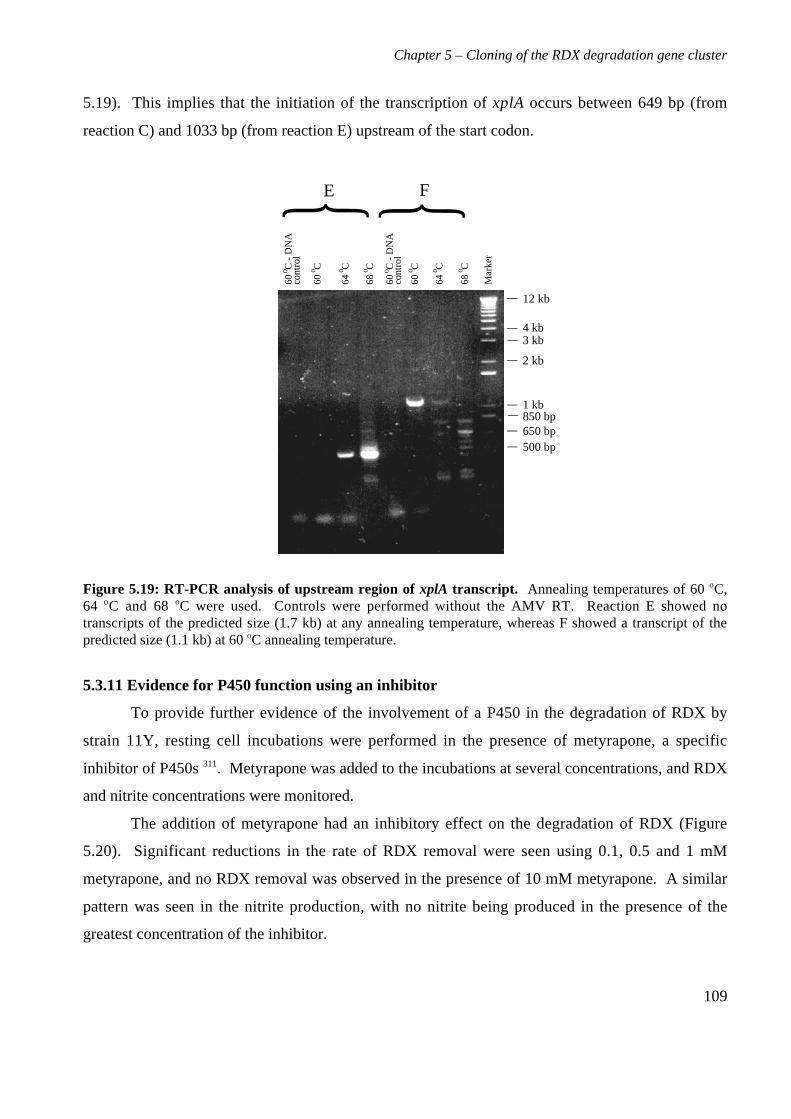
Chapter 5 – Cloning of the RDX degradation gene cluster
109
5.19). This implies that the initiation of the transcription of xplA occurs between 649 bp (from
reaction C) and 1033 bp (from reaction E) upstream of the start codon.
_
_
__
_
___
12 kb
2 kb
1 kb
3 kb4 kb
850 bp650 bp500 bp
Mar
ker
60 C o
64 C o
60 C
- D
NA
co
ntro
l o
60 C o
64 C o
68 C o
E F
60 C
- D
NA
co
ntro
l o
68 C o
Figure 5.19: RT-PCR analysis of upstream region of xplA transcript. Annealing temperatures of 60 oC,64 oC and 68 oC were used. Controls were performed without the AMV RT. Reaction E showed notranscripts of the predicted size (1.7 kb) at any annealing temperature, whereas F showed a transcript of thepredicted size (1.1 kb) at 60 oC annealing temperature.
5.3.11 Evidence for P450 function using an inhibitor
To provide further evidence of the involvement of a P450 in the degradation of RDX by
strain 11Y, resting cell incubations were performed in the presence of metyrapone, a specific
inhibitor of P450s 311. Metyrapone was added to the incubations at several concentrations, and RDX
and nitrite concentrations were monitored.
The addition of metyrapone had an inhibitory effect on the degradation of RDX (Figure
5.20). Significant reductions in the rate of RDX removal were seen using 0.1, 0.5 and 1 mM
metyrapone, and no RDX removal was observed in the presence of 10 mM metyrapone. A similar
pattern was seen in the nitrite production, with no nitrite being produced in the presence of the
greatest concentration of the inhibitor.
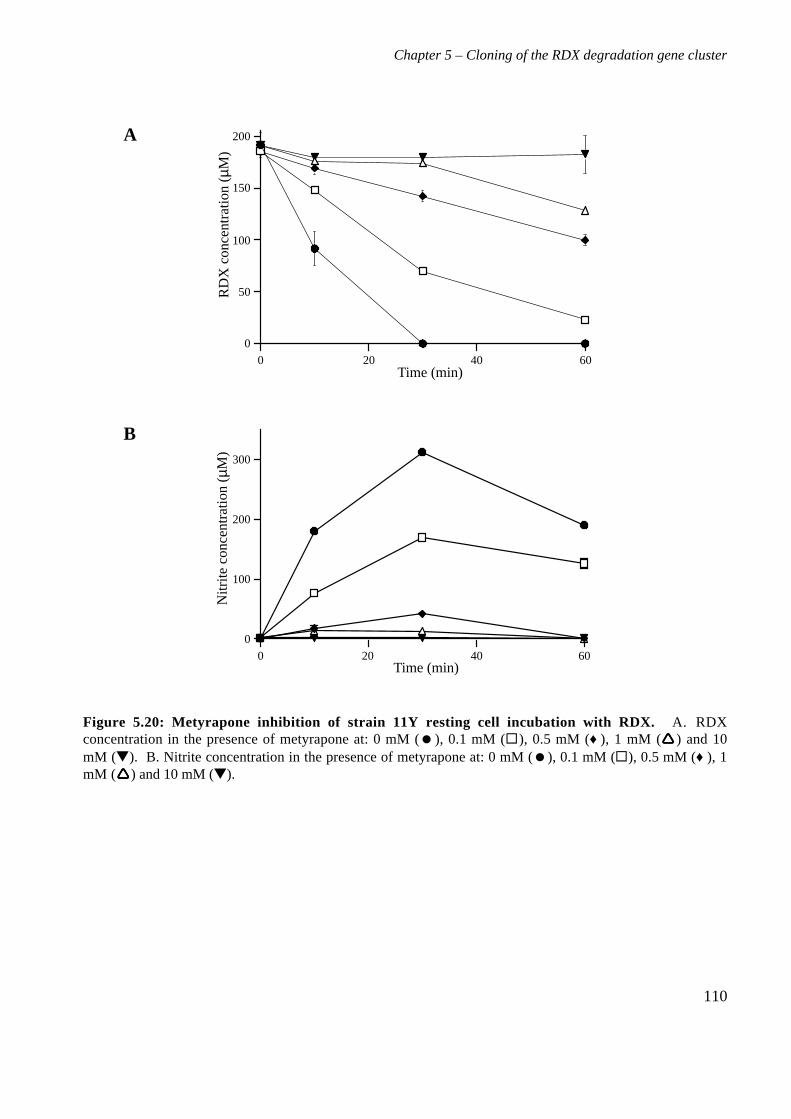
Chapter 5 – Cloning of the RDX degradation gene cluster
110
0
100
200
300
0 20 40 60
0
50
100
150
200
0 20 40 60
Time (min)
Time (min)
RD
X c
once
ntra
tion
(µM)
Nitr
ite c
once
ntra
tion
(µM)
Figure 5.20: Metyrapone inhibition of strain 11Y resting cell incubation with RDX. A. RDXconcentration in the presence of metyrapone at: 0 mM (), 0.1 mM (), 0.5 mM (♦ ), 1 mM () and 10mM (). B. Nitrite concentration in the presence of metyrapone at: 0 mM (), 0.1 mM (), 0.5 mM (♦ ), 1mM () and 10 mM ().
A
B
Chapter 5 – Cloning of the RDX degradation gene cluster
111
5.4 Discussion
A DNA library was used to clone the RDX degrading genes from Rhodococcus rhodochrous
strain 11Y. A representative library of strain 11Y DNA was made first in E. coli and was
subsequently transformed into a non RDX degrading rhodococcal strain. Screening the library in E.
coli was attempted, but was not successful. No zones of clearance were produced when the library
was screened using an adapted zone of clearance screen, so a more sensitive assay was developed to
allow the detection of nitrite resulting from the breakdown of RDX. Both whole cells and lysed
cells were screened in this manner and although there were some apparent positives, these turned
out to be non reproducible. This phenomenon of unreproducible positives using the Griess assay in
microtitre plates has been reported before, and the presence of nitric oxides in ambient air is thought
to be responsible 288, although evaporation from edge and corner wells may also play a role.
The failure of these methods to identify an RDX degrading clone indicates that the necessary
components were not actively produced in E. coli, as representative libraries were screened in each
case. This may be due to a lack of transcription of the gene(s) from their native promoter(s), or the
production of inactive protein. There are only a few cases in which promoters of rhodococcal genes
have been seen to function in E. coli. The promoters of the genes for Rhodococcus sp. N-774
amidase 134, R. rhodochrous J1 nitrile hydratase 169, R. rhodochrous CTM catechol 2,3-dioxygenase
gene 52 , R. opacus MR11 NAD-reducing hydrogenase 118 and R. rhodochrous NCIMB 13259
catechol 1,2-dioxygenase 297 are active in E. coli. This is likely to be because these rhodococcal
promoters conform to the E. coli promoter consensus. Sequences homologous to E. coli promoter -
10 and -35 elements have been found upstream of the gene hppC in R. globerulus PWD1, which
may be responsible for its expression in E. coli 13. In addition there may be components present in
rhodococci but not in E. coli which allow the correct folding of the protein, or extra cofactors or
pathway components required for activity which do not occur in E. coli cells.
A clone from the rhodococcal library carrying a 7.5 kb insert was isolated by selective
enrichment and found to be able to remove RDX from culture. When comparing the growth of this
clone, CW25(pHSX1), with the growth of strain 11Y on RDX, CW25(pHSX1) grew more slowly
than, and reached a lower final OD600 than, strain 11Y. The presence of chloramphenicol in the
growth medium of CW25(pHSX1) may have been responsible for the longer lag phase of this strain,
and strain CW25 does not grow as well as strain 11Y on nitrite (E. Travis, personal communication),
which is the only identified nitrogen source released from the breakdown of RDX by strain 11Y
Chapter 5 – Cloning of the RDX degradation gene cluster
112
(§4.3.5). The insert in pHSX1 contains 426 bp upstream of xplB, and it is possible that further
upstream sequences are required for optimal gene expression.
The 7.5 kb fragment was found to contain three ORFs whose deduced amino acid sequences
have homology to an adrenodoxin reductase, a cytochrome P450 and an acetyl CoA synthase.
Subcloning sections of the 7.5 kb fragment from pHSX1 demonstrated that the gene for the acetyl
CoA synthase was not involved in RDX degradation. A further subcloning experiment showed that
is it the gene for the cytochrome P450-like protein (xplA) which is the unique component for RDX
degradation possessed by strain 11Y and not strain CW25. Strain CW25 appears to be able to
provide any other components required.
P450s are haem containing monooxygenase proteins, widely distributed in animals, plants
and bacteria and are able to catalyse a wide range of reactions which are commonly involved in the
detoxification of substances, particularly xenobiotics 262. The name P450 describes the maximum of
the peak (450 nm) in the absorption spectrum of the reduced carbon monoxide complex. They are
not true cytochromes; a more accurate term would be haem-thiolate protein 215, describing the haem
binding to the sulphur molecule on the cysteine residue. P450cam is the best characterized of the
bacterial P450s, and catalyses the hydroxylation of camphor in Pseudomonas putida.
The deduced amino acid sequence of XplA was analysed and found to contain all the
absolutely conserved residues of P450s (Figure 5.13). In particular the residues Arg-249 and Arg-
443 are thought to be involved in hydrogen bonding the haem 223, and Glu-430 and Arg-433 are
found within the K helix (EXXR sequence) which appears to be involved in maintaining the position
of a “meander” region of the protein, helping to either stabilize the haem pocket, or interact with
redox partners 133.
The threonine residue in the oxygen binding region consensus, absent in XplA, corresponds
to the Thr-252 of P450cam, and has been reported to play a crucial role in the monooxygenation
reaction, as reduced activity and uncoupling of the electron transfer are seen when it is substituted
by another amino acid 153, 239. However, it appears not to be highly conserved in P450s, as
alignments at http://www.icgeb.trieste.it/~p450srv/ indicate that approx. 10 % of sequences have
alternative amino acids at this position, including Ala, Glu, Ser, Asn, Pro and Ile. The substitution
of Ala for Thr found at this position in XplA is seen in several other P450s including P450eryF from
Saccharopolyspora erythraea, involved in erythromycin biosynthesis. Interestingly, the reverse
mutation in P450eryF, Ala245Thr, gave a massively reduced activity and uncoupling of the reducing
equivalent utilization 68. The H-bonding formed by the Thr in P450cam is thought to be supplied by a
Chapter 5 – Cloning of the RDX degradation gene cluster
113
water molecule in the absence of Thr 67. This substitution may be involved in the accommodation of
large substrates by reducing steric hindrance between them and the amino acid side chain, and may
impair the ability of the protein to cleave the O-O bond of the oxygen 120.
Eukaryotic P450s, such as those used to detoxify substances in the liver, require a reductase
component for electron transfer and fall into a group called Type II, whereas bacterial and
mitochondrial P450s are Type I, requiring ferredoxin and ferredoxin reductase to complete the
multicomponent enzyme system 7 4. The reactions which P450s can catalyse in rhodococci and
related species include biotransformations of xenobiotics, such as the dechlorination of
pentachlorophenol by Rhodococcus chlorophenolicus 311, and the degradation of ethoxyphenol and
methoxybenzoate by P450RR1 and P450RR2 of R. rhodochrous 163, the herbicide EPTC by thcB from
Rhodoccoccus sp. 210, ethyl-tert-butyl ether by ethB from R. ruber 53 and piperidine and pyrrolidine
by pipA from Mycobacterium smegmatis 235. Rhodococcal P450s involved in xenobiotic degradation
are sometimes found in operons with genes coding for ferredoxin reductases and ferredoxins 53, 210.
In some cases regulatory genes and other ORFs, to date of unknown function, are found in the
operon 37, 53, 66, 210, 235.
The use of a P450 in the biodegradation of RDX has been speculated upon in P.
chrysosporium 276 and inhibition studies have also implied the involvement of a P450 in work on
rhodococcal RDX degraders 60, 302. Inhibitor studies using the specific P450 inhibitor metyrapone
showed that the removal of RDX from resting cell incubations by Rhodococcus rhodochrous strain
11Y is greatly reduced in the presence of metyrapone. This provides further evidence of the use of a
P450 in the degradation of RDX by strain 11Y and adds weight to the cloning evidence.
The xplA gene has homology to a P450 with a flavodoxin domain at the N-terminus.
Bacterial P450s are usually about 400 amino acids, and this N-terminal extension adds a further
approx. 140 residues, which is in the size range of the short chain bacterial flavodoxins. Met-158
could be postulated as being a start codon for the original P450 as it falls between the two domains.
In some situation, flavodoxins are able to perform the same physiological roles as ferredoxins,
despite there being no sequence homology between the two 309. Both are involved in electron
transport, but flavodoxins use a flavin (FMN) moiety as the redox centre instead of an iron-sulphur
centre. Therefore, the flavodoxin domain of XplA could possibly dispense with the necessity for a
separate ferredoxin. The domain contains most of the residues which form the flavodoxin signature
for the binding of the FMN phosphate group, with the exception of Thr-15 (Figure 5.14). This
threonine residue has been implicated in electron transfer, or in the maintenance of the conformation
Chapter 5 – Cloning of the RDX degradation gene cluster
114
of the protein 315. The flavin is proposed to be sandwiched between residues Trp-60 and Tyr-98
(numbers refer to D. vulgaris) 309. The equivalent of Tyr-98 is present in XplA, but Trp-60 is
replaced by Tyr. However, both have aromatic sidechains such that it is possible that Tyr could
function in the place of Trp.
A flavodoxin-like gene has recently been found in a cluster with a novel P450 and a
reductase in Citrobacter brakii 140, although the function of the flavodoxin as a redox partner of the
P450 has not been demonstrated. In XplA, the flavodoxin appears to be part of a compound protein
with the putative P450, and fused genes containing components of the P450 system are not
uncommon. The most well known example is that of P450BM-3 from Bacillus megaterium, in which
the reductase is fused to the P450 in one self-sufficient protein 212, 213. Crespi et al. 66 reported an
operon containing a P450 and a ferredoxin-like domain at the N-terminus of a protein otherwise
dissimilar to any protein involved in P450 reactions. A two-component bacterial P450 system was
reported by Serizawa and Matsuoka 268, with the reductase component containing both FAD and
FMN groups, and no ferredoxin being required for activity. Very recently a new class of fused P450
has been cloned from a Rhodococcus sp., comprising an N-terminal P450 domain with a C-terminal
reductase domain, and possibly containing a ferredoxin type 2Fe2S domain, although the function of
these domains has not been proved 246.
There are no reports to date of a two component system comprising a reductase and a
compound P450 and FMN domain, possibly making the xpl gene cluster a novel type of P450. A
comparison of XplA with all bacterial P450s has been performed by the P450 nomenclature
committee, who have found it to be unique, and have given it a new family name of CYP177A1 (D.
Nelson, personal communication).
A gene with homology to adrenodoxin reductase, xplB, is found 62 bp upstream of xplA.
Adrenodoxin reductases perform electron transfer as part of the mitochondrial P450 system involved
in steroid biosynthesis, generally transferring electrons between NADP and adrenodoxin, a 2Fe2S
ferredoxin. Amino acid sequence analysis shows that two of the conserved residues of adrenodoxin
reductases are not present in XplB (§5.3.9.3); these residues are implicated in the electron transfer
mechanism from alignments and structural studies 352, although the significance of this is not yet
known. Adrenodoxin reductases differ significantly from ferredoxin reductases, which are more
generally thought to be involved in Type I systems, in sequence and structure 351, although both
perform effectively the same function. Several mycobacterial proteins with homology have been
identified, indicating that similar proteins are found in bacteria, but none have a proven function.
Chapter 5 – Cloning of the RDX degradation gene cluster
115
The function of the flavodoxin domain in XplA as a redox agent and the possible use of
XplB as a reductase in the mechanism have not, as yet, been demonstrated.
Both xplA and xplB appear to possess ATG start codons. Initiation codons of GTG are
commonly found in rhodococcal genes 189, but do not appear to be utilized in xplA or xplB. There
are no possible in-frame GTG initiation codons upstream of xplB, and the initial amino acid of XplA
aligns directly with the methionine of the flavodoxin from D. vulgaris, indicating that it has been
correctly assigned.
P450s which are involved in xenobiotic metabolism are commonly induced by their
substrate. These include P450cam from P. putida, induced by an order of magnitude in the presence
of the substrate camphor 173, P450SU1 and P450SU2 involved in herbicide metabolism in Streptomyces
griseolus which is absent from uninduced cells as assayed by HPLC 221, and a rhodococcal P450
involved in the degradation of herbicide EPTC, whose induction is apparent by 2D gel
electrophoresis 210. There are also reports of constitutive bacterial P450s such as P450CON in
Streptomyces griseolus, and the quantity of this protein appears not to change regardless of the
addition of inducer 221. RT-PCR demonstrated that both xplA and xplB are transcribed in cells grown
in rich medium (LB) in the absence of RDX, which confirms the previous observation that activity
against RDX was found in cells grown without RDX (§4.3.3). The activity was seen to increase
three-fold in the presence of RDX, indicating a degree of inducibility.
The RT-PCR experiments give an indication of the positioning of the promoter of xplA. The
expression of xplA from the subcloned fragment in plasmid pHSX1b demonstrated that a promoter
of xplA must be present within the 697 bp upstream of the gene on pHSX1b. RT-PCR reaction E
showed that at least 649 bp upstream of xplA are transcribed. Therefore, the putative promoter
region can be narrowed down to a region of 48 bp between 697 bp maximum and 649 bp minimum
upstream of the start codon.
Few studies have been performed on the regulatory regions of rhodococcal genes, and they
seem not to have highly conserved sequences such as those in E. coli. Of those which appear in
publications, some have homology to E. coli σ70 or B. subtilis promoters 26, 118, 193, 297, although this is
by no means the norm. Apart from these similarities there is no obvious consensus between the
promoter sequences reported. The putative promoter of xplA appears to be significantly further
upstream than has previously been reported, with known rhodococcal transcription start sites
varying from 26 to 280 nucleotides upstream of the start codon 80, 174.
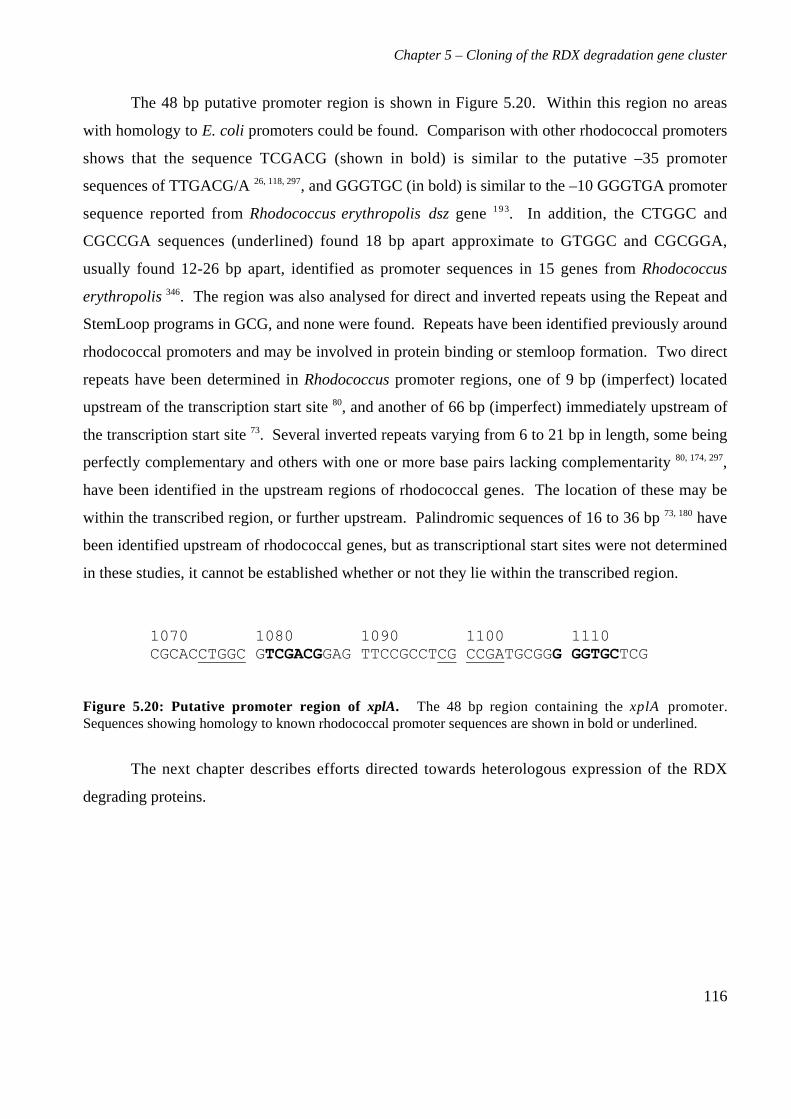
Chapter 5 – Cloning of the RDX degradation gene cluster
116
The 48 bp putative promoter region is shown in Figure 5.20. Within this region no areas
with homology to E. coli promoters could be found. Comparison with other rhodococcal promoters
shows that the sequence TCGACG (shown in bold) is similar to the putative –35 promoter
sequences of TTGACG/A 26, 118, 297, and GGGTGC (in bold) is similar to the –10 GGGTGA promoter
sequence reported from Rhodococcus erythropolis dsz gene 193. In addition, the CTGGC and
CGCCGA sequences (underlined) found 18 bp apart approximate to GTGGC and CGCGGA,
usually found 12-26 bp apart, identified as promoter sequences in 15 genes from Rhodococcus
erythropolis 346. The region was also analysed for direct and inverted repeats using the Repeat and
StemLoop programs in GCG, and none were found. Repeats have been identified previously around
rhodococcal promoters and may be involved in protein binding or stemloop formation. Two direct
repeats have been determined in Rhodococcus promoter regions, one of 9 bp (imperfect) located
upstream of the transcription start site 80, and another of 66 bp (imperfect) immediately upstream of
the transcription start site 73. Several inverted repeats varying from 6 to 21 bp in length, some being
perfectly complementary and others with one or more base pairs lacking complementarity 80, 174, 297,
have been identified in the upstream regions of rhodococcal genes. The location of these may be
within the transcribed region, or further upstream. Palindromic sequences of 16 to 36 bp 73, 180 have
been identified upstream of rhodococcal genes, but as transcriptional start sites were not determined
in these studies, it cannot be established whether or not they lie within the transcribed region.
1070 1080 1090 1100 1110 CGCACCTGGC GTCGACGGAG TTCCGCCTCG CCGATGCGGG GGTGCTCG
Figure 5.20: Putative promoter region of xplA. The 48 bp region containing the xplA promoter.Sequences showing homology to known rhodococcal promoter sequences are shown in bold or underlined.
The next chapter describes efforts directed towards heterologous expression of the RDX
degrading proteins.
Chapter 6 – Heterologous expression of XplA and XplB
117
Chapter 6. Heterologous expression of XplA and XplB
6.1 Background
The genes which enable Rhodocococcus rhodochrous strain 11Y to degrade RDX have been
cloned, and the deduced amino acid sequence data has identified a P450 with flavodoxin domain at
the N-terminus (XplA), and a reductase (XplB) immediately upstream. The potential novelty of this
electron transfer system requires further investigation. The use of a flavodoxin as an electron donor
to a P450 has not been documented previously, and would be of particular interest as a domain fused
to the P450, but its use in this context within XplA remains to be established. The use of the
reductase to complete the electron transfer system also remains to be determined. It is therefore
necessary to obtain pure, active protein, and to reconstitute the activity in vitro. The first stage in
the attempt to obtain activity in vitro is the heterologous expression of the two proteins, XplA and
XplB.
For maximum expression in E. coli, pET vectors were chosen, as they put the gene under the
control of the strong, inducible T7 promoter. The unique Nde I site found in the cloning site of
many pET vectors contains the start codon ATG within its recognition site and is placed in an
optimum position for expression, relative to the promoter and ribosome binding site sequences.
Many of the pET expression vectors contain a BamH I site within the multiple cloning site
downstream of the Nde I site. This is a suitable site to engineer downstream of the stop codon of the
gene to be expressed for ligation into the vector.
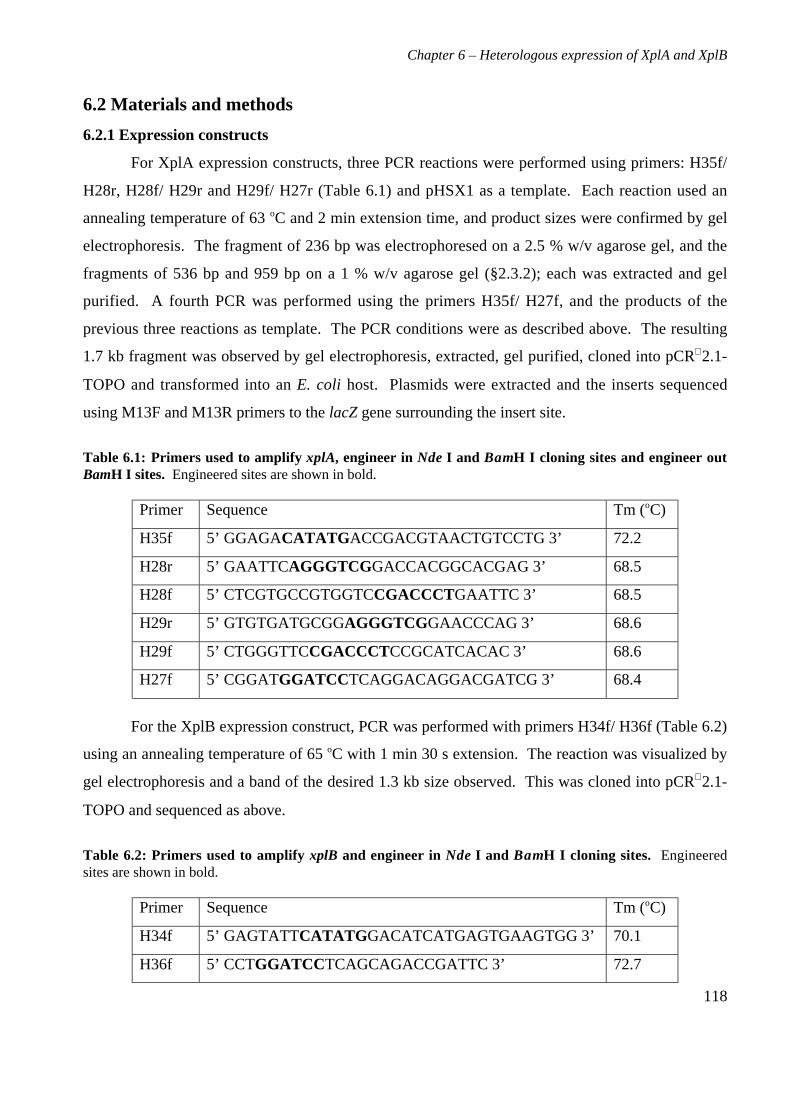
Chapter 6 – Heterologous expression of XplA and XplB
118
6.2 Materials and methods
6.2.1 Expression constructs
For XplA expression constructs, three PCR reactions were performed using primers: H35f/
H28r, H28f/ H29r and H29f/ H27r (Table 6.1) and pHSX1 as a template. Each reaction used an
annealing temperature of 63 oC and 2 min extension time, and product sizes were confirmed by gel
electrophoresis. The fragment of 236 bp was electrophoresed on a 2.5 % w/v agarose gel, and the
fragments of 536 bp and 959 bp on a 1 % w/v agarose gel (§2.3.2); each was extracted and gel
purified. A fourth PCR was performed using the primers H35f/ H27f, and the products of the
previous three reactions as template. The PCR conditions were as described above. The resulting
1.7 kb fragment was observed by gel electrophoresis, extracted, gel purified, cloned into pCR 2.1-
TOPO and transformed into an E. coli host. Plasmids were extracted and the inserts sequenced
using M13F and M13R primers to the lacZ gene surrounding the insert site.
Table 6.1: Primers used to amplify xplA, engineer in Nde I and BamH I cloning sites and engineer outBamH I sites. Engineered sites are shown in bold.
Primer Sequence Tm (oC)
H35f 5’ GGAGACATATG ACCGACGTAACTGTCCTG 3’ 72.2
H28r 5’ GAATTCAGGGTCGGACCACGGCACGAG 3’ 68.5
H28f 5’ CTCGTGCCGTGGTCCGACCCTGAATTC 3’ 68.5
H29r 5’ GTGTGATGCGGAGGGTCGGAACCCAG 3’ 68.6
H29f 5’ CTGGGTTCCGACCCTCCGCATCACAC 3’ 68.6
H27f 5’ CGGATGGATCCTCAGGACAGGACGATCG 3’ 68.4
For the XplB expression construct, PCR was performed with primers H34f/ H36f (Table 6.2)
using an annealing temperature of 65 oC with 1 min 30 s extension. The reaction was visualized by
gel electrophoresis and a band of the desired 1.3 kb size observed. This was cloned into pCR 2.1-
TOPO and sequenced as above.
Table 6.2: Primers used to amplify xplB and engineer in Nde I and BamH I cloning sites. Engineeredsites are shown in bold.
Primer Sequence Tm (oC)
H34f 5’ GAGTATTCATATG GACATCATGAGTGAAGTGG 3’ 70.1
H36f 5’ CCTGGATCCTCAGCAGACCGATTC 3’ 72.7
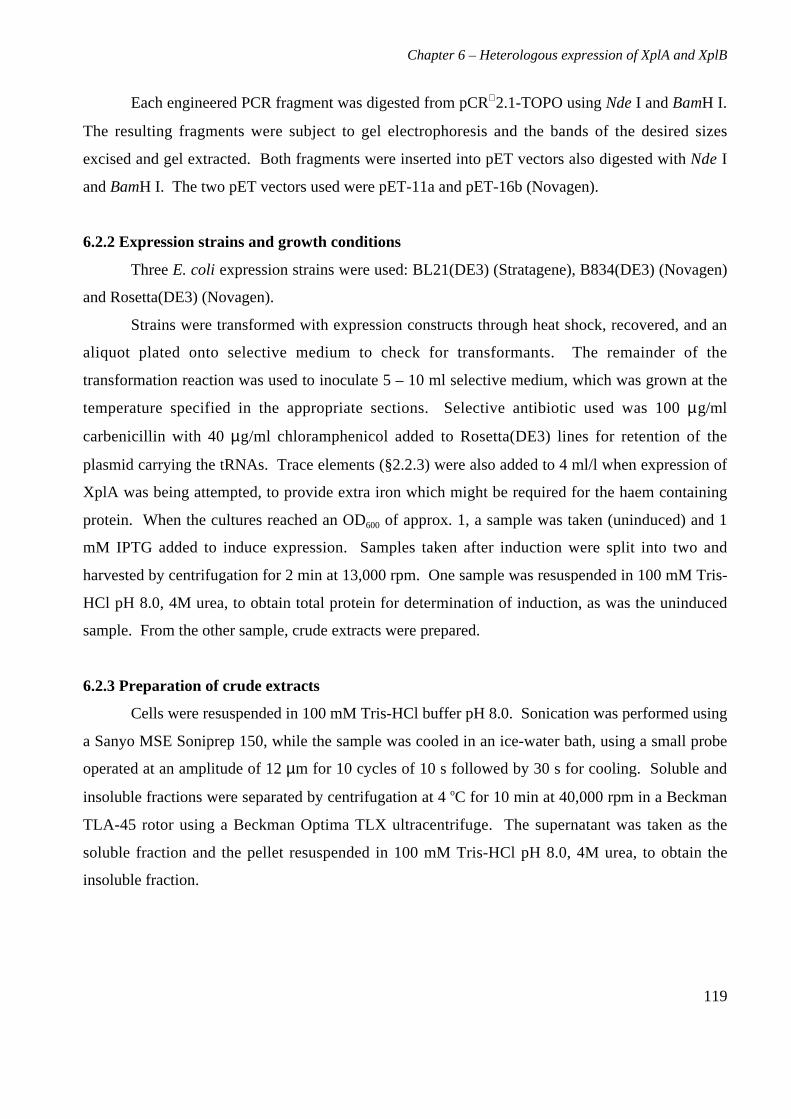
Chapter 6 – Heterologous expression of XplA and XplB
119
Each engineered PCR fragment was digested from pCR 2.1-TOPO using Nde I and BamH I.
The resulting fragments were subject to gel electrophoresis and the bands of the desired sizes
excised and gel extracted. Both fragments were inserted into pET vectors also digested with Nde I
and BamH I. The two pET vectors used were pET-11a and pET-16b (Novagen).
6.2.2 Expression strains and growth conditions
Three E. coli expression strains were used: BL21(DE3) (Stratagene), B834(DE3) (Novagen)
and Rosetta(DE3) (Novagen).
Strains were transformed with expression constructs through heat shock, recovered, and an
aliquot plated onto selective medium to check for transformants. The remainder of the
transformation reaction was used to inoculate 5 – 10 ml selective medium, which was grown at the
temperature specified in the appropriate sections. Selective antibiotic used was 100 µg/ml
carbenicillin with 40 µg/ml chloramphenicol added to Rosetta(DE3) lines for retention of the
plasmid carrying the tRNAs. Trace elements (§2.2.3) were also added to 4 ml/l when expression of
XplA was being attempted, to provide extra iron which might be required for the haem containing
protein. When the cultures reached an OD600 of approx. 1, a sample was taken (uninduced) and 1
mM IPTG added to induce expression. Samples taken after induction were split into two and
harvested by centrifugation for 2 min at 13,000 rpm. One sample was resuspended in 100 mM Tris-
HCl pH 8.0, 4M urea, to obtain total protein for determination of induction, as was the uninduced
sample. From the other sample, crude extracts were prepared.
6.2.3 Preparation of crude extracts
Cells were resuspended in 100 mM Tris-HCl buffer pH 8.0. Sonication was performed using
a Sanyo MSE Soniprep 150, while the sample was cooled in an ice-water bath, using a small probe
operated at an amplitude of 12 µm for 10 cycles of 10 s followed by 30 s for cooling. Soluble and
insoluble fractions were separated by centrifugation at 4 oC for 10 min at 40,000 rpm in a Beckman
TLA-45 rotor using a Beckman Optima TLX ultracentrifuge. The supernatant was taken as the
soluble fraction and the pellet resuspended in 100 mM Tris-HCl pH 8.0, 4M urea, to obtain the
insoluble fraction.
Chapter 6 – Heterologous expression of XplA and XplB
120
6.2.4 Protein concentration determination
Protein concentration was routinely assayed using the bicinchoninic acid (BCA) protein
assay reagent (Pierce, Rockford, Illinois, U.S.A.) according to the manufacturer’s instructions.
Bovine serum albumin (Pierce) was used for the construction of standard curves.
6.2.5 SDS-PAGE electrophoresis
SDS-PAGE was performed according to Laemmli 183 on a Bio-Rad Mini-Protean II system
(Hemel Hempstead, Hertfordshire, U.K.). Samples for SDS-PAGE were denatured by heating to
100 oC for 5 min after dilution with 1/4 volumes of sample buffer consisting of 60 mM Tris-HCl, pH
6.8, 15 % v/v glycerol, 2 % w/v SDS, 5 % v/v β-mercaptoethanol and 0.15 % w/v bromophenol
blue. The acrylamide mixture (Protogel) consisted of 30 % w/v acrylamide and 0.8 % w/v bis-
acrylamide in solution (37.5 : 1 by weight) and was purchased from National Diagnostics (Hessle,
Yorkshire, U.K.). Polyacrylamide gels consisted of a 1 cm 4 % w/v acrylamide stacking gel and a 5
cm resolving gel of 12 % w/v acrylamide. The gels were run at 140 V, stained with 0.1 % w/v
coomassie blue R-250 in methanol: water: acetic acid (4: 5: 1 by volume) and destained with several
changes of the same solvent. Markers used were low molecular weight range markers (Sigma).
6.2.6 Activity assay
An aliquot (10 µl) of soluble fraction from E. coli expressing XplA was added to a 10 µl
aliquot of soluble extract from E. coli expressing XplB, with 1mM cofactor (NADPH, NADP+,
NADH or NAD+) and 0.25 mM RDX, made up to a final volume of 40 µl with 100 mM Tris pH 8.0.
After incubation for 1 h at 30 oC, nitrite was assayed for using the Griess assay (§2.4.4).
6.2.7 Electroblotting and N-terminal sequencing
Crude extract was separated using a 12 % v/v SDS-PAGE gel, which had been allowed to
polymerize overnight, and run using buffer containing 2 mM mercaptoacetic acid. The gel was
blotted onto polyvinyl difluoride (PVDF) membrane (Boehringer Mannheim, Basel, Switzerland)
using a Trans-Blot SD Semi-Dry Electrophoretic Transfer Cell (Bio-Rad). The transfer buffer used
was 10 mM 3-[cyclohexylamino]-1-propanesulfonic acid, 5 mM dithiothreitol, 0.02 % w/v SDS and
10 % v/v methanol, pH 11. Electroblotting was performed at 0.04 A for 75 min. The blot was
rinsed in water for 10 min, stained for 5 min in 0.1 % w/v coomassie brilliant blue (R-250), 50 %
v/v methanol, 1 % v/v acetic acid, and destaining was achieved with four changes of 50 % v/v
Chapter 6 – Heterologous expression of XplA and XplB
121
methanol. The membrane was then washed in water twice for 5 min and airdried. The N-terminal
sequence was determined by automated Edman degradation by the Protein and Nucleic Acid
Chemistry Facility, Department of Biochemistry, University of Cambridge.
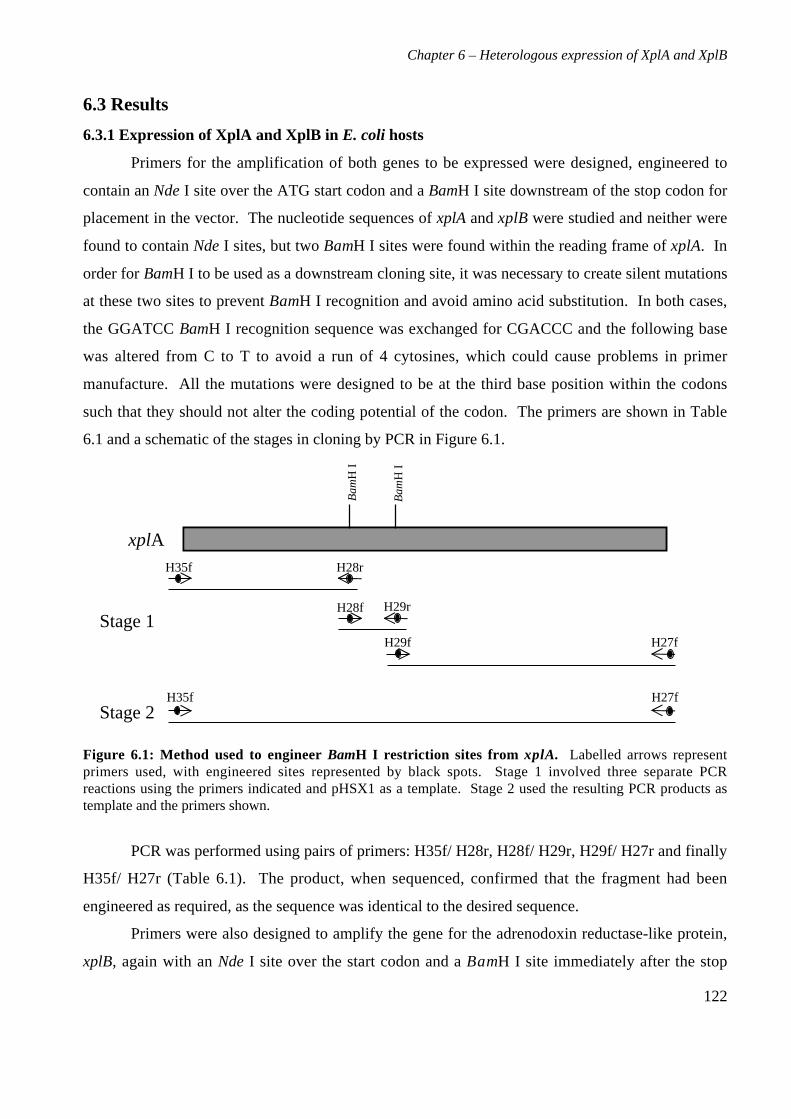
Chapter 6 – Heterologous expression of XplA and XplB
122
6.3 Results
6.3.1 Expression of XplA and XplB in E. coli hosts
Primers for the amplification of both genes to be expressed were designed, engineered to
contain an Nde I site over the ATG start codon and a BamH I site downstream of the stop codon for
placement in the vector. The nucleotide sequences of xplA and xplB were studied and neither were
found to contain Nde I sites, but two BamH I sites were found within the reading frame of xplA. In
order for BamH I to be used as a downstream cloning site, it was necessary to create silent mutations
at these two sites to prevent BamH I recognition and avoid amino acid substitution. In both cases,
the GGATCC BamH I recognition sequence was exchanged for CGACCC and the following base
was altered from C to T to avoid a run of 4 cytosines, which could cause problems in primer
manufacture. All the mutations were designed to be at the third base position within the codons
such that they should not alter the coding potential of the codon. The primers are shown in Table
6.1 and a schematic of the stages in cloning by PCR in Figure 6.1.
Figure 6.1: Method used to engineer BamH I restriction sites from xplA. Labelled arrows representprimers used, with engineered sites represented by black spots. Stage 1 involved three separate PCRreactions using the primers indicated and pHSX1 as a template. Stage 2 used the resulting PCR products astemplate and the primers shown.
PCR was performed using pairs of primers: H35f/ H28r, H28f/ H29r, H29f/ H27r and finally
H35f/ H27r (Table 6.1). The product, when sequenced, confirmed that the fragment had been
engineered as required, as the sequence was identical to the desired sequence.
Primers were also designed to amplify the gene for the adrenodoxin reductase-like protein,
xplB, again with an Nde I site over the start codon and a BamH I site immediately after the stop
Ba
mH
I
xplA
Stage 1
Stage 2
H35f
H27f
H27fH35f
H28r
H28f H29r
H29f
Ba
mH
I
Chapter 6 – Heterologous expression of XplA and XplB
123
codon. These primers are shown in Table 6.2. Sequencing confirmed that the PCR fragment had
been amplified as required, as the sequence was identical to the desired sequence.
Vectors pET-11a and pET-16b were chosen for expression of the two genes. Vector pET-
11a, with a fragment inserted between the Nde I and BamH I sites, carries no modifications to the
protein, and pET-16b carries an N-terminal His tag which may be useful for future purification. A
range of host strains were chosen, all lysogenic for a λ prophage containing an IPTG-inducible T7
RNA polymerase, denoted by (DE3). BL21(DE3) is the standard expression host cell line, and
B834(DE3) its parental line which can result in higher expression levels. In addition, as gram
positive bacteria often have codon biases different from those in E. coli, an expression strain
carrying tRNAs with unusual anticodons was chosen. Rosetta(DE3) host strain was designed for the
expression of eukaryotic, AT- or GC- rich genes in E. coli, and allows the recognition of codons
AUA, AGG, AGA, CUA, CCC and GGA . The absence of these unusual tRNAs can restrict the
translation of heterologous proteins in E. coli. Some of these codons are found frequently within
xplA and xplB as indicated in Table 6.3.
Table 6.3: Occurrence of rare codons in xplA and xplB. These codons are recognized by rare tRNAs inRosetta cell lines.
Rare codon Occurrence in xplA Occurrence in xplB
AUA 0 0
AGG 1 4
AGA 2 0
CUA 1 2
CCC 9 14
GGA 5 9
6.3.1.1 Determination of predicted molecular weights
Predicted molecular weights of both XplA and XplB were calculated using
http://us.expasy.org/tools/pi_tool.html. Deduced amino acid sequences were used to predict the
molecular weight of XplA at 59.9 kDa and that of XplB at 45.9 kDa.
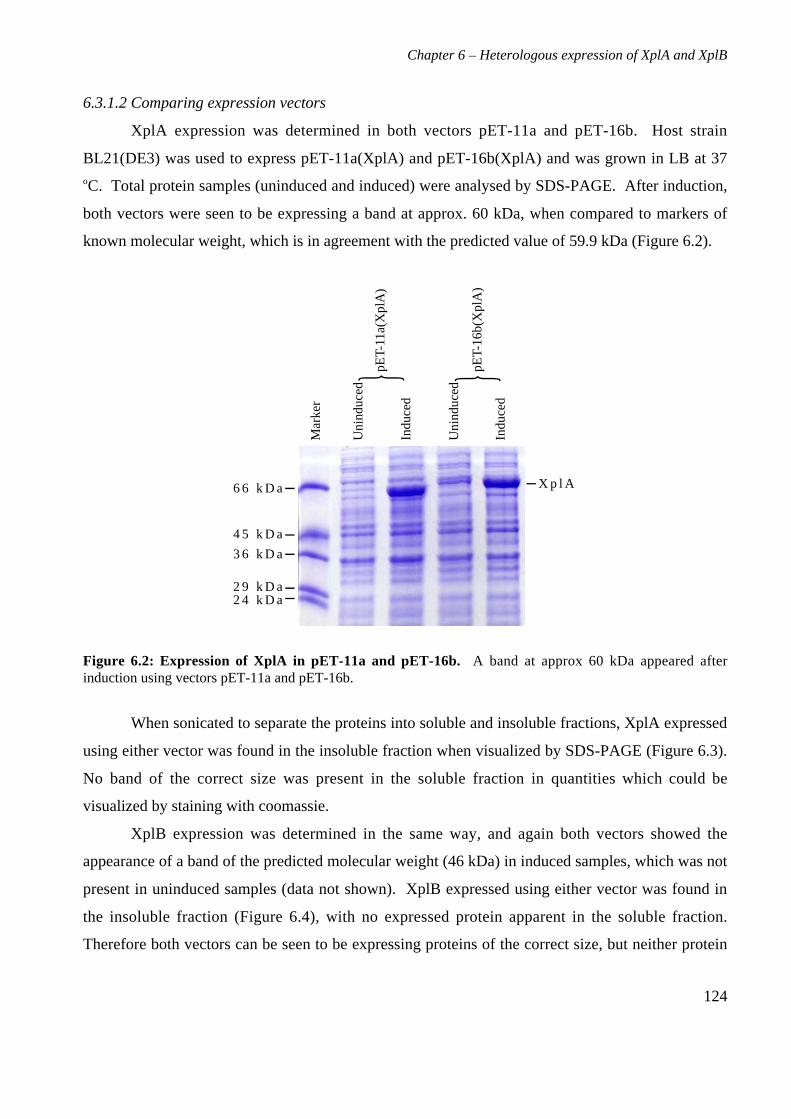
Chapter 6 – Heterologous expression of XplA and XplB
124
6.3.1.2 Comparing expression vectors
XplA expression was determined in both vectors pET-11a and pET-16b. Host strain
BL21(DE3) was used to express pET-11a(XplA) and pET-16b(XplA) and was grown in LB at 37oC. Total protein samples (uninduced and induced) were analysed by SDS-PAGE. After induction,
both vectors were seen to be expressing a band at approx. 60 kDa, when compared to markers of
known molecular weight, which is in agreement with the predicted value of 59.9 kDa (Figure 6.2).
6 6 k D a
4 5 k D a
3 6 k D a
2 9 k D a2 4 k D a
Mar
ker
Uni
nduc
ed
Uni
nduc
ed
Indu
ced
Indu
ced
pET-
11a(
Xpl
A)
pET-
16b(
Xpl
A)
X p l A
Figure 6.2: Expression of XplA in pET-11a and pET-16b. A band at approx 60 kDa appeared afterinduction using vectors pET-11a and pET-16b.
When sonicated to separate the proteins into soluble and insoluble fractions, XplA expressed
using either vector was found in the insoluble fraction when visualized by SDS-PAGE (Figure 6.3).
No band of the correct size was present in the soluble fraction in quantities which could be
visualized by staining with coomassie.
XplB expression was determined in the same way, and again both vectors showed the
appearance of a band of the predicted molecular weight (46 kDa) in induced samples, which was not
present in uninduced samples (data not shown). XplB expressed using either vector was found in
the insoluble fraction (Figure 6.4), with no expressed protein apparent in the soluble fraction.
Therefore both vectors can be seen to be expressing proteins of the correct size, but neither protein
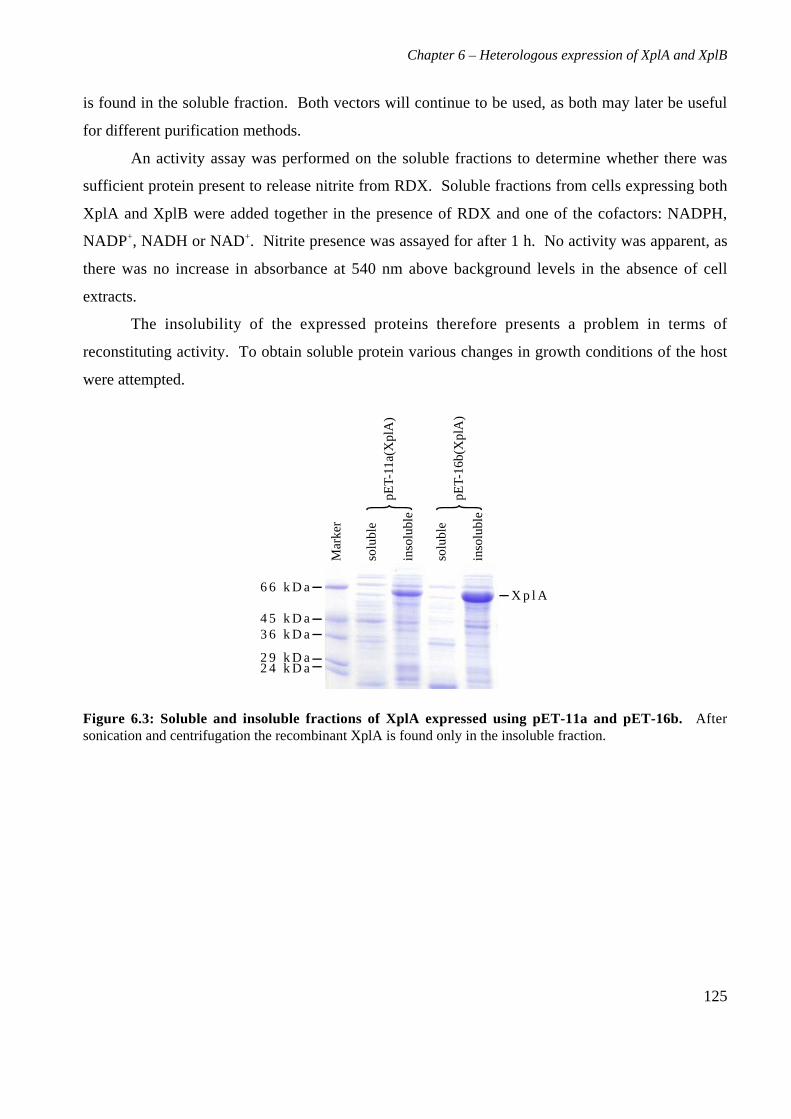
Chapter 6 – Heterologous expression of XplA and XplB
125
is found in the soluble fraction. Both vectors will continue to be used, as both may later be useful
for different purification methods.
An activity assay was performed on the soluble fractions to determine whether there was
sufficient protein present to release nitrite from RDX. Soluble fractions from cells expressing both
XplA and XplB were added together in the presence of RDX and one of the cofactors: NADPH,
NADP+, NADH or NAD+. Nitrite presence was assayed for after 1 h. No activity was apparent, as
there was no increase in absorbance at 540 nm above background levels in the absence of cell
extracts.
The insolubility of the expressed proteins therefore presents a problem in terms of
reconstituting activity. To obtain soluble protein various changes in growth conditions of the host
were attempted.
6 6 k D a
4 5 k D a3 6 k D a
2 9 k D a2 4 k D a
X p l A
Mar
ker
solu
ble
inso
lubl
e
solu
ble
inso
lubl
e
pET-
11a(
Xpl
A)
pET-
16b(
Xpl
A)
Figure 6.3: Soluble and insoluble fractions of XplA expressed using pET-11a and pET-16b. Aftersonication and centrifugation the recombinant XplA is found only in the insoluble fraction.
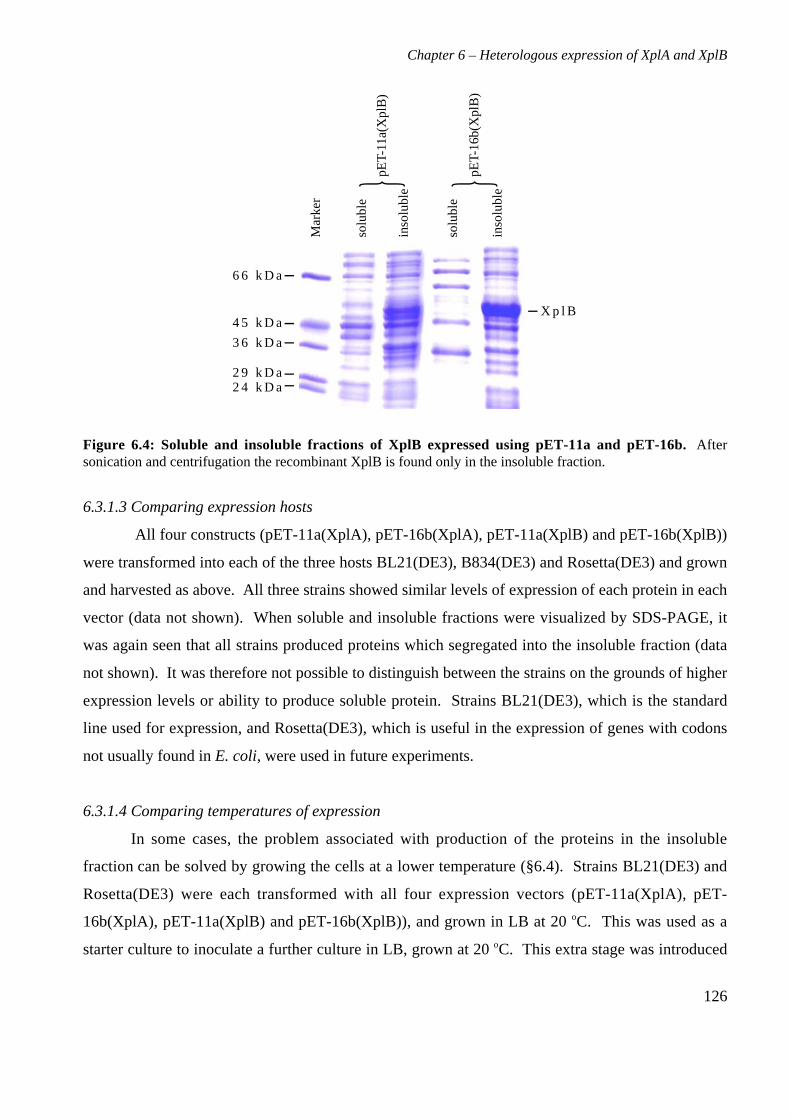
Chapter 6 – Heterologous expression of XplA and XplB
126
X p l B
6 6 k D a
4 5 k D a
3 6 k D a
2 9 k D a2 4 k D a
Mar
ker
solu
ble
inso
lubl
e
solu
ble
inso
lubl
e
pET-
11a(
Xpl
B)
pET-
16b(
Xpl
B)
Figure 6.4: Soluble and insoluble fractions of XplB expressed using pET-11a and pET-16b. Aftersonication and centrifugation the recombinant XplB is found only in the insoluble fraction.
6.3.1.3 Comparing expression hosts
All four constructs (pET-11a(XplA), pET-16b(XplA), pET-11a(XplB) and pET-16b(XplB))
were transformed into each of the three hosts BL21(DE3), B834(DE3) and Rosetta(DE3) and grown
and harvested as above. All three strains showed similar levels of expression of each protein in each
vector (data not shown). When soluble and insoluble fractions were visualized by SDS-PAGE, it
was again seen that all strains produced proteins which segregated into the insoluble fraction (data
not shown). It was therefore not possible to distinguish between the strains on the grounds of higher
expression levels or ability to produce soluble protein. Strains BL21(DE3), which is the standard
line used for expression, and Rosetta(DE3), which is useful in the expression of genes with codons
not usually found in E. coli, were used in future experiments.
6.3.1.4 Comparing temperatures of expression
In some cases, the problem associated with production of the proteins in the insoluble
fraction can be solved by growing the cells at a lower temperature (§6.4). Strains BL21(DE3) and
Rosetta(DE3) were each transformed with all four expression vectors (pET-11a(XplA), pET-
16b(XplA), pET-11a(XplB) and pET-16b(XplB)), and grown in LB at 20 oC. This was used as a
starter culture to inoculate a further culture in LB, grown at 20 oC. This extra stage was introduced
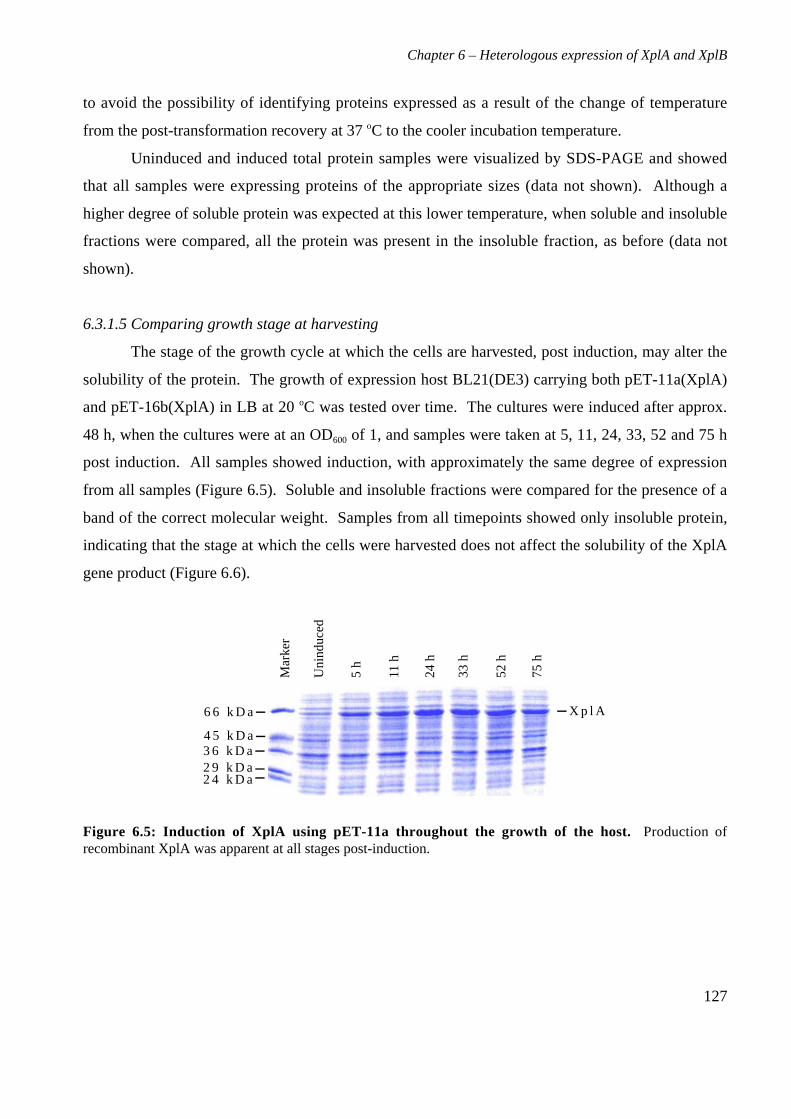
Chapter 6 – Heterologous expression of XplA and XplB
127
to avoid the possibility of identifying proteins expressed as a result of the change of temperature
from the post-transformation recovery at 37 oC to the cooler incubation temperature.
Uninduced and induced total protein samples were visualized by SDS-PAGE and showed
that all samples were expressing proteins of the appropriate sizes (data not shown). Although a
higher degree of soluble protein was expected at this lower temperature, when soluble and insoluble
fractions were compared, all the protein was present in the insoluble fraction, as before (data not
shown).
6.3.1.5 Comparing growth stage at harvesting
The stage of the growth cycle at which the cells are harvested, post induction, may alter the
solubility of the protein. The growth of expression host BL21(DE3) carrying both pET-11a(XplA)
and pET-16b(XplA) in LB at 20 oC was tested over time. The cultures were induced after approx.
48 h, when the cultures were at an OD600 of 1, and samples were taken at 5, 11, 24, 33, 52 and 75 h
post induction. All samples showed induction, with approximately the same degree of expression
from all samples (Figure 6.5). Soluble and insoluble fractions were compared for the presence of a
band of the correct molecular weight. Samples from all timepoints showed only insoluble protein,
indicating that the stage at which the cells were harvested does not affect the solubility of the XplA
gene product (Figure 6.6).
6 6 k D a
4 5 k D a3 6 k D a2 9 k D a2 4 k D a
X p l A
Mar
ker
Uni
nduc
ed
5 h
11 h
24 h
33 h
52 h
75 h
Figure 6.5: Induction of XplA using pET-11a throughout the growth of the host. Production ofrecombinant XplA was apparent at all stages post-induction.
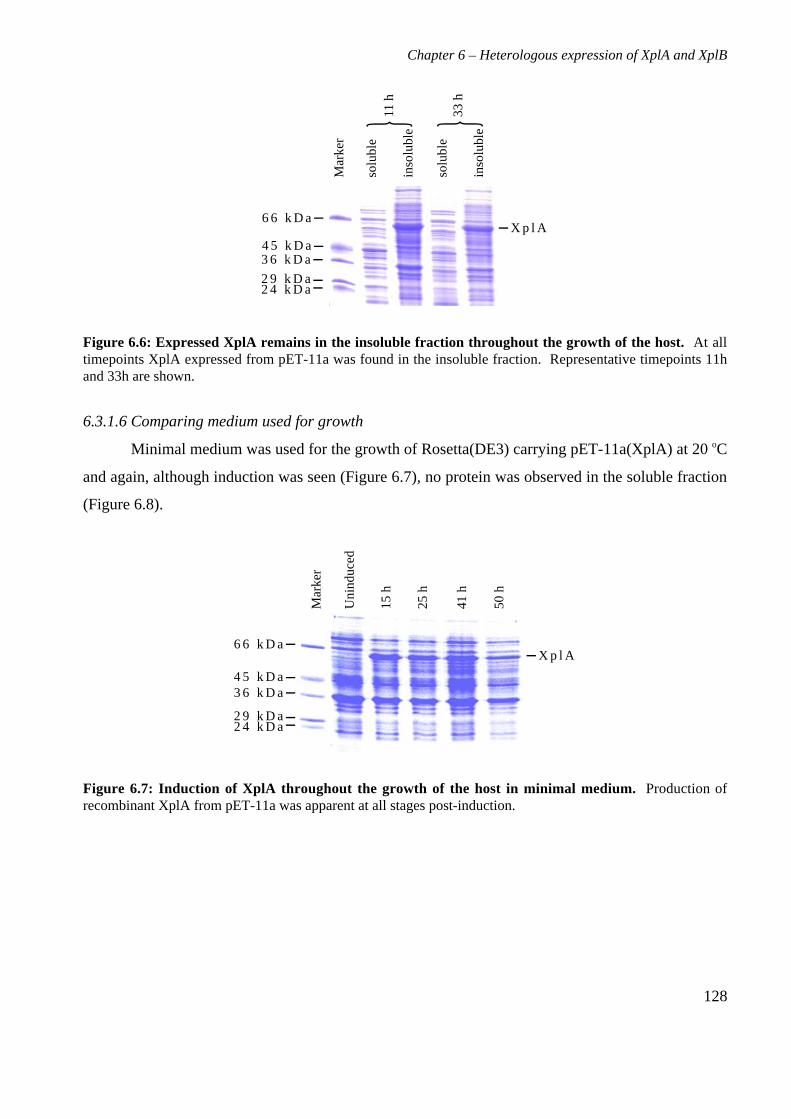
Chapter 6 – Heterologous expression of XplA and XplB
128
6 6 k D a
4 5 k D a3 6 k D a
2 9 k D a2 4 k D a
X p l A
Mar
ker
11 h
33 h
solu
ble
inso
lubl
e
solu
ble
inso
lubl
e
Figure 6.6: Expressed XplA remains in the insoluble fraction throughout the growth of the host. At alltimepoints XplA expressed from pET-11a was found in the insoluble fraction. Representative timepoints 11hand 33h are shown.
6.3.1.6 Comparing medium used for growth
Minimal medium was used for the growth of Rosetta(DE3) carrying pET-11a(XplA) at 20 oC
and again, although induction was seen (Figure 6.7), no protein was observed in the soluble fraction
(Figure 6.8).
Mar
ker
Uni
nduc
ed
15 h
25 h
41 h
50 h
6 6 k D a
4 5 k D a3 6 k D a
2 9 k D a2 4 k D a
X p l A
Figure 6.7: Induction of XplA throughout the growth of the host in minimal medium. Production ofrecombinant XplA from pET-11a was apparent at all stages post-induction.
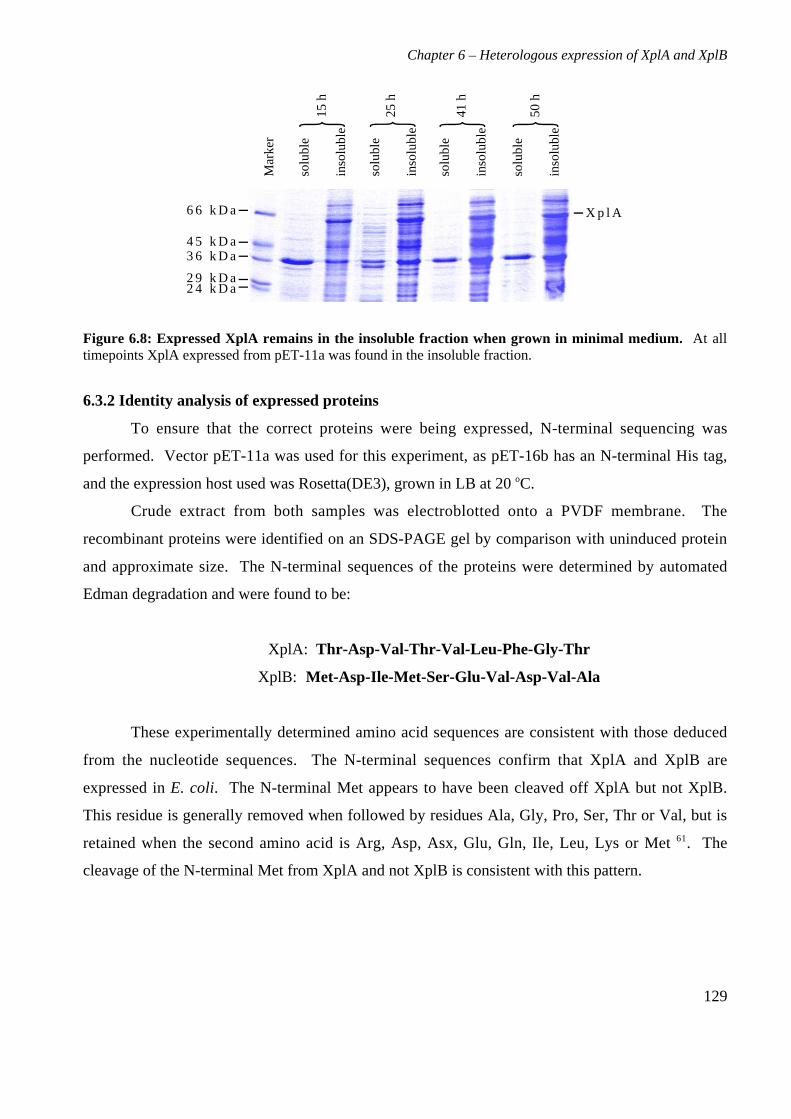
Chapter 6 – Heterologous expression of XplA and XplB
129
Mar
ker
15 h
25 h
41 h
50 h
6 6 k D a
4 5 k D a3 6 k D a
2 9 k D a2 4 k D a
X p l A
solu
ble
inso
lubl
e
solu
ble
inso
lubl
e
solu
ble
inso
lubl
e
solu
ble
inso
lubl
e
Figure 6.8: Expressed XplA remains in the insoluble fraction when grown in minimal medium. At alltimepoints XplA expressed from pET-11a was found in the insoluble fraction.
6.3.2 Identity analysis of expressed proteins
To ensure that the correct proteins were being expressed, N-terminal sequencing was
performed. Vector pET-11a was used for this experiment, as pET-16b has an N-terminal His tag,
and the expression host used was Rosetta(DE3), grown in LB at 20 oC.
Crude extract from both samples was electroblotted onto a PVDF membrane. The
recombinant proteins were identified on an SDS-PAGE gel by comparison with uninduced protein
and approximate size. The N-terminal sequences of the proteins were determined by automated
Edman degradation and were found to be:
XplA: Thr-Asp-Val-Thr-Val-Leu-Phe-Gly-Thr
XplB: Met-Asp-Ile-Met-Ser-Glu-Val-Asp-Val-Ala
These experimentally determined amino acid sequences are consistent with those deduced
from the nucleotide sequences. The N-terminal sequences confirm that XplA and XplB are
expressed in E. coli. The N-terminal Met appears to have been cleaved off XplA but not XplB.
This residue is generally removed when followed by residues Ala, Gly, Pro, Ser, Thr or Val, but is
retained when the second amino acid is Arg, Asp, Asx, Glu, Gln, Ile, Leu, Lys or Met 61. The
cleavage of the N-terminal Met from XplA and not XplB is consistent with this pattern.
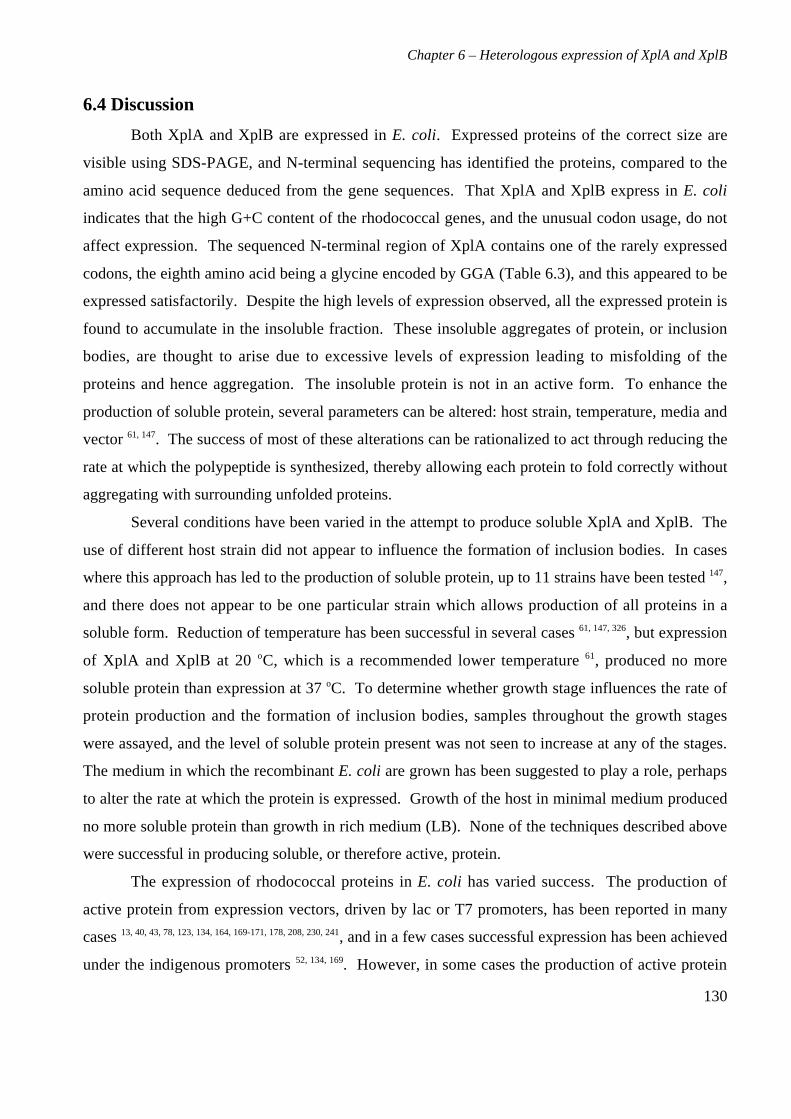
Chapter 6 – Heterologous expression of XplA and XplB
130
6.4 Discussion
Both XplA and XplB are expressed in E. coli. Expressed proteins of the correct size are
visible using SDS-PAGE, and N-terminal sequencing has identified the proteins, compared to the
amino acid sequence deduced from the gene sequences. That XplA and XplB express in E. coli
indicates that the high G+C content of the rhodococcal genes, and the unusual codon usage, do not
affect expression. The sequenced N-terminal region of XplA contains one of the rarely expressed
codons, the eighth amino acid being a glycine encoded by GGA (Table 6.3), and this appeared to be
expressed satisfactorily. Despite the high levels of expression observed, all the expressed protein is
found to accumulate in the insoluble fraction. These insoluble aggregates of protein, or inclusion
bodies, are thought to arise due to excessive levels of expression leading to misfolding of the
proteins and hence aggregation. The insoluble protein is not in an active form. To enhance the
production of soluble protein, several parameters can be altered: host strain, temperature, media and
vector 61, 147. The success of most of these alterations can be rationalized to act through reducing the
rate at which the polypeptide is synthesized, thereby allowing each protein to fold correctly without
aggregating with surrounding unfolded proteins.
Several conditions have been varied in the attempt to produce soluble XplA and XplB. The
use of different host strain did not appear to influence the formation of inclusion bodies. In cases
where this approach has led to the production of soluble protein, up to 11 strains have been tested 147,
and there does not appear to be one particular strain which allows production of all proteins in a
soluble form. Reduction of temperature has been successful in several cases 61, 147, 326, but expression
of XplA and XplB at 20 oC, which is a recommended lower temperature 61, produced no more
soluble protein than expression at 37 oC. To determine whether growth stage influences the rate of
protein production and the formation of inclusion bodies, samples throughout the growth stages
were assayed, and the level of soluble protein present was not seen to increase at any of the stages.
The medium in which the recombinant E. coli are grown has been suggested to play a role, perhaps
to alter the rate at which the protein is expressed. Growth of the host in minimal medium produced
no more soluble protein than growth in rich medium (LB). None of the techniques described above
were successful in producing soluble, or therefore active, protein.
The expression of rhodococcal proteins in E. coli has varied success. The production of
active protein from expression vectors, driven by lac or T7 promoters, has been reported in many
cases 13, 40, 43, 78, 123, 134, 164, 169-171, 178, 208, 230, 241, and in a few cases successful expression has been achieved
under the indigenous promoters 52, 134, 169. However, in some cases the production of active protein
Chapter 6 – Heterologous expression of XplA and XplB
131
from rhodococcal genes in E. coli has not been possible to achieve 13, 152, 200, 272, 285. Although
expression of the proteins is apparent, through visualization on SDS-PAGE, the protein present is
not active 152, 285. In some cases, activity can be detected in low levels when the protein sample is
treated with urea and dialysed 152, 169. The problems associated with expression in E. coli can
sometimes be avoided by expression in other strains, such as Pseudomonas putida 200 or
Streptomyces lividans 285, but expression in alternative strains does not always work 272. Therefore
there do not appear to be any foolproof methods for the heterologous expression of rhodococcal
proteins, and a pragmatic approach appears be necessary.
Both microsomal and microbial P450s have been expressed in E. coli. Microsomal P450s
are membrane-bound (http://drnelson.utmem.edu/PIR.P450.description.html), and the hydrophobic
N-terminal domain commonly requires modification for expression in E. coli and targeting to host
membranes 119. The production of soluble microbial proteins has been achieved under various
conditions. P450s from Streptomyces species, Bacillus subtilis and Citrobacter braakii have been
expressed using pET vectors or pCW 307 and several E. coli host strains 19, 113, 140, 141, 185, 186, 295. Growth
in rich medium at temperatures between 25 and 37 oC results in the production of soluble and, in
most cases, active protein. The haem precursor δ-aminolaevulinic acid can be added to increase the
levels of active protein 181, 186, although soluble protein must be available in the first place. There are
very few examples of the expression of rhodococcal P450s in an E. coli host. Heterologous
expression of thcB, a P450 from Rhodococcus sp. involved in herbicide degradation, was achieved,
as assayed by SDS-PAGE, although no activity was reported 210. A further study with this gene
showed that only very low levels of expression were achieved in E. coli from its own promoter 273.
A novel type of P450 has been expressed in E. coli using pET3a, and was produced in the soluble
fraction when the host was grown at 30 oC 246. This protein was active and produced a peak at 450
nm when a carbon monoxide difference spectrum was performed. There appear to be no inherent
problems associated with the expression of recombinant P450s in E. coli, although the expression of
rhodococcal P450s may prove more difficult.
Active forms of both bovine and rat adrenodoxin reductase have been produced in E. coli 255,
256, as has human ferredoxin reductase, at a low yield 39, and a homologue from Mycobacterium
tuberculosis, FprA, although soluble protein was only obtained at temperatures as low as 15 oC 92.
However, a similar protein from M. tuberculosis, FprB, which has a ferredoxin-like domain at the
N-terminus, was not expressed in the soluble fraction even at this reduced temperature 92. The
Chapter 6 – Heterologous expression of XplA and XplB
132
amount of soluble bovine adrenodoxin reductase produced in E. coli was increased greatly by the
co-expression of chaperone proteins, such as HSP60 319.
There are yet more approaches to attempt with regard to the heterologous expression of
XplA and XplB. The production of inclusion bodies can aid the purification of a protein, as soluble
proteins are eliminated within one step. However, it is not always straightforward to obtain active
protein this way. Resolubilization of the protein involves total denaturation, commonly using urea
or guanidine, and refolding to obtain native protein. The refolding protocol varies for each protein
and must be determined empirically, and is not always successful 61. The incorporation of the
relevant prosthetic groups (haem, FMN and FAD) during refolding may make the procedure more
complex.
Alternative approaches to obtaining soluble protein include the use of weaker promoters,
changing the pH of the growth medium, encouraging secretion of the protein to the periplasm and
producing the protein in a fusion construct 61. Altering the pH of the growth medium can have an
effect on the solubility of the protein: in the case of salmon growth hormone a higher pH aided
solubility 147. Another idea would be to clone the xplA and xplB genes under promoters which are
not as strong as the T7 promoter of the pET vectors. Recombinant proteins previously have been
expressed from lac promoters in vectors such as pUC19 and pBluescript, using a non-DE3
expression host with pBluescript to ensure correct induction. This was not attempted in this study as
alternative cloning sites would have to be engineered upstream and downstream of the genes, as the
sites which allow cloning into pET vectors are not compatible with those required for cloning into
either pBluescript or pUC19, and the time remaining on the project was limiting.
Secretion can be used as a way of obtaining soluble protein and also separating it from
cytoplasmic proteins, which can be a useful step in purification. A secretory tag can be engineered
to the N-terminus of the protein, and which targets the protein for periplasmic export. One example
of this is the OmpT leader sequence which is present in pET-12 vectors. There are specific
protocols which allow the separation of periplasmic proteins from the rest of the cellular proteins 61.
Fusion of the protein to be expressed to a carrier protein has also been used successfully. A survey
of some of the purifications performed in this way is given in Coligan et al. 61. Commonly used
carrier proteins include maltose binding protein, glutathione S-transferase and thioredoxin, all of
which encourage the accumulation of protein in a soluble form. Constructs exist for all of these,
containing sites to allow the subsequent cleavage of the carrier. Overexpression of E. coli
chaperone proteins, to encourage correct folding of the recombinant protein, can also help in the
Chapter 6 – Heterologous expression of XplA and XplB
133
production of soluble protein 147, 326, as described above for the production of adrenodoxin reductase.
Exposing the host cells to heat shock, cold shock or osmotic shock can improve expression and
activity of P450s, which may also act through the production of molecular chaperones 158.
The expression of XplA and XplB using these methods should be attempted, in order to
produce soluble protein. Haem incorporation can then be determined by 3,3’,5,5’-
tetramethylbenzidine-peroxide staining of native gels 304, and flavin presence determined using
HPLC, TLC or spectrophotometric assays 94, 107, 231, 233, 299. The presence of an active P450 can be
determined by performing a reduced carbon monoxide difference spectrum, when a peak at approx.
450 nm should be produced 224. Activity against RDX can be assayed by reconstituting a system
using crude extracts containing each expressed protein, and purification attempted subsequently. A
system consisting of purified XplA and XplB will give information on the use of the flavodoxin
domain in electron transport, and if the system is not active, commercially obtained ferredoxin may
be useful in completing the system. If the flavodoxin domain is active in this role, it would
represent a novel P450 system. When a fully purified, operational system is obtained, more accurate
information regarding the products of RDX degradation can be obtained, including mass balance
analysis. Alternative substrates can be tested with the enzyme system, which may lead to insights
regarding the degradation of the nitramine explosives HMX and CL20.
Chapter 7 – Final discussion
134
Chapter 7. Final discussion
This study aimed to isolate bacteria capable of degrading RDX from contaminated sites, to
isolate the gene required for the ability to break down RDX, and to investigate this activity.
Nineteen bacterial strains were isolated from contaminated material through their ability to degrade
RDX as a sole source of nitrogen. These were characterized and identified; all were found to be
members of the genus Rhodococcus, with thirteen of the strains being most closely related to
Rhodococcus erythropolis, four of the strains having a closest match to RDX degrading bacterium
Rhodococcus sp. strain DN22 59 and two matching a further Rhodococcus species. Further
characterization compared the strains to each other and R. rhodochrous strain 11Y, a previously
isolated RDX degrader, and found them all to be distinct strains. Comparisons of the activities of all
isolates against RDX in resting cell incubations showed that the activities varied widely between the
strains, from 0 % to 100 % degradation of 250 µM RDX over 60 min.
Based on these comparisons one strain was selected for further study. It was chosen to have
a high rate of RDX degradation, antibiotic susceptibilities compatible with a range of rhodococcal
plasmids and a non-mucoid phenotype to enable ease of transformation and manipulation. The
chosen isolate was Rhodococcus rhodochrous strain 11Y.
Comparisons of the RDX degrading rate of strain 11Y found it comparable to, or faster than,
other characterized aerobic strains 27, 59, 157, 338. Strain 11Y appears to use three of the six nitrogens
from RDX, as do other reported strains 27, 59. Resting cell incubations demonstrated that the activity
in strain 11Y is present in cells grown with ammonium provided as the sole source of nitrogen, but
is increased when grown in the presence of RDX. This indicates that the gene is expressed in the
absence of RDX, but is upregulated in its presence. This experiment also showed that the nitrite
reductase of strain 11Y appears to be upregulated in the presence of either RDX or the nitrite
produced from its breakdown. Despite the ability of strain 11Y to degrade RDX, it is not able to
degrade the closely related nitramine explosives HMX and CL20. It is possible that the uptake of
these compounds by the cells is not possible, and that use of a purified enzyme system would allow
degradation of these compounds, or it may be the case that they are sterically hindered from binding
in the active site.
A preliminary study of the products formed from RDX degradation by strain 11Y was
performed, analysing the products of resting cell incubations over time using HPLC, ion
chromatography and a colorimetric test for formaldehyde. Many of the products proposed to form
Chapter 7 – Final discussion
135
from RDX degradation would be detectable using these techniques. The products detected were
nitrite, formate and formaldehyde, with no indication of ammonium or nitrate presence, or any dead
end product accumulation. The mechanism proposed for RDX degradation by R. rhodochrous strain
DN22 invokes an initial denitration step, followed by ring cleavage to form formaldehyde
(eventually carbon dioxide), ammonium and a dead end product 95. The products of the reaction
using strain 11Y are consistent with a mechanism of denitration of RDX, followed by spontaneous
decomposition of the molecule although the products are not entirely consistent with those
determined using strain DN22. The different products can be explained by different competing
reactions within the bacteria. It is also conceivable that different products were observed as a result
of the different techniques used in determining them. To eliminate this possibility, the group who
studied the pathway using DN22 are to perform the same experiments using strain 11Y, which may
provide a useful and interesting comparison. The only way to unequivocally establish the initial
step and the resulting compounds would be to follow the reaction using a purified enzyme system.
Using a gene library from Rhodococcus rhodochrous strain 11Y DNA, the ability to degrade
RDX was conferred to a non RDX degrading strain of R. rhodochrous. The fragment of DNA
which conferred this ability was sequenced and found to contain three open reading frames: an
adrenodoxin reductase-like gene, a P450-like gene and a gene with homology to acetyl CoA
synthase. Subcloning experiments showed that the genes with homologies to acetyl CoA synthase
and adrenodoxin reductase were not required for RDX degrading activity in the rhodococcal host
strain. The gene coding for the P450-like protein, which was necessary for RDX degrading activity,
contains a flavodoxin domain at the N-terminus, and was designated xplA. The involvement of a
P450 in the degradation of RDX in strain 11Y was strongly inferred, as the P450 inhibitor
metyrapone inhibited the degradation of RDX in resting cells.
Bacterial, type I, P450s are only one part of a multicomponent system consisting of a haem
containing P450, an FAD containing reductase and an iron sulphur ferredoxin, whereas type II,
eukaryotic, P450 systems comprise a P450 and a reductase containing both FAD and FMN domains,
with no ferredoxin type protein 74. As a reductase is necessary in the system, it is possible that the
protein encoded by the reductase-like gene found directly upstream of xplA, designated xplB, is
involved in the RDX degrading reaction. XplB may be able to be substituted by a similar protein in
the rhodococcal host, explaining why a vector carrying only xplA is able to confer RDX degradation
upon it. In addition, it is a distinct possibility that the flavodoxin domain at the N-terminal end of
XplA is able to function in the role normally performed by ferredoxins, in shuttling electrons from
Chapter 7 – Final discussion
136
the reductase to the P450. Flavodoxins are able to perform the same electron transport functions as
ferredoxins in some situations 309, and several P450 systems containing fused components have been
reported. P450BM-3 contains the FAD, FMN and haem domains in one polypeptide 212, and a new
class of self-sufficient P450 contains FeS, FMN and haem domains, again in one polypeptide 246. It
is not unlikely that further rearrangements and fused systems will be discovered in the future. It is
also common to find genes involved in xenobiotic degradation in gene clusters containing other
genes required in the pathway. This is true of P450 systems and other genes involved in degradative
pathways 53, 66, 96, 97, 104, 210. The function of the reductase-like XplB and the flavodoxin domain in the
transport of electrons to XplA during RDX degradation has not been proved, and cannot be until
pure proteins are available to reconstitute the system in vitro. However, XplA has already been
described as unique by the P450 nomenclature committee, who have given it the new family name
of CYP177A1.
Although mechanisms have been proposed for many of the reactions catalysed by P450s,
including dealkylation, epoxidation, dehydrogenation, dehalogenation, sulfoxidation and
aromatization 262, the degradation of RDX is not obviously comparable to any of them. Some less
common reactions of P450s have been reviewed 120, and some of these may be applicable to the
breakdown of RDX. The denitration of the nitrate ester GTN, catalysed by a P450, has been
reported to occur under anaerobic conditions 75. The reaction required the presence of NADPH and
was inhibited by oxygen, carbon monoxide, and specific P450 inhibitors. The proposed reaction
mechanism involves donation of 2 electrons sequentially to the substrate, forming first a radical with
the release of nitrite, and subsequently reduction of the radical 75. However, the nitrate ester group
cannot be considered equivalent to a nitramine group in the context of this reaction, and the
denitration of RDX by this mechanism would be very unlikely to occur.
There are reports of the action of P450s on nitrogen-nitrogen compounds, including azo
compounds, where the N=N bond is reduced to N-N and further reduction leads to cleavage of the
N-N bond 145, 334, as is seen in RDX degradation. These reactions were most efficient in anaerobic
conditions, and it was proposed that reductions can only occur in the absence of oxygen 108. More
recently it has been suggested that the binding of particular substrates may inhibit oxygen binding,
allowing the substrate to be reduced by the P450 in place of oxygen 120. However, the denitration of
the P450 appears not to be a reductive process, so a comparison to this reaction may not be relevant.
P450s are monooxygenase enzymes, and their general mechanism involves the incorporation
of one atom from O2 into a substrate with the reduction of the other atom by two electrons provided
Chapter 7 – Final discussion
137
by the associated ferredoxin 262. Thus the typical reaction is one of substrate hydroxylation. The
catalytic cycle involves binding of the substrate followed by reduction of the iron from FeIII to FeII.
Oxygen binding to the iron and a further reduction results in the production of a peroxo
intermediate. Water is released by cleavage of the O-O bond, the substrate is oxygenated and the
enzyme recycled.
One of the steps proposed in the oxidation of substrates is the abstraction of a proton by a
hypothesized FeO3+ species, which is shortly followed by substrate oxygenation 120. The proton
abstraction reaction is the same as that proposed to occur during the alkaline hydrolysis of RDX,
forming an unstable intermediate which spontaneously decomposes in alkaline conditions 148 (Figure
1.4). However, the decomposition is not likely to occur at a neutral pH, and the hydroxylation of
one of the carbons of RDX is the more likely result. Hydroxylation of a carbon would be necessary
to create the products formate and formaldehyde, but the subsequent liberation of nitrite is not easily
rationalized unless the RDX is significantly destabilized by the hydroxylation. To have a chance of
determining the precise nature of the degradation mechanism a pure protein system is required.
The heterologous expression of XplA and XplB in E. coli has produced proteins of the
predicted size, and N-terminal sequences have confirmed their identities. However, both are found
in the insoluble fraction, forming inclusion bodies. Several of the growth conditions, including host
strain, growth temperature, growth medium and stage of harvesting, were altered, with no observed
increase in the production of soluble protein. For future expression of the proteins, a number of
approaches can be attempted to obtain active recombinant protein. Refolding of the insoluble
proteins may form active protein, if the relevant prosthetic groups are included. Factors which may
be further altered to aid the expression of soluble proteins include: vectors, expression strains, co-
expression of chaperone proteins, heat, cold or osmotic shock, targeting to the periplasmic space and
construction of fusion proteins 61, 147, 158.
The purification of the enzymes XplA and XplB are central to the continuation of this
project. Reconstitution of the system in vitro will give information on the involvement of the
reductase enzyme and flavodoxin domain within XplA. This could then provide information on a
new class of P450. A pure enzyme system should also be used to thoroughly elucidate the products
of RDX degradation. Until this is performed, the possibility of undesirable products remains, and
RDX mineralization cannot be proven. This would also give information on how the reaction is
catalysed by the P450, whereas currently the enzymatic mechanism can only be postulated.
Crystallization of the enzyme, with and without substrate, would give information on the reaction
Chapter 7 – Final discussion
138
occurring within the active site. Substrate range should also be investigated. The possibility that
pure enzyme could catalyse the degradation of other nitramine explosives and related compounds
might provide information on the reason for the lack of degradation in vivo, and would make the
enzyme system of even more value with respect to bioremediation.
Possibly the most exciting work that could follow on from this thesis, is also the most
applied, and an obvious next step would be to engineer the genes isolated here into plants, to allow
breakdown of contaminating RDX. Transgenic plants engineered to express bacterial genes have
been very successful in the phytoremediation of other groups of explosives. Although RDX is not
toxic to plants at concentrations up to 21 mg/l 306, it is taken up by plants 20, 21, 132, 245, 306 and
accumulates in the leaves 20, 21, 132, 306. Here it does not appear to be transformed or degraded
significantly although there are reports of small amounts of bound forms of RDX found
intracellularly 22, 237. This accumulation of RDX leads to issues regarding its movement through the
food chain, as it is found at high concentrations in the edible portions of the plants. Therefore if
phytoremediation of explosive contaminated land is to proceed using transgenic plants, the plants
should be engineered to be able to break down the RDX, instead of accumulating it. The transgenic
plants should be able to decontaminate soil and groundwater to significant depths through their root
systems. In particular the use of the fast growing and deep rooted yellow poplar is being considered
for this type of research, and transformation techniques have already been performed using this
plant, demonstrating proof of principle 253.
References
139
References
1. Picric Acid MSDS. Report
http://www.fishersci.ca/msds.nsf/96cb2019dad1311a85256670001d92b9/61568df95178f04a852566f
1000b39b0?OpenDocument. Acros Organics, Geel, Belgium.
2. Accashian, J.V., Vinopal, R.T., Kim, B.-J. and Smets, B.F. (1998) Aerobic growth on nitroglycerin as
the sole carbon, nitrogen, and energy source by a mixed bacterial culture. Appl. Environ. Microbiol.
64:3300-3304.
3. Adams, G.F. and Shaw, R.W. (1992) Chemical reactions in energetic materials. Annu. Rev. Phys. Chem.
43:311-340.
4. Allen, C.C.R., Boyd, D.R., Larkin, M.J., Reid, K.A., Sharma, N.D. and Wilson, K. (1997) Metabolism
of naphthalene, 1-naphthol, indene, and indole by Rhodococcus sp. strain NCIMB 12038. Appl.
Environ. Microbiol. 63:151-155.
5. Altschul, S.F., Gish, W., Miller, W., Myers, E.W. and Lipman, D.J. (1990) Basic local alignment
search tool. J. Mol. Biol. 215:403-410.
6. Altschul, S.F., Madden, T.L., Schaffer, A.A., Zhang, J., Zhang, Z., Miller, W. and Lipman, D.J.
(1997) Gapped BLAST and PSI-BLAST: a new generation of protein database search programs.
Nucleic Acids Res. 25:3389-3402.
7. Andersen, S.J., Quan, S., Gowan, B. and Dabbs, E.R. (1997) Monooxygenase-like sequence of a
Rhodococcus equi gene conferring increased resistance to rifampin by inactivating this antibiotic.
Antimicrob. Agents Chemother. 41:218-221.
8. Ausubel, F.M., Brent, R., Kingston, R.E., Moore, D.D., Seidman, J.G., Smith, J.A. and Struhl, K.
(ed.). (1987) Current protocols in molecular biology, Vol. 1. John Wiley and Sons, Inc.
9. Ausubel, F.M., Brent, R., Kingston, R.E., Moore, D.D., Seidman, J.G., Smith, J.A. and Struhl, K.
(ed.). (1994) Current protocols in molecular biology, Vol. 1. John Wiley and Sons, Inc.
10. Ausubel, F.M., Brent, R., Kingston, R.E., Moore, D.D., Seidman, J.G., Smith, J.A. and Struhl, K.
(ed.). (1994) Current protocols in molecular biology, Vol. 4. John Wiley and Sons, Inc.
11. Bailey, A. and Murray, S.G. (2000) Explosives, propellants and pyrotechnics. Redwoods Books,
Wiltshire.
12. Barber, R.D., Rott, M.A. and Donohue, T.J. (1996) Characterization of a glutathione-dependent
formaldehyde dehydrogenase from Rhodobacter sphaeroides. J. Bacteriol. 178:1386-1393.
13. Barnes, M.R., Duetz, W.A. and Williams, P.A. (1997) A 3-(3-hydroxyphenyl)propionic acid catabolic
pathway in Rhodococcus globerulus PWD1: cloning and characterization of the hpp operon. J.
Bacteriol. 179:6145-6153.
References
140
14. Bart, J.C., Judd, L.L., Hoffman, K.E., Wilkins, A.M. and Kusterbeck, A.W. (1997) Application of a
portable immunosensor to detect the explosives TNT and RDX in groundwater samples. Environ.
Sci. Technol. 31:1505-1511.
15. Beard, R.R. and Noe, J.T. (1982) Aromatic nitro and amino compounds, pp. 2413-2481. In Clayton, G.
D. and Clayton, F. E. (ed.), Patty's industrial hygiene and toxicology, Vol. 2A. John Wiley and Sons,
New York.
16. Behki, R., Topp, E., Dick, W. and Germon, P. (1993) Metabolism of the herbicide atrazine by
Rhodococcus strains. Appl. Environ. Microbiol. 59:1955-1959.
17. Behrend, C. and Heesche-Wagner, K. (1999) Formation of hydride-Meisenheimer complexes of picric
acid (2,4,6-trinitrophenol) and 2,4-dinitrophenol during mineralization of picric acid by Nocardioides
sp. strain CB 22-2. Appl. Environ. Microbiol. 65:1372-1377.
18. Behrens, R. (1990) Thermal decomposition of HMX and RDX: decomposition processes and
mechanisms based on STMBMS and TOF velocity-spectra measurements, pp. 347-368. In Bulusus,
S. N. (ed.), Chemistry and physics of energetic materials. Kluwer Academic Press, Dordrecht, The
Netherlands.
19. Bellamine, A., Mangla, A.T., Nes, W.D. and Waterman, M.R. (1999) Characterization and catalytic
properties of the sterol 14α-demethylase from Mycobacterium tuberculosis. Proc. Natl. Acad. Sci.
USA 96:8937-8942.
20. Best, E.P.H., Zappi, M.E., Fredrickson, H.L., Sprecher, S.L., Larson, S.L. and Ochman, M. (1997)
Screening of aquatic and wetland plant species for phytoremediation of explosives-contaminated
groundwater from the Iowa army ammunition plant. Ann. N.Y. Acad. Sci. 829:179-194.
21. Best, E.P.H., Sprecher, S.L., Larson, S.L., Fredrickson, H.L. and Bader, D.F. (1999) Environmental
behavior of explosives in groundwater from the Milan army ammunition plant in aquatic and wetland
plant treatments. Uptake and fate of TNT and RDX in plants. Chemosphere 39:2057-2072.
22. Bhadra, R., Wayment, D.G., Williams, R.K., Barman, S.N., Stone, M.B., Hughes, J.B. and Shanks,
J.V. (2001) Studies on plant-mediated fate of the explosives RDX and HMX. Chemosphere 44:1259-
1264.
23. Bhaumik, S., Christodoulatos, C., Korfiatis, G.P. and Brodman, B.W. (1997) Aerobic and anaerobic
biodegradation of nitroglycerin in batch and packed bed bioreactors. Water Sci. Technol. 36:139-146.
24. Bier, E.L., Singh, J., Li, Z., Comfort, S.D. and Shea, P.J. (1999) Remediating hexahydro-1,3,5-trinitro-
1,2,5-triazine-contaminated water and soil by Fenton oxidation. Environ. Toxicol. Chem. 18:1078-
1084.
25. Bigey, F., Janbon, G., Arnaud, A. and Galzy, P. (1995) Sizing of the Rhodococcus sp. R312 genome
by pulsed-field gel electrophoresis. Localization of genes involved in nitrile degradation. Antonie
Van Leeuwenhoek 68:173-179.
References
141
26. Bigey, F., Chebrou, H., Fournand, D. and Arnaud, A. (1999) Transcriptional analysis of the nitrile-
degrading operon from Rhodococcus sp. ACV2 and high level production of recombinant amidase
with an Escherichia coli-T7 expression system. J. Appl. Microbiol. 86:752-760.
27. Binks, P.R., Nicklin, S. and Bruce, N.C. (1995) Degradation of hexahydro-1,3,5-trinitro-1,3,5-triazine
(RDX) by Stenotrophomonas maltophilia PB1. Appl. Environ. Microbiol. 61:1318-1322.
28. Binks, P.R., French, C.E., Nicklin, S. and Bruce, N.C. (1996) Degradation of pentaerythritol
tetranitrate by Enterobacter cloacae PB2. Appl. Environ. Microbiol. 62:1214-1219.
29. Blehert, D.S., Fox, B.G. and Chambliss, G.H. (1999) Cloning and sequence analysis of two
Pseudomonas flavoprotein xenobiotic reductases. J. Bacteriol. 181:6254-6263.
30. Boopathy, R., Gurgas, M., Ullian, J. and Manning, J.F. (1998) Metabolism of explosive compounds
by sulfate-reducing bacteria. Curr. Microbiol. 37:127-131.
31. Boopathy, R., Manning, J. and Kulpa, C.F. (1998) Biotransformation of explosives by anaerobic
consortia in liquid culture and in soil slurry. Int. Biodeterior. Biodegrad. 41:67-74.
32. Boopathy, R., Kulpa, C.F. and Manning, J. (1998) Anaerobic biodegradation of explosives and related
compounds by sulfate-reducing and methanogenic bacteria: A review. Bioresource Technol. 63:81-
89.
33. Boopathy, R. (2001) Enhanced biodegradation of cyclotetramethylenetetranitramine (HMX) under mixed
electron-acceptor condition. Bioresour. Technol. 76:241-244.
34. Bose, P., Glaze, W.H. and Maddox, D.S. (1998) Degradation of RDX by various advanced oxidation
processes: II. organic by-products. Water Res. 32:1005-1018.
35. Botterman, J. and Zabeau, M. (1985) High-level production of the EcoR I endonuclease under the
control of the pL promoter of bacteriophage lambda. Gene 37:229-239.
36. Bowden, G.H. and Goodfellow, M. (1990) The actinomyctetes: Actinomyces, Nocardia and related
genera, pp. 31-57. In Parker, M. T. and Duerden, B. I. (ed.), Topley and Wilson's principles of
bacteriology, virology and immunity, Vol. 2. Edward Arnold, London.
37. Bower, S., Perkins, J.B., Yocum, R.R., Howitt, C.L., Rahaim, P. and Pero, J. (1996) Cloning,
sequencing, and characterization of the Bacillus subtilis biotin biosynthetic operon. J. Bacteriol.
178:4122-4130.
38. Brandao, P.F.B., Clapp, J.P. and Bull, A.T. (2002) Discrimination and taxonomy of geographically
diverse strains of nitrile-metabolizing actinomycetes using chemometric and molecular sequencing
techniques. Environ. Microbiol. 4:262-276.
39. Brandt, M.E. and Vickery, L.E. (1992) Expression and characterization of human mitochondrial
ferredoxin reductase in Escherichia coli. Arch. Biochem. Biophys. 294:735-740.
References
142
40. Bresler, M.M., Rosser, S.J., Basran, A. and Bruce, N.C. (2000) Gene cloning and nucleotide
sequencing and properties of a cocaine esterase from Rhodococcus sp. strain MB1. Appl. Environ.
Microbiol. 66:904-908.
41. Broder, M.F. and Westmoreland, R.A. (1998) An estimate of soils contaminated with secondary
explosives. Report SFIM-AEC-ET-CR-98002. Tennessee Valley Authority, Alabama.
42. Brown, G.I. (1998) The big bang - A history of explosives. Sutton Publishing, Bridgend.
43. Brunhuber, N.M.W., Banerjee, A., Jacobs, W.R. and Blanchard, J.S. (1994) Cloning, sequencing,
and expression of Rhodococcus L-phenylalanine dehydrogenase. Sequence comparisons to amino-
acid dehydrogenases. J. Biol. Chem. 269:16203-16211.
44. Bruns-Nagel, D., Steinbach, K., Gemsa, D. and von Low, E. (2000) Composting (humification) of
nitroaromatic compounds, pp. 357-394. In Spain, J. C., Hughes, J. B., and Knackmuss, H.-J. (ed.),
Biodegradation of nitroaromatic compounds and explosives. CRC Press, Boca Raton, Fla.
45. Bryant, C. and DeLuca, M. (1991) Purification and characterization of an oxygen-insensitive NAD(P)H
nitroreductase from Enterobacter cloacae. J. Biol. Chem. 266:4119-4125.
46. Bunch, A.W. (1998) Biotransformation of nitriles by rhodococci. Antonie Van Leeuwenhoek 74:89-97.
47. Burdette, L.J., Cook, L.L. and Dyer, R.S. (1988) Convulsant properties of
cyclotrimethylenetrinitramine (RDX): spontaneous, audiogenic, and amygdaloid kindled seizure
activity. Toxicol. Appl. Pharmacol. 92:436-444.
48. Burnett, R.M., Darling, G.D., Kendall, D.S., LeQuesne, M.E., Mayhew, S.G., Smith, W.W. and
Ludwig, M.L. (1974) The structure of the oxidised form of clostridial flavodoxin at 1.9-A resolution.
J. Biol. Chem. 249:4383-4392.
49. Burton, D.T., Turley, S.D. and Peters, G.T. (1994) The acute and chronic toxicity of hexahydro-1,3,5-
trinitro- 1,3,5-triazine (RDX) to the fathead minnow (Pimephales promelas). Chemosphere 29:567-
579.
50. Burton, D.T., Turley, S.D. and Peters, G.T. (1994) The toxicity of hexahydro-1,3,5-trinitro-1,3,5-
triazine (RDX) to the freshwater green alga Selenastrum capricornutum. Water Air Soil Pollut.
76:449-457.
51. Burton, D.T. and Turley, S.D. (1995) Reduction of hexahydro-1,3,5-trinitro-1,3,5-triazine (RDX)
toxicity to the cladoceran Ceriodaphnia dubia following photolysis in sunlight. Bull. Environ.
Contam. Toxicol. 55:89-95.
52. Candidus, S., van Pee, K.-H. and Lingens, F. (1994) The catechol 2,3-dioxygenase gene of
Rhodococcus rhodochrous CTM: nucleotide sequence, comparison with isofunctional dioxygenases
and evidence for an active-site histidine. Microbiology (SGM) 140:321-330.
References
143
53. Chauvaux, S., Chevalier, F., Le Dantec, C., Fayolle, F., Miras, I., Kunst, F. and Beguin, P. (2001)
Cloning of a genetically unstable cytochrome P-450 gene cluster involved in degradation of the
pollutant ethyl-tert-butyl ether by Rhodococcus ruber. J. Bacteriol. 183:6551-6557.
54. Cheng, S.-C. and Modrich, P. (1983) Positive-selection cloning vehicle useful for overproduction of
hybrid proteins. J. Bacteriol. 154:1005-1008.
55. Christodoulatos, C., Bhaumik, S. and Brodman, B.W. (1997) Anaerobic biodegradation of
nitroglycerin. Water Res. 31:1462-1470.
56. Cole, J. (1996) Nitrite reduction to ammonia by enteric bacteria: redundancy, or a strategy for survival
during oxygen starvation? FEMS Microbiol. Lett. 136:1-11.
57. Cole, S.T., Brosch, R., Parkhill, J., Garnier, T., Churcher, C., Harris, D., Gordon, S.V., Eiglmeier,
K., Gas, S., Barry III, C.E., Tekaia, F., Badcock, K., Basham, D., Brown, D., Chillingworth, T.,
Connor, R., Davies, R., Devlin, K., Feltwell, T., Gentles, S., Hamlin, N., Holroyd, S., Hornsby,
T., Jagels, K., Krogh, A., McLean, J., Moule, S., Murphy, L., Oliver, K., Osborne, J., Quail,
M.A., Rajandream, M.-A., Rogers, J., Rutter, S., Seeger, K., Skelton, J., Squares, R., Squares,
S., Sulston, J.E., Taylor, K., Whitehead, S. and Barrell, B.G. (1998) Deciphering the biology of
Mycobacterium tuberculosis from the complete genome sequence. Nature 393:537-544.
58. Cole, S.T., Eiglmeier, K., Parkhill, J., James, K.D., Thomson, N.R., Wheeler, P.R., Honore, N.,
Garnier, T., Churcher, C., Harris, D., Mungall, K., Basham, D., Brown, D., Chillingworth, T.,
Connor, R., Davies, R.M., Devlin, K., Duthoy, S., Feltwell, T., Fraser, A., Hamlin, N., Holroyd,
S., Hornsby, T., Jagels, K., Lacroix, C., Maclean, J., Moule, S., Murphy, L., Oliver, K., Quail,
M.A., Rajandream, M.-A., Rutherford, K.M., Rutter, S., Seeger, K., Simon, S., Simmonds, M.,
Skelton, J., Squares, R., Squares, S., Stevens, K., Taylor, K., Whitehead, S., Woodward, J.R.
and Barrell, B.G. (2001) Massive gene decay in the leprosy bacillus. Nature 409:1007-1011.
59. Coleman, N.V., Nelson, D.R. and Duxbury, T. (1998) Aerobic biodegradation of hexahydro-1,3,5-
trinitro-1,3,5-triazine (RDX) as a nitrogen source by a Rhodococcus sp., strain DN22. Soil Biol.
Biochem. 30:1159-1167.
60. Coleman, N.V., Spain, J.C. and Duxbury, T. (2002) Evidence that RDX biodegradation by
Rhodococcus strain DN22 is plasmid-borne and involves a cytochrome p-450. J. Appl. Microbiol.
93:13.
61. Coligan, J.E., Dunn, B.M., Speicher, D.W. and Wingfield, P.T. (ed.). (1997) Current protocols in
protein science, Vol. 1. John Wiley and Sons, Inc.
62. Cosgrove, J.D. and Owen, A.J. (1974) The thermal decomposition of 1,3,5 trinitro hexahydro 1,3,5
triazine (RDX)-Part I: The products and physical parameters. Comb. Flame 22:13-18.
63. Cosgrove, J.D. and Owen, A.J. (1974) The thermal decomposition of 1,3,5 trinitro hexahydro 1,3,5
triazine (RDX)-Part II: The effects of the products. Comb. Flame 22:19-22.
References
144
64. Crawford, D.L. (1988) Biodegradation of agricultural and urban wastes, pp. 433-459. In Goodfellow,
M., Williams, S. T., and Mordarski, M. (ed.), Actinomycetes in biotechnology. Academic Press,
London.
65. Crespi, M., Messens, E., Caplan, A.B., van Montagu, M. and Desomer, J. (1992) Fasciation induction
by the phytopathogen Rhodococcus fascians depends upon a linear plasmid encoding a cytokinin
synthase gene. EMBO J. 11:795-804.
66. Crespi, M., Vereecke, D., Temmerman, W., van Montagu, M. and Desomer, J. (1994) The fas operon
of Rhodococcus fascians encodes new genes required for efficient fasciation of host plants. J.
Bacteriol. 176:2492-2501.
67. Cupp-Vickery, J.R. and Poulos, T.L. (1995) Structure of cytochrome P450eryF involved in
erythromycin biosynthesis. Nat. Struct. Biol. 2:144-153.
68. Cupp-Vickery, J.R., Han, O., Hutchinson, C.R. and Poulos, T.L. (1996) Substrate-assisted catalysis in
cytochrome P450eryF. Nat. Struct. Biol. 3:632-637.
69. Dabbs, E.R. and Sole, G.J. (1988) Plasmid-borne resistance to arsenate, arsenite, cadmium, and
chloramphenicol in a Rhodococcus species. Mol. Gen. Genet. 211:148-154.
70. Dabbs, E.R., Gowan, B. and Andersen, S.J. (1990) Nocardioform arsenic resistance plasmids and
construction of Rhodococcus cloning vectors. Plasmid 23:242-247.
71. Dabbs, E.R. (1998) Cloning of genes that have environmental and clinical importance from rhodococci
and related bacteria. Antonie Van Leeuwenhoek 74:155-167.
72. Dabrock, B., Keββββeler, M., Averhoff, B. and Gottschalk, G. (1994) Identification and characterization
of a transmissible linear plasmid from Rhodococcus erythropolis BD2 that encodes isopropylbenzene
and trichloroethane catabolism. Appl. Environ. Microbiol. 60:853-860.
73. De Mot, R., Nagy, I., De Schrijver, A., Pattanapipitpaisal, P., Schoofs, G. and Vanderleyden, J.
(1997) Structural analysis of the 6 kb cryptic plasmid pFAJ26OO from Rhodococcus erythropolis
NI86/21 and construction of Escherichia coli-Rhodococcus shuttle vectors. Microbiology (SGM)
143:3137-3147.
74. Degtyarenko, K.N. (1995) Structural domains of P450-containing monooxygenase systems. Protein eng.
8:737-747.
75. Delaforge, M., Servent, D., Wirsta, P., Ducrocq, C., Mansuy, D. and Lenfant, M. (1993) Particular
ability of cytochrome P-450 CYP3A to reduce glyceryl trinitrate in rat liver microsomes: subsequent
formation of nitric oxide. Chem. Biol. Interact. 86:103-117.
76. Denis-Larose, C., Labbe, D., Bergeron, H., Jones, A.M., Greer, C.W., Al-Hawari, J., Grossman,
M.J., Sankey, B.M. and Lau, P.C.K. (1997) Conservation of plasmid-encoded dibenzothiophene
desulfurization genes in several rhodococci. Appl. Environ. Microbiol. 63:2915-2919.
References
145
77. Denis-Larose, C., Bergeron, H., Labbe, D., Greer, C.W., Hawari, J., Grossman, M.J., Sankey, B.M.
and Lau, P.C.K. (1998) Characterization of the basic replicon of Rhodococcus plasmid pSOX and
development of a Rhodococcus-Escherichia coli shuttle vector. Appl. Environ. Microbiol. 64:4363-
4367.
78. Denome, S.A., Oldfield, C., Nash, L.J. and Young, K.D. (1994) Characterization of the desulfurization
genes from Rhodococcus sp. strain IGTS8. J. Bacteriol. 176:6707-6716.
79. Desomer, J., Dhaese, P. and van Montagu, M. (1990) Transformation of Rhodococcus fascians by
high-voltage electroporation and development of Rhodococcus fascians cloning vectors. Appl.
Environ. Microbiol. 56:2818-2825.
80. Desomer, J., Vereecke, D., Crespi, M. and van Montagu, M. (1992) The plasmid-encoded
chloramphenicol-resistance protein of Rhodococcus fascians is homologous to the transmembrane
tetracycline efflux proteins. Mol. Microbiol. 6:2377-2385.
81. Dickel, O. and Knackmuss, H.-J. (1991) Catabolism of 1,3-dinitrobenzene by Rhodococcus sp. QT-1.
Arch. Microbiol. 157:76-79.
82. Drzyzga, O., Gorontzy, T., Schmidt, A. and Blotevogel, K.H. (1995) Toxicity of explosives and related
compounds to the luminescent bacterium Vibrio fischeri NRRL-B-11177. Arch. Environ. Contam.
Toxicol. 28:229-235.
83. Dunny, G.M., Lee, L.N. and LeBlanc, D.J. (1991) Improved electroporation and cloning vector system
for gram-positive bacteria. Appl. Environ. Microbiol. 57:1194-1201.
84. Duque, E., Haidour, A., Godoy, F. and Ramos, J.L. (1993) Construction of a Pseudomonas hybrid
strain that mineralizes 2,4,6-trinitrotoluene. J. Bacteriol. 175:2278-2283.
85. Duran, R. (1998) New shuttle vectors for Rhodococcus sp. R312 (formerly Brevibacterium sp. R312), a
nitrile hydratase producing strain. J. Basic Microbiol. 38:101-106.
86. Eggeling, L. and Sahm, H. (1985) The formaldehyde dehydrogenase of Rhodococcus erythropolis, a
trimeric enzyme requiring a cofactor and active with alcohols. Eur. J. Biochem. 150:129-134.
87. Egli, T. (1991) On multiple-nutrient-limited growth of microorganisms, with special reference to dual
limitation by carbon and nitrogen substrates. Antonie Van Leeuwenhoek 60:225-234.
88. Esteve-Nunez, A., Caballero, A. and Ramos, J.L. (2001) Biological degradation of 2,4,6-
trinitrotoluene. Microbiol. Mol. Biol. Rev. 65:335-352.
89. Fernando, T. and Aust, S.D. (1991) Biodegradation of munition waste, TNT (2,4,6-trinitrotoluene), and
RDX (hexahydro-1,3,5-trinitro-1,3,5-triazine) by Phanerochaete chrysosporium. A.C.S. Symp. Ser.
468:214-232.
90. Fifer, R.A. (1984) Chemistry of nitrate ester and nitramine propellants, pp. 177-237. In Kuo, K. K. and
Summerfield, M. (ed.), Fundamentals of solid-propellant combustion, Vol. 90. American Institute of
Aeronautics and Astronautics Inc., New York.
References
146
91. Finnerty, W.R. (1992) The biology and genetics of the genus Rhodococcus. Annu. Rev. Microbiol.
46:193-218.
92. Fischer, F., Raimondi, D., Aliverti, A. and Zanetti, G. (2002) Mycobacterium tuberculosis FprA, a
novel bacterial NADPH-ferredoxin reductase. Eur. J. Biochem. 269:3005-3013.
93. Foght, J.M. and Westlake, D.W.S. (1996) Transposon and spontaneous deletion mutants of plasmid-
borne genes encoding polycyclic aromatic hydrocarbon degradation by a strain of Pseudomonas
fluorescens. Biodegradation 7:353-366.
94. Foster, R.P. and Wilson, L.D. (1975) Purification and characterization of adrenodoxin reductase from
bovine adrenal cortex. Biochemistry 14:1477-1484.
95. Fournier, D., Halasz, A., Spain, J., Fiurasek, P. and Hawari, J. (2002) Determination of key
metabolites during biodegradation of hexahydro-1,3,5-trinitro-1,3,5-triazine with Rhodococcus sp.
strain DN22. Appl. Environ. Microbiol. 68:166-172.
96. Franklin, F.C.H., Bagdasarian, M., Bagdasarian, M.M. and Timmis, K.N. (1981) Molecular and
functional analysis of the TOL plasmid pWWO from Pseudomonas putida and cloning of genes for
the entire regulated aromatic ring meta cleavage pathway. Proc. Natl. Acad. Sci. USA 78:7458-7462.
97. Frantz, B. and Chakrabarty, A.M. (1987) Organization and nucleotide sequence determination of a
gene cluster involved in 3-chlorocatechol degradation. Proc. Natl. Acad. Sci. USA 84:4460-4464.
98. Freedman, D.L. and Sutherland, K.W. (1998) Biodegradation of hexahydro-1,3,5-trinitro-1,3,5-triazine
(RDX) under nitrate-reducing conditions. Water Sci. Technol. 38:33-40.
99. French, C.E., Nicklin, S. and Bruce, N.C. (1996) Sequence and properties of pentaerythritol tetranitrate
reductase from Enterobacter cloacae PB2. J. Bacteriol. 178:6623-6627.
100. French, C.E., Nicklin, S. and Bruce, N.C. (1998) Aerobic degradation of 2,4,6-trinitrotoluene by
Enterobacter cloacae PB2 and by pentaerythritol tetranitrate reductase. Appl. Environ. Microbiol.
64:2864-2868.
101. French, C.E., Rosser, S.J., Davies, G.J., Nicklin, S. and Bruce, N.C. (1999) Biodegradation of
explosives by transgenic plants expressing pentaerythritol tetranitrate reductase. Nat. Biotechnol.
17:491-494.
102. Fukuda, M., Shimizu, S., Okita, N., Seto, M. and Masai, E. (1998) Structural alteration of linear
plasmids encoding the genes for polychlorinated biphenyl degradation in Rhodococcus strain RHA1.
Antonie Van Leeuwenhoek 74:169-173.
103. Funk, S.B., Roberts, D.J., Crawford, D.L. and Crawford, R.L. (1993) Initial-phase optimization for
bioremediation of munition compound-contaminated soils. Appl. Environ. Microbiol. 59:2171-2177.
104. Furukawa, K. and Miyazaki, T. (1986) Cloning of a gene cluster encoding biphenyl and
chlorobiphenyl degradation in Pseudomonas pseudoalcaligenes. J. Bacteriol. 166:392-398.
References
147
105. Garg, R., Grasso, D. and Hoag, G. (1991) Treatment of explosives contaminated lagoon sludge.
Hazard. Waste Hazard. Mater. 8:319-340.
106. George, S.E., Huggins-Clark, G. and Brooks, L.R. (2001) Use of a Salmonella microsuspension
bioassay to detect the mutagenicity of munitions compounds at low concentrations. Mut. Res.
490:45-56.
107. Gliszczynska, A. and Koziolowa, A. (1998) Chromatographic determination of flavin derivatives in
baker's yeast. J. Chromatography A 822:59-66.
108. Goeptar, A.R., Scheerens, H. and Vermeulen, N.P.E. (1995) Oxygen and xenobiotic reductase
activities of cytochrome P450. Crit. Rev. Toxicol. 25:25-65.
109. Goldberg, D.J., Green, S.T., Nathwani, D., McMenamin, J., Hamlet, N. and Kennedy, D.H. (1992)
RDX intoxication causing seizures and a widespread petechial rash mimicking meningococcemia. J.
R. Soc. Med. 85:181.
110. Goodfellow, M. and Williams, S.T. (1983) Ecology of actinomycetes. Annu. Rev. Microbiol. 37:189-
216.
111. Goodfellow, M., Alderson, G. and Chun, J. (1998) Rhodococcal systematics: problems and
developments. Antonie Van Leeuwenhoek 74:3-20.
112. Gorontzy, T., Drzyzga, O., Kahl, M.W., Bruns-Nagel, D., Breitung, J., von Loew, E. and
Blotevogel, K.-H. (1994) Microbial degradation of explosives and related compounds. Crit. Rev.
Microbiol. 20:265-284.
113. Green, A.J., Rivers, S.L., Cheesman, M., Reid, G.A., Quaroni, L.G., Macdonald, I.D.G., Chapman,
S.K. and Munro, A.W. (2001) Expression, purification and characterization of cytochrome P450
Biol: a novel P450 involved in biotin synthesis in Bacillus subtilis. J. Biol. Inorg. Chem. 6:523-533.
114. Greene, P.J., Gupta, M., Boyer, H.W., Brown, W.E. and Rosenberg, J.M. (1981) Sequence analysis
of the DNA encoding the Eco RI endonuclease and methylase. J. Biol. Chem. 256:2143-2153.
115. Griest, W.H., Stewart, A.J., Tyndall, R.L., Caton, J.E., Ho, C.-H., Ironside, K.S., Caldwell, W.M.
and Tan, E. (1993) Chemical and toxicological testing of composted explosives-contaminated soil.
Environ. Toxicol. Chem. 12:1105-1116.
116. Griest, W.H., Tyndall, R.L., Stewart, A.J., Caton, J.E., Vass, A.A., Ho, C.-H. and Caldwell, W.M.
(1995) Chemical characterization and toxicological testing of windrow composts from explosives-
contaminated sediments. Environ. Toxicol. Chem. 14:51-59.
117. Grund, A.D. and Gunsalus, I.C. (1983) Cloning of genes for naphthalene metabolism in Pseudomonas
putida. J. Bacteriol. 156:89-94.
118. Grzeszik, C., Lubbers, M., Reh, M. and Schlegel, H.G. (1997) Genes encoding the NAD-reducing
hydrogenase of Rhodococcus opacus MR11. Microbiology (SGM) 143:1271-1286.
References
148
119. Guengerich, F.P., Martin, M.V., Guo, Z. and Chun, Y.-J. (1996) Purification of functional
recombinant P450s from bacteria. Methods Enzymol. 272:35-44.
120. Guengerich, F.P. (2001) Common and uncommon cytochrome P450 reactions related to metabolism
and chemical toxicity. Chem. Res. Toxicol. 14:611-650.
121. Gunderson, C.A., Kostuk, J.M., Gibbs, M.H., Napolitano, G.E., Wicker, L.F., Richmond, J.E. and
Stewart, A.J. (1997) Multispecies toxicity assessment of compost produced in bioremediation of an
explosives-contaminated sediment. Environ. Toxicol. Chem. 16:2529-2537.
122. Gutheil, W.G., Kasimoglu, E. and Nicholson, P.C. (1997) Induction of glutathione-dependent
formaldehyde dehydrogenase activity in Escherichia coli and Hemophilus influenza. Biochem.
Biophys. Res. Commun. 238:693-696.
123. Haddad, S., Eby, D.M. and Neidle, E.L. (2001) Cloning and expression of the benzoate dioxygenase
genes from Rhodococcus sp. strain 19070. Appl. Environ. Microbiol. 67:2507-2514.
124. Häggblom, M.M. (1992) Microbial breakdown of halogenated aromatic pesticides and related
compounds. FEMS Microbiol. Rev. 103:29-72.
125. Haigler, B.E. and Spain, J.C. (1993) Biodegradation of 4-nitrotoluene by Pseudomonas sp. strain 4NT.
Appl. Environ. Microbiol. 59:2239-2243.
126. Haniu, M., Armes, L.G., Yasunobu, K.T., Shastry, B.A. and Gunsalus, I.C. (1982) Amino acid
sequence of the Pseudomonas putida cytochrome P-450: II. Cyanogen bromide peptides, acid
cleavage peptides, and the complete sequence. J. Biol. Chem. 257:12664-12671.
127. Hannink, N., Rosser, S.J., French, C.E., Basran, A., Murray, J.A.H., Nicklin, S. and Bruce, N.C.
(2001) Phytodetoxification of TNT by transgenic plants expressing a bacterial nitroreductase. Nature
Biotech. 19:1168-1172.
128. Hansen, J.B. and Olsen, R.H. (1978) Isolation of large bacterial plasmids and characterization of the
P2 incompatibility group plasmids pMG1 and pMG5. J. Bacteriol. 135:227-238.
129. Hanukoglu, I. and Gutfinger, T. (1989) cDNA sequence of adrenodoxin reductase. Identification of
NADP-binding sites in oxidoreductases. Eur. J. Biochem. 180:479-484.
130. Harkins, V.R., Mollhagen, T., Heintz, C. and Rainwater, K. (1999) Aerobic biodegradation of high
explosives, phase I - HMX. Bioremediation J. 3:285-290.
131. Harrell-Bruder, B. and Hutchins, K.L. (1995) Seizures caused by ingestion of composition C-4. Ann.
Emerg. Med. 26:746-748.
132. Harvey, S.D., Fellows, R.J., Cataldo, D.A. and Bean, R.M. (1991) Fate of the explosive hexahydro-
1,3,5-trinitro-1,3,5-triazine (RDX) in soil and bioaccumulation in bush bean hydroponic plants.
Environ. Toxicol. Chem. 10:845-855.
References
149
133. Hasemann, C.A., Kurumbail, R.G., Boddupalli, S.S., Peterson, J.A. and Deisenhofer, J. (1995)
Structure and function of cytochromes P450: a comparative analysis of three crystal structures.
Structure 3:41-62.
134. Hashimoto, Y., Nishiyama, M., Ikehata, O., Horinouchi, S. and Beppu, T. (1991) Cloning and
characterization of an amidase gene from Rhodococcus species N-774 and its expression in
Escherichia coli. Biochim. Biophys. Acta 1088:225-233.
135. Hashimoto, Y., Nishiyama, M., Yu, F., Watanabe, I., Horinouchi, S. and Beppu, T. (1992)
Development of a host-vector system in a Rhodococcus strain and its use for expression of the cloned
nitrile hydratase gene cluster. J. Gen. Microbiol. 138:1003-1010.
136. Hawari, J., Beaudet, S., Halasz, A., Thiboutot, S. and Ampleman, G. (2000) Microbial degradation
of explosives: biotransformation versus mineralization. Appl. Microbiol. Biotechnol. 54:605-618.
137. Hawari, J., Halasz, A., Sheremata, T., Beaudet, S., Groom, C., Paquet, L., Rhofir, C., Ampleman,
G. and Thiboutot, S. (2000) Characterization of metabolites during biodegradation of hexahydro-
1,3,5-trinitro-1,3,5-triazine (RDX) with municipal anaerobic sludge. Appl. Environ. Microbiol.
66:2652-2657.
138. Hawari, J. (2000) Biodegradation of RDX and HMX: from basic research to field application, pp. 277-
310. In Spain, J. C., Hughes, J. B., and Knackmuss, H.-J. (ed.), Biodegradation of nitroaromatic
compounds and explosives. CRC Press, Boca Raton, Fla.
139. Hawari, J., Halasz, A., Beaudet, S., Paquet, L., Ampleman, G. and Thiboutot, S. (2001)
Biotransformation routes of octahydro-1,3,5,7-tetranitro-1,3,5,7-tetrazocine by municipal anaerobic
sludge. Environ. Sci. Technol. 35:70-75.
140. Hawkes, D.B., Adams, G.W., Burlingame, A.L., Ortiz de Montellano, P.R. and De Voss, J.J. (2002)
Cytochrome P450cin (CYP176A), isolation, expression, and characterization. J. Biol. Chem.
277:27725-27732.
141. Healy, F.G., Krasnoff, S.B., Wach, M., Gibson, D.M. and Loria, R. (2002) Involvement of a
cytochrome P450 monooxygenase in thaxtomin a biosynthesis by Streptomyces acidiscabies. J.
Bacteriol. 184:2019-2029.
142. Heilmann, H.M., Wiesmann, U. and Stenstrom, M.K. (1996) Kinetics of the alkaline hydrolysis of
high explosives RDX and HMX in aqueous solution and adsorbed to activated carbon. Environ. Sci.
Technol. 30:1485-1492.
143. Heiss, G.S., Gowan, B. and Dabbs, E.R. (1992) Cloning of DNA from a Rhodococcus strain
conferring the ability to decolorize sulfonated azo dyes. FEMS Microbiol. Lett. 99:221-226.
144. Hermans, J., Suy, I.M.L. and de Bont, J.A.M. (1993) Transformation of gram-positive
microorganisms with the gram-negative broad-host-range cosmid vector pJRD215. FEMS Microbiol.
Lett. 108:201-204.
References
150
145. Hernandez, P.H., Mazel, P. and Gillette, J.R. (1967) Studies on the mechanism of action of
mammalian hepatic azoreductase-II: The effects of phenobarbital and 3-methylcholanthrene on
carbon monoxide sensitive and insensitive azoreductase activities. Biochem. Pharmacol. 16:1877-
1888.
146. Hirasawa, K., Ishii, Y., Kobayashi, M., Koizumi, K. and Maruhashi, K. (2001) Improvement of
desulfurization activity in Rhodococcus erythropolis KA2-5-1 by genetic engineering. Biosci.
Biotechnol. Biochem. 65:239-246.
147. Hockney, R.C. (1994) Recent developments in heterologous protein production in Escherichia coli.
Trends Biotechnol. 12:456-463.
148. Hoffsommer, J.C., Kubose, D.A. and Glover, D.J. (1977) Kinetic isotope effects and intermediate
formation for the aqueous alkaline homogeneous hydrolysis of 1,3,5-triaza-1,3,5-trinitrocyclohexane
(RDX). J. Phys. Chem. 81:380-385.
149. Hofmann, K., Bucher, P., Falquet, L. and Bairoch, A. (1999) The PROSITE database, its status in
1999. Nucleic Acids Res. 27:215-219.
150. Holdsworth, G., Johnson, M.S. and Hawkins, M.S. (2001) Wildlife toxicity assessment for HMX.
Report 39-EJ-1138-01E. U.S. Army Center for Health Promotion and Preventative Medicine,
Maryland.
151. Hundal, L.S., Singh, J., Bier, E.L., Shea, P.J., Comfort, S.D. and Powers, W.L. (1997) Removal of
TNT and RDX from water and soil using iron metal. Environ. Pollut. 97:55-64.
152. Ikehata, O., Nishiyama, M., Horinouchi, S. and Beppu, T. (1989) Primary structure of nitrile
hydratase deduced from the nucleotide sequence of a Rhodococcus species and its expression in
Escherichia coli. Eur. J. Biochem. 181:563-570.
153. Imai, M., Shimada, H., Watanabe, Y., Matsushima-Hibiya, Y., Makino, R., Koga, H., Horiuchi, T.
and Ishimura, Y. (1989) Uncoupling of the cytochrome P-450cam monooxygenase reaction by a
single mutation, threonine-252 to alanine or valine: a possible role of the hydroxy amino acid in
oxygen activation. Proc. Natl. Acad. Sci. USA 86:7823-7827.
154. Isbister, J.D., Anspach, G.L., Kitchens, J.F. and Doyle, R.C. (1984) Composting for decontamination
of soils containing explosives. Microbiologica 7:47-73.
155. Jerger, D.E. and Woodhull, P. (2000) Applications and costs for biological treatment of explosives-
contaminated soils in the U.S., pp. 395-423. In Spain, J. C., Hughes, J. B., and Knackmuss, H.-J.
(ed.), Biodegradation of nitroaromatic compounds and explosives. CRC Press, Boca Raton, Fla.
156. Johnson, M.S. and McAtee, M.J. (2000) Wildlife toxicity assessment for 2,4,6-trinitrotoluene. Report
39-EJ-1138-00. U.S. Army Center for Health Promotion and Preventative Medicine, Maryland.
157. Jones, A.M., Labelle, S., Paquet, L., Rho, D., Samson, R., Greer, C.W., Hawari, J., Thiboutot, S.,
Lavigne, J., Ampleman, G. and Lavertu, R. (1995) Assessment of the aerobic biodegradation
References
151
potential of RDX, TNT, GAP and NC, pp. 368-381. In Moo-Young, M., Anderson, W. A., and
Chakrabarty, A. M. (ed.), Environmental biotechnology - principles and applications. Kluwer
Academic Press.
158. Kagawa, N. and Cao, Q. (2001) Osmotic stress induced by carbohydrates enhances expression of
foreign proteins in Escherichia coli. Arch. Biochem. Biophys. 393:290-296.
159. Kaiser, K. and Murray, N.E. (1985) Partial cleavage by Sau3A, pp. 40-41. In Glover, D. M. (ed.),
DNA cloning: a practical approach, Vol. 1. IRL Press, Oxford.
160. Kalscheuer, R., Arenskotter, M. and Steinbuchel, A. (1999) Establishment of a gene transfer system
for Rhodococcus opacus PD630 based on electroporation and its application for recombinant
biosynthesis of poly(3-hydroxyalkanoic acids). Appl. Microbiol. Biotechnol. 52:508-515.
161. Kaplan, A.S., Berghout, C.F. and Peczenik, A. (1965) Human intoxication from RDX. Arch. Environ.
Health 10:877-883.
162. Kaplan, D.L. (1993) Biotechnology and bioremediation for organic energetic compounds. In Marinkas,
P. (ed.), Organic energetic compounds. Nova Science, Inc., New York.
163. Karlson, U., Dwyer, D.F., Hooper, S.W., Moore, E.R.B., Timmis, K.N. and Eltis, L.D. (1993) Two
independently regulated cytochromes P-450 in a Rhodococcus rhodochrous strain that degrades 2-
ethoxyphenol and 4-methoxybenzoate. J. Bacteriol. 175:1467-1474.
164. Kesseler, M., Dabbs, E.R., Averhoff, B. and Gottschalk, G. (1996) Studies on the isopropylbenzene
2,3-dioxygenase and the 3- isopropylcatechol 2,3-dioxygenase genes encoded by the linear plasmid
of Rhodococcus erythropolis BD2. Microbiology (SGM) 142:3241-3251.
165. Khan, A.A., Wang, R.-F., Cao, W.-W., Doerge, D.R., Wennerstrom, D. and Cerniglia, C.E. (2001)
Molecular cloning, nucleotide sequence, and expression of genes encoding a polycyclic aromatic ring
dioxygenase from Mycobacterium sp. strain PYR-1. Appl. Environ. Microbiol. 67:3577-3585.
166. Kitamura, M., Sagara, T., Taniguchi, M., Ashida, M., Ezoe, K., Kohno, K., Kojima, S., Ozawa, K.,
Akutsu, H., Kumagai, I. and Nakaya, T. (1998) Cloning and expression of the gene encoding
flavodoxin from Desulfovibrio vulgaris (Miyazaki F). J. Biochem. 123:891-898.
167. Kitts, C.L., Cunningham, D.P. and Unkefer, P.J. (1994) Isolation of three hexahydro-1,3,5-trinitro-
1,3,5-triazine-degrading species of the family Enterobacteriaceae from nitramine explosive-
contaminated soil. Appl. Environ. Microbiol. 60:4608-4611.
168. Kitts, C.L., Green, C.E., Otley, R.A., Alvarez, M.A. and Unkefer, P.J. (2000) Type I nitroreductases
in soil enterobacteria reduce TNT (2,4,6-trinitrotoluene) and RDX (hexahydro-1,3,5-trinitro-1,3,5-
triazine). Can. J. Microbiol. 46:278-282.
169. Kobayashi, M., Nishiyama, M., Nagasawa, T., Horinouchi, S., Beppu, T. and Yamada, H. (1991)
Cloning, nucleotide sequence and expression in Escherichia coli of two cobalt-containing nitrile
hydratase genes from Rhodococcus rhodochrous J1. Biochim. Biophys. Acta 1129:23-33.
References
152
170. Kobayashi, M., Komeda, H., Yanaka, N., Nagasawa, T. and Yamada, H. (1992) Nitrilase from
Rhodococcus rhodochrous J1. Sequencing and overexpression of the gene and identification of an
essential cysteine residue. J. Biol. Chem. 267:20746-20751.
171. Kobayashi, M., Komeda, H., Nagasawa, T., Nishiyama, M., Horinouchi, S., Beppu, T., Yamada, H.
and Shimizu, S. (1993) Amidase coupled with low-molecular-mass nitrile hydratase from
Rhodococcus rhodochrous J1. Sequencing and expression of the gene and purification and
characterization of the gene product. Eur. J. Biochem. 217:327-336.
172. Kobayashi, M. and Shimizu, S. (2000) Nitrile hydrolases. Curr. Opin. Chem. Biol. 4:95-102.
173. Koga, H., Aramaki, H., Yamaguchi, E., Takeuchi, K., Horiuchi, T. and Gunsalus, I.C. (1986)
camR, a negative regulator locus of the cytochrome P-450cam hydroxylase operon. J. Bacteriol.
166:1089-1095.
174. Komeda, H., Hori, Y., Kobayashi, M. and Shimizu, S. (1996) Transcriptional regulation of the
Rhodococcus rhodochrous J1 nitA gene encoding a nitrilase. Proc. Natl. Acad. Sci. USA 93:10572-
10577.
175. Komeda, H., Kobayashi, M. and Shimizu, S. (1996) Characterization of the gene cluster of high-
molecular-mass nitrile hydratase (H-NHase) induced by its reaction product in Rhodococcus
rhodochrous J1. Proc. Natl. Acad. Sci. USA 93:4267-4272.
176. Kosono, S., Maeda, M., Fuji, F., Arai, H. and Kudo, T. (1997) Three of the seven bphC genes of
Rhodococcus erythropolis TA421, isolated from a termite ecosystem, are located on an indigenous
plasmid associated with biphenyl degradation. Appl. Environ. Microbiol. 63:3282-3285.
177. Kruchoski, M.P. (1997) New lower estimate for soils contaminated with secondary explosives and the
associated implications. Report SFIM-AEC-ET-CR97026. TRW Systems Integration Group,
Virginia.
178. Kulakov, L.A., Allen, C.C.R., Lipscomb, D.A. and Larkin, M.J. (2000) Cloning and characterization
of a novel cis-naphthalene dihydrodiol dehydrogenase gene (narB) from Rhodococcus sp.
NCIMB12038. FEMS Microbiol. Lett. 182:327-331.
179. Kulakova, A.N., Stafford, T.M., Larkin, M.J. and Kulakov, L.A. (1995) Plasmid pRTL1 controlling
1-chloroalkane degradation by Rhodococcus rhodochrous NCIMB13064. Plasmid 33:208-217.
180. Kulakova, A.N., Larkin, M.J. and Kulakov, L.A. (1997) The plasmid-located haloalkane
dehalogenase gene from Rhodococcus rhodochrous NCIMB 13064. Microbiology (SGM) 143:109-
115.
181. Kusano, K., Kagawa, N., Sakaguchi, M., Omura, T. and Waterman, M.R. (2001) Importance of a
proline-rich sequence in the amino-terminal region for correct folding of mitochondrial and soluble
microbial P450s. J. Biochem. 129:271-277.
References
153
182. Lachance, B., Robidoux, P.Y., Hawari, J., Ampleman, G., Thiboutot, S. and Sunahara, G.I. (1999)
Cytotoxic and genotoxic effects of energetic compounds on bacterial and mammalian cells in vitro.
Mut. Res. 444:25-39.
183. Laemmli, U.K. (1970) Cleavage of structural proteins during the assembly of the head of bacteriophage
T4. Nature 227:680-685.
184. Laine, M.J., Nakhei, H., Dreier, J., Lehtila, K., Meletzus, D., Eichenlaub, R. and Metzler, M.C.
(1996) Stable transformation of the gram-positive phytopathogenic bacterium Clavibacter
michiganensis subsp. sepedonicus with several cloning vectors. Appl. Environ. Microbiol. 62:1500-
1506.
185. Lamb, D.C., Skaug, T., Song, H.-L., Jackson, C.J., Podust, L.M., Waterman, M.R., Kell, D.B.,
Kelly, D.E. and Kelly, S.L. (2002) The cytochrome P450 complement (CYPome) of Streptomyces
coelicolor A3(2). J. Biol. Chem. 277:24000-24005.
186. Lamb, D.C., Fowler, K., Kieser, T., Manning, N., Podust, L.M., Waterman, M.R., Kelly, D.E. and
Kelly, S.L. (2002) Sterol 14α−demethylase activity in Streptomyces coelicolor A3(2) is associated
with an unusual member of the CYP51 gene family. Biochem. J. 364:555-562.
187. Lambert, P.A. (2002) Cellular impermeability and uptake of biocides and antibiotics in gram-positive
bacteria and mycobacteria. J. Appl. Microbiol. 92:46S-54S.
188. Large, P.J. (1983) Methylotrophy and methanogenesis, First ed, Vol. 8. Van Nostrand Reinhold (U.K.)
Co. Ltd., Wokingham, England.
189. Larkin, M.J., De Mot, R., Kulakov, L.A. and Nagy, I. (1998) Applied aspects of Rhodococcus
genetics. Antonie Van Leeuwenhoek 74:133-153.
190. Lenke, H. and Knackmuss, H.-J. (1992) Initial hydrogenation during catabolism of picric acid by
Rhodococcus erythropolis HL 24-2. Appl. Environ. Microbiol. 58:2933-2937.
191. Levine, B.S., Furedi, E.M., Gordon, D.E., Burns, J.M. and Lish, P.M. (1981) Thirteen week toxicity
study of hexahydro-1,3,5-trinitro-1,3,5- triazine (RDX) in Fischer 344 rats. Toxicol. Lett. 8:241-245.
192. Lewis, T.A., Ederer, M.M., Crawford, R.L. and Crawford, D.L. (1997) Microbial transformations of
2,4,6-trinitrotoluene. J. Ind. Microbiol. Biotechnol. 18:89-96.
193. Li, M.Z., Squires, C.H., Monticello, D.J. and Childs, J.D. (1996) Genetic analysis of the dsz promoter
and associated regulatory regions of Rhodococcus erythropolis IGTS8. J. Bacteriol. 178:6409-6418.
194. Lin, J.T. and Stewart, V. (1998) Nitrate assimilation by bacteria. Adv. Microb. Physiol. 39:1-30.
195. Lynch, J.C., Myers, K.F., Brannon, J.M. and Delfino, J.J. (2001) Effects of pH and temperature on
the aqueous solubility and dissolution rate of 2,4,6-trinitrotoluene (TNT), hexahydro-1,3,5-trinitro-
1,3,5-triazine (RDX) and octahydro-1,3,5,7-tetranitro-1,3,5,7-tetrazocine (HMX). J. Chem. Eng.
Data 46:1549-1555.
References
154
196. Marshall, A. (1932) Explosives: their history, manufacture, properties and tests, III ed. Churchill,
London.
197. Masai, E., Yamada, A., Healy, J.M., Hatta, T., Kimbara, K., Fukuda, M. and Yano, K. (1995)
Characterization of biphenyl catabolic genes of gram-positive polychlorinated biphenyl degrader
Rhodococcus sp. strain RHA1. Appl. Environ. Microbiol. 61:2079-2085.
198. Matsui, T., Hirasawa, K., Konishi, J., Tanaka, Y., Maruhashi, K. and Kurane, R. (2001) Microbial
desulfurization of alkylated dibenzothiophene and alkylated benzothiophene by recombinant
Rhodococcus sp. strain T09. Appl. Microbiol. Biotechnol. 56:196-200.
199. McCormick, N.G., Cornell, J.H. and Kaplan, A.M. (1981) Biodegradation of hexahydro-1,3,5-
trinitro-1,3,5-triazine. Appl. Environ. Microbiol. 42:817-823.
200. McKay, D.B., Seeger, M., Zielinski, M., Hofer, B. and Timmis, K.N. (1997) Heterologous expression
of biphenyl dioxygenase-encoding genes from a gram-positive broad-spectrum polychlorinated
biphenyl degrader and characterization of chlorobiphenyl oxidation by the gene products. J.
Bacteriol. 179:1924-1930.
201. Melius, C.F. (1990) Thermochemical modeling. I. Application to decomposition of energetic materials,
pp. 21-49. In Bulusu, S. N. (ed.), Chemistry and physics of energetic materials. Kluwer Academic
Press, Dordrecht, The Netherlands.
202. Melius, C.F. (1990) Thermochemical modeling. II. Application to ignition and combustion of energetic
materials, pp. 51-78. In Bulusu, S. N. (ed.), Chemistry and physics of energetic materials. Kluwer
Academic Press, Dordrecht, The Netherlands.
203. Meng, M., Sun, W.-Q., Geelhaar, L.A., Kumar, G., Patel, A.R., Payne, G.F., Speedie, M.K. and
Stacy, J.R. (1995) Denitration of glycerol trinitrate by resting cells and cell extracts of Bacillus
thuringiensis/cereus and Enterobacter agglomerans. Appl. Environ. Microbiol. 61:2548-2553.
204. Merlin, C., Springael, D., Mergeay, M. and Toussaint, A. (1997) Organisation of the bph gene cluster
of transposon Tn4371, encoding enzymes for the degradation of biphenyl and 4-chlorobiphenyl
compounds. Mol. Gen. Genet. 253:499-506.
205. Merrick, M.J. and Edwards, R.A. (1995) Nitrogen control in bacteria. Microbiol. Rev. 59:604-622.
206. Metzler, M.C., Zhang, Y.-P. and Chen, T.-A. (1992) Transformation of the gram-positive bacterium
Clavibacter xyli subsp. cynodontis by electroporation with plasmids from the Incp incompatibility
group. J. Bacteriol. 174:4500-4503.
207. Midgley, L.P., Johnson, M.S. and Janus, E.R. (2000) Wildlife toxicity assessment for nitroglycerin.
Report 39-EJ-1138-01F. U.S. Army Center for Health Promotion and Preventative Medicine,
Maryland.
References
155
208. Morii, S., Fujii, C., Miyoshi, T., Iwami, M. and Itagaki, E. (1998) 3-Ketosteroid-∆1-dehydrogenase of
Rhodococcus rhodochrous: sequencing of the genomic DNA and hyperexpression, purification, and
characterization of the recombinant enzyme. J. Biochem. 124:1026-1032.
209. Mulbry, W.W. (1994) Purification and characterization of an inducible s-triazine hydrolase from
Rhodococcus corallinus NRRL B-15444R. Appl. Environ. Microbiol. 60:613-618.
210. Nagy, I., Schoofs, G., Compernolle, F., Proost, P., Vanderleyden, J. and De Mot, R. (1995)
Degradation of the thiocarbamate herbicide EPTC (S-ethyl dipropylcarbamothioate) and biosafening
by Rhodococcus sp. strain NI86/21 involve an inducible cytochrome P-450 system and aldehyde
dehydrogenase. J. Bacteriol. 177:676-687.
211. Nagy, I., Schoofs, G., De Schrijver, A., Vanderleyden, J. and De Mot, R. (1997) New method for
RNA isolation from actinomycetes: application to the transcriptional analysis of the alcohol
oxidoreductase gene thcE in Rhodococcus and Mycobacterium. Lett. Appl. Microbiol. 25:75-79.
212. Narhi, L.O. and Fulco, A.J. (1986) Characterization of a catalytically self-sufficient 119,000-Dalton
cytochrome P-450 monooxygenase induced by barbiturates in Bacillus megaterium. J. Biol. Chem.
261:7160-7169.
213. Narhi, L.O. and Fulco, A.J. (1987) Identification and characterization of two functional domains in
cytochrome P-450BM-3, a catalytically self-sufficient monooxygenase induced by barbiturates in
Bacillus megaterium. J. Biol. Chem. 262:6683-6690.
214. Nash, T. (1953) The colorimetric estimation of formaldehyde by means of the Hantzsch reaction.
Biochem. J. 55:416-421.
215. Nelson, D.R., Kamataki, T., Waxman, D.J., Guengerich, F.P., Estabrook, R.W., Feyereisen, R.,
Gonzalez, F.J., Coon, M.J., Gunsalus, I.C., Gotoh, O., Okuda, K. and Nebert, D.W. (1993) The
P450 superfamily: update on new sequences, gene mapping, accession numbers, early trivial names
of enzymes and nomenclature. DNA Cell Biol. 12:1-51.
216. Nesvera, J., Hochmannova, J., Patek, M., Sroglova, A. and Becvarova, V. (1994) Transfer of the
broad-host-range IncQ plasmid RSF1010 and other plasmid vectors to the gram-positive
methylotroph Brevibacterium methylicum by electrotransformation. Appl. Microbiol. Biotechnol.
40:864-866.
217. Newman, A.K., Rubin, R.A., Kim, S.-H. and Modrich, P. (1981) DNA sequences of structural genes
for Eco RI DNA restriction and modification enzymes. J. Biol. Chem. 256:2131-2139.
218. Nishino, S.F., Spain, J.C., Belcher, L.A. and Litchfield, C.D. (1992) Chlorobenzene degradation by
bacteria isolated from contaminated groundwater. Appl. Environ. Microbiol. 58:1719-1726.
219. Nishino, S.F., Spain, J.C. and Pettigrew, C.A. (1994) Biodegradation of chlorobenzene by indigenous
bacteria. Environ. Toxicol. Chem. 13:871-877.
References
156
220. Nonaka, Y., Murakami, H., Yabusaki, Y., Kuramitsu, S., Kagamiyama, H., Yamano, T. and
Okamoto, M. (1987) Molecular cloning and sequence analysis of full-length cDNA for mRNA of
adrenodoxin oxidoreductase from bovine adrenal cortex. Biochem. Biophys. Res. Commun.
145:1239-1247.
221. O'Keefe, D.P., Romesser, J.A. and Leto, K.J. (1988) Identification of constitutive and herbicide
inducible cytochromes P-450 in Streptomyces griseolus. Arch. Microbiol. 149:406-412.
222. Ogawa, N. and Miyashita, K. (1999) The chlorocatechol-catabolic transposon Tn5707 of Alcaligenes
eutrophus NH9, carrying a gene cluster highly homologous to that in the 1,2,4-trichlorobenzene-
degrading bacterium Pseudomonas sp. strain P51, confers the ability to grow on 3- chlorobenzoate.
Appl. Environ. Microbiol. 65:724-731.
223. Omer, C.A., Lenstra, R., Litle, P.J., Dean, C., Tepperman, J.M., Leto, K.J., Romesser, J.A. and
O'Keefe, D.P. (1990) Genes for two herbicide-inducible cytochromes P-450 from Streptomyces
griseolus. J. Bacteriol. 172:3335-3345.
224. Omura, T. and Sato, R. (1964) The carbon monoxide-binding pigment of liver microsomes. J. Biol.
Chem. 239:2370-2378.
225. Osmon, J.L. and Klausmeier, R.E. (1973) Microbial degradation of explosives. Dev. Ind. Microbiol.
14:247-252.
226. Pennington, J.C. and Brannon, J.M. (2002) Environmental fate of explosives. Thermochimica Acta
384:163-172.
227. Perrière, G. and Gouy, M. (1996) WWW-query: An on-line retrieval system for biological sequence
banks. Biochimie 78:364-369.
228. Peters, G.T., Burton, D.T., Paulson, R.L. and Turley, S.D. (1991) The acute and chronic toxicity of
hexahydro-1,3,5-trinitro-1,3,5-triazine (RDX) to three freshwater invertebrates. Environ. Toxicol.
Chem. 10:1073-1081.
229. Peyton, G.R., LeFaivre, M.H. and Maloney, S.W. (1999) Verification of RDX photolysis mechanism.
Report CERL-TR-99/93. Construction Engineering Research Lab (Army), Illinois.
230. Piddington, C.S., Kovacevich, B.R. and Rambosek, J. (1995) Sequence and molecular
characterization of a DNA region encoding the dibenzothiophene desulfurization operon of
Rhodococcus sp. strain IGTS8. Appl. Environ. Microbiol. 61:468-475.
231. Pinto, R.M., Fraiz, F.J., Cabezas, A., Avalos, M., Canales, J., Costas, M.J. and Cameselle, J.C.
(1999) Preparation of riboflavin 4',5'-cyclic phosphate by incubation of flavin-adeneine dinucleotide
with Mn2+ in the absence of riboflavin 5'-phosphate cyclase. Anal. Biochem. 268:409-411.
232. Pisabarro, A., Correia, A. and Martin, J.F. (1998) Pulsed-field gel electrophoresis analysis of the
genome of Rhodococcus fascians: genome size and linear and circular replicon composition in
virulent and avirulent strains. Curr. Microbiol. 36:302-308.
References
157
233. Poole, L.B. and Ellis, H.R. (1996) Flavin-dependent alkyl hydroperoxide reductase from Salmonella
typhimurium. 1. Purification and enzymatic activities of overexpressed AhpF and AhpC proteins.
Biochemistry 35:56-64.
234. Popov, V.O. and Lamzin, V.S. (1994) NAD+-dependent formate dehydrogenase. Biochem. J. 301:625-
643.
235. Poupin, P., DuCrocq, V., Hallier-Soulier, S. and Truffaut, N. (1999) Cloning and characterization of
the genes encoding a cytochrome P450 (PipA) involved in piperidine and pyrrolidine utilization and
its regulatory protein (PipR) in Mycobacterium smegmatis mc2155. J. Bacteriol. 181:3419-3426.
236. Powers, E.M. (1995) Efficacy of the Ryu nonstaining KOH technique for rapidly determining Gram
reactions of food-borne and waterborne bacteria and yeasts. Appl. Environ. Microbiol. 61:3756-3758.
237. Price, R.A., Pennington, J.C., Larson, S.L., Neumann, D. and Hayes, C.A. (2002) Uptake of RDX
and TNT by agronomic plants. Soil. Sediment. Contam. 11:307-326.
238. Quan, S. and Dabbs, E.R. (1993) Nocardioform arsenic resistance plasmid characterization and
improved Rhodococcus cloning vectors. Plasmid 29:74-79.
239. Raag, R., Martinis, S.A., Sligar, S.G. and Poulos, T.L. (1991) Crystal structure of the cytochrome P-
450CAM active site mutant Thr252Ala. Biochemistry 30:11420-11429.
240. Rainey, F.A., Burghardt, J., Kroppenstedt, R.M., Klatte, S. and Stackebrandt, E. (1995)
Phylogenetic analysis of the genera Rhodococcus and Nocardia and evidence for the evolutionary
origin of the genus Nocardia from within the radiation of Rhodococcus species. Microbiology (SGM)
141:523-528.
241. Rathbone, D.A., Holt, P.-J., Lowe, C.R. and Bruce, N.C. (1997) Molecular analysis of the
Rhodococcus sp. strain H1 her gene and characterization of its product, a heroin esterase, expressed
in Escherichia coli. Appl. Environ. Microbiol. 63:2062-2066.
242. Redenbach, M., Scheel, J. and Schmidt, U. (2000) Chromosome topology and genome size of selected
actinomycetes species. Antonie Van Leeuwenhoek 78:227-235.
243. Regan, K.M. and Crawford, R.L. (1994) Characterization of Clostridium bifermentans and its
biotransformation of 2,4,6-trinitrotoluene (TNT) and 1,3,5-triaza-1,3,5-trinitrocyclohexane (RDX).
Biotechnol. Lett. 16:1081-1086.
244. Rieger, P.-G. and Knackmuss, H.-J. (1995) Basic knowledge and perspectives on biodegradation of
2,4,6-trinitrotoluene and related nitroaromatic compounds in contaminated soil, pp. 1-18. In Spain, J.
C. (ed.), Biodegradation of nitroaromatic compounds. Plenum Press, New York.
245. Rivera, R., Medina, V.F., Larson, S.L. and McCutcheon, S.C. (1998) Phytotreatment of TNT-
contaminated groundwater. J. Soil Contam. 7:511-529.
246. Roberts, G.A., Grogan, G., Greter, A., Flitsch, S.L. and Turner, N.J. (2002) Identification of a new
class of cytochrome P450 from a Rhodococcus sp. J. Bacteriol. 184:3898-3908.
References
158
247. Roberts, T.A. and Dainty, R.H. (1991) Mechanism(s) of microbial inhibition by nitrite, pp. 119-130. In
Hill, M. J. (ed.), Nitrates and nitrites in food and water. Ellis Horwood, New York.
248. Robidoux, P.Y., Svendsen, C., Caumartin, J., Hawari, J., Ampleman, G., Thiboutot, S., Weeks,
J.M. and Sunahara, G.I. (2000) Chronic toxicity of energetic compounds in soil determined using
the earthworm (Eisenia andrei) reproduction test. Environ. Toxicol. Chem. 19:1764-1773.
249. Robidoux, P.Y., Hawari, J., Thiboutot, S., Ampleman, G. and Sunahara, G.I. (2001) Chronic
toxicity of octahydro-1,3,5,7-tetranitro-1,3,5,7-tetrazocine (HMX) in soil determined using the
earthworm (Eisenia andrei) reproduction test. Environ. Pollut. 111:283-292.
250. Rosenberger, R.F. and Eldsen, S.R. (1960) The yields of Streptococcus faecalis grown in continuous
culture. J. Gen. Microbiol. 22:726-739.
251. Rosenblatt, D.H., Burrows, E.P., Mitchell, W.R. and Parmer, D.L. (1991) Organic explosives and
related compounds. In Hutzinger, O. (ed.), The handbook of environmental chemistry. Springer-
Verlag.
252. Rosser, S.J., Basran, A., Travis, E.R., French, C.E. and Bruce, N.C. (2001) Microbial
transformations of explosives. Adv. Appl. Microbiol. 49:1-35.
253. Rugh, C.L., Senecoff, J.F., Meagher, R.B. and Merkle, S.A. (1998) Development of transgenic
yellow poplar for mercury phytoremediation. Nat. Biotechnol. 16:925-928.
254. Sagara, Y., Takata, Y., Miyata, T., Hara, T. and Horiuchi, T. (1987) Cloning and sequence analysis
of adrenodoxin reductase cDNA from bovine adrenal cortex. J. Biochem. 102:1333-1336.
255. Sagara, Y., Wada, A., Takata, Y., Waterman, M.R., Sekimizu, K. and Horiuchi, T. (1993) Direct
expression of adrenodoxin reductase in Escherichia-coli and the functional characterization. Biol.
Pharm. Bull. 16:627-630.
256. Sagara, Y., Watanabe, Y., Kodama, H. and Aramaki, H. (1999) cDNA cloning, overproduction and
characterization of rat adrenodoxin reductase. Biochim. Biophys. Acta 1434:284-295.
257. Sambrook, J., Fritsch, E.F. and Maniatis, T. (1989) Bacterial media, antibiotics, and bacterial strains:
LB medium, pp. A.1. In Nolan, C. (ed.), Molecular Cloning: A laboratory manual, 2nd ed, Vol. 3.
Cold Spring Harbor Laboratory Press, New York.
258. Sambrook, J., Fritsch, E.F. and Maniatis, T. (1989) Agarose gel electrophoresis, pp. 6.3-6.19. In
Nolan, C. (ed.), Molecular Cloning: A laboratory manual, 2nd ed, Vol. 1. Cold Spring Harbor
Laboratory Press, New York.
259. Sambrook, J., Fritsch, E.F. and Maniatis, T. (1989) Fresh competent E. coli prepared using calcium
chloride, pp. 1.82-1.84. In Nolan, C. (ed.), Molecular Cloning: A laboratory manual, Vol. 1. Cold
Spring Harbor Laboratory Press, New York.
References
159
260. Sambrook, J., Fritsch, E.F. and Maniatis, T. (1989) Small scale preparations of plasmid DNA, pp.
1.25-1.30. In Nolan, C. (ed.), Molecular Cloning: A laboratory manual, Vol. 1. Cold Spring Harbor
Laboratory Press, New York.
261. Sambrook, J., Fritsch, E.F. and Maniatis, T. (1989) Extraction and purification of RNA, pp. 7.3-7.9.
In Nolan, C. (ed.), Molecular Cloning: A laboratory manual, 2nd ed, Vol. 1. Cold Spring Harbor
Laboratory Press, New York.
262. Sariaslani, F.S. (1991) Microbial cytochromes P-450 and xenobiotic metabolism. Adv. Appl. Microbiol.
36:133-178.
263. Sariaslani, F.S. and Omer, C.A. (1992) Actinomycete cytochromes P-450 involved in oxidative
metabolism: biochemistry and molecular biology. Crit. Rev. Plant Sci. 11:1-16.
264. Scheideler, L. and Ninnemann, H. (1986) Nitrate reductase activity test: phenazine methosulfate-
ferricyanide stop reagent replaces postassay treatment. Anal. Biochem. 154:29-33.
265. Schulz, G.E. (1992) Binding of nucleotides by proteins. Curr. Opin. Struct. Biol. 2:61-67.
266. Sekizaki, T., Tanoue, T., Osaki, M., Shimoji, Y., Tsubaki, S. and Takai, S. (1998) Improved
electroporation of Rhodococcus equi. J. Vet. Med. Sci. 60:277-279.
267. Selim, H.M., Xue, S.K. and Iskandar, I.K. (1995) Transport of 2,4,6-trinitrotoluene and hexahydro-
1,3,5-trinitro-1,3,5-triazine in soils. Soil Sci. 160:328-339.
268. Serizawa, N. and Matsuoka, T. (1991) A two component-type cytochrome P-450 monooxygenase
system in a prokaryote that catalyzes hydroxylation of ML-236B to pravastatin, a tissue-selective
inhibitor of 3-hydroxy-3-methylglutaryl coenzyme A reductase. Biochim. Biophys. Acta 1084:34-40.
269. Servent, D., Delaforge, M., Ducrocq, C., Mansuy, D. and Lenfant, M. (1989) Nitric oxide formation
during microsomal hepatic denitration of glyceryl trinitrate: involvement of cytochrome P-450.
Biochem. Biophys. Res. Commun. 163:1210-1216.
270. Shao, Z., Dick, W.A. and Behki, R.M. (1995) An improved Escherichia coli-Rhodococcus shuttle
vector and plasmid transformation in Rhodococcus spp. using electroporation. Lett. Appl. Microbiol.
21:261-266.
271. Shao, Z.Q. and Behki, R. (1995) Cloning of the genes for degradation of the herbicides EPTC (S-ethyl
dipropylthiocarbamate) and atrazine from Rhodococcus sp. strain TE1. Appl. Environ. Microbiol.
61:2061-2065.
272. Shao, Z.Q., Seffens, W., Mulbry, W. and Behki, R.M. (1995) Cloning and expression of the s-triazine
hydrolase gene (trza) from Rhodococcus corallinus and development of Rhodococcus recombinant
strains capable of dealkylating and dechlorinating the herbicide atrazine. J. Bacteriol. 177:5748-
5755.
References
160
273. Shao, Z.Q. and Behki, R. (1996) Characterization of the expression of the thcB gene, coding for a
pesticide-degrading cytochrome P-450 in Rhodococcus strains. Appl. Environ. Microbiol. 62:403-
407.
274. Shen, C.F., Guiot, S.R., Thiboutot, S., Ampleman, G. and Hawari, J. (1998) Fate of explosives and
their metabolites in bioslurry treatment processes. Biodegradation 8:339-347.
275. Shen, C.F., Hawari, J.A., Paquet, L., Ampleman, G., Thiboutot, S. and Guiot, S.R. (2001)
Explosive biodegradation in soil slurry batch reactors amended with exogenous microorganisms.
Water. Sci. Technol. 43:291-298.
276. Sheremata, T.W. and Hawari, J. (2000) Mineralization of RDX by the white rot fungus
Phanerochaete chrysosporium to carbon dioxide and nitrous oxide. Environ. Sci. Technol. 34:3384-
3388.
277. Sheremata, T.W., Halasz, A., Paquet, L., Thiboutot, S., Ampleman, G. and Hawari, J. (2001) The
fate of the cyclic nitramine explosive RDX in natural soil. Environ. Sci. Technol. 35:1037-1040.
278. Shine, J. and Dalgarno, L. (1974) The 3'-terminal sequence of Escherichia coli 16S ribosomal RNA:
complementarity to nonsense triplets and ribosome binding sites. Proc. Nat. Acad. Sci. USA 71:1342-
1346.
279. Simini, M., Wentsel, R.S., Checkai, R.T., Phillips, C.T., Chester, N.A., Major, M.A. and Amos,
J.C. (1995) Evaluation of soil toxicity at Joliet army ammunition plant. Environ. Toxicol. Chem.
14:623-630.
280. Singh, G., Kapoor, I.P.S., Mannan, S.M. and Tiwari, S.K. (1999) Studies on energetic compounds
Part XI: preparation and thermolysis of polynitro organic compounds. J. Hazard. Mater. 68:155-178.
281. Singh, J., Comfort, S.D., Hundal, L.S. and Shea, P.J. (1998) Long-term RDX sorption and fate in
soil. J. Environ. Qual. 27:572-577.
282. Singh, J., Comfort, S.D. and Shea, P.J. (1998) Remediating RDX-contaminated water and soil using
zero-valent iron. J. Environ. Qual. 27:1240-1245.
283. Singleton, I. (1994) Microbial metabolism of xenobiotics: fundamental and applied research. J. Chem.
Tech. Biotechnol. 59:9-23.
284. Smets, B.F., Vinopal, R.T., Grasso, D., Strevett, K.A. and Kim, B.-J. (1995) Nitroglycerin
biodegradation: theoretical thermodynamic considerations. J. Energetic Mater. 15:1-4.
285. Smith, T.J., Lloyd, J.S., Gallagher, S.C., Fosdike, W.L.J., Murrell, J.C. and Dalton, H. (1999)
Heterologous expression of alkene monooxygenase from Rhodococcus rhodochrous B-276. Eur. J.
Biochem. 260:446-452.
286. Smith-Simon, C. and Goldhaber, S. (1999) RDX - ATSDR toxicological profile. Report 205-93-0606.
U.S. Department of Health and Human Services, Atlanta.
References
161
287. Snape, J.R., Walkley, N.A., Morby, A.P., Nicklin, S. and White, G.F. (1997) Purification, properties,
and sequence of glycerol trinitrate reductase from Agrobacterium radiobacter. J. Bacteriol.
179:7796-7802.
288. Snell, J.C., Colton, C.A., Chernyshev, O.N. and Gilbert, D.L. (1996) Location-dependent artifact for
NO measurement using multiwell plates. Free Radic. Biol. Med. 20:361-363.
289. Soli, G. (1973) Microbial degradation of cyclonite (RDX). Report NWC-TP-5525 / AD-762 751. U.S.
National Technical Information Service (Naval Weapons Center China Lake Calif), Washington D.C.
290. Spain, J.C. (1995) Biodegradation of nitroaromatic compounds. Annu. Rev. Microbiol. 49:523-555.
291. Spain, J.C. (2000) Introduction, pp. 1-5. In Spain, J. C., Hughes, J. B., and Knackmuss, H.-J. (ed.),
Biodegradation of nitroaromatic compounds and explosives. CRC Press, Boca Raton, Fla.
292. Springael, D., Kreps, S. and Mergeay, M. (1993) Identification of a catabolic transposon, Tn4371,
carrying biphenyl and 4-chlorobiphenyl degradation genes in Alcaligenes eutrophus A5. J. Bacteriol.
175:1674-1681.
293. Steuckart, C., Berger-Preiss, E. and Levsen, K. (1994) Determination of explosives and their
biodegradation products in contaminated soil and water from former ammunition plants by
automated multiple development high-performance thin-layer chromatography. Anal. Chem.
66:2570-2577.
294. Stoecker, M.A., Herwig, R.P. and Staley, J.T. (1994) Rhodococcus zopfii sp. nov., a toxicant-
degrading bacterium. Int. J. Syst. Bacteriol. 44:106-110.
295. Stok, J.E. and De Voss, J.J. (2000) Expression, purification, and characterization of Biol: A carbon-
carbon bond cleaving cytochrome P450 involved in biotin biosynthesis in Bacillus subtilis. Arch.
Biochem. Biophys. 384:351-360.
296. Stokinger, H.E. (1982) Aliphatic nitro compounds, nitrates and nitrites, pp. 4141-4208. In Clayton, G.
D. and Clayton, F. E. (ed.), Patty's industrial hygiene and toxicology, Vol. 2C. John Wiley and Sons,
New York.
297. Strachan, P.D., Freer, A.A. and Fewson, C.A. (1998) Purification and characterization of catechol
1,2-dioxygenase from Rhodococcus rhodochrous NCIMB 13259 and cloning and sequencing of its
catA gene. Biochem. J. 333:741-747.
298. Suen, W.-C. and Spain, J.C. (1993) Cloning and characterization of Pseudomonas sp. strain DNT
genes for 2,4-dinitrotoluene degradation. J. Bacteriol. 175:1831-1837.
299. Sugimoto, M., Tanabe, M., Hataya, M., Enokibara, S., Duine, J.A. and Kawai, F. (2001) The first
step in polyethylene glycol degradation by sphingomonads proceeds via a flavoprotein alcohol
dehydrogenase containing flavin adenine dinucleotide. J. Bacteriol. 183:6694-6698.
300. Tan, E.L., Ho, C.H., Griest, W.H. and Tyndall, R.L. (1992) Mutagenicity of trinitrotoluene and its
metabolites formed during composting. J. Toxicol. Environ. Health 36:165-175.
References
162
301. Tan, H.-M. (1999) Bacterial catabolic transposons. Appl. Microbiol. Biotechnol. 51:1-12.
302. Tekoah, Y., Nejidat, A. and Abeliovich, N.A. (1999) Presented at the second international symposium
on biodegradation of nitroaromatic compounds and explosives, Leesburg, VA.
303. Thiboutot, S., Lavigne, J., Ampleman, G., Richer, G., Lavertu, R., Samson, R., Greer, C., Hawari,
J. and Rho, D. (1994) Presented at the international symposium on energetic materials technology,
Orlando, Florida.
304. Thomas, P.E., Ryan, D. and Levin, W. (1976) An improved staining procedure for detection of the
peroxidase activity of cytochrome P-450 on sodium dodecyl sulfate polyacrylamide gels. Anal.
Biochem. 75:168-176.
305. Thompson, J.D., Higgins, D.G. and Gibson, T.J. (1994) CLUSTAL W: improving the sensitivity of
progressive multiple sequence alignment through sequence weighting, position-specific gap penalties
and weight matrix choice. Nucleic Acids Res. 22:4673-80.
306. Thompson, P.L., Ramer, L.A. and Schnoor, J.L. (1999) Hexahydro-1,3,5-trinitro-1,3,5-triazine
translocation in poplar trees. Environ. Toxicol. Chem. 18:279-284.
307. Townsend, A.J., Kiningham, K.K., St Clair, D., Tephly, T.R., Morrow, C.S. and Guengerich, F.P.
(1999) Symposium overview: characterization of xenobiotic metabolizing enzyme function using
heterologous expression systems. Toxicol. Sci. 48:143-150.
308. Toze, S. and Zappia, L. (1999) Microbial degradation of munition compounds in production
wastewater. Water Res. 33:3040-3045.
309. Ullmann, G.M., Hauswald, M., Jensen, A. and Knapp, E.-W. (2000) Structural alignment of
ferredoxin and flavodoxin based on electrostatic potentials: implications for their interactions with
photosystem I and ferredoxin-NADP reductase. Proteins 38:301-309.
310. Unger, B.P., Gunsalus, I.C. and Sligar, S.G. (1986) Nucleotide sequence of the Pseudomonas putida
cytochrome P-450cam gene and its expression in Escherichia coli. J. Biol. Chem. 261:1158-1163.
311. Uotila, J.S., Salkinoja-Salonen, M.S. and Apajalahti, J.H.A. (1991) Dechlorination of
pentachlorophenol by membrane bound enzymes of Rhodococcus chlorophenolicus PCP-I.
Biodegradation 2:25-31.
312. van Beilen, J.B., Panke, S., Lucchini, S., Franchini, A.G., Rothlisberger, M. and Witholt, B. (2001)
Analysis of Pseudomonas putida alkane-degradation gene clusters and flanking insertion sequences:
evolution and regulation of the alk genes. Microbiology (SGM) 147:1621-1630.
313. van Ham, N.H.A. (1997) Recycling and disposal of munitions and explosives. Waste Management
17:147-150.
314. Vasant Kumar, C., Coque, J.-J.R. and Martin, J.F. (1994) Efficient transformation of the
cephamycin C producer Nocardia lactamdurans and development of shuttle and promoter-probe
cloning vectors. Appl. Environ. Microbiol. 60:4086-4093.
References
163
315. Vervoort, J., Heering, D., Peelen, S. and Van Berkel, W. (1994) Flavodoxins. Methods Enzymol.
243:188-203.
316. Voeikova, T.A. (1999) The conjugal transfer of plasmids from Escherichia coli to various strains of the
order Actinomycetales. Russian J. Genet. 35:1398-1404.
317. Vogt Singer, M.E. and Finnerty, W.R. (1988) Construction of an Escherichia coli-Rhodococcus
shuttle vector and plasmid transformation in Rhodococcus spp. J. Bacteriol. 170:638-645.
318. von Oettingen, W.F., Donahue, D.D., Yagonda, H., Monaco, A.R. and Harris, M.R. (1949) Toxicity
and potential dangers of cyclotrimethylenetrinitramine (RDX). J. Ind. Hyg. Toxicol. 31:21-31.
319. Vonrhein, C., Schmidt, U., Ziegler, G.A., Schweiger, S., Hanukoglu, I. and Schulz, G.E. (1999)
Chaperone-assisted expression of authentic bovine adrenodoxin reductase in Escherichia coli. FEBS
Lett. 443:167-169.
320. Vorbeck, C., Lenke, H., Fischer, P. and Knackmuss, H.-J. (1994) Identification of a hydride-
Meisenheimer complex as a metabolite of 2,4,6-trinitrotoluene by a Mycobacterium strain. J.
Bacteriol. 176:932-934.
321. Wakabayashi, S., Kimura, T., Fukuyama, K., Matsubara, H. and Rogers, L.J. (1989) The amino
acid sequence of a flavodoxin from the eukaryotic red alga Chondrus crispus. Biochem. J. 263.
322. Walker, J.E. and Kaplan, D.L. (1992) Biological degradation of explosives and chemical agents.
Biodegradation 3:369-385.
323. Wang, S., Nakashima, S., Numata, O., Fujiu, K. and Nozawa, Y. (1999) Molecular cloning and cell-
cycle-dependent expression of the acetyl-CoA synthetase gene in Tetrahymena cells. Biochem. J.
343:479-485.
324. Warhurst, A.M., Clarke, K.F., Hill, R.A., Holt, R.A. and Fewson, C.A. (1994) Metabolism of
styrene by Rhodococcus rhodochrous NCIMB 13259. Appl. Environ. Microbiol. 60:1137-1145.
325. Warhurst, A.M. and Fewson, C.A. (1994) Biotransformations catalyzed by the genus Rhodococcus.
Crit. Rev. Biotechnol. 14:29-73.
326. Weickert, M.J., Doherty, D.H., Best, E.A. and Olins, P.O. (1996) Optimization of heterologous
protein production in Escherichia coli. Curr. Opin. Biotechnol. 7:494-499.
327. Weisburg, W.G., Barns, S.M., Pelletier, D.A. and Lane, D.J. (1991) 16S ribosomal DNA
amplification for phylogenetic study. J. Bacteriol. 173:697-703.
328. Wendt, T.M., Cornell, J.H. and Kaplan, A.M. (1978) Microbial degradation of glycerol nitrates. Appl.
Environ. Microbiol. 36:693-699.
329. White, G.F., Snape, J.R. and Nicklin, S. (1996) Biodegradation of glycerol trinitrate and
pentaerythritol tetranitrate by Agrobacterium radiobacter. Appl. Environ. Microbiol. 62:637-642.
330. White, G.F., Snape, J.R. and Nicklin, S. (1996) Bacterial biodegradation of glycerol trinitrate. Int.
Biodeterior. Biodegrad. 38:77-82.
References
164
331. Whong, W.-Z. and Edwards, G.S. (1984) Genotoxic activity of nitroaromatic explosives and related
compounds in Salmonella typhimurium. Mut. Res. 136:209-215.
332. Wight, C.A. and Botcher, T.R. (1992) Thermal decomposition of solid RDX begins with N-N bond
scission. J. Am. Chem. Soc. 114:8303-8304.
333. Williams, R.T., Ziegenfuss, P.S. and Sisk, W.E. (1992) Composting of explosives and propellant
contaminated soils under thermophilic and mesophilic conditions. J. Ind. Microbiol. 9:137-144.
334. Wislocki, P.G., Miwa, G.T. and Lu, A.Y.H. (1980) Reactions catalyzed by the cytochrome P-450
system, pp. 135-182. In Jakoby, W. B. (ed.), Enzymatic basis of detoxication, Vol. I. Academic Press,
New York.
335. Woody, R.C., Kearns, G.L., Brewster, M.A., Turley, C.P., Sharp, G.B. and Lake, R.S. (1986) The
neurotoxicity of cyclotrimethylenetrinitramine (RDX) in a child: a clinical and pharmacokinetic
evaluation. J. Toxicol. Clin. Toxicol. 24:305-319.
336. Wu, C.J. and Fried, L.E. (1997) Ab initio study of RDX decomposition mechanisms. J. Phys. Chem. A
101:8675-8679.
337. Xue, S.K., Iskandar, I.K. and Selim, H.M. (1995) Adsorption-desorption of 2,4,6-trinitrotoluene and
hexahydro-1,3,5-trinitro-1,3,5-triazine in soils. Soil Sci. 160:317-327.
338. Yang, Y., Wang, X., Yin, P., Li, W. and Zhou, P. (1983) Studies on three strains of Corynebacterium
degrading cyclotrimethylene-trinitroamine (RDX). Acta Microbiol. Sinica 23:251-256.
339. Yanze-Kontchou, C. and Gschwind, N. (1994) Mineralization of the herbicide atrazine as a carbon
source by a Pseudomonas strain. Appl. Environ. Microbiol. 60:4297-4302.
340. Yen, K.-M. and Gunsalus, I.C. (1982) Plasmids gene organization: naphthalene/salicylate oxidation.
Proc. Natl. Acad. Sci. USA 79:874-878.
341. Yinon, J. (1981) Thin-layer chromatography (TLC), pp. 59-85. In Yinon, J. and Zitrin, S. (ed.), The
analysis of explosives, Vol. 3. Pergamon, Oxford.
342. Yinon, J. (1981) Chemical methods, pp. 29-46. In Yinon, J. and Zitrin, S. (ed.), The analysis of
explosives, Vol. 3. Pergamon, Oxford.
343. Yoon, J.-H., Lee, J.-S., Shin, Y.K., Park, Y.-H. and Lee, S.T. (1997) Reclassification of Nocardioides
simplex ATCC 13260, ATCC 19565, and ATCC 19566 as Rhodococcus erythropolis. Int. J. Syst.
Bacteriol. 47:904-907.
344. Yoon, J.-H., Kang, S.-S., Cho, Y.-G., Lee, S.T., Kho, Y.H., Kim, C.-J. and Park, Y.-H. (2000)
Rhodococcus pyridinivorans sp. nov., a pyridine-degrading bacterium. Int. J. Syst. Evol. Microbiol.
50:2173-2180.
345. Young, D.M., Unkefer, P.J. and Ogden, K.L. (1997) Biotransformation of hexahydro-1,3,5-trinitro-
1,3,5-triazine (RDX) by a prospective consortium and its most effective isolate Serratia marcescens.
Biotechnol. Bioeng. 53:515-522.
References
165
346. Yun, C.-O., Kayser, K.J., Webster, D. and Kilbane II, J.J. Isolation and characterization of
promoters from Rhodococcus erythropolis IGTS8. Unpubl.
347. Zenno, S., Koike, H., Kumar, A.N., Jayaraman, R., Tanokura, M. and Saigo, K. (1996)
Biochemical characterization of NfsA, the Escherichia coli major nitroreductase exhibiting a high
amino acid sequence homology to Frp, a Vibrio harveyi flavin oxidoreductase. J. Bacteriol.
178:4508-4514.
348. Zhao, X., Hintsa, E.J. and Lee, Y.T. (1988) Infrared multiphoton dissociation of RDX in a molecular
beam. J. Chem. Phys. 88:801-810.
349. Zheng, H., Tkachuk-Saad, O. and Prescott, J.F. (1997) Development of a Rhodococcus equi-
Escherichia coli plasmid shuttle vector. Plasmid 38:180-187.
350. Ziegenfuss, P.S. and Williams, R.T. (1991) Hazardous materials composting. J. Hazard. Mater. 28:91-
99.
351. Ziegler, G.A., Vonrhein, C., Hanukoglu, I. and Schulz, G.E. (1999) The structure of adrenodoxin
reductase of mitochondrial P450 systems: Electron transfer for steroid biosynthesis. J. Mol. Biol.
289:981-990.
352. Ziegler, G.A. and Schulz, G.E. (2000) Crystal structures of adrenodoxin reductase in complex with
NADP+ and NADPH suggesting a mechanism for the electron transfer of an enzyme family.
Biochemistry 39:10986-10995.
353. Zoh, K.-D. and Stenstrom, M.K. (2002) Fenton oxidation of hexahydro-1,3,5-trinitro-1,3,5-triazine
(RDX) and octahydro-1,3,5,7-tetranitro-1,3,5,7-tetrazocine (HMX). Water Res. 36:1331-1341.