Embed Size (px)
Citation preview

Studying DNA compaction by the Condensin complex usingmagnetic tweezers
Ana Carolina Faustino Mota
Thesis to obtain the Master of Science Degree in
Bioengineering and Nanosystems
Supervisors: Prof. Cornelis Dekker
Prof. Susana Isabel Pinheiro Cardoso de Freitas
Examination Committee
President: Prof. Gabriel Antonio Amaro Monteiro
Supervisor: Prof. Susana Isabel Pinheiro Cardoso de Freitas
Member of the Committee: Prof. Elisabete Fernandes
October 2016

Acknowledgements
This project was a great challenge to my bioengineering background by bringing techniques from phy-
sics to the analysis of biological events. It let me to go further than standard techniques and allowed
me to acquire complementary knowledge. The capability to look at the experimental results and take
conclusions about the model that better fits was firstly a puzzling job but turns out to be a stimulating
challenge. Not forgetting that this was my longest stay outside of Portugal and therefore, there are a lot
of people that I thank for all the support in this thesis.
Firstly, a special acknowledgement for Prof Cees Dekker to allow me in his group, a very competitive
and highly regarded laboratory. More than high knowledge, constructive discussions, advanced techni-
ques and well equipped laboratories, the working environment and the organized activities provided me
the chance to develop new friendships. This was a remarkable experience that encouraged me to define
my career in science.
I would like to thank my daily supervisor Jorine Eeftens for the patience for teaching, guidance in
the lab and valuable discussions. The freedom given to analyse my data and manage my experiments
helped me to gain autonomy and confidence in the lab. Besides that, thanks for continuously reminding
me to ”not work on the weekends” and enjoy my stay. In fact, it made me realize that back in Portugal
the pressure for positive results to progress in the career might harm the passion to do science.
I would like to also mention the members of the Cees Dekker lab for the support, the lovely time
spent together and the borrels in the coffee corner. I felt a cooperative and stimulating environment in
the whole group.
Furthermore, I would like to thank Prof Susana Freitas for accepting to be my local supervisor and
help me improve my physics knowledge before embarking on this adventure. I appreciate all the kind
and motivating words as well as the encouragement to take the most of this opportunity.
Of course, I cannot end this section without mentioning my family and friends. Even that we were
always 2,000 km far apart, the distant support by skype and whatsapp was essential to keep our bonds
alive. For the friends in Delft, I am thankful for helping me to adapt in a new country, to join in the trips
and for all the good moments together in the Netherlands.
Ana Mota
October 2016
i

Abstract
Condensin I complex belongs to the structural maintenance of chromosomes (SMC) family proteins, by
playing different roles in the cell cycle. The condensin mechanism to compact DNA is a long unresolved
debate due to the difficulty to track or obtain information from its movements. In consequence, little is
known about the condensin interaction with DNA whether diffuses or binds statically. Such critical events
as binding, extension shortening and structure maintenance are unsettled mechanism that this thesis
aims to answer. Techniques with high precision that can be conducted in physiological environment
are required for a realistic study and this project focus on the magnetic tweezers technique. The DNA
strand is at one end connected to a superparamagnetic bead and the other is attached to the surface
with a permanent magnet placed on the top at a specific height. The most striking discoveries consist
on the condensin binding to the DNA strand without ATP, although after its addition the condensation is
triggered and a stable structure is formed against mild forces (0.75 pN). The force application affects the
DNA stiffness and until certain level the condensation is blocked (1.75 pN). Furthermore, force as high
as 10 pN reverses the process and the original extension is reached back. The topology indifference for
condensation kinetics proves the non-specificity of condensin binding. Therefore, this thesis defends that
the model which better resembles the results is the DNA clustering with multiple condensin interactions.
Keywords: Magnetic Tweezers; Condensin I Complex; Single-Molecule Technique; Deoxyribonu-
cleic Acid (DNA); Condensation Rate.
ii

Resumo
Complexo de condensina I pertence a famılia das proteınas para a manutencao estrutural dos cromoso-
mas, que toma funcoes distintas ao longo do ciclo celular. O mecanismo da condensina para compactar
o ADN tem sido debatido devido a dificuldade para controlar ou obter informacao sobre os seus mo-
vimentos. Deste modo, pouco se sabe sobre a interacao da condensina com o ADN como se difunde
ou se liga estaticamente. Tais eventos crıticos como a ligacao, o encurtamento da extensao do ADN
e a manutencao da estrutura sao questoes que se pretende responder. Para um estudo realista sobre
a condensina sao necessarias tecnicas com elevada precisao que permitam realizar experiencias num
ambiente fisiologico e este projecto usa a tecnica das ”pincas magneticas”. A cadeia de ADN liga-se
numa das extremidades a uma esfera superparamagnetica enquanto a outra extremidade esta ligada a
uma superfıcie com um ıman permanente colocado na parte superior a uma altura especıfica. As des-
cobertas mais notaveis consistem na ligacao da condensina a cadeia de ADN sem ATP, embora apos
a sua adicao a condensacao e accionada e uma estrutura estavel e formada sob 0,75 pN de forca.
A aplicacao de forca afeta a rigidez do ADN e ate certo nıvel a condensacao e bloqueada (1,75 pN).
Alem disso, aplicando 10 pN o processo e invertido, recuperando a extensao original. A indiferenca
da topologia para a cinetica de condensacao prova a nao-especificidade da ligacao da condensina.
Portanto, esta tese defende o modelo da compactacao do DNA atraves de multiplas interacoes entre
condensinas.
Palavras-chaves: Pincas Magneticas; Complexo de Condensina I; Tecnicas da ”unica-molecula”;
Acido Desoxirribonucleico (ADN); Velocidade de Condensacao.
iii

Contents
Introduction 1
Single-Molecule Techniques . . . . . . . . . . . . . . . . . . . . . . . . . . . . . . . . . . . . . . 2
DNA . . . . . . . . . . . . . . . . . . . . . . . . . . . . . . . . . . . . . . . . . . . . . . . . . . . 5
Condensin I complex . . . . . . . . . . . . . . . . . . . . . . . . . . . . . . . . . . . . . . . . . . 9
Tools and Methods 14
Experimental setup design . . . . . . . . . . . . . . . . . . . . . . . . . . . . . . . . . . . . . . 15
Force calculation . . . . . . . . . . . . . . . . . . . . . . . . . . . . . . . . . . . . . . . . . . . . 16
Correction methods . . . . . . . . . . . . . . . . . . . . . . . . . . . . . . . . . . . . . . . . . . 19
Image analysis . . . . . . . . . . . . . . . . . . . . . . . . . . . . . . . . . . . . . . . . . . . . . 21
Experimental procedure . . . . . . . . . . . . . . . . . . . . . . . . . . . . . . . . . . . . . . . . 22
Calibration curve . . . . . . . . . . . . . . . . . . . . . . . . . . . . . . . . . . . . . . . . . . . . 25
Condensation Model 26
Trace analysis . . . . . . . . . . . . . . . . . . . . . . . . . . . . . . . . . . . . . . . . . . . . . 27
Experimental procedure . . . . . . . . . . . . . . . . . . . . . . . . . . . . . . . . . . . . . . . . 29
Results and discussion . . . . . . . . . . . . . . . . . . . . . . . . . . . . . . . . . . . . . . . . 29
Model formulation . . . . . . . . . . . . . . . . . . . . . . . . . . . . . . . . . . . . . . . . . . . 41
Conclusion . . . . . . . . . . . . . . . . . . . . . . . . . . . . . . . . . . . . . . . . . . . . . . . 45
Outlook . . . . . . . . . . . . . . . . . . . . . . . . . . . . . . . . . . . . . . . . . . . . . . . . . 46
iv

List of Tables
1 Lag time, condensation fraction and rate mean and standard deviations are presented in
each ATP concentration with the total number of tethers analysed per concentration. . . . 55
2 Average and standard deviation of the parameters of the sequential experiment. . . . . . 55
3 Average and standard deviation of the parameters at the condensin concentration exper-
iment. . . . . . . . . . . . . . . . . . . . . . . . . . . . . . . . . . . . . . . . . . . . . . . . 56
4 Average and standard deviation of the parameters at different topological structures of DNA. 56
5 Average and standard deviation of the parameters at different NaCl concentrations. . . . . 56
6 Lag time, condensation fraction and rate mean and standard deviations are presented in
each force applied with the total number of tethers analysed per force . . . . . . . . . . . 56
7 Comparison of consecutive condensation rates whether the following round decreases in
rate and taking into consideration the two different groups. . . . . . . . . . . . . . . . . . . 57
8 Comparison of consecutive decondensation rates whether the following round decreases
in rate and taking into consideration the two different groups. . . . . . . . . . . . . . . . . 57
9 Parameters analysed per bead at different measurements for decondensation experiments. 58
v

List of Figures
1 Representation of DNA with proteins stretched by AFM. Position-sensitive detector (PSD)
is a quartz sensor with four quadrants that detects the laser reflected. Adapted from
Neuman et al [1] . . . . . . . . . . . . . . . . . . . . . . . . . . . . . . . . . . . . . . . . . 3
2 Schematic of the experimental geometry used to characterize the mechanics of the DNA
hairpins. The DNA hairpin is attached at each end to dsDNA handles bound to optically
trapped beads (not to scale) in a force-clamped arrangement. [2] . . . . . . . . . . . . . . 4
3 Zoom in of a DNA helix stucture to visualize the base pairing of adenine (A) with thymine
(T) and guanine (G) with cytosine (C) . . . . . . . . . . . . . . . . . . . . . . . . . . . . . 5
4 The effect of the contour length with the structural property of DNA strand.(A) Above
persistence length the DNA adopts a random coil orientation according to the thermal
fluctuations of the solution. (B) Closer to the persistence length the freedom of orientation
is considerably restricted by the DNA rigidity described in WLC model. (C) Shorter than
persistence length DNA obtains a rigid structure. . . . . . . . . . . . . . . . . . . . . . . . 7
5 Representation of the force applied in function of the DNA extension measured in z axis.
This graph allowed Bustamante et al to define the WLC model for DNA strand. [3] . . . . 7
6 Representation of a relaxed strand with a linking number of 20 due to the presence of
20 twist. In case A, the liking number decreases despite of writhe formation in negative
direction. In case B, 2 twists are removed in the DNA strand. . . . . . . . . . . . . . . . . 8
7 Representation of the three types of condensin: condensin I and II present in eukaryotes
and SMC-ScpAB complex present in prokaryotes. . . . . . . . . . . . . . . . . . . . . . . 9
8 A model for recognition and binding of condensin to the DNA simplified in 4 steps. The
red circles refer to ATP molecules and for the head groups association, 2 ATP molecules
are needed. The image was a adaptation from Hirano’s review. [4] . . . . . . . . . . . . . 10
9 Schematic representation of the cell cycle stages with the cell division starting at the
mitosis and ending at the cytokinesis. The red line represents the DNA that condenses
during mitosis by condensin I (green and blue) and II (yellow and pink) interaction. The
condensin II is present in the nucleus while condensin I stays in the cytoplasm. . . . . . . 11
vi

10 The hypothetical mechanisms of condensin actuation are illustrated and named as chiral
looping, supercoiling, loop extrusion and cluster formation. The heads group of different
condensins can bind generating clusters or directly bind to DNA strand. The brown line
stands for double DNA strand and the red circles for ATP molecules. . . . . . . . . . . . . 12
11 Representation of a magnetic tweezers equipment: CMOS camera, LED source of light
and the flow cell indicating the liquid inflow and outlet channel. In the flow cell the tethered
bead to be studied has next to it a reference bead to remove bias from the mechanical
drift. [5] . . . . . . . . . . . . . . . . . . . . . . . . . . . . . . . . . . . . . . . . . . . . . . 15
12 Representation of vertical (A) and horizontal (B) magnets with the corresponding mag-
netic field gradient. The vertical configuration produces steeper magnetic gradients while
the horizontal configuration has a more homogeneous force distribution along the surface.
Adapted from [6] . . . . . . . . . . . . . . . . . . . . . . . . . . . . . . . . . . . . . . . . . 16
13 Schematic representation of the functionalization steps of the flow cell. A - Glass surface
of the coverslip with nitrocellulose. B - Adsorption of anti-dig antibodies. C - Complexation
of DNA-bead with the antibodies. The red squares and the purple sticks represent the
biotin and streptavidin, respectively. The green triangle is the digoxigenin and the grey
and brown beads are, respectively, reference and magnetic beads. D - Double tether. . . 17
14 The image A shows a magnetic bead being pulled by permanent magnets which can
rotate and move closer or further away from the flow cell surface. The image B shows the
effect of magnets rotation by twisting the DNA tethered to the bead. Until ± 5 rotations
the extension is constant then it decreases (buckling point). [1] . . . . . . . . . . . . . . . 19
15 Sequence of images recorded for the z-lookup tables and a, b, c, d and e correspond to
frame number 1, 25, 50, 75 and 100. The concentric rings diameter increases according
to the objective movement. . . . . . . . . . . . . . . . . . . . . . . . . . . . . . . . . . . . 22
16 Position of the holes in the coverslip. . . . . . . . . . . . . . . . . . . . . . . . . . . . . . . 23
17 Pipetting of the solutions onto the coverslip. . . . . . . . . . . . . . . . . . . . . . . . . . . 23
18 Sequence to mount the flowcell. . . . . . . . . . . . . . . . . . . . . . . . . . . . . . . . . 24
19 Graphic representation that correlates magnet height with force exerted on the MyOne
beads together with the fitting curve. . . . . . . . . . . . . . . . . . . . . . . . . . . . . . . 25
20 Rotation curves at 0.5 and 2 pN for each type of tether structure. The colours red, blue
and green are respectively nicked, single and double tethers, recognizable due to the
presence of buckling point. The buckling point absence at 0.5 pN is characteristic of
nicked tethers and at 2 pN is from single tethers. . . . . . . . . . . . . . . . . . . . . . . . 27
21 Example of traces where the tether extension is tracked over time. The condensin in
flushed at 0 seconds and the lag time describes the duration of constant DNA extension.
The 80 % and 20 % of the total condensed length is used for condensation rate. . . . . . 28
22 Relation between ATP concentration and condensation rate. The rate increases linearly
in function of ATP concentration until 2 mM and at 2.5 mM suffers a decrease. . . . . . . 30
vii

23 Relation between ATP concentration and lag time. The lag time shows a wide deviation
at lower concentrations and maintains simillar at higher concentrations than 0.75 mM. . . 30
24 Example of a Michaelis-Menten curve correlating reaction rate and substrate concentra-
tion. Vmax is the maximum rate. KM is the Michaelis constant. . . . . . . . . . . . . . . . 31
25 New trace for sequential flushing of condensin that was 24 minutes before ATP at 0 sec-
ond. The incubation took 20 minutes and the unbound condensins were washed out
that took the remaining 4 minutes. The incubation time was partially recorded since the
images saving took approximately 10 min after the tracking was stopped. . . . . . . . . . 31
26 Relation between condensin complex concentration and condensation rate. Until 18 nM
there is a increase of condensation rate but at higher concentrations the rate stabilized. . 32
27 Condensation traces comparison between 18 nM and 36 nM condensin concentrations.
At 18 nM the lag time is higher than 36 nM, although the condensation fraction is close to 1. 33
28 Illustration of a DNA stand with multiple condensin complexes attached. This condensa-
tion method by chiral looping DNA is a hypothetical model that is being debated in this
project. . . . . . . . . . . . . . . . . . . . . . . . . . . . . . . . . . . . . . . . . . . . . . . 33
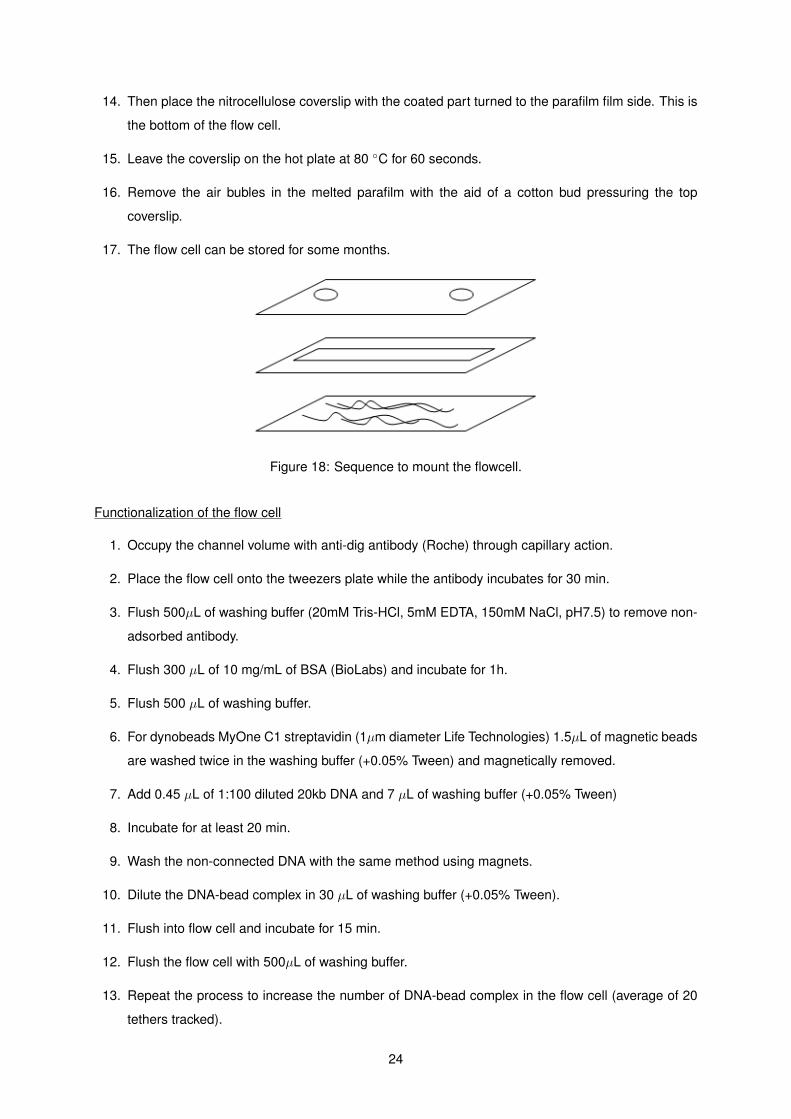
29 Histogram representing the condensation rate average and standard deviation in each
DNA topology analysed.The tethers number analysed in positive and negative supercoils
are both 6, 12 in single tethers and 10 in double tethers. . . . . . . . . . . . . . . . . . . . 34
30 A hypothetical scheme of double tether representation. A fully extended double tether (A)
after one rotation will show a considerable change of extension due to DNA crossing (B). 35
31 Histogram representing the condensation rate average at different concentrations with the
error bars. The condensation is just observed between 50 mM and 200 mM with constant
rate. The tethers number by NaCl concentration are: 0 mM - 7; 50 mM - 12; 100 mM - 10;
150 mM - 8; 200 mM - 12; 250 mM - 11; 400 mM - 10. . . . . . . . . . . . . . . . . . . . . 36
32 Representation of NaCl concentration in milimolar in function of lag time in seconds. At
150 and 200 mM the lag time is considerably high with a large standard deviation. . . . . 36
33 Representation of the traces registered at each force (green – 0.3 pN, red – 0.75 pN, blue
– 1.25 pN and pink – 1.75 pN). The initial extension varies with the force applied as well
as the rate, lag time and condensation fraction. . . . . . . . . . . . . . . . . . . . . . . . . 37
34 Relation between force exerted and initial extension. In fact, the extension increases from
5 µm at 0.3 pN to around 6.5 µm at 1.5 pN. . . . . . . . . . . . . . . . . . . . . . . . . . . 37
35 Relation between force exerted and final extension. The final extension increases in func-
tion of the force applied, making the condensation fraction to decrease. . . . . . . . . . . 37
36 Relation between force exerted and lag time. The lag time shows a large increase at 1.25
and 1.5 pN while the standard deviation becomes wide. . . . . . . . . . . . . . . . . . . . 38
37 Relation between force exerted and condensation rate. The rate decreases in function of
the force applied while the standard deviation also becomes smaller. . . . . . . . . . . . . 38
38 Representation of the force exerted on the tethers correlated with number of ATP required
in each force. The ATP molecules increases in function of the force. . . . . . . . . . . . . 39
viii

39 Example of a trace that represents series of condensation at 0.75 pN and decondensation
at 10 pN events. The initial extension could be successfully recovered in every stage and
the condensation still occurred after decondensation events. . . . . . . . . . . . . . . . . 39
40 The condensation rate average and standard deviation in each round have simillar values. 40
41 The initial extension at 0.75 pN (red) and at 10 pN (blue) relative to the initial DNA exten-
sion is averaged in each round and added the standard deviation. The values obtained at
different rounds and force do not show a significant difference. . . . . . . . . . . . . . . . 40
42 Representation of the condensation rate mean and standard deviation in function of the
condensated fraction in previous round have simillar values. . . . . . . . . . . . . . . . . . 41
43 The initial extension at 0.75 pN (red) and at 10 pN (blue) relative to the initial DNA ex-
tension is averaged in each condensated fraction and added the standard deviation. The
condensated fraction is from the previous round analysed. The values obtained at differ-
ent rounds and force do not show a significant difference. . . . . . . . . . . . . . . . . . . 41
44 Cartoon that represents the disruption of condensin attached to the DNA strand by appli-
cation of high forces. This is a debated model in comparison to the permanent condensin
attachment with DNA. . . . . . . . . . . . . . . . . . . . . . . . . . . . . . . . . . . . . . . 43
45 Schematic representation of the electrical double layer around DNA when in a solution
with NaCl. The water molecules were not included for simplification. . . . . . . . . . . . . 44
46 Schematic representation of new configurations to record condensation with MT and flu-
orescence microscopy. The tether is in the horizontal direction since the magnet was
moved to the tweezers plate plane. . . . . . . . . . . . . . . . . . . . . . . . . . . . . . . . 47
ix

List of Abbreviations
AFM – Atomic Resolution Microscopy
ADP – Adenosine Diphosphate
ATP – Adenosine Triphosphate
B – Magnetic Field
CAP – Catabolite Activator Protein
CMOS – Complementary Metal–oxide–semiconductor
Cy3/5 - Cyanine 3/5
dA - Deoxyadenosine
dC - Deoxycytosine
dG - Deoxyguanosine
DNA – Deoxyribonucleic Acid
dsDNA - Double-stranded DNA
dT - Deoxythymidine
DTT - Dichlorodiphenyltrichloroethane
EDTA - Thylenediaminetetraacetic Acid
FRET - Forster Resonance Energy Transfer
HEAT - Huntington, Elongation Factor 3, PR65/A, TOR
HEPES - 4-(2-hydroxyethyl)-1-piperazineethanesulfonic Acid
LED – Light Emitting Diode
Lp – Persistence Length
MgCl2 - Magnesium Chloride
MT – Magnetic Tweezers
NaCl - Sodium Chloride
OT – Optical Tweezers
PDMS - Polydimethylsiloxane
PSD - Position-sensitive Detector
Scc – Sister Chromatid Cohesion
SMC – Structural Maintenance of Chromosome
SNR - Signal-to-noise Ratio
ssDNA - Single-stranded DNA
x

Tris-HCl - Tris-Hydrochloride
Tw - Twist
WLC – Worm-Like-Chain
Wr – Writhe
xi

Introduction
In the biological point of view, life started when the first cell was created. The DNA present in
the cell encodes the information for cell survival and replication. Along evolution, those mechanisms
have gained sophistication to compact longer DNA strands and to face the environmental adversities
and cooperate or compete with other cells. More complex organisms benefit from the evolutionary
pressure and the cell machinery grows along with the requirements of the organism. The feasibility of
DNA replication is in the heart of the cell characteristics transmission into the daughter cells. Without an
ultra-compacted DNA structure named chromosomes, the whole process is put in danger. Condensin I
holocomplex is a member of the protein family that assures an efficient condensation and equal split of
the mother chromosomes. The undefined mechanism for condensation is a critical gap in our knowledge
to understand the cell replication. Methods of high precision that analyse single molecules like magnetic
tweezers are in demand to extract physical information to build a condensin mechanistic model.
1

Single-Molecule Techniques
In the last decades, a considerable development in optics and imaging methods has driven microscopy to
another level, the molecular scale. Now that imaging can accurately record several molecular events, the
following step is, naturally, manipulate with precise accuracy. In 1981 the first single-molecule technique
known as Scanning Tunnelling Microscopy was introduced, which brought the capability to visualize
and manipulate molecules at the atomic level. Later, it was improved to new types of microscopes
with sharper tips and more flexible cantilevers resulting in higher resolutions of molecular images and
higher versatility through the Atomic Force Microscopy (AFM) (1986). This technique by interacting with
the samples surface gives out information about the irregularities and different affinities in a sample
such as semiconductors, cell cultures, polymers and chemical structures. Entirely different methods for
single molecule experiments were also pursued such as optical tweezers (OT), which was first reported
in 1970 and just years later it was applied in molecular studies. In a highly controlled manner, single
molecules are manipulated in order to study their mechanical properties. Furthermore, Croquette et
al in 1996 introduced the first system of magnetic tweezers (MT) which initially aimed to confirm the
recent polymeric model attributed to DNA’s double helix. It was also applied afterwards in other types of
molecules and even in cell studies. All of those techniques share the capability to operate in small force
fields ranging between ato- and microNewton. This gives us information about the stretching resistance
due to mechanical and chemical properties of the molecule. This project focuses on MT for single
molecule experiments of condensin complex due of MT unique functionalities. These are explained and
compared to the other main single-molecule techniques available nowadays in the following section. [1]
The MT uses a superparamagnetic bead which has a molecule tethered at one end, and the other
end is immobilized on the glass surface and can provide forces ranging from 10 fN to 100 pN. [7] The
lower force limit is due to the surface forces becoming dominant and the top limit force is associated
with technical issues due to magnet intensity force and restriction of space. This technique can induce
torque in the molecules, which makes it an ideal technique for DNA supercoil research. [8] It has an
easy calibration system and permanent magnets are simple to manipulate. The force gradient applied is
homogeneous along the imaged field. The bead movement in the solution can be predicted according to
Brownian motion and the system is less prone than other single-molecule techniques to other molecular
interferences. The disadvantages are related to the limited spatial resolution and presence of viscous
drag in the bead which restricts the maximum number of tethers and temporal resolution problems. [5]
Developing better image acquisition equipment with wider image view also raises concerns about the
variation of magnetic force actuating on the flow cell surface, which in certain systems might be crucial.
The information of molecular events can be limited to stretching detection, so fluorescence microscopy
is a solution to control the organization within the chain, as well as interaction with other molecules. [9]
Although MT shows to have adequate attributes for sensitive control of force in biological molecules,
AFM and OT are also techniques that can apply force in such systems with distinct characteristics and
operation mode.
First of all, AFM is undoubtedly a revolutionary tool in single-molecule spectroscopy where forces
2

ranging from 10 to 104 pN are exerted by a cantilever tip on one end of the molecule and the other end
is bond to the surface (figure 1). The cantilever’s horizontal movement is controlled by a piezoelectric
with a small current. The tip interacts with the probe, for example DNA, proteins or even inorganic
materials, by electrostatic or van der Waals interactions. The cantilever deflection can be triggered by
sample height differences or the specific attraction to the molecule. The deflection is detected by laser
reflection from the top of the cantilever to a photodiode. [10, 11, 12, 13]
Figure 1: Representation of DNA with proteins stretched by AFM. Position-sensitive detector (PSD) is a
quartz sensor with four quadrants that detects the laser reflected. Adapted from Neuman et al [1]
.
Moreover, AFM has the following features:
• AFM is able to work in air or in liquid environments allowing experiments in near physiological
conditions, as opposed to the limitation of electron microscopy.
• There are three imaging modes: tapping, contact and non-contact mode. These differ in interaction
method with the probe by different modulations of the cantilever frequency.
And the following disadvantages:
• Undesirable interactions with other elements in the medium by Van de Waals, electrostatic and
adhesion forces.
• Difficult to control the attachment of the tip with the molecule.
• Limited to strong interactions like covalent bonds.
• Expensive tips.
Through OT, the molecule is tethered either by two dielectric beads or one which has the other end
connected to the surface. A dielectric bead is trapped in an optical well made by two laser beams in focus
due to its photosensitivity (figure 2). This makes it follow the light gradient towards to the focus point.
Throughout those movements forces between 0.01 to 100 pN are exerted on the molecule attached. [1]
3

To overcome light scattering, microscope lenses must have high numerical aperture to generate steep
light gradient and stabilize the trapping zone. [2, 14, 15]
Figure 2: Schematic of the experimental geometry used to characterize the mechanics of the DNA
hairpins. The DNA hairpin is attached at each end to dsDNA handles bound to optically trapped beads
(not to scale) in a force-clamped arrangement. [2]
Some characteristics are highlighted here:
• The trap stiffness is greatly dependent of the quality of the beam used and on the environment.
Optical field gradient perturbations affect the intensity distribution that commands the OT move-
ment.
• The AFM and MT look for suppressing the surface interactions in the measurements while OT has
no surface by counting on the lasers trap.
• Thanks to the three-dimensional manipulation, this technique allows more versatile experiments.
And the following disadvantages:
• If there is another dielectric particle around, it will be trapped by the laser. For this reason, the
operating conditions are generally in diluted solutions which makes it harder to trap the molecule
of interest and difficult to apply in vivo.
• Lower throughput than MT.
• It needs well calibrated forces that in optical systems are quite complex since they rely on the
calculation of molecule stiffness by Hooke’s law according to the bead displacement which affects
the force accuracy. [7]
• The molecules to be tested cannot be photo-damageable.
There is plenty of room for improvement, creating more versatile methods for broader types of exper-
iments. Those techniques definitely bring an enormous contribution to our knowledge of structural and
mechanistically traits of biological molecules. By studying the condensin complex with MT, it is possible
to recreate a specific event of cell division in vitro with precision and simplicity where the environmental
conditions are easily controlled. After this brief introduction, more details of the MT actuation are given
in the following sections as well as the setup description, software, force analysis and experimental
procedure for DNA immobilization and condensin actuation analysis.
4

DNA
The DNA structure was first displayed by Watson and Crick in 1953 which revolutionised biology by
finally matching DNA physical properties with its function. DNA has information codified in genes that is
later expressed into phenotypic characteristics. Briefly, DNA is organised in an antiparallel double helix
of nucleotides linked by phosphodiester bonds which work like a polymer chain. A human DNA strand
can be as long as 2 m and only 2 nm wide for those two helices. Although a cell has a limited size of few
micrometres which leads to a complex DNA compaction to fit in a cell nucleus. [7] Three components
are part of the nucleotides: phosphate, sugars and nitrogen bases. The bases have 4 possibilities
and are paired two by two always connected by hydrogen bond interactions: Thymine (T) – Adenine
(A) and Cytosine (C) - Guanine (G) (figure 3). The stacking of both strands into a double helix can
have structural differences such as number of base pairs per turn and grooves size in the helix. Those
differences in structure lead to distinct DNA classifications considering the B-form the most common in
cells, although several others structures should be considered, specially in this thesis, as P-form when
DNA is overstretched. [16] The negative charge of the backbone repels each other as well as the water
molecules by electrostatic interactions which enables DNA to smoothly move along another strand when
in contact and attracts proteins like polymerases or histone due to their positive charge. [17]
Figure 3: Zoom in of a DNA helix stucture to visualize the base pairing of adenine (A) with thymine (T)
and guanine (G) with cytosine (C)
There are a wide range of proteins that interact with DNA for vital functions in a cell such as su-
percoiling and transcription. Supercoils appear after the force application by enzymes to twist the DNA
helix. The twist will constrain the DNA into supercoils modifying its topology. To copy the genetic in-
formation into a mRNA which in biology is called transcription, involves different types of proteins for
detection, helix opening, supercoiling reduction, mismatches correction and strand reconnection. There
is a duality of certain proteins which control the compaction level of DNA but also regulate the gene
expression throughout more strongly compacted DNA portions than others which inhibits transcription.
Although those interactions between proteins responsible for condensing the DNA strand are still barely
known.
5

In the eukaryotic cell, the DNA helix has a higher compaction level that is organized in nucleosomes,
which consist of wraps of DNA around histone proteins. The wrapped genes transcription can be en-
hanced or repressed depending of the chemical modifications introduced in histones for a controlled
recruitment of transcriptional proteins. During transcription or replication processes some DNA portions
are temporarily uncoiled for better assessment of the proteins. The polymerases action generates torque
which obstructs the enzymes actuation. The topoisomerases ease the torque by nicking and rotating a
strand under another. This tension control mechanism is correlated with the origin of supercoiling. [18]
Some topological concepts of the DNA must be reviewed to understand the impact of stretching and
condensation in living cells. As referred, the DNA packaging not only allows the storage of an enormous
amount of information in a single cell but also influences the genetic expression as well the replication.
The local melting (dsDNA is splitted in 2 ssDNA) at the promoters leads to transcription initiation or at
the replication origins promotes DNA replication despite of the negative supercoiling. In the other hand
the positive supercoiling blocks mRNA synthesis important for transcription and the progression of the
replication fork. [19]
Several models of polymeric physics were taking into consideration to explain the semi-flexible be-
haviour of DNA, and since 1994 the Worm-like-chain model (WLC) is used for a DNA helix. In the WLC
model, as a result of the thermal fluctuations of surrounding fluids the DNA strand shows high degree of
flexibility in comparison to its long chain. However, until some length the DNA acquires rigidity enough to
resist bending. This length is an important physical characteristic: below that value, the polymeric chain,
in this case DNA helix, cannot be bent. This is the persistence length and it is around at 45 nm or 150
base pairs in DNA, according to the WLC model (figure 4). Applying high forces between 5-50 pN have
a consequence of stretching the B-DNA structure, but at higher forces drastic changes in contour length
occur and also others DNA structures show exponential variations (figure 5). The chemical bonds of the
molecule are shifted increasing the contour length and the elastic enthalpy effects are significant, as a
consequence the effective persistence length is calculated by the following equation: [20, 3, 18]
Leff =
(kBT
F
)[1
4(1− l)2− 1
4+
z
L0− F
K0+
i≤7∑i=2
ai(l)i
](1)
where z/L0 is DNA extension, a(l) is a residual value (tabled) and F/K0 is the enthalpy correction.
A DNA molecule can suffer two coiling effects: twist (Tw) and writhe (Wr) (figure 6). Twist happens
when the DNA helix goes over or under the other and DNA segments can be left more accessible when
opposing the twist direction. Writhes are in the origin of the plectonemes — when DNA loops or crosses
over itself in its axis approaches distant DNA regions. A relaxed DNA molecule has Wr = 0 due to
absence of external constrains. Those constrains are advantageous for the cell to compact DNA in a
smaller shape, critical for cell division efficiency. [21]
A mathematical theorem due to White (1969) states that:
Lk = Tw +Wr = constant (2)
The linking number (Lk) increases when applied torsion, defining the excess linking number σ (or
6

Figure 4: The effect of the contour length with the structural property of DNA strand.(A) Above per-
sistence length the DNA adopts a random coil orientation according to the thermal fluctuations of the
solution. (B) Closer to the persistence length the freedom of orientation is considerably restricted by the
DNA rigidity described in WLC model. (C) Shorter than persistence length DNA obtains a rigid structure.
Figure 5: Representation of the force applied in function of the DNA extension measured in z axis. This
graph allowed Bustamante et al to define the WLC model for DNA strand. [3]
degree of supercoiling):
σ =Lk − Lk0Lk0
(3)
The principal tool for topology analysis is gel electrophoresis because the migration speed changes
with supercoiling degree. However, those supercoils are irreversible and real-time analysis is inacces-
sible by this method. MT has become a wide-spread single molecule technique to effectively coil the
DNA through twist and torque, being the most versatile technique. [7] Several experiments were made
for topological study of DNA double helix and some conclusions are here described.
When applying rotations the linking number of DNA is increased by twisting the double helix. Never-
theless, the twists are interchangeable with writhes promoting plectonemes because the twist variation
number is very limited and going beyond the limit triggers denaturation of the double strand. When DNA
is saturated with twist and starts to writhe, the DNA extension decreases as a result of plectonemes
7

Figure 6: Representation of a relaxed strand with a linking number of 20 due to the presence of 20 twist.
In case A, the liking number decreases despite of writhe formation in negative direction. In case B, 2
twists are removed in the DNA strand.
creation and this transition is named as buckling or characteristic point. The buckling point is distinct
from the melting force. The DNA melting happens when the hydrogen bonds are disrupted by promoting
helix misalignment by force exertion. Those specific forces depend on dG-dC content in comparison with
dA-dT, electrostatic interaction with the buffer salts, pH and temperature. A broken covalent bond (nick)
in the DNA phosphate backbone removes the coilable feature by being torsionally unconstrained. This
means that under torque the extended length of the strand is kept the same by not showing a buckling
point. [22]
As mentioned the buckling point for dA-dT-rich was estimated to be lower than the dG-dC-rich se-
quence by employing rotations at different forces. At higher forces the buckling point is more difficult to
reach, since the DNA helix was observed to melt, essentially, in dA-dT-rich sequences. [18, 23] This is
logical when considering that dG-dC pairs have triple hydrogen interaction while dA-dT pairs just have
two. However, a new study made by Vlijm et al [22] proved that the dA-dT rich sequences could endure
higher number of rotations because the DNA strand is more flexible to twist while dG-dC contributes
to the helix stiffness. The melting still happens, preferentially, in the dA-dT sequences although the
high ratio of dC-dG is the actual promoter. To avoid influences in terms of the rigidity caused by DNA
sequence, the DNA has to include a known nucleotides sequence for all experiments.
A handful of other experiments could have been referred about DNA structure and force influence.
Nevertheless, an increasing number of experiments with proteins like polymerases, helicases, recom-
binases and topoisomerases and cells were also conducted to picture relevant events in vivo. [24] An
example is the nucleosome interaction which seems to reduce the DNA persistence length by binding it
around the histones. They also absorb energy from coiling effect which delays the plectoneme formation.
[25] The DNA condensation into chromosomes during mitosis caught attention by the introduction of a
novel group of proteins that promote a highly organized compaction. Those proteins known as structural
maintenance of chromosome (SMC) are described in the following section.
8

Condensin I complex
Taking human DNA as an example, which length is around 2 meters long, compression is an unavoidable
task for the cell to ensure that the information management and preservation can be accomplished.
Although, cell divisions need an additional confined DNA arrangement, known as chromosomes, so that
the two sister chromatids are equally separated for incorporation into daughter cells. Mistakes in the
division process can lead to aberrations in which generally induces cell apoptosis but in worst case can
trigger a tumour.
This decisive event involves different proteins in each stage of mitosis and check-points for a correct
segregation of chromatids. The DNA packaging is a complex event. To create the compact structure
of chromosomes, a particularly important group of molecules is required, the SMC proteins. Those
proteins are at the basis of chromosome structural modifications and there are 6 types in eukaryotes:
Smc1-Smc3 in cohesin, Smc2-Smc4 in condensin and Smc5-Smc6. Their structure consists in a coiled
shaped hetero-dimer with antiparallel peptidical chains of 50 nm length. [26] In the middle of the SMC
structure, a globular structure is called the hinge domain, and at the chain end, an ATPase head domain
which contains N and C terminal. Two SMC monomers are connected by the hinge domain create a
V-shaped dimer and change to O-shaped when the head domains bind to each other in presence of
2 ATP molecules, hydrolysing afterwards for heads disengagement (figure 8). [27] The play with open
and close arms is believed to be a conserve feature of SMC so that when DNA is interacting with the
hinge group, the DNA is engaged by the heads in ATP presence. [28] A recent work of Eeftens et al [29]
with AFM pointed out that condensin SMC dimers are very flexible due to a persistence length of 4 nm.
Moreover head groups can interact with the hinge in P- or B-configuration.
Figure 7: Representation of the three types of condensin: condensin I and II present in eukaryotes and
SMC-ScpAB complex present in prokaryotes.
Different condensin types were encountered depending of their proteic elements and organism: con-
densin I, condensin II and SMC-ScpAB (figure 7). Condensin in eukaryotes has more 3 subunits besides
the Sm2/Smc4 heterodimers, is the β-kleisin in condensin type II that recruits the HEAT-repeat subunits
CAP-D3 and CAP-G2 and δ-kleisins in type I with CAP-D2 and CAP-G. [30] The ATPase domains are
called as CAP-H (type I) and CAP-H2 (type II). The eukaryotic kleisin contacts with the ATPase heads
9

asymmetrically to the N-terminal of Smc2 and C-terminal of Smc-4. [31] The non-SMC complex might
enhance or diminish the holocomplex activity, for example the HEAT repeats stimulate the ATPase activ-
ity. [32] The DNA recognition depends on non-SMC proteins through the HEAT-repeat subunits, which do
not show affinity to the histone proteins or chromatin fibers. The HEAT-repeat subunits removal causes
aberrant chromosomes such, when specifically G subunit was displaced, it led to an abnormal axis or to
an unorganized chromatin mass when without D subunit. [33]
The prokaryotic Smc-ScpAB complex includes the Smc coiled coils although that ScpA replaces
kleisin and ScpB is the only DNA recognition component.[34] Those differences between eukaryotes
and prokaryotes are due to the absence of mitotic spindles for chromatids transportation in prokaryotes
which needs a less robust condensin structure. [27]
Figure 8: A model for recognition and binding of condensin to the DNA simplified in 4 steps. The red
circles refer to ATP molecules and for the head groups association, 2 ATP molecules are needed. The
image was a adaptation from Hirano’s review. [4]
For a eukaryote, the balance of both condensins type is crucial due to their distinct functions, how-
ever, in this thesis only condensin I was studied. Condensin II is present mainly in the nucleus while
condensin I is exclusively in the cytoplasm. In interphase, condensin is required for regulation and main-
tenance of DNA structure and expression. [35] Condensin can control gene expression, for example, by
bringing together the homologous allele that was located far apart. Additionally, genes are clustered in
order to enhance or inhibit gene expression. [36]
The cell division initiates by disrupting the nucleus membrane, however the condensin I complexes
present in the cytoplasm do not condense the DNA in that stage (figure 9). Just later when mitosis is
settled condensin I will contribute for lateral compaction while condensin II will lead to axial shortening,
being present in the cell at 5:1 ratio, respectively. [4, 37] In anaphase, when chromatids are segregated
by spindle tension on centromeros, which is the centre part of the chromosomes where both chromatids
are connected, condensin I maintains the chromosome rigidity. Condensin I also exhibit more mobility
than condensin II. Condensin I role is more relevant than condensin II in mitosis although condensins are
delocalized to the chromosomes arms before anaphase. [38, 39, 31, 40] For an elongated linear chro-
mosome structure, condensin II is the first holocomplex actuating although the condensation mechanism
is still unclear. In the same way, the condensin I actuation is unknown then the DNA strand compaction
models are speculated to occur in certain pathways as chiral looping, supercoiling, loop extrusion or
cluster formation (figure 10). [4] The aim of this project is to understand which mechanism condensin
uses to condense. Chiral looping consist in the torsion of two non-specific DNA sites around each other
10

like a twist. As an extension of this definition, the condensin could continue twisting to generate super-
coils that would allow a more compact conformation. Loop extrusion is supported by different studies
[26] since the lateral conformation can be modified in this model. The loop elongation was hypothesized
to occur by DNA sliding or by condensin hopping to further sequences. The compaction by condensin
cluster is a complex mechanism due to the interactions variety according to the condensin conformation.
Condensin hinge and head groups are though to simultaneously interact within each other [29] and the
head groups can also interact with DNA.
Figure 9: Schematic representation of the cell cycle stages with the cell division starting at the mitosis
and ending at the cytokinesis. The red line represents the DNA that condenses during mitosis by con-
densin I (green and blue) and II (yellow and pink) interaction. The condensin II is present in the nucleus
while condensin I stays in the cytoplasm.
In electrophoresis experiments, DNA was arranged in positive supercoils by condensin I upon ATP
hydrolysis. For further organization, DNA entanglements were removed through collaboration of decate-
nases as topoisomerases. [27] HEAT-mediated condensin interactions might be a key for cross-linking
of distant DNA strands. [32] A study with magnetic tweezers by Strick et al[41] referred that the initial
presence of negative or positive supercoils does not influence the condensation process. Neverthe-
less, most of in vitro studies lack biological reactions such as kleisin phosphorilations in condensin II
by Cdk1 and in condensin I by Aurora B among other kinases acting on DNA, portraying very poorly in
vivo events. The condensation and segregation of chromosomes include much more proteins besides
condensin complex that interact in a diverse array of events. [42] Moreover, an efficient DNA-condensin
interaction lies down on nucleosome accessibility and that is regulated by different proteins. [39] For
instance, Aurora B phosphorylates histones that over-wind DNA for improved flexibility.
11

Figure 10: The hypothetical mechanisms of condensin actuation are illustrated and named as chiral
looping, supercoiling, loop extrusion and cluster formation. The heads group of different condensins can
bind generating clusters or directly bind to DNA strand. The brown line stands for double DNA strand
and the red circles for ATP molecules.
Despite of the relevance of such process, one of the main role player of chromosome condensation,
condensin complex, was just discovered approximately 15 years ago [43], and a considerable amount
of research has been pursued. Nevertheless, the condensation steps and conditions are still unclear
and further research to bring up a model supported by stronger evidences are a priority in this field.
Because of the static analysis like electrophoresis are limited to the moment of capture and to non-
physiological environments, limited information can be gathered. Other techniques with real-time ob-
servation of condensation might give the desired knowledge about condensin kinetics and interactions.
The single-molecule techniques are ideal for a small scale analysis, which let the operator to control the
condensin kinetics for better observation.
In this project, the models represented in figure 8 for binding as well in figure 10 for the conden-
sation process will be critically analysed accordingly with the condensation rate. Little is known about
the condensin interaction with DNA, whether condensin diffuses or stays static while being catalysed by
ATP. Experiments with variation of ATP and condensin concentration and force intensity aim to address
unanswered questions like if ATP is essential for condensin proteolytic activity which induces conden-
sation and if condensation rate is linearly increased with the condensin concentration and affected by
force strength. In the same way, binding ability of condensin is wondered to be ATP-independent, so
condensin will be added without ATP and just later ATP is flushed to compare events. Even though
that condensin does not bind in preferable gene sequences, there is still debate about DNA topology
12

influence so throughout magnet rotations the DNA supercoil degree will be increased to clarify this point.
Since the molecules involved have charged groups that are dependent of the salt in solution, several salt
concentrations will be considered. How stable are those structures once formed? By high force applica-
tion, while DNA compaction is ongoing, is expected that condensation reverses. Nevertheless, at which
extent can the original state be recovered and if the following condensation rate is in some way altered
due to condensin structure rupture. By answering to this questions, certain models can be excluded or
supported. Our comprehension about this crucial event in cells has to be clarified so that other fields
and industries can benefit from this knowledge such as cancer and autoimmune diseases treatment.
13

Tools and Methods
To helps us elucidate in the physical analysis of the condensin mechanistic model, a single
molecule technique was employed. The magnetic tweezers technique grants a precise control in each
DNA molecule connected with a magnetic bead under analysis through magnetic field generation. An
in vitro experiment in a flowcell makes the study system much simpler and removes other unknown
variables out of this model. Nevertheless, the condensation steps might be in the order of nanometers
which makes the tracking susceptible for all kind of interferences that might encounter in a flowcell. This
chapter focus on the methods for image tracking, position interpretation and correction.
14

Experimental setup design
Figure 11: Representation of a magnetic tweezers equipment: CMOS camera, LED source of light and
the flow cell indicating the liquid inflow and outlet channel. In the flow cell the tethered bead to be studied
has next to it a reference bead to remove bias from the mechanical drift. [5]
The setup is represented in figure 11. For tethers (DNA + bead) observation, a channel with fluid
flowing is designed and cut in parafilm which is sandwiched between two glass coverslip that makes
a flow cell. It needs to be transparent for optical visualization and with a thin coverslip for lower light
refraction. One of the coverslips has two holes to flush in and out the buffer. The outlet of the flow
cell has a tube that connects to the syringe pump which flushes out the buffer at a controlled speed
approximately 408 µL/min to avoid tethers disruption. The flow cell with the tethered beads attached to
the bottom is placed on a movable tweezers plate. Above the flow cell a holder is placed, which hangs
2 neodymium magnets, and a 530 nm LED which emits green light to the flow cell. Different geometries
for the magnets as horizontal were analysed by Lipfert et al [6] for wider and equal exposure of magnetic
force on flow cell surface but variations of force in function of height are less sharp than vertical ones.
Vertical magnets were applied on the setup despite of steeper differences on force application (figure
12). [6]
Between the flow cell and the objective (magnification x50 Nikon) of an inverted microscope oil was
added to prevent significant refraction of the light in different refractive index mediums. The objective
position is controlled with nanometrical precision by a piezo stage which changes the focal plane. The
amplified image is detected by a complementary metal-oxide semiconductor (CMOS) which is a common
camera with high sampling rates. A CMOS sensor (FA-20-01M1H-00-R DALSA) contains a photodiode
coupled with a transistor in order to convert the photon to charge. Later charge is converted into voltage
located in just one cell, which gives a more versatility. In the case of the current experiment, a CMOS
camera records the image that goes through the objective and analyses in the computer in high sampling
frequencies. A drawback of this camera is the limited resolution to record more beads at a single
15

Figure 12: Representation of vertical (A) and horizontal (B) magnets with the corresponding magnetic
field gradient. The vertical configuration produces steeper magnetic gradients while the horizontal con-
figuration has a more homogeneous force distribution along the surface. Adapted from [6]
experiment for a more representative data. Many experiments with multiplexed measurements have
been developed so that a high bead density can be measured at the same time, increasing the technique
reliability and throughput. [5]
The flow cell is comprised of two glass coverslips 24x60mm, one of them with an inlet and outlet holes
made by sand erosion and the other functionalized with nitrocellulose (figure 13A), with a parafilm layer in
between. The channel is 5cm long and 0.5 cm wide and approximately 0.25 mm height. Anti-digoxigenin
antibodies stitches to the nitrocellulose (figure 13B) which is later passivated with 10 mg/mL of Bovine
Serum Albumin (BSA) to prevent interactions among bead, DNA and inner surface. DNA possesses a
biotin group that reacts with the streptavidin group of the magnetic beads. The non-connected DNA to
the magnetic beads was removed by multiple washes with a permanent magnet and later the tethers
are flushed in the flow cell for anti-dig association. The antibody forms complexes with digoxigenin
label introduced in the other DNA end (figure 13C). In some occasions a single bead attached two DNA
strands that also formed complexes with anti-dig antibodies (figure 13D). In the following section will
be explained how to detect double tethers. The components not associated are flushed out through
a constant flow settled by the pump. The choice for streptavidin-biotin relies on the high dissociation
rates (10−15 M−1) being much higher than the affinities of standard antigen-antibody complexes (10−6-
10−9 M−1). They present a complex combination between aromatic side chains of proteins, creating a
network of strong hydrogen bonds between ligands. [44] Therefore, the anti-dig bond has the weakest
point that is around 20 pN. [45]
Force calculation
The magnetic bead is made of iron oxide (Fe3O4) in magnetite crystal organization. It was chosen due
to its large magnetic susceptibilities, χ, which increases the bead magnetization by the equation 4.
M = χH (4)
Negative susceptibility is a characteristic of diamagnetic materials, the positive low values until 0.01
are due to paramagnetic materials and higher susceptibilities are from ferromagnetics and ferrimagnet-
16

Figure 13: Schematic representation of the functionalization steps of the flow cell. A - Glass surface
of the coverslip with nitrocellulose. B - Adsorption of anti-dig antibodies. C - Complexation of DNA-
bead with the antibodies. The red squares and the purple sticks represent the biotin and streptavidin,
respectively. The green triangle is the digoxigenin and the grey and brown beads are, respectively,
reference and magnetic beads. D - Double tether.
ics materials. Magnetic susceptibility is related with unpaired electrons despite of the low energy gap
between orbital states. The element with highest susceptibility is iron (Fe: χ = 5.92) with 5 unpaired
electrons in d orbital. [46] By Pauli principle, the electrons should point in opposite directions to coun-
teract spins, decreasing magnetization of the material. If an external magnetic field is introduced, the
magnetic moments self-orientate along the magnetic field, magnetizing the material. This is the charac-
teristic behaviour of a paramagnetic material, while diamagnetic materials have internal compensation,
increasing their potential energy by avoiding magnetization. [5]
Superparamagnetism has been applied in delivery systems and in sensors because of low remnant
magnetization, which means when a magnetic field is not applied, the material does not stay magnetized.
This is an important feature for instantaneous adjustment of materials magnetization according to the
magnetic field intensity changes.
The relationship between volume and magnetic susceptibility of the bead with force is conducted by
the equations 5 and 6. Forces between 10 and 100 pN are applied on beads with diameter of 1 to 3 µm
having the magnets outside of flow cell.
−→m = Vbead−→M = Vbeadχ
−→H (5)
with Vbead = 43πr
3, r is the bead radius.
−→Fm =
1
2(−→m.∇)
−→B =
Vbeadχ
2µ0
(−→B.∇
)−→B (6)
where µ0is the magnetic permeability in vacuum, B is the external magnetic field and in paramagnetic
materials is related with B = µ0H = µ0
χ M . The exerted magnetic field depends on the source, being
described with more detail in the following section. [47]
The characteristic length for magnetic field gradient is large, easily portrayed by the graphic of B
along z, when B has values of ≈mT the gradient change is in the order of 1 mm in solution medium. As
explained before, the field of view is considerably small and the beads are fixed in a position, so it can
be assumed that the magnetic field is maintained constant along the experiment. However, the values of
17

magnetic field in permanent magnets cannot be directly measured without a Hall sensor so the indirect
method using the bead stiffness was the one employed in this project. Firstly, the mechanical energy
stored in the nucleic acid (A) depends on the Lext described in z–axis:
EP = Etether + Emagnet = A (Lext)− Fmag.z (7)
When in equilibrium: (x, y, z) = (0, 0, Lext) = r0 and all partial derivatives of potencies energy are
equal to 0:
Fmag =∂A
∂Lext(8)
Nevertheless, the Brownian motion promotes the system to be shifted out of the equilibrium so a
new expression for total potential energy around the equilibrium position was defined considering the
trap stiffness (k) in each axis:
EP (−→r ) ≈ EP (−→r0) +1
2kx∂x
2 +1
2ky∂y
2 +1
2kz∂z
2 (9)
The x–axis is constrained by the magnet field and flow orientation and in the y–axis should be ac-
counted the bead radius because of its freedom of movement.
EP (−→r ) ≈ EP (−→r0) +1
2
(F
Lext
)∂x2 +
1
2
(F
Lext +R
)∂y2 +
1
2
(∂F
∂Lext
)∂z2 (10)
The z–axis trap stiffness of DNA molecule is dependent of its extension, so that an approximation of
worm-like-chain (WLC) model is used to calculate the force.
kz =∂F (Lext)
∂Lext=
kBT
2LPL0
(2 +
(1− Lext
L0
)−3)
(11)
Applying the equipartition theorem provides an estimation of the force:
F =kBTLext〈∂x2〉
(12)
where kb is the Boltzman constant and T the absolute temperature equal to 300 K,⟨∂x2
⟩is the variance
in x-axis.
While the major component of magnetic momentum is aligned according to −→B , there is a minor
component, −→m0, is not aligned at the start with −→B due to material anisotropy triggering torque, −→Γ , on
the bead: [48]
−→Γ = −→m0 ×
−→B (13)
Together with this phenomena, the magnet can actually be rotated to provoke misalignment between
magnetic field and the bead magnetization, which is forced to rotate as well. This originates an interest-
ing effect on the molecule tethered, changing the coiling state by twisting (figure 14). The twisting in a
DNA molecule can be measured by extension per superhelical turn (∆z): [47]
Γ =√
2LpkBTF and z = 2πR =
√2LpkBT
F(14)
18

Figure 14: The image A shows a magnetic bead being pulled by permanent magnets which can rotate
and move closer or further away from the flow cell surface. The image B shows the effect of magnets
rotation by twisting the DNA tethered to the bead. Until ± 5 rotations the extension is constant then it
decreases (buckling point). [1]
The rotation curve of a tether exhibits the buckling point when the extension decreases due to plec-
toneme formation (figure 14B). A nicked DNA does not have a buckling point while the double tether
have a more significant change of extension. The buckling point is harder to achieve when force is in-
creased by melting the DNA strand. In those situations, the double tether still shows extension change
because both helices curl around each other acting like plectoneme formation.
Correction methods
A correct image analysis would provide the bead position over time allowing to track the events in the
DNA helix by beads movement, as well as calculating the applied force. However as referred previously
there are other forces affecting the bead like the liquid viscosity and Brownian motion which distort
the bead trajectory. The condensation event is hypothesized to happen in small steps in the order of
nanometers due to the condensin size. Those thermal noise might affect the tracking of the smallest
steps, distorting the results. Moreover, the events being recorded might actuate at higher frequencies
than sampling which means there is information being lost due to undersampling or aliasing. In this way,
data processing is crucial for correct data analysis so this section will explain the considerations taken
before proceeding to measurements.
The measurements were recorded through a custom written LabVIEW program. For correct handling
of LabVIEW, a calibration curve should be first addressed to correlate the magnet height with the force
applied through beads movement and diffraction ring radius. Nevertheless, the bead position values
printed by LabVIEW do not correspond with the real position related to the bottom of the flow cell. To
correct those values, the magnet is moved away so the gravity force dominates to push down the bead
until it touches the bottom of the flow cell. The offset value is then defined by the lowest Z-value to
19

correspond to the position 0. The following measured Z-values will be subtracted by offset position
numbers giving a more accurate extension values.
Other corrections as the use of larger beads reduces the thermal fluctuations however, it increases
the interaction with the inner surfaces, poor time resolution and less sensitive at low forces. Increasing
the viscosity would slow down the bead’s movement although it could equally affect the enzymatic reac-
tion. The signal-to-noise ratio depends partly on light intensity. [49] The DNA length is also a relevant
factor since it defines the trap stiffness which is related to the temporal resolution, that was explained
before. By decreasing the trap stiffness, lower will be the time resolution, what defines how fast can an
event be sampled. [50, 5]
The sampling frequency for Brownian motion might create two effects: aliasing and time averaging or
motion blur. In the first case the frequency spectrum is influenced by higher frequencies than the sam-
pling which ended up to be introduce in the spectrum with lower frequencies changing the shape of the
power spectrum. [19] In the second effect, the measured variance is lower than the actual variance due
to loss of information by averaging the pixel intensity. Decreasing the shutter time could solve the motion
blur however information is going to be lost during the non-recorded time. Ideally the natural frequency
of the system should be lower than the Nyquist frequency of the camera (half of sampling frequency),
nevertheless the set-up camera has limited sampling frequency so the data is mathematically corrected
as follows.
The bead is embedded in a solution with a certain flow and other molecules promote collisions.
Since the Reynolds number is lower than 10−3 (around 10−5), the solution has approximately diffusive
behaviour; the Stokes law can be used (equation 15).
F ≈ 6πηav (15)
where η is the viscosity, a is the bead radius and v is the measured bead velocity.
Applying the Stokes-Einstein equation to calculate the diffusivity coefficient:
D =kbT
6πηr(16)
where kb is the Boltzman constant and T the absolute temperature equal to 300 K, η is the dynamic
viscosity that was considered to be the same as water (10−3 N.s/m2) and r is the bead radius in meter.
The true position, X, was averaged, Xm, in a finite time interval, W:
Xm (t) =1
W
∫ t
t−WX (t) dt (17)
The corrected position with the offset was handled in a MATLAB function by first determining the vari-
ance. However, the measured variance undergoes motion blur that introduces systematic bias despite of
long exposure time to track the condensation movements that happen with faster frequency. Therefore,
the measured variance should be corrected with the following functions:
S (α) =2
α−(
2
α2× (1− exp (−α) )
)(18)
20

var (Xm) = var (X)S(α) (19)
where α = Wτ = Wk
γ , τ is the trap relaxation time, γ is the friction factor felt in the particle calculated by
6πηr and k is the trap stiffness. For simplification W cannot be much larger than τ , so α is approximately
1. Using power series to express the motion blur correction function as:
S (α) ≈1− 2α
15 + α2
60
1 + α/5(20)
The equation 18 is combined with 20, it is possible to get k for α determination.
k =30kbT
2DW + 15var + (225var2 + 240DWvar − 11D2W 2)0.5 (21)
Now that the unknown variables were calculated, they can be applied in the correction function
(equation 18). The measured variance can thus be corrected (equation 19). The true variance will be
applied in the equation 12 to compute the corresponding force.
Finally, the force applied is fitted with the DNA extension through the equation 12. Different exten-
sions are obtained for the calibration curve by varying the magnet height, which changes the magnet
force strength involved in the system.
This technique does not have interference at low frequencies or a need for a feedback system.
MTs provide an ultrastable operation and simplicity in experimental operation. Nevertheless, the major
drawback is still not offering better resolution than OT, being limited by the thermal force of the aqueous
environment which gives temporal and spatial imprecision, especially at high forces and with small bead
and molecule tethered. The following equation shows that the bead height changes are camera noise
dependent of image pixels number, Npixel, and sampling frequency, fs:
δzcamera ∼
√1
Npixelfs(22)
Image analysis
In similarity with other single molecule techniques, the image tracking is in the base of the event analysis.
After bead-DNA tethering on the flow cell, the magnet is placed so the magnetic beads are attracted with
a distance from the bottom between 0 to 6.5 µm (contour length of DNA construct). The magnet is placed
at a distance with approximately 0.5 pN which makes the tether well distinguished from the reference
beads fixed on the bottom. The objective focus is manually changed in order to display a plane with both
type of beads. Afterwards, just 5 beads can be tracked in real time with one of them being the reference
bead. For larger beads tracking, the sampled images are saved onto the hard drive in jpeg format and
later another software is employed for offline tracking. Jpeg compression allows saving images at high
rate (>50 Hz) with minimal loss of resolution and the image size comprises 96 pixels with each pixel
ranging 159 nm. The number of tethers tracked is a compromise between resolution and the field of view
that might be sufficiently wide to show irregularities on the magnetic force distribution leading to different
21

effects on tethers. [8] The corrective algorithms to account for inhomogeneous magnetic gradient were
already written. Although in the present study with condensin, different application of forces might cause
distinct responses.
The enzymatic catalysis promoted by condensin leads to the DNA length contraction that is going
to be detected by the tethered bead. The LED light is projected on the flow cell where the tethers
are attached. The light is scattered by the bead then creating interference with the non-scattered light.
Concentric diffraction rings are produced in the focal plane of the objective positioned below the flow cell.
[47, 8, 48] The centre of the concentric diffraction rings is where the bead is located, conferring x and y
coordinates values. The z-movement estimation is given by concentric ring distance between the rings
and considering the bead fluctuation by Brownian motions. In this way it is possible to make a relation
between tether height and diffraction ring diameter (figure 15). Before proceeding with measurements,
a z-lookup table is accurately constructed by displacing the objective, typically in 100 steps of 200 nm
giving a range of 20 µm to calculate the radial profile at each focus point. Only the brightest fringes are
considered in the function to reduce the noise. [51] However the objective displacement is not exactly
equivalent to the bead displacement during experiments due to the refractive index of the medium. An
oil-immersion is used to reduce such deviation, although it was still accounted for by a linear correction
factor of 0.88. [51]
Figure 15: Sequence of images recorded for the z-lookup tables and a, b, c, d and e correspond to
frame number 1, 25, 50, 75 and 100. The concentric rings diameter increases according to the objective
movement.
The signal-to-noise ratio, SNR, was tested experimentally and is around 30 taking already into con-
sideration the shot noise (semiconductor defects) and the signal range, S, (peak-to-peak signal intensity
between the maximum and minimum brightest found in concentric rings). To calculate the SNR the
following equation was used:
SNR =S
4σ− 1 (23)
where S is the signal range, 4σ sets 95% confidence bound. The factor of 1 is related to the addition of
noise detected in a region without signal which increases the apparent measured signal. [51]
Experimental procedure
Flow cell
22

1. Draw 2 holes in 1 coverslip (Menzel-Glaser) at opposite ends like represented in figure 16 by
mounting on the top of a coverslip with those circles.
Figure 16: Position of the holes in the coverslip.
2. Take the coverslips to a sandblaster to sandblast the holes by placing the blaster gun close to the
hole centre and pump sand/air.
3. Place the sandblasted coverslips and also blank coverslips in a coverslip holder in a beaker filled
with acetone.
4. Lay the beaker in the sonicator for 30 min for acetone cleaning.
5. For cutting the fluidic channel in a parafilm sheet, an aluminium template is placed on the top of
the layer.
6. From a 1% nitrocellulose solution (0.1g in 10mL amyl acetate stored at 4 ◦C), dilute at 10:1 in amyl
acetate.
7. Take the coverslips out of the sonicator and let them dry in the air.
8. Dry the persistent solution with a nitrogen gun.
9. Pipette 3.5µL of diluted nitrocellulose solution across the surface of the non-holed coverslip like
represented in figure 17.
10. Use the pipette tip to spread the solution along the remaining surface by flattening the tip on the
surface.
Figure 17: Pipetting of the solutions onto the coverslip.
11. Let the solution dry in the air.
12. Pipette 4µL of polystyrene beads (Spherotech) that were diluted 1:5 in ethanol with the same
method.
13. Lay the parafilm on the top of the sandblasted coverslip in order to align the hole with the channel.
23
14. Then place the nitrocellulose coverslip with the coated part turned to the parafilm film side. This is
the bottom of the flow cell.
15. Leave the coverslip on the hot plate at 80 ◦C for 60 seconds.
16. Remove the air bubles in the melted parafilm with the aid of a cotton bud pressuring the top
coverslip.
17. The flow cell can be stored for some months.
Figure 18: Sequence to mount the flowcell.
Functionalization of the flow cell
1. Occupy the channel volume with anti-dig antibody (Roche) through capillary action.
2. Place the flow cell onto the tweezers plate while the antibody incubates for 30 min.
3. Flush 500µL of washing buffer (20mM Tris-HCl, 5mM EDTA, 150mM NaCl, pH7.5) to remove non-
adsorbed antibody.
4. Flush 300 µL of 10 mg/mL of BSA (BioLabs) and incubate for 1h.
5. Flush 500 µL of washing buffer.
6. For dynobeads MyOne C1 streptavidin (1µm diameter Life Technologies) 1.5µL of magnetic beads
are washed twice in the washing buffer (+0.05% Tween) and magnetically removed.
7. Add 0.45 µL of 1:100 diluted 20kb DNA and 7 µL of washing buffer (+0.05% Tween)
8. Incubate for at least 20 min.
9. Wash the non-connected DNA with the same method using magnets.
10. Dilute the DNA-bead complex in 30 µL of washing buffer (+0.05% Tween).
11. Flush into flow cell and incubate for 15 min.
12. Flush the flow cell with 500µL of washing buffer.
13. Repeat the process to increase the number of DNA-bead complex in the flow cell (average of 20
tethers tracked).
24

14. For dynobeads M-270 streptavidin (2.8 µm diameter Life Technologies)
15. Change the bead’s volume for 3µL and flush only one aliquot into flow cell.
16. All the rest of the reagents are from Sigma-Aldrich.
Calibration curve
Before taking measurements, the magnetic force value actuating in the system is needed to know so
that the results can be related to the force effect. There are other methods referred previously like
Hall sensors that can measure the magnetic field. However, this a type of experiment where precision
is crucial and the magnetic field intensity perform significant changes at short distances. The field of
view was already considered to avoid those changes, so the most accurate method is by drawing a
calibration curve that correlates magnet height with force in the beads observed. By employing the
LabVIEW software, beads pictures are taken at 100Hz frequency for around 8000 frames at different
heights. The magnet height was considered in order to plot a graph that correlates with the force applied.
The following graph represents the first calibration curve used for MyOne beads with 1 µm diameter.
Figure 19: Graphic representation that correlates magnet height with force exerted on the MyOne beads
together with the fitting curve.
The force exerted is represented in function of the magnet height in figure 19 with an exponential
fitting curve. The fitting curve’s coefficients allow to calculate the magnet position for a specific force.
More calibration curves were taken when the set up or beads aliquot were changed. A set of experiments
adopted a different type of bead with 2.8 µm diameter so it could be possible to apply forces as high as
10 pN.
25

Condensation Model
The development of a fine correction method allows an accurate analysis of the bead coordinates
over time by conceiving a trace graph. After the condensin flushing, the DNA extension resembles the
condensation degree giving out information about the compaction procedure. By combining results of
different experiments that vary force intensity, DNA topology and ATP, condensin and salt concentrations,
relevant information is acquired for the condensation model formulation. Under analysis are 4 models
for condensin actuation to be debated: chiral looping, supercoiling, loop extrusion and cluster formation.
The most appropriate model to fulfil the results observations would lead to a significant achievement for
the comprehension of chromosome dynamics.
26

Trace analysis
The algorithm design for magnetic tweezers and the understanding of the DNA physics made it possible
to start with biological experiments on DNA throughout force. The work of Strick et al [41] introduced the
first time a simple assay with condensin I complex and prove the magnetic tweezers potential for single-
molecule studies. The real-time manipulation and observation of condensation to explain its mechanism
is the aspiration of this project. The flow cell functionalization and buffer conditions were defined by
previous studies which were fundamental for this project realization. Herein are explained the traces
observation, how they were translated into results and a discussion about their meaning.
After the calibration curve formulation, the specific force for measurements is applied by selecting
the corresponding magnet height. The flow cell, whose tethers were attached and washed according to
the protocol in Tools and Methods section, is located on the tweezer’s plate to first analyse the tether’s
characteristics. The offset values are recorded as well as the rotation curve at 0.5 and 2 pN (figure
20). The choice of those forces were due to the DNA melting starts to occur below 2 pN so that double
and single tethers can be distinguished. The rotation curve at 0.5 pN gives information about nicked
tethers, by not exhibit a buckling point. This information will be important to relate the DNA topology
with condensation events. Before flushing in the condensin aliquot, the DNA extension is recorded at
the measuring force in a pre-measurement trace and then the condensation trace is taken.
Figure 20: Rotation curves at 0.5 and 2 pN for each type of tether structure. The colours red, blue and
green are respectively nicked, single and double tethers, recognizable due to the presence of buckling
point. The buckling point absence at 0.5 pN is characteristic of nicked tethers and at 2 pN is from single
tethers.
The LabVIEW software tracked the z-position values by first recording the images and later register
the bead position as described in the Tools and Methods chapter. Afterwards the position values are
represented in MATLAB accordingly with the sampling frequency adopted that will give the position’s
time. The z-position values displayed in the traces depict the current DNA extension over time. Therefore
a change in those position values means that the DNA extension was increased or decreased. The
morphological DNA transformations are not directly observable, just with the addition of dyes some extra
27

information could be obtained. In fact, successful combination of MT with fluorescence was achieved
despite of some technical complexity due to the DNA proximity to the surface.
As mentioned, the rotation curves were captured before flushing in the condensin so that torsional
information can be obtained. The graphs relate DNA extension with number of magnet rotations instead,
which were between -100 to 100. Before adding condensin, an pre-measurement trace was recorded
to extract the original DNA extension while no compaction is taken place. In the moment after that the
whole aliquot was added and the flushing stopped, LabVIEW, immediately, starts to track in order to
represent the initial point (0 seconds) in the trace. The recording stops when the live analysis made by
LabVIEW shows stabilization of the tether extension for at least 2 minutes. The MT provides information
about the time that was taken to start condensation, the lag time, as well as the time to complete full
condensation. This data information was gathered by manual reading of the traces to avoid ambiguity
created by trace irregularities or noise. The 100% DNA extension in a measurement is represented
in the pre-measurement trace. Since not all tethers reach 0 extension, only the condensation fraction
is considered for the rate. Besides that, to remove inaccuracies about the start and ending of the
condensation trace and exclusively considering the actual final extension reached, between 80% and
20% of the total length compacted is determined the condensation rate (figure 21). The condensation
rate evaluates the condensin efficiency in a certain condition introduced. The determination of the
experimental error was by applying the standard deviation of the measured points. Some conclusions
about the condensation mechanism can be deduced in conformation with the experimental results, like
the relevance of DNA topology and flexibility, ATP and condensin concentration.
Figure 21: Example of traces where the tether extension is tracked over time. The condensin in flushed
at 0 seconds and the lag time describes the duration of constant DNA extension. The 80 % and 20 % of
the total condensed length is used for condensation rate.
28

Experimental procedure
1. After have prepared the flow cell, flush 500 µL of condensin buffer (125 mM NaCl, 10 mM HEPES
and 5 mM MgCl2).
2. Focus the objective where most tethers can be found and take the offset, rotation curves at 0.5 pN
and 2 pN with 5 Hz turns frequency between -100 and 100 turns.
3. Place the magnet height at the adequate position for the force required.
4. Always keeping in an ice container, prepare the sample with 50 µL total volume.
(a) Add 34.5 µL of condensin buffer.
(b) From a 1 M of DTT solution in the fridge prepare the sample in order to have 1 mM of DTT.
(c) From 100 mM of ATP solution in -20 oC, prepare 1 mM of ATP.
(d) From a -80 oC freezer, an aliquot was taken from a condensin (extracted from mitotic eggs of
Drosophila melanogaster ) solution of 1.2 mg/mL to get 12 nM of condensin.
5. Before flushing in the protein, take a pre-measurement curve of 2048 frames to record the initial
extension. In the moment that the tracking is finished the sample should be immediately flushed.
6. Start to record the traces right after the sample was flushed. Stop tracking when the tethers are
completely condensed.
Results and discussion
The ATP is the driving force for condensation.
Several experiments were performed to understand the condensation mechanism. ATP is one of the
key role players since condensation depends on that, however, little is known when ATP interacts with
condensin and what is the purpose. To quantify the ATP relation with condensation event, 8 different
concentrations were evaluated which gave 124 tethers in total (table 5 in appendix). Some previous stud-
ies [41, 33, 32] had referred that ATP is essential for DNA compaction and is involved in the catalysis of
condensin head groups. In fact, a measurement without ATP was performed to prove those statements
and no condensation was observed (figure 22). The addition of ATP promoted the condensation by
increasing the rate in function of the ATP concentration. The rate increases considerably until 2 mM ATP
reaching almost 350 bp/s. However, at 2.5 mM the rate decreases almost by half of the value of 2 mM
ATP due to condensin activity inhibition or an experimental flaw. Nevertheless, no literature refers about
morphological modifications in condensin structure when in contact with excessive ATP or ADP, which
makes it more likely to be an error in the measurement. The lag time does not show a correlation with
ATP concentration, only at very low concentrations that increases lag time due to large standard devia-
tions (figure 23). In addition, each condensin can have differences in activity causing delayed actuation.
29

Figure 22: Relation between ATP concentration
and condensation rate. The rate increases lin-
early in function of ATP concentration until 2 mM
and at 2.5 mM suffers a decrease.
Figure 23: Relation between ATP concentration
and lag time. The lag time shows a wide deviation
at lower concentrations and maintains simillar at
higher concentrations than 0.75 mM.
The fraction is similar in almost all forces, just only when adopting 0.25 mM of ATP a fraction of 0.37 is
obtained due to 58% of tethers not condensing. For more detailed numbers, see table 1 in the appendix.
Taking a deeper look at figure 22 and considering that ATP is a substrate of condensin enzymatic
reaction, a Michaelis-Menten curve is expected to represent this data like the schematic representation
in figure 24. Actually, the ratio between condensin and ATP concentration in the standard conditions
(0.75 pN, 12 nM of condensin and 1 mM of ATP) is 1:83 while at the lower concentration at 0.25 mM is
1:21 and higher at 2.5 mM is 1:208 a difference of 10 times more ATP by each condensin. A biological
reaction is limited by a maximum speed since the substrate will saturate the catalytic groups of an
enzyme. The Michaelis-Menten curve expresses the maximum rate that a reaction can reach with a
certain enzyme concentration. The Michaelis-Menten curve is mathematically expressed as:
V =Vmax [S]
KM + [S](24)
where Vmax is the maximum rate, [S] is the substrate concentration and KM is the Michaelis constant
that corresponds to the substrate concentration when the rate is half of Vmax.
The calculation of both parameters, Vmax and KM , is by linearization of Michaelis-Menten equation
in order to have a linear relation between variables. However, the calculation did not provide valid results
since the standard deviations are considerably large and the saturation rate was not well defined.
The condensin binding to DNA is ATP-independent.
With this new experiment, the aim is to clarify the ATP relevancy for condensin binding to DNA.
Therefore, a different experiment was designed to flush condensin without ATP and leave it incubate for
20 minutes. Afterwards, the unbound condensin is washed out and added ATP. In this experiment 15
tethers were analysed. As expected, no condensation was triggered, the extension was kept constant
along the incubation time. The traces in figure 25 reveals the DNA extension along incubation time and
after flusing ATP at time = 0s with the same volume and concentration used in previous experiment. In
30

Figure 24: Example of a Michaelis-Menten curve correlating reaction rate and substrate concentration.
Vmax is the maximum rate. KM is the Michaelis constant.
the middle of both traces, the unbound condensin was removed by flushing 300 µL of buffer.
Figure 25: New trace for sequential flushing of condensin that was 24 minutes before ATP at 0 second.
The incubation took 20 minutes and the unbound condensins were washed out that took the remaining
4 minutes. The incubation time was partially recorded since the images saving took approximately 10
min after the tracking was stopped.
DNA was able to fully condense and large values of lag time were presented (table 2 in appendix).
The condensation was then triggered with lower rate, approximately half of the standard experiment.
This supports the hypothesis that condensin can bind to DNA in ATP absence and the bind is strong
enough to survive the flow force.
The condensin I complex concentration boost DNA compaction kinetics until saturation point.
In this experiment, 7 condensin concentrations with a total of 97 tethers were considered (table 3 in
appendix). The tethers fully condensed in most concentrations. At 3 nM, only 33% of the tethers con-
densed and at 6 nM the success percentage was 83%. Even that few quantity of condensin was added,
31

the compacted DNA was stable and did not recover the extension along the condensation. In figure 26,
the rate is represented in function of condensin concentration. The condensation rate increases until
18 nM when saturated around 160-180 bp/s. By virtue of the catalytic heads where the ATP hydrolysis
takes place condensin complexes promote DNA condensation. However, since it is an enzyme and not
a substrate, the Michaelis-Menten is not, in principle, applied in this case.
Figure 26: Relation between condensin complex concentration and condensation rate. Until 18 nM there
is a increase of condensation rate but at higher concentrations the rate stabilized.
Another factor that can help to understand this effect is the lower lag time at higher concentrations in
comparison with lower ones (at 18 nM was 181 s and at 36 nM was 39 s) as in figure 27 is shown. This
information would indicate that there is more energy being used to overcome the energy barrier. This
implies that there are more condensin molecules attached to the DNA strand for ATP usage to speed
up the process. To represent the initial organization of condensin complexes at 18 nM and at 36 nM of
condensin the figure 28 was made. Nevertheless, the overall rate is equal, even that the condensation in
36 nM started quicker and with a steeper inclination that was gradually flattened (figure 27). It could be
that condensin used up most of surrounding ATP molecules, slowing down the condensation at the end
portraying a previous experiment with lower ATP concentrations. To elucidate about the ATP availability,
the ratios of condensin:ATP are 1:56 at 18nM and 1:28 at 36 nM. However, it is also likely that condensin
molecules started to condensate at different spots and at a certain point the condensin activity will create
interferences with each other’s activity. By increasing ATP concentration in order to reach the 1:56 ratio
and then compare with the 18 nM results could help us understand what is causing the rate slowdown.
Moreover, it is legit to think that the unbound condensin could take part in this reorganization. For
that, the sequential addition of ATP after condensin incubation should be brought back here to further
analysis. The rate described is 55 bp/s which transcribes in a concentration in the middle of experiments
with 6 and 9 nM of condensin by looking at the figure 26 even that was flushed 12 nM, which implies
that more than half of the protein was kept bound to the DNA. Those results are in agreement with Strick
32

Figure 27: Condensation traces comparison between 18 nM and 36 nM condensin concentrations. At
18 nM the lag time is higher than 36 nM, although the condensation fraction is close to 1.
Figure 28: Illustration of a DNA stand with multiple condensin complexes attached. This condensation
method by chiral looping DNA is a hypothetical model that is being debated in this project.
et al[41] work where the buffer volume increased to verify that the bound condensin was also being
removed during flushing. Consequently, it can be conveyed that the bound condensin can reorganize in
a DNA ’ball’ to reach the full condensation.
Furthermore, increasing the condensin amount in the solution could stimulate formation of condensin
clusters not directly involved in the condensation. Kim et al[9] used fluorescence to prove the existence
of condensin clusters but their function is unclear. This would be a competing effect that would abstain
some condensin molecules to participate in the condensation. However, we see that the lag time is
considerably lower and the rate is in generally faster at the start thus the condensin competition is not a
significant factor or could even be an enhancement.
To elucidate about the cooperative level of condensin with other condensin complexes, the Hill coef-
ficient, n, was subsequently calculated:
θ =[condensin]n
[Ka]n + [condensin]n(25)
where θ represents the condensation rate and Ka is the ligand concentration occupying half of the
binding sites.
The rate fitting in function of different condensin concentration gave a Hill coefficient approximately
33
2.5. The Hill equation defines that higher than 1 the proteins are cooperative while lower than 1 the
proteins affinity is decreased. Therefore there is formation of clusters which cooperates in the DNA
compaction.
The condensin I complex activity does not change with supercoiled DNA.
Next, we studied if the degree of DNA supercoiling influences the condensation rate. Condensin
was reported [43] to form positive coils or knots in DNA. Additionally, the double tethers were also
considered by having a particular topologic structure. The results are shown in figure 29, where a
histogram displays the condensation rate of each topology and more details are in table 4 in appendix.
The rates are equal when DNA was positively and negatively supercoiled with the relaxed DNA. This
result is in conformation with Strick et al experiments.[41] The condensin mechanism to compact DNA
is independent of its supercoiling level or orientation. The same way, by previous analysis [41] is known
that a nicked strand does not affect the condensation rate. Furthermore, Piazza et al[32] demonstrated
that the condensin binding is not site-specific, suggesting that the in vivo regulation is made by chemical
modifications of nucleosomes to leave DNA more or less accessible.
Figure 29: Histogram representing the condensation rate average and standard deviation in each DNA
topology analysed.The tethers number analysed in positive and negative supercoils are both 6, 12 in
single tethers and 10 in double tethers.
The topology experiment examined tethers with -45 and +45 rotation turns that corresponds to a 1
µm of extension reduction due to plectonemes formation. The value of 45 rotation turns was concluded
by evaluation of several rotation curves like in figure 29, having a buckling point around ±30 rotation
turns. There is a considerable difference in lag times between the two rotated tethers having the positive
supercoils 195±175 bp/s and the negative 38±21 bp/s.
More DNA propelled a higher activity.
In this experiment a measurement for double tethers was also included by changing the ratio of DNA
with beads through mixing 0.5 µL of beads with 0.6 µL of DNA (table 4 in appendix). The double tethers
34

condensation rate, whose mean is 3 times higher than standard with a large spread of values, do not
follow the line of results from previous topological changes (figure 29). Besides, the double tether’s
extension is in the majority of cases lower than in single tethers and have the shortest lag time of 21±15
bp/s.
To understand this phenomena, it is important to have an elucidative structure of what would it be
the double tethers. The double tethers are consisted of multiple DNA strands that are connected to
the same bead. To look for differences in the double tether structures, a new rotation curve was made
between -5 and +5 magnet turns at 2 pN with 0.5 Hz frequency, to reduce the drag force in the bead. In
almost 25 % of the double tethers show a clear sudden decrease of extension like represented in figure
30. The two parallel DNA strands (figure 30A) twist around each other while the magnet rotates by
creating entanglements (figure 30B). The other double tethers that did not show the extension change
are a result of an entanglement before the binding to the anti-dig antibodies, which makes the untwisted
point in a distinct magnet rotation. As a result, the presence of another DNA strand increases the rate
by possibly allowing inter-DNA strand condensation. Thanks to the long arms of condensin I complex
and the proximity of multiple DNA strands more opportunities are created to trigger condensation.
Figure 30: A hypothetical scheme of double tether representation. A fully extended double tether (A)
after one rotation will show a considerable change of extension due to DNA crossing (B).
The salt concentration in solution limits the condensin I complex operation.
The study about the NaCl influence is also of great interest since the different molecules playing a
role in the condensation possess charged groups. NaCl in aqueous solution dissociates in Na+ and Cl−
ions that interact to opposite charges by electrostatic force which are present in the phosphate groups
of DNA and ATP, Mg2+ and the HEAT repeat of condensin I complex. ATP creates chelates with Mg2+
which is the metal ion with the highest binding affinity, and such connection is required to participate in
catalytic reactions.[52] The HEAT proteins are hypothesised to interact with DNA backbone and promote
condensation, allowing a stable and strong binding.[32]
This time, 8 different NaCl concentrations were made to determine the condensation limits. The
condensation rates in the range of 50 and 200 mM of NaCl have similar values (figure 31). Outside of that
range, which means at higher concentration than 200 mM and in NaCl absence, no condensation was
35

observed. The lag time is represented in figure 32 which seems to increase along with salt concentration
although the error measured is substantial. The condensation fraction’s averages were all close to 1,
independently from the NaCl concentration in the condensin buffer.
Figure 31: Histogram representing the condensation rate average at different concentrations with the
error bars. The condensation is just observed between 50 mM and 200 mM with constant rate. The
tethers number by NaCl concentration are: 0 mM - 7; 50 mM - 12; 100 mM - 10; 150 mM - 8; 200 mM -
12; 250 mM - 11; 400 mM - 10.
Figure 32: Representation of NaCl concentration in milimolar in function of lag time in seconds. At 150
and 200 mM the lag time is considerably high with a large standard deviation.
Condensation rate depends on the applied force.
To describe the lag time, condensation fraction and rate according to force variation, 8 different force
gradients and 152 tethers were analysed in total. The detailed information can be examined in table
6 in appendix. When applying force as little as 0.3 pN the DNA reaches around 5 µm of extension,
which is 77% of the total length of the construct (6.5 µm). This extension differences are represented
36

by traces recorded at distinct forces in figure 33. Between 0.3 pN and 1.5 pN 20% of the total extension
had increased, which translates in a gain of chain rigidity that influences the rate (figure 34). The final
extension also depends of which force is applied but the effect is more pronounced at the highest forces
(figure 35).
Figure 33: Representation of the traces registered at each force (green – 0.3 pN, red – 0.75 pN, blue –
1.25 pN and pink – 1.75 pN). The initial extension varies with the force applied as well as the rate, lag
time and condensation fraction.
Figure 34: Relation between force exerted and
initial extension. In fact, the extension increases
from 5 µm at 0.3 pN to around 6.5 µm at 1.5 pN.
Figure 35: Relation between force exerted and
final extension. The final extension increases in
function of the force applied, making the conden-
sation fraction to decrease.
In figure 36, the lag time is in function of force applied which is longer when the force is higher, al-
though the lag time spread also increases in most of the experiments. This means that there is higher
37

probability at lower forces for the condensation to start in the first seconds but at higher forces the prob-
ability for that to happen in such interval is smaller. Ultimately, the condensation rate decreases steadily
with higher forces as is shown in figure 37. At higher forces, the breaks events along condensation are
more frequent as well as the time needed to complete condensation. At 1.75 pN no more condensation
is detected.
Figure 36: Relation between force exerted and lag
time. The lag time shows a large increase at 1.25
and 1.5 pN while the standard deviation becomes
wide.
Figure 37: Relation between force exerted and
condensation rate. The rate decreases in function
of the force applied while the standard deviation
also becomes smaller.
The energy barrier to start the condensation rises with increasing the force. The condensin work
energy to fully condense the DNA is calculated by multiplying the force applied with the absolute con-
densation length. The amount of ATP molecules required by each tether is determined by considering
that 1 ATP = 20 kT of energy and 1 kT = 4.114 pN.nm, which gives 1 ATP≈80 pN.nm. In figure 38, the
force applied is related with number of ATP consumed. Curiously, for the standard condition approxi-
mately 45 ATP molecules were found to fully condense a DNA strand, whose ratio is resembled in the
ATP concentration (0.5 mM ATP and 12 nM condensin) close to the limit of condensation. This would
indicate that just one condensin is required for one tether to condense. However, there is no proof that
just one condensin complex is involved and the available ATP might not only be used for direct extension
reduction.
The condensed DNA extension was recovered with high force without affecting the condensin
I complex activity.
Force might prevent the condensation development but can it destroy the condensin arrangement in
the DNA? Hence, the last experiment consists in pulling the tether back to the original extension while
DNA is condensing to re-start the condensation by 5 times. Since the pulling force is 10 pN, a new
bead with 2.8 µm of diameter was adopted and a new calibration curve was made. This time more
factors were considered like the extension when pulled at 10 pN, decondensation rate and absolute
decondensation length. In this experiment, 59 tethers were analysed in which 29 showed condensation
38

Figure 38: Representation of the force exerted on the tethers correlated with number of ATP required in
each force. The ATP molecules increases in function of the force.
and were single tethers.
Figure 39: Example of a trace that represents series of condensation at 0.75 pN and decondensation at
10 pN events. The initial extension could be successfully recovered in every stage and the condensation
still occurred after decondensation events.
The values obtained can be analysed in the appendix table 9. The parameters were examined ei-
ther in a global behaviour or by considering in which stage the condensation was taken place. Several
39

correlations were performed by looking at the mentioned parameters (extensions, condensation and de-
condensation rates and decondensation length) depending of the condensation fraction reached in a
previous stage and also relate it with the stage. Table 7 in the appendix compares the condensation in
the referred round with the consecutive one and tells whether the condensation rate decreased in per-
centage. To analyse tethers in similar situations, 2 groups were defined depending if the condensation
had started in the first round or in the second. The other cases are not included due to insufficient data.
The condensin I complex was still able to condense after high force application by 4 times. A similar
experiment was performed by Strick et al[41] just applying high force once, which condensation was
followed and the total DNA strand decondensation was also obtained. In the first group, the most rep-
resented data, stage 1 and 2, shows that around 70% of the beads decreased the condensation rate.
The number of beads decline because condensation did not occur later. In the second group, the stage
succeeding the not condensed first stage had lower activity than the stage 3, what looks like an increas-
ing of rate in opposition to the group 1. The first situation could lead an explaination based on loss of
condensin activity. However the second group did not express activity at first stage and then raise the
condensation rate until third stage, thus the first argument is not appropriate for both situations. The
superposition of those groups to represent a global variation of condensation rate in each stage made
it difficult to understand if the condensation ability was being lost (figure 40). This suggests that con-
densin should acquire a certain configuration to start condensation which in the first group was being
lost at the consecutive stages and in the second group was sequentially being gained. This indicates
that the 10 pN force could partially or totally destroy the condensin arrangement to restructure it again in
the consecutive condensation. The decondensation rates variation between those groups have similar
values in comparison to condensation rates (table 8 in appendix) suggesting a direct relation between
condensation and decondensation rate.
Figure 40: The condensation rate average and
standard deviation in each round have simillar val-
ues.
Figure 41: The initial extension at 0.75 pN (red)
and at 10 pN (blue) relative to the initial DNA ex-
tension is averaged in each round and added the
standard deviation. The values obtained at differ-
ent rounds and force do not show a significant dif-
ference.
40

The other parameters do not show a pattern, having a standard deviation considerably high to dis-
tinguish any correlation or have similar results. Figure 41 shows the relative extension changes in
comparison to the original extension in stage 1 where the force applied was enough to recover the initial
extension. The same conclusion could be taken for the extension at 10 pN from the same figure.
In figure 42, the condensation rate of the subsequent stage is represented in function of the con-
densated fraction, where no correlation is detected. Higher condensation fraction than 0.6 of the initial
extension were neglected since the surface might interact with the DNA and inflate the results. The
condensation degree does not affect the condensin activity and also does not prevent the full recovery
of the DNA extension. In fact, the initial extension can be completely regenerated, independently from
the advance stage of the condensation (figure 43).
Figure 42: Representation of the condensation
rate mean and standard deviation in function of
the condensated fraction in previous round have
simillar values.
Figure 43: The initial extension at 0.75 pN (red)
and at 10 pN (blue) relative to the initial DNA ex-
tension is averaged in each condensated fraction
and added the standard deviation. The conden-
sated fraction is from the previous round anal-
ysed. The values obtained at different rounds and
force do not show a significant difference.
Model formulation
The aim of this project is the clarification of the condensin mechanism that can now be tackled. The
models were presented in the introduction and are based in certain assumptions that might not cor-
respond to the behaviour analysed in the presented results. However, while some models are being
considered invalid because they do not resemble certain events, there is no reason to only assume one
model and this preposition should be kept in mind. In a previous study [33] condensin was referred to
promote axial and lateral condensation, so not only the variation of the DNA extension observed in the
traces should be solely considered.
41

The initial extension is increased by stronger force fields which translates into the decrease of DNA
chain freedom degree. The DNA flexibility allows the chain to acquire curved conformations in solution.
Then the force increment turns the DNA strand more rigid and extended along the same axis of the
magnetic force. This behaviour could affect the condensin activity in two different ways:
• The DNA rigidity disrupt the bending or loop extrusion due to the high energy barrier. Probably
each compaction point takes more time and ATP to effectively happen or a new condensin ar-
rangement is needed to face the force exerted. Therefore, an experiment with more condensin
and ATP could provide more energy to bend DNA and then clarify the starting mechanism. This
would support the coiling and loop extrusion mechanisms.
• In case of a mechanism that needs to encircle DNA protuberances, the force increasing leaves
less opportunities to trigger condensation. The limit of condensation is at 1.75 pN when reached
the highest extension is coincident with the DNA contour length of 6.5 µm. This evidence supports
the models about cluster formation in a loop and condensin embrace around DNA loops.
The double tethers might support the second option since the presence of another DNA strand
increases considerably the rate. In most of the cases, both DNA strands were entangled, so in a certain
point they were close enough for condensin to interact with both strands at the same time. This means
that more protuberances, more opportunities for condensin to cause condensation.
For the DNA decondensation, a higher force (10 pN) was needed than the limiting one (1.75 pN) to
reverse condensation. Once the condensins with ATP have bent the DNA, stable condensation modules
are generated. The comparison between the force applied (0.75 pN) during condensation and the one
for decondensation (10 pN), means that the energy spent to decondense DNA is 10 times higher. The
mechanism to condense DNA must handle more ATP molecules than calculated by force application and
the condensin interaction with DNA is considerably strong. This supports the hypothesis that condensin
also promotes lateral condensation that is not observable in this experiment.
The irrelevance of previous events before decondensation suggest that an independent condensation
cycle starts everytime the original extension is achieved. The conceived structure that maintained DNA
compaction must have been completely destroyed by spreading the condensin far apart or deleting
from the DNA. The strength of the condensin-condensin and condensin-DNA interactions under ATP
are not yet measured to understand in which way condensin was dismantled. However, to test if the
condensin was disconnected from the DNA strand (figure 44), the flowcell is washed like in the sequential
experiment while the force of 10 pN is still applied. If afterwards the DNA still condenses means that the
condensin was not removed but the absence of condensation tells the opposite.
The topology change by the supercoils generation showed no difference in rate and condensed
fraction. The supercoils generated by DNA rotation can cancel other supercoils with opposite sign.
[19, 7] However, considering that a condensin coils in a certain direction and opposite supercoils are
present in the DNA strand, they cannot be merged without first untwist one of them. Even that the DNA
supercoils have mobility along the strand, [53] it is not likely that condensin besides coiling the DNA
42

Figure 44: Cartoon that represents the disruption of condensin attached to the DNA strand by application
of high forces. This is a debated model in comparison to the permanent condensin attachment with DNA.
can make the supercoil move too and merge. This would leave 1 µm of the DNA extension with an
opposite supercoils domain that prevents a full and fast condensation. This eliminates the supercoiled
and chiral looping models for condensation. Moreover, if the condensin would have the ability to untwist
the opposite supercoils to proceed with condensation, a reversion of the DNA extension should have
been observed. Nevertheless, the in vivo condensin activity is dependent of topoisomerases what makes
the function of DNA strand relaxation obsolete for condensin.
Looking at the NaCl concentration experiments, the reason for the absence of condensation at 0
mM of NaCl can be attributed to the instability of the charged groups present in condensin and DNA
as explained in the results. Condensin has the groups exposed to the solution like in most of protein
structures and the ions are important to maintain the 3D structure, essential for the allosteric changes
during enzymatic reactions.[30] The DNA secondary structure also suffer some modifications [32, 33]
however, topological changes were proven to not affect the condensin activity. By increasing the NaCl
concentration, several interactions are being affected by ions competition and the electrical double layer
around ions. Firstly, the metallic chelation affinity between Mg2+ and ATP declines even that Mg2+ (106
M−1) still has much stronger affinity than Na+ (10 M−1).[52] The absence of condensation cannot be
explained by the MgATP2− chelate affinity alone. Secondly, the physical effect of creating a surrounding
layer with counter ions promotes the repulsion from other molecule’s charged groups, increasing the
colloidal stability (figure 45). The relation between layer length with ion concentrations can be evaluated
by the Debye screening length (k−1):
k−1 =
(εrε0kBT
2NAe2I
) 12
(26)
where NA is the Avogadro number (6.022×10²³ mol−1), e is the elementary charge constant (1.602×10⁻¹⁹C),
εr the relative permittivity (5.9) and ε0 the permittivity in vacuum ( 8.854 F.m−1), kB the Boltzmann con-
stant, T the absolute temperature and I the ionic force that is calculated by I = 12
∑ni=1 cizi
2, being ci
the ion concentration and zi the ionic charge.
The interaction between DNA and condensin becomes more energetically demanding, which is sup-
ported by the lag time increase. Besides that, other type of interactions might have been destabilising:
43

Figure 45: Schematic representation of the electrical double layer around DNA when in a solution with
NaCl. The water molecules were not included for simplification.
• The repulsive interaction between different condensins could have stopped the clusters formation.
• The Debye length between distant DNA, that approached together for coiling or looping, might
become long enough to block being encircled by condensin.
The sequential data proved that the bound condensins complexes are enough to start and complete
the condensation without the unbound condensin interactions. The lower rate is due to the loss of some
bound condensin as stated by Strick et al.[41] In his experiment, the buffer volume was increased which
caused the condensation rate to decrease or even disappear proving that bound condensin was being
removed. Therefore, the unbound condensin relevance to the ongoing condensation is insignificant.
Actually, really few condensin concentration (3nM) can process the condensation. However, the
concentration raising improves the rate and decreases the lag time. Despite of this multi-condensin
improvement of condensation parameters, it is likely that more than one condensin triggers the whole
DNA condensation and ATP usage might resemble the interactions among condensin complexes.
Higher condensin concentration increases the condensin presence in the DNA strand and conse-
quently the rate raises until 18 nM. Afterwards the rate saturates and long breaks are observed at the
final stages of the condensation suggesting difficulty to proceed with the extension shortening. One
reason could be the ATP depletion but another attractive hypothesis is the interference of condensins
activities. In the chiral looping and supercoiling models, saturation may happen when different con-
densins meet after the DNA strand in between is completely coiled. In order to merge the coils together,
the condensin involved might have to unbind the coiled site. However, the decondensation experiments
proved that a stable and strong interaction are in the basis of the process so the condensin transitions
must be carefully controlled to not destabilize the coiled strand.
The computational simulations for the loop extrusion model made by Goloborodko et al [26] showed
that different loops can merge in a larger loop or create a smaller one inside of the main loop. The same
study refers that the condensin interaction is transient which contradicts the stable compaction observed
44

in force experiments. The condensation needs a reliable condensin binding in the site and condensin
might cooperate with more condensin for cluster formation to rearrange the condensed structure. In
the looping model, the condensin inside of the loop is not clear if they are supporting the DNA exten-
sion reduction rather than stabilizing the loops. In this model the rate should gradually decrease while
approaching the end since less condensin is actuating in the axial shortening.
The model that combines different condensin complexes in a cluster to maintain a stable loop fits
the results. The condensin cluster could have a function of promoting the axial or the lateral shortening
since the beginning of the condensation, according to the position encountered in the loop. In this
way the rate would be kept constant along condensation. Another aspect is the method of condensin
movement: hoping or slide along the DNA strand. The ATP function in the condensin might elucidate the
type of connection is used for. The suggested hypothesis of the heads disengagement from DNA could
attribute a hopping behaviour to the condensin. When no ATP is attached to the head groups so that the
condensin is weakly bound, the condensin could slide along DNA. In fact, condensin without ATP, in the
sequential experiment and Strick et al results, was being removed from the strand while washing buffer
but in presence of ATP, forces like 10 pN were needed to unbind condensin.
Conclusion
Throughout this project some previous unresolved questions about condensin I complex had the op-
portunity to be answered and new tips for the construction of the condensin activity model were also
provided. The primary conclusions from this work are:
• Force application can disrupt and block condensin activity
• ATP and condensin concentrations regulate the condensation rate until a certain extent when the
condensation activity is saturated.
• Condensation is independent from different DNA topological conformations
• Condensin has a limited range of NaCl concentrations between 0.5 to 2.5 mM to operate
• Condensin binds to DNA without the presence of ATP but condensation is ATP dependent
• The DNA strand undergoes multiple condensation after being decondensed by strong forces.
The information that this project offers about condensation process can be summarized in 3 mo-
ments: binding, condensation and maintenance. The condensin starts the condensation when ATP is
present together with Mg2+ and the condensation is limited to a certain range of NaCl concentration.
ATP fuels the condensation activity and together with condensin concentration can regulate the conden-
sation rate. The supercoil degree is irrelevant for the bending activity of condensin. The DNA rigidity
due to force exertion might block condensation. On the other hand, the strand flexibility is essential to
allow distant sites to be connected. Lastly, condensation can create a stable DNA entanglement that
45

can endure high forces. Nevertheless, the condensation can be reversed before being fully compacted
and a new round of condensation starts by multiple times with different rate.
The model that better resembles the results obtained is the cluster formation of condensin complexes.
The coiled and supercoiled model achieve a saturation point in the axial shortening and do not explain
the lateral rearrangement that was referred in other studies. The loop extrusion model does not explain
the strong stability of condensin with ATP in DNA. Moreover, the constant condensation rate should
be decreased since some of the condensin is lost while encountering with other condensin in DNA or
included in a bigger loop not, actuating in the axial shortening. The cluster model is not clear yet about
the condensin connections and what kind of conformation will be derived from ATP usage.
By fulfilling the goal’s challenges of this project, new questions had aroused and more research is
still required to get a complete understanding about condensin I complex activity and relevance for the
cell. Some questions are: how do condensins first interact with DNA? What is the specific role of the
hinge and head groups as well the non-SMC groups? How do condensins interact with each other
to organize the DNA strand in packed novel? Many other questions could be asked which brings the
following section to give an outlook for future work to help us clarify the undetermined condensin activity.
Outlook
Some more complete information could be extracted by implementing extra experiments:
• Repeat 2.5 mM ATP and decondensation measurements to get more data.
• Add higher condensin concentration in the 1.75 pN force measurement to understand if the limit
was set by the ability of condensin to bend DNA or if the condensin cooperation can overcome the
force.
• Flush condensin I complex with 250 mM NaCl and without ATP to incubate for 20 min. Then wash
unbound condensin out with a standard NaCl concentration and with ATP to understand if the
activity depletion in high salinity was due to ATP or condensin blockage or DNA bending.
• Flush condensin with and without ATP at 1.75 pN. Then wash unbound condensin out. Add ATP
and decrease force to 0.75 pN. It is expected to know if the high force despromoted binding be-
cause condensin could not embrace the DNA and if the ATP presence enhances/inhibit the stable
binding before being flushed out.
• While applying the disruptive force of 10 pN, wash out the flowcell with new buffer to test if the
condensin was disconnected from the DNA strand. If afterwards the DNA still condenses means
that the condensin was not removed but the absence of condensation tells the opposite.
• Flush condensin I complex mutants to understand the source of the condensation activity or bind-
ing by applying the sequential experiment. Kinoshita et al[33] refered the importance of the non-
Smc for a stable binding. The lack of one of the non-Smc proteins promoted abnormal DNA
compaction structure.
46

The right key that could release the information so much wanted is the inclusion of fluorescence
microscopy methods in the experiments. For example, by coupling fluorescence microscopy together
with MT two types of data is obtained simultaneously: the movements of the tracked molecule and
the DNA extension, which provides the condensation rate. The choice of which dye is hybridized with
condensin and the method of imaging would dependent of the measurement’s goal. Therefore, some
set of experiments are going to be described according to the information to be gathered and also based
on the state-of-the-art that describes the hurdles to allow an extensive application of this technique.
Some technical details about imaging should be accounted like a resolution around 50 nm (length
of the condensin arm) is required for this research. The accuracy and an appropriate image processing
would benefit the data correction, specially due to the limitation of certain fluorescence microscopes to
track at such small scale. Another aspect is the light diffraction due to the bead that shadows the DNA
strand bellow. A new configuration that would avoid the light obstacle is conceived by pulling the bead
horizontally and record the DNA and the bead simultaneously (figure 46).
Figure 46: Schematic representation of new configurations to record condensation with MT and fluores-
cence microscopy. The tether is in the horizontal direction since the magnet was moved to the tweezers
plate plane.
Experiment 1 – Condensin I performance in DNA
Several questions about the condensin mechanism have being pointed out, thus some are going to
be addressed in this experimental method. If it is possible to track each condensin complex and under-
stand whether it interacts with other condensins to form clusters? If they are formed in which occasions
and roles does condensin play in the DNA condensation? To trigger condensation, does condensin
become static in the DNA strand or keep moving along the strand? To answer those questions, the first
step should start by coupling efficiently condensin with a dye. The research pursued by Kim et al[9] man-
47

aged to engineer a prokaryotic condensin with Cy3, which is a fluorophore. After leaving Cy3 to react
with condensin, the unlabelled condensin is removed by size-exclusion chromatography and unlabelled
dyes are quantified at the end. However, the remaining condensin might have reacted with more than
one dye. To quantify the amount of excess dye, the initial concentration is subtracted by the unreacted
Cy3 concentration and condensin-Cy3 pairs that emit fluorescence. Although more than one Cy3, that
are attached in the same condensin in distant places, might emit a distinct signal from each other, giving
the information that those signals belong to different condensins. This raises uncertainties about the re-
sults because condensation events would be lost from imaging or the information given is not complete
or correct. Therefore, a specific site for fluorophore binding needs to be carefully engineered to avoid
multiple labelling.
An alternative way was designed by Soh et al[28] throughout the application of the quenching pair,
Cy3 and Cy5, increasing the dye:condensin molar ratio. Quenching is observed by the decrease of fluo-
rescence activity or by changing the emission wavelength (FRET) due to the transference of energy from
a donor to a receptor that provokes relaxation of the energy level in the donor and new emission from the
receptor. This is an interesting effect that in condensin could be used to elucidate about different groups
interactions along condensation. After chromatography 3 types of molecules are obtained: Cy3-SMC
(acceptor), Cy5-SMC (donor) and Cy3-SMS-Cy5 (FRET pair). By irradiation of specific wavelengths
of light, Cy3 (550 nm) and Cy5 (650 nm) are excited and have specific emission peak wavelengths. A
FRET pair has a special feature, if the donor dye (Cy3) is close enough to the acceptor dye (Cy5), the ra-
diation energy is transmitted to the acceptor dye so that the emission peak corresponds to the acceptor
wavelength instead showing the Cy3 typical emission peak. This allows to distinguish a FRET pair from
an isolated Cy3 dye. The transitions between FRET pair and Cy3 emission peaks give information about
the proximity with other condensin in case the SMC has a single dye or about the arms movement when
multiple dyes are attached in the same SMC. Nevertheless, the same struggles as previously mentioned
are present in this method which affect the reliability of the data.
Experiment 2 – DNA bending
The simple analysis of DNA along condensation can already provide some information about the
condensation process like number of condensation spots and distance.[53] Integrating a quenching pair
in the DNA strand such as Cy3 and Cy5 [54] would detect when distant parts of DNA meet and the
mechanism itself used to approach them. As an example, taking the hypothesis that DNA is bent by
crossing two distant sites, the new emission stays permanently on. In the case that condensin pulls
the DNA like a loop, the emission intensity should first increase and then gradually disappear. Those
examples prove how valuable those results would be to create a defined model for condensin. Moreover,
for DNA labelling there are a wide range of dyes to choose from, depending of the emission intensity,
size, stability in certain solutions or to distinguish from other signals like labelled condensin.[34]
AFM was once used to study the mechanical properties of condensin in physiological solutions with
interesting results.[29] The condensation process using AFM would be an upgrade for a better track-
48

ing of condensin activity since different DNA shapes in nanometrical scale are distinguishable and the
molecular interactions can also be detected. The main concern of this technique is the presence of
artefacts from buffers that block the ability to characterize the ongoing events and a non-reactive surface
that interferes with the process.
49

Bibliography
[1] Keir C. Neuman and Attila Nagy. Single-molecule force spectroscopy: optical tweezers, magnetic
tweezers and atomic force microscopy. Nature Method, 5(6):491–505, 2008.
[2] Brandon L Blakely, Christoph E Dumelin, Britta Trappmann, Lynn M McGregor, Colin K Choi, Pe-
ter C Anthony, Van K Duesterberg, Brendon M Baker, Steven M Block, David R Liu, and Christo-
pher S Chen. A DNA-based molecular probe for optically reporting cellular traction forces. Nature
methods, 11(12):1229–1232, 2014.
[3] C. Bouchiat, M. D. Wang, J.-F. Allemand, T. Strick, S. M. Block, and V. Croquette. Estimating
the Persistence Length of a Worm–Like Chain Molecule from Force–Extension Measurements.
Biophysical Journal, 76:409–413, 1999.
[4] Tatsuya Hirano. Condensin-Based Chromosome Organization from Bacteria to Vertebrates. Cell,
164(5):847–857, 2016.
[5] I. D. Vilfan, J. Lipfert, D. A. Koster, S. G. Lemay, and Nynke H Dekker. Magnetic Tweezers for Single-
Molecule Experiments. In Handbook of Single-Molecule Biophysics, pages 371–395. Springer
Science+Business Media, 2009.
[6] Jan Lipfert, Xiaomin Hao, and Nynke H Dekker. Quantitative modeling and optimization of magnetic
tweezers. Biophysical journal, 96(12):5040–5049, 2009.
[7] G Charvin, J-F F Allemand, T R Strick, D Bensimon, V Croquette, Charvin G, J-F F Allemand,
Strick Tr, Bensimon D, and Croquette V. Twisting DNA: single molecule studies. Contemporary
Physics, 45(5):383–403, 2004.
[8] Iwijn De Vlaminck, Thomas Henighan, Marijn T J van Loenhout, Daniel R Burnham, and Cees
Dekker. Magnetic forces and DNA mechanics in multiplexed magnetic tweezers. PloS one,
7(8):e41432, 2012.
[9] Hyeong Jun Kim and Joseph J. Loparo. Multistep assembly of DNA condensation clusters by SMC.
Nature Communications, 7:2–12, 2016.
[10] S M Lindsay, L a Nagahara, T Thundat, U Knipping, R L Rill, B Drake, C B Prater, a L Weisenhorn,
S a Gould, and P K Hansma. STM and AFM images of nucleosome DNA under water. Journal of
biomolecular structure & dynamics, 7(2):279–287, 1989.
50
[11] Yuri Lyubchenko, Lyuda Shlyakhtenko, Rodney Harrington, and Patrick Odent. Atomic force mi-
croscopy of long DNA: Imaging in air and under water. Biophysical Journal, 90:2137–2140, 1993.
[12] L H Pope, M C Davies, C J Roberts, S J B Tendler, and P M Williams. Atomic force microscopy of
long DNA: Imaging in air and under water. Biophysical Journal, 199:68–78, 2000.
[13] Y L Lyubchenko, a a Gall, L S Shlyakhtenko, R E Harrington, B L Jacobs, P I Oden, and S M Lind-
say. Atomic force microscopy imaging of double stranded DNA and RNA. Journal of biomolecular
structure & dynamics, 10(3):589–606, 1992.
[14] David G Grier. A revolution in optical manipulation. Nature, 424:810–816, 2003.
[15] Furqan M Fazal and Steven M Block. Optical tweezers study life under tension. Nature Photonics,
5:318–321, 2014.
[16] J. Leger, G Romano, A Sarkar, J Robert, L Bourdieu, D Chatenay, and J. Marko. Structural Transi-
tions of a Twisted and Stretched DNA Molecule. Physical Review Letters, 83(5):1066–1069, 1999.
[17] Lizabeth A Allison. Fundamental Molecular Biology. Blackwell, 2007.
[18] Carlos Bustamante, Steven B Smith, Jan Liphardt, and Doug Smith. Single-molecule studies of
DNA mechanics. Nucleic Acids, (10):279–285, 2000.
[19] Aartjan J W Te Velthuis, Jacob W J Kerssemakers, Jan Lipfert, and Nynke H. Dekker. Quantitative
guidelines for force calibration through spectral analysis of magnetic tweezers data. Biophysical
Journal, 99(4):1292–1302, 2010.
[20] Michael Rubinstein and Ralph H Colby. Polymer Physics. Oxford University Press, 2003.
[21] Nick Gilbert and James Allan. Supercoiling in DNA and chromatin. Current opinion in genetics &
development, 25:15–21, 2014.
[22] Vlijm Rifka, V. D Torre Jaco, and Dekker Cees. Counterintuitive DNA sequence dependence in
supercoiling-induced DNA melting. PLoS ONE, 10(10):1–14, 2015.
[23] T R Strick, J F Allemand, D Bensimon, and V Croquette. Behavior of supercoiled DNA. Biophysical
journal, 74(4):2016–2028, 1998.
[24] Lene B Oddershede. Force probing of individual molecules inside the living cell is now a reality.
Nature Chemical Biology, 8(11):879–886, 2012.
[25] Rifka Vlijm, Jeremy S J Smitshuijzen, Alexandra Lusser, and Cees Dekker. NAP1-Assisted Nucle-
osome Assembly on DNA Measured in Real Time by Single-Molecule Magnetic Tweezers. PLoS
ONE, 7(9):1–11, 2012.
[26] Anton Goloborodko, Maxim V Imakaev, John F Marko, and Leonid Mirny. Compaction and segre-
gation of sister chromatids via active loop extrusion. eLife, 5(14864), 2016.
51

[27] Frank Burmann, Ho-Chul Shin, Jerome Basquin, Young-Min Soh, Victor Gimenez-Oya, Yeon-Gil
Kim, Byung-Ha Oh, and Stephan Gruber. An asymmetric SMC-kleisin bridge in prokaryotic con-
densin. Nature structural & molecular biology, 20(3):371–379, 2013.
[28] Young Min Soh, Frank Burmann, Ho Chul Shin, Takashi Oda, Kyeong Sik Jin, Christopher P. Tose-
land, Cheolhee Kim, Hansol Lee, Soo Jin Kim, Min Seok Kong, Marie Laure Durand-Diebold,
Yeon Gil Kim, Ho Min Kim, Nam Ki Lee, Mamoru Sato, Byung Ha Oh, and Stephan Gruber. Molec-
ular basis for SMC rod formation and its dissolution upon DNA binding. Molecular Cell, 57(2):290–
303, 2015.
[29] Jorine M. Eeftens, Allard J. Katan, Marc Kschonsak, Markus Hassler, Liza de Wilde, Essam M.
Dief, Christian H. Haering, and Cees Dekker. Condensin Smc2-Smc4 Dimers Are Flexible and
Dynamic. Cell Reports, 14(8):1813–1818, 2016.
[30] Kim Nasmyth and Christian H. Haering. the Structure and Function of Smc and Kleisin Complexes.
Annual Review of Biochemistry, 74(1):595–648, 2005.
[31] Marc Kschonsak and Christian H Haering. Shaping mitotic chromosomes: From classical concepts
to molecular mechanisms. BioEssays, 37(7):755–766, 2015.
[32] Ilaria Piazza, Anna Rutkowska, Alessandro Ori, Marta Walczak, Jutta Metz, Vicent Pelechano,
Martin Beck, and Christian H Haering. Association of condensin with chromosomes depends on
DNA binding by its HEAT-repeat subunits. Nature structural & molecular biology, 21(6):560–568,
2014.
[33] Kazuhisa Kinoshita, Tetsuya J. Kobayashi, and Tatsuya Hirano. Balancing acts of two HEAT
subunits of condensin I support dynamic assembly of chromosome axes. Developmental Cell,
33(1):94–107, 2015.
[34] LuiseA K. KleineBorgmann, Jonas Ries, Helge Ewers, Maximilian H. Ulbrich, and Peter L. Grau-
mann. The Bacterial SMC Complex Displays Two Distinct Modes of Interaction with the Chromo-
some. Cell Reports, 3(5):1483–1492, 2013.
[35] Carolyn M George, Julianna Bozler, Huy Q Nguyen, and Giovanni Bosco. Condensins are Required
for Maintenance of Nuclear Architecture. Cells, 3:865–882, 2014.
[36] Yuri Frosi and Christian H. Haering. Control of chromosome interactions by condensin complexes.
Current Opinion in Cell Biology, 34:94–100, 2015.
[37] Luis Aragon, Enrique Martinez-Perez, and Matthias Merkenschlager. Condensin, cohesin and the
control of chromatin states. Current Opinion in Genetics & Development, 23(2):204–211, apr 2013.
[38] Kenji Tada, Hiroaki Susumu, Takeshi Sakuno, and Yoshinori Watanabe. Condensin association with
histone H2A shapes mitotic chromosomes. Nature, 474(7352):477–483, 2011.
52
[39] Joanne Leonard, Nicholas Sen, Raul Torres, Takashi Sutani, Adam Jarmuz, Katsuhiko Shirahige,
and Luis Aragon. Condensin Relocalization from Centromeres to Chromosome Arms Promotes
Top2 Recruitment during Anaphase. Cell Reports, 13(11):2336–2344, 2015.
[40] Jesse J Lipp, Toru Hirota, Ina Poser, and Jan-Michael Peters. Aurora B controls the association of
condensin I but not condensin II with mitotic chromosomes. Journal of cell science, 120:1245–1255,
2007.
[41] Terence R. Strick, Tatsuhiko Kawaguchi, and Tatsuya Hirano. Real-Time Detection of Single-
Molecule DNA Compaction by Condensin I. Current Biology, 14:874–880, 2004.
[42] Tatsuya Hirano. Condensins: Universal organizers of chromosomes with diverse functions. Genes
and Development, 26(15):1659–1678, 2012.
[43] Tatsuya Hirano, Ryuji Kobayashi, and Michiko Hirano. Condensins, Chromosome Condensation
Protein Complexes Containing XCAP-C, XCAP-E and a Xenopus Homolog of the Drosophila Bar-
ren Protein. Cell, 89:511–521, 1998.
[44] Marzena de Odrowaz Piramowicz, Pawel Czuba, Marta Targosz, Kvetoslava Burda, and Marek
Szymonski. Dynamic force measurements of avidin–biotin and streptavdin–biotin interactions using
AFM. BMC Biophysics, 53(1):93–100, 2006.
[45] Jorine M. Eeftens, Jaco van der Torre, Daniel R. Burnham, and Cees Dekker. Copper-free click
chemistry for attachment of biomolecules in magnetic tweezers. BMC Biophysics, 8(9):2362–2371,
2015.
[46] R. M. Cornell and U. Schwertmann. The Iron Oxides. Wiley-VCH GmbH, 2000.
[47] Iwijn De Vlaminck and Cees Dekker. Recent advances in magnetic tweezers. Annual review of
biophysics, 41:453–472, 2012.
[48] Jan Lipfert, Matthew Wiggin, Jacob W J Kerssemakers, Francesco Pedaci, and Nynke H Dekker.
Freely orbiting magnetic tweezers to directly monitor changes in the twist of nucleic acids. Nature
communications, 2(439):1–10, 2011.
[49] Wesley P. Wong and Ken Halvorsen. Beyond the frame rate: Measuring high-frequency fluctuations
with light intensity modulation. Optics Letters, 34(3):277–279, 2013.
[50] Wesley P Wong and Ken Halvorsen. The effect of integration time on fluctuation measurements:
calibrating an optical trap in the presence of motion blur. Optics express, 14(25):12517–12531,
2006.
[51] Marijn T J Van Loenhout, Jacob W J Kerssemakers, Iwijn De Vlaminck, and Cees Dekker. Non-
bias-limited tracking of spherical particles, enabling nanometer resolution at low magnification. Bio-
physical Journal, 102(10):2362–2371, 2012.
53

[52] John E. Wilson and Arnold Chin. Chelation of Divalent Cations by ATP, Studied by Titration
Calorimetry. Analytical Biochemistry, 193:16–19, 1991.
[53] M T J van Loenhout, M V de Grunt, and C Dekker. Dynamics of DNA supercoils. Science,
338(6103):94–97, 2012.
[54] Wonbae Lee, Peter H. von Hippel, and Andrew H. Marcus. Internally labeled Cy3/Cy5 DNA con-
structs show greatly enhanced photo-stability in single-molecule FRET experiments. Nucleic Acids
Research, 42(9):5967–5977, 2014.
54

Appendix
Table 1: Lag time, condensation fraction and rate mean and standard deviations are presented in each
ATP concentration with the total number of tethers analysed per concentration.
ATP (mM) 0 0.25 0.5 0.75 1 1.25 1.5 2 2.5
Lag Time
(s)
- 504 ±
316
417 ±
448
265 ±
344
31 ± 29 58 ± 62 79 ± 43 23 ± 11 72 ±
48
Fraction 0 0.37 ±
0.4
0.92 ±
0.15
0.93 ±
0.1
0.89 ±
0.08
0.95 ±
0.12
0.95 ±
0.09
0.99 ±
0.02
0.98 ±
0.05
Rate
(bp/s)
0 16 ±
15
45 ±
30
87 ±
44
129 ±
38
176 ±
106
274 ±
142
323 ±
145
173 ±
109
# Tethers 15 12 19 12 22 22 15 13 9
Table 2: Average and standard deviation of the parameters of the sequential experiment.
Sequential
Lag Time (s) 790 ± 797
Fraction 0.99 ± 0.03
Rate (bp/s) 55 ± 28
# Tethers 15
55

Table 3: Average and standard deviation of the parameters at the condensin concentration experiment.
Condensin
(nM)
0 3 6 9 12 18 24 36
Lag Time (s) - 1197 ±
730
600 ±
597
478 ±
339
31 ± 29 181 ±
109
77 ± 70 39 ± 34
Fraction 0 0.32 ±
0.48
0.84 ±
0.18
0.74 ±
0.28
0.89 ±
0.08
0.97 ±
0.07
0.95 ±
0.12
0.95 ±
0.06
Rate (bp/s) 0 8 ± 16 35 ± 32 65 ± 31 129 ±
38
167 ±
81
189 ±
66
160 ±
50
# Tethers 10 9 12 17 22 16 11 10
Table 4: Average and standard deviation of the parameters at different topological structures of DNA.
Topology -45 turns +45 turns single double
Lag Time (s) 38 ± 21 197 ± 175 93 ± 74 24 ± 20
Fraction 0.92 ± 0.15 0.87 ± 0.13 0.94 ± 0.12 0.99 ± 0.01
Rate (bp/s) 98 ± 30 91 ± 24 100 ± 31 365 ± 186
# Tethers 6 6 7 10
Table 5: Average and standard deviation of the parameters at different NaCl concentrations.
NaCl (mM) 0 50 100 125 150 200 250 400
Lag Time
(s)
- 27 ± 27 110 ±
67
93 ± 74 678 ±
429
626 ±
678
- -
Fraction 0 0.94 ±
0.07
0.94 ±
0.07
0.94 ±
0.12
0.92 ±
0.09
0.94 ±
0.10
0 0
Rate (bp/s) 0 73 ± 32 78 ± 22 100 ±
31
70 ± 19 58 ± 34 0 0
# Tethers 7 12 10 7 8 12 11 10
Table 6: Lag time, condensation fraction and rate mean and standard deviations are presented in each
force applied with the total number of tethers analysed per force
.
Force (pN) 0.3 0.4 0.5 0.75 1 1.25 1.5 1.75
Lag Time (s) 15 ± 13 9 ± 5 23 ± 14 31 ± 29 27 ± 12 75 ± 45 108 ± 92 -
Fraction 0.95 ±
0.04
0.95 ±
0.07
0.92 ±
0.05
0.89 ±
0.08
0.87 ±
0.1
0.78 ±
0.14
0.62 ±
0.18
0
Rate (bp/s) 412 ±
130
362 ±
149
242 ±
112
129 ±
38
69 ± 41 33 ± 16 15 ± 9 0
# Tethers 20 11 28 22 15 17 24 15
56

Table 7: Comparison of consecutive condensation rates whether the following round decreases in rate
and taking into consideration the two different groups.
Stage 1 # Tethers Stage 2 # Tethers Stage 3 # Tethers Stage 4 # Tethers
69 % 13 67 % 6 25 % 4 33 % 3
- - 0 % 7 71 % 2 0 % 1
Table 8: Comparison of consecutive decondensation rates whether the following round decreases in
rate and taking into consideration the two different groups.
Stage 1 # Tethers Stage 2 # Tethers Stage 3 # Tethers
69 % 13 67 % 9 57 % 7
- - 0 % 4 75 % 2
57

Table9:
Param
etersanalysed
perbeadatdifferentm
easurements
fordecondensationexperim
ents.
NrM
eas.E
xt.at10pN
Lagtime
Ext.
at0.75pNFraction
Cond.
Rate
Ext.
at10pNA
bs.D
econd.D
econd.R
ateLagtim
eE
xt.at0.75pN
Fraction
17
3735.6
0.4759
5.561.91
76.34-
4.350
17
3305.8
0.4125
72.6
151.60-
5.60.05
17
-5.8
00
7.40
0.0066
5.80.45
2-
1575.45
0.552
6.82.9
115.2643
5.30.47
2-
315.74
0.4627
--
-0
5.450.31
2-
744.9
0.3319
6.61.9
179.92167
4.850.68
3-
1605.2
0.5447
--
-11
4.20.58
3-
-6
00
--
-96
60.48
3-
-5.7
00
--
-13
5.70.26
36.6
-5.1
00
6.40
0.00497
5.30.42
3-
-6
00
--
-5
5.950.39
37
1145.3
0.6263
6.263.36
52.62-
4.250.13
3-
-6
00
--
-236
60.22
4-
1526
0.4826
--
-0
60.47
4-
-5.3
0.040
--
--
5.20
5-
785.4
0.4342
--
-101
5.350.28
56.8
2255.65
0.2721
6.70.9
191.90102
5.650.45
56.85
-5.25
0.10
6.850.35
85.16200
5.20.17
57
105.55
0.3711
6.951.75
62.950
5.50.23
56.95
1265.75
0.6741
5.762.06
90.54-
4.850
57.1
-5.65
00
7.10
0.00120
5.60.45
57.2
2765.65
0.63129
7.12.7
149.130
5.40.8
57.3
1375.35
0.5978
6.80.5
81.70-
5.10
56.72
3115.6
0.4678
6.50.7
215.386
5.450.2
57
-5.3
0.090
6.50
0.00349
5.10.47
56.77
585.3
0.3832
5.441.04
91.04100
4.150.23
68
715.9
0.2810
--
--
60
67.4
2235.6
0.4827
--
-427
5.50.22
7-
4235.4
0.2282
--
-81
5.50.16
58

Con
d.
Rat
eE
xt.
at10
pNA
bs.
Dec
ond.
Dec
ond.
Rat
eLa
gtim
eE
xt.
at0.
75pN
Frac
tion
Con
d.R
ate
Ext
.at
10pN
Abs
.D
econ
d.D
econ
d.R
ate
06.
150.
7544
.35
-4.
960.
040
6.52
0.52
56.9
7
07
0.09
42.0
8-
5.3
00
70
0.00
137
7.4
2.95
216.
950
5.8
0.44
115
7.35
2.75
170.
07
296.
82.
710
3.13
134
5.4
0.49
336.
83
86.5
1
20-
--
05.
40.
211
--
-
985.
93.
2414
8.42
-4.
70.
020
6.2
0.35
24.0
2
20-
--
275
4.2
0.36
24-
--
215.
91.
653
.17
155
4.1
199
--
-
69-
--
225
5.3
0.44
17-
--
687.
12.
0212
1.07
290
5.15
0.36
167.
12.
8592
.28
40-
--
-5.
80.
110
--
-
07.
12.
478
.61
141
4.85
0.26
77.
12.
4595
.85
16-
--
-5.
80.
10
--
-
126
--
-0
60.
3393
--
-
0-
--
-5.
150
0-
--
26-
--
200
5.1
0.17
9-
--
456.
71.
7512
7.41
-5.
50
06.
70
0.00
156.
60.
792
.23
194
5.2
0.16
586.
50.
319
.64
166.
81.
550
.71
-5.
350
06.
90.
410
.08
06.
950.
5563
.31
-5.
60
06.
950
0.00
626.
452.
1267
.77
05.
250.
26
6.5
1.3
222.
22
485.
62.
784
.59
04.
30.
5816
6.1
2.15
55.9
5
07.
31
35.1
2-
5.3
0.13
07.
30.
779
.91
536.
50
0.00
-5.
550
06.
50
0.00
506
0.5
76.9
215
54.
50.
2244
5.5
0.9
50.3
5
275.
951.
3512
6.05
-4.
50.
110
5.27
0.37
78.0
1
0-
--
-5.
850
0-
--
14-
--
-5.
20.
060
--
-
33-
--
-5.
450
0-
--
59

Lagtime
Ext.
at0.75pNFraction
Cond.
Rate
Ext.
at10pNA
bs.D
econd.D
econd.R
ateLagtim
eE
xt.at0.75pN
FractionC
ond.R
ate
485.3
0.2212
6.70.8
95.52-
5.40.02
0
1715.65
0.532
6.72.4
56.410
5.50.5
91
-5.9
0.150
7.450
0.00-
5.950
0
3295.4
0.4417
6.51.54
81.70-
5.250
0
-5.1
0.020
--
-298
50.39
32
-4.9
0.020
--
--
--
-
-4.3
00
--
-20
4.50.31
16
--
--
--
--
--
-
974.9
0.4426
--
--
5.30.08
0
-4.75
00
7.11.2
52.00-
4.90
0
1345.7
0.367
--
-299
5.70.28
18
1364.86
0.1813
7.11.9
121.64291
4.80.375
35
1395.8
0.5567
--
--
3.90
0
--
--
--
--
--
-
05.5
0.4261
--
-19
5.50.35
97
2675.4
0.2623
--
--
5.10
0
-5.4
00
6.70
0.00-
5.50
0
-5
00
6.20
0.00-
5.10
0
405.5
0.1816
6.90.9
47.43-
5.50.07
0
-5.7
00
6.950
0.00-
5.70
0
1475.35
0.6634
4.151.55
177.85-
3.50
0
04.8
0.1722
6.41.06
38.07-
5.10.07
0
-5.3
0.020
7.30.3
17.49-
5.30.02
0
-5.55
00
6.50
0.00-
5.550.01
0
-4.4
0.110
6.30
0.00-
4.40.02
0
04.5
0.187
5.230.58
76.48-
4.80
0
305.95
0.4315
--
-0
4.40.24
7
735.5
0.337
--
--
5.30.08
0
-5.45
00
--
--
5.450
0
60