Embed Size (px)
Citation preview
STUDY TO IMPROVE THE PREDICTED RESPONSE OF FLOOR SYSTEMS DUE TO
WALKING
by
Michael DeLancey Boice
Thesis submitted to the Faculty of the Virginia Polytechnic Institute and State University
in partial fulfillment of the requirements for the degree of
MASTER OF SCIENCE
in
Civil Engineering
APPROVED:
_______________________________ Dr. Thomas M. Murray, Chairman
____________________ _________________________ Dr. Mehdi Setareh Dr. W. Samuel Easterling
February 2003
Blacksburg, Virginia 24061
natural frequency, floor vibrations, accelerations, acceptability
STUDY TO IMPROVE THE PREDICTED RESPONSE OF FLOOR SYSTEMS DUE TO
WALKING
By
Michael DeLancey Boice
Dr. Thomas M. Murray, Chairman
Department of Civil and Environmental Engineering
(ABSTRACT)
The scope of this study is divided into three topics. To begin, more accurate
methods for estimating the fundamental natural frequencies of floors were explored.
Improvements for predicting the behavior of floor systems using several criteria were
also investigated. The final topic compared the AISC and SCI methods for analyzing
vibrations acceptability.
Natural frequency prediction was studied by examining 103 case studies
involving floor systems of various framing occupied or being constructed in the United
States and Europe. Based on the results from these comparisons, it was reasonably
concluded that the predicted bay frequency using Dunkerly’s estimate (fn2) is not the most
accurate method for predicting the system frequency using the AISC Design Guide for all
types of framing analyzed. The predicted beam frequency using AISC methods provided
sound correlations with the measured bay frequencies. On the other hand, with the
exception of floor systems with joist girders and joists, the results showed that the SCI
methods provided more accurate predictions of bay frequency despite a fair amount of
data scatter.
Evaluations based on the AISC Design Guide 11, the SCI criteria Murray
Criterion, and Modified Reiher-Meister scale were compared with subjective field
analyses for each case study in the second part of this study. The AISC Design Guide
criterion is the most consistent method for predicting floor behavior. The SCI criterion is

the next most consistent method for floor acceptability, followed by the Murray Criterion
then the Modified Reiher-Meister scale.
In the final part of this study, predicted accelerations and floor behavior
tolerability for 78 case studies were evaluated using the AISC and the SCI criteria. The
two prediction methods are in agreement for 82 % (64 of 78) of the case studies, and
strongly disagree for only 12 % (9 of 78) of the case studies.

iv
ACKNOWLEDGMENTS
The road to obtaining a Masters degree is an arduous path. Many people deserve
recognition and appreciation for helping me achieve my dreams. I would first like to
extend my sincerest appreciation to Dr. Thomas M. Murray for his constant support and
guidance. His patience and friendship will always be valued and sorely missed. In
addition, my committee members, Dr. Mehdi Setareh and Dr. W. Samuel Easterling,
deserve my deepest gratitude. I would also like to thank Dr. Stephen Hicks of the Steel
Construction Institute for his cooperation in developing my thesis. I am also grateful to
NUCOR Research and Development for their financial assistance.
Special appreciation goes to my parents and family for their constant
encouragement and support all throughout my life. Their love has always inspired me to
continue to succeed and always follow my dreams.
Finally, I would like to thank Mike Yahraus, Brad Fuller, Matt Engelmann, and
Chris Brown for being my friends and staying by my side.
v
TABLE OF CONTENTS PAGE
ACKNOWLEDGMENTS..............................................................................iv
TABLE OF CONTENTS................................................................................v
LIST OF FIGURES......................................................................................viii
LIST OF TABLES ..........................................................................................x
CHAPTER I – FLOOR VIBRATIONS BACKGROUND AND
LITERATURE REVIEW................................................................................1
1.1 INTRODUCTION ................................................................................................ 1
1.2 SCOPE OF RESEARCH ..................................................................................... 2
1.3 TERMINOLOGY ................................................................................................. 2
1.4 LITERATURE REVIEW ..................................................................................... 6
1.4.1 HISTORICAL FLOOR VIBRATIONS CRITERIA.................................. 6
1.4.2 AISC STEEL DESIGN GUIDE SERIES 11 ............................................ 10
1.4.3 SCI FLOOR VIBRATIONS CRITERIA.................................................. 15
1.4.4 ADDITIONAL CURRENT RESEARCH ................................................ 20
1.5 NEED FOR RESEARCH ................................................................................... 21
CHAPTER II – NATURAL FREQUENCY STUDY ..................................23
2.1 INTRODUCTION .............................................................................................. 23
2.2 AISC FREQUENCY COMPARISONS............................................................. 24
2.2.1 FLOORS WITH HOT-ROLLED SHAPES.............................................. 25
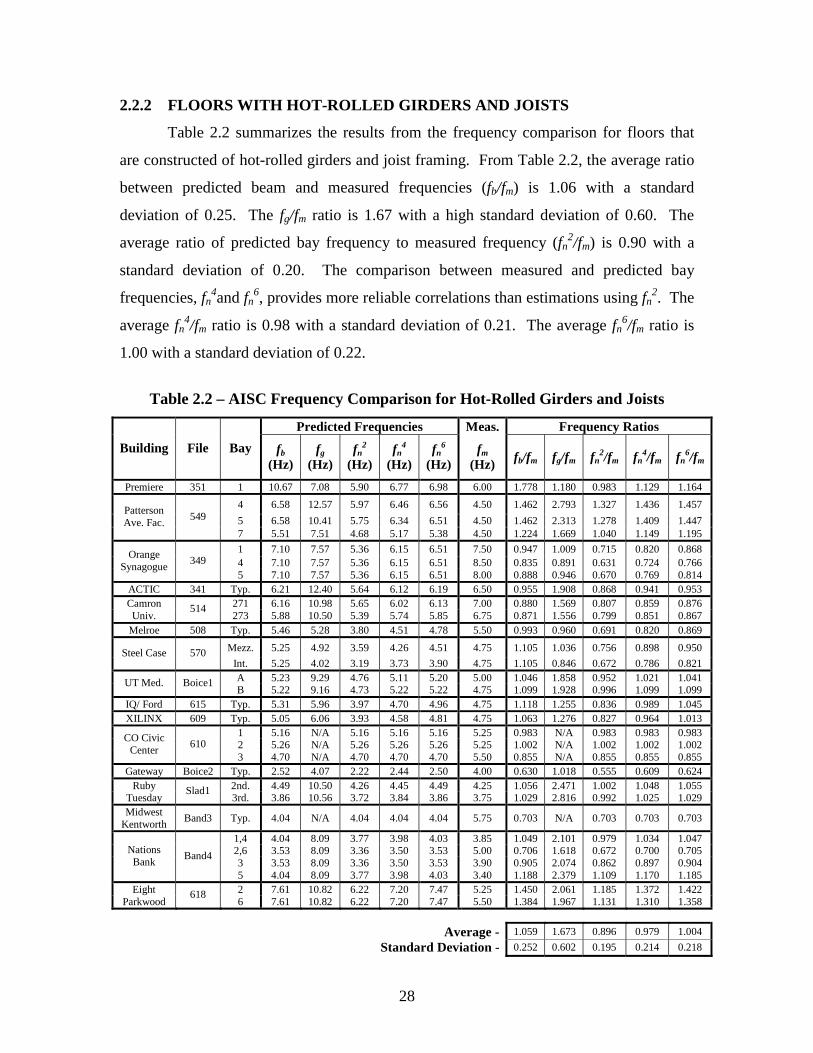
2.2.2 FLOORS WITH HOT-ROLLED GIRDERS AND JOISTS .................... 28
2.2.3 FLOORS WITH JOIST GIRDERS AND JOISTS................................... 30
2.2.4 HOT-ROLLED GIRDERS AND CASTELLATED BEAMS ................. 33
2.2.5 SUMMARY OF AISC FREQUENCY COMPARISONS ....................... 35
2.3 SCI FREQUENCY COMPARISONS................................................................ 37
2.3.1 FLOORS WITH HOT-ROLLED SHAPES.............................................. 37
2.3.2 FLOORS WITH HOT-ROLLED GIRDERS AND JOISTS .................... 40
2.3.3 FLOORS WITH JOIST GIRDERS AND JOISTS................................... 43
2.3.4 HOT-ROLLED GIRDERS AND CASTELLATED BEAMS ................. 45
vi
2.3.5 SUMMARY OF SCI FREQUENCY COMPARISONS .......................... 47
2.4 AISC vs. SCI FREQUENCY COMPARISON ................................................. 49
2.4.1 FLOORS WITH HOT-ROLLED SHAPES.............................................. 49
2.4.2 FLOORS WITH HOT-ROLLED GIRDERS AND JOISTS .................... 49
2.4.3 FLOORS WITH JOIST GIRDERS AND JOISTS................................... 49
2.4.4 HOT-ROLLED GIRDERS AND CASTELLATED BEAMS ................ 50
2.5 FREQUENCY EVALUATION OF BRITISH FLOORS................................... 53
2.5.1 AISC FREQUENCY EVALUATION OF BRITISH FLOORS .............. 53
2.5.2 SCI FREQUENCY EVALUATION OF BRITISH FLOORS ................. 56
2.5.3 EXAMPLE EVALUATION OF A SCI TESTED FLOOR ..................... 57
2.6 SUMMARY........................................................................................................ 59
CHAPTER III – FLOOR VIBRATIONS CRITERIA COMPARISONS....64
3.1 INTRODUCTION .............................................................................................. 64
3.2 CRITERIA COMPARISON RESULTS ............................................................ 65
3.2.1 FLOORS WITH HOT-ROLLED SHAPES.............................................. 66
3.2.2 FLOORS WITH HOT-ROLLED GIRDERS AND JOISTS .................... 66
3.2.3 FLOORS WITH JOIST GIRDERS AND JOISTS................................... 70
3.3 SUMMARY........................................................................................................ 70
CHAPTER IV – AISC AND SCI ACCELERATIONS COMPARISON....72
4.1 INTRODUCTION .............................................................................................. 72
4.2 AISC VS. SCI ACCEPTABILITY COMPARISON.......................................... 73
4.2.1 FLOORS WITH HOT-ROLLED SHAPES.............................................. 74
4.2.2 FLOORS WITH HOT-ROLLED GIRDERS AND JOISTS .................... 75
4.2.3 FLOORS WITH JOIST GIRDERS AND JOISTS................................... 77
4.2.4 HOT-ROLLED GIRDERS AND CASTELLATED BEAMS ................. 78
4.3 SUMMARY........................................................................................................ 78
CHAPTER V – CONCLUSIONS AND RECOMMENDATIONS .............80
5.1 SUMMARY........................................................................................................ 80
5.2 CONCLUSIONS................................................................................................. 80
5.2.1 NATURAL FREQUENCY STUDY ........................................................ 80
5.2.2 FLOOR VIBRATION CRITERIA COMPARISON................................ 81
vii
5.2.3 AISC AND SCI ACCELERATION COMPARISONS ........................... 81
5.3 COMMENTS...................................................................................................... 81
5.4 AREAS FOR FURTHER RESEARCH.............................................................. 82
LIST OF REFERENCES ..............................................................................84
APPENDIX A – EXAMPLE CALCULATIONS ........................................86
APPENDIX A.1 AISC DESIGN GUIDE 11 CALCULATIONS............................. 87
A.1.1 HOT-ROLLED SHAPES ......................................................................... 88
A.1.2 HOT-ROLLED GIRDERS WITH JOISTS .............................................. 92
A.1.3 JOIST GIRDERS WITH JOISTS............................................................. 97
A.1.4 HOT-ROLLED GIRDERS WITH CASTELLATED BEAMS.............. 101
A.1.5 BRITISH FLOOR SYSTEM .................................................................. 105
APPENDIX A.2 SCI FREQUENCY CALCULATIONS....................................... 109
A.2.1 HOT-ROLLED SHAPES ....................................................................... 110
A.2.2 HOT-ROLLED GIRDERS WITH JOISTS ............................................ 115
A.2.3 JOIST GIRDERS WITH JOISTS........................................................... 120
A.2.4 HOT-ROLLED GIRDERS WITH CASTELLATED BEAMS.............. 125
A.2.5 BRITISH FLOOR SYSTEM .................................................................. 130
APPENDIX A.3 SCI ACCELERATION CALCULATIONS ................................ 137
A.3.1 HOT-ROLLED SHAPES ....................................................................... 138
A.3.2 HOT-ROLLED GIRDERS WITH JOISTS ............................................ 139
A.3.3 JOIST GIRDERS WITH JOISTS........................................................... 140
A.3.4 HOT-ROLLED GIRDERS WITH CASTELLATED BEAMS.............. 141
APPENDIX A.4 MURRAY CRITERION CALCULATIONS .............................. 142
A.4.1 HOT-ROLLED SHAPES ....................................................................... 143
A.4.2 HOT-ROLLED GIRDERS WITH JOISTS ............................................ 148
A.4.3 JOIST GIRDERS WITH JOISTS........................................................... 153
APPENDIX A.5 MODIFIED REIHER-MEISTER CALCULATIONS................. 158
A.5.1 HOT-ROLLED SHAPES ....................................................................... 159
A.5.2 HOT-ROLLED GIRDERS WITH JOISTS ............................................ 164
A.5.3 JOIST GIRDERS WITH JOISTS........................................................... 168
VITA ...........................................................................................................173
viii
LIST OF FIGURES
Figure 1.1 – Amplitude and Period..................................................................................... 3
Figure 1.2 – Dynamic Loads (AISC Steel Design Guide Series 11 1997) ......................... 4
Figure 1.3 – Typical Mode Shapes for a Beam and Floor System ..................................... 5
Figure 1.4 – Frequency Spectrum....................................................................................... 6
Figure 1.5 – Reiher-Meister Scale ...................................................................................... 7
Figure 1.6 – Modified Reiher-Meister Scale ...................................................................... 7
Figure 1.7 – T-Beam Model................................................................................................ 8
Figure 1.8 – Recommended Peak Accelerations (Allen and Murray 1993) ..................... 10
Figure 1.9 – Modal Deflection of Beams.......................................................................... 17
Figure 1.10 – Mode Shape Governed by (a) Secondary Beam Flexibility (b) Primary
Beam Flexibility (Hicks, et al. 2000)........................................................................ 18
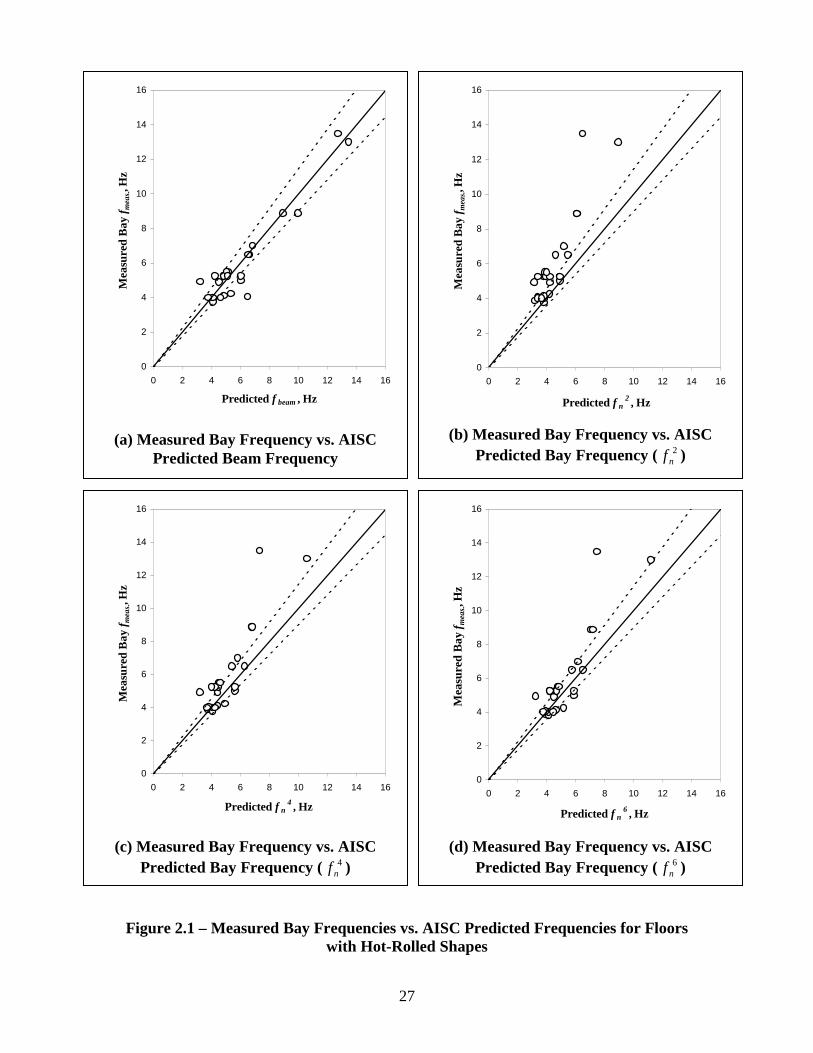
Figure 2.1 – Measured Bay Frequencies vs. AISC Predicted Frequencies for Floors with
Hot-Rolled Shapes .................................................................................................... 27
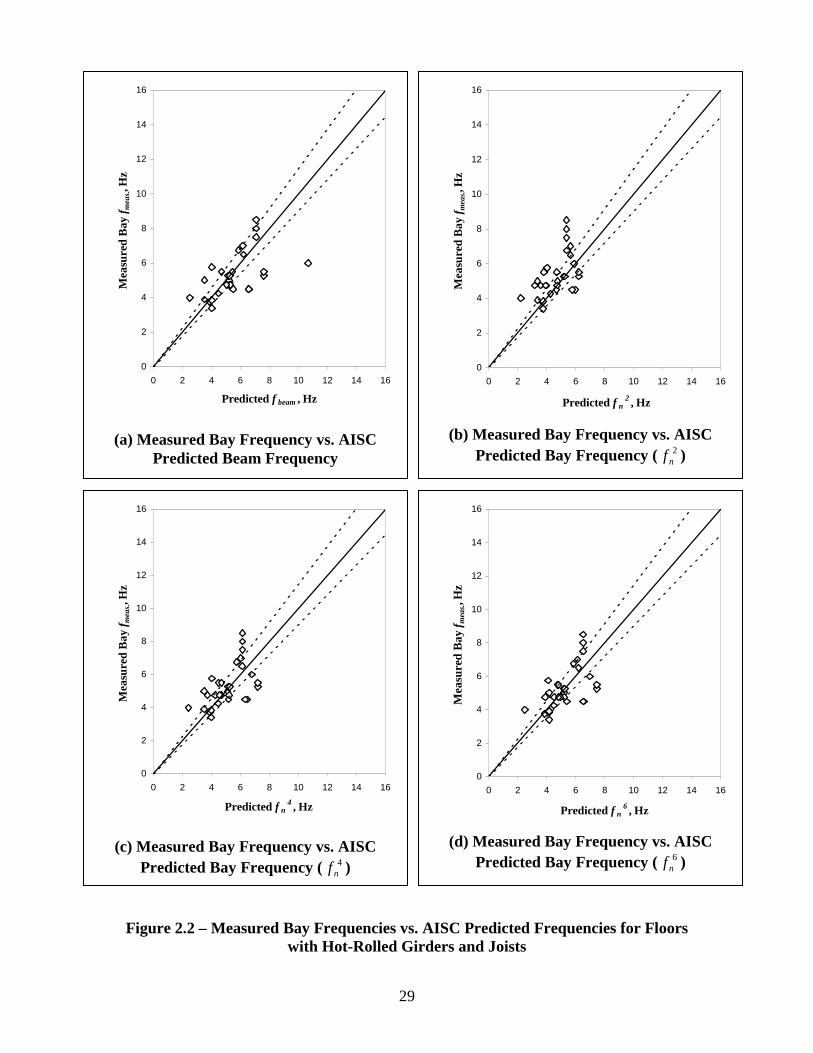
Figure 2.2 – Measured Bay Frequencies vs. AISC Predicted Frequencies for Floors with
Hot-Rolled Girders and Joists................................................................................... 29
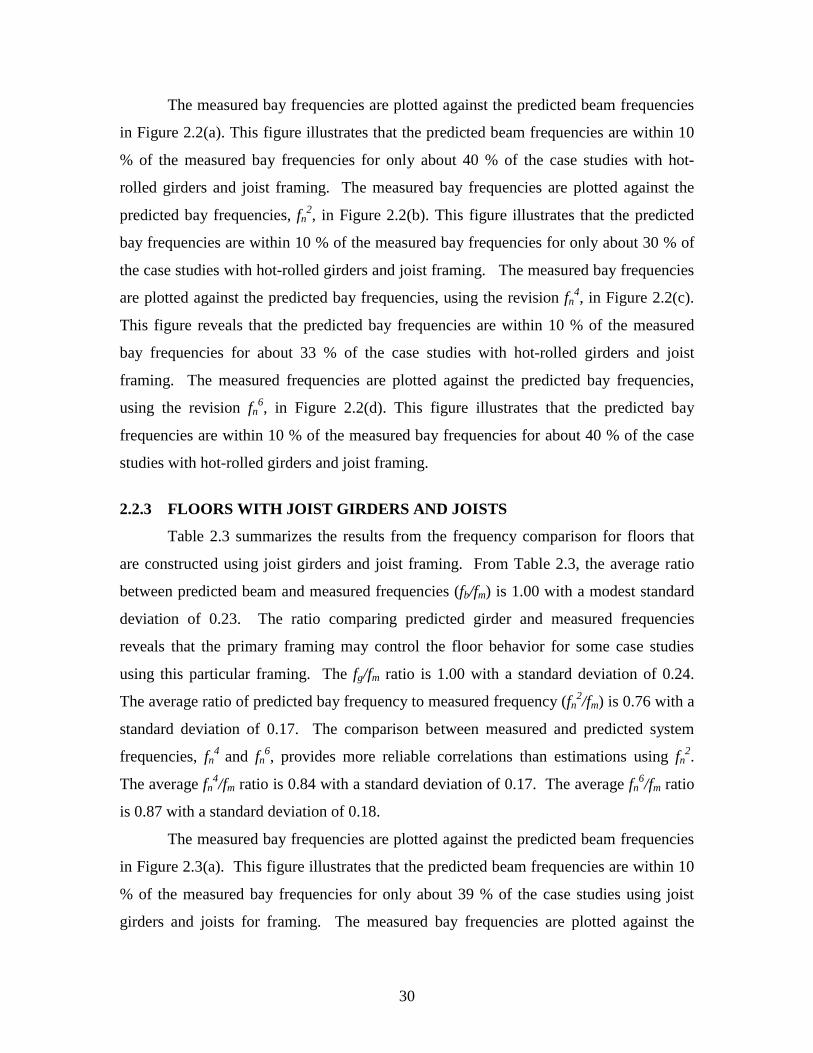
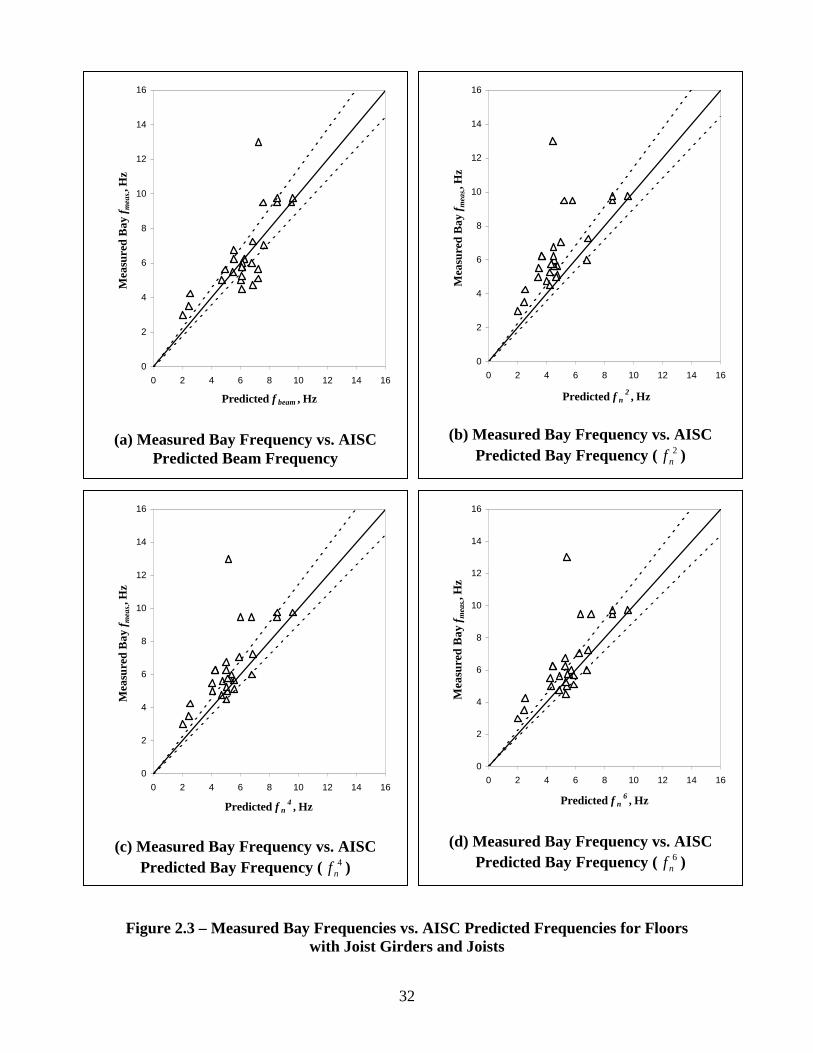
Figure 2.3 – Measured Bay Frequencies vs. AISC Predicted Frequencies for Floors with
Joist Girders and Joists.............................................................................................. 32
Figure 2.4 – Measured Bay Frequencies vs. AISC Predicted Frequencies for Floors with
Hot-Rolled Girders with Castellated Beams............................................................. 34
Figure 2.5 – Measured Bay Frequencies vs. AISC Predicted Frequencies for All Framing
Types......................................................................................................................... 36
Figure 2.6 – Measured Bay Frequencies vs. SCI Predicted Frequencies for Floors with
Hot-Rolled Shapes .................................................................................................... 39
Figure 2.7 – Measured Bay Frequencies vs. SCI Predicted Frequencies for Floors with
Hot-Rolled Girders and Joists................................................................................... 42
Figure 2.8 – Measured Bay Frequencies vs. SCI Predicted Frequencies for Floors with
Joist Girders and Joists.............................................................................................. 44
ix
Figure 2.9 – Measured Bay Frequencies vs. SCI Predicted Frequencies for Floors with
Hot-Rolled Girders and Castellated Beams .............................................................. 46
Figure 2.10 – Measured Bay Frequencies vs. SCI Predicted Frequencies for All Framing
Types......................................................................................................................... 48
Figure 2.11 – Measured Bay Frequency vs. Predicted AISC and SCI Bay Frequency for
British Tested Floors................................................................................................. 55
Figure 2.12 – First Floor Framing Plan SCI Headquarters (Hicks, et al. 2000) ............... 58
x
LIST OF TABLES
Table 1.1 – Leff and S Dimensions (Hicks, et al. 2000)..................................................... 20
Table 2.1 – AISC Frequency Comparison for Floors with Hot-Rolled Shapes................ 26
Table 2.2 – AISC Frequency Comparison for Hot-Rolled Girders and Joists.................. 28
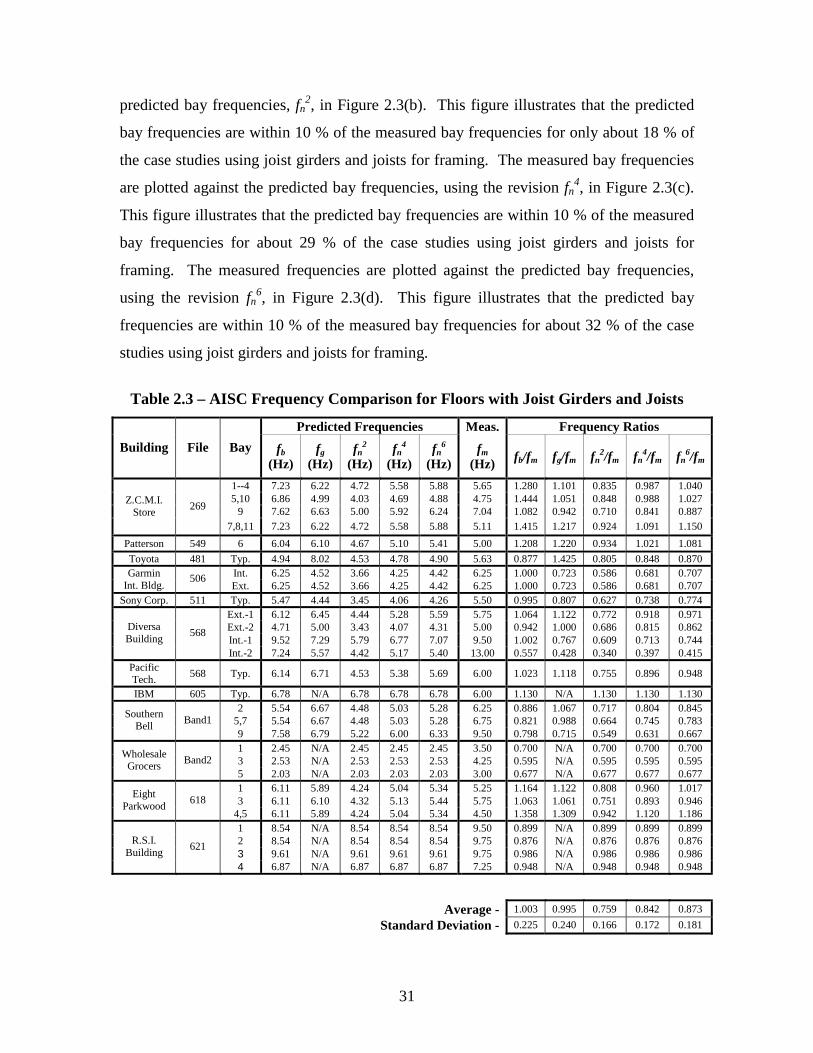
Table 2.3 – AISC Frequency Comparison for Floors with Joist Girders and Joists......... 31
Table 2.4 – AISC Frequency Comparison for Floors with Hot-Rolled Girders and
Castellated Beams..................................................................................................... 33
Table 2.5 – SCI Frequency Comparison for Floors with Hot-Rolled Shapes .................. 38
Table 2.6 – SCI Frequency Comparison for Floors with Hot-Rolled Girders and Joists . 41
Table 2.7 – SCI Frequency Comparison for Floors with Joist Girders and Joists............ 43
Table 2.8 – SCI Frequency Comparison for Floors with Hot-Rolled Girders and
Castellated Beams..................................................................................................... 45
Table 2.9 – AISC vs. SCI Frequency Comparison for Floors with Hot-Rolled Shapes... 50
Table 2.10 – AISC vs. SCI Frequencies for Hot-Rolled Girders and Joists..................... 51
Table 2.11 – AISC vs. SCI Frequencies for Floors with Joist Girders and Joists ............ 52
Table 2.12 – AISC vs. SCI Frequencies for Hot-Rolled Girders with Castellated Beams52
Table 2.13 – System Frequency Comparison for British Floors Using AISC Method .... 54
Table 2.14 – System Frequency Comparison for British Floors Using SCI Method ....... 54
Table 2.15 – AISC vs. SCI Comparison of Parameters for the SCI Headquarters Framing
................................................................................................................................... 58
Table 2.16 – Summary of Results of Frequency Study .................................................... 60
Table 3.1 – Acceptability Criteria Comparison for Floors with Hot-Rolled Shapes........ 67
Table 3.2 – Acceptability Criteria Comparison for Floors with Hot-Rolled Girders and
Joists.......................................................................................................................... 68
Table 3.3 – Acceptability Criteria Comparison for Floors with Joist Girders and Joist
Framing..................................................................................................................... 69
Table 3.4 – Criteria Comparison Summary ...................................................................... 71
Table 4.1 – AISC vs. SCI Acceptability for Framing Using Hot-Rolled Shapes............. 74
Table 4.2 – AISC vs. SCI Acceptability for Framing Using Hot-Rolled Girders and
Joists.......................................................................................................................... 76

xi
Table 4.3 – AISC vs. SCI Acceptability for Framing Using Joist Girders and Joists ...... 77
Table 4.4 – AISC vs. SCI Acceptability for Framing Using Hot-Rolled Girders and
Castellated Beams..................................................................................................... 78
Table 4.5 – AISC vs. SCI Acceptability Comparison Summary...................................... 79
1
CHAPTER I – FLOOR VIBRATIONS BACKGROUND AND
LITERATURE REVIEW
1.1 INTRODUCTION
Current trends in technology and construction practices have had an adverse
effect on the structural dynamics of floor systems in buildings. Twenty-first century
building designs are lightweight and high-strength and have longer spanning floor
systems. As a result, the serviceability due to vibrations becomes problematic for floors
with less live loading, damping, stiffness, and mass. Although floor vibrations do not
affect the structural integrity of a building, occupants may feel anxiety and uneasiness
due to the motion. Research into floor vibrations must continue to evolve to keep up with
changing developments in design and materials.
Floors that are susceptible to occupant-induced vibrations are costly and tedious
to retrofit. A number of criteria and design standards have been developed to predict the
response of floor systems due to walking excitations. Each criterion has assumptions on
the nature and relevant properties of floor systems. Due to the assorted techniques,
predictions of floor behavior can be significantly different between the criteria.
Examining case studies of floor systems currently being constructed and occupied in the
United States and the United Kingdom may provide insight on the accuracy of the
various prediction criteria.
The focus of this research is divided into three main topics in which case studies
were evaluated. The first focuses on comparing predicted natural frequencies with field-
measured frequencies. The second is a comparison between current acceptability criteria
and subjective field analyses. A comparison between the acceptability criteria used in the
United States and the United Kingdom is assessed in the final topic. The results of each
topic are used to suggest methods to improve correlation between predicted and field
behavior.
2
1.2 SCOPE OF RESEARCH
The objective of this research is to examine case studies of floor systems of
various framing being constructed and occupied in the United States and the United
Kingdom in an attempt to improve correlation between predicted and measured floor
response. Analyses of existing floors are important for improving the accuracy of
techniques for predicting the fundamental natural frequency of a floor. The first topic
provides a comparison between predicted fundamental frequencies and measured field
frequencies. The second topic involves evaluating currently occupied floor systems using
the American Institute of Steel Construction Design Guide 11 Floor Vibrations Due to
Human Activity (Murray, et al. 1997), the Modified Reiher-Meister scale, the Murray
Criterion, and the Steel Construction Institute criteria. The results of the evaluations are
then compared to subjective field analyses of the floor systems. The third focus of this
study compares the predicted accelerations and acceptability criteria between the
American Institute of Steel Construction (AISC) and Steel Construction Institute (SCI)
methods for assessing floor behavior. Proposals for continued research and conclusions
on each specific study are then given.
1.3 TERMINOLOGY
The terms listed below are used frequently within the text. The terms are defined
with respect to the specific field of floor vibrations.
Vibration. Vibrations are periodic motions of an elastic body such as a floor system in
alternately opposite directions from a position of equilibrium. Floor vibrations can be
classified as free or forced. Free vibration occurs when the floor system is displaced and
released, causing the structure to vibrate at a natural frequency. Forced vibration results
when a floor system vibrates at a frequency caused by a continuous and dynamic
excitation.
Cycle. A cycle is the motion of a floor system that recurs regularly and usually leads
back to a starting position.
3
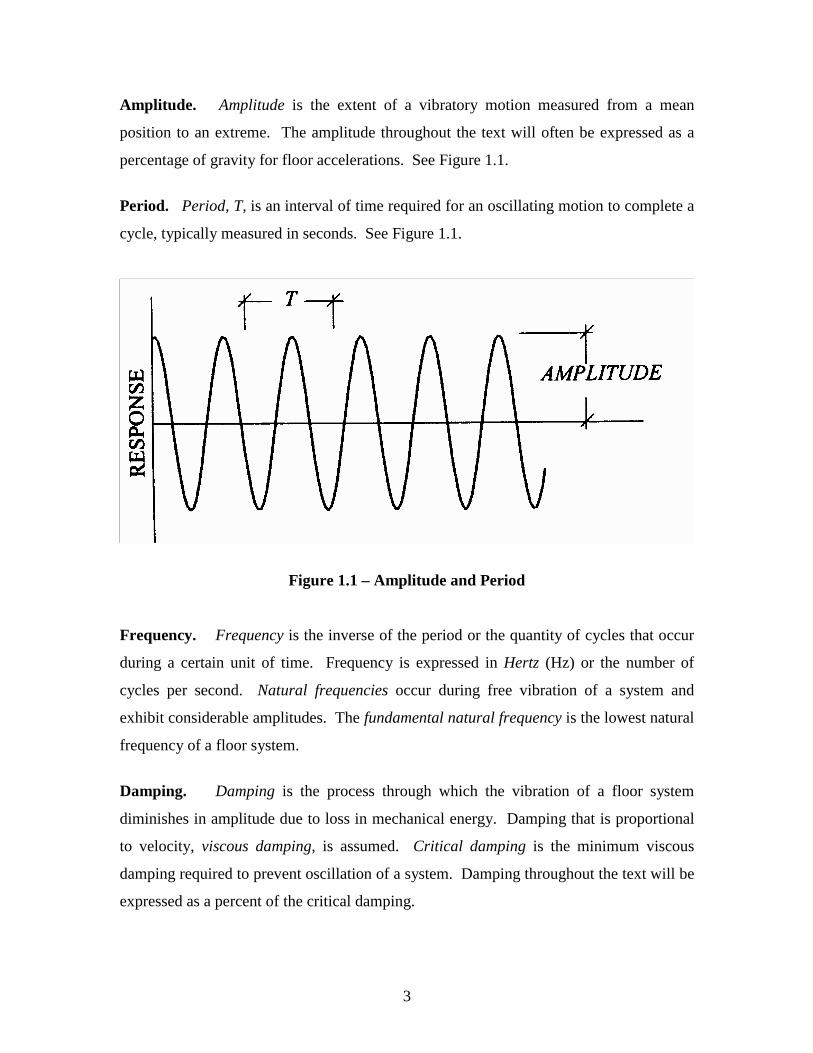
Amplitude. Amplitude is the extent of a vibratory motion measured from a mean
position to an extreme. The amplitude throughout the text will often be expressed as a
percentage of gravity for floor accelerations. See Figure 1.1.
Period. Period, T, is an interval of time required for an oscillating motion to complete a
cycle, typically measured in seconds. See Figure 1.1.
Figure 1.1 – Amplitude and Period
Frequency. Frequency is the inverse of the period or the quantity of cycles that occur
during a certain unit of time. Frequency is expressed in Hertz (Hz) or the number of
cycles per second. Natural frequencies occur during free vibration of a system and
exhibit considerable amplitudes. The fundamental natural frequency is the lowest natural
frequency of a floor system.
Damping. Damping is the process through which the vibration of a floor system
diminishes in amplitude due to loss in mechanical energy. Damping that is proportional
to velocity, viscous damping, is assumed. Critical damping is the minimum viscous
damping required to prevent oscillation of a system. Damping throughout the text will be
expressed as a percent of the critical damping.
4
Resonance. Resonance is a state that results in vibrations with large amplitudes as a
result of an excitation applied to a system at any natural frequency or multiple of any
natural frequency to the system.
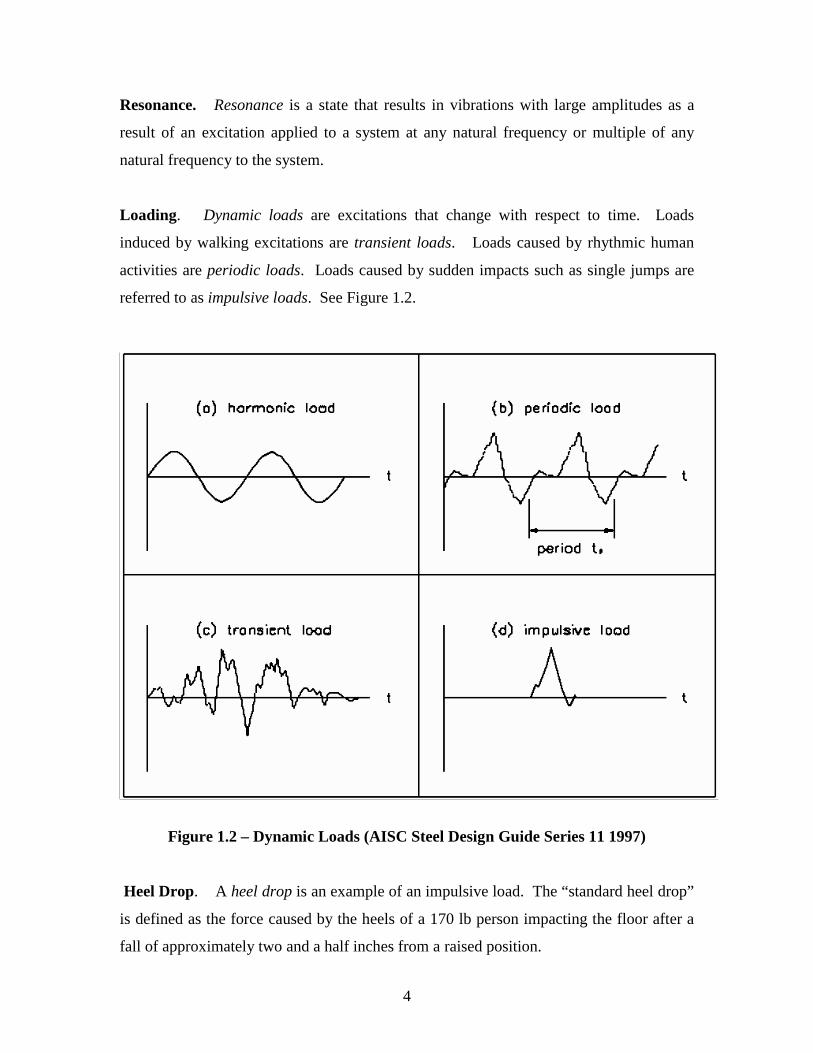
Loading. Dynamic loads are excitations that change with respect to time. Loads
induced by walking excitations are transient loads. Loads caused by rhythmic human
activities are periodic loads. Loads caused by sudden impacts such as single jumps are
referred to as impulsive loads. See Figure 1.2.
Figure 1.2 – Dynamic Loads (AISC Steel Design Guide Series 11 1997)
Heel Drop. A heel drop is an example of an impulsive load. The “standard heel drop”
is defined as the force caused by the heels of a 170 lb person impacting the floor after a
fall of approximately two and a half inches from a raised position.
5
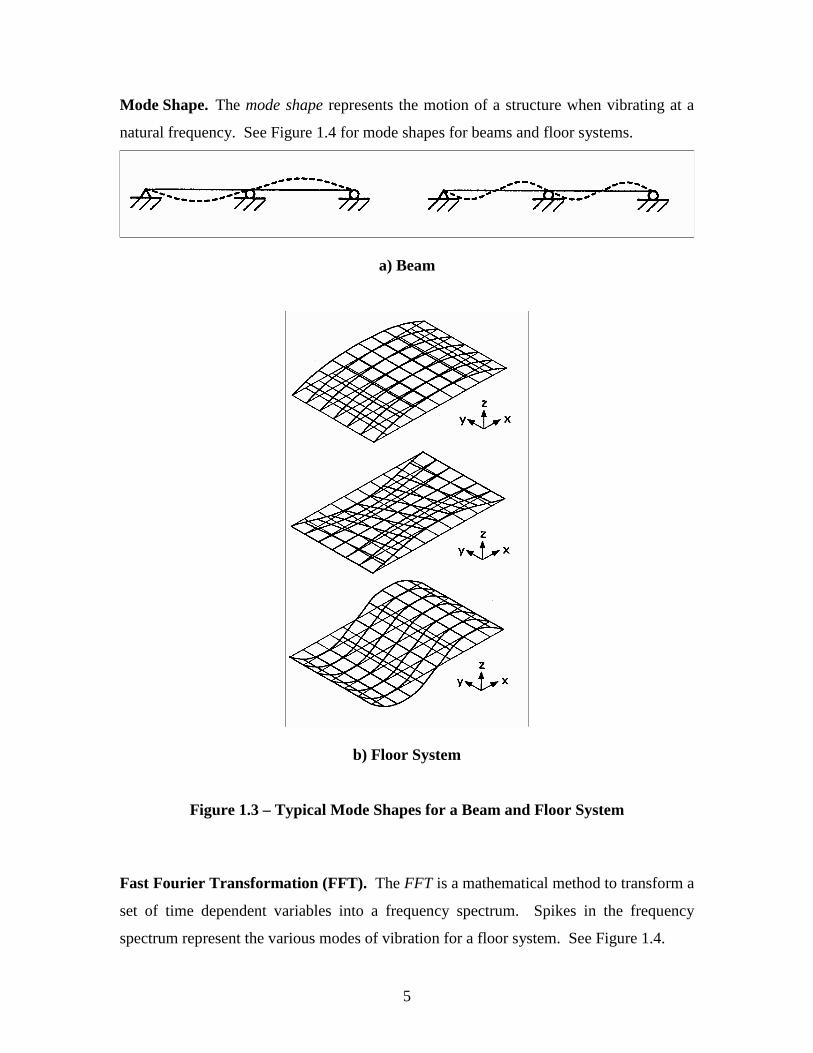
Mode Shape. The mode shape represents the motion of a structure when vibrating at a
natural frequency. See Figure 1.4 for mode shapes for beams and floor systems.
a) Beam
b) Floor System
Figure 1.3 – Typical Mode Shapes for a Beam and Floor System
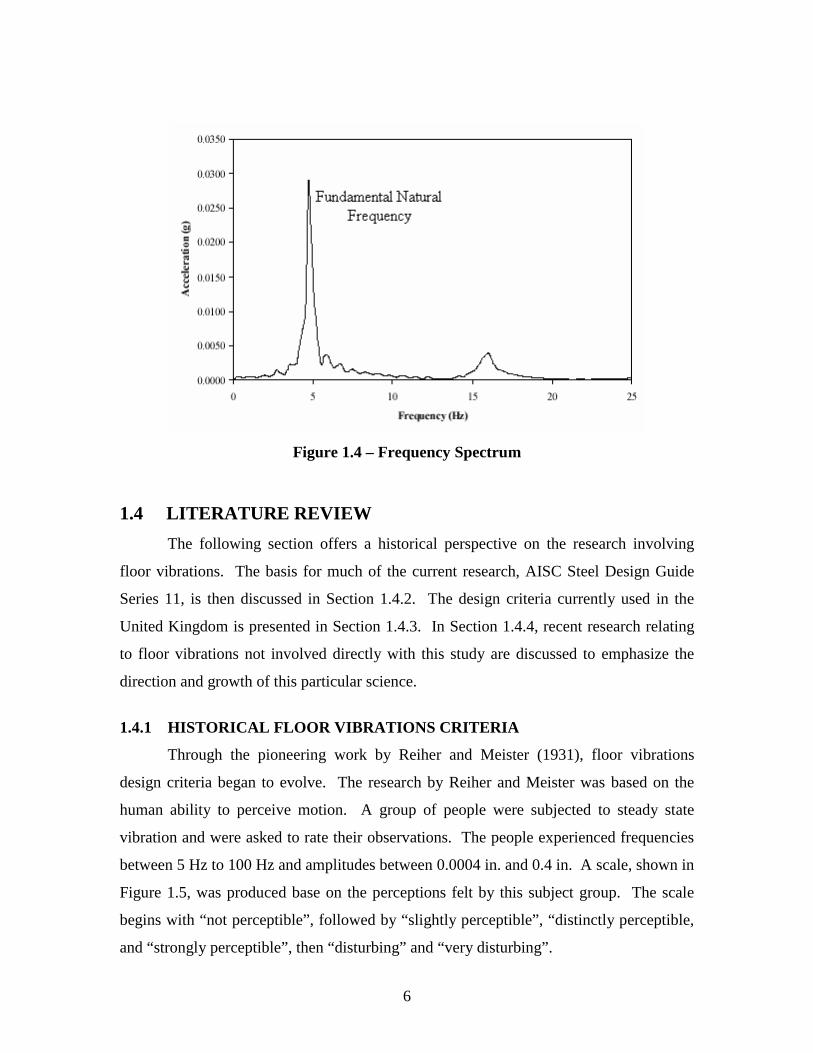
Fast Fourier Transformation (FFT). The FFT is a mathematical method to transform a
set of time dependent variables into a frequency spectrum. Spikes in the frequency
spectrum represent the various modes of vibration for a floor system. See Figure 1.4.
6
Figure 1.4 – Frequency Spectrum
1.4 LITERATURE REVIEW
The following section offers a historical perspective on the research involving
floor vibrations. The basis for much of the current research, AISC Steel Design Guide
Series 11, is then discussed in Section 1.4.2. The design criteria currently used in the
United Kingdom is presented in Section 1.4.3. In Section 1.4.4, recent research relating
to floor vibrations not involved directly with this study are discussed to emphasize the
direction and growth of this particular science.
1.4.1 HISTORICAL FLOOR VIBRATIONS CRITERIA
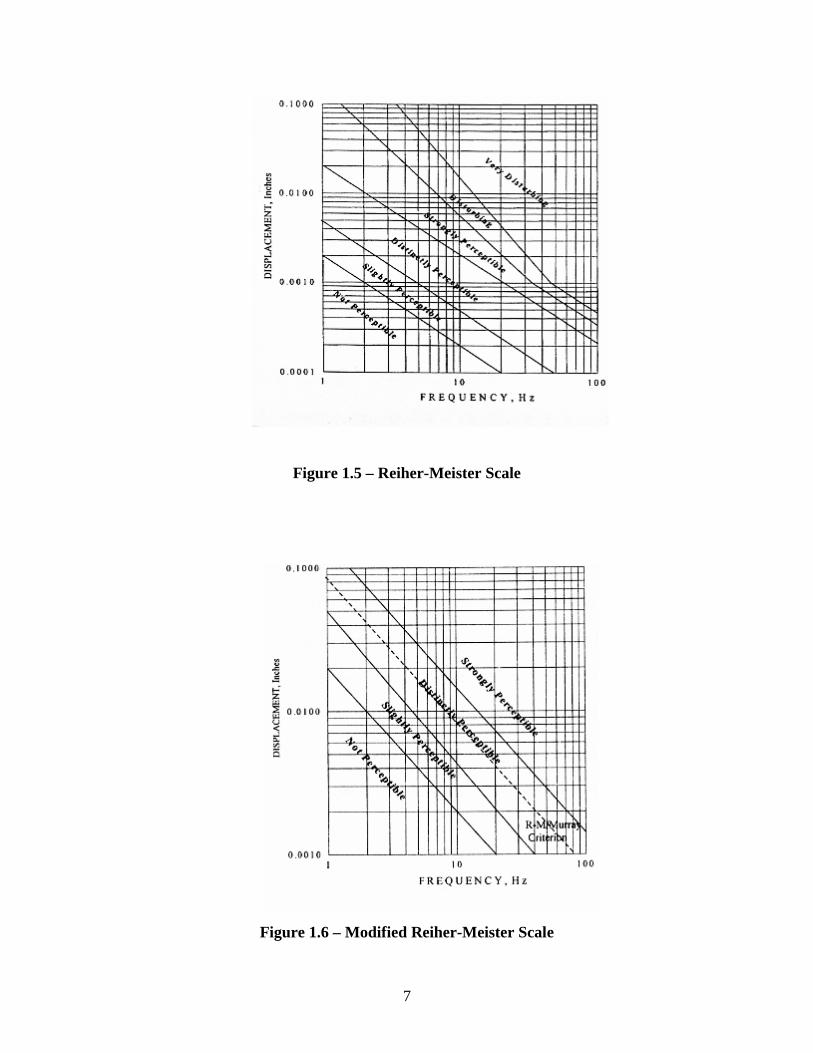
Through the pioneering work by Reiher and Meister (1931), floor vibrations
design criteria began to evolve. The research by Reiher and Meister was based on the
human ability to perceive motion. A group of people were subjected to steady state
vibration and were asked to rate their observations. The people experienced frequencies
between 5 Hz to 100 Hz and amplitudes between 0.0004 in. and 0.4 in. A scale, shown in
Figure 1.5, was produced base on the perceptions felt by this subject group. The scale
begins with “not perceptible”, followed by “slightly perceptible”, “distinctly perceptible,
and “strongly perceptible”, then “disturbing” and “very disturbing”.
7
Figure 1.5 – Reiher-Meister Scale
Figure 1.6 – Modified Reiher-Meister Scale
8
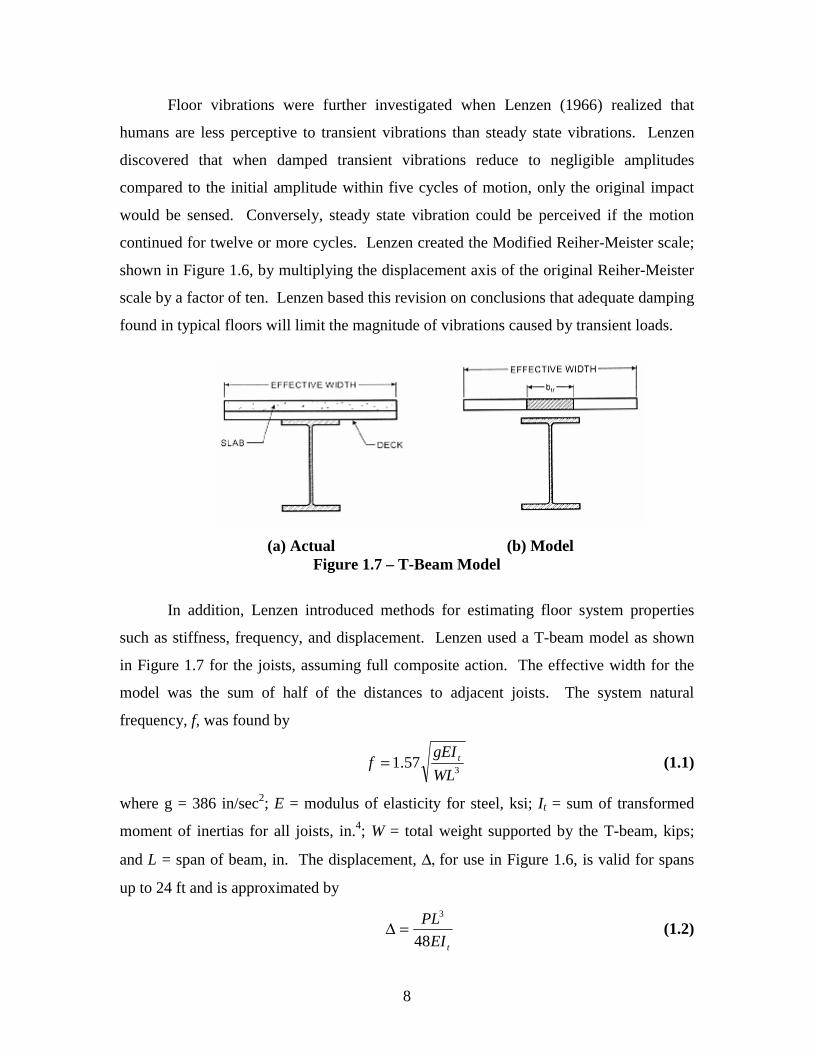
Floor vibrations were further investigated when Lenzen (1966) realized that
humans are less perceptive to transient vibrations than steady state vibrations. Lenzen
discovered that when damped transient vibrations reduce to negligible amplitudes
compared to the initial amplitude within five cycles of motion, only the original impact
would be sensed. Conversely, steady state vibration could be perceived if the motion
continued for twelve or more cycles. Lenzen created the Modified Reiher-Meister scale;
shown in Figure 1.6, by multiplying the displacement axis of the original Reiher-Meister
scale by a factor of ten. Lenzen based this revision on conclusions that adequate damping
found in typical floors will limit the magnitude of vibrations caused by transient loads.
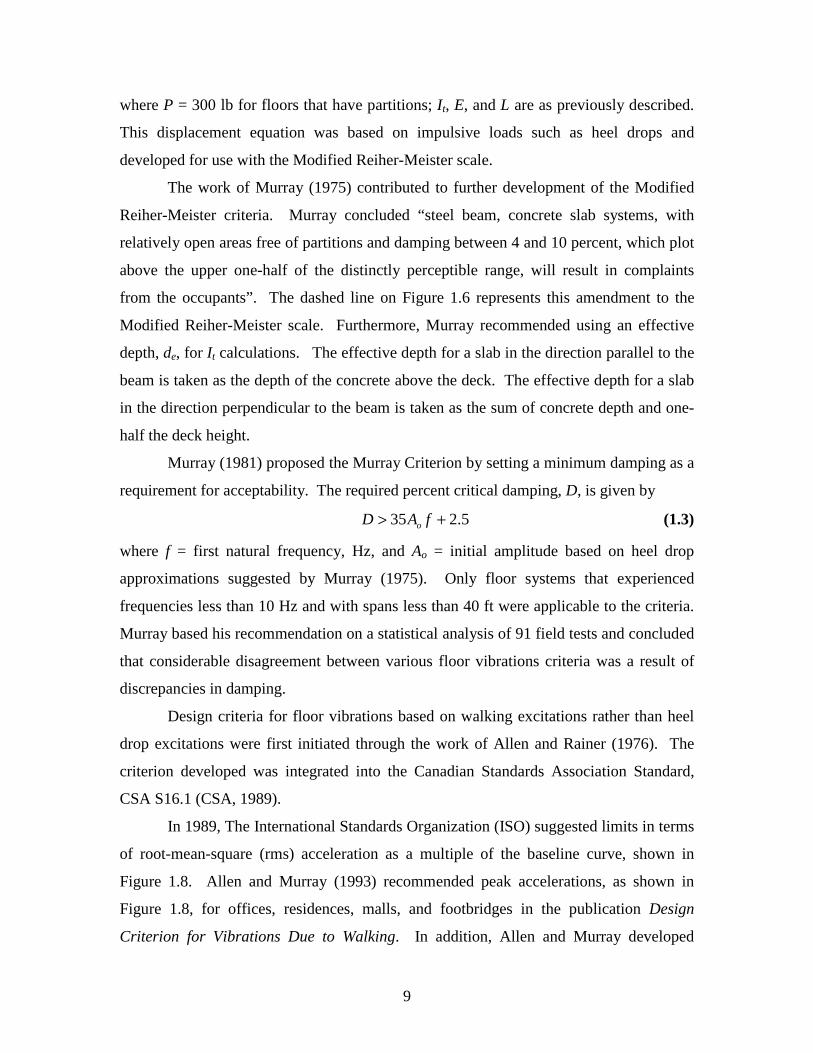
(a) Actual (b) Model Figure 1.7 – T-Beam Model
In addition, Lenzen introduced methods for estimating floor system properties
such as stiffness, frequency, and displacement. Lenzen used a T-beam model as shown
in Figure 1.7 for the joists, assuming full composite action. The effective width for the
model was the sum of half of the distances to adjacent joists. The system natural
frequency, f, was found by
3
57.1WL
gEIf t= (1.1)
where g = 386 in/sec2; E = modulus of elasticity for steel, ksi; It = sum of transformed
moment of inertias for all joists, in.4; W = total weight supported by the T-beam, kips;
and L = span of beam, in. The displacement, ∆, for use in Figure 1.6, is valid for spans
up to 24 ft and is approximated by
tEI
PL
48
3
=∆ (1.2)
9
where P = 300 lb for floors that have partitions; It, E, and L are as previously described.
This displacement equation was based on impulsive loads such as heel drops and
developed for use with the Modified Reiher-Meister scale.
The work of Murray (1975) contributed to further development of the Modified
Reiher-Meister criteria. Murray concluded “steel beam, concrete slab systems, with
relatively open areas free of partitions and damping between 4 and 10 percent, which plot
above the upper one-half of the distinctly perceptible range, will result in complaints
from the occupants”. The dashed line on Figure 1.6 represents this amendment to the
Modified Reiher-Meister scale. Furthermore, Murray recommended using an effective
depth, de, for It calculations. The effective depth for a slab in the direction parallel to the
beam is taken as the depth of the concrete above the deck. The effective depth for a slab
in the direction perpendicular to the beam is taken as the sum of concrete depth and one-
half the deck height.
Murray (1981) proposed the Murray Criterion by setting a minimum damping as a
requirement for acceptability. The required percent critical damping, D, is given by
5.235 +> fAD o (1.3)
where f = first natural frequency, Hz, and Ao = initial amplitude based on heel drop
approximations suggested by Murray (1975). Only floor systems that experienced
frequencies less than 10 Hz and with spans less than 40 ft were applicable to the criteria.
Murray based his recommendation on a statistical analysis of 91 field tests and concluded
that considerable disagreement between various floor vibrations criteria was a result of
discrepancies in damping.
Design criteria for floor vibrations based on walking excitations rather than heel
drop excitations were first initiated through the work of Allen and Rainer (1976). The
criterion developed was integrated into the Canadian Standards Association Standard,
CSA S16.1 (CSA, 1989).
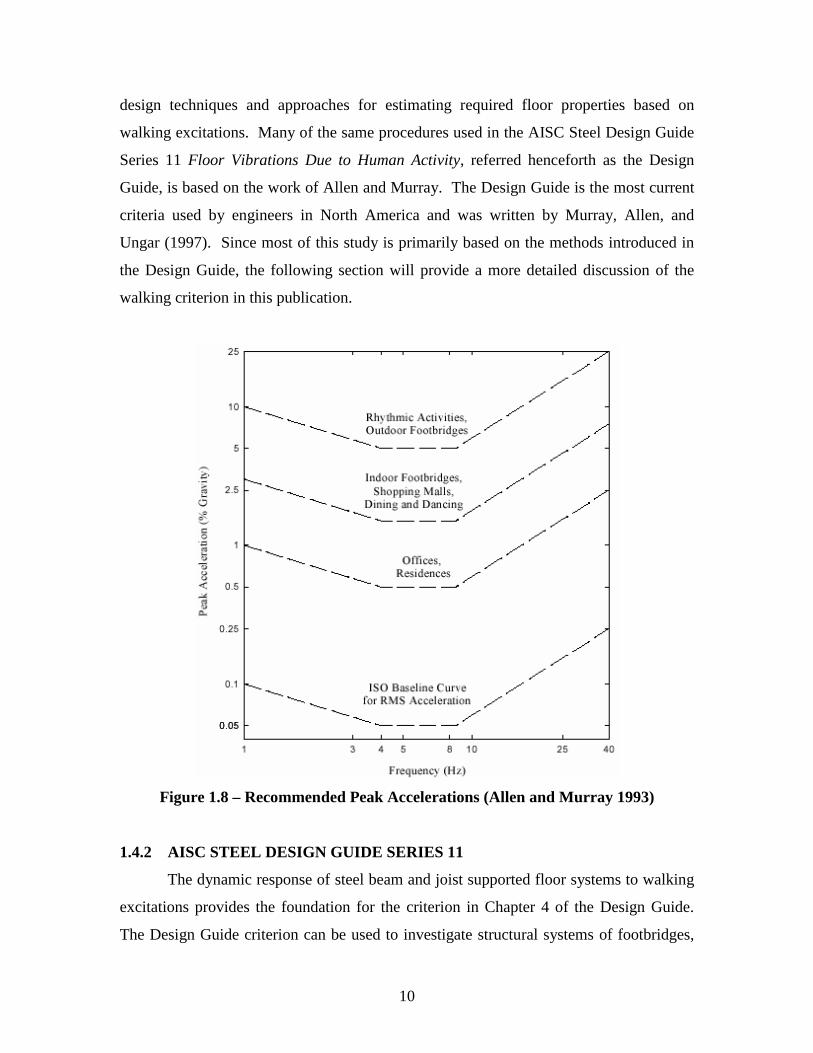
In 1989, The International Standards Organization (ISO) suggested limits in terms
of root-mean-square (rms) acceleration as a multiple of the baseline curve, shown in
Figure 1.8. Allen and Murray (1993) recommended peak accelerations, as shown in
Figure 1.8, for offices, residences, malls, and footbridges in the publication Design
Criterion for Vibrations Due to Walking. In addition, Allen and Murray developed
10
design techniques and approaches for estimating required floor properties based on
walking excitations. Many of the same procedures used in the AISC Steel Design Guide
Series 11 Floor Vibrations Due to Human Activity, referred henceforth as the Design
Guide, is based on the work of Allen and Murray. The Design Guide is the most current
criteria used by engineers in North America and was written by Murray, Allen, and
Ungar (1997). Since most of this study is primarily based on the methods introduced in
the Design Guide, the following section will provide a more detailed discussion of the
walking criterion in this publication.
Figure 1.8 – Recommended Peak Accelerations (Allen and Murray 1993)
1.4.2 AISC STEEL DESIGN GUIDE SERIES 11
The dynamic response of steel beam and joist supported floor systems to walking
excitations provides the foundation for the criterion in Chapter 4 of the Design Guide.
The Design Guide criterion can be used to investigate structural systems of footbridges,
11
offices, residences, and malls made of steel and concrete. This section will explain the
walking criterion and summarize the important procedures for calculating floor system
properties.
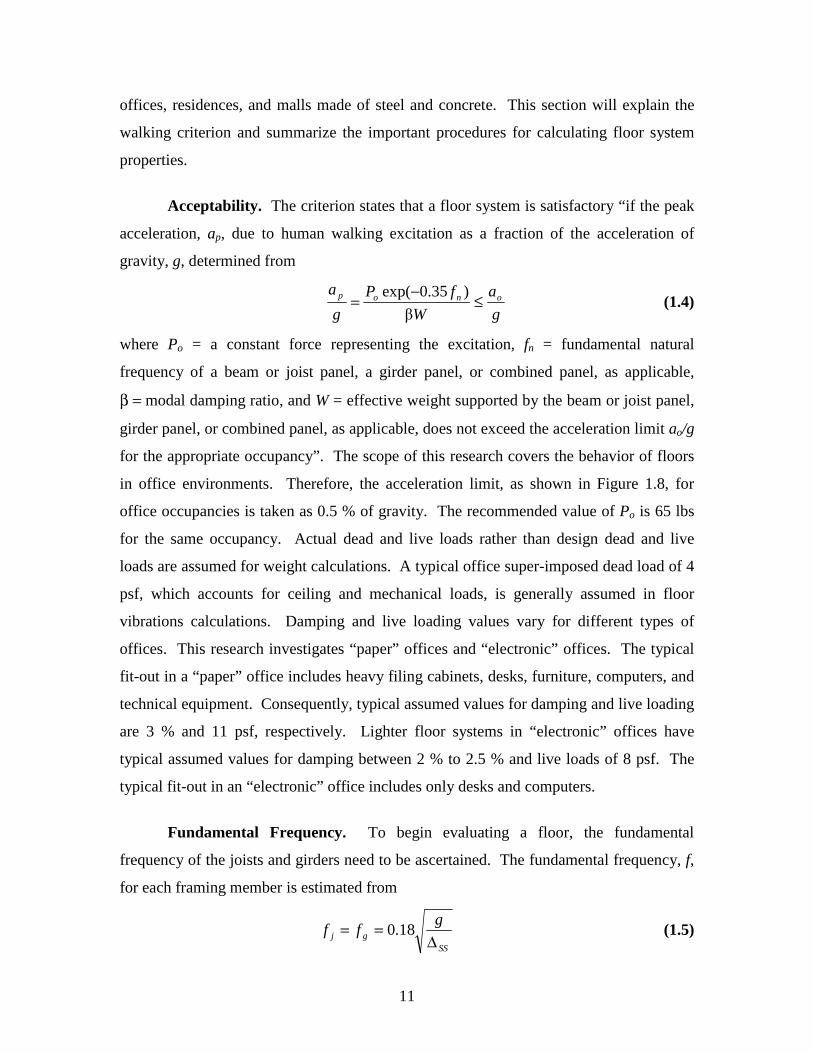
Acceptability. The criterion states that a floor system is satisfactory “if the peak
acceleration, ap, due to human walking excitation as a fraction of the acceleration of
gravity, g, determined from
g
a
W
fP
g
aonop ≤
−=
β)35.0exp(
(1.4)
where Po = a constant force representing the excitation, fn = fundamental natural
frequency of a beam or joist panel, a girder panel, or combined panel, as applicable,
β = modal damping ratio, and W = effective weight supported by the beam or joist panel,
girder panel, or combined panel, as applicable, does not exceed the acceleration limit ao/g
for the appropriate occupancy”. The scope of this research covers the behavior of floors
in office environments. Therefore, the acceleration limit, as shown in Figure 1.8, for
office occupancies is taken as 0.5 % of gravity. The recommended value of Po is 65 lbs
for the same occupancy. Actual dead and live loads rather than design dead and live
loads are assumed for weight calculations. A typical office super-imposed dead load of 4
psf, which accounts for ceiling and mechanical loads, is generally assumed in floor
vibrations calculations. Damping and live loading values vary for different types of
offices. This research investigates “paper” offices and “electronic” offices. The typical
fit-out in a “paper” office includes heavy filing cabinets, desks, furniture, computers, and
technical equipment. Consequently, typical assumed values for damping and live loading
are 3 % and 11 psf, respectively. Lighter floor systems in “electronic” offices have
typical assumed values for damping between 2 % to 2.5 % and live loads of 8 psf. The
typical fit-out in an “electronic” office includes only desks and computers.
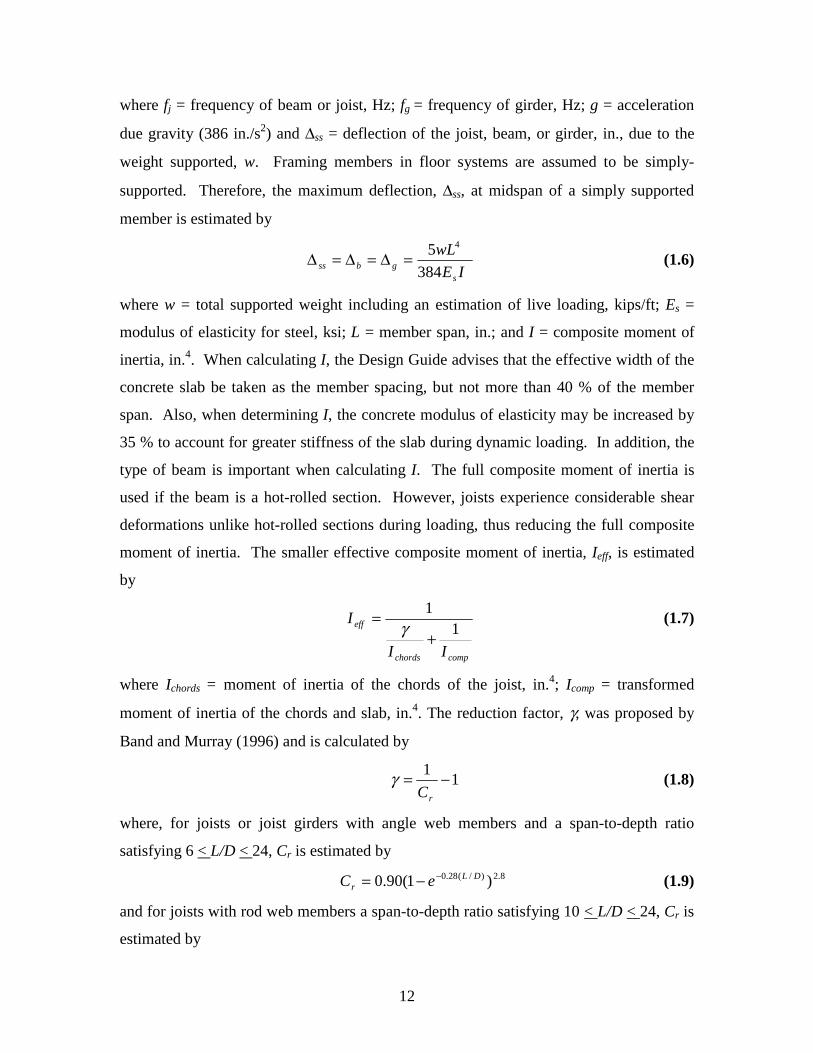
Fundamental Frequency. To begin evaluating a floor, the fundamental
frequency of the joists and girders need to be ascertained. The fundamental frequency, f,
for each framing member is estimated from
SSgj
gff
∆== 18.0 (1.5)
12
where fj = frequency of beam or joist, Hz; fg = frequency of girder, Hz; g = acceleration
due gravity (386 in./s2) and ∆ss = deflection of the joist, beam, or girder, in., due to the
weight supported, w. Framing members in floor systems are assumed to be simply-
supported. Therefore, the maximum deflection, ∆ss, at midspan of a simply supported
member is estimated by
IE
wL
sgbss 384
5 4
=∆=∆=∆ (1.6)
where w = total supported weight including an estimation of live loading, kips/ft; Es =
modulus of elasticity for steel, ksi; L = member span, in.; and I = composite moment of
inertia, in.4. When calculating I, the Design Guide advises that the effective width of the
concrete slab be taken as the member spacing, but not more than 40 % of the member
span. Also, when determining I, the concrete modulus of elasticity may be increased by
35 % to account for greater stiffness of the slab during dynamic loading. In addition, the
type of beam is important when calculating I. The full composite moment of inertia is
used if the beam is a hot-rolled section. However, joists experience considerable shear
deformations unlike hot-rolled sections during loading, thus reducing the full composite
moment of inertia. The smaller effective composite moment of inertia, Ieff, is estimated
by
compchords
eff
II
I1
1
+= γ (1.7)
where Ichords = moment of inertia of the chords of the joist, in.4; Icomp = transformed
moment of inertia of the chords and slab, in.4. The reduction factor, γ, was proposed by
Band and Murray (1996) and is calculated by
11 −=
rCγ (1.8)
where, for joists or joist girders with angle web members and a span-to-depth ratio
satisfying 6 < L/D < 24, Cr is estimated by
8.2)/(28.0 )1(90.0 DLr eC −−= (1.9)
and for joists with rod web members a span-to-depth ratio satisfying 10 < L/D < 24, Cr is
estimated by
13
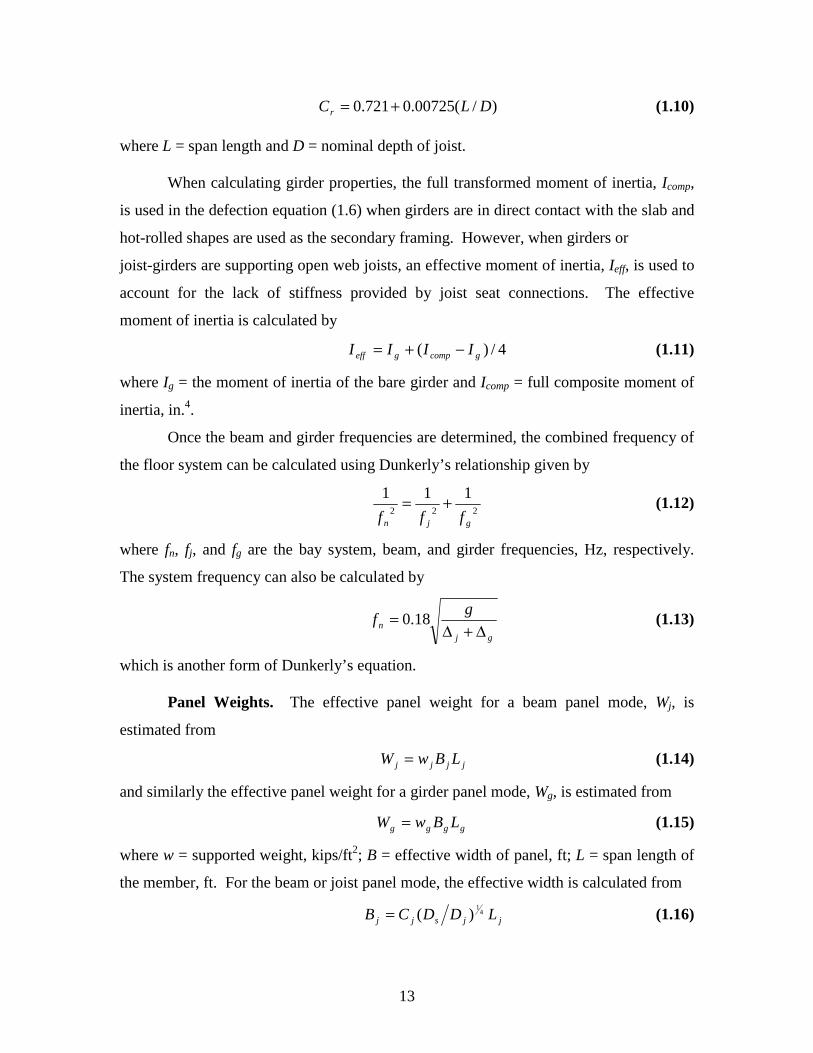
)/(00725.0721.0 DLCr += (1.10)
where L = span length and D = nominal depth of joist.
When calculating girder properties, the full transformed moment of inertia, Icomp,
is used in the defection equation (1.6) when girders are in direct contact with the slab and
hot-rolled shapes are used as the secondary framing. However, when girders or
joist-girders are supporting open web joists, an effective moment of inertia, Ieff, is used to
account for the lack of stiffness provided by joist seat connections. The effective
moment of inertia is calculated by
4/)( gcompgeff IIII −+= (1.11)
where Ig = the moment of inertia of the bare girder and Icomp = full composite moment of
inertia, in.4.
Once the beam and girder frequencies are determined, the combined frequency of
the floor system can be calculated using Dunkerly’s relationship given by
222
111
gjn fff+= (1.12)
where fn, fj, and fg are the bay system, beam, and girder frequencies, Hz, respectively.
The system frequency can also be calculated by
gjn
gf
∆+∆= 18.0 (1.13)
which is another form of Dunkerly’s equation. Panel Weights. The effective panel weight for a beam panel mode, Wj, is
estimated from
jjjj LBwW = (1.14)
and similarly the effective panel weight for a girder panel mode, Wg, is estimated from
gggg LBwW = (1.15)
where w = supported weight, kips/ft2; B = effective width of panel, ft; L = span length of
the member, ft. For the beam or joist panel mode, the effective width is calculated from
jjsjj LDDCB 41
)(= (1.16)
14
where Cj = 2.0 for joists and beams in most areas or Cj = 1.0 when joists or beams are
parallel to an interior edge; Dj = joist or beam transformed moment of inertia per unit
width, in.4/ft; Ds = transformed slab moment of inertia per unit width, in.4/ft; Lj = span
length of the member, ft. The effective width of the beam or joist panel mode cannot be
greater than two-thirds of the floor width in the direction perpendicular to the beam or
joist span. For the girder mode, the effective width is calculated by
ggjgg LDDCB 41
)(= (1.17)
where Cg = 1.6 for girders supporting joists connected to the girder flange through joist
seats or Cg = 1.8 for girders supporting beams connected to the girder web; Dj = joist or
beam transformed moment of inertia per unit width, in.4/ft; Dg = girder transformed
moment of inertia per unit width, in.4/ft; Lg = span length of the girder, ft. The effective
width of the girder panel mode cannot be greater than two-thirds of the floor length in the
direction perpendicular to the girder span. The effective panel weight, Wj or Wg, may be
increased by 50 % when beams, joists, or girders are continuous over their supports and a
neighboring span is greater than 0.7 times the span under consideration. This increase in
weight applies to hot-rolled sections shear-connected to girder webs and joists that are
connected by both top and bottom chords.
The equivalent panel weight, W, when considering the combined mode is
estimated by
ggj
gj
gj
j WWW∆+∆
∆+
∆+∆∆
= (1.18)
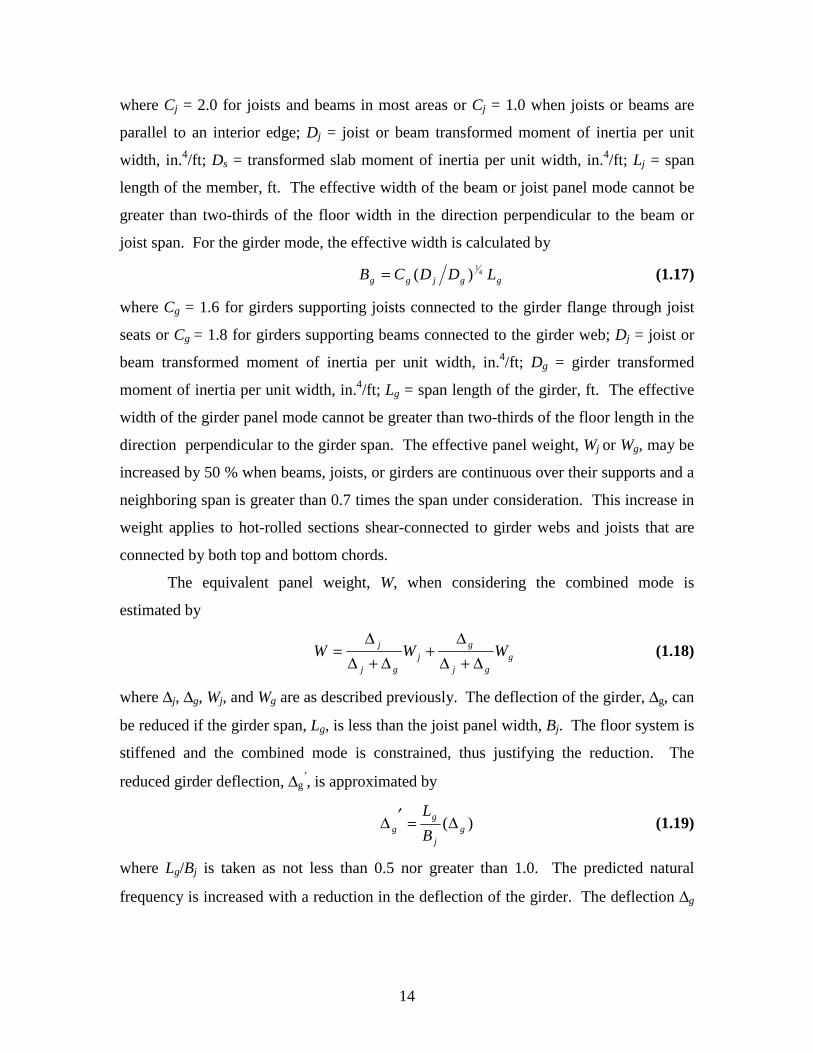
where ∆j, ∆g, Wj, and Wg are as described previously. The deflection of the girder, ∆g, can
be reduced if the girder span, Lg, is less than the joist panel width, Bj. The floor system is
stiffened and the combined mode is constrained, thus justifying the reduction. The
reduced girder deflection, ∆g’, is approximated by
)( gj
gg B
L∆=′∆ (1.19)
where Lg/Bj is taken as not less than 0.5 nor greater than 1.0. The predicted natural
frequency is increased with a reduction in the deflection of the girder. The deflection ∆g
15
in Equations 1.5 or 1.13 is replaced by ∆g’ in order to calculate the fundamental natural
frequencies of girders or system frequencies.
1.4.3 SCI FLOOR VIBRATIONS CRITERIA
The SCI Publication Design Guide on the Vibration of Floors, authored by Wyatt
(1989), provides the techniques and criterion used in the United Kingdom for analyzing
floor response. In this section, the acceptability criteria used to rate a floor system, the
methods used to calculate the fundamental natural frequencies of floor systems, important
procedures for calculating floor system properties, and a summary of the different floor
system assumptions currently used by AISC and SCI techniques, are presented.
Acceptability Criteria. Using estimated peak acceleration, the root-mean-square
acceleration or arms is then
2peakrms aa = (1.20)
The limiting acceleration is given by the baseline acceleration, abase, shown as the ISO
baseline curve in Figure 1.8 multiplied by a response factor, R, for the specific office
environment. The limiting acceleration is also a function of the fundamental frequency,
fo, of the floor system. The limiting accelerations of floors are dictated by
Rarms 005.0≤ for 3.0 Hz ≤ fo ≤ 8.0 Hz (1.21)
and
≤
8005.0 o
rms
fRa for fo > 8.0 Hz (1.22)
The SCI guide recognizes three types of office environments. The “special
office” is “appropriate for floors where technical tasks that require concentration and
precision operations on computers are performed”. The “general office” is “appropriate
for floors where normal activities and text operations on computers are performed”. The
“busy office” is “appropriate for floors that are available to many people, with both visual
and audible distractions”. The response factors for “special office”, “general office”, and
“busy office” are 4, 8, and 12, respectively.
Fundamental Frequency. Many of the same procedures and calculations are
used by both SCI and AISC. The Steel Construction Institute also uses Equations 1.5 and
16
1.6 to calculate the fundamental natural frequency of floors. However, SCI has subtle
differences in the assumptions of floor system properties. For example, when calculating
the weight carried by a beam, SCI assumes a load corresponding to the self-weight,
services, ceiling, and 10 % of the imposed load. The imposed value of 10 % represents
“a sensible permanent load for furnished floors designed in office environments”. The
AISC and the SCI also differ in the definition of effective width for secondary and
primary framing members. The SCI takes the effective breadth of slab to be the
summation of one-eighth of the member spans either side of the beam providing that this
value does not exceed b or the summation of 0.8b/2, where b is the spacing of the
secondary and primary framing, respectively.
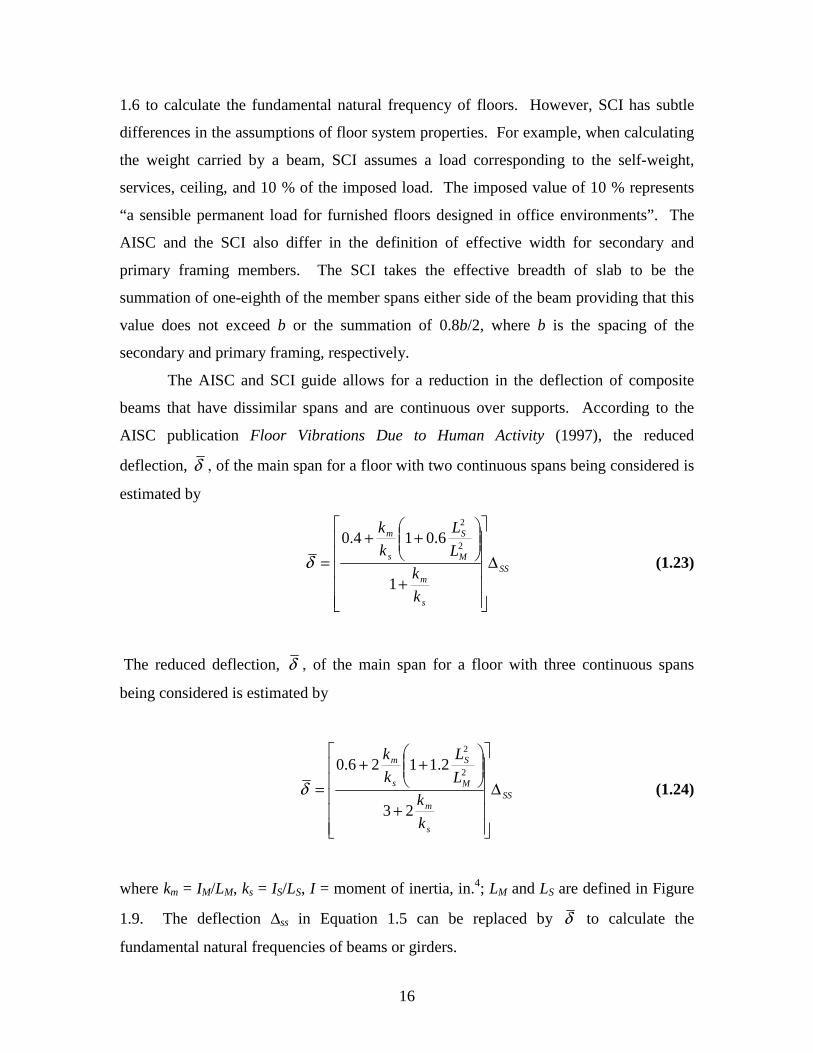
The AISC and SCI guide allows for a reduction in the deflection of composite
beams that have dissimilar spans and are continuous over supports. According to the
AISC publication Floor Vibrations Due to Human Activity (1997), the reduced
deflection, δ , of the main span for a floor with two continuous spans being considered is
estimated by
SS
s
m
M
S
s
m
k
k
L
L
k
k
∆
+
++
=1
6.014.02
2
δ (1.23)
The reduced deflection, δ , of the main span for a floor with three continuous spans
being considered is estimated by
SS
s
m
M
S
s
m
k
k
L
L
k
k
∆
+
++
=23
2.1126.02
2
δ (1.24)
where km = IM/LM, ks = IS/LS, I = moment of inertia, in.4; LM and LS are defined in Figure
1.9. The deflection ∆ss in Equation 1.5 can be replaced by δ to calculate the
fundamental natural frequencies of beams or girders.
17
(a) Two Continuous Spans (b) Three Continuous Spans
Figure 1.9 – Modal Deflection of Beams (AISC Design Guide 11 1997)
Another difference between the AISC and SCI techniques is that SCI considers
the deflection of the composite slab when calculating the fundamental frequency of the
entire floor system. Dunkerly’s approximation becomes
2222
1111
slabgjnffff
++= (1.25)
where fslab = frequency of composite slab, Hz; and fn, fj, and fg are as described previously.
In composite construction, the slab is much stiffer than the beam or girder. Therefore, in
many analyses of floor systems, the frequency of the slab may be neglected.
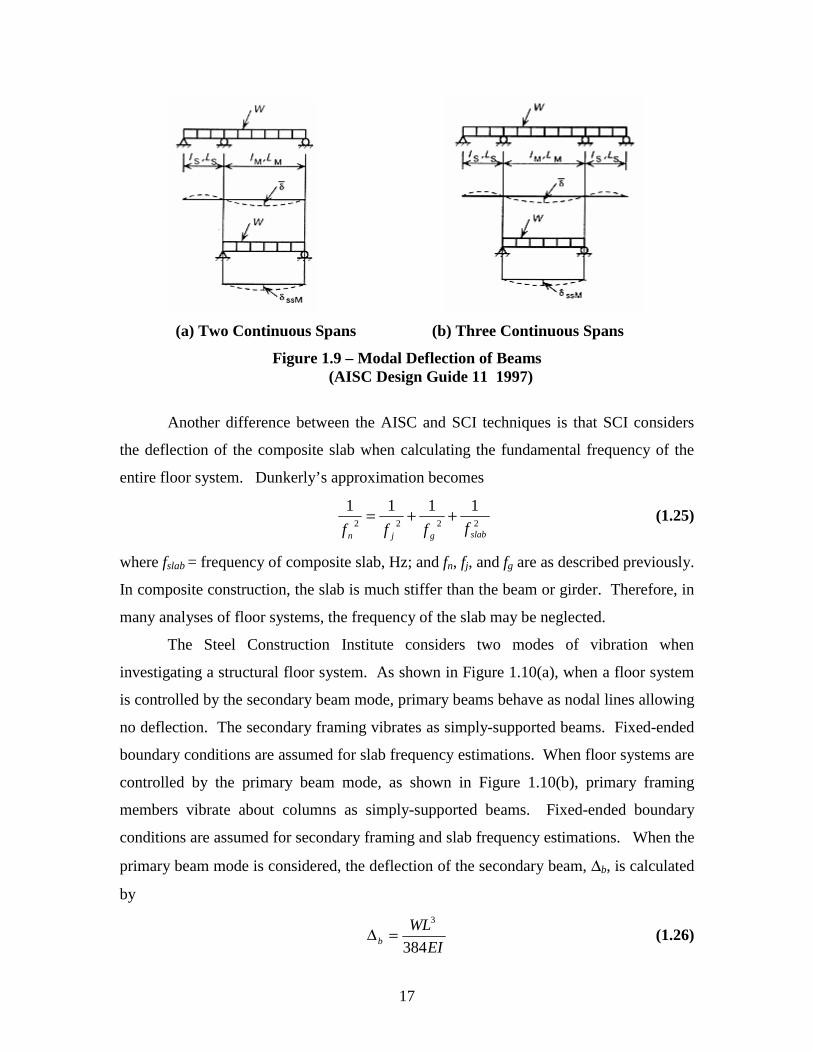
The Steel Construction Institute considers two modes of vibration when
investigating a structural floor system. As shown in Figure 1.10(a), when a floor system
is controlled by the secondary beam mode, primary beams behave as nodal lines allowing
no deflection. The secondary framing vibrates as simply-supported beams. Fixed-ended
boundary conditions are assumed for slab frequency estimations. When floor systems are
controlled by the primary beam mode, as shown in Figure 1.10(b), primary framing
members vibrate about columns as simply-supported beams. Fixed-ended boundary
conditions are assumed for secondary framing and slab frequency estimations. When the
primary beam mode is considered, the deflection of the secondary beam, ∆b, is calculated
by
EI
WLb 384
3
=∆ (1.26)
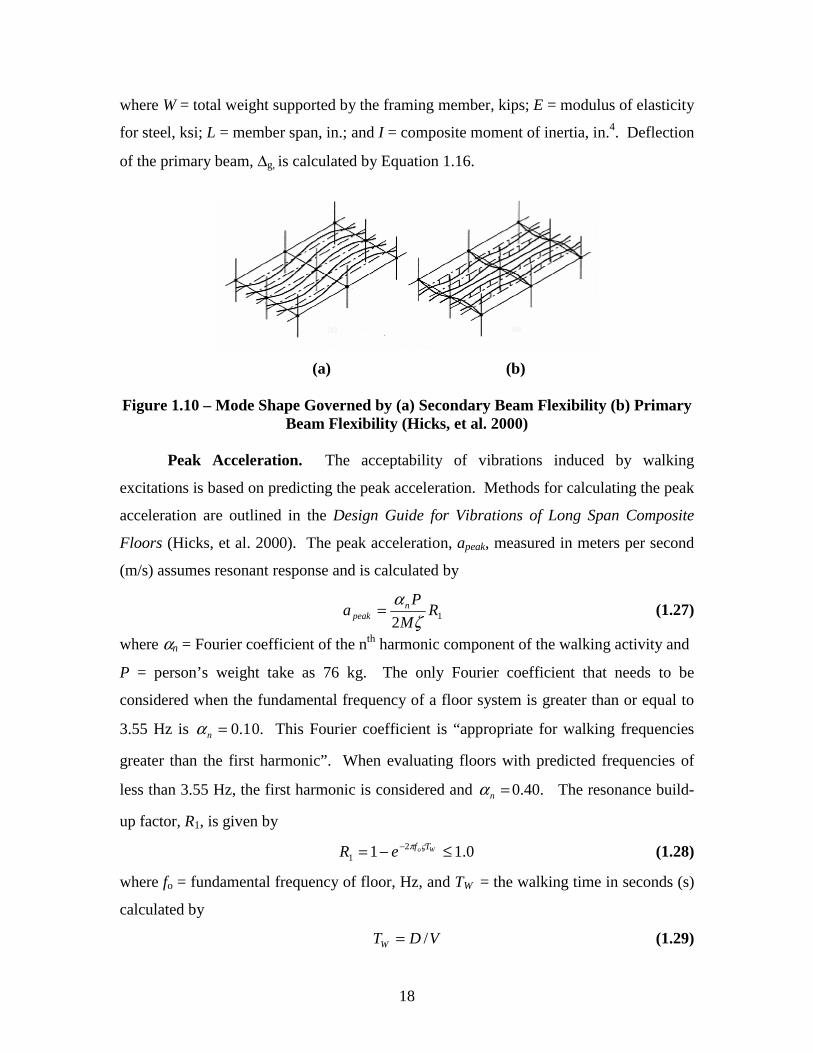
18
where W = total weight supported by the framing member, kips; E = modulus of elasticity
for steel, ksi; L = member span, in.; and I = composite moment of inertia, in.4. Deflection
of the primary beam, ∆g, is calculated by Equation 1.16.
(a) (b)
Figure 1.10 – Mode Shape Governed by (a) Secondary Beam Flexibility (b) Primary Beam Flexibility (Hicks, et al. 2000)
Peak Acceleration. The acceptability of vibrations induced by walking
excitations is based on predicting the peak acceleration. Methods for calculating the peak
acceleration are outlined in the Design Guide for Vibrations of Long Span Composite
Floors (Hicks, et al. 2000). The peak acceleration, apeak, measured in meters per second
(m/s) assumes resonant response and is calculated by
12R
M
Pa n
peak ζα
= (1.27)
where αn = Fourier coefficient of the nth harmonic component of the walking activity and
P = person’s weight take as 76 kg. The only Fourier coefficient that needs to be
considered when the fundamental frequency of a floor system is greater than or equal to
3.55 Hz is 1.0=nα 0. This Fourier coefficient is “appropriate for walking frequencies
greater than the first harmonic”. When evaluating floors with predicted frequencies of
less than 3.55 Hz, the first harmonic is considered and =nα 0.40. The resonance build-
up factor, R1, is given by
0.11 21 ≤−= − Wo TfeR ςπ (1.28)
where fo = fundamental frequency of floor, Hz, and TW = the walking time in seconds (s)
calculated by
VDTW /= (1.29)
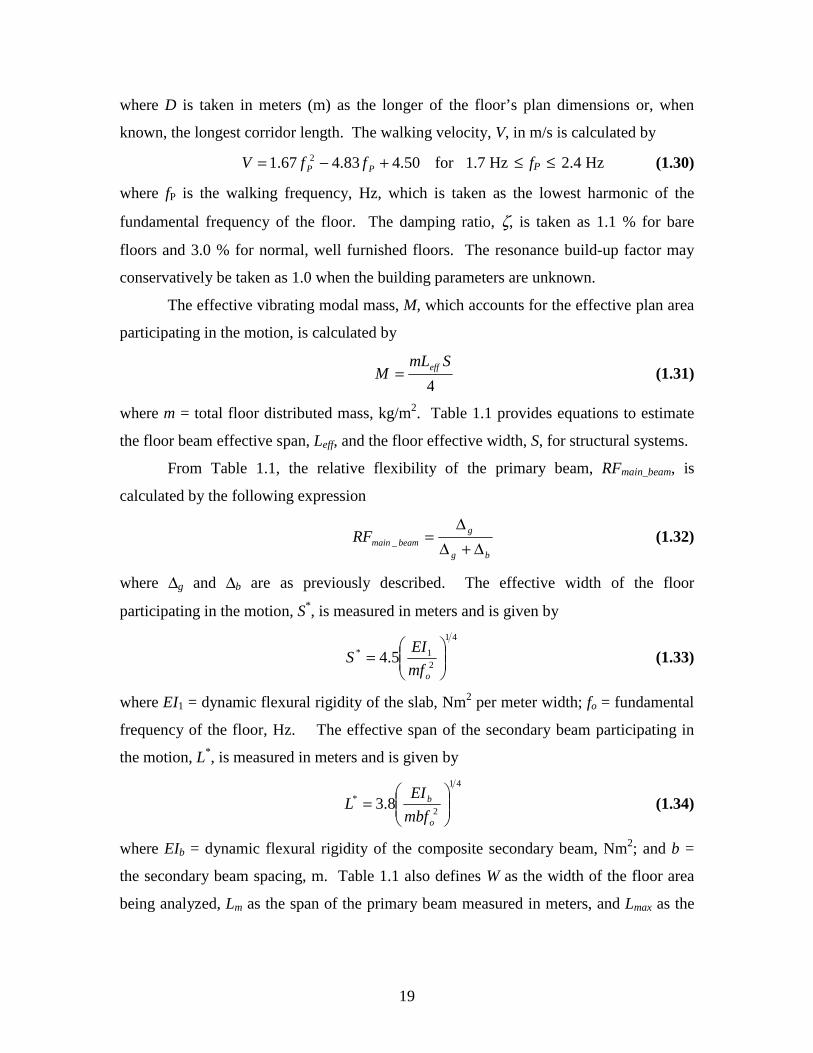
19
where D is taken in meters (m) as the longer of the floor’s plan dimensions or, when
known, the longest corridor length. The walking velocity, V, in m/s is calculated by
50.483.467.1 2 +−= PP ffV for 1.7 Hz ≤ fP ≤ 2.4 Hz (1.30)
where fP is the walking frequency, Hz, which is taken as the lowest harmonic of the
fundamental frequency of the floor. The damping ratio, ζ, is taken as 1.1 % for bare
floors and 3.0 % for normal, well furnished floors. The resonance build-up factor may
conservatively be taken as 1.0 when the building parameters are unknown.
The effective vibrating modal mass, M, which accounts for the effective plan area
participating in the motion, is calculated by
4
SmLM eff= (1.31)
where m = total floor distributed mass, kg/m2. Table 1.1 provides equations to estimate
the floor beam effective span, Leff, and the floor effective width, S, for structural systems.
From Table 1.1, the relative flexibility of the primary beam, RFmain_beam, is
calculated by the following expression
bg
gbeammainRF
∆+∆∆
=_ (1.32)
where ∆g and ∆b are as previously described. The effective width of the floor
participating in the motion, S*, is measured in meters and is given by
41
21* 5.4
=
omf
EIS (1.33)
where EI1 = dynamic flexural rigidity of the slab, Nm2 per meter width; fo = fundamental
frequency of the floor, Hz. The effective span of the secondary beam participating in
the motion, L*, is measured in meters and is given by
41
2* 8.3
=
o
b
mbf
EIL (1.34)
where EIb = dynamic flexural rigidity of the composite secondary beam, Nm2; and b =
the secondary beam spacing, m. Table 1.1 also defines W as the width of the floor area
being analyzed, Lm as the span of the primary beam measured in meters, and Lmax as the
20
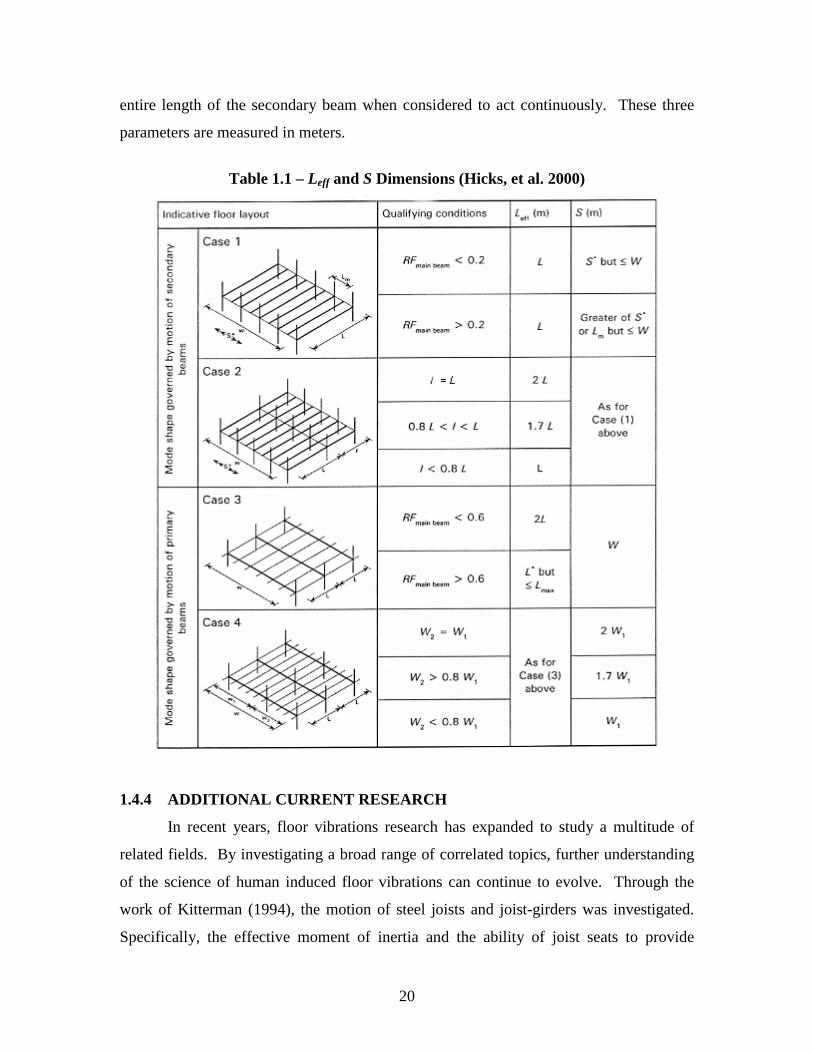
entire length of the secondary beam when considered to act continuously. These three
parameters are measured in meters.
Table 1.1 – Leff and S Dimensions (Hicks, et al. 2000)
1.4.4 ADDITIONAL CURRENT RESEARCH
In recent years, floor vibrations research has expanded to study a multitude of
related fields. By investigating a broad range of correlated topics, further understanding
of the science of human induced floor vibrations can continue to evolve. Through the
work of Kitterman (1994), the motion of steel joists and joist-girders was investigated.
Specifically, the effective moment of inertia and the ability of joist seats to provide
21
composite behavior were explored. Kitterman derived equations for estimating the
effective moment of inertia of framing members as a result of many tests of floor
systems. Rottmann (1996) studied the use of tuned mass dampers for retrofitting floor
systems with motion problems. The use of finite element analyses for predicting floor
behavior was conducted by Band (1996), Beavers (1998), and Sladki (1999). Finite
element analyses proved to be an effective tool in approximating the fundamental natural
frequency of a floor. However, the studies also found that peak accelerations of floors
cannot be predicted accurately using finite element techniques. Warmoth (2002) also
investigated the girder moment of inertia in relation to floor vibrations. Warmoth
recognized that different joist-seat connections vary in stiffness and proposed a new
calculation for girder effective moment of inertia based on these findings. Through the
work of Jackson (2002), floor motion properties of castellated beams were examined.
Castellated beams have web openings creating non-prismatic cross sections. Jackson
concluded that the composite moment of inertia should be calculated using the net
moment of inertia for floor member properties.
1.5 NEED FOR RESEARCH
The dynamics of floors systems are changing with currents trends in design using
lightweight, high-strength materials, and office fit-outs. Properties and vibrations
behavior change due to less damping, stiffness, and mass provided by the floors.
Therefore, past assumptions and methodology become out dated and floor vibrations
research must continue to evolve. Analyses of existing floors are important for
investigating more accurate techniques to improve the correlation between predicted and
observed floor behavior. Examining case studies of floor systems can provide insight on
the accuracy of the various prediction criteria. The focus of this research is divided into
three topics in which case studies of existing floors are evaluated. In Chapter II, the
fundamental natural frequencies of floor systems with various framing are studied. The
measured and predicted bay, beam, and girder frequencies are scrutinized. Four
acceptability criteria for analyzing existing occupied floors in the United States are
compared in Chapter III. The criteria are then evaluated with field subjective analyses of
the floors. The AISC and SCI methods on predicting floor motion are compared in
22
Chapter IV. Conclusions are made and continued research is proposed in Chapter V
based on the findings from each study. Supplemental material in the publication by
Boice and Murray (2003) for this report contains summary sheets of the case studies used
in the frequency and criteria comparisons. These sheets include floor systems properties
such as damping, framing, loading, predicted and measured fundamental frequencies,
accelerations, and slab properties. In addition, framing plans for the floor systems
evaluated in this study are found in the supplemental material. Appendix A contains the
example calculations of frequencies and acceptability criteria based on the AISC and SCI
methods.
23
CHAPTER II – NATURAL FREQUENCY STUDY
2.1 INTRODUCTION
Analyzing actual floor systems that are occupied or under construction provides
insight into the behavior of vibrations induced by walking excitations. The fundamental
natural frequency is an important property needed to predict the response of a floor.
Therefore, the natural frequencies for floor systems of various framing are examined in
this chapter. Correlation between predicted and measured response can be improved by
comparing structural system frequencies.
This chapter provides a comparison of predicted and measured frequencies from
103 case studies involving floors occupied and or currently being constructed in the
United States and the United Kingdom. The type of framing used differentiates the
structural floor systems. The classifications for framing are “hot-rolled beams”, “hot-
rolled girders with joists”, “hot-rolled girders with castellated beams”, and “joist girders
with joists”. The controlling girder, which allows the most deflection corresponding to
the lower frequency, is considered when classifying a floor system when two different
types of girders are used in the framing.
The measured frequency was determined from the response of a floor system due
to heel drops, walking, and ambient conditions. For ambient measurements, the
frequency is measured without any excitation to the floor. An ONO SOKKI CF-1200
Handheld FFT Analyzer and seismic accelerometer was primarily used in the most recent
case studies to measure natural frequencies as a result of excitations administered at the
center of selected bays. This FFT analyzer is accurate to within 0.25 Hz.
The framing systems were modeled using the design software FLOORVIB2
(Murray and Elhouar 1994) in order to predict the fundamental natural frequency. The
FLOORVIB2 software is based on the AISC Design Guide. In addition, the frequencies
are also predicted using the methods outlined in the SCI Publication Design Guide on the
24
Vibration of Floors, (Wyatt 1989). The predicted beam, girder, and bay frequencies are
then compared to the measured frequencies.
Supplemental material for this report is found in the publication by Boice and
Murray (2003) and contains summary sheets of the case studies used in the frequency and
criteria comparisons. These sheets include floor systems properties such as damping,
framing, loading, predicted and measured fundamental frequencies, accelerations, and
slab properties. In addition, the supplemental material contains framing plans for the
floor systems evaluated in this chapter. Appendix A contains sample calculations of
beam, girder, and bay frequencies. The following sections of this chapter include the
frequency comparison using the Design Guide and SCI methods, followed by a summary
of AISC and SCI predicted bay frequencies. In addition, this chapter includes vibration
properties for floors that were tested in Europe. The final section of this chapter provides
conclusions and recommendations.
2.2 AISC FREQUENCY COMPARISONS
This section presents the results from comparisons between measured bay
frequencies and predicted beam, joist, girder, and system frequencies. The predicted
frequencies are calculated using the methods outlined in the AISC Design Guide. The
floors are classified and compared by the framing used in the structural system. The bay
or system frequency is predicted using Dunkerly’s relationship, Equation 1.12. In
addition, system frequencies estimated using modifications to Dunkerly’s equation are
compared with measured frequencies. These modifications raise the powers of the
system properties to 4 and 6. The following relationships reflect the revisions,
444
111
gjn fff+= (2.1)
666
111
gjn fff+= (2.2)
where fn = system frequency, fj= beam or joist frequency, fg = girder frequency, measured
in Hz.
In the following sections, Tables 2.1 through 2.4 provide predicted and measured
frequencies as well as frequency ratios for each type of framing. The girders are assumed
25
to be infinitely rigid for some of the case studies. Therefore, the girders that do not
participate in the motion of the floor are modeled as walls in the FLOORVIB2 software.
Tables 2.1 through 2.4 have the phrase “N/A” or not applicable when the girder
frequency is not used in the comparison. In Tables 2.1 through 2.4, measured bay
frequencies are compared with predicted bay frequencies. In the comparisons that
follow, fn from equations 1.12, 2.1, and 2.2 will be referred to as fn2, fn
4, and fn6,
respectively. In addition, measured system frequencies are compared with predicted
beam and girder frequencies in these tables. Figures 2.1 through 2.5 in the following
sections graphically show measured bay frequencies versus predicted frequencies. In
these figures, the abbreviation “H-R” describes hot-rolled framing, “H-R/J” describes
framing with hot-rolled girders and joists, “J-G/J” describes framing with joist girders
and joists, and “H-R/Cast.” describes framing with hot-rolled girders and castellated
beams. Also, in Figures 2.1 through 2.5, the solid line represents when the predicted
frequency is equal to the measured frequency. The dashed lines located above and below
the solid line represent a range of predicted frequencies within 10 % of the measured
frequencies.
2.2.1 FLOORS WITH HOT-ROLLED SHAPES
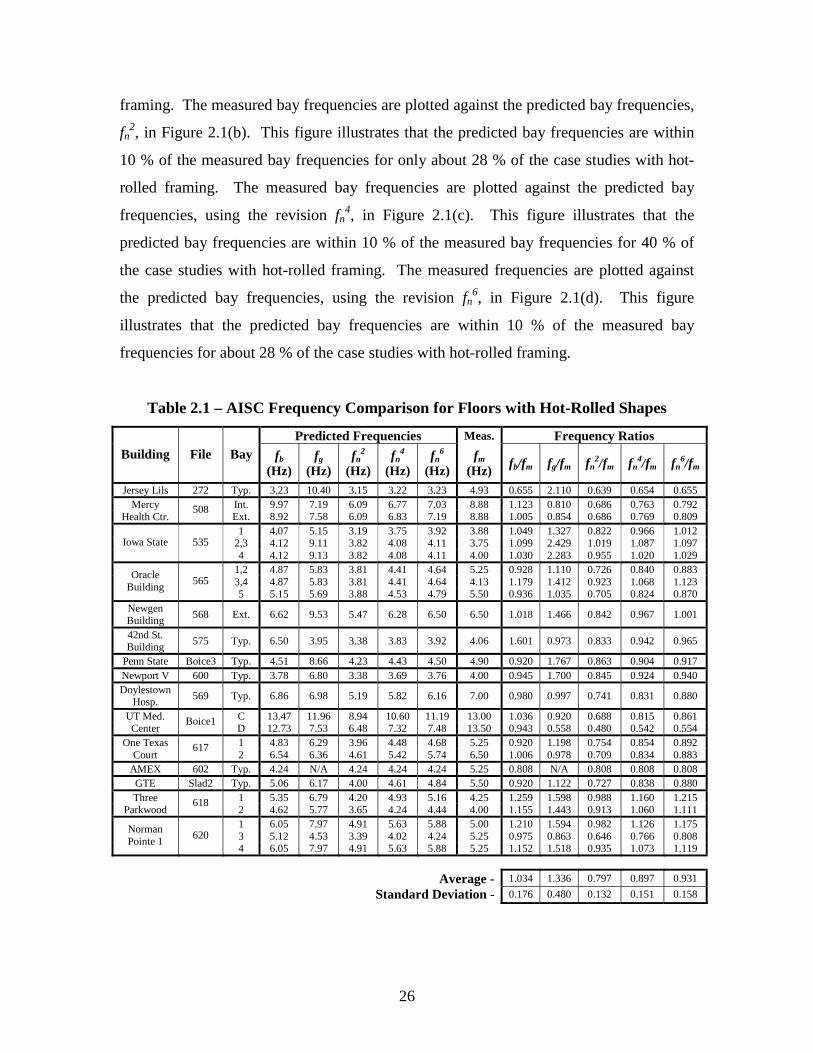
Table 2.1 summarizes the results from the frequency comparisons for floors that
are constructed of hot-rolled framing. From Table 2.1, the average ratio between
predicted beam and measured frequencies (fb/fm) is 1.03 with a modest standard deviation
of 0.18. The ratio comparing predicted girder and measured frequencies demonstrates
that the girder does not solely control the floor behavior. The fg/fm ratio is 1.34 with a
standard deviation of 0.48. The average ratio of predicted bay frequency to measured
frequency (fn2/fm) is 0.80 with a standard deviation of 0.13. The comparison between
measured and predicted bay frequencies, fn4 and fn
6, provides better correlations than
estimations using fn2. The average fn
4/fm ratio is 0.90 with a standard deviation of 0.15.
The average fn6/fm ratio is 0.93 with a standard deviation of 0.16.
The measured bay frequencies are plotted against the predicted beam frequencies
in Figure 2.1(a). This figure illustrates that the predicted beam frequencies are within 10
% of the measured bay frequencies for about 64 % of the case studies with hot-rolled
26
framing. The measured bay frequencies are plotted against the predicted bay frequencies,
fn2, in Figure 2.1(b). This figure illustrates that the predicted bay frequencies are within
10 % of the measured bay frequencies for only about 28 % of the case studies with hot-
rolled framing. The measured bay frequencies are plotted against the predicted bay
frequencies, using the revision fn4, in Figure 2.1(c). This figure illustrates that the
predicted bay frequencies are within 10 % of the measured bay frequencies for 40 % of
the case studies with hot-rolled framing. The measured frequencies are plotted against
the predicted bay frequencies, using the revision fn6, in Figure 2.1(d). This figure
illustrates that the predicted bay frequencies are within 10 % of the measured bay
frequencies for about 28 % of the case studies with hot-rolled framing.
Table 2.1 – AISC Frequency Comparison for Floors with Hot-Rolled Shapes
Predicted Frequencies Meas. Frequency Ratios Building File Bay fb
(Hz) fg
(Hz) fn
2 (Hz)
fn4
(Hz) fn
6 (Hz)
fm (Hz)
fb/fm fg/fm fn2/fm fn
4/fm fn6/fm
Jersey Lils 272 Typ. 3.23 10.40 3.15 3.22 3.23 4.93 0.655 2.110 0.639 0.654 0.655 Int. 9.97 7.19 6.09 6.77 7.03 8.88 1.123 0.810 0.686 0.763 0.792 Mercy
Health Ctr. 508
Ext. 8.92 7.58 6.09 6.83 7.19 8.88 1.005 0.854 0.686 0.769 0.809 1 4.07 5.15 3.19 3.75 3.92 3.88 1.049 1.327 0.822 0.966 1.012
2,3 4.12 9.11 3.82 4.08 4.11 3.75 1.099 2.429 1.019 1.087 1.097 Iowa State 535 4 4.12 9.13 3.82 4.08 4.11 4.00 1.030 2.283 0.955 1.020 1.029
1,2 4.87 5.83 3.81 4.41 4.64 5.25 0.928 1.110 0.726 0.840 0.883 3,4 4.87 5.83 3.81 4.41 4.64 4.13 1.179 1.412 0.923 1.068 1.123
Oracle Building
565 5 5.15 5.69 3.88 4.53 4.79 5.50 0.936 1.035 0.705 0.824 0.870
Newgen Building
568 Ext. 6.62 9.53 5.47 6.28 6.50 6.50 1.018 1.466 0.842 0.967 1.001
42nd St. Building
575 Typ. 6.50 3.95 3.38 3.83 3.92 4.06 1.601 0.973 0.833 0.942 0.965
Penn State Boice3 Typ. 4.51 8.66 4.23 4.43 4.50 4.90 0.920 1.767 0.863 0.904 0.917 Newport V 600 Typ. 3.78 6.80 3.38 3.69 3.76 4.00 0.945 1.700 0.845 0.924 0.940 Doylestown
Hosp. 569 Typ. 6.86 6.98 5.19 5.82 6.16 7.00 0.980 0.997 0.741 0.831 0.880
C 13.47 11.96 8.94 10.60 11.19 13.00 1.036 0.920 0.688 0.815 0.861 UT Med. Center
Boice1 D 12.73 7.53 6.48 7.32 7.48 13.50 0.943 0.558 0.480 0.542 0.554 1 4.83 6.29 3.96 4.48 4.68 5.25 0.920 1.198 0.754 0.854 0.892 One Texas
Court 617
2 6.54 6.36 4.61 5.42 5.74 6.50 1.006 0.978 0.709 0.834 0.883 AMEX 602 Typ. 4.24 N/A 4.24 4.24 4.24 5.25 0.808 N/A 0.808 0.808 0.808 GTE Slad2 Typ. 5.06 6.17 4.00 4.61 4.84 5.50 0.920 1.122 0.727 0.838 0.880
1 5.35 6.79 4.20 4.93 5.16 4.25 1.259 1.598 0.988 1.160 1.215 Three Parkwood
618 2 4.62 5.77 3.65 4.24 4.44 4.00 1.155 1.443 0.913 1.060 1.111 1 6.05 7.97 4.91 5.63 5.88 5.00 1.210 1.594 0.982 1.126 1.175 3 5.12 4.53 3.39 4.02 4.24 5.25 0.975 0.863 0.646 0.766 0.808
Norman Pointe 1
620 4 6.05 7.97 4.91 5.63 5.88 5.25 1.152 1.518 0.935 1.073 1.119
Average - 1.034 1.336 0.797 0.897 0.931
Standard Deviation - 0.176 0.480 0.132 0.151 0.158
27
Figure 2.1 – Measured Bay Frequencies vs. AISC Predicted Frequencies for Floors with Hot-Rolled Shapes
0
2
4
6
8
10
12
14
16
0 2 4 6 8 10 12 14 16
Predicted f beam , Hz
Mea
sure
d B
ay f m
eas.,H
z
(a) Measured Bay Frequency vs. AISC
Predicted Beam Frequency
0
2
4
6
8
10
12
14
16
0 2 4 6 8 10 12 14 16
Predicted f n2 , Hz
Mea
sure
d B
ay f m
eas.,H
z
(b) Measured Bay Frequency vs. AISC Predicted Bay Frequency ( 2
nf )
0
2
4
6
8
10
12
14
16
0 2 4 6 8 10 12 14 16
Predicted f n4 , Hz
Mea
sure
d B
ay f m
eas.,H
z
(c) Measured Bay Frequency vs. AISC
Predicted Bay Frequency ( 4nf )
0
2
4
6
8
10
12
14
16
0 2 4 6 8 10 12 14 16
Predicted f n6 , Hz
Mea
sure
d B
ay f m
eas.,H
z
(d) Measured Bay Frequency vs. AISC
Predicted Bay Frequency ( 6nf )
28
2.2.2 FLOORS WITH HOT-ROLLED GIRDERS AND JOISTS
Table 2.2 summarizes the results from the frequency comparison for floors that
are constructed of hot-rolled girders and joist framing. From Table 2.2, the average ratio
between predicted beam and measured frequencies (fb/fm) is 1.06 with a standard
deviation of 0.25. The fg/fm ratio is 1.67 with a high standard deviation of 0.60. The
average ratio of predicted bay frequency to measured frequency (fn2/fm) is 0.90 with a
standard deviation of 0.20. The comparison between measured and predicted bay
frequencies, fn4and fn
6, provides more reliable correlations than estimations using fn2. The
average fn4/fm ratio is 0.98 with a standard deviation of 0.21. The average fn
6/fm ratio is
1.00 with a standard deviation of 0.22.
Table 2.2 – AISC Frequency Comparison for Hot-Rolled Girders and Joists
Predicted Frequencies Meas. Frequency Ratios
Building File Bay fb
(Hz) fg
(Hz) fn
2 (Hz)
fn4
(Hz) fn
6 (Hz)
fm (Hz) fb/fm fg/fm fn
2/fm fn4/fm fn
6/fm
Premiere 351 1 10.67 7.08 5.90 6.77 6.98 6.00 1.778 1.180 0.983 1.129 1.164
4 6.58 12.57 5.97 6.46 6.56 4.50 1.462 2.793 1.327 1.436 1.457
5 6.58 10.41 5.75 6.34 6.51 4.50 1.462 2.313 1.278 1.409 1.447 Patterson Ave. Fac.
549
7 5.51 7.51 4.68 5.17 5.38 4.50 1.224 1.669 1.040 1.149 1.195
1 7.10 7.57 5.36 6.15 6.51 7.50 0.947 1.009 0.715 0.820 0.868 4 7.10 7.57 5.36 6.15 6.51 8.50 0.835 0.891 0.631 0.724 0.766
Orange Synagogue
349 5 7.10 7.57 5.36 6.15 6.51 8.00 0.888 0.946 0.670 0.769 0.814
ACTIC 341 Typ. 6.21 12.40 5.64 6.12 6.19 6.50 0.955 1.908 0.868 0.941 0.953 271 6.16 10.98 5.65 6.02 6.13 7.00 0.880 1.569 0.807 0.859 0.876 Camron
Univ. 514
273 5.88 10.50 5.39 5.74 5.85 6.75 0.871 1.556 0.799 0.851 0.867 Melroe 508 Typ. 5.46 5.28 3.80 4.51 4.78 5.50 0.993 0.960 0.691 0.820 0.869
Mezz. 5.25 4.92 3.59 4.26 4.51 4.75 1.105 1.036 0.756 0.898 0.950 Steel Case 570 Int. 5.25 4.02 3.19 3.73 3.90 4.75 1.105 0.846 0.672 0.786 0.821 A 5.23 9.29 4.76 5.11 5.20 5.00 1.046 1.858 0.952 1.021 1.041 UT Med. Boice1 B 5.22 9.16 4.73 5.22 5.22 4.75 1.099 1.928 0.996 1.099 1.099
IQ/ Ford 615 Typ. 5.31 5.96 3.97 4.70 4.96 4.75 1.118 1.255 0.836 0.989 1.045 XILINX 609 Typ. 5.05 6.06 3.93 4.58 4.81 4.75 1.063 1.276 0.827 0.964 1.013
1 5.16 N/A 5.16 5.16 5.16 5.25 0.983 N/A 0.983 0.983 0.983 2 5.26 N/A 5.26 5.26 5.26 5.25 1.002 N/A 1.002 1.002 1.002
CO Civic Center
610 3 4.70 N/A 4.70 4.70 4.70 5.50 0.855 N/A 0.855 0.855 0.855
Gateway Boice2 Typ. 2.52 4.07 2.22 2.44 2.50 4.00 0.630 1.018 0.555 0.609 0.624 2nd. 4.49 10.50 4.26 4.45 4.49 4.25 1.056 2.471 1.002 1.048 1.055 Ruby
Tuesday Slad1
3rd. 3.86 10.56 3.72 3.84 3.86 3.75 1.029 2.816 0.992 1.025 1.029 Midwest
Kentworth Band3 Typ. 4.04 N/A 4.04 4.04 4.04 5.75 0.703 N/A 0.703 0.703 0.703
1,4 4.04 8.09 3.77 3.98 4.03 3.85 1.049 2.101 0.979 1.034 1.047 2,6 3.53 8.09 3.36 3.50 3.53 5.00 0.706 1.618 0.672 0.700 0.705 3 3.53 8.09 3.36 3.50 3.53 3.90 0.905 2.074 0.862 0.897 0.904
Nations Bank
Band4
5 4.04 8.09 3.77 3.98 4.03 3.40 1.188 2.379 1.109 1.170 1.185 2 7.61 10.82 6.22 7.20 7.47 5.25 1.450 2.061 1.185 1.372 1.422 Eight
Parkwood 618
6 7.61 10.82 6.22 7.20 7.47 5.50 1.384 1.967 1.131 1.310 1.358
Average - 1.059 1.673 0.896 0.979 1.004
Standard Deviation - 0.252 0.602 0.195 0.214 0.218
29
Figure 2.2 – Measured Bay Frequencies vs. AISC Predicted Frequencies for Floors with Hot-Rolled Girders and Joists
0
2
4
6
8
10
12
14
16
0 2 4 6 8 10 12 14 16
Predicted f beam , Hz
Mea
sure
d Sy
stem
f mea
s.,H
z
(a) Measured Bay Frequency vs. AISC
Predicted Beam Frequency
0
2
4
6
8
10
12
14
16
0 2 4 6 8 10 12 14 16
Predicted f n2 , Hz
Mea
sure
d Sy
stem
f mea
s.,H
z(b) Measured System Frequency vs. AISC
Predicted Bay Frequency ( 2nf )
0
2
4
6
8
10
12
14
16
0 2 4 6 8 10 12 14 16
Predicted f n4 , Hz
Mea
sure
d Sy
stem
f mea
s.,H
z
(c) Measured System Frequency vs. AISC
Predicted Bay Frequency ( 4nf )
0
2
4
6
8
10
12
14
16
0 2 4 6 8 10 12 14 16
Predicted f n6 , Hz
Mea
sure
d B
ay f m
eas.,H
z
(d) Measured Bay Frequency vs. AISC
Predicted Bay Frequency ( 6nf )
0
2
4
6
8
10
12
14
16
0 2 4 6 8 10 12 14 16
Predicted f beam , Hz
Mea
sure
d B
ay f m
eas.,H
z
(a) Measured Bay Frequency vs. AISC
Predicted Beam Frequency
0
2
4
6
8
10
12
14
16
0 2 4 6 8 10 12 14 16
Predicted f n2 , Hz
Mea
sure
d B
ay f m
eas.,H
z
(b) Measured Bay Frequency vs. AISC Predicted Bay Frequency ( 2
nf )
0
2
4
6
8
10
12
14
16
0 2 4 6 8 10 12 14 16
Predicted f n4 , Hz
Mea
sure
d B
ay f m
eas.,H
z
(c) Measured Bay Frequency vs. AISC
Predicted Bay Frequency ( 4nf )
30
The measured bay frequencies are plotted against the predicted beam frequencies
in Figure 2.2(a). This figure illustrates that the predicted beam frequencies are within 10
% of the measured bay frequencies for only about 40 % of the case studies with hot-
rolled girders and joist framing. The measured bay frequencies are plotted against the
predicted bay frequencies, fn2, in Figure 2.2(b). This figure illustrates that the predicted
bay frequencies are within 10 % of the measured bay frequencies for only about 30 % of
the case studies with hot-rolled girders and joist framing. The measured bay frequencies
are plotted against the predicted bay frequencies, using the revision fn4, in Figure 2.2(c).
This figure reveals that the predicted bay frequencies are within 10 % of the measured
bay frequencies for about 33 % of the case studies with hot-rolled girders and joist
framing. The measured frequencies are plotted against the predicted bay frequencies,
using the revision fn6, in Figure 2.2(d). This figure illustrates that the predicted bay
frequencies are within 10 % of the measured bay frequencies for about 40 % of the case
studies with hot-rolled girders and joist framing.
2.2.3 FLOORS WITH JOIST GIRDERS AND JOISTS
Table 2.3 summarizes the results from the frequency comparison for floors that
are constructed using joist girders and joist framing. From Table 2.3, the average ratio
between predicted beam and measured frequencies (fb/fm) is 1.00 with a modest standard
deviation of 0.23. The ratio comparing predicted girder and measured frequencies
reveals that the primary framing may control the floor behavior for some case studies
using this particular framing. The fg/fm ratio is 1.00 with a standard deviation of 0.24.
The average ratio of predicted bay frequency to measured frequency (fn2/fm) is 0.76 with a
standard deviation of 0.17. The comparison between measured and predicted system
frequencies, fn4 and fn
6, provides more reliable correlations than estimations using fn2.
The average fn4/fm ratio is 0.84 with a standard deviation of 0.17. The average fn
6/fm ratio
is 0.87 with a standard deviation of 0.18.
The measured bay frequencies are plotted against the predicted beam frequencies
in Figure 2.3(a). This figure illustrates that the predicted beam frequencies are within 10
% of the measured bay frequencies for only about 39 % of the case studies using joist
girders and joists for framing. The measured bay frequencies are plotted against the
31
predicted bay frequencies, fn2, in Figure 2.3(b). This figure illustrates that the predicted
bay frequencies are within 10 % of the measured bay frequencies for only about 18 % of
the case studies using joist girders and joists for framing. The measured bay frequencies
are plotted against the predicted bay frequencies, using the revision fn4, in Figure 2.3(c).
This figure illustrates that the predicted bay frequencies are within 10 % of the measured
bay frequencies for about 29 % of the case studies using joist girders and joists for
framing. The measured frequencies are plotted against the predicted bay frequencies,
using the revision fn6, in Figure 2.3(d). This figure illustrates that the predicted bay
frequencies are within 10 % of the measured bay frequencies for about 32 % of the case
studies using joist girders and joists for framing.
Table 2.3 – AISC Frequency Comparison for Floors with Joist Girders and Joists
Predicted Frequencies Meas. Frequency Ratios
Building File Bay fb
(Hz) fg
(Hz) fn
2 (Hz)
fn4
(Hz) fn
6 (Hz)
fm (Hz) fb/fm fg/fm fn
2/fm fn4/fm fn
6/fm
1--4 7.23 6.22 4.72 5.58 5.88 5.65 1.280 1.101 0.835 0.987 1.040 5,10 6.86 4.99 4.03 4.69 4.88 4.75 1.444 1.051 0.848 0.988 1.027
9 7.62 6.63 5.00 5.92 6.24 7.04 1.082 0.942 0.710 0.841 0.887 Z.C.M.I.
Store 269
7,8,11 7.23 6.22 4.72 5.58 5.88 5.11 1.415 1.217 0.924 1.091 1.150
Patterson 549 6 6.04 6.10 4.67 5.10 5.41 5.00 1.208 1.220 0.934 1.021 1.081
Toyota 481 Typ. 4.94 8.02 4.53 4.78 4.90 5.63 0.877 1.425 0.805 0.848 0.870 Int. 6.25 4.52 3.66 4.25 4.42 6.25 1.000 0.723 0.586 0.681 0.707 Garmin
Int. Bldg. 506
Ext. 6.25 4.52 3.66 4.25 4.42 6.25 1.000 0.723 0.586 0.681 0.707 Sony Corp. 511 Typ. 5.47 4.44 3.45 4.06 4.26 5.50 0.995 0.807 0.627 0.738 0.774
Ext.-1 6.12 6.45 4.44 5.28 5.59 5.75 1.064 1.122 0.772 0.918 0.971 Ext.-2 4.71 5.00 3.43 4.07 4.31 5.00 0.942 1.000 0.686 0.815 0.862 Int.-1 9.52 7.29 5.79 6.77 7.07 9.50 1.002 0.767 0.609 0.713 0.744
Diversa Building
568
Int.-2 7.24 5.57 4.42 5.17 5.40 13.00 0.557 0.428 0.340 0.397 0.415 Pacific Tech.
568 Typ. 6.14 6.71 4.53 5.38 5.69 6.00 1.023 1.118 0.755 0.896 0.948
IBM 605 Typ. 6.78 N/A 6.78 6.78 6.78 6.00 1.130 N/A 1.130 1.130 1.130 2 5.54 6.67 4.48 5.03 5.28 6.25 0.886 1.067 0.717 0.804 0.845
5,7 5.54 6.67 4.48 5.03 5.28 6.75 0.821 0.988 0.664 0.745 0.783 Southern
Bell Band1
9 7.58 6.79 5.22 6.00 6.33 9.50 0.798 0.715 0.549 0.631 0.667 1 2.45 N/A 2.45 2.45 2.45 3.50 0.700 N/A 0.700 0.700 0.700 3 2.53 N/A 2.53 2.53 2.53 4.25 0.595 N/A 0.595 0.595 0.595
Wholesale Grocers
Band2 5 2.03 N/A 2.03 2.03 2.03 3.00 0.677 N/A 0.677 0.677 0.677 1 6.11 5.89 4.24 5.04 5.34 5.25 1.164 1.122 0.808 0.960 1.017 3 6.11 6.10 4.32 5.13 5.44 5.75 1.063 1.061 0.751 0.893 0.946
Eight Parkwood
618 4,5 6.11 5.89 4.24 5.04 5.34 4.50 1.358 1.309 0.942 1.120 1.186 1 8.54 N/A 8.54 8.54 8.54 9.50 0.899 N/A 0.899 0.899 0.899 2 8.54 N/A 8.54 8.54 8.54 9.75 0.876 N/A 0.876 0.876 0.876 3 9.61 N/A 9.61 9.61 9.61 9.75 0.986 N/A 0.986 0.986 0.986
R.S.I. Building
621
4 6.87 N/A 6.87 6.87 6.87 7.25 0.948 N/A 0.948 0.948 0.948
Average - 1.003 0.995 0.759 0.842 0.873
Standard Deviation - 0.225 0.240 0.166 0.172 0.181
32
Figure 2.3 – Measured Bay Frequencies vs. AISC Predicted Frequencies for Floors with Joist Girders and Joists
0
2
4
6
8
10
12
14
16
0 2 4 6 8 10 12 14 16
Predicted f beam , Hz
Mea
sure
d B
ay f m
eas.,H
z
(a) Measured Bay Frequency vs. AISC
Predicted Beam Frequency
0
2
4
6
8
10
12
14
16
0 2 4 6 8 10 12 14 16
Predicted f n2 , Hz
Mea
sure
d B
ay f m
eas.,H
z
(b) Measured Bay Frequency vs. AISC Predicted Bay Frequency ( 2
nf )
0
2
4
6
8
10
12
14
16
0 2 4 6 8 10 12 14 16
Predicted f n4 , Hz
Mea
sure
d B
ay f m
eas.,H
z
(c) Measured Bay Frequency vs. AISC
Predicted Bay Frequency ( 4nf )
0
2
4
6
8
10
12
14
16
0 2 4 6 8 10 12 14 16
Predicted f n6 , Hz
Mea
sure
d B
ay f m
eas.,H
z
(d) Measured Bay Frequency vs. AISC
Predicted Bay Frequency ( 6nf )
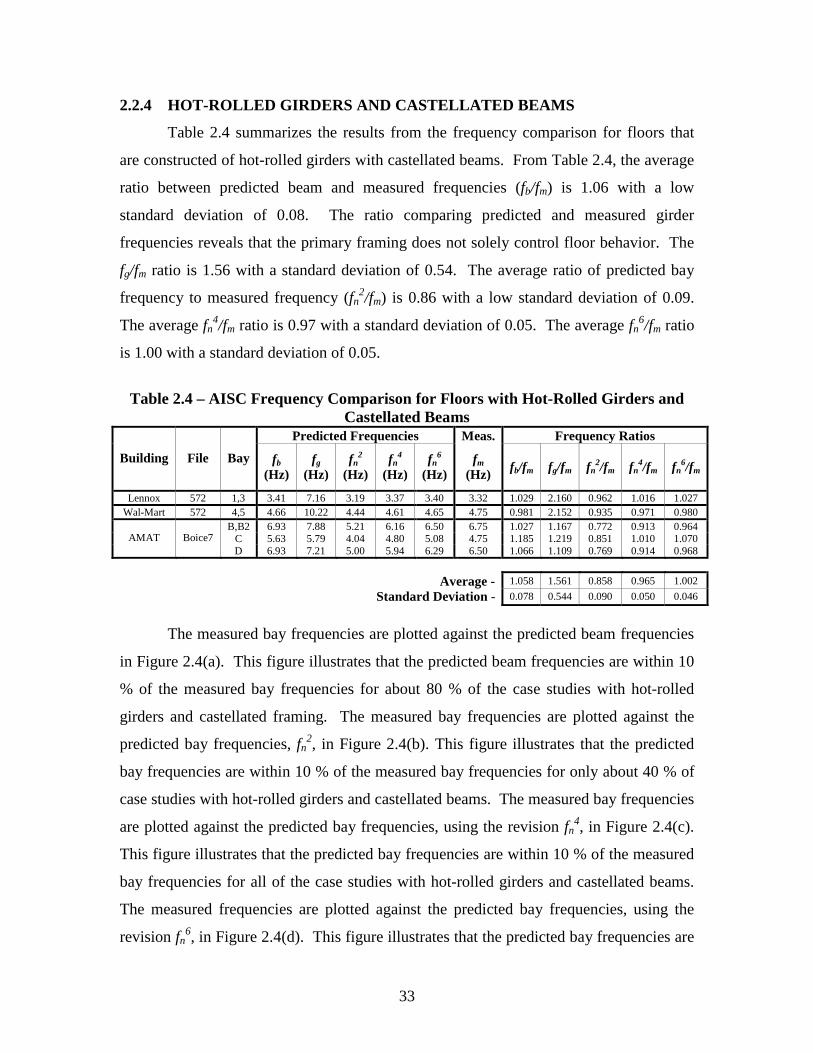
33
2.2.4 HOT-ROLLED GIRDERS AND CASTELLATED BEAMS
Table 2.4 summarizes the results from the frequency comparison for floors that
are constructed of hot-rolled girders with castellated beams. From Table 2.4, the average
ratio between predicted beam and measured frequencies (fb/fm) is 1.06 with a low
standard deviation of 0.08. The ratio comparing predicted and measured girder
frequencies reveals that the primary framing does not solely control floor behavior. The
fg/fm ratio is 1.56 with a standard deviation of 0.54. The average ratio of predicted bay
frequency to measured frequency (fn2/fm) is 0.86 with a low standard deviation of 0.09.
The average fn4/fm ratio is 0.97 with a standard deviation of 0.05. The average fn
6/fm ratio
is 1.00 with a standard deviation of 0.05.
Table 2.4 – AISC Frequency Comparison for Floors with Hot-Rolled Girders and
Castellated Beams Predicted Frequencies Meas. Frequency Ratios
Building File Bay fb
(Hz) fg
(Hz) fn
2 (Hz)
fn4
(Hz) fn
6 (Hz)
fm (Hz)
fb/fm fg/fm fn2/fm fn
4/fm fn6/fm
Lennox 572 1,3 3.41 7.16 3.19 3.37 3.40 3.32 1.029 2.160 0.962 1.016 1.027 Wal-Mart 572 4,5 4.66 10.22 4.44 4.61 4.65 4.75 0.981 2.152 0.935 0.971 0.980
B,B2 6.93 7.88 5.21 6.16 6.50 6.75 1.027 1.167 0.772 0.913 0.964 C 5.63 5.79 4.04 4.80 5.08 4.75 1.185 1.219 0.851 1.010 1.070 AMAT Boice7 D 6.93 7.21 5.00 5.94 6.29 6.50 1.066 1.109 0.769 0.914 0.968
Average - 1.058 1.561 0.858 0.965 1.002
Standard Deviation - 0.078 0.544 0.090 0.050 0.046
The measured bay frequencies are plotted against the predicted beam frequencies
in Figure 2.4(a). This figure illustrates that the predicted beam frequencies are within 10
% of the measured bay frequencies for about 80 % of the case studies with hot-rolled
girders and castellated framing. The measured bay frequencies are plotted against the
predicted bay frequencies, fn2, in Figure 2.4(b). This figure illustrates that the predicted
bay frequencies are within 10 % of the measured bay frequencies for only about 40 % of
case studies with hot-rolled girders and castellated beams. The measured bay frequencies
are plotted against the predicted bay frequencies, using the revision fn4, in Figure 2.4(c).
This figure illustrates that the predicted bay frequencies are within 10 % of the measured
bay frequencies for all of the case studies with hot-rolled girders and castellated beams.
The measured frequencies are plotted against the predicted bay frequencies, using the
revision fn6, in Figure 2.4(d). This figure illustrates that the predicted bay frequencies are
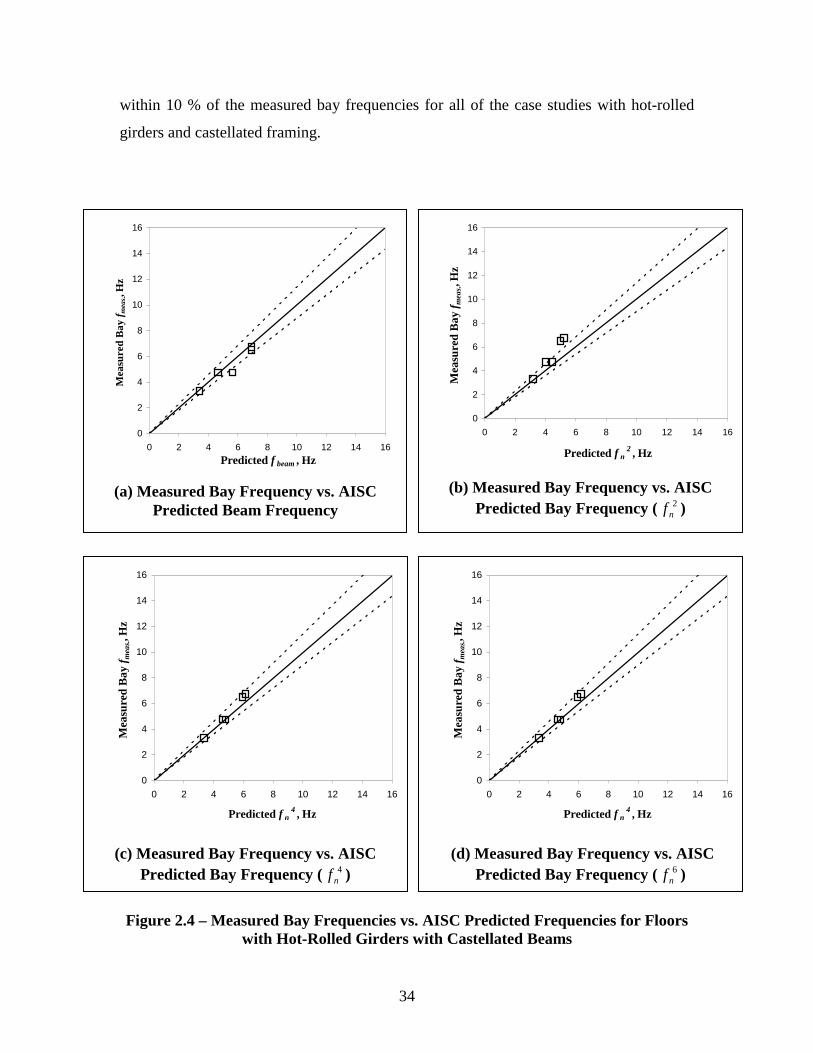
34
within 10 % of the measured bay frequencies for all of the case studies with hot-rolled
girders and castellated framing.
Figure 2.4 – Measured Bay Frequencies vs. AISC Predicted Frequencies for Floors
with Hot-Rolled Girders with Castellated Beams
0
2
4
6
8
10
12
14
16
0 2 4 6 8 10 12 14 16
Predicted f beam , Hz
Mea
sure
d B
ay f
mea
s.,H
z
(a) Measured Bay Frequency vs. AISC Predicted Beam Frequency
0
2
4
6
8
10
12
14
16
0 2 4 6 8 10 12 14 16
Predicted f n2 , Hz
Mea
sure
d B
ay f m
eas.,H
z
(b) Measured Bay Frequency vs. AISC Predicted Bay Frequency ( 2
nf )
0
2
4
6
8
10
12
14
16
0 2 4 6 8 10 12 14 16
Predicted f n4 , Hz
Mea
sure
d B
ay f m
eas.,H
z
(c) Measured Bay Frequency vs. AISC Predicted Bay Frequency ( 4
nf )
0
2
4
6
8
10
12
14
16
0 2 4 6 8 10 12 14 16
Predicted f n4 , Hz
Mea
sure
d B
ay f m
eas.,H
z
(d) Measured Bay Frequency vs. AISC Predicted Bay Frequency ( 6
nf )
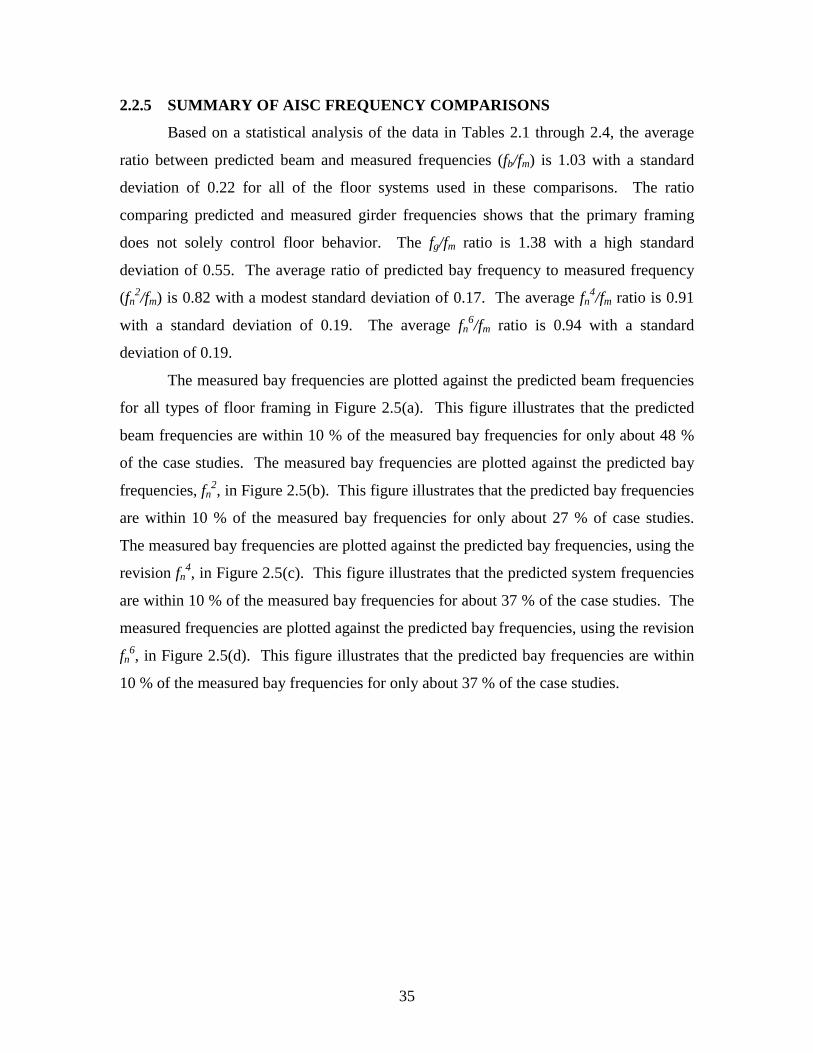
35
2.2.5 SUMMARY OF AISC FREQUENCY COMPARISONS
Based on a statistical analysis of the data in Tables 2.1 through 2.4, the average
ratio between predicted beam and measured frequencies (fb/fm) is 1.03 with a standard
deviation of 0.22 for all of the floor systems used in these comparisons. The ratio
comparing predicted and measured girder frequencies shows that the primary framing
does not solely control floor behavior. The fg/fm ratio is 1.38 with a high standard
deviation of 0.55. The average ratio of predicted bay frequency to measured frequency
(fn2/fm) is 0.82 with a modest standard deviation of 0.17. The average fn
4/fm ratio is 0.91
with a standard deviation of 0.19. The average fn6/fm ratio is 0.94 with a standard
deviation of 0.19.
The measured bay frequencies are plotted against the predicted beam frequencies
for all types of floor framing in Figure 2.5(a). This figure illustrates that the predicted
beam frequencies are within 10 % of the measured bay frequencies for only about 48 %
of the case studies. The measured bay frequencies are plotted against the predicted bay
frequencies, fn2, in Figure 2.5(b). This figure illustrates that the predicted bay frequencies
are within 10 % of the measured bay frequencies for only about 27 % of case studies.
The measured bay frequencies are plotted against the predicted bay frequencies, using the
revision fn4, in Figure 2.5(c). This figure illustrates that the predicted system frequencies
are within 10 % of the measured bay frequencies for about 37 % of the case studies. The
measured frequencies are plotted against the predicted bay frequencies, using the revision
fn6, in Figure 2.5(d). This figure illustrates that the predicted bay frequencies are within
10 % of the measured bay frequencies for only about 37 % of the case studies.
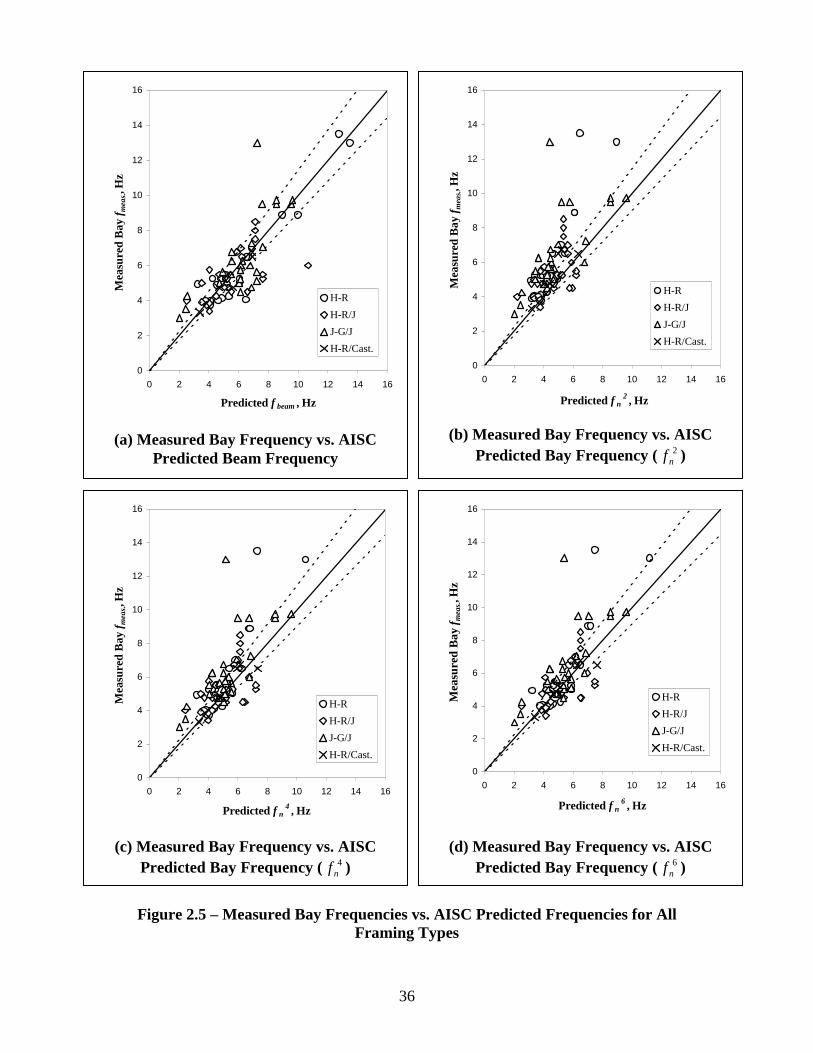
36
Figure 2.5 – Measured Bay Frequencies vs. AISC Predicted Frequencies for All
Framing Types
0
2
4
6
8
10
12
14
16
0 2 4 6 8 10 12 14 16
Predicted f beam , Hz
Mea
sure
d B
ay f m
eas.,H
z
H-R
H-R/J
J-G/J
H-R/Cast.
(a) Measured Bay Frequency vs. AISC Predicted Beam Frequency
0
2
4
6
8
10
12
14
16
0 2 4 6 8 10 12 14 16
Predicted f n2 , Hz
Mea
sure
d B
ay f
mea
s.,H
z
H-R
H-R/J
J-G/J
H-R/Cast.
(b) Measured Bay Frequency vs. AISC Predicted Bay Frequency ( 2
nf )
0
2
4
6
8
10
12
14
16
0 2 4 6 8 10 12 14 16
Predicted f n4 , Hz
Mea
sure
d B
ay f m
eas.,H
z
H-R
H-R/J
J-G/J
H-R/Cast.
(c) Measured Bay Frequency vs. AISC
Predicted Bay Frequency ( 4nf )
0
2
4
6
8
10
12
14
16
0 2 4 6 8 10 12 14 16
Predicted f n6 , Hz
Mea
sure
d B
ay f m
eas.,H
z
H-R
H-R/J
J-G/J
H-R/Cast.
(d) Measured Bay Frequency vs. AISC
Predicted Bay Frequency ( 6nf )
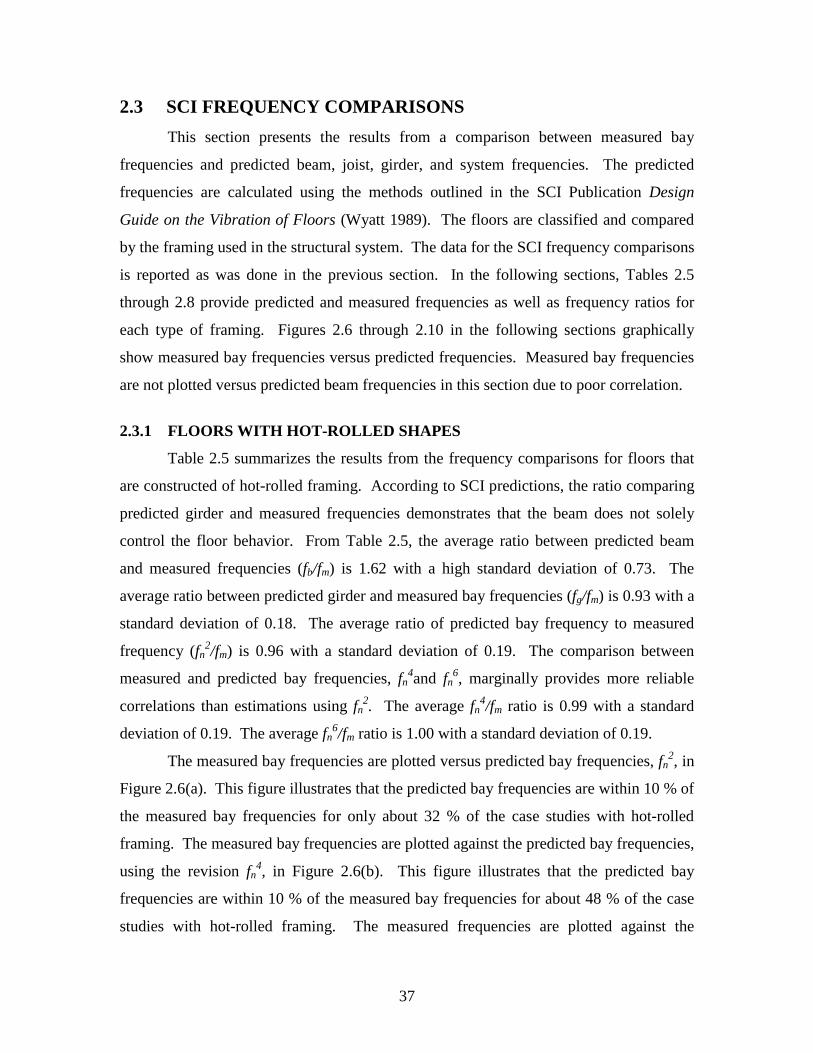
37
2.3 SCI FREQUENCY COMPARISONS
This section presents the results from a comparison between measured bay
frequencies and predicted beam, joist, girder, and system frequencies. The predicted
frequencies are calculated using the methods outlined in the SCI Publication Design
Guide on the Vibration of Floors (Wyatt 1989). The floors are classified and compared
by the framing used in the structural system. The data for the SCI frequency comparisons
is reported as was done in the previous section. In the following sections, Tables 2.5
through 2.8 provide predicted and measured frequencies as well as frequency ratios for
each type of framing. Figures 2.6 through 2.10 in the following sections graphically
show measured bay frequencies versus predicted frequencies. Measured bay frequencies
are not plotted versus predicted beam frequencies in this section due to poor correlation.
2.3.1 FLOORS WITH HOT-ROLLED SHAPES
Table 2.5 summarizes the results from the frequency comparisons for floors that
are constructed of hot-rolled framing. According to SCI predictions, the ratio comparing
predicted girder and measured frequencies demonstrates that the beam does not solely
control the floor behavior. From Table 2.5, the average ratio between predicted beam
and measured frequencies (fb/fm) is 1.62 with a high standard deviation of 0.73. The
average ratio between predicted girder and measured bay frequencies (fg/fm) is 0.93 with a
standard deviation of 0.18. The average ratio of predicted bay frequency to measured
frequency (fn2/fm) is 0.96 with a standard deviation of 0.19. The comparison between
measured and predicted bay frequencies, fn4and fn
6, marginally provides more reliable
correlations than estimations using fn2. The average fn
4/fm ratio is 0.99 with a standard
deviation of 0.19. The average fn6/fm ratio is 1.00 with a standard deviation of 0.19.
The measured bay frequencies are plotted versus predicted bay frequencies, fn2, in
Figure 2.6(a). This figure illustrates that the predicted bay frequencies are within 10 % of
the measured bay frequencies for only about 32 % of the case studies with hot-rolled
framing. The measured bay frequencies are plotted against the predicted bay frequencies,
using the revision fn4, in Figure 2.6(b). This figure illustrates that the predicted bay
frequencies are within 10 % of the measured bay frequencies for about 48 % of the case
studies with hot-rolled framing. The measured frequencies are plotted against the
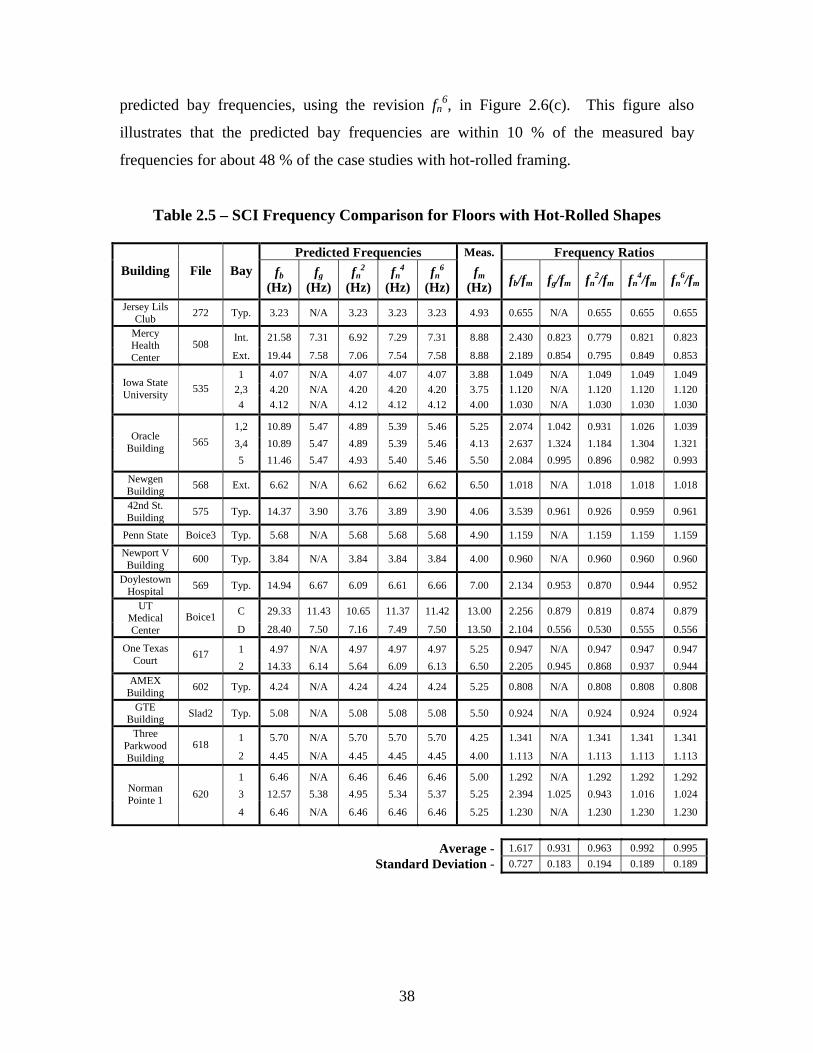
38
predicted bay frequencies, using the revision fn6, in Figure 2.6(c). This figure also
illustrates that the predicted bay frequencies are within 10 % of the measured bay
frequencies for about 48 % of the case studies with hot-rolled framing.
Table 2.5 – SCI Frequency Comparison for Floors with Hot-Rolled Shapes
Predicted Frequencies Meas. Frequency Ratios Building File Bay fb
(Hz) fg
(Hz) fn
2 (Hz)
fn4
(Hz) fn
6 (Hz)
fm (Hz)
fb/fm fg/fm fn2/fm fn
4/fm fn6/fm
Jersey Lils Club
272 Typ. 3.23 N/A 3.23 3.23 3.23 4.93 0.655 N/A 0.655 0.655 0.655
Int. 21.58 7.31 6.92 7.29 7.31 8.88 2.430 0.823 0.779 0.821 0.823 Mercy Health Center
508 Ext. 19.44 7.58 7.06 7.54 7.58 8.88 2.189 0.854 0.795 0.849 0.853
1 4.07 N/A 4.07 4.07 4.07 3.88 1.049 N/A 1.049 1.049 1.049
2,3 4.20 N/A 4.20 4.20 4.20 3.75 1.120 N/A 1.120 1.120 1.120 Iowa State University
535
4 4.12 N/A 4.12 4.12 4.12 4.00 1.030 N/A 1.030 1.030 1.030
1,2 10.89 5.47 4.89 5.39 5.46 5.25 2.074 1.042 0.931 1.026 1.039
3,4 10.89 5.47 4.89 5.39 5.46 4.13 2.637 1.324 1.184 1.304 1.321 Oracle
Building 565
5 11.46 5.47 4.93 5.40 5.46 5.50 2.084 0.995 0.896 0.982 0.993
Newgen Building
568 Ext. 6.62 N/A 6.62 6.62 6.62 6.50 1.018 N/A 1.018 1.018 1.018
42nd St. Building
575 Typ. 14.37 3.90 3.76 3.89 3.90 4.06 3.539 0.961 0.926 0.959 0.961
Penn State Boice3 Typ. 5.68 N/A 5.68 5.68 5.68 4.90 1.159 N/A 1.159 1.159 1.159
Newport V Building
600 Typ. 3.84 N/A 3.84 3.84 3.84 4.00 0.960 N/A 0.960 0.960 0.960
Doylestown Hospital
569 Typ. 14.94 6.67 6.09 6.61 6.66 7.00 2.134 0.953 0.870 0.944 0.952
C 29.33 11.43 10.65 11.37 11.42 13.00 2.256 0.879 0.819 0.874 0.879 UT Medical Center
Boice1 D 28.40 7.50 7.16 7.49 7.50 13.50 2.104 0.556 0.530 0.555 0.556
1 4.97 N/A 4.97 4.97 4.97 5.25 0.947 N/A 0.947 0.947 0.947 One Texas Court
617 2 14.33 6.14 5.64 6.09 6.13 6.50 2.205 0.945 0.868 0.937 0.944
AMEX Building
602 Typ. 4.24 N/A 4.24 4.24 4.24 5.25 0.808 N/A 0.808 0.808 0.808
GTE Building
Slad2 Typ. 5.08 N/A 5.08 5.08 5.08 5.50 0.924 N/A 0.924 0.924 0.924
1 5.70 N/A 5.70 5.70 5.70 4.25 1.341 N/A 1.341 1.341 1.341 Three Parkwood Building
618 2 4.45 N/A 4.45 4.45 4.45 4.00 1.113 N/A 1.113 1.113 1.113
1 6.46 N/A 6.46 6.46 6.46 5.00 1.292 N/A 1.292 1.292 1.292
3 12.57 5.38 4.95 5.34 5.37 5.25 2.394 1.025 0.943 1.016 1.024 Norman Pointe 1
620
4 6.46 N/A 6.46 6.46 6.46 5.25 1.230 N/A 1.230 1.230 1.230
Average - 1.617 0.931 0.963 0.992 0.995
Standard Deviation - 0.727 0.183 0.194 0.189 0.189
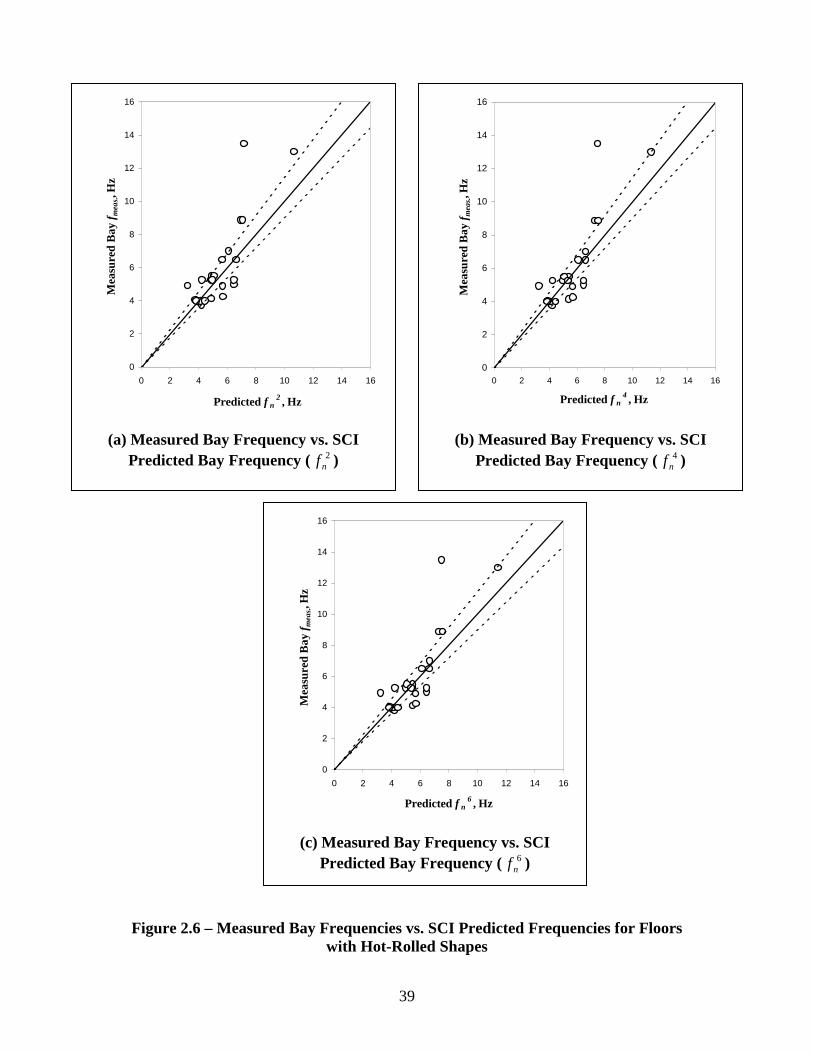
39
Figure 2.6 – Measured Bay Frequencies vs. SCI Predicted Frequencies for Floors with Hot-Rolled Shapes
0
2
4
6
8
10
12
14
16
0 2 4 6 8 10 12 14 16
Predicted f n6 , Hz
Mea
sure
d B
ay f m
eas.,H
z
(c) Measured Bay Frequency vs. SCI Predicted Bay Frequency ( 6
nf )
0
2
4
6
8
10
12
14
16
0 2 4 6 8 10 12 14 16
Predicted f n4 , Hz
Mea
sure
d B
ay f m
eas.,H
z
(b) Measured Bay Frequency vs. SCI
Predicted Bay Frequency ( 4nf )
0
2
4
6
8
10
12
14
16
0 2 4 6 8 10 12 14 16
Predicted f n2 , Hz
Mea
sure
d B
ay f m
eas.,H
z
(a) Measured Bay Frequency vs. SCI
Predicted Bay Frequency ( 2nf )
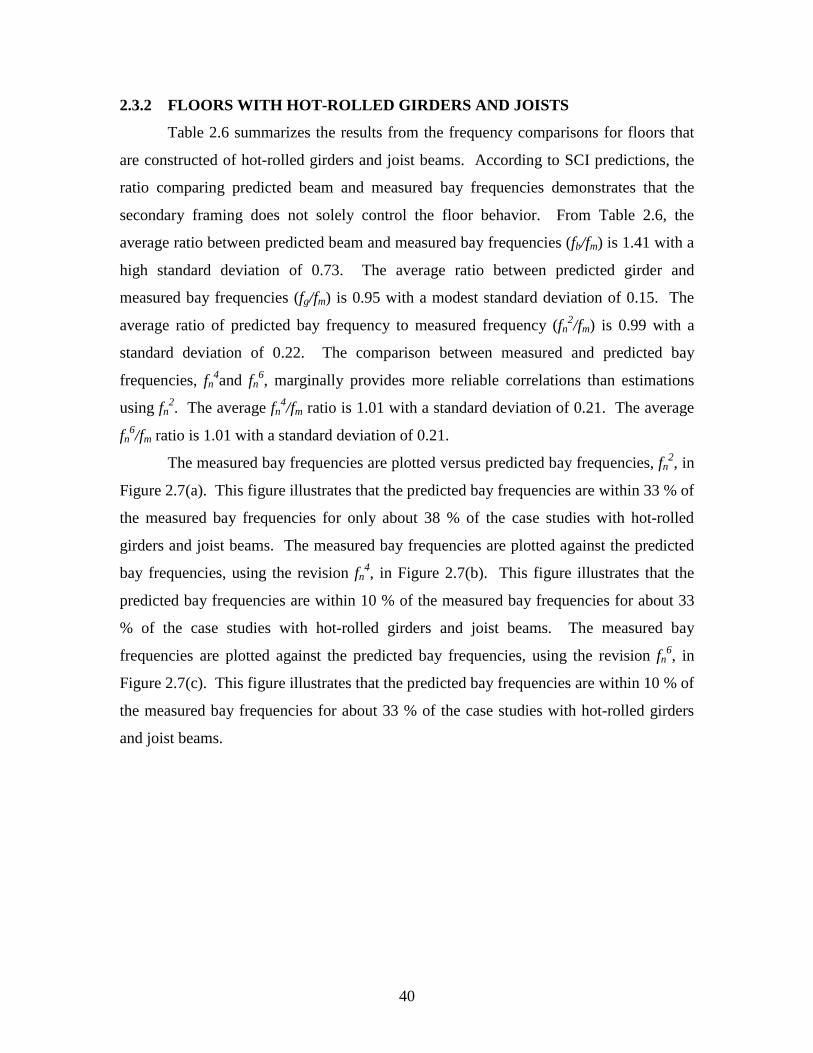
40
2.3.2 FLOORS WITH HOT-ROLLED GIRDERS AND JOISTS
Table 2.6 summarizes the results from the frequency comparisons for floors that
are constructed of hot-rolled girders and joist beams. According to SCI predictions, the
ratio comparing predicted beam and measured bay frequencies demonstrates that the
secondary framing does not solely control the floor behavior. From Table 2.6, the
average ratio between predicted beam and measured bay frequencies (fb/fm) is 1.41 with a
high standard deviation of 0.73. The average ratio between predicted girder and
measured bay frequencies (fg/fm) is 0.95 with a modest standard deviation of 0.15. The
average ratio of predicted bay frequency to measured frequency (fn2/fm) is 0.99 with a
standard deviation of 0.22. The comparison between measured and predicted bay
frequencies, fn4and fn
6, marginally provides more reliable correlations than estimations
using fn2. The average fn
4/fm ratio is 1.01 with a standard deviation of 0.21. The average
fn6/fm ratio is 1.01 with a standard deviation of 0.21.
The measured bay frequencies are plotted versus predicted bay frequencies, fn2, in
Figure 2.7(a). This figure illustrates that the predicted bay frequencies are within 33 % of
the measured bay frequencies for only about 38 % of the case studies with hot-rolled
girders and joist beams. The measured bay frequencies are plotted against the predicted
bay frequencies, using the revision fn4, in Figure 2.7(b). This figure illustrates that the
predicted bay frequencies are within 10 % of the measured bay frequencies for about 33
% of the case studies with hot-rolled girders and joist beams. The measured bay
frequencies are plotted against the predicted bay frequencies, using the revision fn6, in
Figure 2.7(c). This figure illustrates that the predicted bay frequencies are within 10 % of
the measured bay frequencies for about 33 % of the case studies with hot-rolled girders
and joist beams.
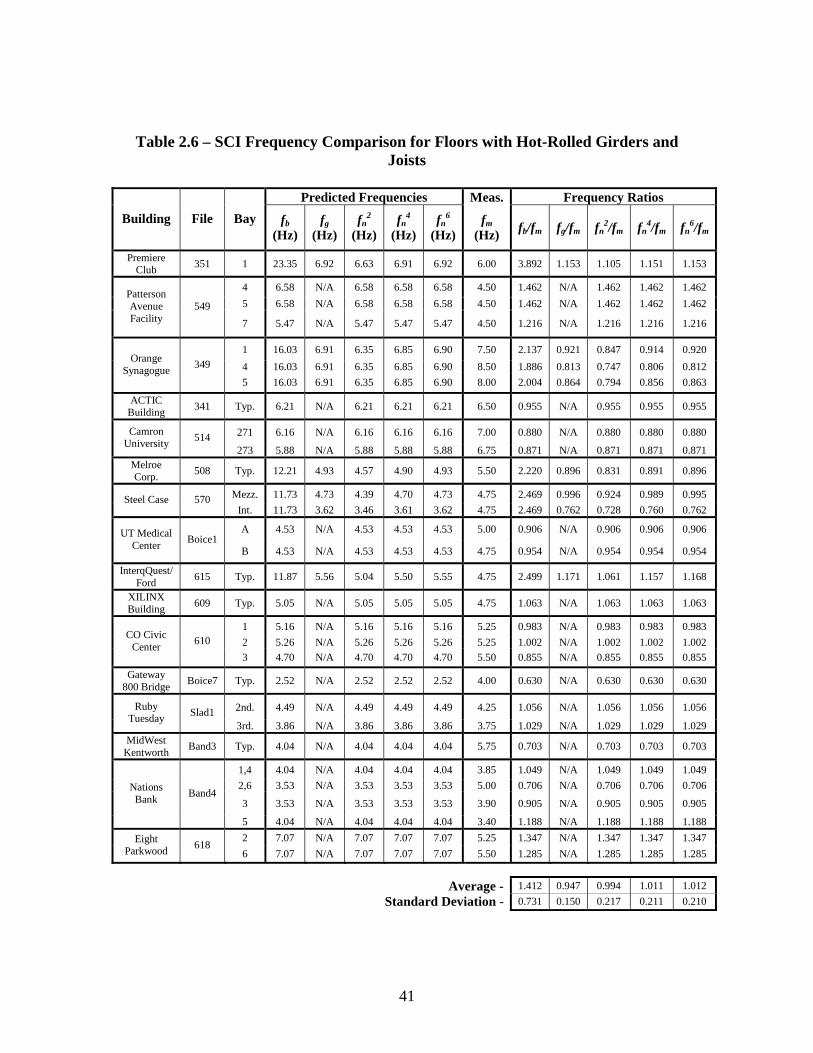
41
Table 2.6 – SCI Frequency Comparison for Floors with Hot-Rolled Girders and Joists
Predicted Frequencies Meas. Frequency Ratios
Building File Bay fb
(Hz) fg
(Hz) fn
2 (Hz)
fn4
(Hz) fn
6 (Hz)
fm (Hz)
fb/fm fg/fm fn2/fm fn
4/fm fn6/fm
Premiere Club
351 1 23.35 6.92 6.63 6.91 6.92 6.00 3.892 1.153 1.105 1.151 1.153
4 6.58 N/A 6.58 6.58 6.58 4.50 1.462 N/A 1.462 1.462 1.462
5 6.58 N/A 6.58 6.58 6.58 4.50 1.462 N/A 1.462 1.462 1.462 Patterson Avenue Facility
549
7 5.47 N/A 5.47 5.47 5.47 4.50 1.216 N/A 1.216 1.216 1.216
1 16.03 6.91 6.35 6.85 6.90 7.50 2.137 0.921 0.847 0.914 0.920
4 16.03 6.91 6.35 6.85 6.90 8.50 1.886 0.813 0.747 0.806 0.812 Orange
Synagogue 349
5 16.03 6.91 6.35 6.85 6.90 8.00 2.004 0.864 0.794 0.856 0.863
ACTIC Building
341 Typ. 6.21 N/A 6.21 6.21 6.21 6.50 0.955 N/A 0.955 0.955 0.955
271 6.16 N/A 6.16 6.16 6.16 7.00 0.880 N/A 0.880 0.880 0.880 Camron University
514 273 5.88 N/A 5.88 5.88 5.88 6.75 0.871 N/A 0.871 0.871 0.871
Melroe Corp.
508 Typ. 12.21 4.93 4.57 4.90 4.93 5.50 2.220 0.896 0.831 0.891 0.896
Mezz. 11.73 4.73 4.39 4.70 4.73 4.75 2.469 0.996 0.924 0.989 0.995 Steel Case 570 Int. 11.73 3.62 3.46 3.61 3.62 4.75 2.469 0.762 0.728 0.760 0.762
A 4.53 N/A 4.53 4.53 4.53 5.00 0.906 N/A 0.906 0.906 0.906 UT Medical Center
Boice1 B 4.53 N/A 4.53 4.53 4.53 4.75 0.954 N/A 0.954 0.954 0.954
InterqQuest/ Ford
615 Typ. 11.87 5.56 5.04 5.50 5.55 4.75 2.499 1.171 1.061 1.157 1.168
XILINX Building
609 Typ. 5.05 N/A 5.05 5.05 5.05 4.75 1.063 N/A 1.063 1.063 1.063
1 5.16 N/A 5.16 5.16 5.16 5.25 0.983 N/A 0.983 0.983 0.983
2 5.26 N/A 5.26 5.26 5.26 5.25 1.002 N/A 1.002 1.002 1.002 CO Civic
Center 610
3 4.70 N/A 4.70 4.70 4.70 5.50 0.855 N/A 0.855 0.855 0.855
Gateway 800 Bridge
Boice7 Typ. 2.52 N/A 2.52 2.52 2.52 4.00 0.630 N/A 0.630 0.630 0.630
2nd. 4.49 N/A 4.49 4.49 4.49 4.25 1.056 N/A 1.056 1.056 1.056 Ruby Tuesday
Slad1 3rd. 3.86 N/A 3.86 3.86 3.86 3.75 1.029 N/A 1.029 1.029 1.029
MidWest Kentworth
Band3 Typ. 4.04 N/A 4.04 4.04 4.04 5.75 0.703 N/A 0.703 0.703 0.703
1,4 4.04 N/A 4.04 4.04 4.04 3.85 1.049 N/A 1.049 1.049 1.049
2,6 3.53 N/A 3.53 3.53 3.53 5.00 0.706 N/A 0.706 0.706 0.706
3 3.53 N/A 3.53 3.53 3.53 3.90 0.905 N/A 0.905 0.905 0.905
Nations Bank
Band4
5 4.04 N/A 4.04 4.04 4.04 3.40 1.188 N/A 1.188 1.188 1.188
2 7.07 N/A 7.07 7.07 7.07 5.25 1.347 N/A 1.347 1.347 1.347 Eight Parkwood
618 6 7.07 N/A 7.07 7.07 7.07 5.50 1.285 N/A 1.285 1.285 1.285
Average - 1.412 0.947 0.994 1.011 1.012
Standard Deviation - 0.731 0.150 0.217 0.211 0.210
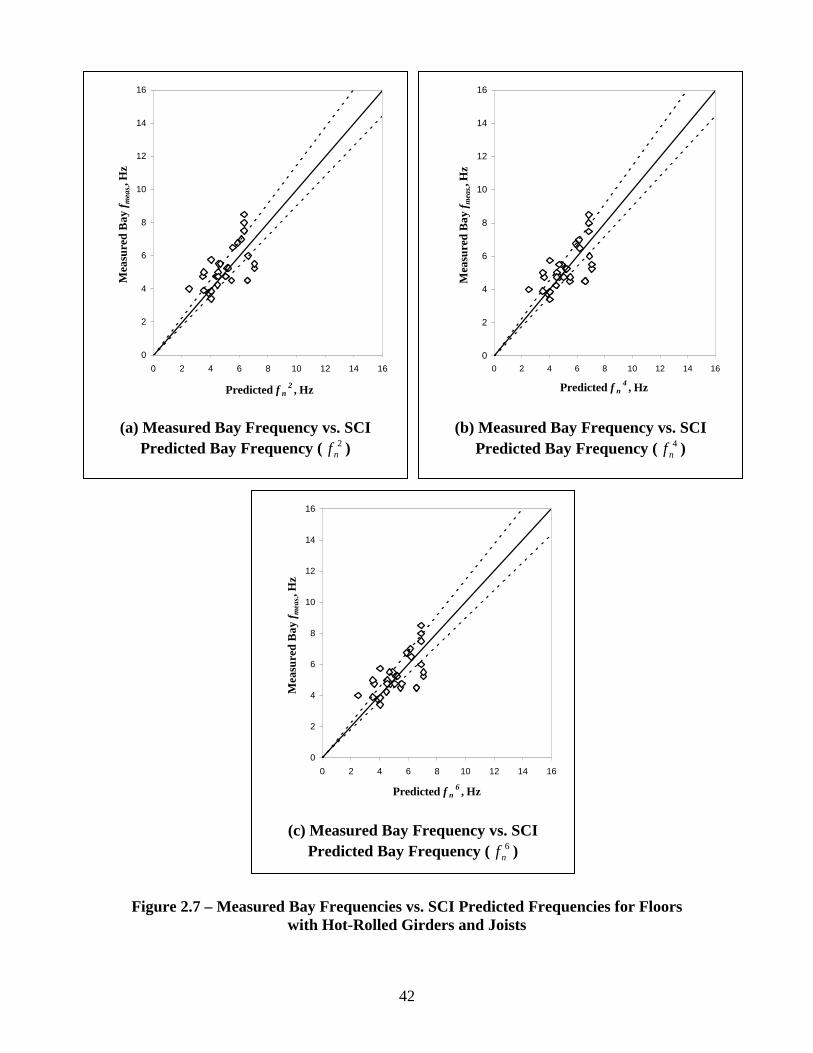
42
Figure 2.7 – Measured Bay Frequencies vs. SCI Predicted Frequencies for Floors
with Hot-Rolled Girders and Joists
0
2
4
6
8
10
12
14
16
0 2 4 6 8 10 12 14 16
Predicted f n2 , Hz
Mea
sure
d B
ay f m
eas.,H
z
(a) Measured Bay Frequency vs. SCI
Predicted Bay Frequency ( 2nf )
0
2
4
6
8
10
12
14
16
0 2 4 6 8 10 12 14 16
Predicted f n4 , Hz
Mea
sure
d B
ay f m
eas.,H
z
(b) Measured Bay Frequency vs. SCI
Predicted Bay Frequency ( 4nf )
0
2
4
6
8
10
12
14
16
0 2 4 6 8 10 12 14 16
Predicted f n6 , Hz
Mea
sure
d B
ay f m
eas.,H
z
(c) Measured Bay Frequency vs. SCI Predicted Bay Frequency ( 6
nf )
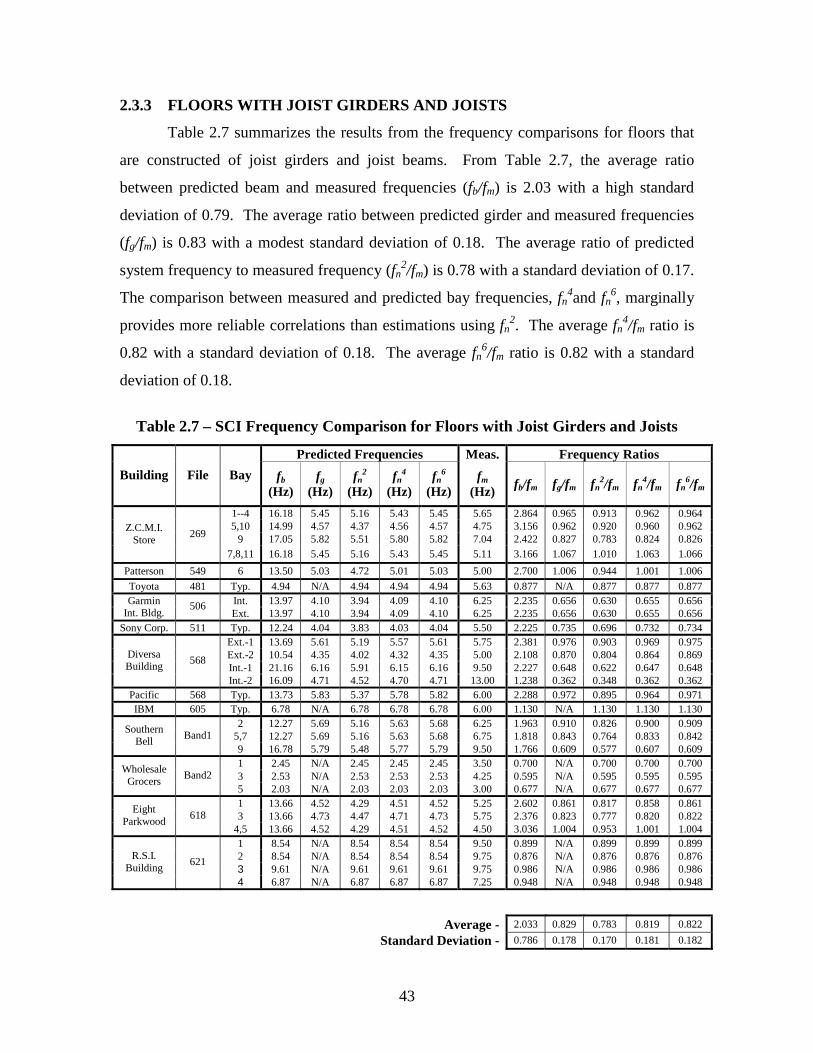
43
2.3.3 FLOORS WITH JOIST GIRDERS AND JOISTS
Table 2.7 summarizes the results from the frequency comparisons for floors that
are constructed of joist girders and joist beams. From Table 2.7, the average ratio
between predicted beam and measured frequencies (fb/fm) is 2.03 with a high standard
deviation of 0.79. The average ratio between predicted girder and measured frequencies
(fg/fm) is 0.83 with a modest standard deviation of 0.18. The average ratio of predicted
system frequency to measured frequency (fn2/fm) is 0.78 with a standard deviation of 0.17.
The comparison between measured and predicted bay frequencies, fn4and fn
6, marginally
provides more reliable correlations than estimations using fn2. The average fn
4/fm ratio is
0.82 with a standard deviation of 0.18. The average fn6/fm ratio is 0.82 with a standard
deviation of 0.18.
Table 2.7 – SCI Frequency Comparison for Floors with Joist Girders and Joists
Predicted Frequencies Meas. Frequency Ratios
Building File Bay fb
(Hz) fg
(Hz) fn
2 (Hz)
fn4
(Hz) fn
6 (Hz)
fm (Hz)
fb/fm fg/fm fn2/fm fn
4/fm fn6/fm
1--4 16.18 5.45 5.16 5.43 5.45 5.65 2.864 0.965 0.913 0.962 0.964 5,10 14.99 4.57 4.37 4.56 4.57 4.75 3.156 0.962 0.920 0.960 0.962
9 17.05 5.82 5.51 5.80 5.82 7.04 2.422 0.827 0.783 0.824 0.826 Z.C.M.I.
Store 269
7,8,11 16.18 5.45 5.16 5.43 5.45 5.11 3.166 1.067 1.010 1.063 1.066
Patterson 549 6 13.50 5.03 4.72 5.01 5.03 5.00 2.700 1.006 0.944 1.001 1.006
Toyota 481 Typ. 4.94 N/A 4.94 4.94 4.94 5.63 0.877 N/A 0.877 0.877 0.877 Int. 13.97 4.10 3.94 4.09 4.10 6.25 2.235 0.656 0.630 0.655 0.656 Garmin
Int. Bldg. 506
Ext. 13.97 4.10 3.94 4.09 4.10 6.25 2.235 0.656 0.630 0.655 0.656 Sony Corp. 511 Typ. 12.24 4.04 3.83 4.03 4.04 5.50 2.225 0.735 0.696 0.732 0.734
Ext.-1 13.69 5.61 5.19 5.57 5.61 5.75 2.381 0.976 0.903 0.969 0.975 Ext.-2 10.54 4.35 4.02 4.32 4.35 5.00 2.108 0.870 0.804 0.864 0.869 Int.-1 21.16 6.16 5.91 6.15 6.16 9.50 2.227 0.648 0.622 0.647 0.648
Diversa Building
568
Int.-2 16.09 4.71 4.52 4.70 4.71 13.00 1.238 0.362 0.348 0.362 0.362 Pacific 568 Typ. 13.73 5.83 5.37 5.78 5.82 6.00 2.288 0.972 0.895 0.964 0.971 IBM 605 Typ. 6.78 N/A 6.78 6.78 6.78 6.00 1.130 N/A 1.130 1.130 1.130
2 12.27 5.69 5.16 5.63 5.68 6.25 1.963 0.910 0.826 0.900 0.909 5,7 12.27 5.69 5.16 5.63 5.68 6.75 1.818 0.843 0.764 0.833 0.842
Southern Bell
Band1 9 16.78 5.79 5.48 5.77 5.79 9.50 1.766 0.609 0.577 0.607 0.609 1 2.45 N/A 2.45 2.45 2.45 3.50 0.700 N/A 0.700 0.700 0.700 3 2.53 N/A 2.53 2.53 2.53 4.25 0.595 N/A 0.595 0.595 0.595
Wholesale Grocers
Band2 5 2.03 N/A 2.03 2.03 2.03 3.00 0.677 N/A 0.677 0.677 0.677 1 13.66 4.52 4.29 4.51 4.52 5.25 2.602 0.861 0.817 0.858 0.861 3 13.66 4.73 4.47 4.71 4.73 5.75 2.376 0.823 0.777 0.820 0.822
Eight Parkwood
618 4,5 13.66 4.52 4.29 4.51 4.52 4.50 3.036 1.004 0.953 1.001 1.004 1 8.54 N/A 8.54 8.54 8.54 9.50 0.899 N/A 0.899 0.899 0.899 2 8.54 N/A 8.54 8.54 8.54 9.75 0.876 N/A 0.876 0.876 0.876 3 9.61 N/A 9.61 9.61 9.61 9.75 0.986 N/A 0.986 0.986 0.986
R.S.I. Building
621
4 6.87 N/A 6.87 6.87 6.87 7.25 0.948 N/A 0.948 0.948 0.948
Average - 2.033 0.829 0.783 0.819 0.822
Standard Deviation - 0.786 0.178 0.170 0.181 0.182
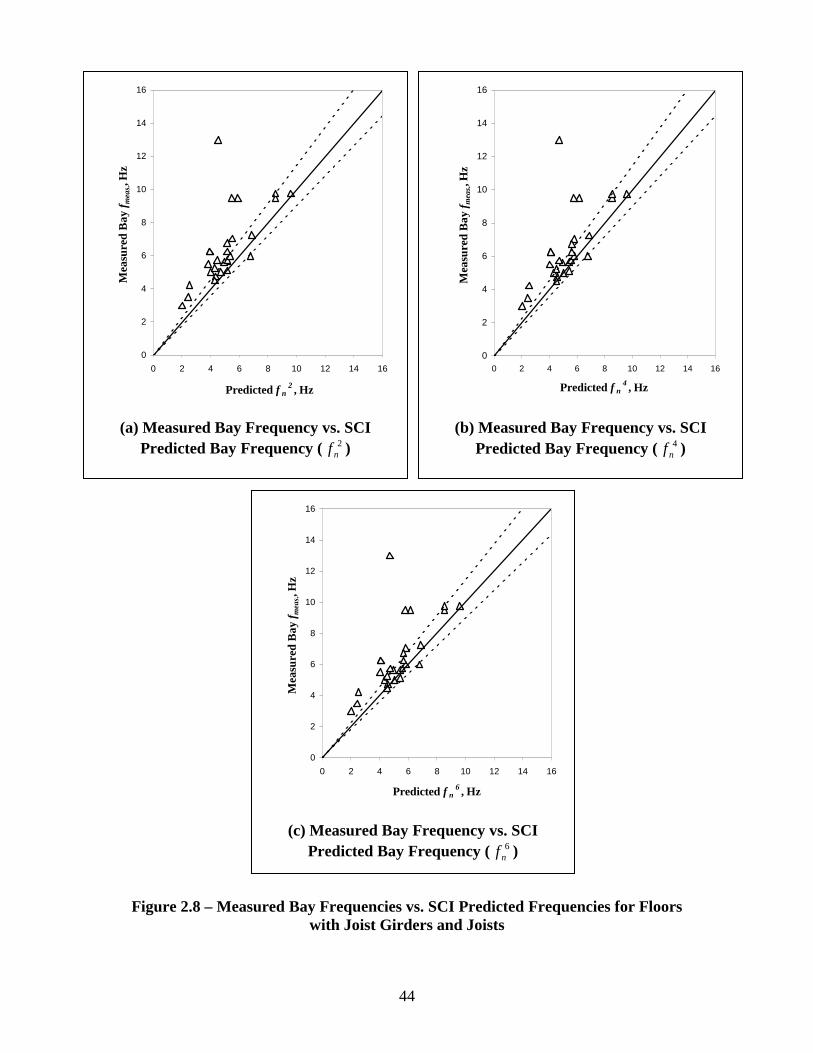
44
Figure 2.8 – Measured Bay Frequencies vs. SCI Predicted Frequencies for Floors
with Joist Girders and Joists
0
2
4
6
8
10
12
14
16
0 2 4 6 8 10 12 14 16
Predicted f n2 , Hz
Mea
sure
d B
ay f m
eas.,H
z
(a) Measured Bay Frequency vs. SCI
Predicted Bay Frequency ( 2nf )
0
2
4
6
8
10
12
14
16
0 2 4 6 8 10 12 14 16
Predicted f n4 , Hz
Mea
sure
d B
ay f m
eas.,H
z
(b) Measured Bay Frequency vs. SCI
Predicted Bay Frequency ( 4nf )
0
2
4
6
8
10
12
14
16
0 2 4 6 8 10 12 14 16
Predicted f n6 , Hz
Mea
sure
d B
ay f m
eas.,H
z
(c) Measured Bay Frequency vs. SCI Predicted Bay Frequency ( 6
nf )
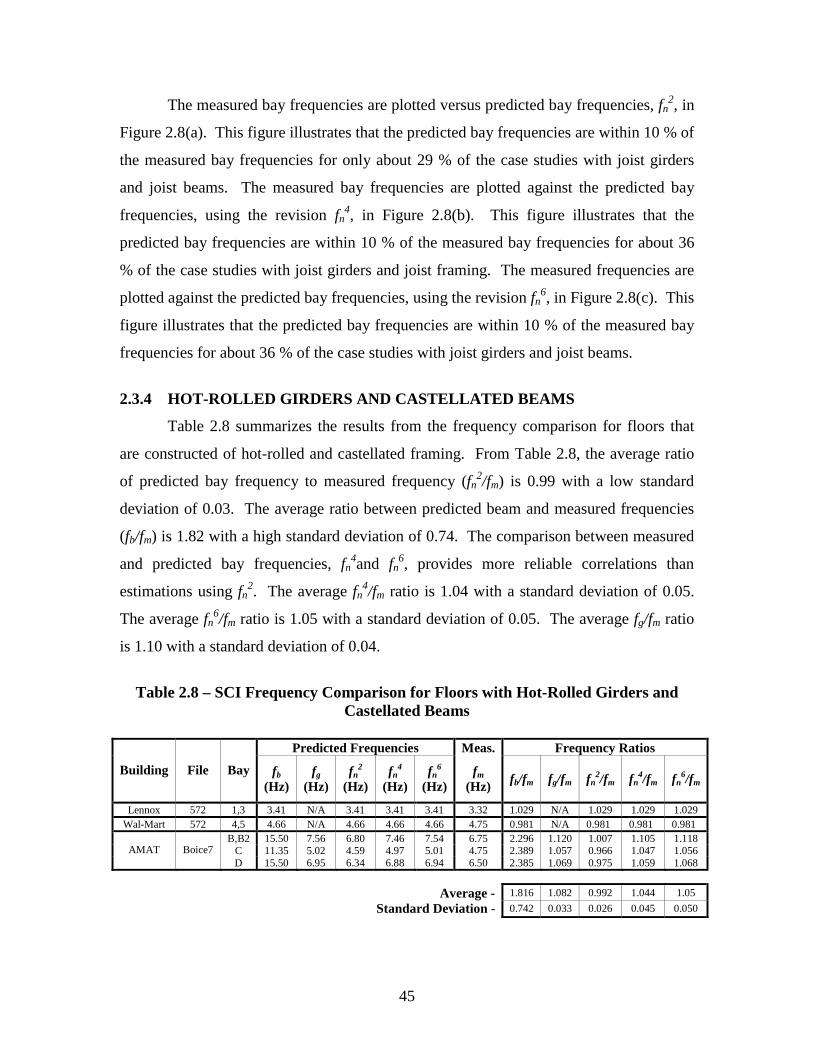
45
The measured bay frequencies are plotted versus predicted bay frequencies, fn2, in
Figure 2.8(a). This figure illustrates that the predicted bay frequencies are within 10 % of
the measured bay frequencies for only about 29 % of the case studies with joist girders
and joist beams. The measured bay frequencies are plotted against the predicted bay
frequencies, using the revision fn4, in Figure 2.8(b). This figure illustrates that the
predicted bay frequencies are within 10 % of the measured bay frequencies for about 36
% of the case studies with joist girders and joist framing. The measured frequencies are
plotted against the predicted bay frequencies, using the revision fn6, in Figure 2.8(c). This
figure illustrates that the predicted bay frequencies are within 10 % of the measured bay
frequencies for about 36 % of the case studies with joist girders and joist beams.
2.3.4 HOT-ROLLED GIRDERS AND CASTELLATED BEAMS
Table 2.8 summarizes the results from the frequency comparison for floors that
are constructed of hot-rolled and castellated framing. From Table 2.8, the average ratio
of predicted bay frequency to measured frequency (fn2/fm) is 0.99 with a low standard
deviation of 0.03. The average ratio between predicted beam and measured frequencies
(fb/fm) is 1.82 with a high standard deviation of 0.74. The comparison between measured
and predicted bay frequencies, fn4and fn
6, provides more reliable correlations than
estimations using fn2. The average fn
4/fm ratio is 1.04 with a standard deviation of 0.05.
The average fn6/fm ratio is 1.05 with a standard deviation of 0.05. The average fg/fm ratio
is 1.10 with a standard deviation of 0.04.
Table 2.8 – SCI Frequency Comparison for Floors with Hot-Rolled Girders and
Castellated Beams
Predicted Frequencies Meas. Frequency Ratios
Building File Bay fb
(Hz) fg
(Hz) fn
2 (Hz)
fn4
(Hz) fn
6 (Hz)
fm (Hz)
fb/fm fg/fm fn2/fm fn
4/fm fn6/fm
Lennox 572 1,3 3.41 N/A 3.41 3.41 3.41 3.32 1.029 N/A 1.029 1.029 1.029 Wal-Mart 572 4,5 4.66 N/A 4.66 4.66 4.66 4.75 0.981 N/A 0.981 0.981 0.981
B,B2 15.50 7.56 6.80 7.46 7.54 6.75 2.296 1.120 1.007 1.105 1.118 C 11.35 5.02 4.59 4.97 5.01 4.75 2.389 1.057 0.966 1.047 1.056 AMAT Boice7 D 15.50 6.95 6.34 6.88 6.94 6.50 2.385 1.069 0.975 1.059 1.068
Average - 1.816 1.082 0.992 1.044 1.05
Standard Deviation - 0.742 0.033 0.026 0.045 0.050
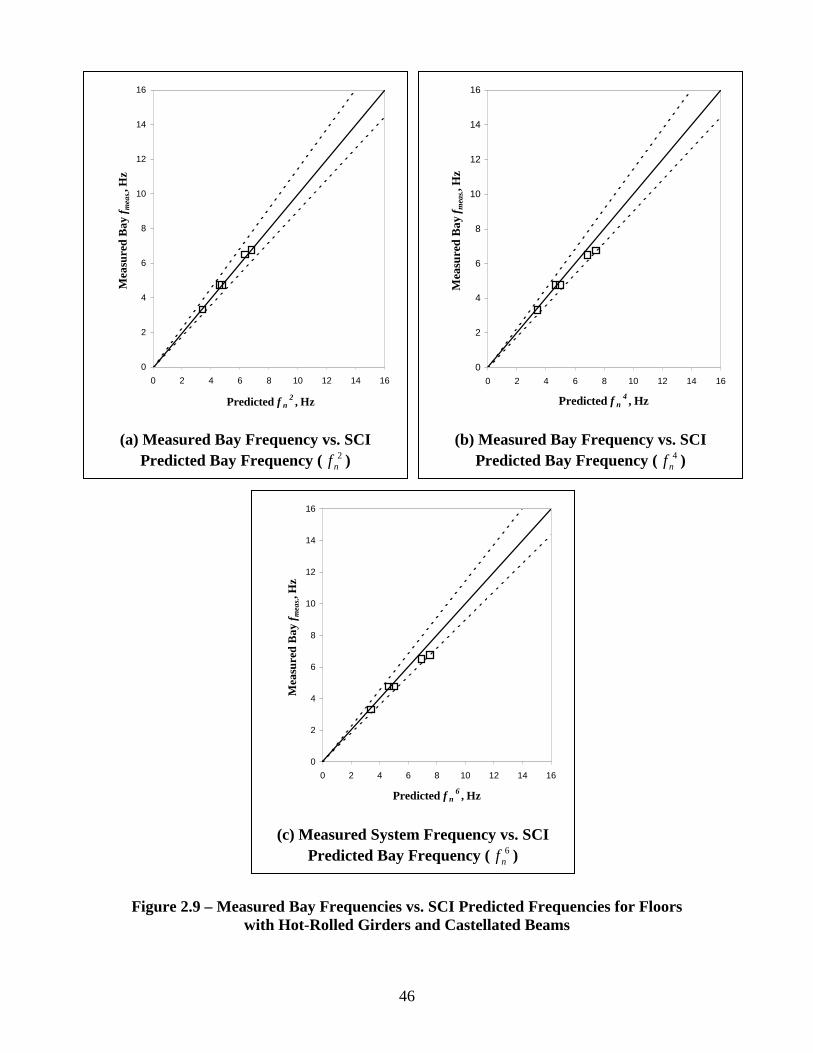
46
Figure 2.9 – Measured Bay Frequencies vs. SCI Predicted Frequencies for Floors
with Hot-Rolled Girders and Castellated Beams
0
2
4
6
8
10
12
14
16
0 2 4 6 8 10 12 14 16
Predicted f n2 , Hz
Mea
sure
d B
ay f m
eas.,H
z
(a) Measured Bay Frequency vs. SCI
Predicted Bay Frequency ( 2nf )
0
2
4
6
8
10
12
14
16
0 2 4 6 8 10 12 14 16
Predicted f n4 , Hz
Mea
sure
d B
ay f m
eas.,H
z
(b) Measured Bay Frequency vs. SCI
Predicted Bay Frequency ( 4nf )
0
2
4
6
8
10
12
14
16
0 2 4 6 8 10 12 14 16
Predicted f n6 , Hz
Mea
sure
d B
ay f m
eas.,H
z
(c) Measured System Frequency vs. SCI Predicted Bay Frequency ( 6
nf )
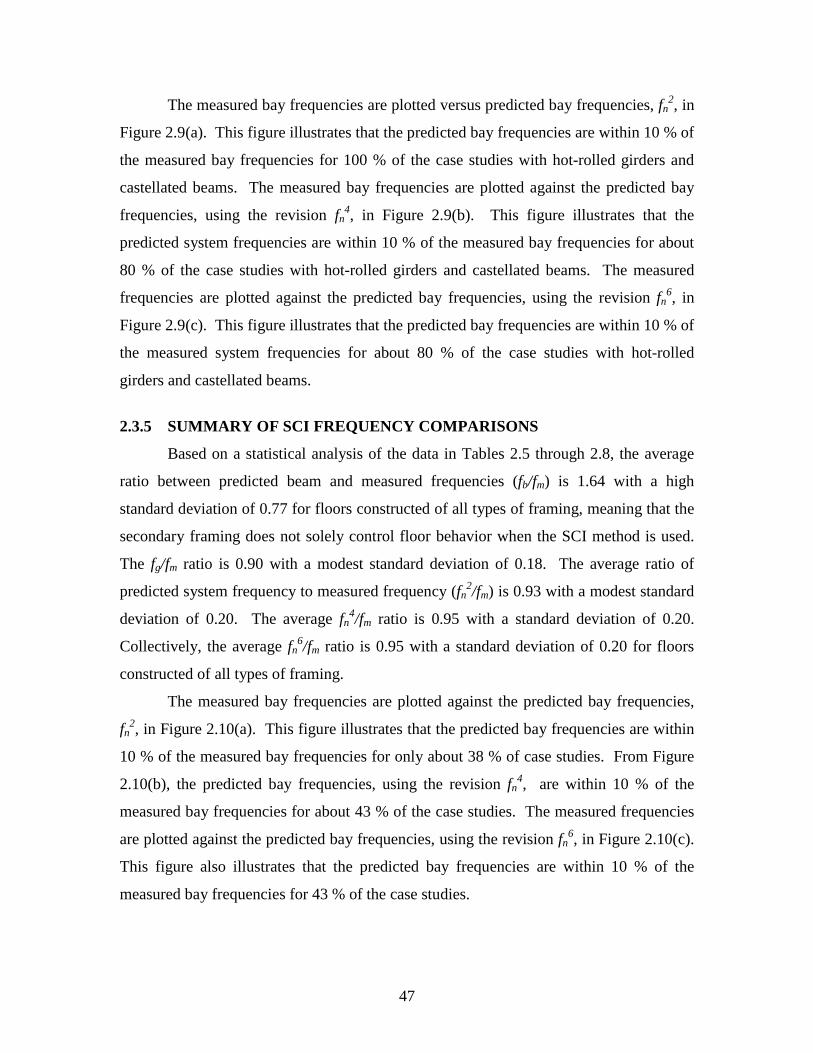
47
The measured bay frequencies are plotted versus predicted bay frequencies, fn2, in
Figure 2.9(a). This figure illustrates that the predicted bay frequencies are within 10 % of
the measured bay frequencies for 100 % of the case studies with hot-rolled girders and
castellated beams. The measured bay frequencies are plotted against the predicted bay
frequencies, using the revision fn4, in Figure 2.9(b). This figure illustrates that the
predicted system frequencies are within 10 % of the measured bay frequencies for about
80 % of the case studies with hot-rolled girders and castellated beams. The measured
frequencies are plotted against the predicted bay frequencies, using the revision fn6, in
Figure 2.9(c). This figure illustrates that the predicted bay frequencies are within 10 % of
the measured system frequencies for about 80 % of the case studies with hot-rolled
girders and castellated beams.
2.3.5 SUMMARY OF SCI FREQUENCY COMPARISONS
Based on a statistical analysis of the data in Tables 2.5 through 2.8, the average
ratio between predicted beam and measured frequencies (fb/fm) is 1.64 with a high
standard deviation of 0.77 for floors constructed of all types of framing, meaning that the
secondary framing does not solely control floor behavior when the SCI method is used.
The fg/fm ratio is 0.90 with a modest standard deviation of 0.18. The average ratio of
predicted system frequency to measured frequency (fn2/fm) is 0.93 with a modest standard
deviation of 0.20. The average fn4/fm ratio is 0.95 with a standard deviation of 0.20.
Collectively, the average fn6/fm ratio is 0.95 with a standard deviation of 0.20 for floors
constructed of all types of framing.
The measured bay frequencies are plotted against the predicted bay frequencies,
fn2, in Figure 2.10(a). This figure illustrates that the predicted bay frequencies are within
10 % of the measured bay frequencies for only about 38 % of case studies. From Figure
2.10(b), the predicted bay frequencies, using the revision fn4, are within 10 % of the
measured bay frequencies for about 43 % of the case studies. The measured frequencies
are plotted against the predicted bay frequencies, using the revision fn6, in Figure 2.10(c).
This figure also illustrates that the predicted bay frequencies are within 10 % of the
measured bay frequencies for 43 % of the case studies.
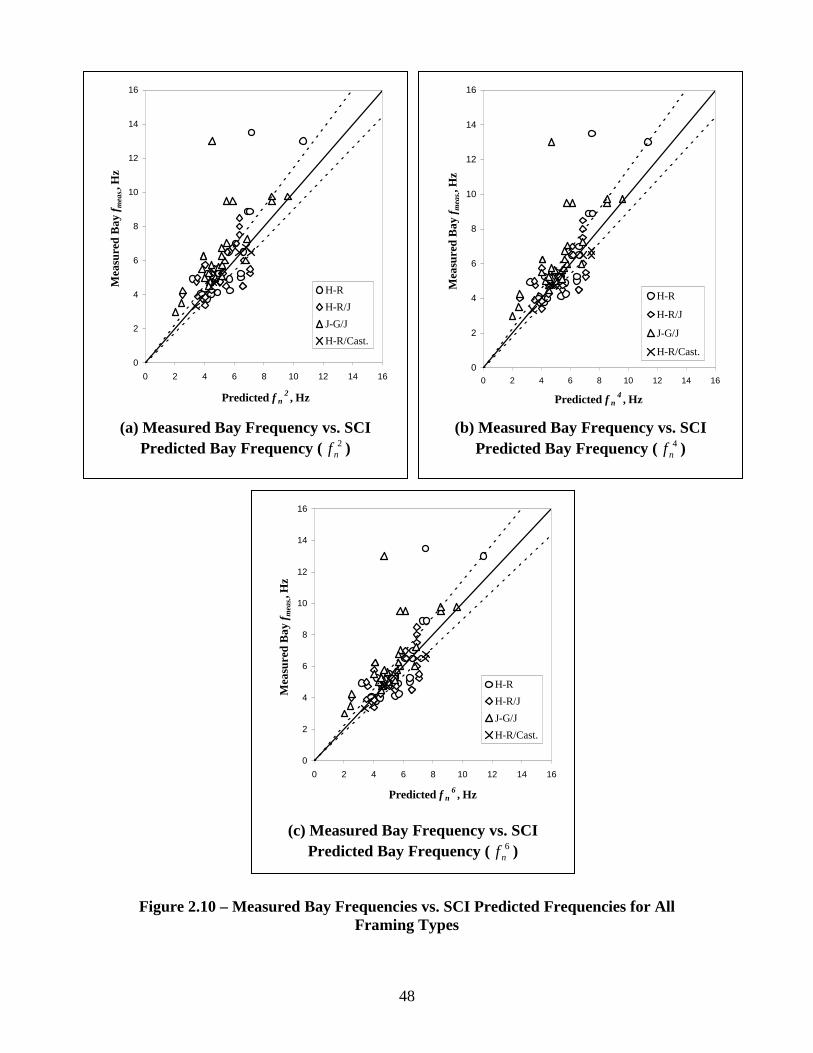
48
Figure 2.10 – Measured Bay Frequencies vs. SCI Predicted Frequencies for All
Framing Types
0
2
4
6
8
10
12
14
16
0 2 4 6 8 10 12 14 16
Predicted f n2 , Hz
Mea
sure
d B
ay f m
eas.,H
z
H-R
H-R/J
J-G/J
H-R/Cast.
(a) Measured Bay Frequency vs. SCI
Predicted Bay Frequency ( 2nf )
0
2
4
6
8
10
12
14
16
0 2 4 6 8 10 12 14 16
Predicted f n4 , Hz
Mea
sure
d B
ay f m
eas.,H
z
H-R
H-R/J
J-G/J
H-R/Cast.
(b) Measured Bay Frequency vs. SCI
Predicted Bay Frequency ( 4nf )
0
2
4
6
8
10
12
14
16
0 2 4 6 8 10 12 14 16
Predicted f n6 , Hz
Mea
sure
d B
ay f m
eas.,H
z
H-R
H-R/J
J-G/J
H-R/Cast.
(c) Measured Bay Frequency vs. SCI Predicted Bay Frequency ( 6
nf )
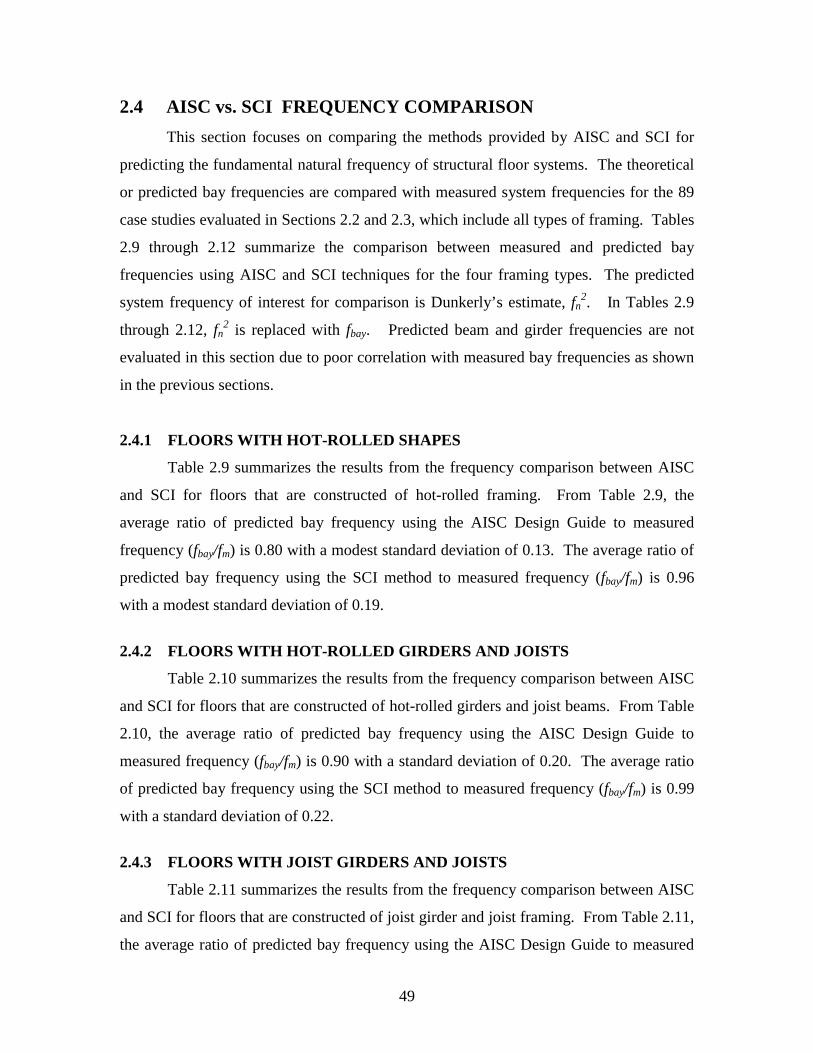
49
2.4 AISC vs. SCI FREQUENCY COMPARISON
This section focuses on comparing the methods provided by AISC and SCI for
predicting the fundamental natural frequency of structural floor systems. The theoretical
or predicted bay frequencies are compared with measured system frequencies for the 89
case studies evaluated in Sections 2.2 and 2.3, which include all types of framing. Tables
2.9 through 2.12 summarize the comparison between measured and predicted bay
frequencies using AISC and SCI techniques for the four framing types. The predicted
system frequency of interest for comparison is Dunkerly’s estimate, fn2. In Tables 2.9
through 2.12, fn2 is replaced with fbay. Predicted beam and girder frequencies are not
evaluated in this section due to poor correlation with measured bay frequencies as shown
in the previous sections.
2.4.1 FLOORS WITH HOT-ROLLED SHAPES
Table 2.9 summarizes the results from the frequency comparison between AISC
and SCI for floors that are constructed of hot-rolled framing. From Table 2.9, the
average ratio of predicted bay frequency using the AISC Design Guide to measured
frequency (fbay/fm) is 0.80 with a modest standard deviation of 0.13. The average ratio of
predicted bay frequency using the SCI method to measured frequency (fbay/fm) is 0.96
with a modest standard deviation of 0.19.
2.4.2 FLOORS WITH HOT-ROLLED GIRDERS AND JOISTS
Table 2.10 summarizes the results from the frequency comparison between AISC
and SCI for floors that are constructed of hot-rolled girders and joist beams. From Table
2.10, the average ratio of predicted bay frequency using the AISC Design Guide to
measured frequency (fbay/fm) is 0.90 with a standard deviation of 0.20. The average ratio
of predicted bay frequency using the SCI method to measured frequency (fbay/fm) is 0.99
with a standard deviation of 0.22.
2.4.3 FLOORS WITH JOIST GIRDERS AND JOISTS
Table 2.11 summarizes the results from the frequency comparison between AISC
and SCI for floors that are constructed of joist girder and joist framing. From Table 2.11,
the average ratio of predicted bay frequency using the AISC Design Guide to measured
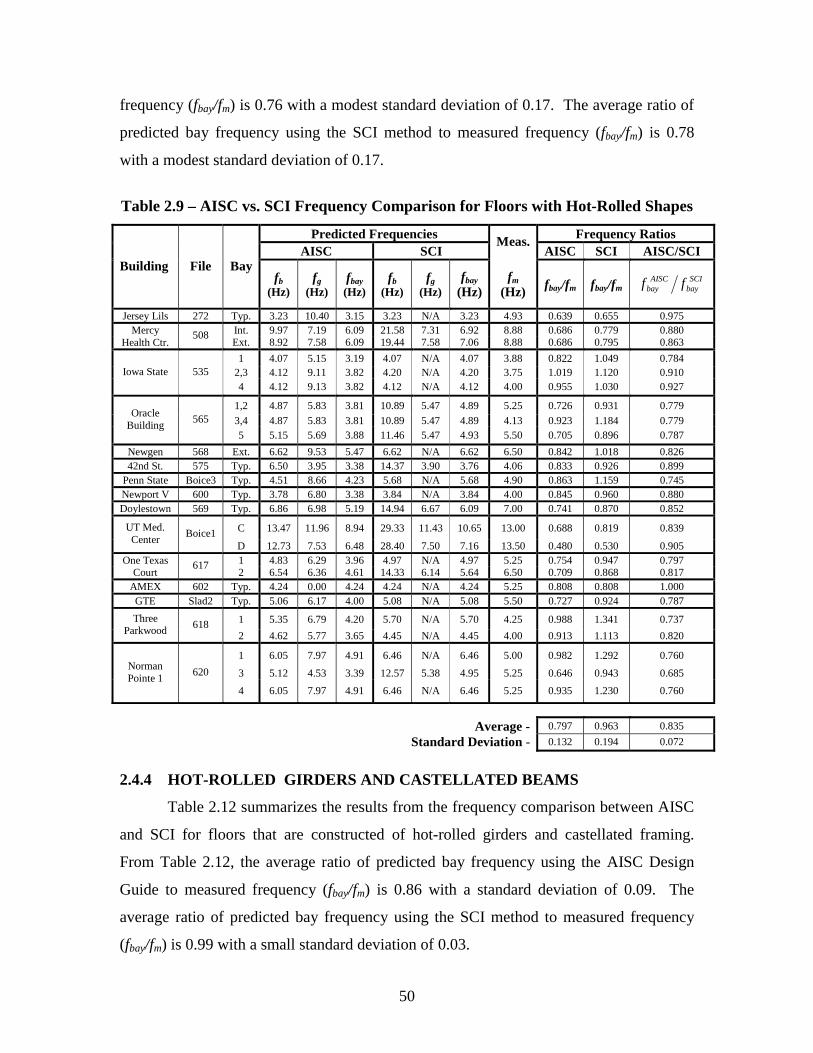
50
frequency (fbay/fm) is 0.76 with a modest standard deviation of 0.17. The average ratio of
predicted bay frequency using the SCI method to measured frequency (fbay/fm) is 0.78
with a modest standard deviation of 0.17.
Table 2.9 – AISC vs. SCI Frequency Comparison for Floors with Hot-Rolled Shapes
Predicted Frequencies Frequency Ratios AISC SCI
Meas. AISC SCI AISC/SCI
Building File Bay fb
(Hz) fg
(Hz) fbay (Hz)
fb (Hz)
fg (Hz)
fbay (Hz)
fm (Hz) fbay/fm fbay/fm SCI
bayAISC
bay ff
Jersey Lils 272 Typ. 3.23 10.40 3.15 3.23 N/A 3.23 4.93 0.639 0.655 0.975 Int. 9.97 7.19 6.09 21.58 7.31 6.92 8.88 0.686 0.779 0.880 Mercy
Health Ctr. 508
Ext. 8.92 7.58 6.09 19.44 7.58 7.06 8.88 0.686 0.795 0.863
1 4.07 5.15 3.19 4.07 N/A 4.07 3.88 0.822 1.049 0.784 2,3 4.12 9.11 3.82 4.20 N/A 4.20 3.75 1.019 1.120 0.910 Iowa State 535
4 4.12 9.13 3.82 4.12 N/A 4.12 4.00 0.955 1.030 0.927
1,2 4.87 5.83 3.81 10.89 5.47 4.89 5.25 0.726 0.931 0.779
3,4 4.87 5.83 3.81 10.89 5.47 4.89 4.13 0.923 1.184 0.779 Oracle
Building 565
5 5.15 5.69 3.88 11.46 5.47 4.93 5.50 0.705 0.896 0.787
Newgen 568 Ext. 6.62 9.53 5.47 6.62 N/A 6.62 6.50 0.842 1.018 0.826 42nd St. 575 Typ. 6.50 3.95 3.38 14.37 3.90 3.76 4.06 0.833 0.926 0.899
Penn State Boice3 Typ. 4.51 8.66 4.23 5.68 N/A 5.68 4.90 0.863 1.159 0.745 Newport V 600 Typ. 3.78 6.80 3.38 3.84 N/A 3.84 4.00 0.845 0.960 0.880 Doylestown 569 Typ. 6.86 6.98 5.19 14.94 6.67 6.09 7.00 0.741 0.870 0.852
C 13.47 11.96 8.94 29.33 11.43 10.65 13.00 0.688 0.819 0.839 UT Med. Center
Boice1 D 12.73 7.53 6.48 28.40 7.50 7.16 13.50 0.480 0.530 0.905 1 4.83 6.29 3.96 4.97 N/A 4.97 5.25 0.754 0.947 0.797 One Texas
Court 617
2 6.54 6.36 4.61 14.33 6.14 5.64 6.50 0.709 0.868 0.817 AMEX 602 Typ. 4.24 0.00 4.24 4.24 N/A 4.24 5.25 0.808 0.808 1.000 GTE Slad2 Typ. 5.06 6.17 4.00 5.08 N/A 5.08 5.50 0.727 0.924 0.787
1 5.35 6.79 4.20 5.70 N/A 5.70 4.25 0.988 1.341 0.737 Three Parkwood
618 2 4.62 5.77 3.65 4.45 N/A 4.45 4.00 0.913 1.113 0.820
1 6.05 7.97 4.91 6.46 N/A 6.46 5.00 0.982 1.292 0.760
3 5.12 4.53 3.39 12.57 5.38 4.95 5.25 0.646 0.943 0.685 Norman Pointe 1
620
4 6.05 7.97 4.91 6.46 N/A 6.46 5.25 0.935 1.230 0.760
Average - 0.797 0.963 0.835
Standard Deviation - 0.132 0.194 0.072
2.4.4 HOT-ROLLED GIRDERS AND CASTELLATED BEAMS
Table 2.12 summarizes the results from the frequency comparison between AISC
and SCI for floors that are constructed of hot-rolled girders and castellated framing.
From Table 2.12, the average ratio of predicted bay frequency using the AISC Design
Guide to measured frequency (fbay/fm) is 0.86 with a standard deviation of 0.09. The
average ratio of predicted bay frequency using the SCI method to measured frequency
(fbay/fm) is 0.99 with a small standard deviation of 0.03.
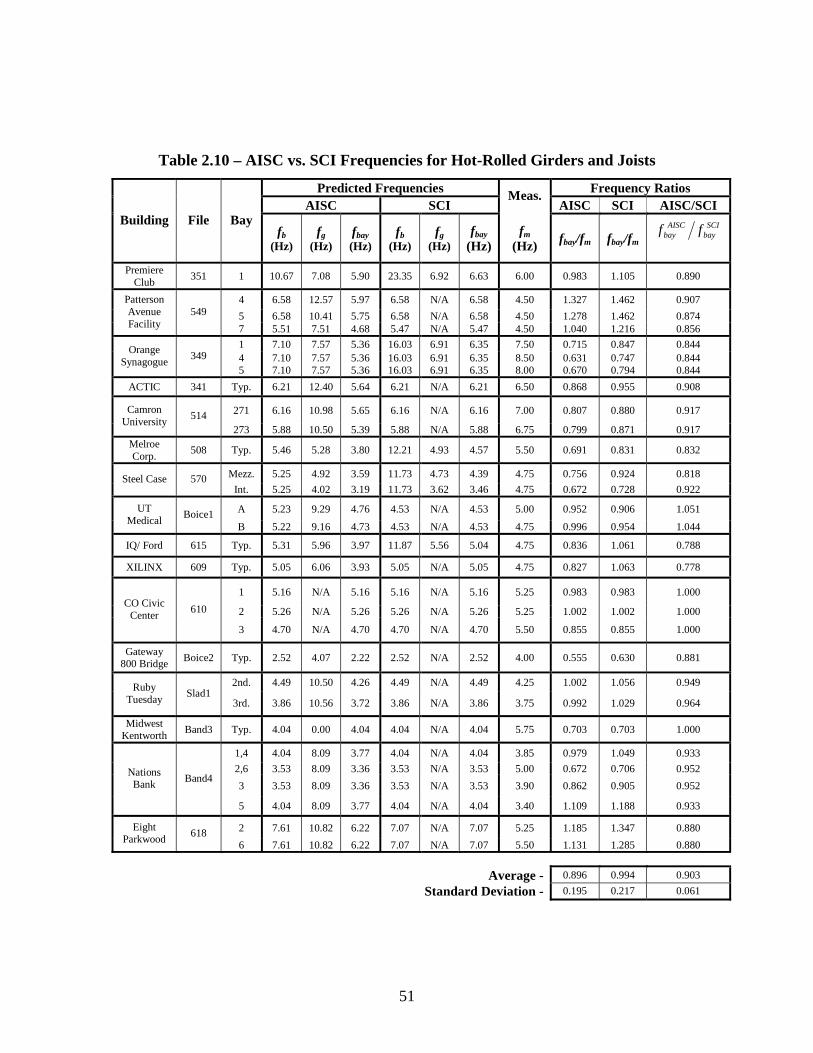
51
Table 2.10 – AISC vs. SCI Frequencies for Hot-Rolled Girders and Joists
Predicted Frequencies Frequency Ratios AISC SCI
Meas. AISC SCI AISC/SCI
Building File Bay fb
(Hz) fg
(Hz) fbay (Hz)
fb (Hz)
fg (Hz)
fbay (Hz)
fm (Hz)
fbay/fm fbay/fm SCI
bayAISC
bay ff
Premiere
Club 351 1 10.67 7.08 5.90 23.35 6.92 6.63 6.00 0.983 1.105 0.890
4 6.58 12.57 5.97 6.58 N/A 6.58 4.50 1.327 1.462 0.907
5 6.58 10.41 5.75 6.58 N/A 6.58 4.50 1.278 1.462 0.874
Patterson Avenue Facility
549
7 5.51 7.51 4.68 5.47 N/A 5.47 4.50 1.040 1.216 0.856
1 7.10 7.57 5.36 16.03 6.91 6.35 7.50 0.715 0.847 0.844 4 7.10 7.57 5.36 16.03 6.91 6.35 8.50 0.631 0.747 0.844
Orange Synagogue
349 5 7.10 7.57 5.36 16.03 6.91 6.35 8.00 0.670 0.794 0.844
ACTIC 341 Typ. 6.21 12.40 5.64 6.21 N/A 6.21 6.50 0.868 0.955 0.908
271 6.16 10.98 5.65 6.16 N/A 6.16 7.00 0.807 0.880 0.917 Camron University
514 273 5.88 10.50 5.39 5.88 N/A 5.88 6.75 0.799 0.871 0.917
Melroe Corp.
508 Typ. 5.46 5.28 3.80 12.21 4.93 4.57 5.50 0.691 0.831 0.832
Mezz. 5.25 4.92 3.59 11.73 4.73 4.39 4.75 0.756 0.924 0.818 Steel Case 570 Int. 5.25 4.02 3.19 11.73 3.62 3.46 4.75 0.672 0.728 0.922
A 5.23 9.29 4.76 4.53 N/A 4.53 5.00 0.952 0.906 1.051 UT Medical
Boice1 B 5.22 9.16 4.73 4.53 N/A 4.53 4.75 0.996 0.954 1.044
IQ/ Ford 615 Typ. 5.31 5.96 3.97 11.87 5.56 5.04 4.75 0.836 1.061 0.788
XILINX 609 Typ. 5.05 6.06 3.93 5.05 N/A 5.05 4.75 0.827 1.063 0.778
1 5.16 N/A 5.16 5.16 N/A 5.16 5.25 0.983 0.983 1.000
2 5.26 N/A 5.26 5.26 N/A 5.26 5.25 1.002 1.002 1.000 CO Civic
Center 610
3 4.70 N/A 4.70 4.70 N/A 4.70 5.50 0.855 0.855 1.000
Gateway 800 Bridge
Boice2 Typ. 2.52 4.07 2.22 2.52 N/A 2.52 4.00 0.555 0.630 0.881
2nd. 4.49 10.50 4.26 4.49 N/A 4.49 4.25 1.002 1.056 0.949 Ruby Tuesday
Slad1 3rd. 3.86 10.56 3.72 3.86 N/A 3.86 3.75 0.992 1.029 0.964
Midwest Kentworth
Band3 Typ. 4.04 0.00 4.04 4.04 N/A 4.04 5.75 0.703 0.703 1.000
1,4 4.04 8.09 3.77 4.04 N/A 4.04 3.85 0.979 1.049 0.933
2,6 3.53 8.09 3.36 3.53 N/A 3.53 5.00 0.672 0.706 0.952
3 3.53 8.09 3.36 3.53 N/A 3.53 3.90 0.862 0.905 0.952 Nations Bank
Band4
5 4.04 8.09 3.77 4.04 N/A 4.04 3.40 1.109 1.188 0.933
2 7.61 10.82 6.22 7.07 N/A 7.07 5.25 1.185 1.347 0.880 Eight Parkwood
618 6 7.61 10.82 6.22 7.07 N/A 7.07 5.50 1.131 1.285 0.880
Average - 0.896 0.994 0.903
Standard Deviation - 0.195 0.217 0.061
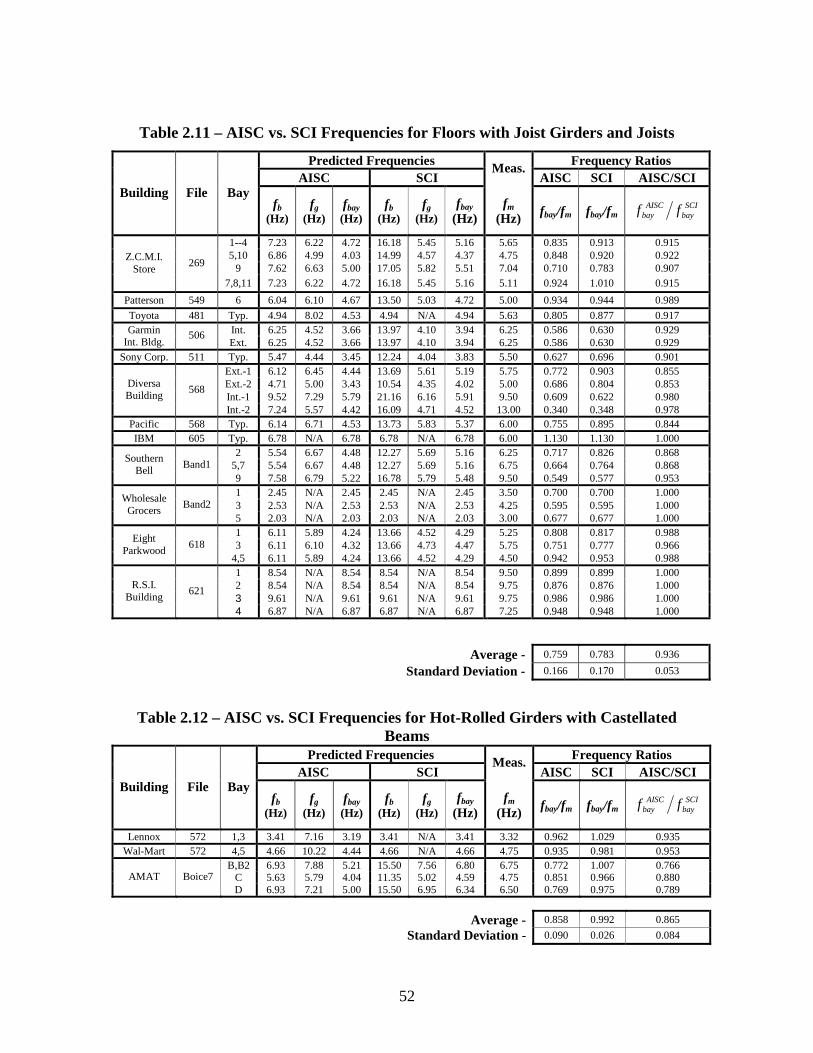
52
Table 2.11 – AISC vs. SCI Frequencies for Floors with Joist Girders and Joists
Predicted Frequencies Frequency Ratios AISC SCI
Meas. AISC SCI AISC/SCI
Building File Bay fb
(Hz) fg
(Hz) fbay (Hz)
fb (Hz)
fg (Hz)
fbay (Hz)
fm (Hz) fbay/fm fbay/fm SCI
bayAISC
bay ff
1--4 7.23 6.22 4.72 16.18 5.45 5.16 5.65 0.835 0.913 0.915 5,10 6.86 4.99 4.03 14.99 4.57 4.37 4.75 0.848 0.920 0.922
9 7.62 6.63 5.00 17.05 5.82 5.51 7.04 0.710 0.783 0.907 Z.C.M.I.
Store 269
7,8,11 7.23 6.22 4.72 16.18 5.45 5.16 5.11 0.924 1.010 0.915
Patterson 549 6 6.04 6.10 4.67 13.50 5.03 4.72 5.00 0.934 0.944 0.989
Toyota 481 Typ. 4.94 8.02 4.53 4.94 N/A 4.94 5.63 0.805 0.877 0.917 Int. 6.25 4.52 3.66 13.97 4.10 3.94 6.25 0.586 0.630 0.929 Garmin
Int. Bldg. 506
Ext. 6.25 4.52 3.66 13.97 4.10 3.94 6.25 0.586 0.630 0.929 Sony Corp. 511 Typ. 5.47 4.44 3.45 12.24 4.04 3.83 5.50 0.627 0.696 0.901
Ext.-1 6.12 6.45 4.44 13.69 5.61 5.19 5.75 0.772 0.903 0.855 Ext.-2 4.71 5.00 3.43 10.54 4.35 4.02 5.00 0.686 0.804 0.853 Int.-1 9.52 7.29 5.79 21.16 6.16 5.91 9.50 0.609 0.622 0.980
Diversa Building
568
Int.-2 7.24 5.57 4.42 16.09 4.71 4.52 13.00 0.340 0.348 0.978 Pacific 568 Typ. 6.14 6.71 4.53 13.73 5.83 5.37 6.00 0.755 0.895 0.844 IBM 605 Typ. 6.78 N/A 6.78 6.78 N/A 6.78 6.00 1.130 1.130 1.000
2 5.54 6.67 4.48 12.27 5.69 5.16 6.25 0.717 0.826 0.868 5,7 5.54 6.67 4.48 12.27 5.69 5.16 6.75 0.664 0.764 0.868
Southern Bell
Band1 9 7.58 6.79 5.22 16.78 5.79 5.48 9.50 0.549 0.577 0.953 1 2.45 N/A 2.45 2.45 N/A 2.45 3.50 0.700 0.700 1.000 3 2.53 N/A 2.53 2.53 N/A 2.53 4.25 0.595 0.595 1.000
Wholesale Grocers
Band2 5 2.03 N/A 2.03 2.03 N/A 2.03 3.00 0.677 0.677 1.000 1 6.11 5.89 4.24 13.66 4.52 4.29 5.25 0.808 0.817 0.988 3 6.11 6.10 4.32 13.66 4.73 4.47 5.75 0.751 0.777 0.966
Eight Parkwood
618 4,5 6.11 5.89 4.24 13.66 4.52 4.29 4.50 0.942 0.953 0.988 1 8.54 N/A 8.54 8.54 N/A 8.54 9.50 0.899 0.899 1.000 2 8.54 N/A 8.54 8.54 N/A 8.54 9.75 0.876 0.876 1.000 3 9.61 N/A 9.61 9.61 N/A 9.61 9.75 0.986 0.986 1.000
R.S.I. Building
621
4 6.87 N/A 6.87 6.87 N/A 6.87 7.25 0.948 0.948 1.000
Average - 0.759 0.783 0.936
Standard Deviation - 0.166 0.170 0.053
Table 2.12 – AISC vs. SCI Frequencies for Hot-Rolled Girders with Castellated Beams
Predicted Frequencies Frequency Ratios AISC SCI
Meas. AISC SCI AISC/SCI
Building File Bay fb
(Hz) fg
(Hz) fbay (Hz)
fb (Hz)
fg (Hz)
fbay (Hz)
fm (Hz)
fbay/fm fbay/fm SCIbay
AISCbay ff
Lennox 572 1,3 3.41 7.16 3.19 3.41 N/A 3.41 3.32 0.962 1.029 0.935 Wal-Mart 572 4,5 4.66 10.22 4.44 4.66 N/A 4.66 4.75 0.935 0.981 0.953
B,B2 6.93 7.88 5.21 15.50 7.56 6.80 6.75 0.772 1.007 0.766 C 5.63 5.79 4.04 11.35 5.02 4.59 4.75 0.851 0.966 0.880 AMAT Boice7 D 6.93 7.21 5.00 15.50 6.95 6.34 6.50 0.769 0.975 0.789
Average - 0.858 0.992 0.865
Standard Deviation - 0.090 0.026 0.084
53
2.5 FREQUENCY EVALUATION OF BRITISH FLOORS
This section focuses on comparing the methods provided by AISC and SCI for
predicting the fundamental natural frequency of structural floor systems. Fourteen case
studies of floors previously evaluated in the SCI publication Design Guide for Vibration
of Long Span Composite Floors (Hicks, et al. 2000) are assessed. These floors use hot-
rolled, castellated, or cellular framing. Cellular beams are similar to castellated beams in
that the cross sectional properties for both are non-prismatic. Therefore, net rather than
gross section properties were used when modeling the floor systems.
Again, predicted system frequencies based on the AISC Design Guide are
calculated using the techniques discussed in Section 2.2. SCI predictions of system
frequencies are calculated using the techniques presented in Section 1.4.3. Tables 2.13
and 2.14 summarize the comparison between measured and predicted bay frequencies
using the AISC and SCI methods. Measured frequencies are plotted against predicted
system frequencies in Figure 2.11. Again, the predicted frequencies that are of interest
for comparison are Dunkerly’s estimate, fn2, as well as approximations using fn
4 and 6nf .
Predicted beam and girder frequencies are not evaluated in this section due to poor
correlation with measured bay frequencies. In Tables 2.13 and 2.14, fn2 is replaced with
fbay. In addition, system properties are investigated and compared for an example floor
system originally tested by SCI. Specifically, differences in effective width and
composite moment of inertia values are examined.
2.5.1 AISC FREQUENCY EVALUATION OF BRITISH FLOORS
The AISC Design Guide proved to be a fairly accurate tool for predicting the
fundamental natural frequencies of the British floor systems. From Table 2.13, the
average ratio of predicted system frequency to measured frequency (fbay/fm) is 0.93.
However, a modest standard deviation of 0.18 suggests that the data is moderately
scattered. The average ratio of predicted system frequency to measured frequency (fn4/fm)
is 1.00 with a standard deviation of 0.15, and for (fn6/fm) is 1.02 with a modest standard
deviation of 0.15.
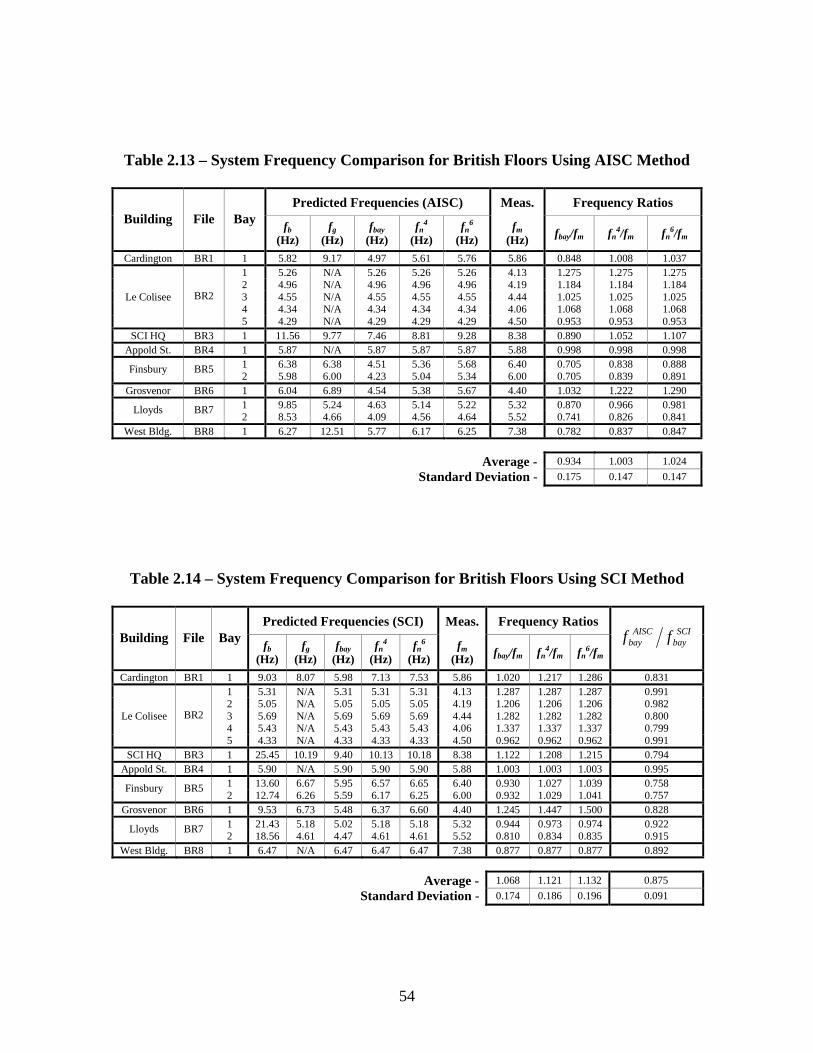
54
Table 2.13 – System Frequency Comparison for British Floors Using AISC Method
Predicted Frequencies (AISC) Meas. Frequency Ratios Building File Bay
fb
(Hz) fg
(Hz) fbay
(Hz) fn
4 (Hz)
fn6
(Hz) fm
(Hz) fbay/fm fn4/fm fn
6/fm
Cardington BR1 1 5.82 9.17 4.97 5.61 5.76 5.86 0.848 1.008 1.037 1 5.26 N/A 5.26 5.26 5.26 4.13 1.275 1.275 1.275 2 4.96 N/A 4.96 4.96 4.96 4.19 1.184 1.184 1.184 3 4.55 N/A 4.55 4.55 4.55 4.44 1.025 1.025 1.025 4 4.34 N/A 4.34 4.34 4.34 4.06 1.068 1.068 1.068
Le Colisee
BR2
5 4.29 N/A 4.29 4.29 4.29 4.50 0.953 0.953 0.953 SCI HQ BR3 1 11.56 9.77 7.46 8.81 9.28 8.38 0.890 1.052 1.107
Appold St. BR4 1 5.87 N/A 5.87 5.87 5.87 5.88 0.998 0.998 0.998 1 6.38 6.38 4.51 5.36 5.68 6.40 0.705 0.838 0.888 Finsbury BR5 2 5.98 6.00 4.23 5.04 5.34 6.00 0.705 0.839 0.891
Grosvenor BR6 1 6.04 6.89 4.54 5.38 5.67 4.40 1.032 1.222 1.290 1 9.85 5.24 4.63 5.14 5.22 5.32 0.870 0.966 0.981 Lloyds BR7 2 8.53 4.66 4.09 4.56 4.64 5.52 0.741 0.826 0.841
West Bldg. BR8 1 6.27 12.51 5.77 6.17 6.25 7.38 0.782 0.837 0.847
Average - 0.934 1.003 1.024
Standard Deviation - 0.175 0.147 0.147
Table 2.14 – System Frequency Comparison for British Floors Using SCI Method
Predicted Frequencies (SCI) Meas. Frequency Ratios Building File Bay
fb
(Hz) fg
(Hz) fbay
(Hz) fn
4 (Hz)
fn6
(Hz) fm
(Hz) fbay/fm fn4/fm fn
6/fm
SCIbay
AISCbay ff
Cardington BR1 1 9.03 8.07 5.98 7.13 7.53 5.86 1.020 1.217 1.286 0.831 1 5.31 N/A 5.31 5.31 5.31 4.13 1.287 1.287 1.287 0.991 2 5.05 N/A 5.05 5.05 5.05 4.19 1.206 1.206 1.206 0.982 3 5.69 N/A 5.69 5.69 5.69 4.44 1.282 1.282 1.282 0.800 4 5.43 N/A 5.43 5.43 5.43 4.06 1.337 1.337 1.337 0.799
Le Colisee
BR2
5 4.33 N/A 4.33 4.33 4.33 4.50 0.962 0.962 0.962 0.991 SCI HQ BR3 1 25.45 10.19 9.40 10.13 10.18 8.38 1.122 1.208 1.215 0.794
Appold St. BR4 1 5.90 N/A 5.90 5.90 5.90 5.88 1.003 1.003 1.003 0.995 1 13.60 6.67 5.95 6.57 6.65 6.40 0.930 1.027 1.039 0.758 Finsbury BR5 2 12.74 6.26 5.59 6.17 6.25 6.00 0.932 1.029 1.041 0.757
Grosvenor BR6 1 9.53 6.73 5.48 6.37 6.60 4.40 1.245 1.447 1.500 0.828 1 21.43 5.18 5.02 5.18 5.18 5.32 0.944 0.973 0.974 0.922 Lloyds BR7 2 18.56 4.61 4.47 4.61 4.61 5.52 0.810 0.834 0.835 0.915
West Bldg. BR8 1 6.47 N/A 6.47 6.47 6.47 7.38 0.877 0.877 0.877 0.892
Average - 1.068 1.121 1.132 0.875
Standard Deviation - 0.174 0.186 0.196 0.091
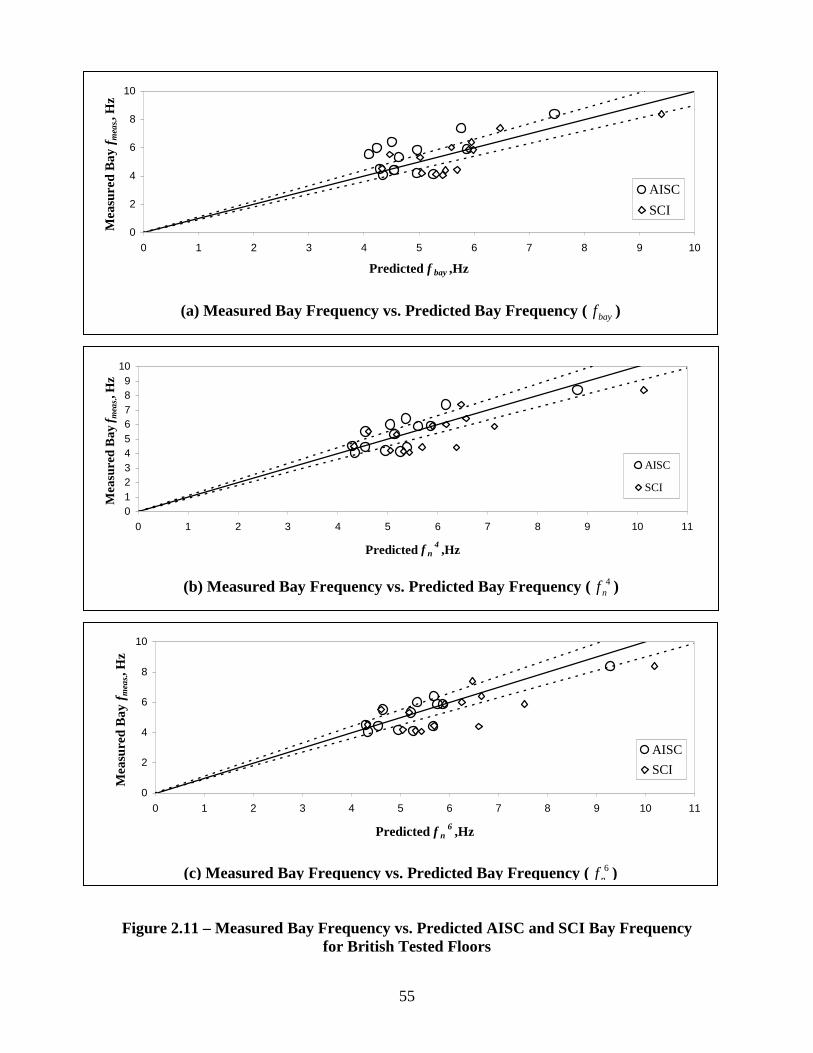
55
Figure 2.11 – Measured Bay Frequency vs. Predicted AISC and SCI Bay Frequency for British Tested Floors
0
2
4
6
8
10
0 1 2 3 4 5 6 7 8 9 10
Predicted f bay ,Hz
Mea
sure
d B
ay f
mea
s.,H
z
AISC
SCI
(a) Measured Bay Frequency vs. Predicted Bay Frequency ( bayf )
0
2
4
6
8
10
0 1 2 3 4 5 6 7 8 9 10 11
Predicted f n6 ,Hz
Mea
sure
d B
ay f
mea
s.,H
z
AISC
SCI
(c) Measured Bay Frequency vs. Predicted Bay Frequency ( 6nf )
0123456789
10
0 1 2 3 4 5 6 7 8 9 10 11
Predicted f n4 ,Hz
Mea
sure
d B
ay f m
eas., H
z
AISC
SCI
(b) Measured Bay Frequency vs. Predicted Bay Frequency ( 4
nf )
56
The predicted bay frequencies, fn2, are plotted against the measured system
frequencies in Figure 2.11(a). This figure illustrates that the predicted bay frequencies
are within 10 % of the measured bay frequencies for only 6 of the 14 floors studied by
SCI but using the AISC prediction method. The predicted bay frequencies, using the
revision fn4, are plotted against the measured system frequencies in Figure 2.11(b), where
the predicted system frequencies are within 10 % of the measured bay frequencies for 7
of the 14 floors. The predicted bay frequencies, using the revision fn6, are plotted against
the measured frequencies in Figure 2.11(c), where the predicted system frequencies are
within 10 % of the measured bay frequencies for 7 of the 14 floors studied by SCI.
2.5.2 SCI FREQUENCY EVALUATION OF BRITISH FLOORS
The methods provided by Steel Construction Institute also proved to be a fairly
accurate tool for predicting the fundamental natural frequencies of the British floor
systems. From Table 2.14, the average ratio of predicted system frequency to measured
frequency (fbay/fm) is 1.07. However, a modest standard deviation of 0.17 suggests that
the data is moderately scattered. The average ratio of predicted system frequency to
measured frequency (fn4/fm) is 1.12 with a standard deviation of 0.19, and for (fn
6/fm) is
1.13 with a standard deviation of 0.20.
The predicted bay frequencies, fn2, are plotted against the measured system
frequencies in Figure 2.11(a). This figure illustrates that the predicted bay frequencies
are within 10 % of the measured bay frequencies for only 6 of the 14 floors studied by
SCI. The predicted bay frequencies, using the revision 4nf , are plotted against the
measured system frequencies in Figure 2.11(b). This figure illustrates that the predicted
system frequencies are within 10 % of the measured bay frequencies for only 5 of the 14
British case studies. The predicted bay frequencies, using the revision fn6, are plotted
against the measured frequencies in Figure 2.11(c). This figure illustrates that the
predicted system frequencies are within 10 % of the measured bay frequencies for 5 of 14
British case studies.
57
2.5.3 EXAMPLE EVALUATION OF A SCI TESTED FLOOR
To further explore the differences between the AISC and SCI methods, basic
system properties are investigated and compared in this section. Specifically, differences
in effective width, composite moment of inertia, and frequency are examined for a
particular floor tested by SCI. In Section 2.5.2, the SCI method assumes a fixed-ended
boundary condition for the secondary framing when evaluating a floor based on the
flexibility of the primary framing. However, for purposes of comparison, simply
supported conditions are assumed for both beam and girder frequency calculations in this
section. Also, reductions of deflections due to stiffening provided by adjacent bays are
neglected for both methods.
The floor system used in the comparison, shown in Figure 2.11, is of the SCI
headquarters in Ascot, Great Britain. The secondary floor framing of a typical bay
consists of 305X127UB42 beams spaced at 98 in. with a span of 19 ft-8in. The beams
are supported by 686X152 castellated girders. The girders span 24 ft-5 in. The floor slab
is 5-1/8 in. total depth normal weight concrete supported by 2 in. deep composite form
deck. The loading on the bay includes the self-weight of the slab and decking as well as
non-structural components such as services, ceilings, raised floors, mechanical ductwork,
and office furniture.
Table 2.15 shows the general, beam mode and girder mode properties for the
AISC and SCI methods. The concrete compressive strength (fc’) is not used in the United
Kingdom. The equivalent concrete compressive strength used in AISC calculations is
found by back calculating from the dynamic modular ratio of 5.29 used by SCI for
normal weight concrete. The dynamic modular ratio is taken as the modulus of elasticity
for steel (Es) divided by 1.35 times the modulus of elasticity for concrete (Ec). To
account for dynamic effects under load, the modulus of elasticity for concrete is
increased. The resulting equivalent concrete compressive strength used in the AISC
calculations is 5.0 ksi. (Note : For lightweight concrete, the dynamic modular ratio used
by SCI is 9.31 and the corresponding concrete compressive strength is 3.8 ksi.)
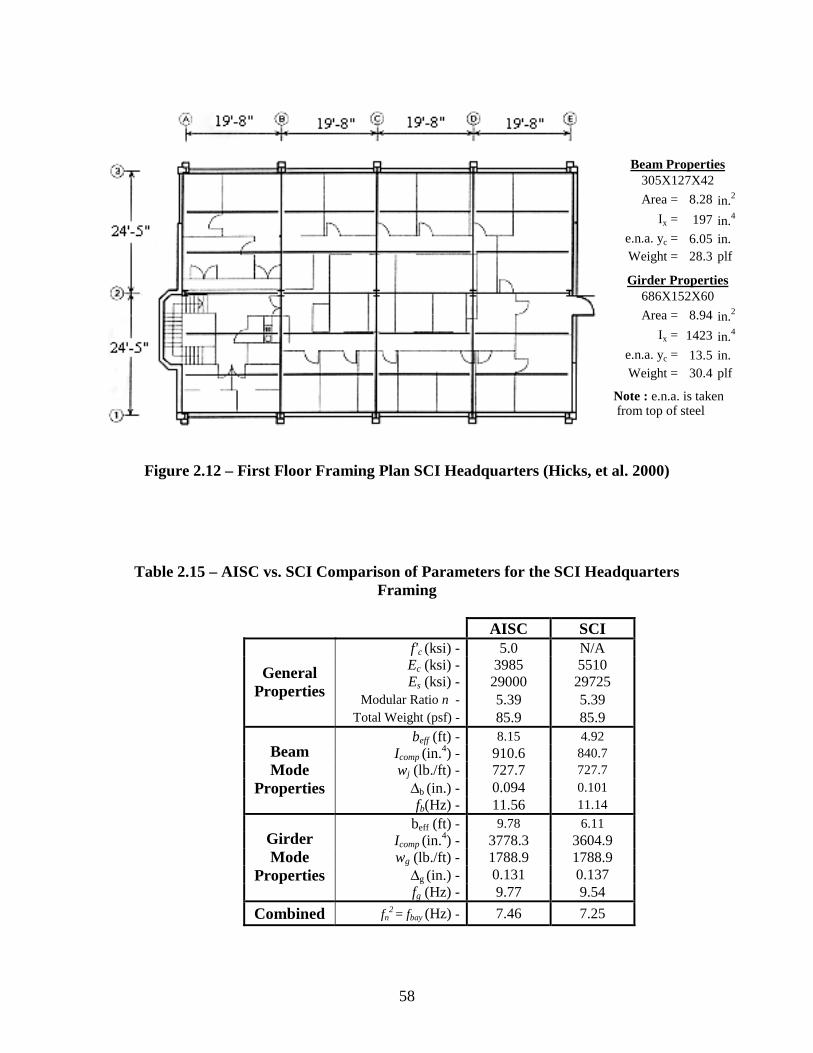
58
Figure 2.12 – First Floor Framing Plan SCI Headquarters (Hicks, et al. 2000)
Table 2.15 – AISC vs. SCI Comparison of Parameters for the SCI Headquarters Framing
AISC SCI
f'c (ksi) - 5.0 N/A Ec (ksi) - 3985 5510 Es (ksi) - 29000 29725
Modular Ratio n - 5.39 5.39
General Properties
Total Weight (psf) - 85.9 85.9 beff (ft) - 8.15 4.92
Icomp (in.4) - 910.6 840.7 wj (lb./ft) - 727.7 727.7
∆b (in.) - 0.094 0.101
Beam Mode
Properties fb(Hz) - 11.56 11.14
beff (ft) - 9.78 6.11 Icomp (in.4) - 3778.3 3604.9 wg (lb./ft) - 1788.9 1788.9
∆g (in.) - 0.131 0.137
Girder Mode
Properties fg (Hz) - 9.77 9.54
Combined fn2 = fbay (Hz) - 7.46 7.25
Area = 8.28 in.2
Ix = 197 in.4
e.n.a. yc = 6.05 in.Weight = 28.3 plf
Area = 8.94 in.2
Ix = 1423 in.4
e.n.a. yc = 13.5 in.Weight = 30.4 plf
686X152X60
Note : e.n.a. is taken from top of steel
Beam Properties305X127X42
Girder Properties
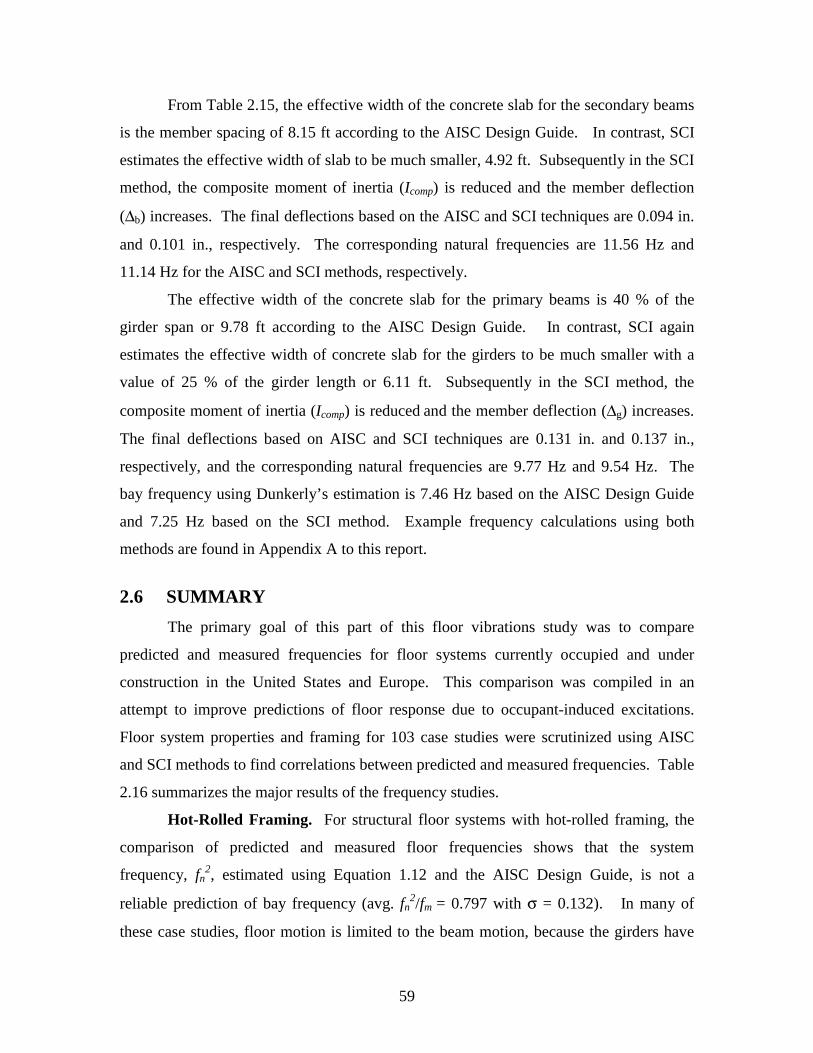
59
From Table 2.15, the effective width of the concrete slab for the secondary beams
is the member spacing of 8.15 ft according to the AISC Design Guide. In contrast, SCI
estimates the effective width of slab to be much smaller, 4.92 ft. Subsequently in the SCI
method, the composite moment of inertia (Icomp) is reduced and the member deflection
(∆b) increases. The final deflections based on the AISC and SCI techniques are 0.094 in.
and 0.101 in., respectively. The corresponding natural frequencies are 11.56 Hz and
11.14 Hz for the AISC and SCI methods, respectively.
The effective width of the concrete slab for the primary beams is 40 % of the
girder span or 9.78 ft according to the AISC Design Guide. In contrast, SCI again
estimates the effective width of concrete slab for the girders to be much smaller with a
value of 25 % of the girder length or 6.11 ft. Subsequently in the SCI method, the
composite moment of inertia (Icomp) is reduced and the member deflection (∆g) increases.
The final deflections based on AISC and SCI techniques are 0.131 in. and 0.137 in.,
respectively, and the corresponding natural frequencies are 9.77 Hz and 9.54 Hz. The
bay frequency using Dunkerly’s estimation is 7.46 Hz based on the AISC Design Guide
and 7.25 Hz based on the SCI method. Example frequency calculations using both
methods are found in Appendix A to this report.
2.6 SUMMARY
The primary goal of this part of this floor vibrations study was to compare
predicted and measured frequencies for floor systems currently occupied and under
construction in the United States and Europe. This comparison was compiled in an
attempt to improve predictions of floor response due to occupant-induced excitations.
Floor system properties and framing for 103 case studies were scrutinized using AISC
and SCI methods to find correlations between predicted and measured frequencies. Table
2.16 summarizes the major results of the frequency studies.
Hot-Rolled Framing. For structural floor systems with hot-rolled framing, the
comparison of predicted and measured floor frequencies shows that the system
frequency, fn2, estimated using Equation 1.12 and the AISC Design Guide, is not a
reliable prediction of bay frequency (avg. fn2/fm = 0.797 with σ = 0.132). In many of
these case studies, floor motion is limited to the beam motion, because the girders have
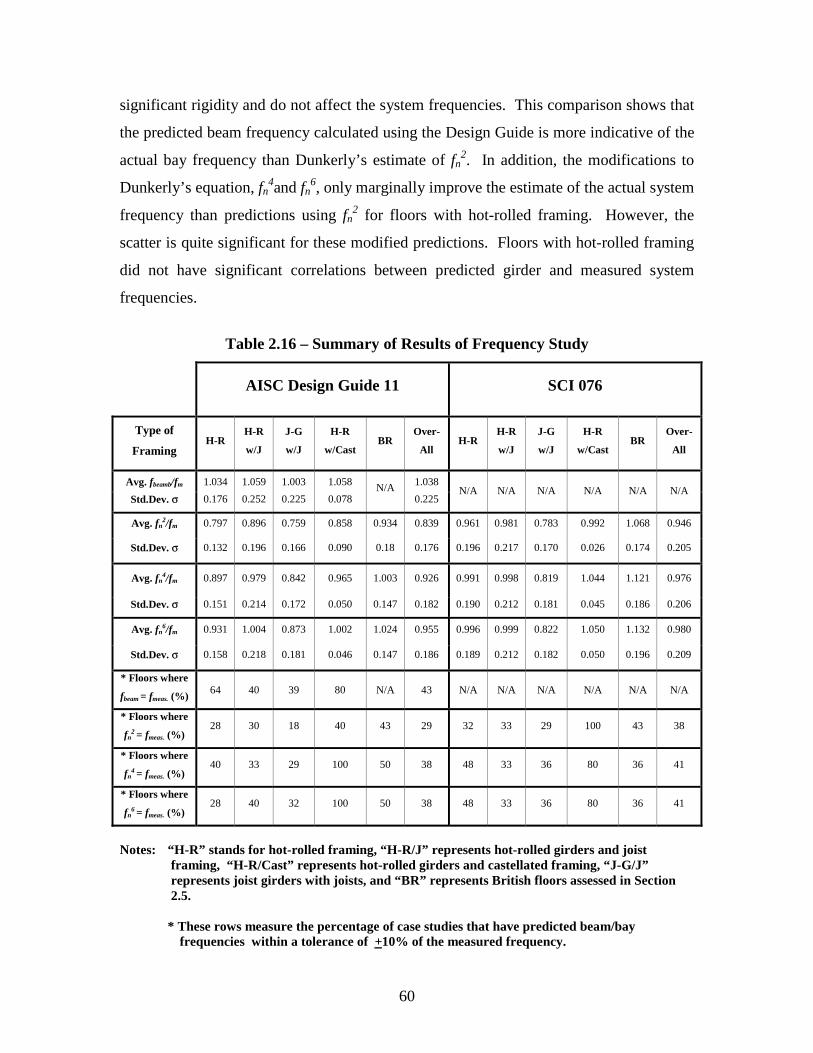
60
significant rigidity and do not affect the system frequencies. This comparison shows that
the predicted beam frequency calculated using the Design Guide is more indicative of the
actual bay frequency than Dunkerly’s estimate of fn2. In addition, the modifications to
Dunkerly’s equation, fn4and fn
6, only marginally improve the estimate of the actual system
frequency than predictions using fn2 for floors with hot-rolled framing. However, the
scatter is quite significant for these modified predictions. Floors with hot-rolled framing
did not have significant correlations between predicted girder and measured system
frequencies.
Table 2.16 – Summary of Results of Frequency Study
AISC Design Guide 11 SCI 076
Type of
Framing H-R
H-R
w/J
J-G
w/J
H-R
w/Cast BR
Over-
All H-R
H-R
w/J
J-G
w/J
H-R
w/Cast BR
Over-
All
Avg. fbeamb/fm 1.034 1.059 1.003 1.058 1.038
Std.Dev. σ 0.176 0.252 0.225 0.078 N/A
0.225 N/A N/A N/A N/A N/A N/A
Avg. fn2/fm 0.797 0.896 0.759 0.858 0.934 0.839 0.961 0.981 0.783 0.992 1.068 0.946
Std.Dev. σ 0.132 0.196 0.166 0.090 0.18 0.176 0.196 0.217 0.170 0.026 0.174 0.205
Avg. fn4/fm 0.897 0.979 0.842 0.965 1.003 0.926 0.991 0.998 0.819 1.044 1.121 0.976
Std.Dev. σ 0.151 0.214 0.172 0.050 0.147 0.182 0.190 0.212 0.181 0.045 0.186 0.206
Avg. fn6/fm 0.931 1.004 0.873 1.002 1.024 0.955 0.996 0.999 0.822 1.050 1.132 0.980
Std.Dev. σ 0.158 0.218 0.181 0.046 0.147 0.186 0.189 0.212 0.182 0.050 0.196 0.209
* Floors where
fbeam = fmeas. (%) 64 40 39 80 N/A 43 N/A N/A N/A N/A N/A N/A
* Floors where
fn2 = fmeas. (%)
28 30 18 40 43 29 32 33 29 100 43 38
* Floors where
fn4 = fmeas. (%)
40 33 29 100 50 38 48 33 36 80 36 41
* Floors where
fn6 = fmeas. (%)
28 40 32 100 50 38 48 33 36 80 36 41
Notes: “H-R” stands for hot-rolled framing, “H-R/J” represents hot-rolled girders and joist
framing, “H-R/Cast” represents hot-rolled girders and castellated framing, “J-G/J” represents joist girders with joists, and “BR” represents British floors assessed in Section 2.5.
* These rows measure the percentage of case studies that have predicted beam/bay
frequencies within a tolerance of +10% of the measured frequency.
61
The methods used by the Steel Construction Institute Guide are reliable for
predicting bay frequencies, fn2, for floors constructed of hot-rolled shapes (avg. fn
2/fm =
0.961 with σ = 0.196). The modifications to Dunkerly’s equation, fn4and fn
6, also provide
better estimates of the system frequency than predictions using fn2 for floors with hot-
rolled framing. However, the scatter is quite significant for these modified predictions.
Floors with hot-rolled framing evaluated using SCI techniques did not have significant
correlations between predicted beam or girder and measured system frequencies.
Hot-Rolled Girders and Joist Beams. For structural floor systems with hot-
rolled girders and joist framing, the comparison of predicted and measured floor
frequencies reveals that the system frequency, fn2, estimated using Equation 1.12 and the
AISC Design Guide, is again not a reliable prediction of bay frequency (avg. fn2/fm =
0.896 with σ = 0.196). This comparison also shows that the predicted beam frequency is
not an accurate prediction of the fundamental natural frequency of floor systems utilizing
hot-rolled and joist framing. The modifications to Dunkerly’s equation, fn4and fn
6,
estimate the system frequency with the same accuracy as predictions using beamf .
However, the scatter is quite significant for these modified predictions.
The methods used by the Steel Construction Institute Guide are reliable for
predicting bay frequencies using Dunkerly’s approximation, fn2, for floors constructed of
hot-rolled girders and joists (avg. fn2/fm = 0.981 with σ = 0.217). In addition, the
modifications to Dunkerly’s equation, fn4and fn
6, estimate the system frequency with
better accuracy than predictions using fn2 for floors with hot-rolled girders and joist
framing. However, the scatter is quite significant for these modified predictions. Floors
with hot-rolled girders and joist framing evaluated using SCI techniques did not have
significant correlations between predicted beam or girder and measured system
frequencies.
Joist Girders and Joists. For structural floor systems with joist girders and
joists, the comparison of predicted and measured floor frequencies shows that the system
frequency, fn2, estimated using Equation 1.12 and the AISC Design Guide, is not a
reliable prediction of bay frequency (avg. fn2/fm = 0.759 with σ = 0.166). This
comparison also shows that the predicted joist frequency is not an accurate prediction of
the fundamental natural frequency of floor systems utilizing joist girder and joist framing.
62
The modifications to Dunkerly’s equation, fn4and fn
6, estimate the system frequency with
less accuracy than predictions using fn2. The scatter is quite significant for these modified
predictions.
The methods used by the Steel Construction Institute Guide are also not reliable
for predicting bay frequencies, fn2, of floors constructed with joist girders and joists (avg.
fn2/fm = 0.783 with σ = 0.170). In addition, the modifications to Dunkerly’s equation,
fn4and fn
6, marginally improve the estimate of the system frequency than predictions using
fn2 for floors with joist girders and joists. However, the scatter is quite significant for
these modified predictions. Floors with joist girders and joist framing evaluated using
SCI techniques did not have significant correlations between predicted beam or girder
and measured system frequencies.
Hot-Rolled Girders and Castellated Beams. Only six case studies of bays with
hot-rolled girders and castellated framing were evaluated in the study. For structural
floor systems with hot-rolled girders and castellated beams, the comparison of predicted
and measured floor frequencies shows that the system frequency, fn2, estimated using
Equation 1.12 and the AISC Design Guide, is reliable for about 50 % of the predictions
(avg. fn2/fm = 0.858 with σ = 0.090). This comparison shows that the predicted beam
frequency is more indicative of the bay frequency than Dunkerly’s estimate of fn2. In
addition, the modifications to Dunkerly’s equation, fn4and fn
6, estimate the system
frequency with better accuracy than predictions using fn2 for floors with hot-rolled girders
and castellated framing. In addition, the scatter in the data is quite low for these modified
predictions.
The methods used by the Steel Construction Institute Guide are reliable for
predicting bay frequencies, fn2, for floors constructed of hot-rolled girders and castellated
framing (avg. fn2/fm = 0.992 with σ = 0.026). The modifications to Dunkerly’s equation,
fn4and fn
6, also estimate the system frequency with good accuracy for floors with hot-
rolled and castellated framing. However, the scatter is quite significant for these
modified predictions. Floors with hot-rolled girders and castellated framing evaluated
using SCI techniques did not have significant correlations between predicted beam or
girder and measured system frequencies.
63
British Floors. The AISC Design Guide on average underestimated the bay
frequency by 7 % for the floor systems previously evaluated in the SCI publication
Design Guide for Vibration of Long Span Composite Floors (Hicks, et al. 2000). The
SCI method on average overestimated the bay frequency by 7 % for the same floor
systems. Modest scatter in the data suggests that the predicted bay frequency, fn2,
calculated using both methods is a moderately reliable prediction for these tested floors.
The differences between the predicted frequencies arise from varying assumptions on
deflection reductions and boundary conditions for deflection estimations. The AISC
Design Guide and SCI also have different definitions for the effective width of slab,
which has significantly affects the estimation of the composite moment of inertia for
primary and secondary beams.
64
CHAPTER III – FLOOR VIBRATIONS CRITERIA COMPARISONS
3.1 INTRODUCTION
Predicting the response of framing systems is important when evaluating floors
for acceptability. Many criteria are used in the United States and the United Kingdom to
help determine the tolerability of floor system response due to occupant-induced
vibrations. This chapter evaluates occupied floor systems for case studies using four
separate acceptability criteria and compares the results with subjective analyses based on
field observations. The four acceptability criteria used to evaluate these case studies in
this chapter are the American Institute of Steel Construction Design Guide 11 Floor
Vibrations Due to Human Activity (Murray, et al. 1997), the Modified Reiher-Meister
scale, the Murray Criterion, and enhancements to the Steel Construction Institute criteria
outlined in Design Guide for Vibrations of Long Span Composite Floors (Hicks, et al.
2000). Details of the backgrounds of these four acceptability criteria are discussed in
Chapter I of this study. The AISC and SCI acceptability criteria are the most current
methods used for evaluating floor system behavior in the United States and Great Britain.
With the advent of light-weight and stronger construction materials, past assumptions and
methods required for the Modified Reiher-Meister scale and the Murray Criterion are
becoming outdated. Therefore, comparing past and present acceptability criteria will
provide insight into the development and progress of floor vibration research. Through
comparison of analyses and experimental data for existing floor systems, the correlation
between predicted and measured behavior may be improved.
This chapter provides a comparison of predicted and observed behavior from 51
case studies involving office floors currently being occupied and used in the United
States. The type of framing used during construction differentiates the structural floor
systems. Similar to the previous chapter, the classifications for framing are “hot-rolled
beams”, “hot-rolled beams with joists”, and “joist girders with joists”. The controlling
girder, which has the most deflection and the lowest frequency, is considered when
65
classifying a floor system with two different types of girders used in the framing. (The
castellated framing case studies were not fully constructed at the time of testing.
Therefore, these case studies are not evaluated in this chapter.) The results from the
acceptability evaluations are then compared with subjective field observations of actual
floor behavior and system properties at the time of the testing. The subjective analyses
are based on the expertise of the measurement team present, as well as, the opinions of
the occupants who were occupying the office spaces at the time of testing.
Supplemental material for this report is found in the publication by Boice and
Murray (2003) and contains summary sheets of the case studies used in the frequency and
criteria comparisons. These sheets include floor systems properties such as damping,
framing, loading, predicted and measured fundamental frequencies, accelerations, and
slab properties. In addition, the supplemental material contains framing plans for the
floor systems evaluated in this chapter. Appendix A provides example calculations for
determining floor acceptability based on the Steel Construction Institute criteria. The
sample calculations for SCI accelerations and acceptability are based on predicted SCI
system frequencies.
3.2 CRITERIA COMPARISON RESULTS
Tables 3.1 through 3.3 summarize the results from the acceptability evaluations
for the assessed case studies. Agreement between subjective analyses and acceptability
criteria presented in the Design Guide is based on the predicted peak accelerations of the
office floor systems. For example, floors with predicted peak accelerations above 0.50 %
of gravity should exhibit annoying floor vibrations and subsequently have complaints
from the occupants. Agreement between subjective analyses and the Murray Criterion is
based on a minimum required damping value needed to limit vibrations of office floor
systems. For the Murray Criterion, building owners with floor systems having required
damping value above 4.5 % should receive complaints from the occupants due to the
vibrations. Agreement between subjective analyses and the Modified Reiher-Meister
scale is based on the chart shown in Figure 1.6. According to the figure, floor systems
that plot above the upper one-half of the distinctly perceptible range will result in
complaints from the occupants (Murray 1975). Agreement between subjective analyses
66
and acceptability criteria presented by the Steel Construction Institute is based on the
root-mean-square (rms) accelerations of the office floor systems. For example, floors
with root-mean-square accelerations above the acceleration limits should also exhibit
annoying floor vibrations and subsequently have complaints from the occupants. The
acceleration limits are based on the type of office environment and established using
Equations 1.21 and 1.22. In addition, the damping value, β, corresponding to
recommendations in the AISC Design Guide for the location at the time of testing, as
well as, predicted and measured system frequencies are provided in Tables 3.1 through
3.3 in order to draw a parallel with the results of the criteria comparisons.
3.2.1 FLOORS WITH HOT-ROLLED SHAPES
Table 3.1 shows the results of the criteria comparisons for floor systems
comprised of hot-rolled shapes for primary members. From the data presented, 17 of 19
or about 89 % of the case studies analyzed using the Design Guide criteria agree with the
corresponding subjective analyses of the behavior of the floor systems. When the case
studies were evaluated using the Murray Criterion, about 68 % of the floor systems
comply with the corresponding subjective analyses. The case studies evaluated using the
Modified Reiher-Meister acceptability scale have the least compliance with only 47 % of
the floor systems agreeing with the subjective analyses of the system performance. The
case studies evaluated using the Steel Construction Institute acceptability criteria have
about 68 % compliance with the subjective evaluations. Only about 42 % of the case
studies have complete agreement between all four of the acceptability criteria and the
corresponding subjective analyses. Only about 11 % of the case studies show complete
disagreement between all four of the acceptability criteria and the corresponding
subjective analyses.
3.2.2 FLOORS WITH HOT-ROLLED GIRDERS AND JOISTS
Table 3.2 shows the results of the criteria comparisons for floor systems
comprised of hot-rolled shapes for primary members and joist framing for secondary
members. From the data presented, 13 of 15 or about 87 % of the case studies analyzed
using the Design Guide criteria agree with the corresponding subjective analyses of the
behavior of the floor systems. When the case studies were evaluated using the Murray
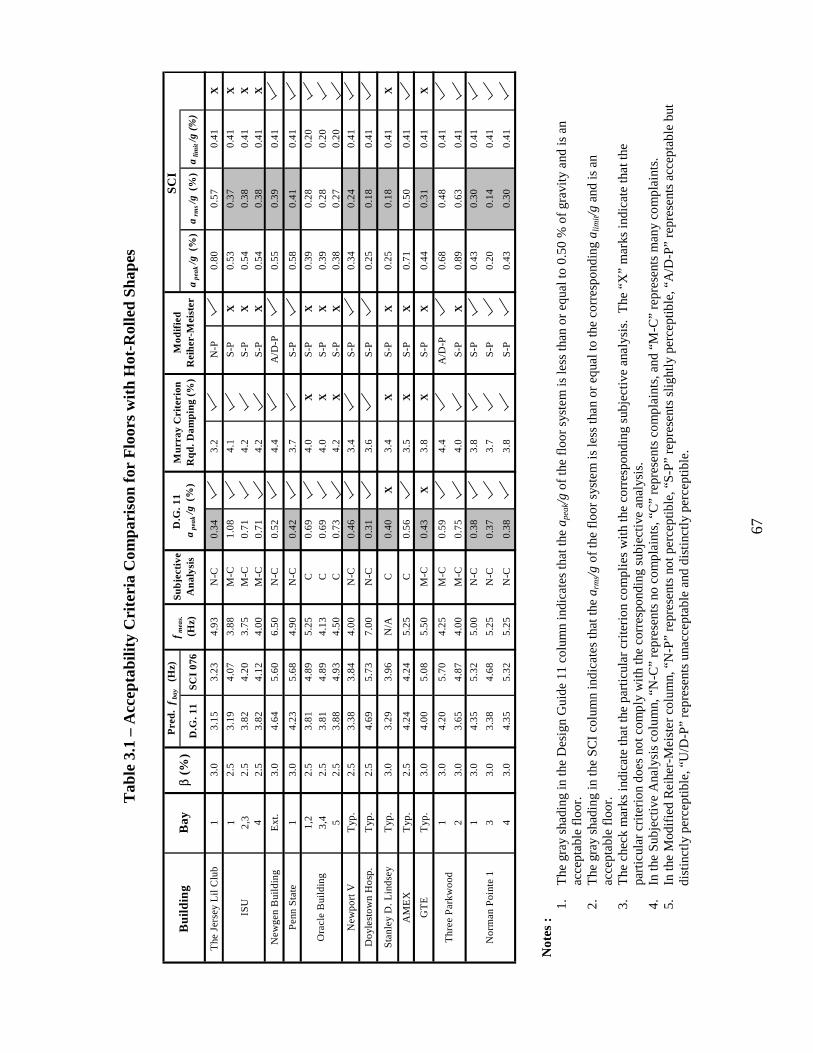
67
Tab
le 3
.1 –
Acc
epta
bilit
y C
rite
ria
Com
pari
son
for
Flo
ors
wit
h H
ot-R
olle
d Sh
apes
Not
es :
1.
T
he g
ray
shad
ing
in th
e D
esig
n G
uide
11
colu
mn
indi
cate
s th
at th
e a p
eak/
g of
the
floo
r sy
stem
is le
ss th
an o
r eq
ual t
o 0.
50 %
of
grav
ity
and
is a
n ac
cept
able
flo
or.
2.
The
gra
y sh
adin
g in
the
SC
I co
lum
n in
dica
tes
that
the
a rm
s/g o
f th
e fl
oor
syst
em is
less
than
or
equa
l to
the
corr
espo
ndin
g a l
imit/g
and
is a
n ac
cept
able
flo
or.
3.
The
che
ck m
arks
indi
cate
that
the
part
icul
ar c
rite
rion
com
plie
s w
ith
the
corr
espo
ndin
g su
bjec
tive
ana
lysi
s. T
he “
X”
mar
ks in
dica
te th
at th
e pa
rtic
ular
cri
teri
on d
oes
not c
ompl
y w
ith
the
corr
espo
ndin
g su
bjec
tive
ana
lysi
s.
4.
In th
e S
ubje
ctiv
e A
naly
sis
colu
mn,
“N
-C”
repr
esen
ts n
o co
mpl
aint
s, “
C”
repr
esen
ts c
ompl
aint
s, a
nd “
M-C
” re
pres
ents
man
y co
mpl
aint
s.
5.
In th
e M
odif
ied
Rei
her-
Mei
ster
col
umn,
“N
-P”
repr
esen
ts n
ot p
erce
ptib
le, “
S-P
” re
pres
ents
slig
htly
per
cept
ible
, “A
/D-P
” re
pres
ents
acc
epta
ble
but
dis
tinc
tly
perc
epti
ble,
“U
/D-P
” re
pres
ents
una
ccep
tabl
e an
d di
stin
ctly
per
cept
ible
.
D.G
. 11
SC
I 07
6a
peak
/g (
%)
arm
s/g
(%
)a
limit
/g (
%)
The
Jer
sey
Lil
Clu
b 1
3.0
3.15
3.23
4.93
N-C
0.34
3.2
N-P
0.80
0.57
0.41
X
12.
53.
194.
073.
88M
-C1.
084.
1S
-PX
0.53
0.37
0.41
XIS
U2,
32.
53.
824.
203.
75M
-C0.
714.
2S
-PX
0.54
0.38
0.41
X4
2.5
3.82
4.12
4.00
M-C
0.71
4.2
S-P
X0.
540.
380.
41X
New
gen
Bui
ldin
gE
xt.
3.0
4.64
5.60
6.50
N-C
0.52
4.4
A/D
-P0.
550.
390.
41
Pen
n S
tate
13.
04.
235.
684.
90N
-C0.
423.
7S
-P0.
580.
410.
41
1,2
2.5
3.81
4.89
5.25
C0.
694.
0X
S-P
X0.
390.
280.
203,
42.
53.
814.
894.
13C
0.69
4.0
XS
-PX
0.39
0.28
0.20
52.
53.
884.
934.
50C
0.73
4.2
XS
-PX
0.38
0.27
0.20
New
port
VT
yp.
2.5
3.38
3.84
4.00
N-C
0.46
3.4
S-P
0.34
0.24
0.41
Doy
lest
own
Hos
p.T
yp.
2.5
4.69
5.73
7.00
N-C
0.31
3.6
S-P
0.25
0.18
0.41
Sta
nley
D. L
inds
eyT
yp.
3.0
3.29
3.96
N/A
C0.
40X
3.4
XS
-PX
0.25
0.18
0.41
X
AM
EX
Typ
.2.
54.
244.
245.
25C
0.56
3.5
XS
-PX
0.71
0.50
0.41
GT
ET
yp.
3.0
4.00
5.08
5.50
M-C
0.43
X3.
8X
S-P
X0.
440.
310.
41X
13.
04.
205.
704.
25M
-C0.
594.
4A
/D-P
0.
680.
480.
41
23.
03.
654.
874.
00M
-C0.
754.
0S
-PX
0.89
0.63
0.41
13.
04.
355.
325.
00N
-C0.
383.
8S
-P0.
430.
300.
41
33.
03.
384.
685.
25N
-C0.
373.
7S
-P0.
200.
140.
41
43.
04.
355.
325.
25N
-C0.
383.
8S
-P0.
430.
300.
41
Thr
ee P
arkw
ood
Nor
man
Poi
nte
1
Ora
cle
Bui
ldin
g
β (%
)B
ayD
.G. 1
1
ape
ak/g
(%
)M
urra
y C
rite
rion
R
qd. D
ampi
ng (
%)
Pre
d.
f bay
(H
z)f m
eas.
(Hz)
SC
I B
uil
din
g Su
bjec
tive
A
nal
ysis
Mod
ifie
d
Rei
her-
Mei
ster
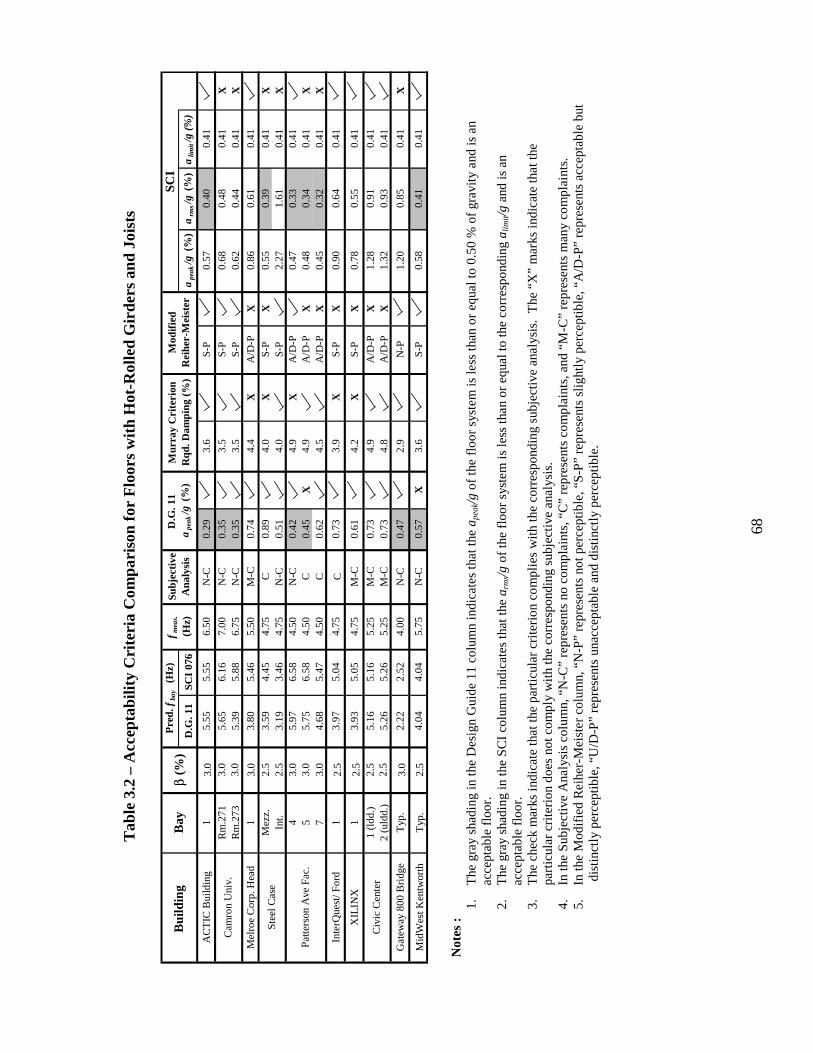
68
Tab
le 3
.2 –
Acc
epta
bilit
y C
rite
ria
Com
pari
son
for
Flo
ors
wit
h H
ot-R
olle
d G
irde
rs a
nd J
oist
s
Not
es :
1.
T
he g
ray
shad
ing
in th
e D
esig
n G
uide
11
colu
mn
indi
cate
s th
at th
e a p
eak/
g of
the
floo
r sy
stem
is le
ss th
an o
r eq
ual t
o 0.
50 %
of
grav
ity
and
is a
n ac
cept
able
flo
or.
2.
The
gra
y sh
adin
g in
the
SC
I co
lum
n in
dica
tes
that
the
a rm
s/g o
f th
e fl
oor
syst
em is
less
than
or
equa
l to
the
corr
espo
ndin
g a l
imit/g
and
is a
n ac
cept
able
flo
or.
3.
The
che
ck m
arks
indi
cate
that
the
part
icul
ar c
rite
rion
com
plie
s w
ith
the
corr
espo
ndin
g su
bjec
tive
ana
lysi
s. T
he “
X”
mar
ks in
dica
te th
at th
e pa
rtic
ular
cri
teri
on d
oes
not c
ompl
y w
ith
the
corr
espo
ndin
g su
bjec
tive
ana
lysi
s.
4.
In th
e S
ubje
ctiv
e A
naly
sis
colu
mn,
“N
-C”
repr
esen
ts n
o co
mpl
aint
s, “
C”
repr
esen
ts c
ompl
aint
s, a
nd “
M-C
” re
pres
ents
man
y co
mpl
aint
s.
5.
In th
e M
odif
ied
Rei
her-
Mei
ster
col
umn,
“N
-P”
repr
esen
ts n
ot p
erce
ptib
le, “
S-P
” re
pres
ents
slig
htly
per
cept
ible
, “A
/D-P
” re
pres
ents
acc
epta
ble
but
dis
tinc
tly
perc
epti
ble,
“U
/D-P
” re
pres
ents
una
ccep
tabl
e an
d di
stin
ctly
per
cept
ible
.
D.G
. 11
SCI
076
ape
ak/g
(%
)a
rms/g
(%
)a
limit
/g (
%)
AC
TIC
Bui
ldin
g1
3.0
5.55
5.55
6.50
N-C
0.29
3.6
S-P
0.57
0.40
0.41
Rm
.271
3.0
5.65
6.16
7.00
N-C
0.35
3.5
S-P
0.68
0.48
0.41
XR
m.2
733.
05.
395.
886.
75N
-C0.
353.
5S-
P0.
620.
440.
41X
Mel
roe
Cor
p. H
ead
13.
03.
805.
465.
50M
-C0.
744.
4X
A/D
-PX
0.86
0.61
0.41
Mez
z.2.
53.
594.
454.
75C
0.89
4.0
XS-
PX
0.55
0.39
0.41
XIn
t.2.
53.
193.
464.
75N
-C0.
514.
0S-
P2.
271.
610.
41X
43.
05.
976.
584.
50N
-C0.
424.
9X
A/D
-P0.
470.
330.
415
3.0
5.75
6.58
4.50
C0.
45X
4.9
A/D
-PX
0.48
0.34
0.41
X7
3.0
4.68
5.47
4.50
C0.
624.
5A
/D-P
X0.
450.
320.
41X
Inte
rQue
st/ F
ord
12.
53.
975.
044.
75C
0.73
3.9
XS-
PX
0.90
0.64
0.41
XIL
INX
12.
53.
935.
054.
75M
-C0.
614.
2X
S-P
X0.
780.
550.
41
1 (l
dd.)
2.5
5.16
5.16
5.25
M-C
0.73
4.9
A/D
-PX
1.28
0.91
0.41
2 (u
ldd.
)2.
55.
265.
265.
25M
-C0.
734.
8A
/D-P
X1.
320.
930.
41
Gat
eway
800
Bri
dge
Typ
.3.
02.
222.
524.
00N
-C0.
472.
9N
-P1.
200.
850.
41X
Mid
Wes
t Ken
twor
thT
yp.
2.5
4.04
4.04
5.75
N-C
0.57
X3.
6S-
P0.
580.
410.
41
f mea
s.
(Hz)
SCI
Bui
ldin
g P
red.
fba
y (
Hz)
D.G
. 11
a
peak
/g (
%)
Mur
ray
Cri
teri
on
Rqd
. Dam
ping
(%
)B
ay
Pat
ters
on A
ve F
ac.
Mod
ifie
d
Rei
her-
Mei
ster
Subj
ecti
ve
Ana
lysi
s
Civ
ic C
ente
r
Stee
l Cas
e
Cam
ron
Uni
v.
β (%
)
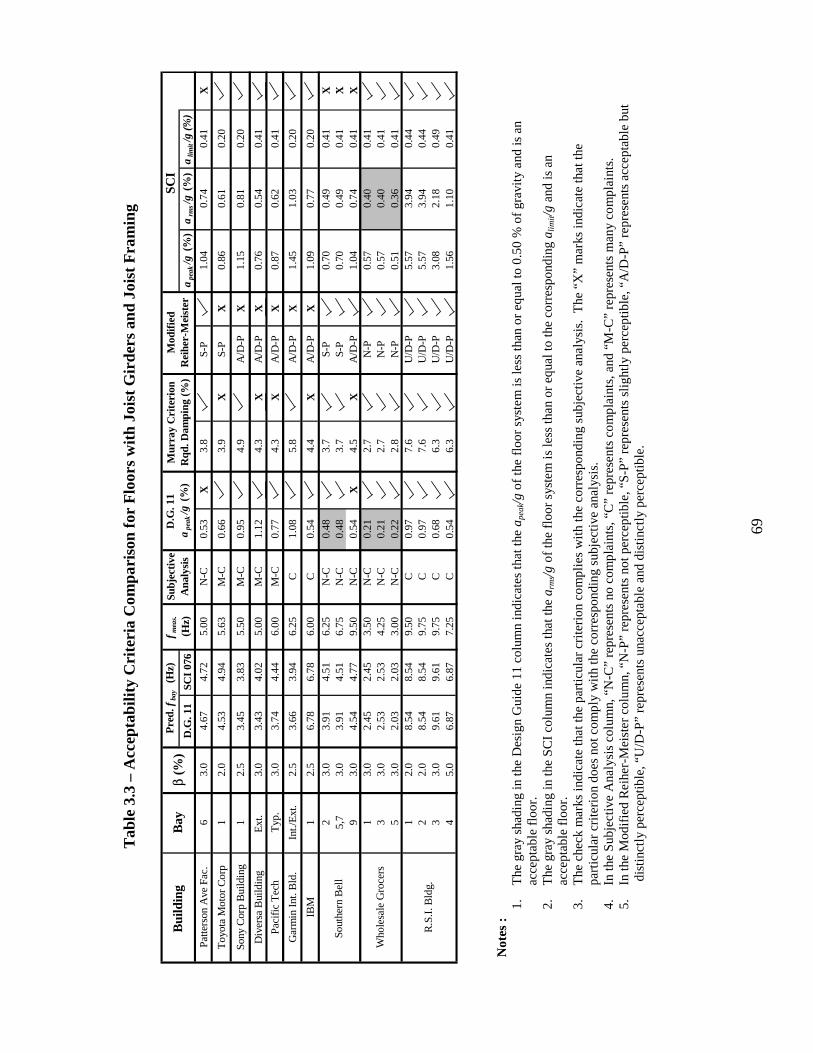
69
Tab
le 3
.3 –
Acc
epta
bilit
y C
rite
ria
Com
pari
son
for
Flo
ors
wit
h Jo
ist
Gir
ders
and
Joi
st F
ram
ing
Not
es :
1.
T
he g
ray
shad
ing
in th
e D
esig
n G
uide
11
colu
mn
indi
cate
s th
at th
e a p
eak/
g of
the
floo
r sy
stem
is le
ss th
an o
r eq
ual t
o 0.
50 %
of
grav
ity
and
is a
n ac
cept
able
flo
or.
2.
The
gra
y sh
adin
g in
the
SC
I co
lum
n in
dica
tes
that
the
a rm
s/g o
f th
e fl
oor
syst
em is
less
than
or
equa
l to
the
corr
espo
ndin
g a l
imit/g
and
is a
n ac
cept
able
flo
or.
3.
The
che
ck m
arks
indi
cate
that
the
part
icul
ar c
rite
rion
com
plie
s w
ith
the
corr
espo
ndin
g su
bjec
tive
ana
lysi
s. T
he “
X”
mar
ks in
dica
te th
at th
e pa
rtic
ular
cri
teri
on d
oes
not c
ompl
y w
ith
the
corr
espo
ndin
g su
bjec
tive
ana
lysi
s.
4.
In th
e S
ubje
ctiv
e A
naly
sis
colu
mn,
“N
-C”
repr
esen
ts n
o co
mpl
aint
s, “
C”
repr
esen
ts c
ompl
aint
s, a
nd “
M-C
” re
pres
ents
man
y co
mpl
aint
s.
5.
In th
e M
odif
ied
Rei
her-
Mei
ster
col
umn,
“N
-P”
repr
esen
ts n
ot p
erce
ptib
le, “
S-P
” re
pres
ents
slig
htly
per
cept
ible
, “A
/D-P
” re
pres
ents
acc
epta
ble
but
dis
tinc
tly
perc
epti
ble,
“U
/D-P
” re
pres
ents
una
ccep
tabl
e an
d di
stin
ctly
per
cept
ible
.
D.G
. 11
SCI
076
ape
ak/g
(%
)a
rms/g
(%
)a
limit
/g (%
)
Patte
rson
Ave
Fac
.6
3.0
4.67
4.72
5.00
N-C
0.53
X3.
8S-
P1.
040.
740.
41X
Toy
ota
Mot
or C
orp
12.
04.
534.
945.
63M
-C0.
663.
9X
S-P
X0.
860.
610.
20
Sony
Cor
p B
uild
ing
12.
53.
453.
835.
50M
-C0.
954.
9A
/D-P
X1.
150.
810.
20
Div
ersa
Bui
ldin
gE
xt.
3.0
3.43
4.02
5.00
M-C
1.12
4.3
XA
/D-P
X0.
760.
540.
41
Paci
fic
Tec
hT
yp.
3.0
3.74
4.44
6.00
M-C
0.77
4.3
XA
/D-P
X0.
870.
620.
41
Gar
min
Int
. Bld
.In
t./E
xt.
2.5
3.66
3.94
6.25
C1.
085.
8A
/D-P
X1.
451.
030.
20
IBM
12.
56.
786.
786.
00C
0.54
4.4
XA
/D-P
X1.
090.
770.
20
23.
03.
914.
516.
25N
-C0.
483.
7S-
P0.
700.
490.
41X
5,7
3.0
3.91
4.51
6.75
N-C
0.48
3.7
S-P
0.70
0.49
0.41
X9
3.0
4.54
4.77
9.50
N-C
0.54
X4.
5X
A/D
-P1.
040.
740.
41X
13.
02.
452.
453.
50N
-C0.
212.
7N
-P0.
570.
400.
413
3.0
2.53
2.53
4.25
N-C
0.21
2.7
N-P
0.57
0.40
0.41
53.
02.
032.
033.
00N
-C0.
222.
8N
-P0.
510.
360.
411
2.0
8.54
8.54
9.50
C0.
977.
6U
/D-P
5.57
3.94
0.44
22.
08.
548.
549.
75C
0.97
7.6
U/D
-P5.
573.
940.
443
3.0
9.61
9.61
9.75
C0.
686.
3U
/D-P
3.08
2.18
0.49
45.
06.
876.
877.
25C
0.54
6.3
U/D
-P1.
561.
100.
41
R.S
.I. B
ldg.
SCI
β (%
)M
urra
y C
rite
rion
R
qd. D
ampi
ng (%
)f m
eas.
(Hz)
Sout
hern
Bel
l
Who
lesa
le G
roce
rs
Pre
d. f
bay (
Hz)
Mod
ifie
d
Rei
her-
Mei
ster
D.G
. 11
a
peak
/g (%
)B
ayB
uild
ing
Subj
ecti
ve
Ana
lysi
s

70
Criterion, about 67 % of the floor systems comply with the corresponding subjective
analyses. The case studies evaluated using the Modified Reiher-Meister acceptability
scale have the least compliance with only 47 % of the floor systems agreeing with the
subjective analyses. The case studies evaluated using the Steel Construction Institute
acceptability criteria have about 53 % compliance with the subjective evaluations. For
about 7 % of the case studies, all four of the acceptability criteria and the corresponding
subjective analyses have complete agreement. None of the case studies have complete
disagreement between all four of the acceptability criteria and the corresponding
subjective analyses.
3.2.3 FLOORS WITH JOIST GIRDERS AND JOISTS
Table 3.3 shows the results of the criteria comparisons for floor systems
comprised of joist girders for primary members and joist framing for secondary members.
From the data presented, 15 of 17 or about 88 % of the case studies analyzed using the
Design Guide criteria agree with the corresponding subjective analyses of the behavior of
the floor systems. When the case studies were evaluated using the Murray Criterion,
about 71 % of the floor systems comply with the corresponding subjective analyses. The
case studies evaluated using the Modified Reiher-Meister acceptability scale have the
least compliance with only 65 % of the floor systems agreeing with the subjective
analyses. The case studies evaluated using the Steel Construction Institute acceptability
criteria have about 82 % compliance with the subjective evaluations. For about 41 % of
the case studies, all four of the acceptability criteria and the corresponding subjective
analyses have complete agreement. None of the case studies have complete disagreement
between all four of the acceptability criteria and the corresponding subjective analyses.
3.3 SUMMARY
The primary goal of this part of the study was to determine which floor vibrations
criteria has the best accuracy for predicting floor response. Table 3.4 summarizes the
major results from the acceptability criteria comparisons.
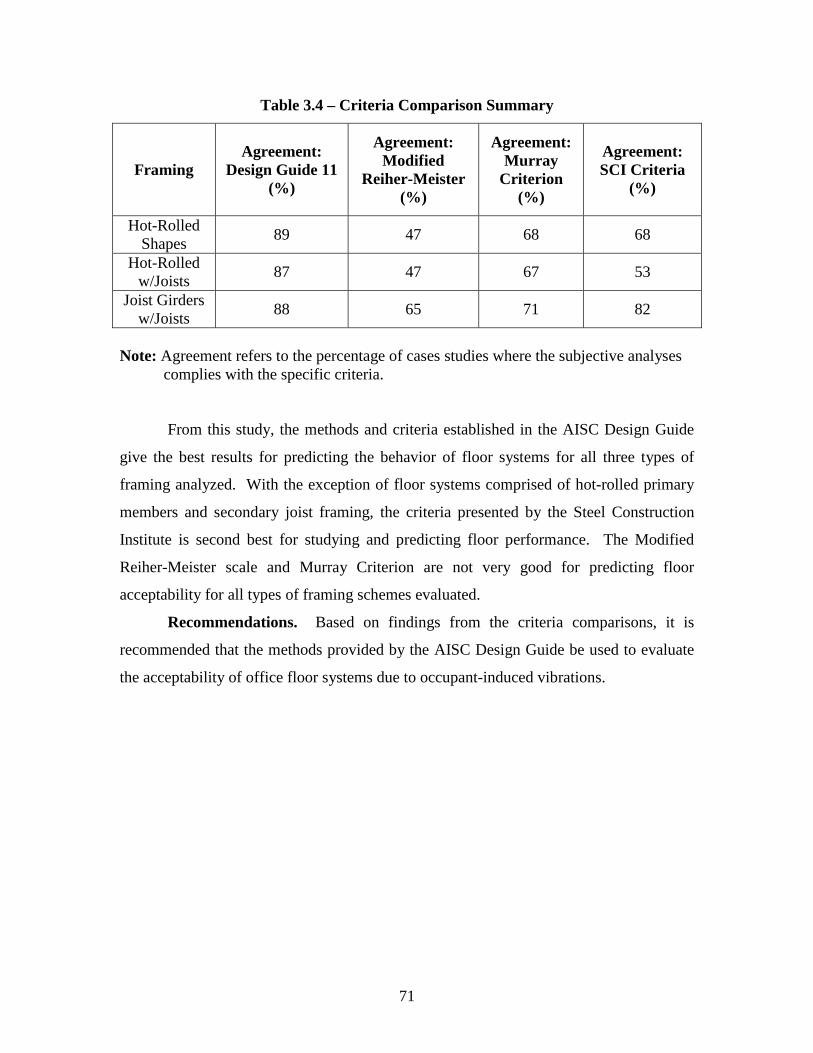
71
Table 3.4 – Criteria Comparison Summary
Framing
Agreement:
Design Guide 11 (%)
Agreement: Modified
Reiher-Meister (%)
Agreement: Murray
Criterion (%)
Agreement: SCI Criteria
(%)
Hot-Rolled Shapes
89 47 68 68
Hot-Rolled w/Joists
87 47 67 53
Joist Girders w/Joists
88 65 71 82
Note: Agreement refers to the percentage of cases studies where the subjective analyses complies with the specific criteria.
From this study, the methods and criteria established in the AISC Design Guide
give the best results for predicting the behavior of floor systems for all three types of
framing analyzed. With the exception of floor systems comprised of hot-rolled primary
members and secondary joist framing, the criteria presented by the Steel Construction
Institute is second best for studying and predicting floor performance. The Modified
Reiher-Meister scale and Murray Criterion are not very good for predicting floor
acceptability for all types of framing schemes evaluated.
Recommendations. Based on findings from the criteria comparisons, it is
recommended that the methods provided by the AISC Design Guide be used to evaluate
the acceptability of office floor systems due to occupant-induced vibrations.
72
CHAPTER IV – AISC AND SCI ACCELERATIONS COMPARISON
4.1 INTRODUCTION
The final part of this study compares predicted accelerations for a number of case
studies calculated using the American Institute of Steel Construction Design Guide 11
Floor Vibrations Due to Human Activity (Murray, et al. 1997) and enhancements to the
Steel Construction Institute criteria outlined in Design Guide for Vibrations of Long Span
Composite Floors (Hicks, et al. 2000). The case studies are of buildings under
construction or being occupied in the United States. The predicted accelerations and
floor behavior acceptability are compared to assess the line of agreement between the
AISC and SCI methods.
This chapter provides a comparison of predicted accelerations and acceptability
from 78 case studies involving floors currently being occupied and constructed in the
United States. The type of framing used during construction differentiates the structural
floor systems. The classifications for framing are “hot-rolled beams”, “hot-rolled beams
with joists”, “hot-rolled and castellated beams”, and “joist girders with joists”. The
controlling girder, which allows the most deflection and thus the lower frequency, is
considered when classifying a floor system with two different types of girders used in the
framing. The bays for these case studies are modeled using the design software
FLOORVIB2 (Murray and Elhouar 1994) to predict accelerations and acceptability. The
FLOORVIB2 software is based on the AISC Design Guide. In addition, accelerations are
also predicted using the methods outlined in the SCI Publication Design Guide for
Vibrations of Long Span Composite Floors (Hicks, et al. 2000). The predicted
accelerations for the AISC and SCI methods are then compared for agreement. This
acceptability comparison is based on future or final occupancy of the case study offices.
Many of the floor systems evaluated in Chapter I were under construction with very light
73
loading during testing. When modeling these case studies for acceleration estimates,
damping is assumed to be 3 % with 4 psf of dead load and 11 psf of live load. The actual
office fit-out and loading conditions acting on the floor systems were noted and used for
modeling purposes for floor systems that were occupied during testing. The values for
damping and loading are based on the subjective expertise of the measurement team.
Supplemental material for this report is found in the publication by Boice and
Murray (2003) and contains summary sheets of the case studies used in the frequency and
criteria comparisons. These sheets include floor systems properties such as damping,
framing, loading, predicted and measured fundamental frequencies, accelerations, and
slab properties. In addition, this supplemental material contains framing plans for the
floor systems evaluated in this chapter. Appendix A provides calculations for
determining floor acceptability based on the Steel Construction Institute criteria.
4.2 AISC VS. SCI ACCEPTABILITY COMPARISON
Tables 4.1 through 4.4 illustrate the results from the acceleration comparison
acceptability evaluations for the assessed case studies. The peak acceleration limit of
0.50 % of gravity, shown in Figure 1.8, is used in the AISC Design Guide to rate a floor
for acceptability. In this comparison, the case studies are assumed to be “General
Offices” when the SCI method is used to evaluate floor acceptability. Therefore, the
response factor is 8 and Equations 1.21 and 1.22 control the limiting rms acceleration.
The “General Office” is “appropriate for floors where normal activities and text
operations on computers are performed” (Wyatt 1989). In the predicted acceleration
columns of Tables 4.1 through 4.4, the gray shading indicates that the predicted
acceleration is less than or equal to the limiting acceleration and the corresponding floor
system should be acceptable for occupant-induced vibrations. The gray shading in the
agreement column in Tables 4.1 through 4.4 illustrates that the predictions on
acceptability using the AISC Design Guide and the SCI methods concur. The agreement
column uses a scale, which begins with “Strongly Disagree”, followed by “Disagree”,
“Agree”, then “Strongly Agree”. The phrase “Strongly Disagree” means that the
solutions between the AISC and SCI methods differ by more than 15 % of each other.
The term “Disagree” means that the solutions between the AISC and SCI methods differ
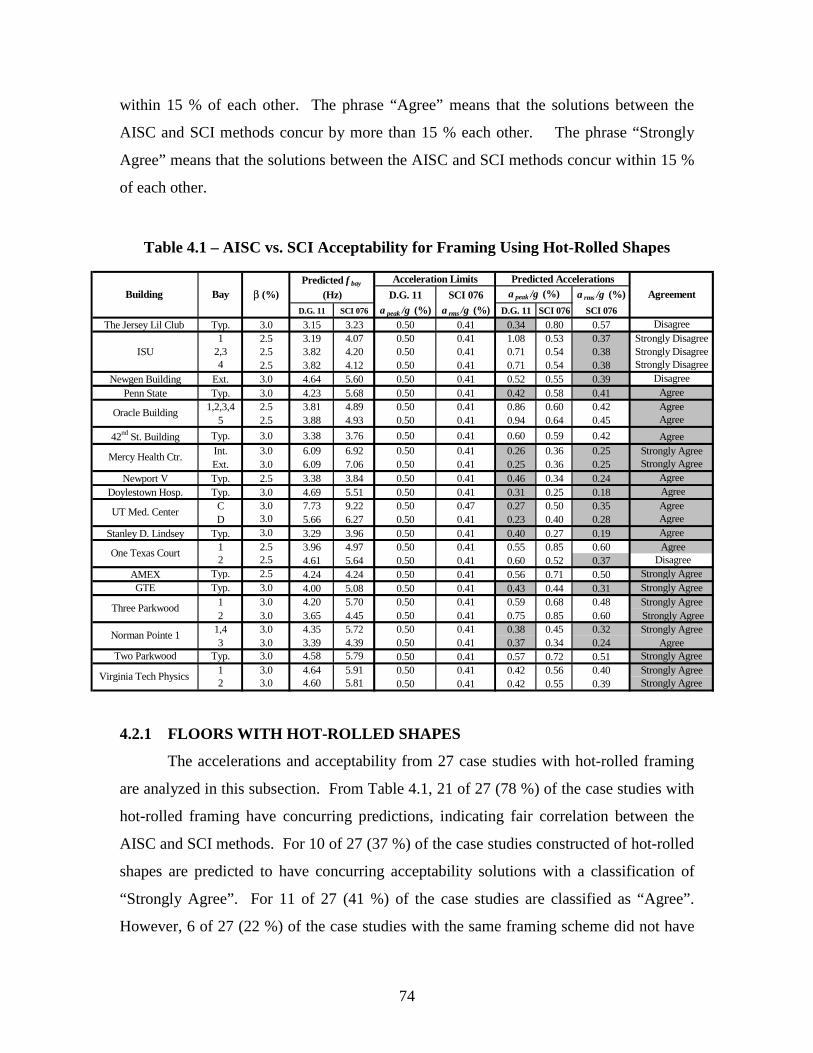
74
within 15 % of each other. The phrase “Agree” means that the solutions between the
AISC and SCI methods concur by more than 15 % each other. The phrase “Strongly
Agree” means that the solutions between the AISC and SCI methods concur within 15 %
of each other.
Table 4.1 – AISC vs. SCI Acceptability for Framing Using Hot-Rolled Shapes
4.2.1 FLOORS WITH HOT-ROLLED SHAPES
The accelerations and acceptability from 27 case studies with hot-rolled framing
are analyzed in this subsection. From Table 4.1, 21 of 27 (78 %) of the case studies with
hot-rolled framing have concurring predictions, indicating fair correlation between the
AISC and SCI methods. For 10 of 27 (37 %) of the case studies constructed of hot-rolled
shapes are predicted to have concurring acceptability solutions with a classification of
“Strongly Agree”. For 11 of 27 (41 %) of the case studies are classified as “Agree”.
However, 6 of 27 (22 %) of the case studies with the same framing scheme did not have
D.G. 11 SCI 076 a rms /g (%)
D.G. 11 SCI 076 a peak /g (%) a rms /g (%) D.G. 11 SCI 076 SCI 076
The Jersey Lil Club Typ. 3.0 3.15 3.23 0.50 0.41 0.34 0.80 0.57 Disagree1 2.5 3.19 4.07 0.50 0.41 1.08 0.53 0.37 Strongly Disagree
ISU 2,3 2.5 3.82 4.20 0.50 0.41 0.71 0.54 0.38 Strongly Disagree4 2.5 3.82 4.12 0.50 0.41 0.71 0.54 0.38 Strongly Disagree
Newgen Building Ext. 3.0 4.64 5.60 0.50 0.41 0.52 0.55 0.39 Disagree
Penn State Typ. 3.0 4.23 5.68 0.50 0.41 0.42 0.58 0.41 Agree1,2,3,4 2.5 3.81 4.89 0.50 0.41 0.86 0.60 0.42 Agree
5 2.5 3.88 4.93 0.50 0.41 0.94 0.64 0.45 Agree
42nd St. Building Typ. 3.0 3.38 3.76 0.50 0.41 0.60 0.59 0.42 AgreeInt. 3.0 6.09 6.92 0.50 0.41 0.26 0.36 0.25 Strongly AgreeExt. 3.0 6.09 7.06 0.50 0.41 0.25 0.36 0.25 Strongly Agree
Newport V Typ. 2.5 3.38 3.84 0.50 0.41 0.46 0.34 0.24 AgreeDoylestown Hosp. Typ. 3.0 4.69 5.51 0.50 0.41 0.31 0.25 0.18 Agree
C 3.0 7.73 9.22 0.50 0.47 0.27 0.50 0.35 AgreeD 3.0 5.66 6.27 0.50 0.41 0.23 0.40 0.28 Agree
Stanley D. Lindsey Typ. 3.0 3.29 3.96 0.50 0.41 0.40 0.27 0.19 Agree1 2.5 3.96 4.97 0.50 0.41 0.55 0.85 0.60 Agree2 2.5 4.61 5.64 0.50 0.41 0.60 0.52 0.37 Disagree
AMEX Typ. 2.5 4.24 4.24 0.50 0.41 0.56 0.71 0.50 Strongly AgreeGTE Typ. 3.0 4.00 5.08 0.50 0.41 0.43 0.44 0.31 Strongly Agree
1 3.0 4.20 5.70 0.50 0.41 0.59 0.68 0.48 Strongly Agree2 3.0 3.65 4.45 0.50 0.41 0.75 0.85 0.60 Strongly Agree
1,4 3.0 4.35 5.72 0.50 0.41 0.38 0.45 0.32 Strongly Agree3 3.0 3.39 4.39 0.50 0.41 0.37 0.34 0.24 Agree
Two Parkwood Typ. 3.0 4.58 5.79 0.50 0.41 0.57 0.72 0.51 Strongly Agree1 3.0 4.64 5.91 0.50 0.41 0.42 0.56 0.40 Strongly Agree2 3.0 4.60 5.81 0.50 0.41 0.42 0.55 0.39 Strongly Agree
Virginia Tech Physics
Bay
One Texas Court
UT Med. Center
Norman Pointe 1
Three Parkwood
Mercy Health Ctr.
Oracle Building
β (%)Building
Acceleration Limitsa peak /g (%) Agreement
Predicted AccelerationsPredicted f bay
(Hz)
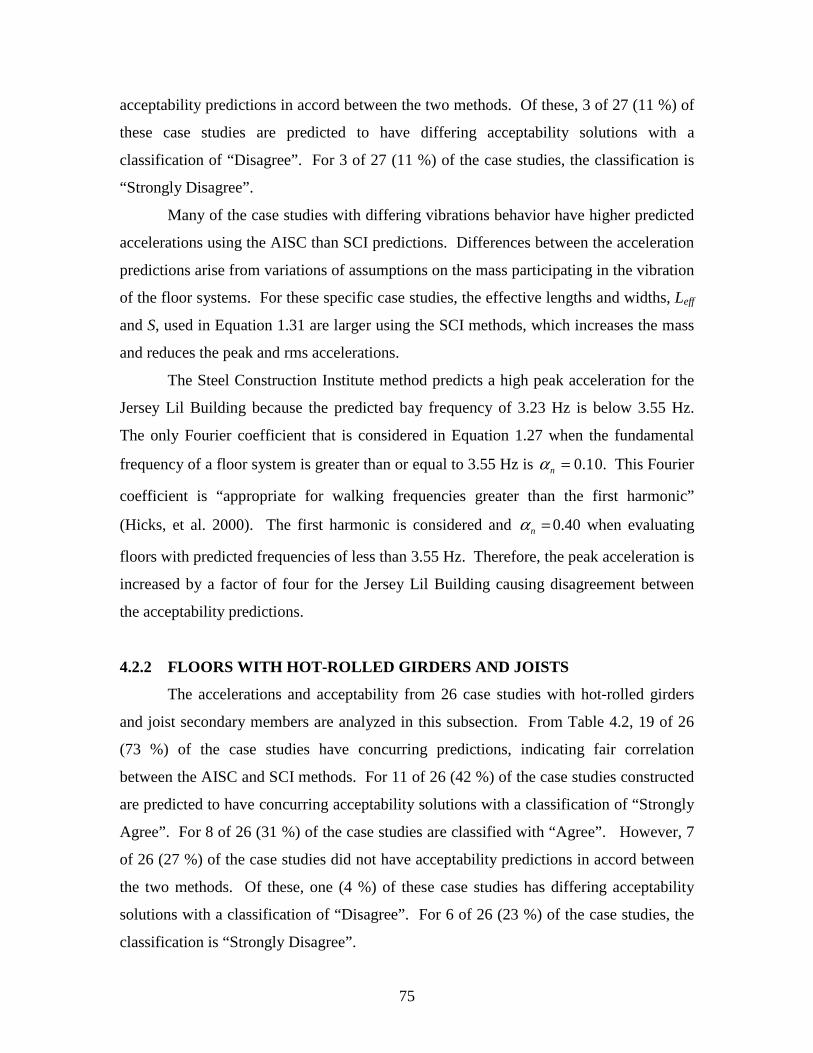
75
acceptability predictions in accord between the two methods. Of these, 3 of 27 (11 %) of
these case studies are predicted to have differing acceptability solutions with a
classification of “Disagree”. For 3 of 27 (11 %) of the case studies, the classification is
“Strongly Disagree”.
Many of the case studies with differing vibrations behavior have higher predicted
accelerations using the AISC than SCI predictions. Differences between the acceleration
predictions arise from variations of assumptions on the mass participating in the vibration
of the floor systems. For these specific case studies, the effective lengths and widths, Leff
and S, used in Equation 1.31 are larger using the SCI methods, which increases the mass
and reduces the peak and rms accelerations.
The Steel Construction Institute method predicts a high peak acceleration for the
Jersey Lil Building because the predicted bay frequency of 3.23 Hz is below 3.55 Hz.
The only Fourier coefficient that is considered in Equation 1.27 when the fundamental
frequency of a floor system is greater than or equal to 3.55 Hz is 1.0=nα 0. This Fourier
coefficient is “appropriate for walking frequencies greater than the first harmonic”
(Hicks, et al. 2000). The first harmonic is considered and =nα 0.40 when evaluating
floors with predicted frequencies of less than 3.55 Hz. Therefore, the peak acceleration is
increased by a factor of four for the Jersey Lil Building causing disagreement between
the acceptability predictions.
4.2.2 FLOORS WITH HOT-ROLLED GIRDERS AND JOISTS
The accelerations and acceptability from 26 case studies with hot-rolled girders
and joist secondary members are analyzed in this subsection. From Table 4.2, 19 of 26
(73 %) of the case studies have concurring predictions, indicating fair correlation
between the AISC and SCI methods. For 11 of 26 (42 %) of the case studies constructed
are predicted to have concurring acceptability solutions with a classification of “Strongly
Agree”. For 8 of 26 (31 %) of the case studies are classified with “Agree”. However, 7
of 26 (27 %) of the case studies did not have acceptability predictions in accord between
the two methods. Of these, one (4 %) of these case studies has differing acceptability
solutions with a classification of “Disagree”. For 6 of 26 (23 %) of the case studies, the
classification is “Strongly Disagree”.
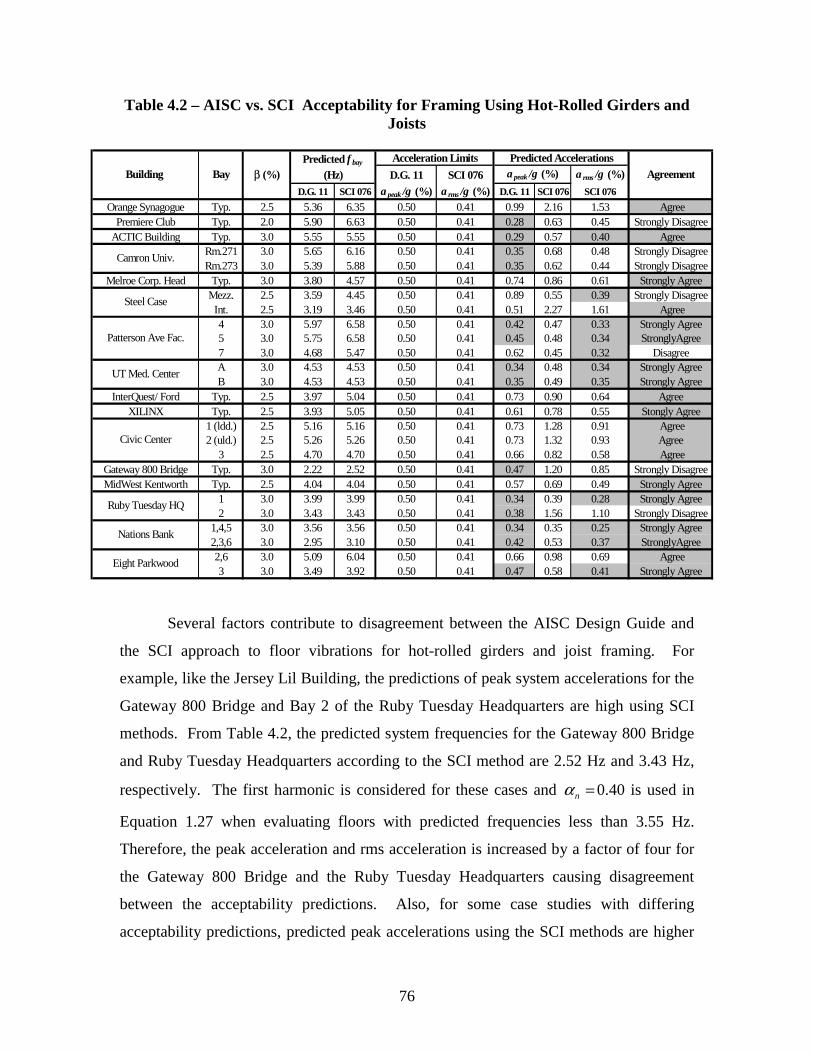
76
Table 4.2 – AISC vs. SCI Acceptability for Framing Using Hot-Rolled Girders and Joists
Several factors contribute to disagreement between the AISC Design Guide and
the SCI approach to floor vibrations for hot-rolled girders and joist framing. For
example, like the Jersey Lil Building, the predictions of peak system accelerations for the
Gateway 800 Bridge and Bay 2 of the Ruby Tuesday Headquarters are high using SCI
methods. From Table 4.2, the predicted system frequencies for the Gateway 800 Bridge
and Ruby Tuesday Headquarters according to the SCI method are 2.52 Hz and 3.43 Hz,
respectively. The first harmonic is considered for these cases and =nα 0.40 is used in
Equation 1.27 when evaluating floors with predicted frequencies less than 3.55 Hz.
Therefore, the peak acceleration and rms acceleration is increased by a factor of four for
the Gateway 800 Bridge and the Ruby Tuesday Headquarters causing disagreement
between the acceptability predictions. Also, for some case studies with differing
acceptability predictions, predicted peak accelerations using the SCI methods are higher
D.G. 11 SCI 076 a rms /g (%)
D.G. 11 SCI 076 a peak /g (%) a rms /g (%) D.G. 11 SCI 076 SCI 076
Orange Synagogue Typ. 2.5 5.36 6.35 0.50 0.41 0.99 2.16 1.53 AgreePremiere Club Typ. 2.0 5.90 6.63 0.50 0.41 0.28 0.63 0.45 Strongly Disagree
ACTIC Building Typ. 3.0 5.55 5.55 0.50 0.41 0.29 0.57 0.40 AgreeRm.271 3.0 5.65 6.16 0.50 0.41 0.35 0.68 0.48 Strongly DisagreeRm.273 3.0 5.39 5.88 0.50 0.41 0.35 0.62 0.44 Strongly Disagree
Melroe Corp. Head Typ. 3.0 3.80 4.57 0.50 0.41 0.74 0.86 0.61 Strongly AgreeMezz. 2.5 3.59 4.45 0.50 0.41 0.89 0.55 0.39 Strongly Disagree
Int. 2.5 3.19 3.46 0.50 0.41 0.51 2.27 1.61 Agree4 3.0 5.97 6.58 0.50 0.41 0.42 0.47 0.33 Strongly Agree5 3.0 5.75 6.58 0.50 0.41 0.45 0.48 0.34 StronglyAgree7 3.0 4.68 5.47 0.50 0.41 0.62 0.45 0.32 DisagreeA 3.0 4.53 4.53 0.50 0.41 0.34 0.48 0.34 Strongly AgreeB 3.0 4.53 4.53 0.50 0.41 0.35 0.49 0.35 Strongly Agree
InterQuest/ Ford Typ. 2.5 3.97 5.04 0.50 0.41 0.73 0.90 0.64 AgreeXILINX Typ. 2.5 3.93 5.05 0.50 0.41 0.61 0.78 0.55 Stongly Agree
1 (ldd.) 2.5 5.16 5.16 0.50 0.41 0.73 1.28 0.91 Agree2 (uld.) 2.5 5.26 5.26 0.50 0.41 0.73 1.32 0.93 Agree
3 2.5 4.70 4.70 0.50 0.41 0.66 0.82 0.58 AgreeGateway 800 Bridge Typ. 3.0 2.22 2.52 0.50 0.41 0.47 1.20 0.85 Strongly DisagreeMidWest Kentworth Typ. 2.5 4.04 4.04 0.50 0.41 0.57 0.69 0.49 Strongly Agree
1 3.0 3.99 3.99 0.50 0.41 0.34 0.39 0.28 Strongly Agree2 3.0 3.43 3.43 0.50 0.41 0.38 1.56 1.10 Strongly Disagree
1,4,5 3.0 3.56 3.56 0.50 0.41 0.34 0.35 0.25 Strongly Agree2,3,6 3.0 2.95 3.10 0.50 0.41 0.42 0.53 0.37 StronglyAgree2,6 3.0 5.09 6.04 0.50 0.41 0.66 0.98 0.69 Agree3 3.0 3.49 3.92 0.50 0.41 0.47 0.58 0.41 Strongly Agree
Steel Case
Civic Center
Eight Parkwood
Ruby Tuesday HQ
UT Med. Center
Nations Bank
Acceleration Limits
Patterson Ave Fac.
Camron Univ.
AgreementPredicted Accelerations
a peak /g (%)Predicted f bay
(Hz)β (%)BayBuilding
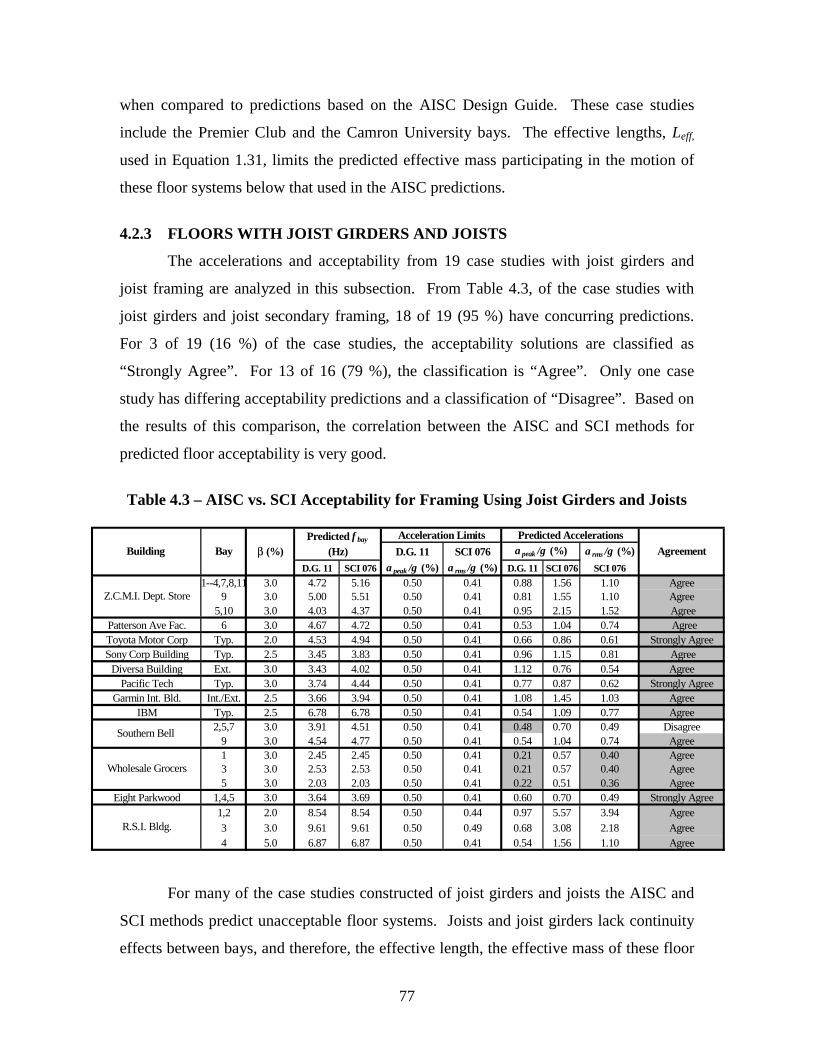
77
when compared to predictions based on the AISC Design Guide. These case studies
include the Premier Club and the Camron University bays. The effective lengths, Leff,
used in Equation 1.31, limits the predicted effective mass participating in the motion of
these floor systems below that used in the AISC predictions.
4.2.3 FLOORS WITH JOIST GIRDERS AND JOISTS
The accelerations and acceptability from 19 case studies with joist girders and
joist framing are analyzed in this subsection. From Table 4.3, of the case studies with
joist girders and joist secondary framing, 18 of 19 (95 %) have concurring predictions.
For 3 of 19 (16 %) of the case studies, the acceptability solutions are classified as
“Strongly Agree”. For 13 of 16 (79 %), the classification is “Agree”. Only one case
study has differing acceptability predictions and a classification of “Disagree”. Based on
the results of this comparison, the correlation between the AISC and SCI methods for
predicted floor acceptability is very good.
Table 4.3 – AISC vs. SCI Acceptability for Framing Using Joist Girders and Joists
For many of the case studies constructed of joist girders and joists the AISC and
SCI methods predict unacceptable floor systems. Joists and joist girders lack continuity
effects between bays, and therefore, the effective length, the effective mass of these floor
D.G. 11 SCI 076 a rms /g (%)
D.G. 11 SCI 076 a peak /g (%) a rms /g (%) D.G. 11 SCI 076 SCI 076
1--4,7,8,11 3.0 4.72 5.16 0.50 0.41 0.88 1.56 1.10 Agree9 3.0 5.00 5.51 0.50 0.41 0.81 1.55 1.10 Agree
5,10 3.0 4.03 4.37 0.50 0.41 0.95 2.15 1.52 AgreePatterson Ave Fac. 6 3.0 4.67 4.72 0.50 0.41 0.53 1.04 0.74 AgreeToyota Motor Corp Typ. 2.0 4.53 4.94 0.50 0.41 0.66 0.86 0.61 Strongly AgreeSony Corp Building Typ. 2.5 3.45 3.83 0.50 0.41 0.96 1.15 0.81 Agree
Diversa Building Ext. 3.0 3.43 4.02 0.50 0.41 1.12 0.76 0.54 AgreePacific Tech Typ. 3.0 3.74 4.44 0.50 0.41 0.77 0.87 0.62 Strongly Agree
Garmin Int. Bld. Int./Ext. 2.5 3.66 3.94 0.50 0.41 1.08 1.45 1.03 AgreeIBM Typ. 2.5 6.78 6.78 0.50 0.41 0.54 1.09 0.77 Agree
2,5,7 3.0 3.91 4.51 0.50 0.41 0.48 0.70 0.49 Disagree9 3.0 4.54 4.77 0.50 0.41 0.54 1.04 0.74 Agree1 3.0 2.45 2.45 0.50 0.41 0.21 0.57 0.40 Agree3 3.0 2.53 2.53 0.50 0.41 0.21 0.57 0.40 Agree5 3.0 2.03 2.03 0.50 0.41 0.22 0.51 0.36 Agree
Eight Parkwood 1,4,5 3.0 3.64 3.69 0.50 0.41 0.60 0.70 0.49 Strongly Agree1,2 2.0 8.54 8.54 0.50 0.44 0.97 5.57 3.94 Agree3 3.0 9.61 9.61 0.50 0.49 0.68 3.08 2.18 Agree4 5.0 6.87 6.87 0.50 0.41 0.54 1.56 1.10 Agree
Wholesale Grocers
R.S.I. Bldg.
Z.C.M.I. Dept. Store
Southern Bell
a peak /g (%)Acceleration Limits
Building AgreementBay β (%)
Predicted AccelerationsPredicted f bay
(Hz)
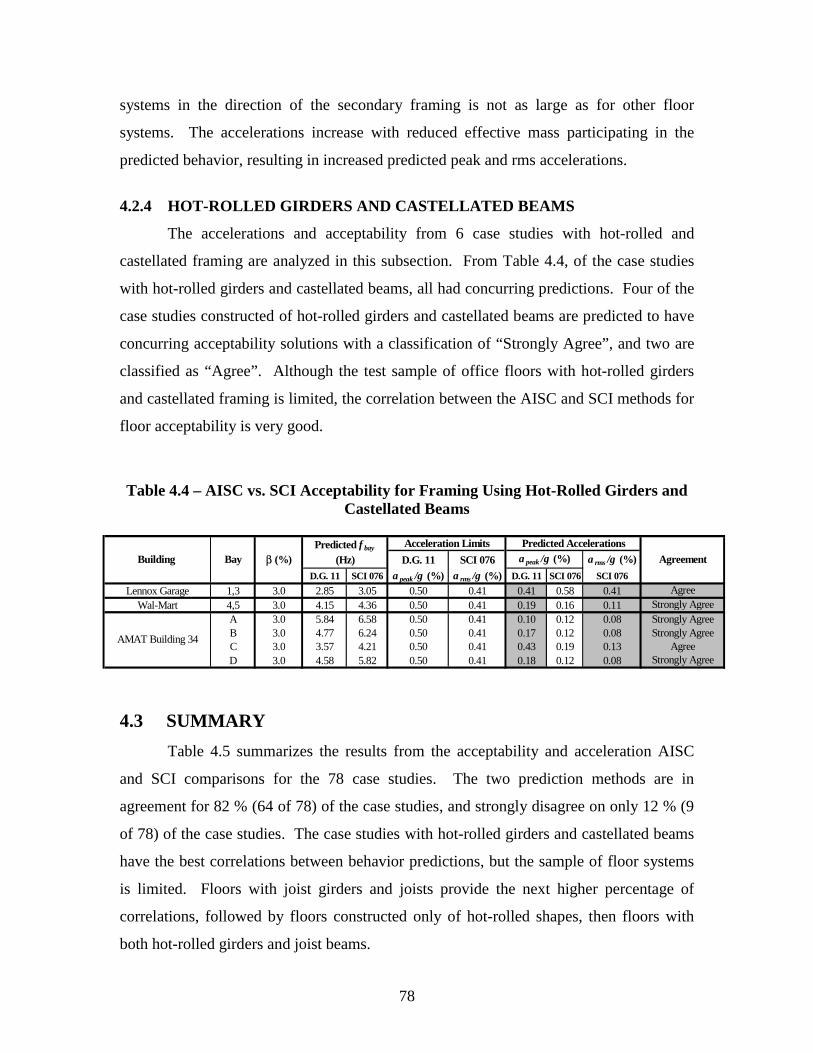
78
systems in the direction of the secondary framing is not as large as for other floor
systems. The accelerations increase with reduced effective mass participating in the
predicted behavior, resulting in increased predicted peak and rms accelerations.
4.2.4 HOT-ROLLED GIRDERS AND CASTELLATED BEAMS
The accelerations and acceptability from 6 case studies with hot-rolled and
castellated framing are analyzed in this subsection. From Table 4.4, of the case studies
with hot-rolled girders and castellated beams, all had concurring predictions. Four of the
case studies constructed of hot-rolled girders and castellated beams are predicted to have
concurring acceptability solutions with a classification of “Strongly Agree”, and two are
classified as “Agree”. Although the test sample of office floors with hot-rolled girders
and castellated framing is limited, the correlation between the AISC and SCI methods for
floor acceptability is very good.
Table 4.4 – AISC vs. SCI Acceptability for Framing Using Hot-Rolled Girders and Castellated Beams
4.3 SUMMARY
Table 4.5 summarizes the results from the acceptability and acceleration AISC
and SCI comparisons for the 78 case studies. The two prediction methods are in
agreement for 82 % (64 of 78) of the case studies, and strongly disagree on only 12 % (9
of 78) of the case studies. The case studies with hot-rolled girders and castellated beams
have the best correlations between behavior predictions, but the sample of floor systems
is limited. Floors with joist girders and joists provide the next higher percentage of
correlations, followed by floors constructed only of hot-rolled shapes, then floors with
both hot-rolled girders and joist beams.
D.G. 11 SCI 076 a rms /g (%)
D.G. 11 SCI 076 a peak /g (%) a rms /g (%) D.G. 11 SCI 076 SCI 076
Lennox Garage 1,3 3.0 2.85 3.05 0.50 0.41 0.41 0.58 0.41 AgreeWal-Mart 4,5 3.0 4.15 4.36 0.50 0.41 0.19 0.16 0.11 Strongly Agree
A 3.0 5.84 6.58 0.50 0.41 0.10 0.12 0.08 Strongly AgreeB 3.0 4.77 6.24 0.50 0.41 0.17 0.12 0.08 Strongly AgreeC 3.0 3.57 4.21 0.50 0.41 0.43 0.19 0.13 AgreeD 3.0 4.58 5.82 0.50 0.41 0.18 0.12 0.08 Strongly Agree
Building Bay β (%)
AMAT Building 34
AgreementPredicted f bay
(Hz)
Predicted Accelerationsa peak /g (%)
Acceleration Limits
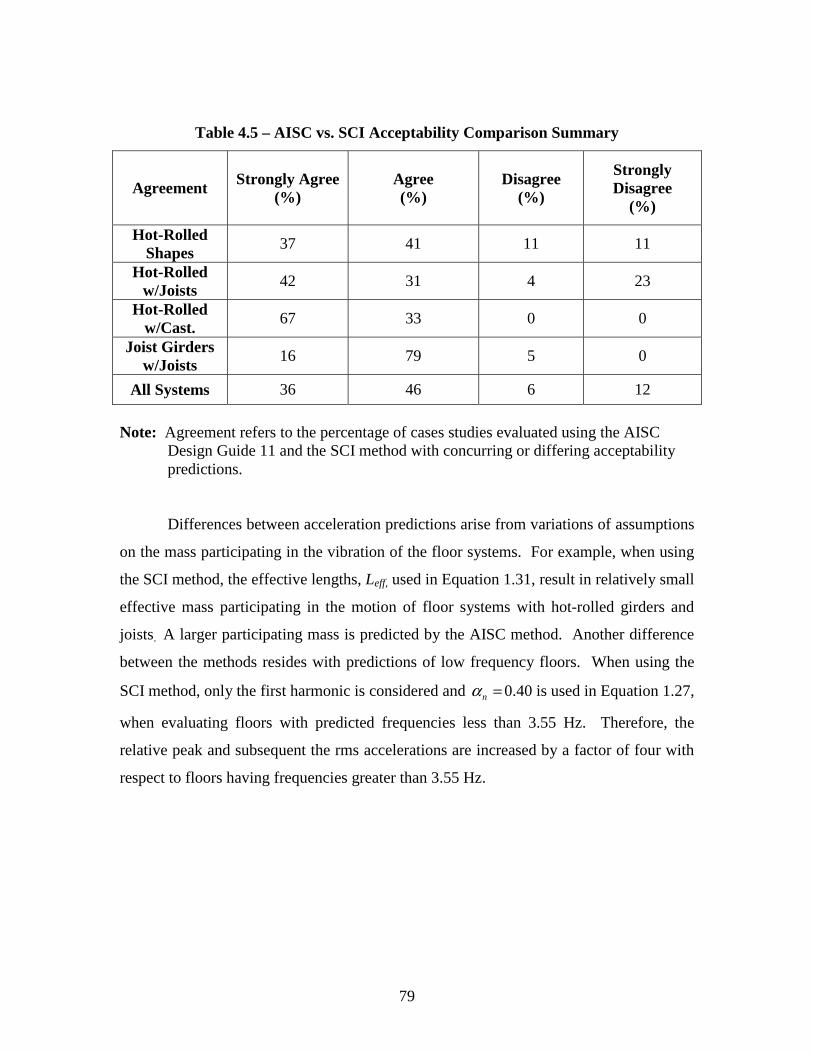
79
Table 4.5 – AISC vs. SCI Acceptability Comparison Summary
Agreement
Strongly Agree
(%)
Agree (%)
Disagree (%)
Strongly Disagree
(%)
Hot-Rolled Shapes
37 41 11 11
Hot-Rolled w/Joists
42 31 4 23
Hot-Rolled w/Cast.
67 33 0 0
Joist Girders w/Joists
16 79 5 0
All Systems 36 46 6 12
Note: Agreement refers to the percentage of cases studies evaluated using the AISC
Design Guide 11 and the SCI method with concurring or differing acceptability predictions.
Differences between acceleration predictions arise from variations of assumptions
on the mass participating in the vibration of the floor systems. For example, when using
the SCI method, the effective lengths, Leff, used in Equation 1.31, result in relatively small
effective mass participating in the motion of floor systems with hot-rolled girders and
joists. A larger participating mass is predicted by the AISC method. Another difference
between the methods resides with predictions of low frequency floors. When using the
SCI method, only the first harmonic is considered and =nα 0.40 is used in Equation 1.27,
when evaluating floors with predicted frequencies less than 3.55 Hz. Therefore, the
relative peak and subsequent the rms accelerations are increased by a factor of four with
respect to floors having frequencies greater than 3.55 Hz.
80
CHAPTER V – CONCLUSIONS AND
RECOMMENDATIONS
5.1 SUMMARY
The purpose of this study was to suggest methods for improving the correlation
between predicted and actual field behavior of office floor systems due to occupant-
induced walking excitations. The focus of this research was divided into three main
topics in which case studies were evaluated. The first focused on comparing field-
measured frequencies with predicted natural frequencies using the methods outlined in
the AISC Design Guide and the SCI Publication Design Guide on the Vibration of Floors
(Wyatt 1989). The second is a comparison of current acceptability criteria and subjective
field analyses of observed floor system behavior. The four acceptability criteria used to
evaluate these case studies were the AISC Design Guide, enhancements to the Steel
Construction Institute criteria outlined in Design Guide for Vibrations of Long Span
Composite Floors (Hicks, et al. 2000) the Murray Criterion, and the Modified Reiher-
Meister scale. Comparison of predicted accelerations and acceptability from the AISC
and the SCI criteria, were assessed in the final topic.
5.2 CONCLUSIONS
5.2.1 NATURAL FREQUENCY STUDY
The purpose of this part of the study was to compare predicted and measured
frequencies of floor systems for 103 case studies currently occupied and under
construction in the United States and Europe. This comparison was compiled in an
attempt to improve predictions of floor response due to occupant-induced excitations.
Floor system properties and framing for these case studies were scrutinized using AISC
and SCI methods to find correlations between predicted and measured frequencies.
Based on the results of the comparisons, it can be reasonably concluded that the predicted
bay frequency using Dunkerly’s estimate (fn2) is not the most accurate method for
predicting the system frequency using the AISC Design Guide procedures for all types of
81
framing analyzed. The predicted beam frequency using AISC methods provided sound
correlations with the measured bay frequencies, although the scatter of the data was
modest. On the other hand, with the exception of floor systems with joist girders and
joists, the results showed that the SCI methods provided more accurate predictions of bay
frequency despite a fair amount of data scatter. In addition, revisions to Dunkerly’s
estimate, fn4 (Equation 2.1) and fn
6 (Equation 2.2), marginally improved the correlation
for predicting system frequencies using between predicted and measured frequencies for
both the AISC Design Guide and SCI methods. However, the scatter of data for these
modified system predictions were moderately high.
5.2.2 FLOOR VIBRATION CRITERIA COMPARISON
The primary goal of this part of the research was to determine which floor
vibration criteria best predicts floor response. From the results of the four methods used
to examine the case studies, the AISC Design Guide criterion is judged the most accurate
method for predicting floor vibrations acceptability. The SCI criterion is the next most
consistent method, followed by the Murray Criterion then the Modified Reiher-Meister
scale.
5.2.3 AISC AND SCI ACCELERATION COMPARISONS
The final part of this study compares predicted accelerations and floor behavior
tolerability for 78 case studies evaluated using the AISC and the SCI criteria. The two
prediction methods are in agreement for 82 % (64 of 78) of the case studies, and strongly
disagree for only 12 % (9 of 78) of the case studies. The case studies with hot-rolled
girders and castellated beams have the best correlations between behavior predictions, but
the sample of floor systems is very limited. Floors with joist girders and joists provide
the next higher percentage of correlations, followed by floors constructed only of hot-
rolled shapes, then floors with hot-rolled girders and joist beams.
5.3 COMMENTS
When evaluating a floor system for acceptability using the SCI criteria, several
considerations should be made for the effective length, Leff, used in the effective mass, M,
Equation 1.31. Floor systems comprised solely of hot-rolled framing members should
82
strictly use the guidelines presented in Table 1.1 for determining effective lengths and
widths. However, when floors are comprised of hot-rolled shapes with joists or joist
girders with joists, continuity effects of secondary framing members need to be
considered. Table 1.1 should be used as outlined by SCI when the predicted motion of
the secondary beams controls the floor system behavior. When the predicted motion of
the floor system is controlled by the primary framing and the relative flexibility,
RFmain_beam, is greater than 0.60, only the length of the secondary beam should be used as
Lmax and subsequently Leff. The term Lmax is defined as the total length of the secondary
beam when considered to act continuously. Unlike hot-rolled secondary framing, joists
are not considered to act continuously from bay to bay. Another recommendation that
should be considered when using the SCI criteria for floor acceptability is that actual
corridor dimensions for computing the resonant build-up factor, R1, should be used. The
resonant build-up factor, Equation 1.28, is a function of D. The property D is taken
conservatively as the longer of the floors plan dimensions or, when known, the longest
architectural corridor length. The architectural corridor lengths were not known and the
resonant build-up factors were calculated to be 1.0 for the case studies evaluated. The
resonant build-up factor is used as a reduction of the peak acceleration. In future studies,
architectural corridor features should be noted to provide more accurate predictions of
floor behavior using SCI methods.
5.4 AREAS FOR FURTHER RESEARCH
Many of the floor systems in the natural frequency study showed the best
correlation between predicted beam frequency and measured bay frequency when
evaluated using the AISC Design Guide. Future floor vibration research should study the
framing member properties that would cause the girder frequency to be neglected when
calculating bay frequencies for each type of framing scheme. These member properties
should include span-to-depth ratios for girders and beams, as well as, girder span-to-beam
span ratios. Moreover, this study showed that the modifications to Dunkerly’s equation,
fn4and fn
6, on average marginally provide more reliable predictions than estimations using
fn2 for AISC and SCI methods. Further study of these modifications is recommended for
both methods. In addition, only six case studies of floors with hot-rolled girders and

83
castellated beams were used in this study. Therefore, in future research, a broader sample
of floor systems with hot-rolled girders and castellated beams should be considered to
compare measured and predicted frequencies, accelerations, and behavioral acceptability.
84
LIST OF REFERENCES
Allen, D. E., and Rainer, J. H. (1976). “Vibration Criteria for Long Span Floors.”
Canadian Journal of Civil Engineering, Vol. 3, No. 2, The National Research Council of Canada, June, pp.165-173.
Allen, D. E., and Murray, T. M. (1993). Design Criterion for Vibrations Due to
Walking.” Engineering Journal, AISC, 3rd Qtr., pp. 117-129. Band B. S. Jr. (1996). “ Several Vibration Performance Aspects of Joist and Joist-Girder
Supported Floors.” M.S. Thesis, Virginia Polytechnic Institute and State University, Blacksburg, Virginia.
Beavers, T. A. (1998). “Fundamental Natural Frequency of Steel Joist Supported
Floors.” M.S. Thesis, Virginia Polytechnic Institute and State University, Blacksburg, Virginia.
Boice, M. D. and Murray, T. M. (2003). “Study to Improve the Predicted Response of
Floor Systems Due to Walking Case Studies Data.” Research Report CE/VPI-ST-03/05, Virginia Polytechnic Institute and State University, Blacksburg, Virginia.
CSA, 1989, Canadian Standards CAN3-S16.1-M89: Steel Structures for Buildings –
Limit States Design: Appendix G, Guide for Floor Vibrations. Rexdale, Ontario. Hicks, S. J., Lawson, R. M., King, C. M. (2000). “SCI RT803: Design Guide for
Vibrations of Long Span Composite Floors.” Steel Construction Institute, Ascot, Great Britain.
International Standards Organization (1989). “Evaluation of Human Exposure to Whole-
Body Vibration – Part 2: Human Exposure to Continuous and Shock Induced Vibrations in Buildings (1 to 80 Hz).” International Standard, ISO 2631-2.
Jackson, R. (2002). “Vibration and Flexural Strength Characteristics of Composite
Castellated Beams.” M.S. Thesis, Virginia Polytechnic Institute and State University, Blacksburg, Virginia.
Kitterman, S. S. (1994). “Investigation of Several Aspects of the Vibration
Characteristics of Steel Member-Supported Floors.” M.S. Thesis, Virginia Polytechnic Institute and State University, Blacksburg, Virginia.
Murray, T. M. (1975). “Design to Prevent Floor Vibrations.” Engineering Journal, AISC,
3rd Qtr., Chicago, Illinois, pp. 82-87. Murray, T. M. (1981). “Acceptability Criterion for Occupant-Induced Floor Vibrations.”
Engineering Journal, AISC, 2nd Qtr., Chicago, Illinois, pp. 62-70.
85
Murray, T. M., Allen, D. E., Ungar, E. E. (1997). “AISC Steel Design Guide Series 11:
Floor Vibrations Due to Human Activity.” American Institute of Steel Construction, Chicago, Illinois.
Murray, T. M., Elhouar, S., (1994). “Design Advisor Version 5.0—A Shell for Building Knowledge-Based Systems for Application in Structural Design.” Structural Engineers Inc., Radford, Virginia.
Lenzen, K.H. (1966). “Vibration of Steel Joist –Concrete Slab Floors.” Engineering
Journal, AISC, 3rd Qtr., Chicago, Illinois, pp. 133-136. Reiher, H. and Meister, F.J. (1931). “The Effect of Vibration on People.” Translated
from Forsch. Geb. Ing. Wes: 2(11) 381-6, by U.S. Air Material Command, Translation F-TS-616-RE, Wright Field, Ohio, AMC, 1946.
Rottmann, C. (1996). “The Use of Tuned Mass Dampers to Control Floor Vibrations.”
M.S. Thesis, Virginia Polytechnic Institute and State University, Blacksburg, Virginia.
Sladki, M. J. (1999). “Prediction of Floor Vibration Response Using the Finite Element
Method.” M.S. Thesis, Virginia Polytechnic Institute and State University, Blacksburg, Virginia.
Warmoth, F. J. Jr. (1999). “Floor Vibrations: Girder Effective Moment of Inertia and
Cost Study.” M.S. Thesis, Virginia Polytechnic Institute and State University, Blacksburg, Virginia.
Wyatt, T. A. (1989). “SCI Publication 076: Design Guide on the Vibration of Floors.”,
Steel Construction Institute, Ascot, Great Britain.
86
APPENDIX A – EXAMPLE CALCULATIONS
87
APPENDIX A.1 AISC DESIGN GUIDE 11 CALCULATIONS
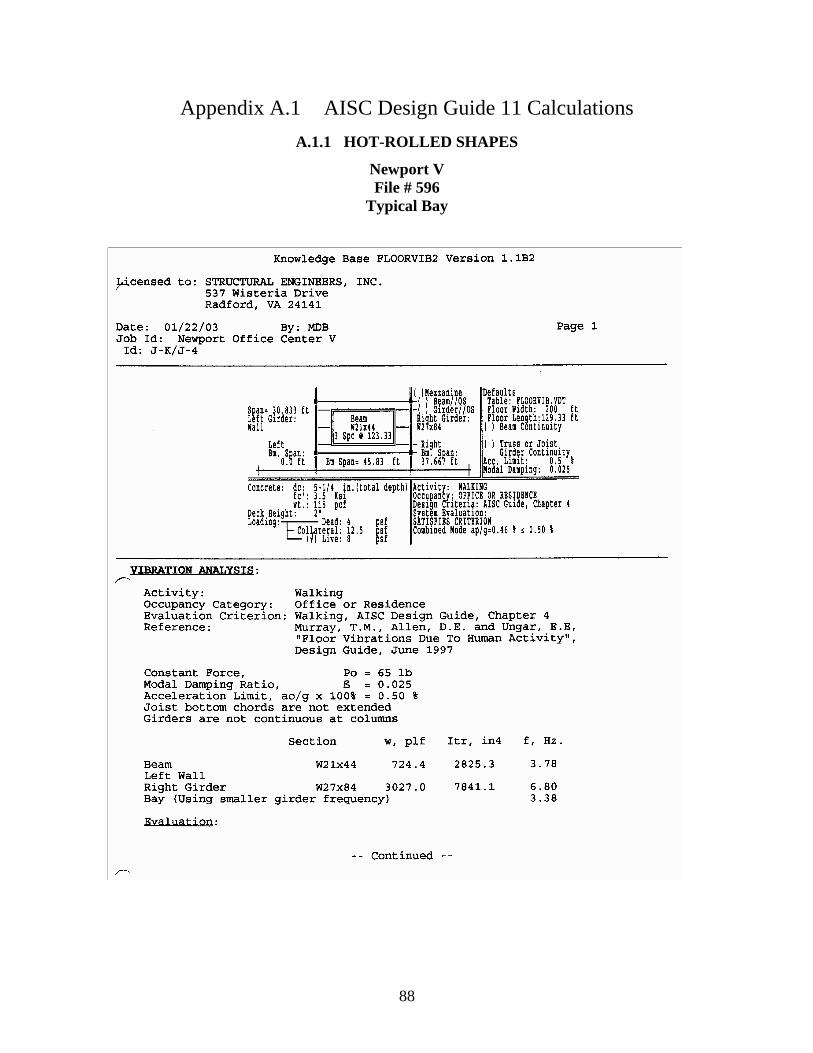
88
Appendix A.1 AISC Design Guide 11 Calculations
A.1.1 HOT-ROLLED SHAPES
Newport V File # 596
Typical Bay
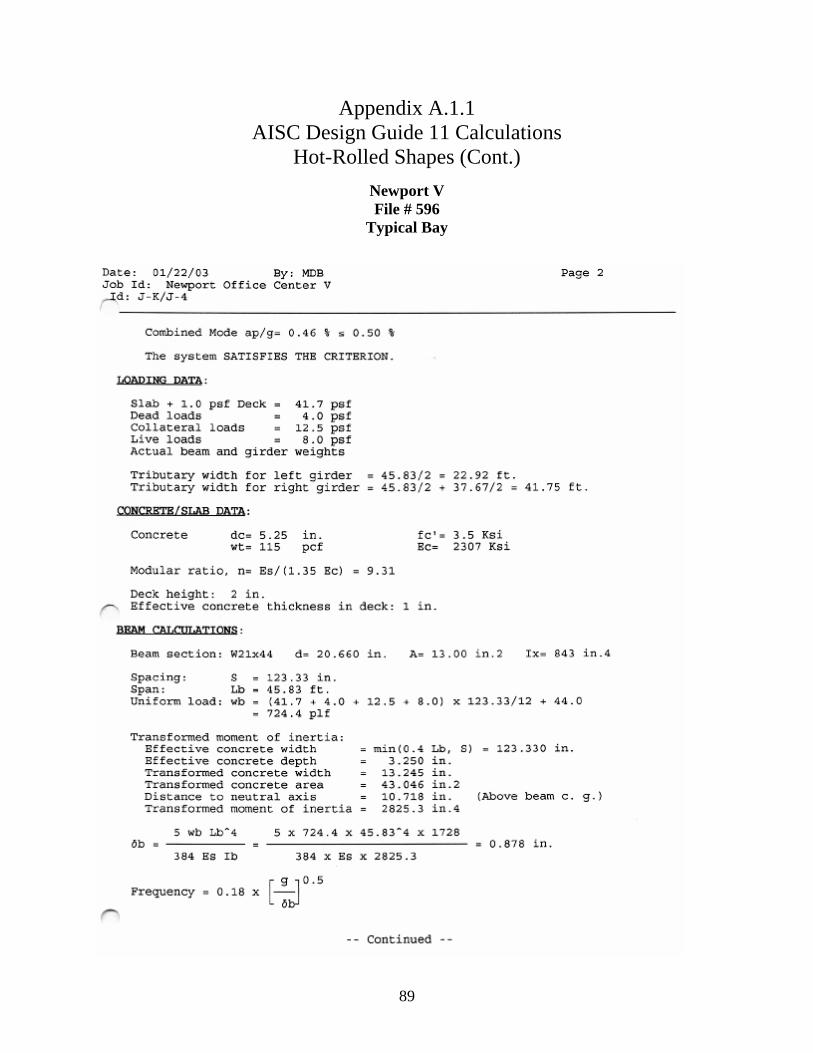
89
Appendix A.1.1 AISC Design Guide 11 Calculations
Hot-Rolled Shapes (Cont.)
Newport V File # 596
Typical Bay
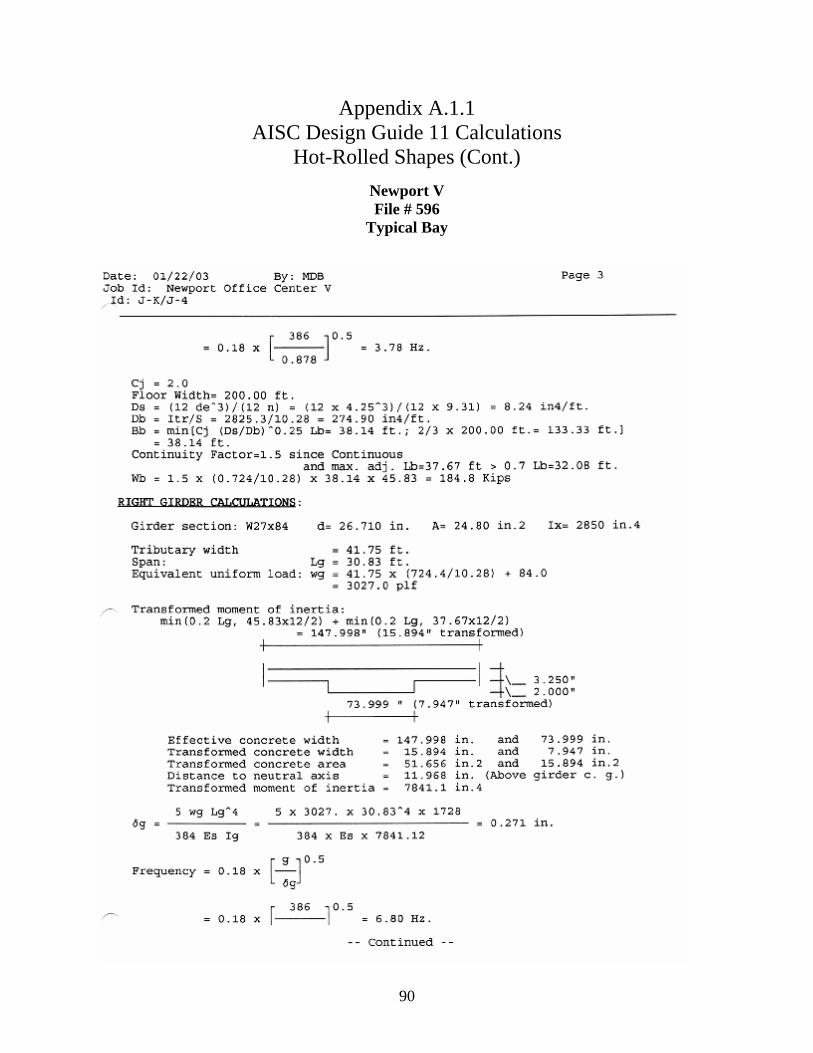
90
Appendix A.1.1 AISC Design Guide 11 Calculations
Hot-Rolled Shapes (Cont.)
Newport V File # 596
Typical Bay
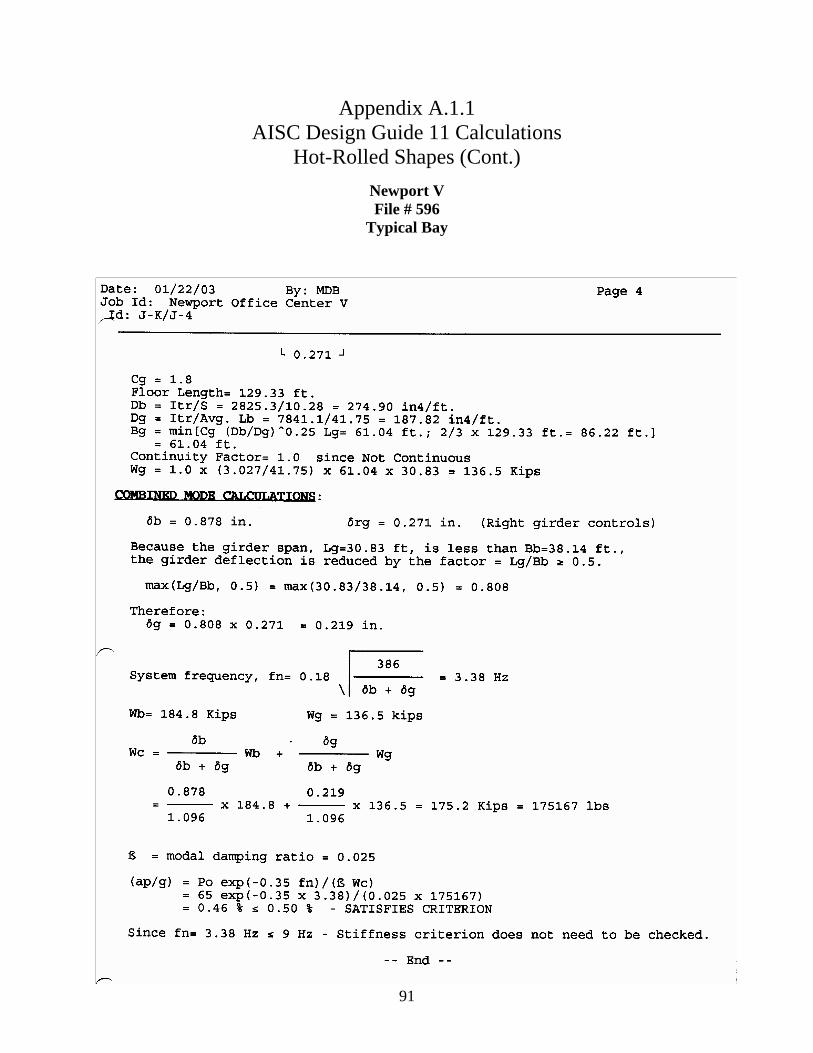
91
Appendix A.1.1 AISC Design Guide 11 Calculations
Hot-Rolled Shapes (Cont.)
Newport V File # 596
Typical Bay
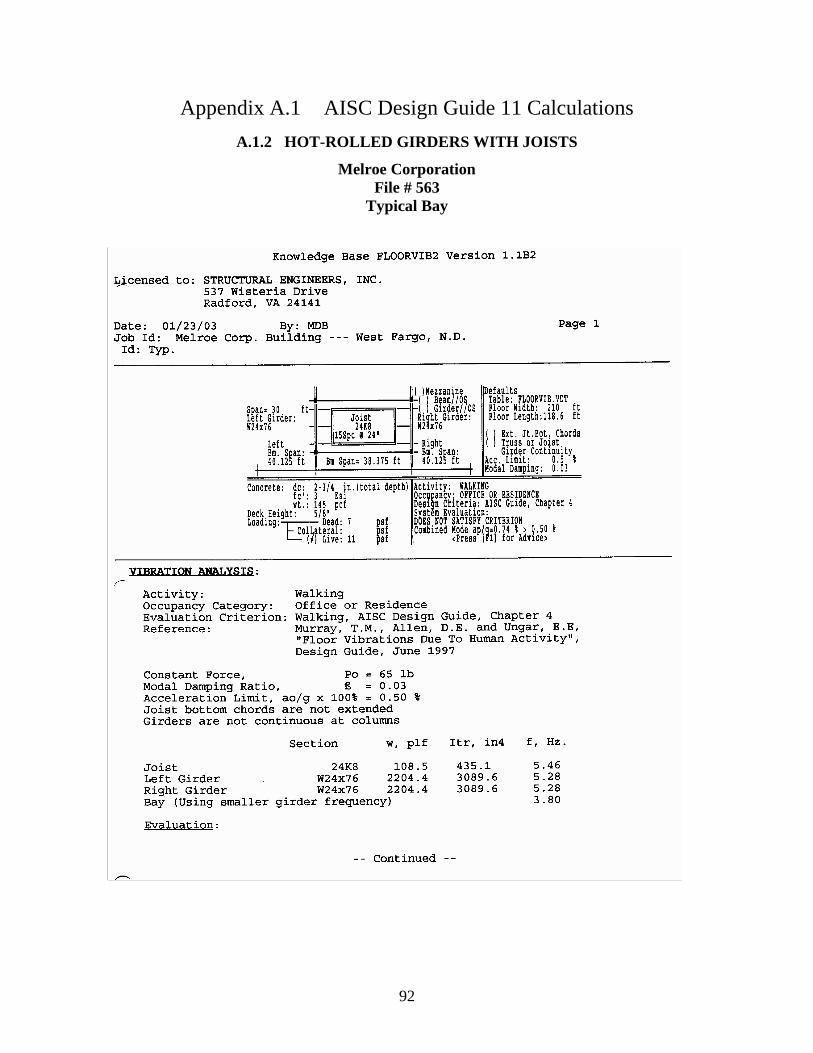
92
Appendix A.1 AISC Design Guide 11 Calculations
A.1.2 HOT-ROLLED GIRDERS WITH JOISTS
Melroe Corporation File # 563
Typical Bay
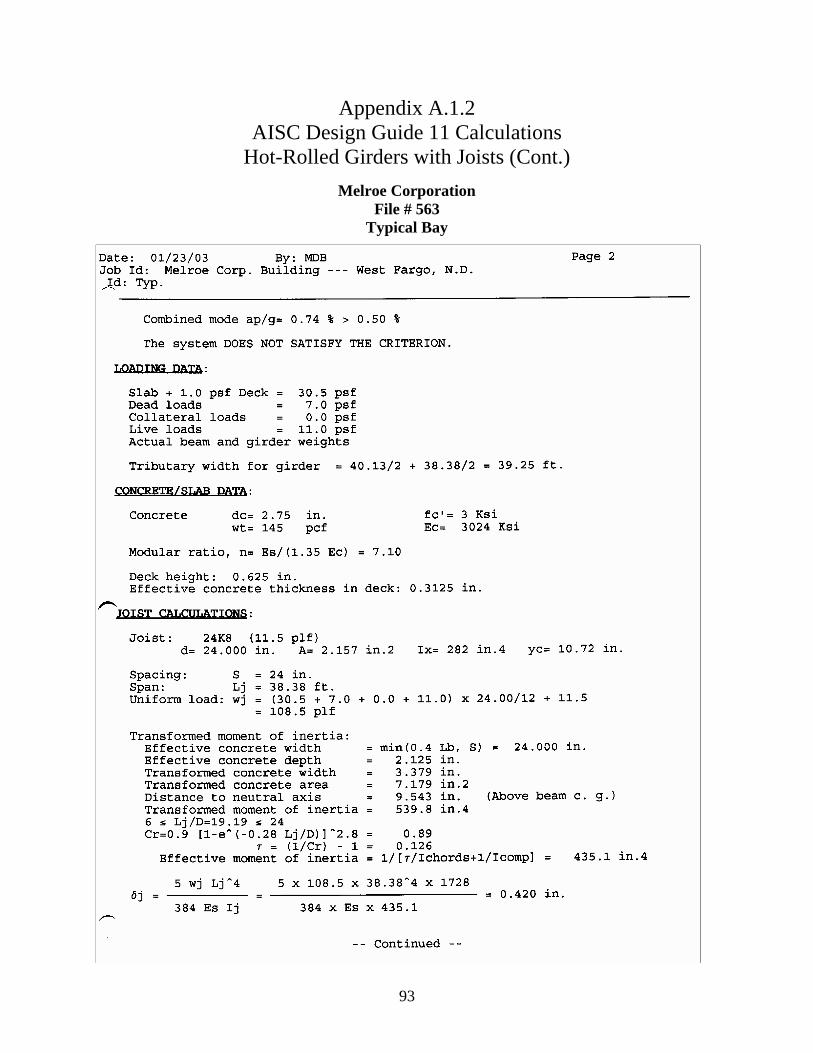
93
Appendix A.1.2 AISC Design Guide 11 Calculations
Hot-Rolled Girders with Joists (Cont.)
Melroe Corporation File # 563
Typical Bay

94
Appendix A.1.2 AISC Design Guide 11 Calculations
Hot-Rolled Girders with Joists (Cont.)
Melroe Corporation File # 563
Typical Bay
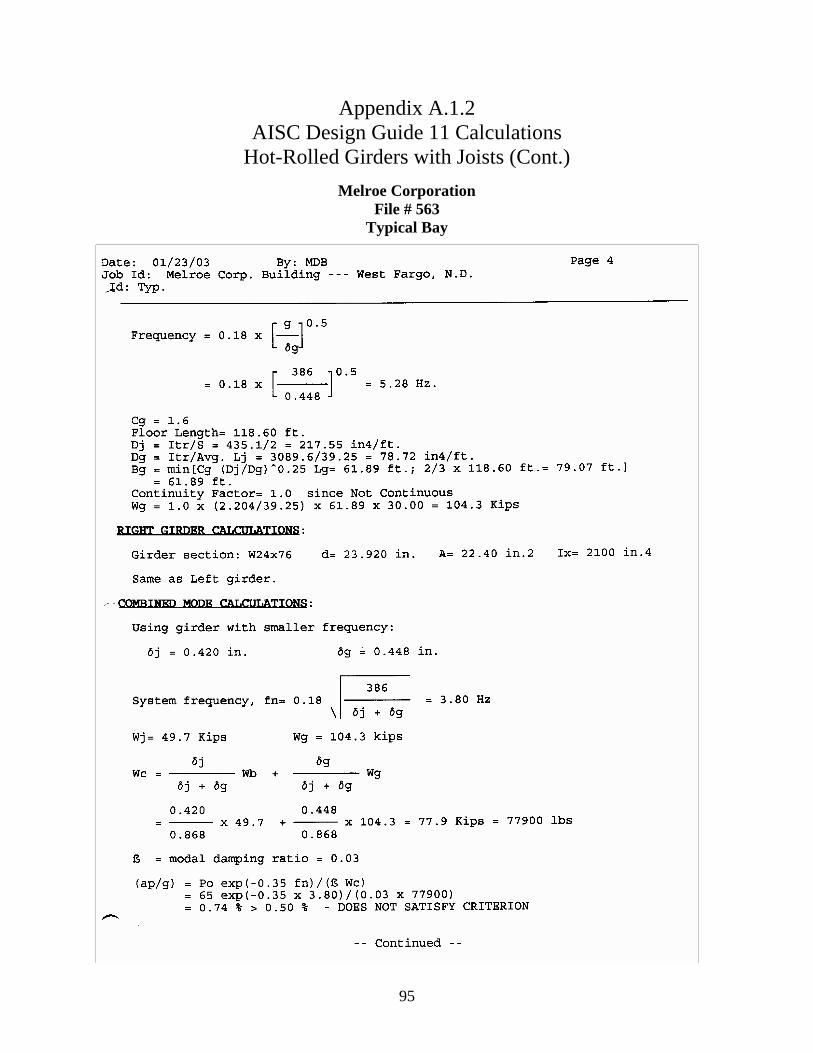
95
Appendix A.1.2 AISC Design Guide 11 Calculations
Hot-Rolled Girders with Joists (Cont.)
Melroe Corporation File # 563
Typical Bay
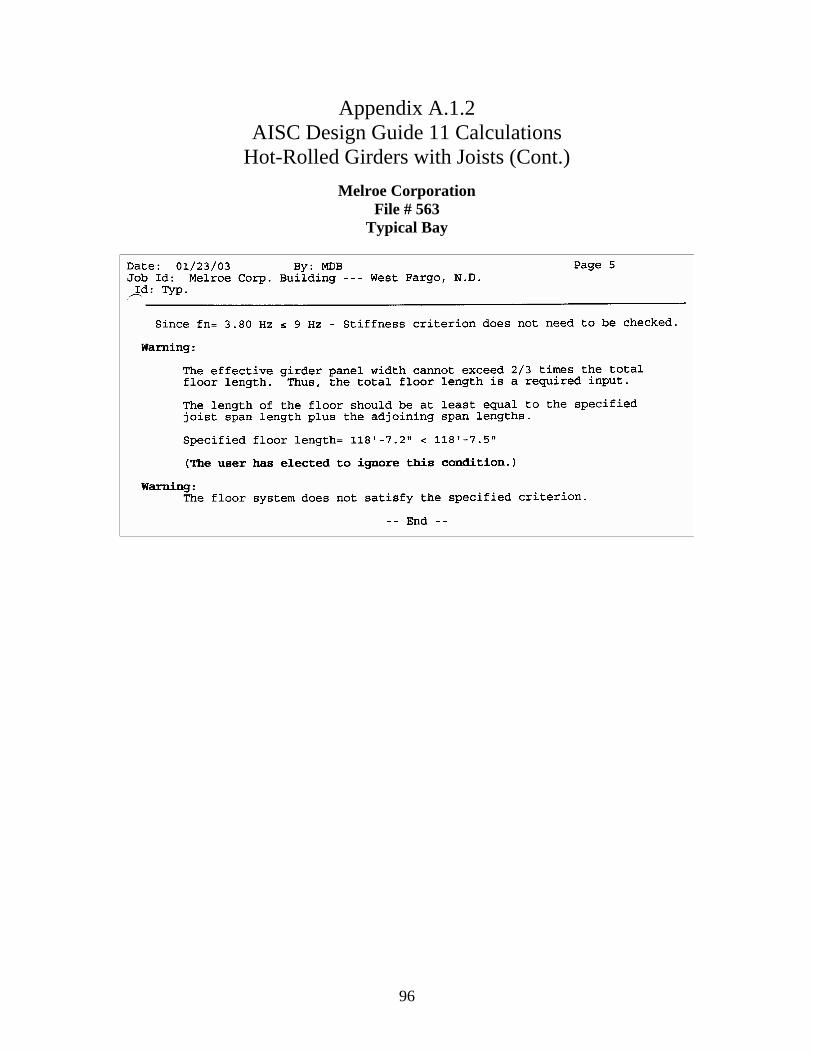
96
Appendix A.1.2 AISC Design Guide 11 Calculations
Hot-Rolled Girders with Joists (Cont.)
Melroe Corporation File # 563
Typical Bay
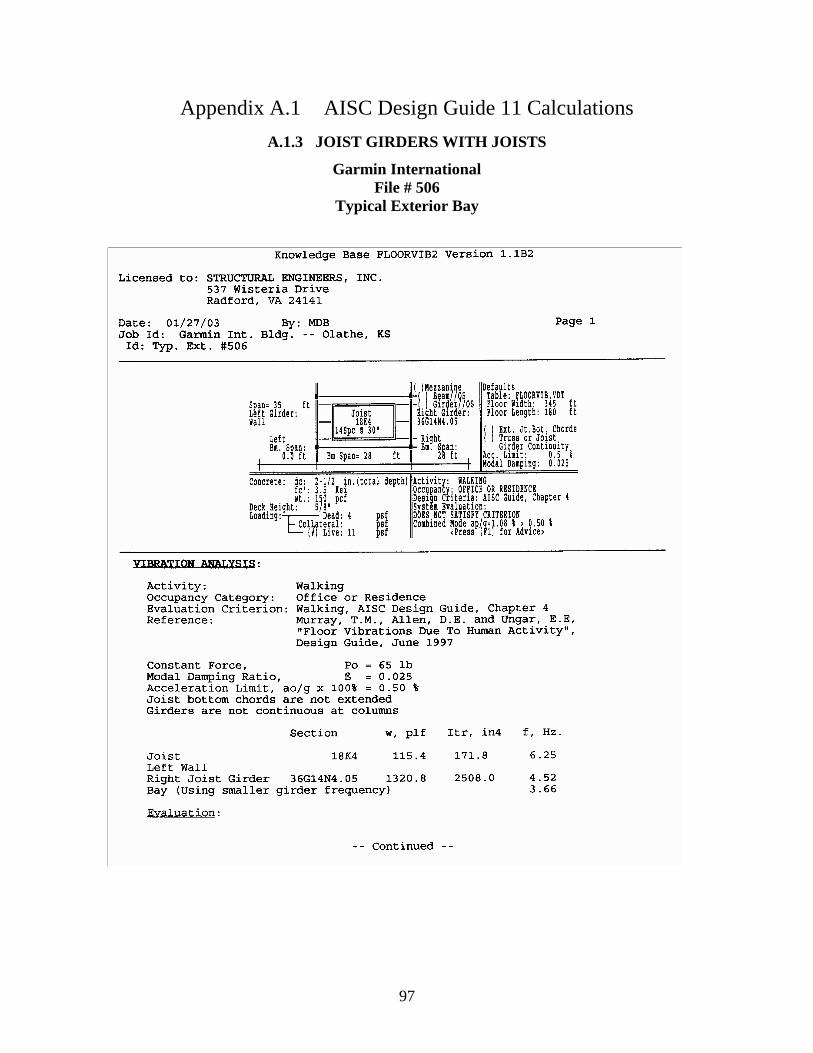
97
Appendix A.1 AISC Design Guide 11 Calculations
A.1.3 JOIST GIRDERS WITH JOISTS
Garmin International File # 506
Typical Exterior Bay
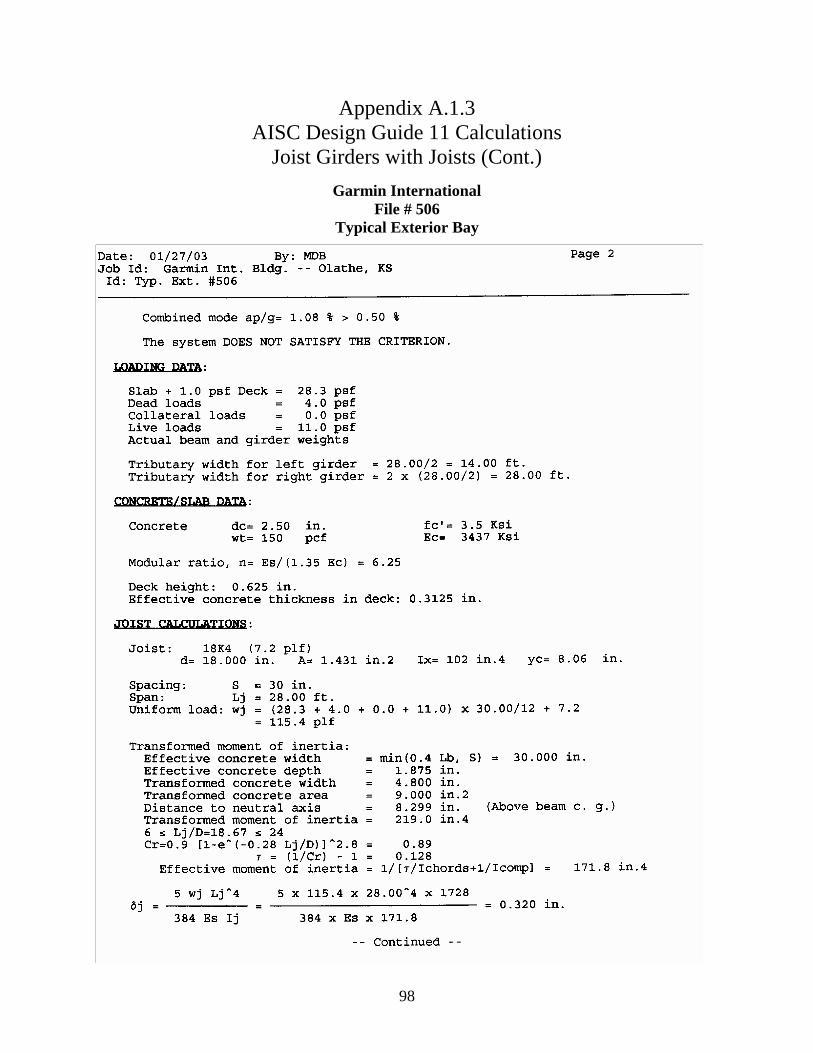
98
Appendix A.1.3 AISC Design Guide 11 Calculations
Joist Girders with Joists (Cont.)
Garmin International File # 506
Typical Exterior Bay
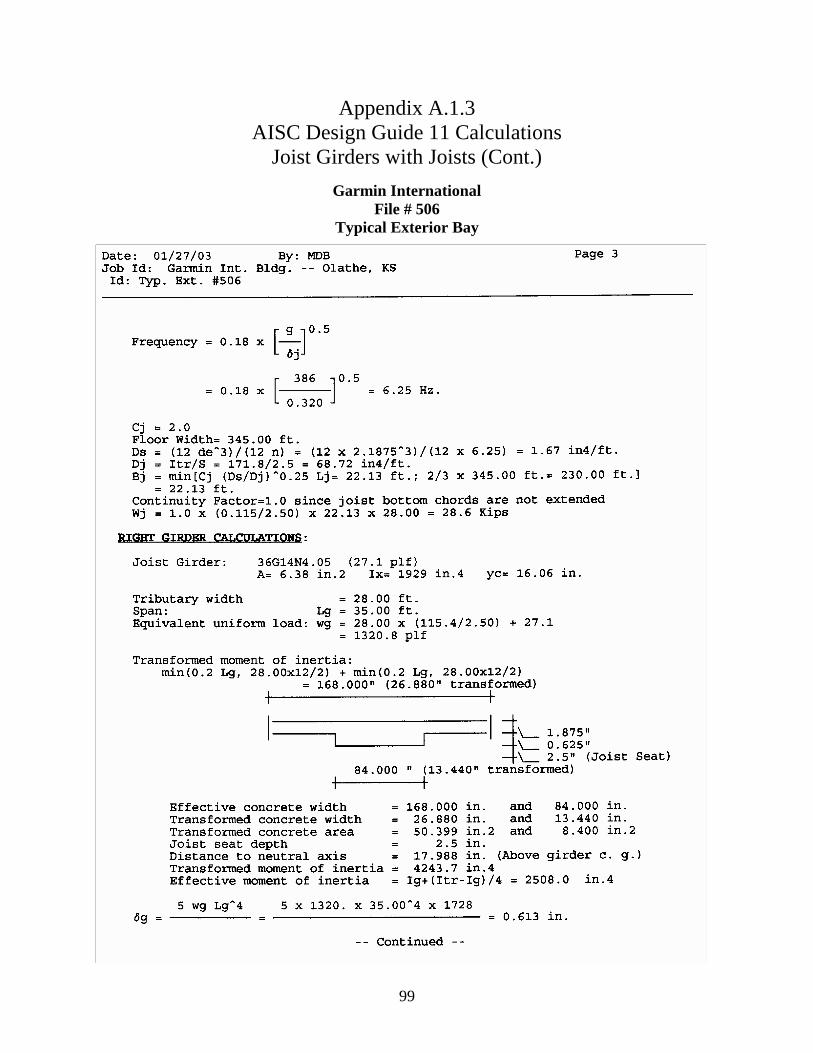
99
Appendix A.1.3 AISC Design Guide 11 Calculations
Joist Girders with Joists (Cont.)
Garmin International File # 506
Typical Exterior Bay
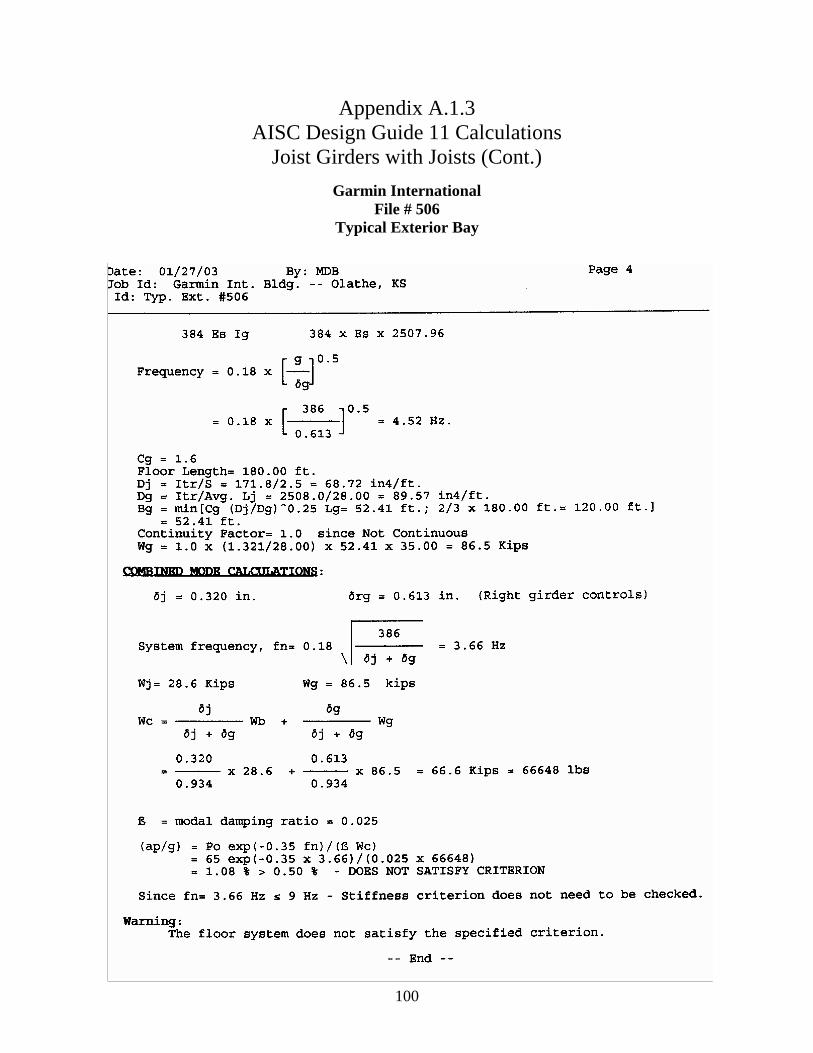
100
Appendix A.1.3 AISC Design Guide 11 Calculations
Joist Girders with Joists (Cont.)
Garmin International File # 506
Typical Exterior Bay
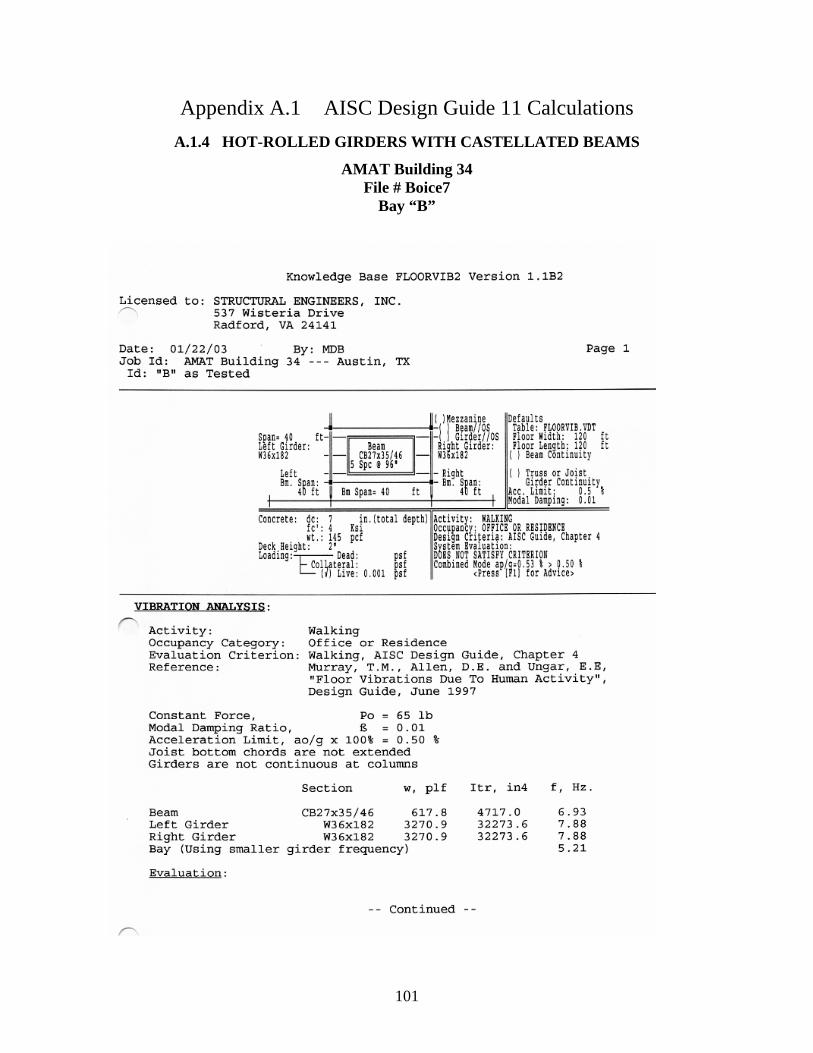
101
Appendix A.1 AISC Design Guide 11 Calculations
A.1.4 HOT-ROLLED GIRDERS WITH CASTELLATED BEAMS
AMAT Building 34 File # Boice7
Bay “B”
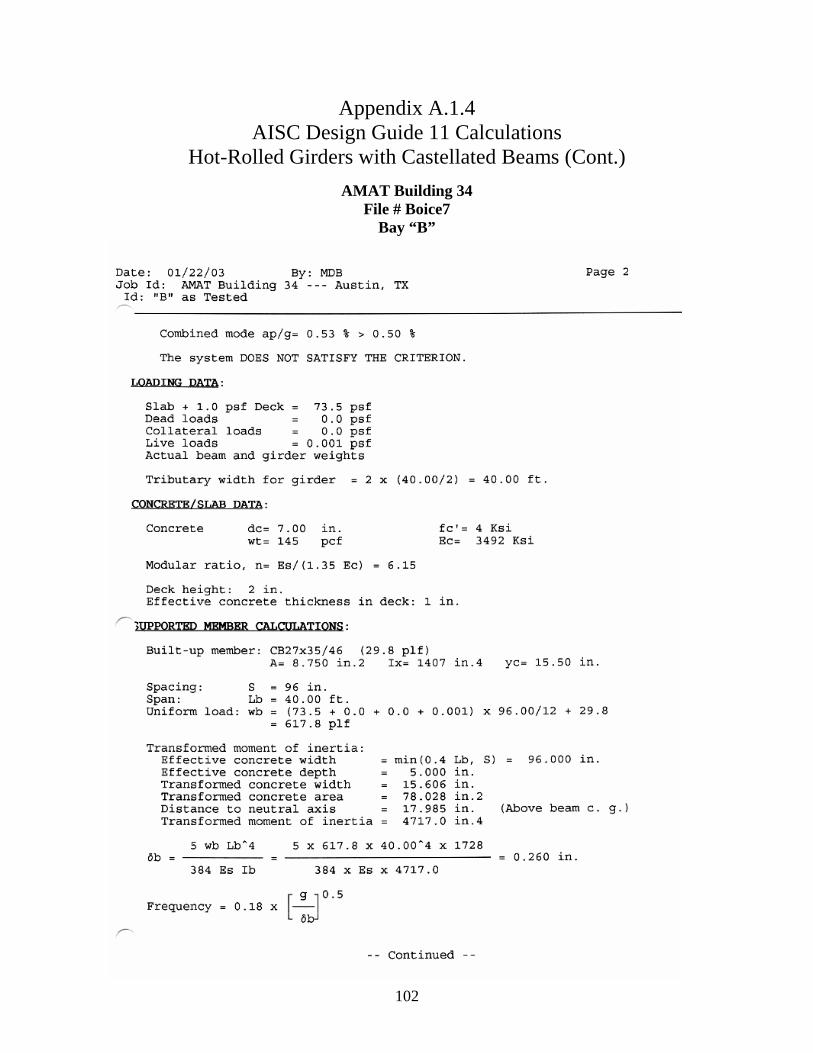
102
Appendix A.1.4 AISC Design Guide 11 Calculations
Hot-Rolled Girders with Castellated Beams (Cont.)
AMAT Building 34 File # Boice7
Bay “B”
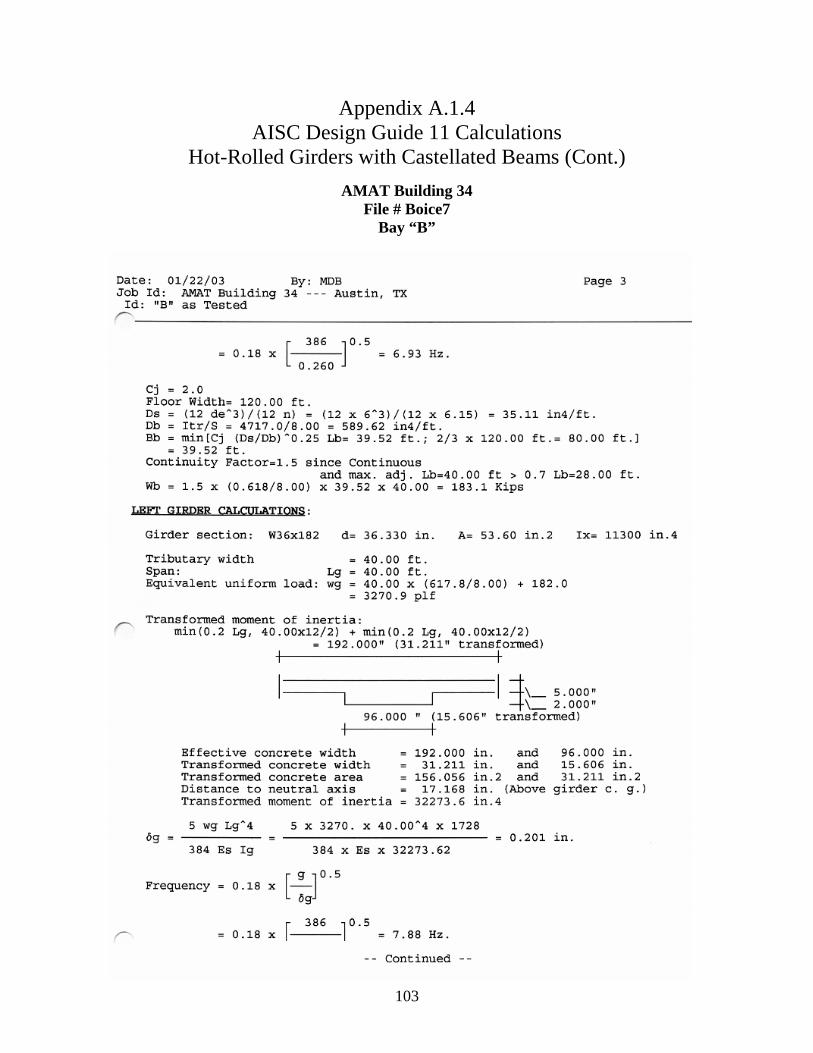
103
Appendix A.1.4
AISC Design Guide 11 Calculations Hot-Rolled Girders with Castellated Beams (Cont.)
AMAT Building 34 File # Boice7
Bay “B”
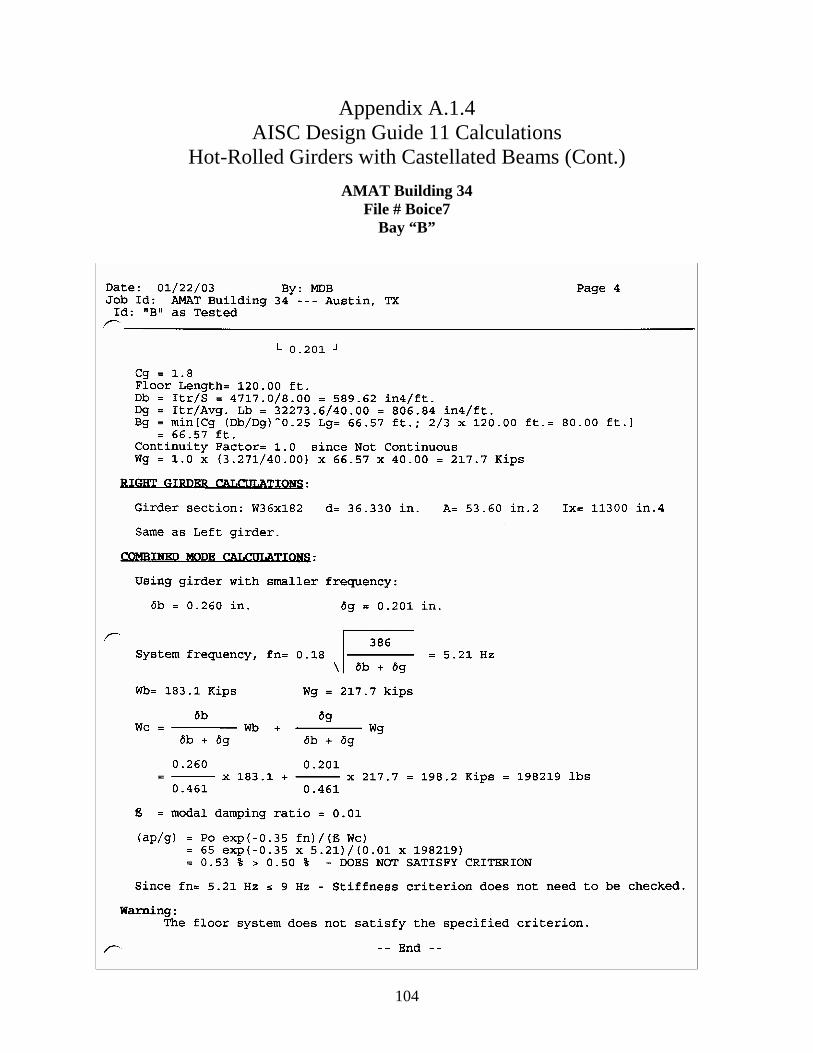
104
Appendix A.1.4 AISC Design Guide 11 Calculations
Hot-Rolled Girders with Castellated Beams (Cont.)
AMAT Building 34 File # Boice7
Bay “B”
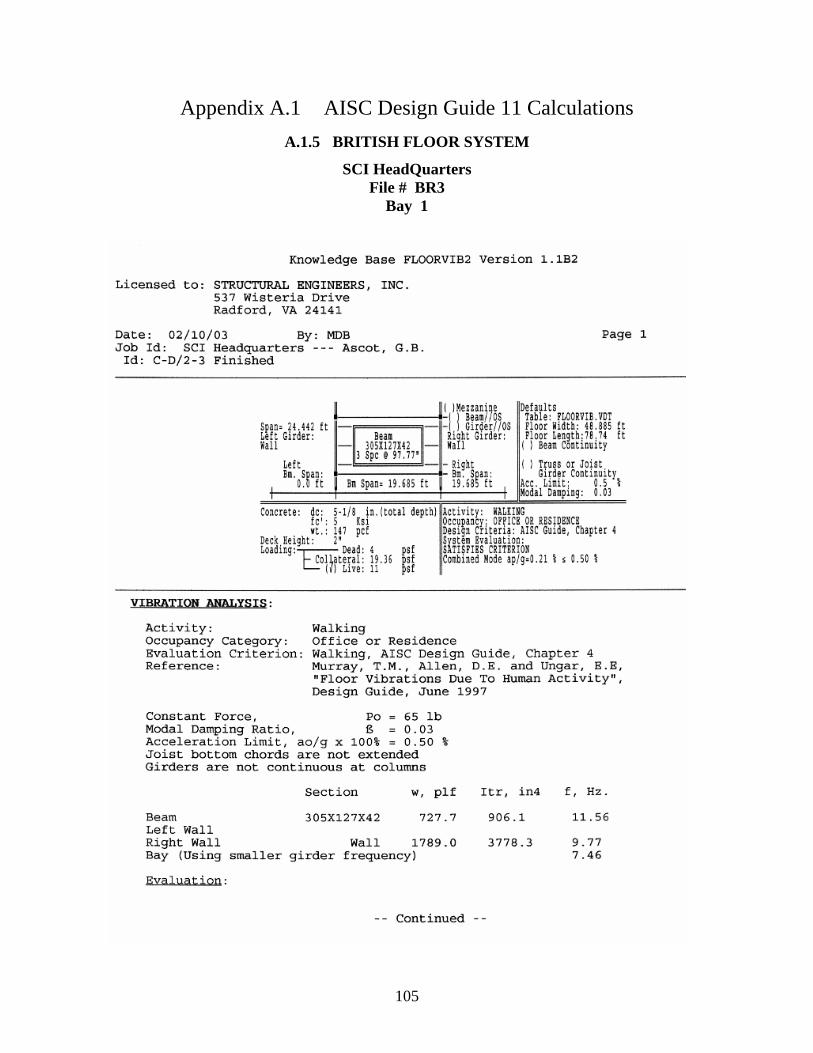
105
Appendix A.1 AISC Design Guide 11 Calculations
A.1.5 BRITISH FLOOR SYSTEM
SCI HeadQuarters File # BR3
Bay 1
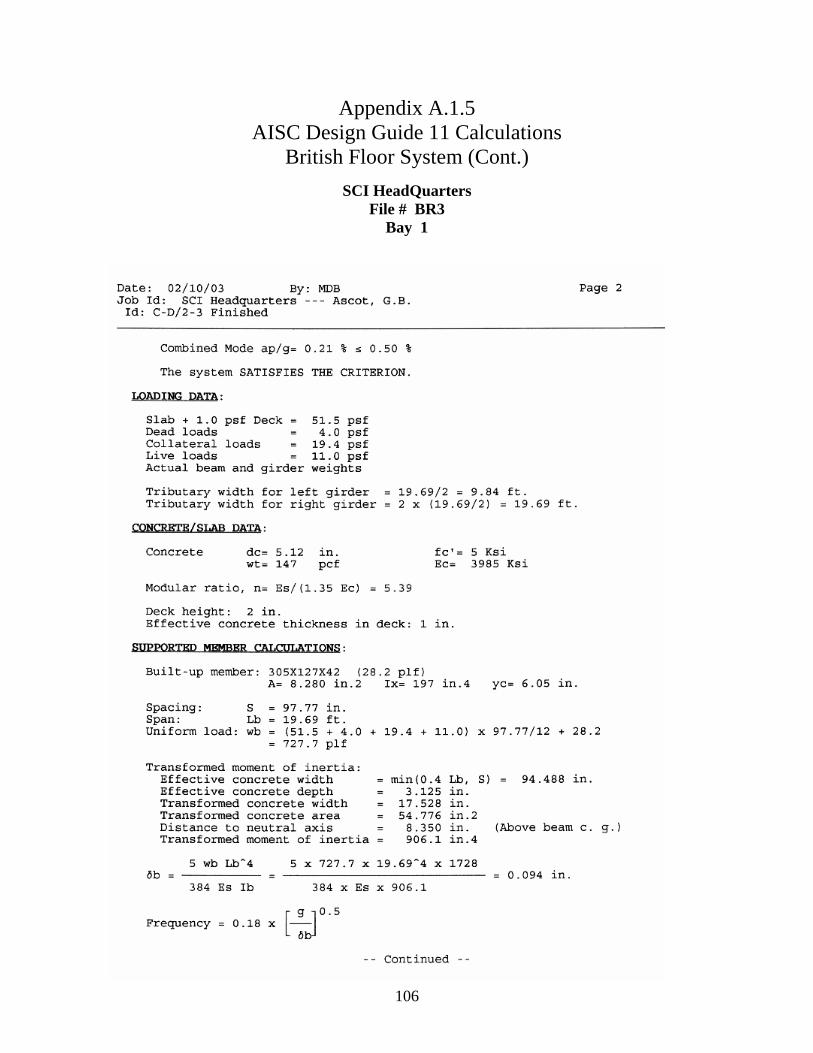
106
Appendix A.1.5 AISC Design Guide 11 Calculations
British Floor System (Cont.)
SCI HeadQuarters File # BR3
Bay 1
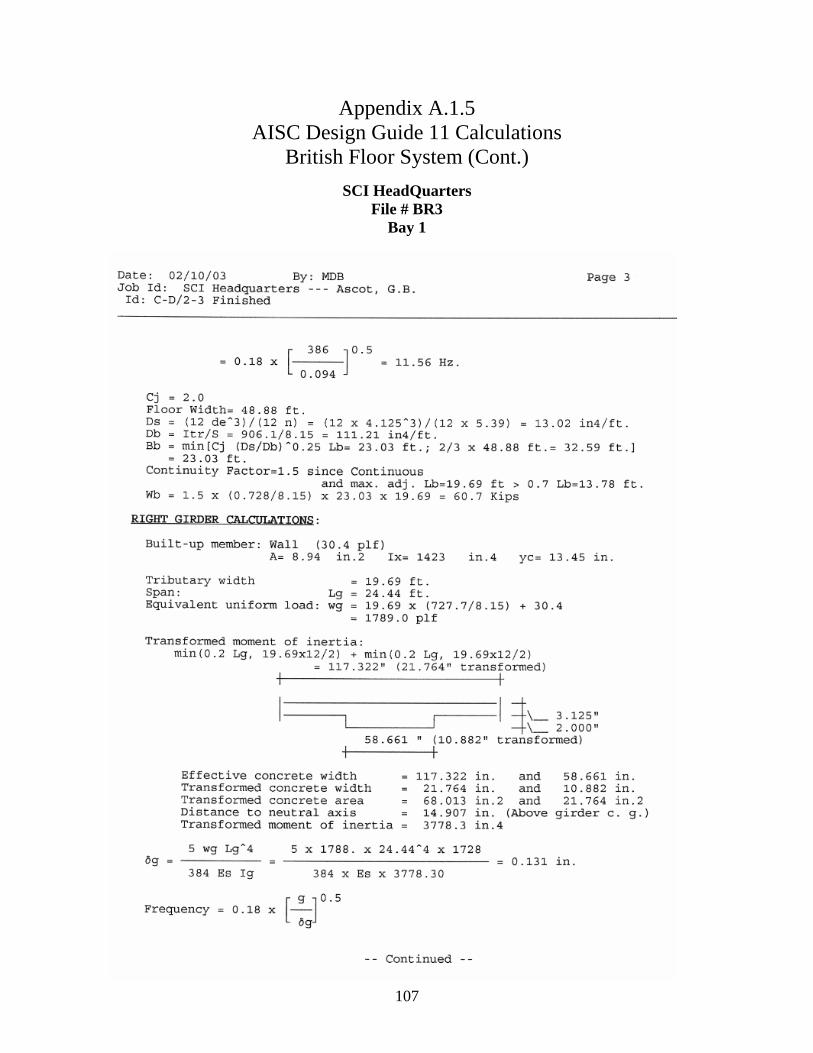
107
Appendix A.1.5
AISC Design Guide 11 Calculations British Floor System (Cont.)
SCI HeadQuarters File # BR3
Bay 1
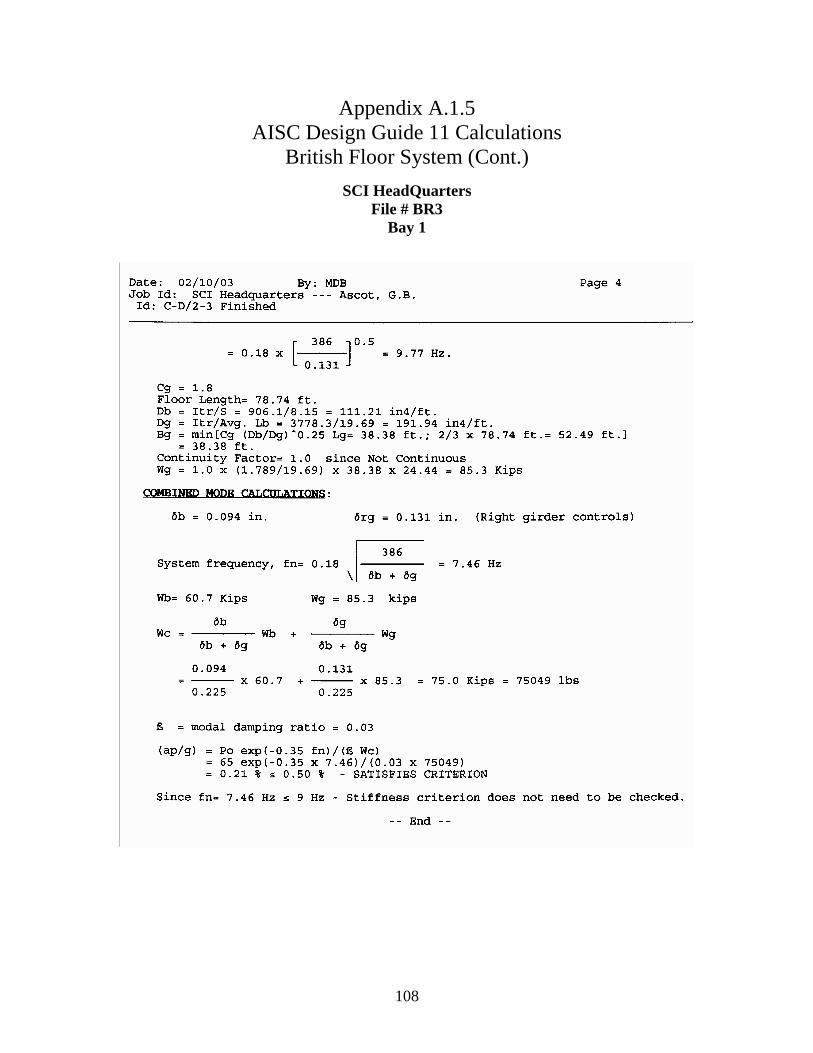
108
Appendix A.1.5 AISC Design Guide 11 Calculations
British Floor System (Cont.)
SCI HeadQuarters File # BR3
Bay 1
109
APPENDIX A.2 SCI FREQUENCY CALCULATIONS
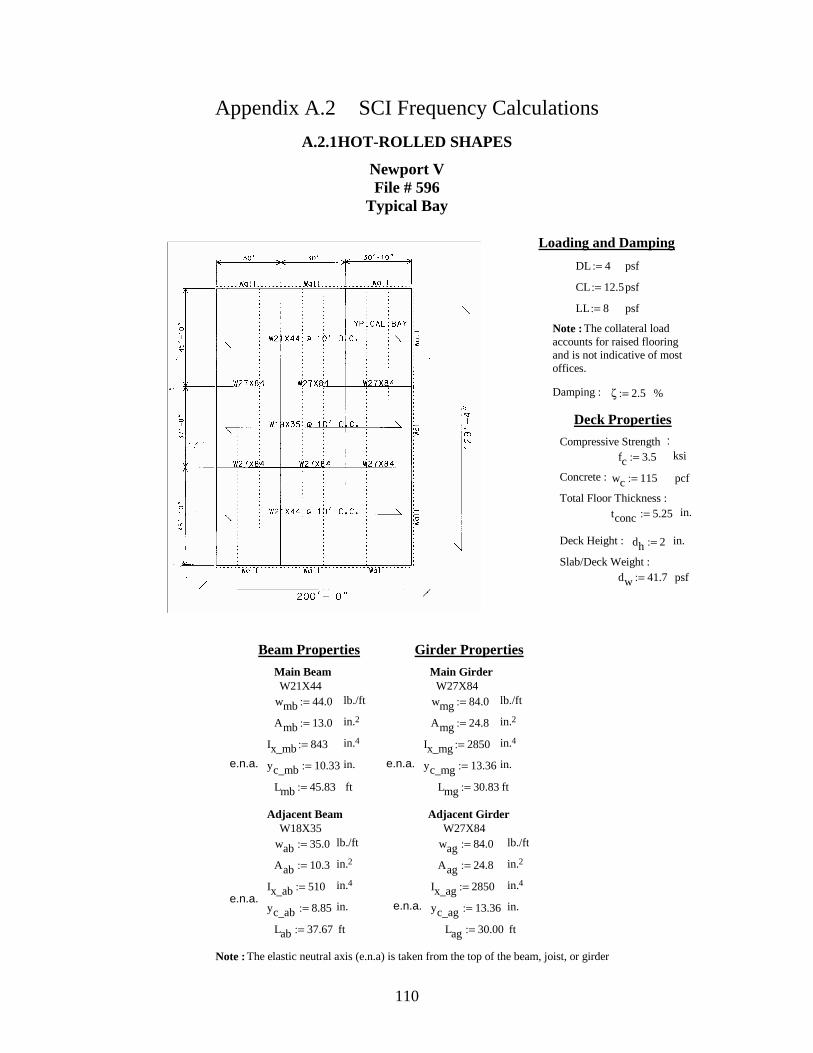
110
Appendix A.2 SCI Frequency Calculations
A.2.1 HOT-ROLLED SHAPES
Newport V File # 596
Typical Bay
psfdw 41.7:=Slab/Deck Weight :
in.dh 2:=Deck Height :
in.tconc 5.25:=Total Floor Thickness :
pcfwc 115:=Concrete :
ksi fc 3.5:=Compressive Strength :
Deck Properties
%ζ 2.5:=Damping :
Note : The collateral load accounts for raised flooring and is not indicative of most offices.
psfLL 8:=
psfCL 12.5:=
psfDL 4:=
Loading and Damping
Adjacent Beam Adjacent Girder W18X35 W27X84
wab 35.0:= lb./ft wag 84.0:= lb./ft
Aab 10.3:= in.2 Aag 24.8:= in.2
Ix_ab 510:= in.4 Ix_ag 2850:= in.4
e.n.a.yc_ab 8.85:= in. e.n.a. yc_ag 13.36:= in.
Lab 37.67:= ft Lag 30.00:= ft
Note : The elastic neutral axis (e.n.a) is taken from the top of the beam, joist, or girder
Beam Properties Girder Properties
Main Beam Main GirderW21X44 W27X84
wmb 44.0:= lb./ft wmg 84.0:= lb./ft
Amb 13.0:= in.2 Amg 24.8:= in.2
Ix_mb 843:= in.4 Ix_mg 2850:= in.4
e.n.a. yc_mb 10.33:= in. e.n.a. yc_mg 13.36:= in.
Lmb 45.83:= ft Lmg 30.83:= ft
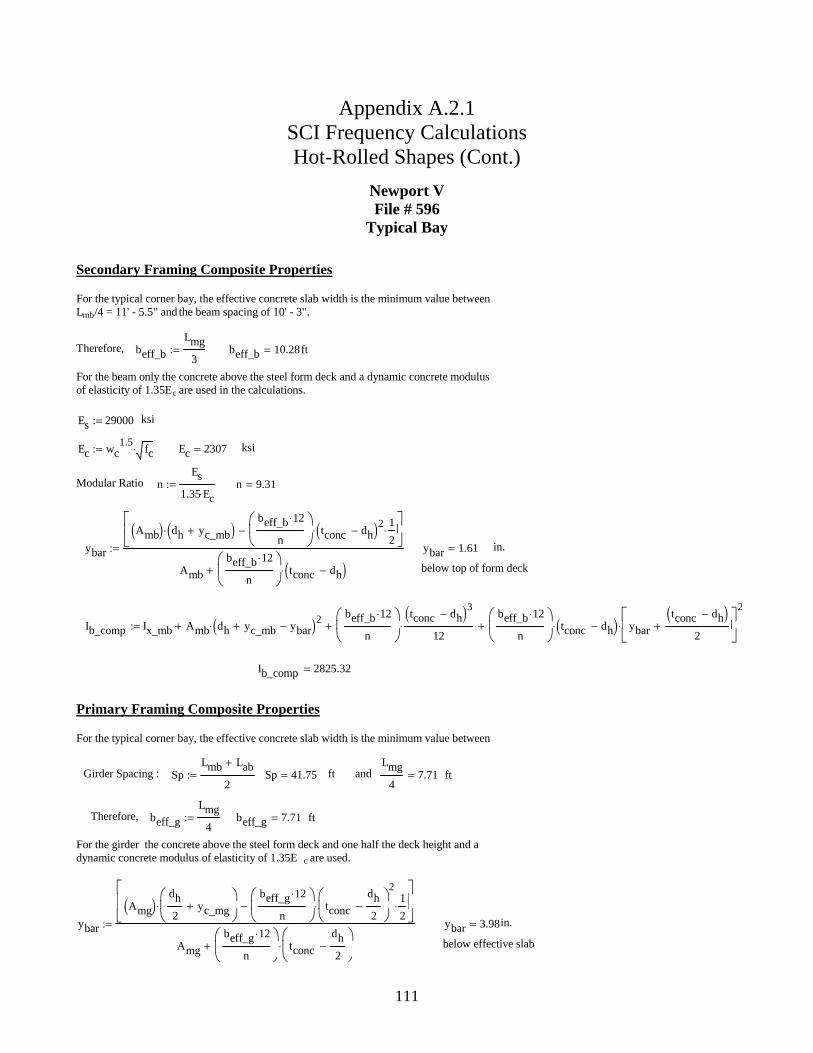
111
Appendix A.2.1 SCI Frequency Calculations Hot-Rolled Shapes (Cont.)
Newport V File # 596
Typical Bay
Ib_comp Ix_mb Amb dh yc_mb+ ybar−( )2⋅+beff_b 12⋅
n
tconc dh−( )3
12⋅+
beff_b 12⋅
n
tconc dh−( )⋅ ybar
tconc dh−( )2
+
2
⋅+:=
Ib_comp 2825.32=
Primary Framing Composite Properties
For the typical corner bay, the effective concrete slab width is the minimum value between
Girder Spacing : SpLmb Lab+
2:= Sp 41.75= ft and
Lmg
47.71= ft
Therefore,
beff_g
Lmg
4:= beff_g 7.71= ft
For the girder the concrete above the steel form deck and one half the deck height and a dynamic concrete modulus of elasticity of 1.35E c are used.
ybar
Amg( )dh
2yc_mg+
⋅beff_g 12⋅
n
tconc
dh
2−
2
⋅1
2⋅−
Amg
beff_g 12⋅
n
tconc
dh
2−
⋅+
:= ybar 3.98= in.
below effective slab
Secondary Framing Composite Properties
For the typical corner bay, the effective concrete slab width is the minimum value between Lmb/4 = 11' - 5.5" and the beam spacing of 10' - 3".
Therefore,
beff_b
Lmg
3:= beff_b 10.28= ft
For the beam only the concrete above the steel form deck and a dynamic concrete modulus of elasticity of 1.35Ec are used in the calculations.
Es 29000:= ksi
Ec wc1.5
fc⋅:= Ec 2307= ksi
Modular Ratio nEs
1.35 Ec⋅:= n 9.31=
ybar
Amb( ) dh yc_mb+( )⋅beff_b 12⋅
n
tconc dh−( )2⋅1
2⋅−
Amb
beff_b 12⋅
n
tconc dh−( )⋅+
:= ybar 1.61= in.
below top of form deck
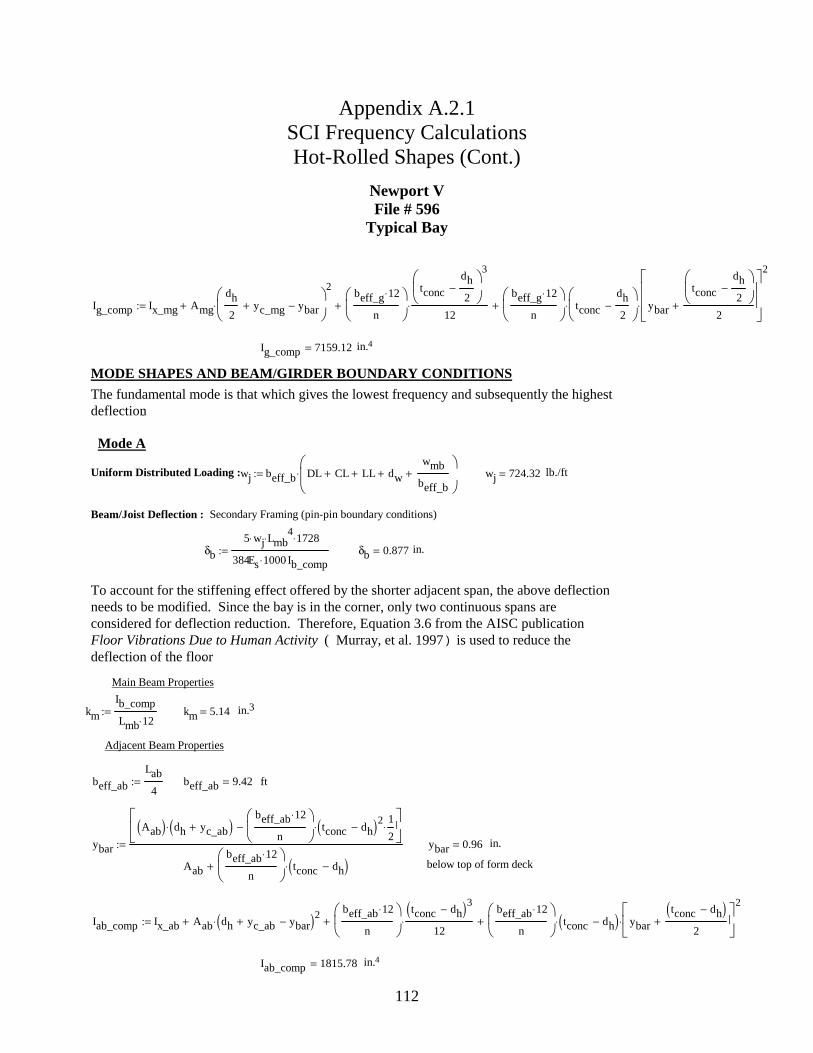
112
Appendix A.2.1 SCI Frequency Calculations Hot-Rolled Shapes (Cont.)
Newport V File # 596
Typical Bay
in.4Iab_comp 1815.78=
Iab_comp Ix_ab Aab dh yc_ab+ ybar−( )2⋅+beff_ab 12⋅
n
tconc dh−( )3
12⋅+
beff_ab 12⋅
n
tconc dh−( )⋅ ybar
tconc dh−( )2
+
2
⋅+:=
below top of form deck
in.ybar 0.96=ybar
Aab( ) dh yc_ab+( )⋅beff_ab 12⋅
n
tconc dh−( )2⋅1
2⋅−
Aab
beff_ab 12⋅
n
tconc dh−( )⋅+
:=
ftbeff_ab 9.42=beff_ab
Lab
4:=
Adjacent Beam Properties
in.3km 5.14=km
Ib_comp
Lmb 12⋅:=
Main Beam Properties
To account for the stiffening effect offered by the shorter adjacent span, the above deflection needs to be modified. Since the bay is in the corner, only two continuous spans are considered for deflection reduction. Therefore, Equation 3.6 from the AISC publication Floor Vibrations Due to Human Activity ( Murray, et al. 1997 ) is used to reduce the deflection of the floor.
in.δb 0.877=δb
5 wj⋅ Lmb4⋅ 1728⋅
384Es 1000⋅ Ib_comp⋅:=
Secondary Framing (pin-pin boundary conditions)Beam/Joist Deflection :
lb./ftwj 724.32=wj beff_b DL CL+ LL+ dw+wmb
beff_b+
⋅:=Uniform Distributed Loading :
Mode A
The fundamental mode is that which gives the lowest frequency and subsequently the highest deflection.
MODE SHAPES AND BEAM/GIRDER BOUNDARY CONDITIONS
in.4Ig_comp 7159.12=
Ig_comp Ix_mg Amg
dh
2yc_mg+ ybar−
2
⋅+beff_g 12⋅
n
tconc
dh
2−
3
12⋅+
beff_g 12⋅
n
tconc
dh
2−
⋅ ybar
tconc
dh
2−
2+
2
⋅+:=
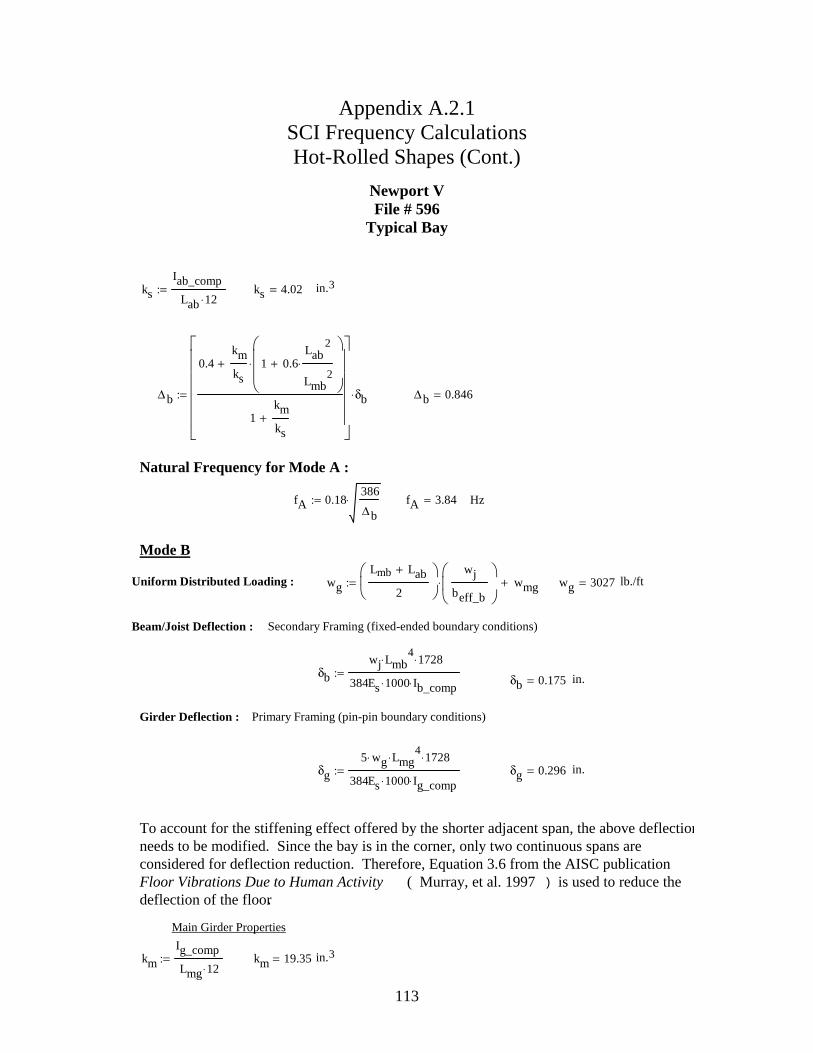
113
Appendix A.2.1 SCI Frequency Calculations Hot-Rolled Shapes (Cont.)
Newport V File # 596
Typical Bay
in.3km 19.35=km
Ig_comp
Lmg 12⋅:=
Main Girder Properties
To account for the stiffening effect offered by the shorter adjacent span, the above deflectionneeds to be modified. Since the bay is in the corner, only two continuous spans are considered for deflection reduction. Therefore, Equation 3.6 from the AISC publication Floor Vibrations Due to Human Activity ( Murray, et al. 1997 ) is used to reduce the deflection of the floor.
in.δg 0.296=δg
5 wg⋅ Lmg4⋅ 1728⋅
384Es 1000⋅ Ig_comp⋅:=
Primary Framing (pin-pin boundary conditions)Girder Deflection :
in.δb 0.175=δb
wj Lmb4⋅ 1728⋅
384Es 1000⋅ Ib_comp⋅:=
Secondary Framing (fixed-ended boundary conditions)Beam/Joist Deflection :
lb./ftwg 3027=wg
Lmb Lab+
2
wj
beff_b
⋅ wmg+:=Uniform Distributed Loading :
Mode B
HzfA 3.84=fA 0.18386
∆b⋅:=
Natural Frequency for Mode A :
∆b 0.846=∆ b
0.4km
ks1 0.6
Lab2
Lmb2
⋅+
⋅+
1km
ks+
δb⋅:=
in.3ks 4.02=ks
Iab_comp
Lab 12⋅:=
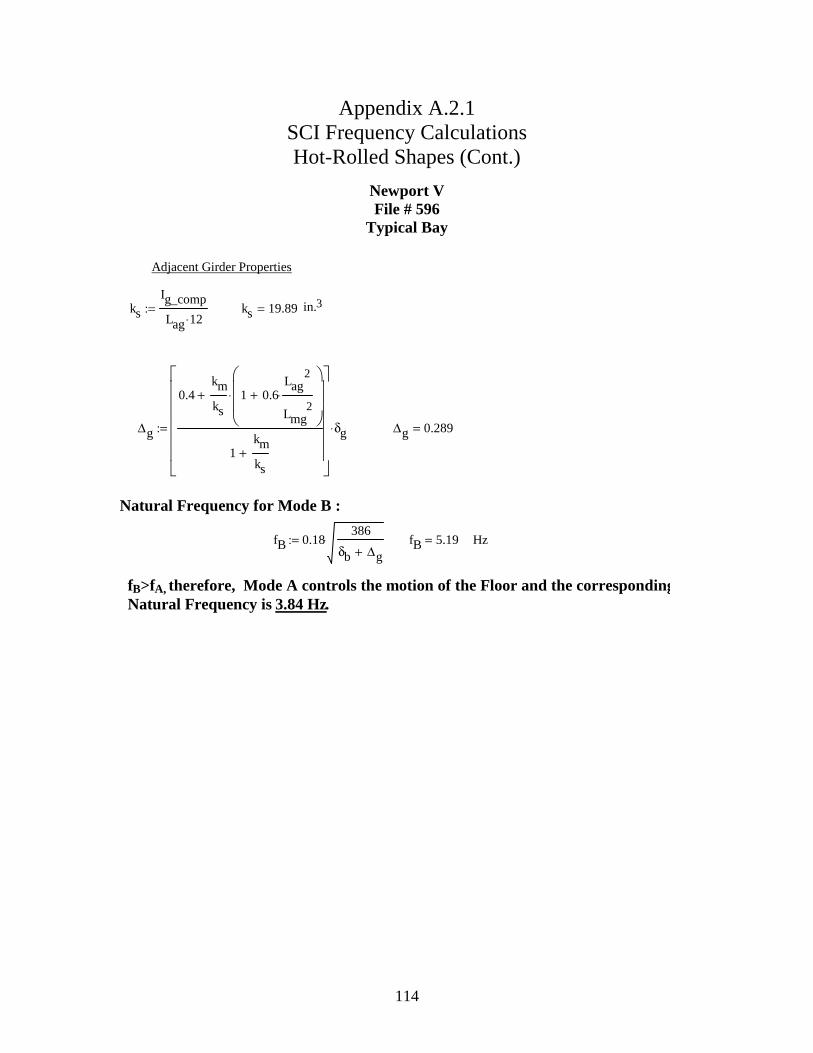
114
Appendix A.2.1 SCI Frequency Calculations Hot-Rolled Shapes (Cont.)
Newport V File # 596
Typical Bay
Adjacent Girder Properties
ks
Ig_comp
Lag 12⋅:= ks 19.89= in.3
∆g
0.4km
ks1 0.6
Lag2
Lmg2
⋅+
⋅+
1km
ks+
δg⋅:= ∆g 0.289=
Natural Frequency for Mode B :
fB 0.18386
δb ∆g+⋅:= fB 5.19= Hz
fB>fA, therefore, Mode A controls the motion of the Floor and the correspondingNatural Frequency is 3.84 Hz.
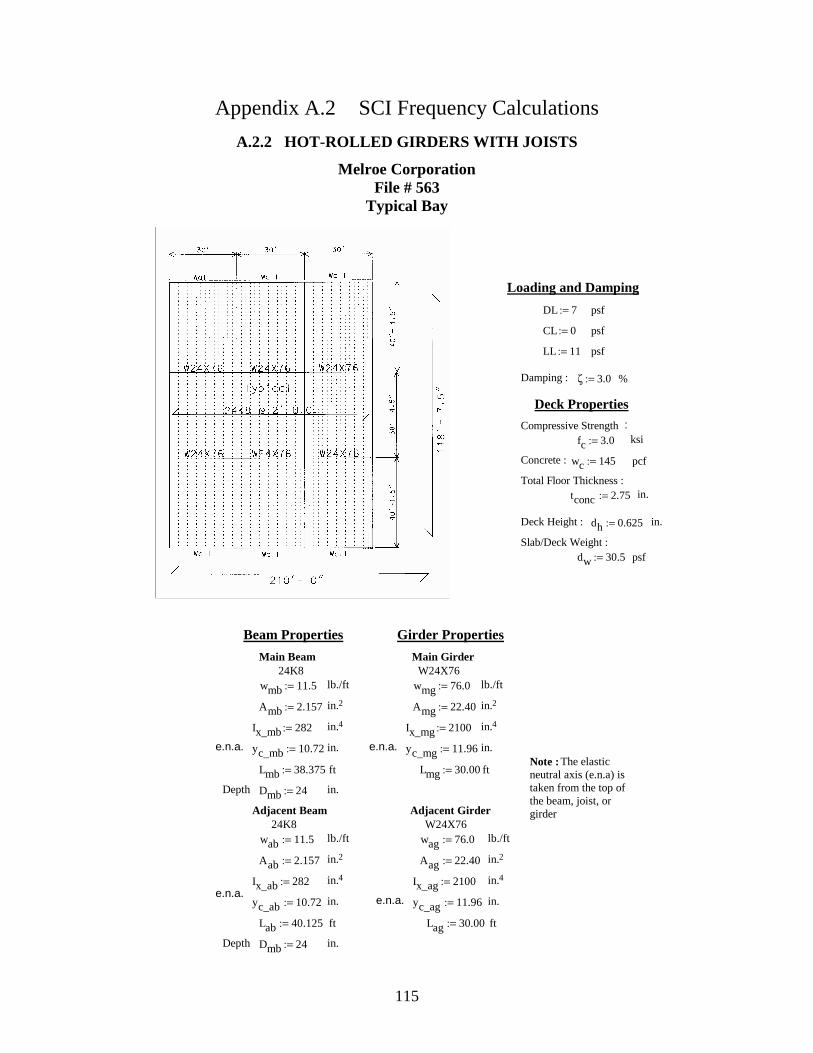
115
Appendix A.2 SCI Frequency Calculations
A.2.2 HOT-ROLLED GIRDERS WITH JOISTS
Melroe Corporation File # 563
Typical Bay
psfdw 30.5:=Slab/Deck Weight :
in.dh 0.625:=Deck Height :
in.tconc 2.75:=Total Floor Thickness :
pcfwc 145:=Concrete :
ksi fc 3.0:=Compressive Strength :
Deck Properties
%ζ 3.0:=Damping :
psfLL 11:=
psfCL 0:=
psfDL 7:=
Loading and Damping
in.
Adjacent Beam Adjacent Girder 24K8 W24X76
wab 11.5:= lb./ft wag 76.0:= lb./ft
Aab 2.157:= in.2 Aag 22.40:= in.2
Ix_ab 282:= in.4 Ix_ag 2100:= in.4
e.n.a.yc_ab 10.72:= in. e.n.a. yc_ag 11.96:= in.
Lab 40.125:= ft Lag 30.00:= ft
Depth Dmb 24:= in.
Beam Properties Girder Properties
Main Beam Main Girder24K8 W24X76
wmb 11.5:= lb./ft wmg 76.0:= lb./ft
Amb 2.157:= in.2 Amg 22.40:= in.2
Ix_mb 282:= in.4 Ix_mg 2100:= in.4
e.n.a. yc_mb 10.72:= in. e.n.a. yc_mg 11.96:= in.Note : The elastic neutral axis (e.n.a) is taken from the top of the beam, joist, or girder
Lmb 38.375:= ft Lmg 30.00:= ft
Depth Dmb 24:=
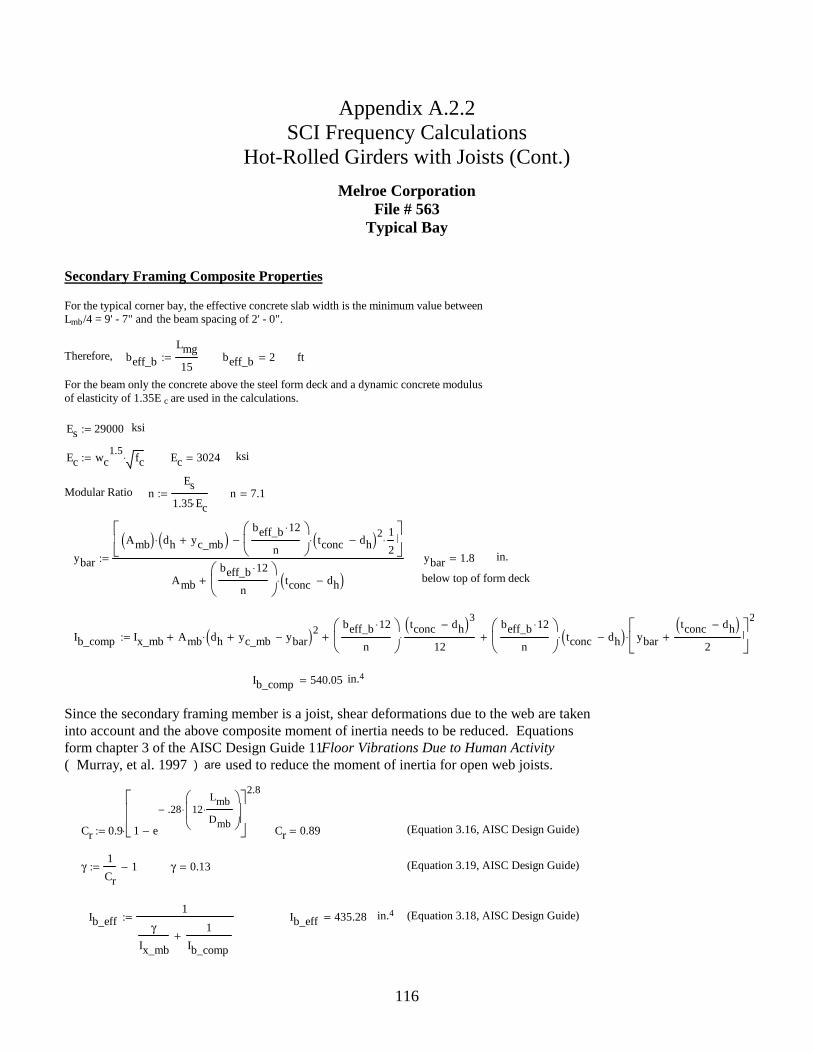
116
Appendix A.2.2 SCI Frequency Calculations
Hot-Rolled Girders with Joists (Cont.)
Melroe Corporation File # 563
Typical Bay
(Equation 3.18, AISC Design Guide) in.4Ib_eff 435.28=Ib_eff1
γIx_mb
1
Ib_comp+
:=
(Equation 3.19, AISC Design Guide) γ 0.13=γ1
Cr1−:=
(Equation 3.16, AISC Design Guide) Cr 0.89=Cr 0.9 1 e
.28− 12Lmb
Dmb⋅
⋅
−
2.8
⋅:=
Since the secondary framing member is a joist, shear deformations due to the web are taken into account and the above composite moment of inertia needs to be reduced. Equations form chapter 3 of the AISC Design Guide 11 Floor Vibrations Due to Human Activity ( Murray, et al. 1997 ) are used to reduce the moment of inertia for open web joists.
in.4Ib_comp 540.05=
Ib_comp Ix_mb Amb dh yc_mb+ ybar−( )2⋅+beff_b 12⋅
n
tconc dh−( )3
12⋅+
beff_b 12⋅
n
tconc dh−( )⋅ ybar
tconc dh−( )2
+
2
⋅+:=
below top of form deck
in.
Secondary Framing Composite Properties
For the typical corner bay, the effective concrete slab width is the minimum value between Lmb/4 = 9' - 7" and the beam spacing of 2' - 0".
Therefore,
beff_b
Lmg
15:= beff_b 2= ft
For the beam only the concrete above the steel form deck and a dynamic concrete modulus of elasticity of 1.35E c are used in the calculations.
Es 29000:= ksi
Ec wc1.5
fc⋅:= Ec 3024= ksi
Modular Ratio nEs
1.35 Ec⋅:= n 7.1=
ybar
Amb( ) dh yc_mb+( )⋅beff_b 12⋅
n
tconc dh−( )2⋅1
2⋅−
Amb
beff_b 12⋅
n
tconc dh−( )⋅+
:= ybar 1.8=
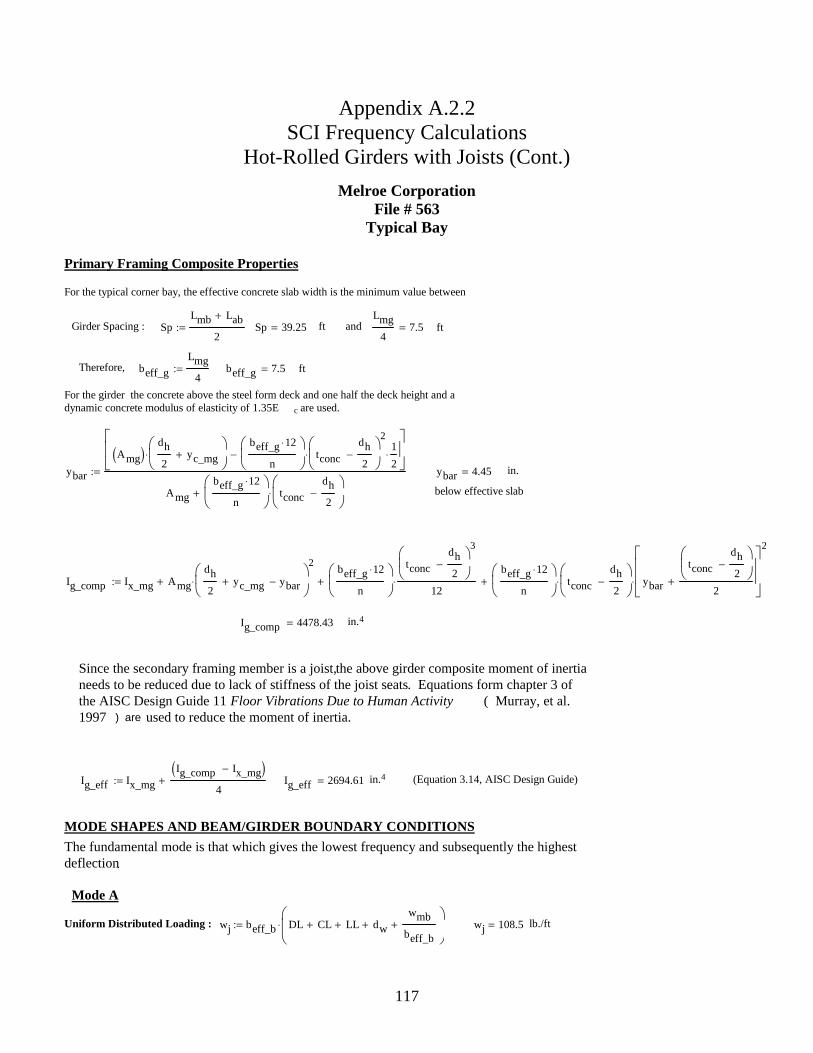
117
Appendix A.2.2 SCI Frequency Calculations
Hot-Rolled Girders with Joists (Cont.)
Melroe Corporation File # 563
Typical Bay
lb./ftwj 108.5=wj beff_b DL CL+ LL+ dw+wmb
beff_b+
⋅:=Uniform Distributed Loading :
Mode A
The fundamental mode is that which gives the lowest frequency and subsequently the highest deflection.
MODE SHAPES AND BEAM/GIRDER BOUNDARY CONDITIONS
(Equation 3.14, AISC Design Guide) in.4Ig_eff 2694.61=Ig_eff Ix_mg
Ig_comp Ix_mg−( )4
+:=
Since the secondary framing member is a joist, the above girder composite moment of inertia needs to be reduced due to lack of stiffness of the joist seats. Equations form chapter 3 of the AISC Design Guide 11 Floor Vibrations Due to Human Activity ( Murray, et al. 1997 ) are used to reduce the moment of inertia.
in.4Ig_comp 4478.43=
Ig_comp Ix_mg Amg
dh
2yc_mg+ ybar−
2
⋅+beff_g 12⋅
n
tconc
dh
2−
3
12⋅+
beff_g 12⋅
n
tconc
dh
2−
⋅ ybar
tconc
dh
2−
2+
2
⋅+:=
below effective slab
in.ybar 4.45=ybar
Amg( )dh
2yc_mg+
⋅beff_g 12⋅
n
tconc
dh
2−
2
⋅1
2⋅−
Amg
beff_g 12⋅
n
tconc
dh
2−
⋅+
:=
For the girder the concrete above the steel form deck and one half the deck height and a dynamic concrete modulus of elasticity of 1.35E c are used.
ftbeff_g 7.5=beff_g
Lmg
4:=Therefore,
ftLmg
47.5=ft and Sp 39.25=Sp
Lmb Lab+
2:=Girder Spacing :
For the typical corner bay, the effective concrete slab width is the minimum value between
Primary Framing Composite Properties
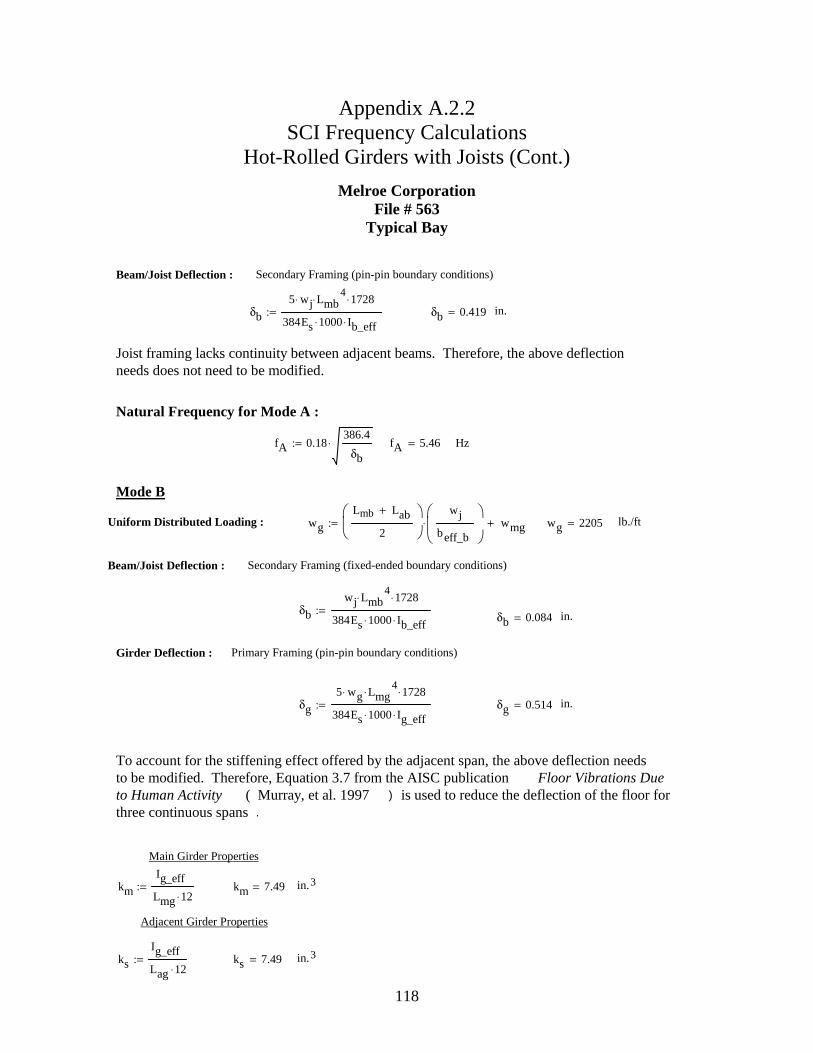
118
Appendix A.2.2 SCI Frequency Calculations
Hot-Rolled Girders with Joists (Cont.)
Melroe Corporation File # 563
Typical Bay
δb
wj Lmb4⋅ 1728⋅
384Es 1000⋅ Ib_eff⋅:= δb 0.084= in.
Girder Deflection : Primary Framing (pin-pin boundary conditions)
δg
5 wg⋅ Lmg4⋅ 1728⋅
384Es 1000⋅ Ig_eff⋅:= δg 0.514= in.
To account for the stiffening effect offered by the adjacent span, the above deflection needs to be modified. Therefore, Equation 3.7 from the AISC publication Floor Vibrations Due to Human Activity ( Murray, et al. 1997 ) is used to reduce the deflection of the floor for three continuous spans .
Main Girder Properties
km
Ig_eff
Lmg 12⋅:= km 7.49= in.3
Adjacent Girder Properties
ks
Ig_eff
Lag 12⋅:= ks 7.49= in.3
Beam/Joist Deflection : Secondary Framing (pin-pin boundary conditions)
δb
5 wj⋅ Lmb4⋅ 1728⋅
384Es 1000⋅ Ib_eff⋅:= δb 0.419= in.
Joist framing lacks continuity between adjacent beams. Therefore, the above deflection needs does not need to be modified.
Natural Frequency for Mode A :
fA 0.18386.4
δb⋅:= fA 5.46= Hz
Mode B
Uniform Distributed Loading : wg
Lmb Lab+
2
wj
beff_b
⋅ wmg+:= wg 2205= lb./ft
Beam/Joist Deflection : Secondary Framing (fixed-ended boundary conditions)
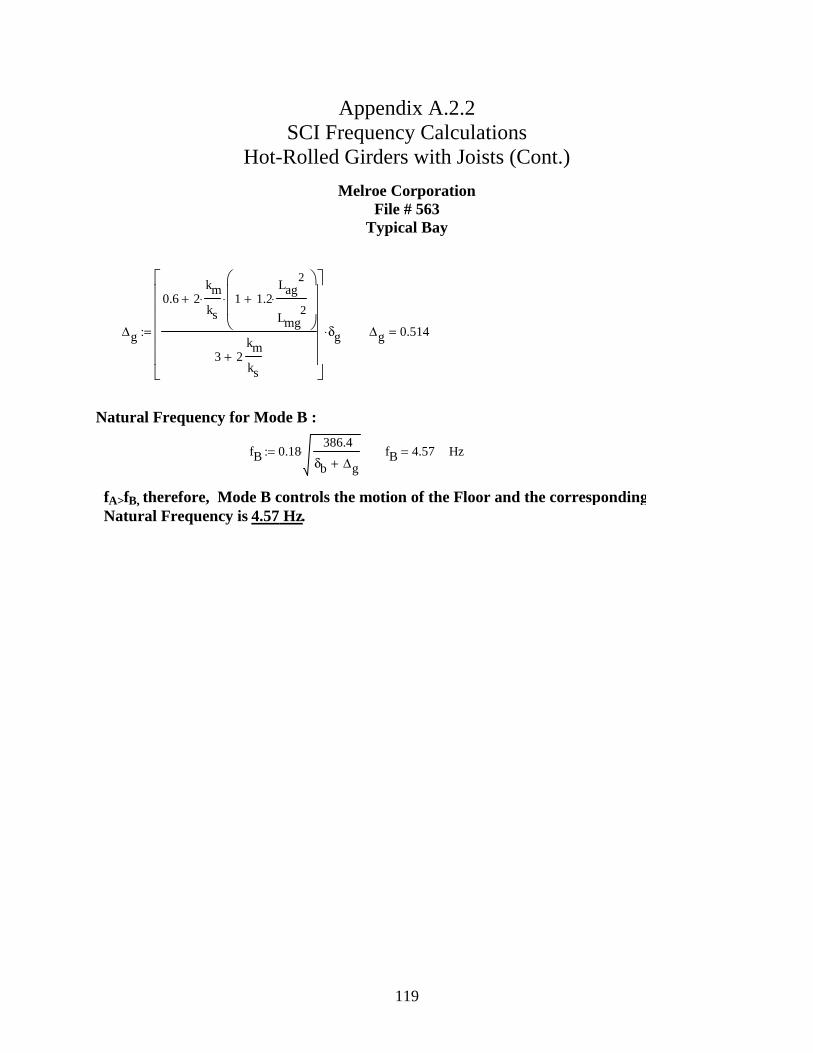
119
Appendix A.2.2 SCI Frequency Calculations
Hot-Rolled Girders with Joists (Cont.)
Melroe Corporation File # 563
Typical Bay
∆g
0.6 2km
ks⋅ 1 1.2
Lag2
Lmg2
⋅+
⋅+
3 2km
ks+
δg⋅:= ∆g 0.514=
Natural Frequency for Mode B :
fB 0.18386.4
δb ∆g+⋅:= fB 4.57= Hz
fA>fB, therefore, Mode B controls the motion of the Floor and the corresponding Natural Frequency is 4.57 Hz.
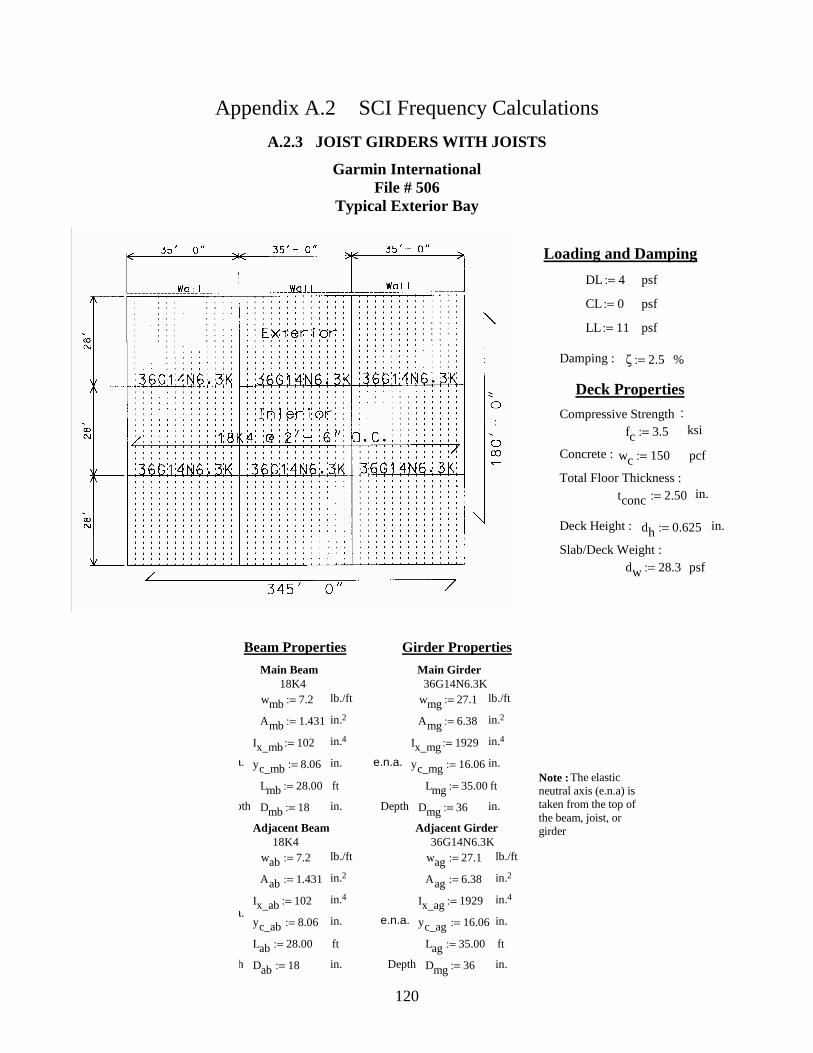
120
Appendix A.2 SCI Frequency Calculations
A.2.3 JOIST GIRDERS WITH JOISTS
Garmin International File # 506
Typical Exterior Bay
psfdw 28.3:=Slab/Deck Weight :
in.dh 0.625:=Deck Height :
in.tconc 2.50:=Total Floor Thickness :
pcfwc 150:=Concrete :
ksi fc 3.5:=Compressive Strength :
Deck Properties
%ζ 2.5:=Damping :
psfLL 11:=
psfCL 0:=
psfDL 4:=
Loading and Damping
in.
Adjacent Beam Adjacent Girder 18K4 36G14N6.3K
wab 7.2:= lb./ft wag 27.1:= lb./ft
Aab 1.431:= in.2 Aag 6.38:= in.2
Ix_ab 102:= in.4 Ix_ag 1929:=
in.Dmg 36:=Depth in.Dab 18:=pth
ftLag 35.00:=ftLab 28.00:=
in.yc_ag 16.06:=e.n.a.in.yc_ab 8.06:=.a.
in.4
Ix_mg 1929:=in.4Ix_mb 102:=
in.2Amg 6.38:=in.2Amb 1.431:=
lb./ftwmg 27.1:=lb./ftwmb 7.2:=36G14N6.3K 18K4
Main GirderMain Beam
Girder PropertiesBeam Properties
Dmg 36:=Depth in.Dmb 18:=epth
ftLmg 35.00:=ftLmb 28.00:=Note : The elastic neutral axis (e.n.a) is taken from the top of the beam, joist, or girder
in.yc_mg 16.06:=e.n.a.in.yc_mb 8.06:=.a.
in.4
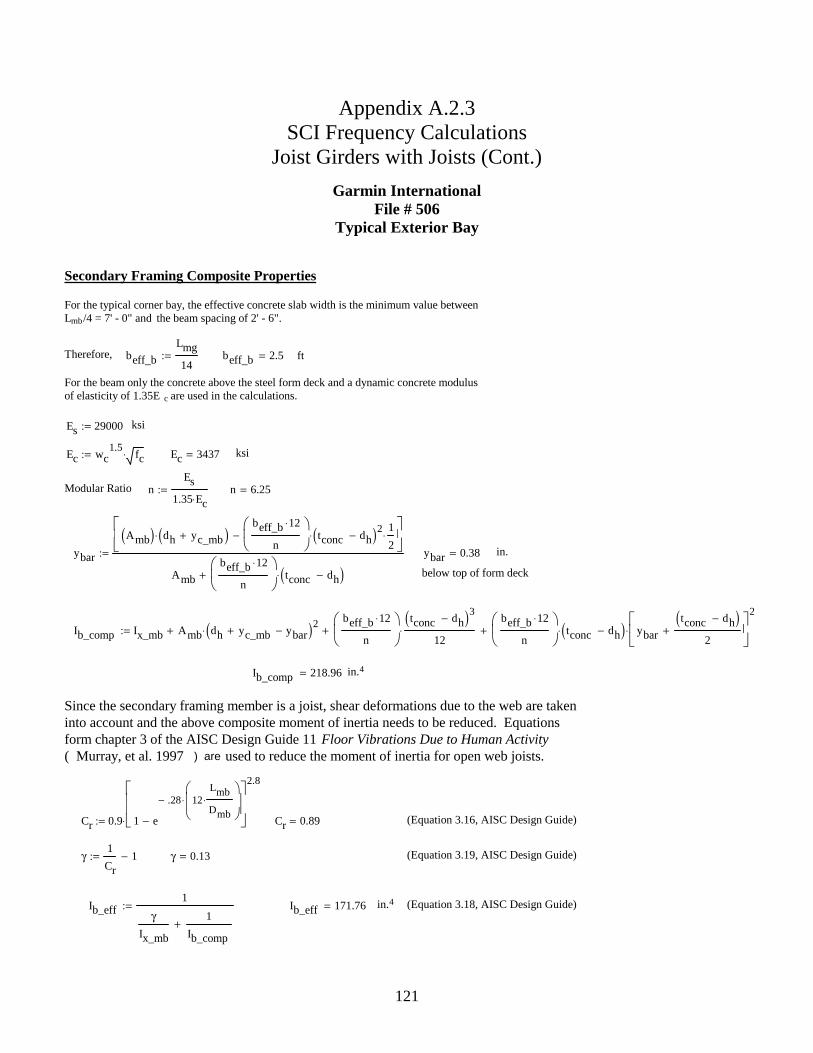
121
Appendix A.2.3 SCI Frequency Calculations
Joist Girders with Joists (Cont.)
Garmin International File # 506
Typical Exterior Bay
(Equation 3.18, AISC Design Guide) in.4Ib_eff 171.76=Ib_eff1
γIx_mb
1
Ib_comp+
:=
(Equation 3.19, AISC Design Guide) γ 0.13=γ1
Cr1−:=
(Equation 3.16, AISC Design Guide) Cr 0.89=Cr 0.9 1 e
.28− 12Lmb
Dmb⋅
⋅
−
2.8
⋅:=
Since the secondary framing member is a joist, shear deformations due to the web are taken into account and the above composite moment of inertia needs to be reduced. Equations form chapter 3 of the AISC Design Guide 11 Floor Vibrations Due to Human Activity ( Murray, et al. 1997 ) are used to reduce the moment of inertia for open web joists.
in.4Ib_comp 218.96=
Ib_comp Ix_mb Amb dh yc_mb+ ybar−( )2⋅+beff_b 12⋅
n
tconc dh−( )3
12⋅+
beff_b 12⋅
n
tconc dh−( )⋅ ybar
tconc dh−( )2
+
2
⋅+:=
below top of form deck
in.
Secondary Framing Composite Properties
For the typical corner bay, the effective concrete slab width is the minimum value between Lmb/4 = 7' - 0" and the beam spacing of 2' - 6".
Therefore,
beff_b
Lmg
14:= beff_b 2.5= ft
For the beam only the concrete above the steel form deck and a dynamic concrete modulus of elasticity of 1.35E c are used in the calculations.
Es 29000:= ksi
Ec wc1.5
fc⋅:= Ec 3437= ksi
Modular Ratio nEs
1.35 Ec⋅:= n 6.25=
ybar
Amb( ) dh yc_mb+( )⋅beff_b 12⋅
n
tconc dh−( )2⋅1
2⋅−
Amb
beff_b 12⋅
n
tconc dh−( )⋅+
:= ybar 0.38=
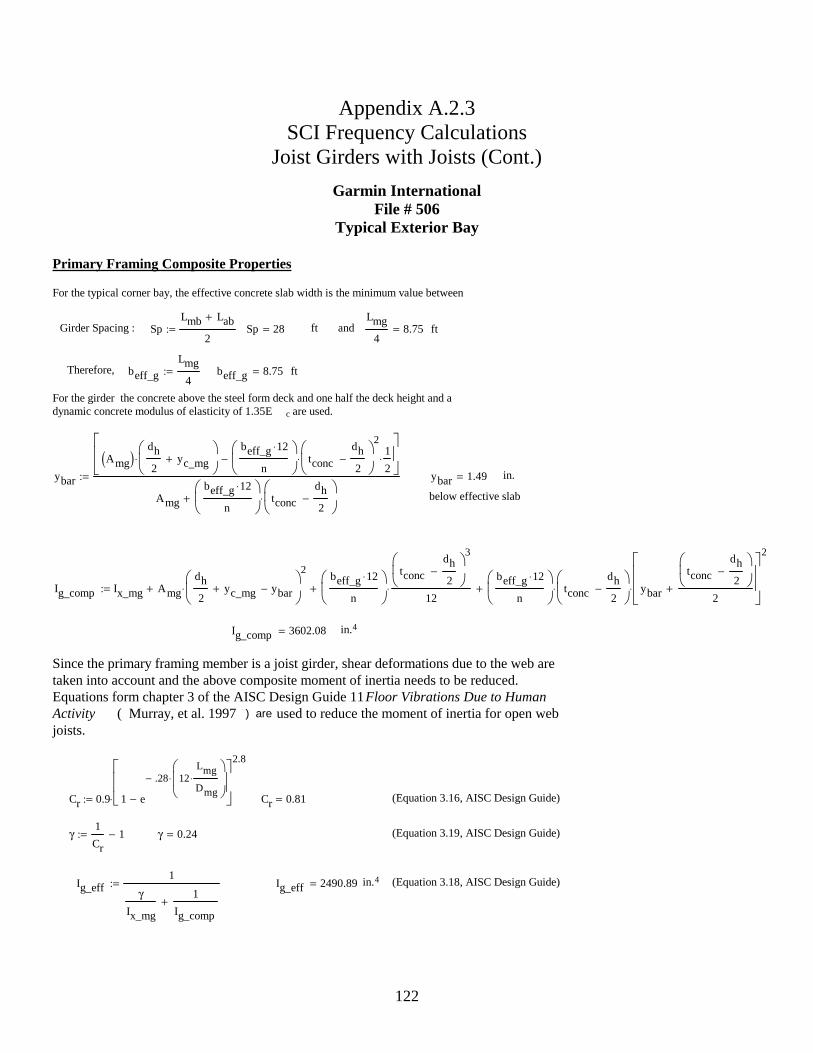
122
Appendix A.2.3 SCI Frequency Calculations
Joist Girders with Joists (Cont.)
Garmin International File # 506
Typical Exterior Bay
(Equation 3.18, AISC Design Guide) in.4Ig_eff 2490.89=Ig_eff1
γIx_mg
1
Ig_comp+
:=
(Equation 3.19, AISC Design Guide) γ 0.24=γ1
Cr1−:=
(Equation 3.16, AISC Design Guide) Cr 0.81=Cr 0.9 1 e
.28− 12Lmg
Dmg⋅
⋅
−
2.8
⋅:=
Since the primary framing member is a joist girder, shear deformations due to the web are taken into account and the above composite moment of inertia needs to be reduced. Equations form chapter 3 of the AISC Design Guide 11 Floor Vibrations Due to Human Activity ( Murray, et al. 1997 ) are used to reduce the moment of inertia for open web joists.
in.4Ig_comp 3602.08=
Ig_comp Ix_mg Amg
dh
2yc_mg+ ybar−
2
⋅+beff_g 12⋅
n
tconc
dh
2−
3
12⋅+
beff_g 12⋅
n
tconc
dh
2−
⋅ ybar
tconc
dh
2−
2+
2
⋅+:=
below effective slab
in.ybar 1.49=ybar
Amg( )dh
2yc_mg+
⋅beff_g 12⋅
n
tconc
dh
2−
2
⋅1
2⋅−
Amg
beff_g 12⋅
n
tconc
dh
2−
⋅+
:=
For the girder the concrete above the steel form deck and one half the deck height and a dynamic concrete modulus of elasticity of 1.35E c are used.
ftbeff_g 8.75=beff_g
Lmg
4:=Therefore,
ftLmg
48.75=ft and Sp 28=Sp
Lmb Lab+
2:=Girder Spacing :
For the typical corner bay, the effective concrete slab width is the minimum value between
Primary Framing Composite Properties
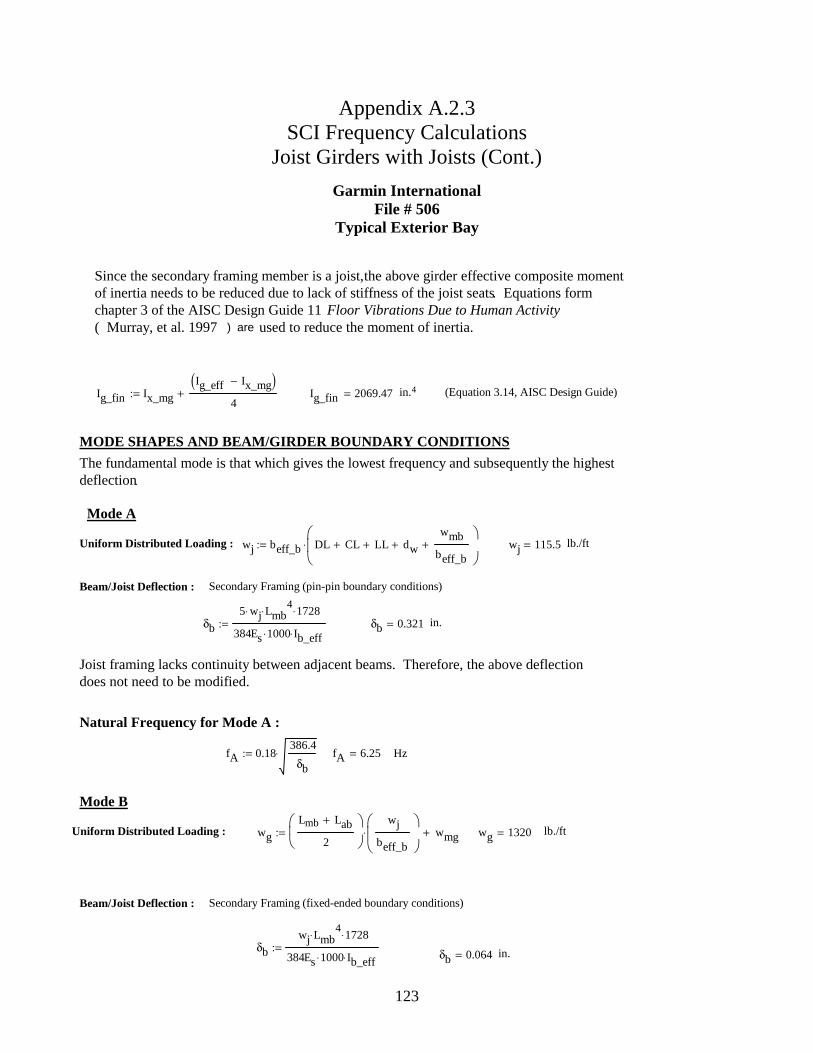
123
Appendix A.2.3 SCI Frequency Calculations
Joist Girders with Joists (Cont.)
Garmin International File # 506
Typical Exterior Bay
in.δb 0.064=δb
wj Lmb4⋅ 1728⋅
384Es 1000⋅ Ib_eff⋅:=
Secondary Framing (fixed-ended boundary conditions)Beam/Joist Deflection :
lb./ftwg 1320=wg
Lmb Lab+
2
wj
beff_b
⋅ wmg+:=Uniform Distributed Loading :
Mode B
HzfA 6.25=fA 0.18386.4
δb⋅:=
Natural Frequency for Mode A :
Joist framing lacks continuity between adjacent beams. Therefore, the above deflection does not need to be modified.
in.δb 0.321=δb
5 wj⋅ Lmb4⋅ 1728⋅
384Es 1000⋅ Ib_eff⋅:=
Secondary Framing (pin-pin boundary conditions)Beam/Joist Deflection :
lb./ftwj 115.5=wj beff_b DL CL+ LL+ dw+wmb
beff_b+
⋅:=Uniform Distributed Loading :
Mode A
The fundamental mode is that which gives the lowest frequency and subsequently the highest deflection.
MODE SHAPES AND BEAM/GIRDER BOUNDARY CONDITIONS
(Equation 3.14, AISC Design Guide) in.4Ig_fin 2069.47=Ig_fin Ix_mg
Ig_eff Ix_mg−( )4
+:=
Since the secondary framing member is a joist, the above girder effective composite moment of inertia needs to be reduced due to lack of stiffness of the joist seats. Equations form chapter 3 of the AISC Design Guide 11 Floor Vibrations Due to Human Activity ( Murray, et al. 1997 ) are used to reduce the moment of inertia.
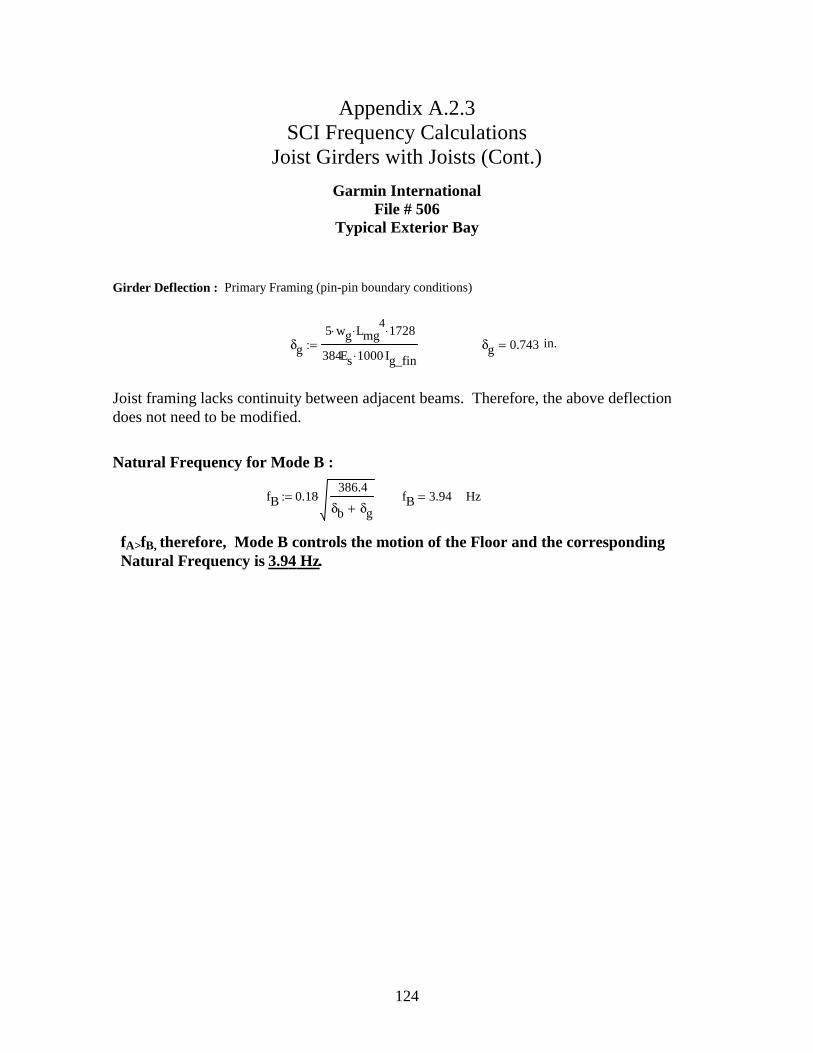
124
Appendix A.2.3 SCI Frequency Calculations
Joist Girders with Joists (Cont.)
Garmin International File # 506
Typical Exterior Bay
Girder Deflection : Primary Framing (pin-pin boundary conditions)
δg
5 wg⋅ Lmg4⋅ 1728⋅
384Es 1000⋅ Ig_fin⋅:= δg 0.743= in.
Joist framing lacks continuity between adjacent beams. Therefore, the above deflection does not need to be modified.
Natural Frequency for Mode B :
fB 0.18386.4
δb δg+⋅:= fB 3.94= Hz
fA>fB, therefore, Mode B controls the motion of the Floor and the corresponding Natural Frequency is 3.94 Hz.
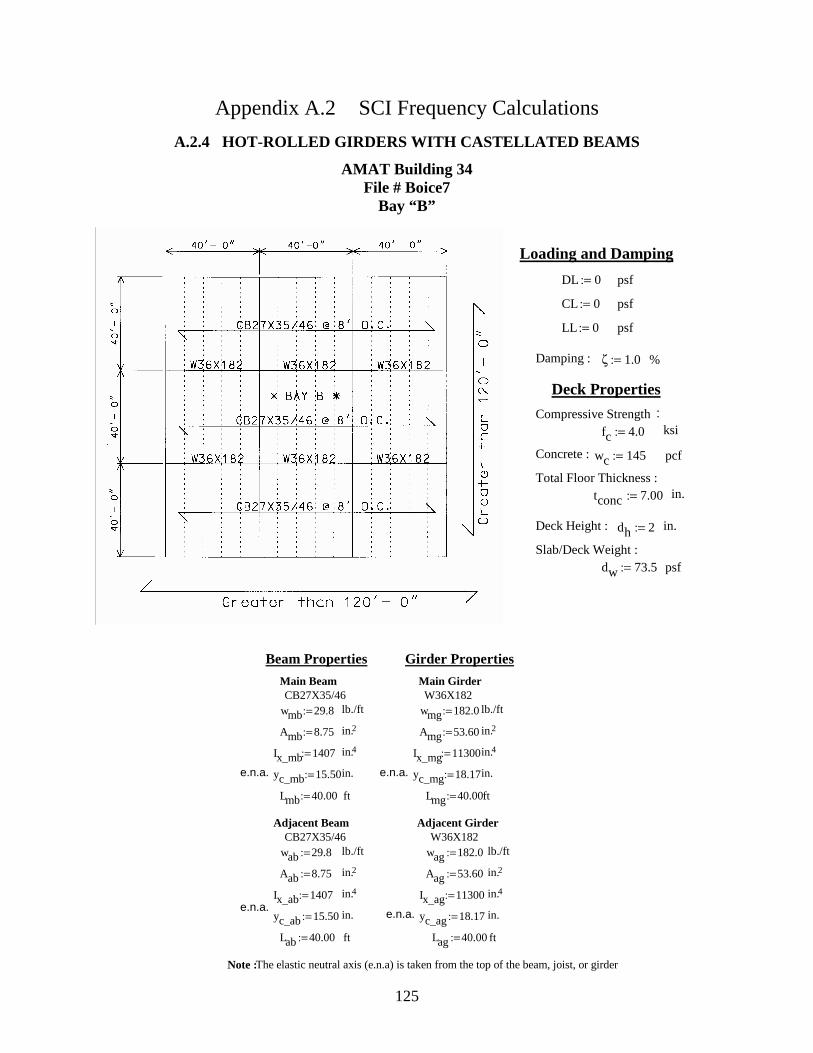
125
Appendix A.2 SCI Frequency Calculations
A.2.4 HOT-ROLLED GIRDERS WITH CASTELLATED BEAMS
AMAT Building 34 File # Boice7
Bay “B”
psfdw 73.5:=Slab/Deck Weight :
in.dh 2:=Deck Height :
in.tconc 7.00:=Total Floor Thickness :
pcfwc 145:=Concrete :
ksi fc 4.0:=Compressive Strength :
Deck Properties
%ζ 1.0:=Damping :
psfLL 0:=
psfCL 0:=
psfDL 0:=
Loading and Damping
Adjacent Beam Adjacent Girder CB27X35/46 W36X182
wab 29.8:= lb./ft wag 182.0:= lb./ft
Aab 8.75:= in.2 Aag 53.60:= in.2
Ix_ab 1407:= in.4 Ix_ag 11300:= in.4
e.n.a.yc_ab 15.50:= in. e.n.a. yc_ag 18.17:= in.
Lab 40.00:= ft Lag 40.00:= ft
Note : The elastic neutral axis (e.n.a) is taken from the top of the beam, joist, or girder
Beam Properties Girder Properties
Main Beam Main GirderCB27X35/46 W36X182
wmb 29.8:= lb./ft wmg 182.0:= lb./ft
Amb 8.75:= in.2 Amg 53.60:= in.2
Ix_mb 1407:= in.4 Ix_mg 11300:= in.4
e.n.a. yc_mb 15.50:= in. e.n.a. yc_mg 18.17:= in.
Lmb 40.00:= ft Lmg 40.00:= ft
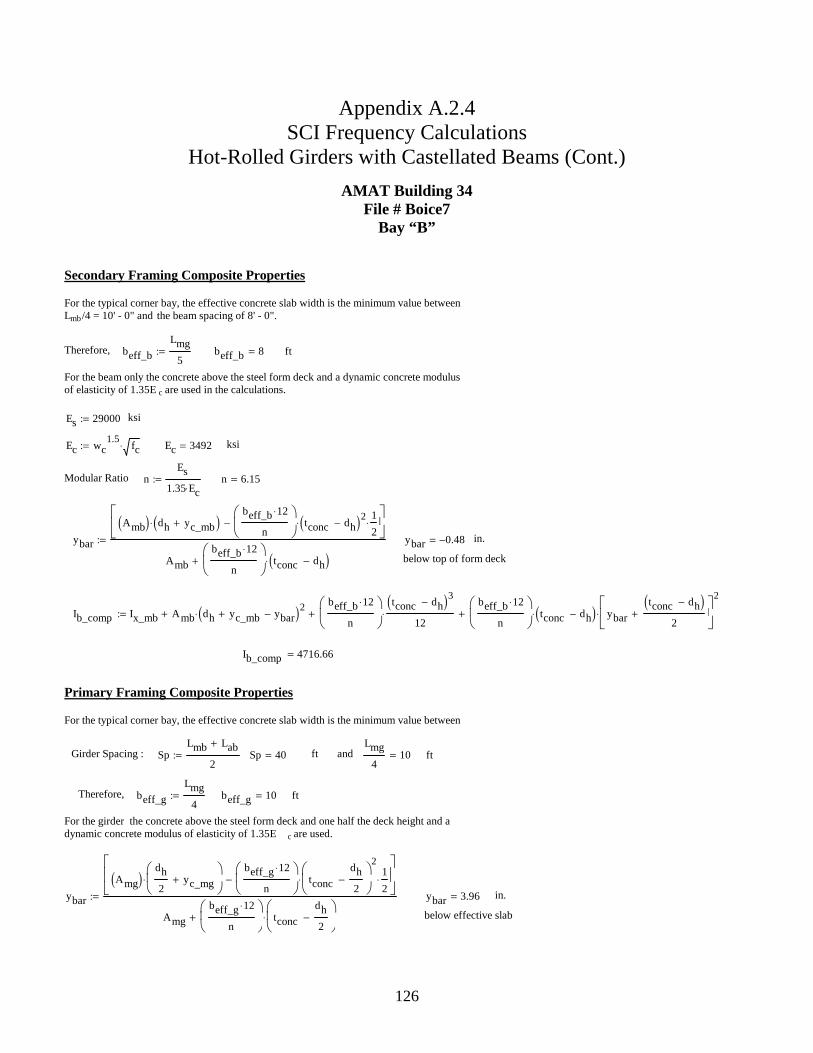
126
Appendix A.2.4 SCI Frequency Calculations
Hot-Rolled Girders with Castellated Beams (Cont.)
AMAT Building 34 File # Boice7
Bay “B”
Ib_comp Ix_mb Amb dh yc_mb+ ybar−( )2⋅+beff_b 12⋅
n
tconc dh−( )3
12⋅+
beff_b 12⋅
n
tconc dh−( )⋅ ybar
tconc dh−( )2
+
2
⋅+:=
Ib_comp 4716.66=
Primary Framing Composite Properties
For the typical corner bay, the effective concrete slab width is the minimum value between
Girder Spacing : SpLmb Lab+
2:= Sp 40= ft and
Lmg
410= ft
Therefore,
beff_g
Lmg
4:= beff_g 10= ft
For the girder the concrete above the steel form deck and one half the deck height and a dynamic concrete modulus of elasticity of 1.35E c are used.
ybar
Amg( )dh
2yc_mg+
⋅beff_g 12⋅
n
tconc
dh
2−
2
⋅1
2⋅−
Amg
beff_g 12⋅
n
tconc
dh
2−
⋅+
:= ybar 3.96= in.
below effective slab
Secondary Framing Composite Properties
For the typical corner bay, the effective concrete slab width is the minimum value between Lmb/4 = 10' - 0" and the beam spacing of 8' - 0".
Therefore,
beff_b
Lmg
5:= beff_b 8= ft
For the beam only the concrete above the steel form deck and a dynamic concrete modulus of elasticity of 1.35E c are used in the calculations.
Es 29000:= ksi
Ec wc1.5
fc⋅:= Ec 3492= ksi
Modular Ratio nEs
1.35 Ec⋅:= n 6.15=
ybar
Amb( ) dh yc_mb+( )⋅beff_b 12⋅
n
tconc dh−( )2⋅1
2⋅−
Amb
beff_b 12⋅
n
tconc dh−( )⋅+
:= ybar 0.48−= in.
below top of form deck
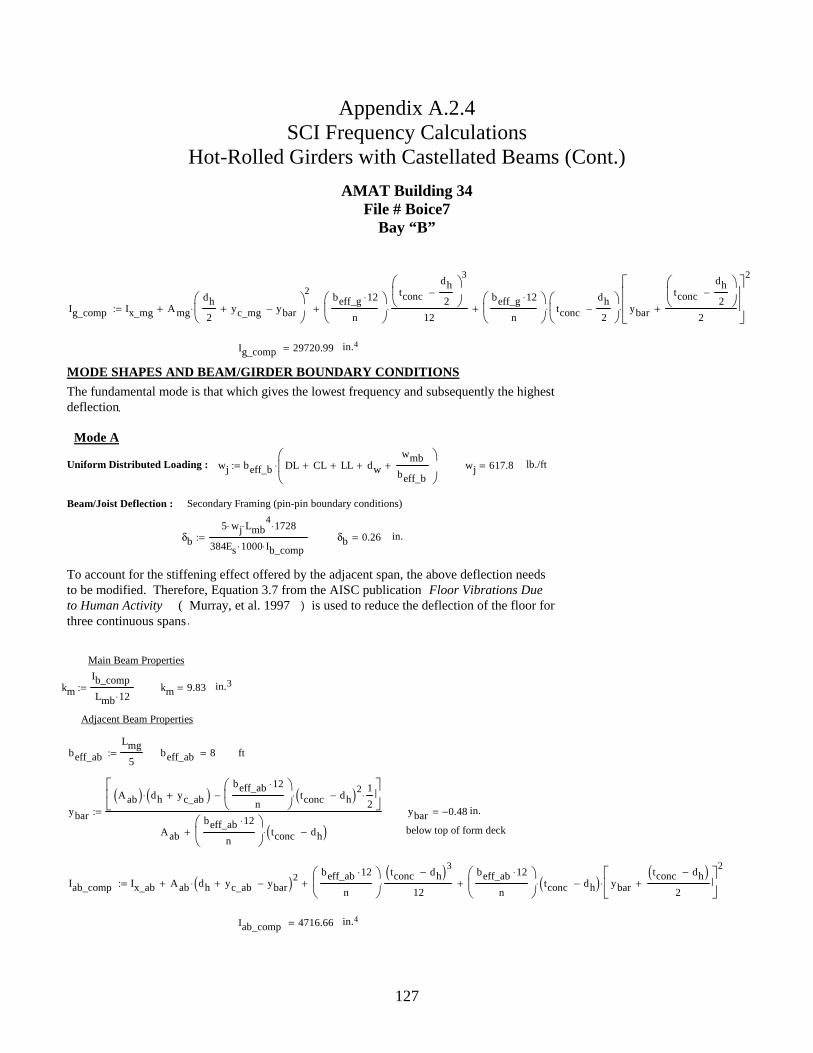
127
Appendix A.2.4 SCI Frequency Calculations
Hot-Rolled Girders with Castellated Beams (Cont.)
AMAT Building 34 File # Boice7
Bay “B”
in.4Iab_comp 4716.66=
Iab_comp Ix_ab Aab dh yc_ab+ ybar−( )2⋅+beff_ab 12⋅
n
tconc dh−( )3
12⋅+
beff_ab 12⋅
n
tconc dh−( )⋅ ybar
tconc dh−( )2
+
2
⋅+:=
below top of form deck
in.ybar 0.48−=ybar
Aab( ) dh yc_ab+( )⋅beff_ab 12⋅
n
tconc dh−( )2⋅1
2⋅−
Aab
beff_ab 12⋅
n
tconc dh−( )⋅+
:=
ftbeff_ab 8=beff_ab
Lmg
5:=
Adjacent Beam Properties
in.3km 9.83=km
Ib_comp
Lmb 12⋅:=
Main Beam Properties
To account for the stiffening effect offered by the adjacent span, the above deflection needs to be modified. Therefore, Equation 3.7 from the AISC publication Floor Vibrations Due to Human Activity ( Murray, et al. 1997 ) is used to reduce the deflection of the floor for three continuous spans .
in.δb 0.26=δb
5 wj⋅ Lmb4⋅ 1728⋅
384Es 1000⋅ Ib_comp⋅:=
Secondary Framing (pin-pin boundary conditions)Beam/Joist Deflection :
lb./ftwj 617.8=wj beff_b DL CL+ LL+ dw+wmb
beff_b+
⋅:=Uniform Distributed Loading :
Mode A
The fundamental mode is that which gives the lowest frequency and subsequently the highest deflection.
MODE SHAPES AND BEAM/GIRDER BOUNDARY CONDITIONS
in.4Ig_comp 29720.99=
Ig_comp Ix_mg Amg
dh
2yc_mg+ ybar−
2
⋅+beff_g 12⋅
n
tconc
dh
2−
3
12⋅+
beff_g 12⋅
n
tconc
dh
2−
⋅ ybar
tconc
dh
2−
2+
2
⋅+:=
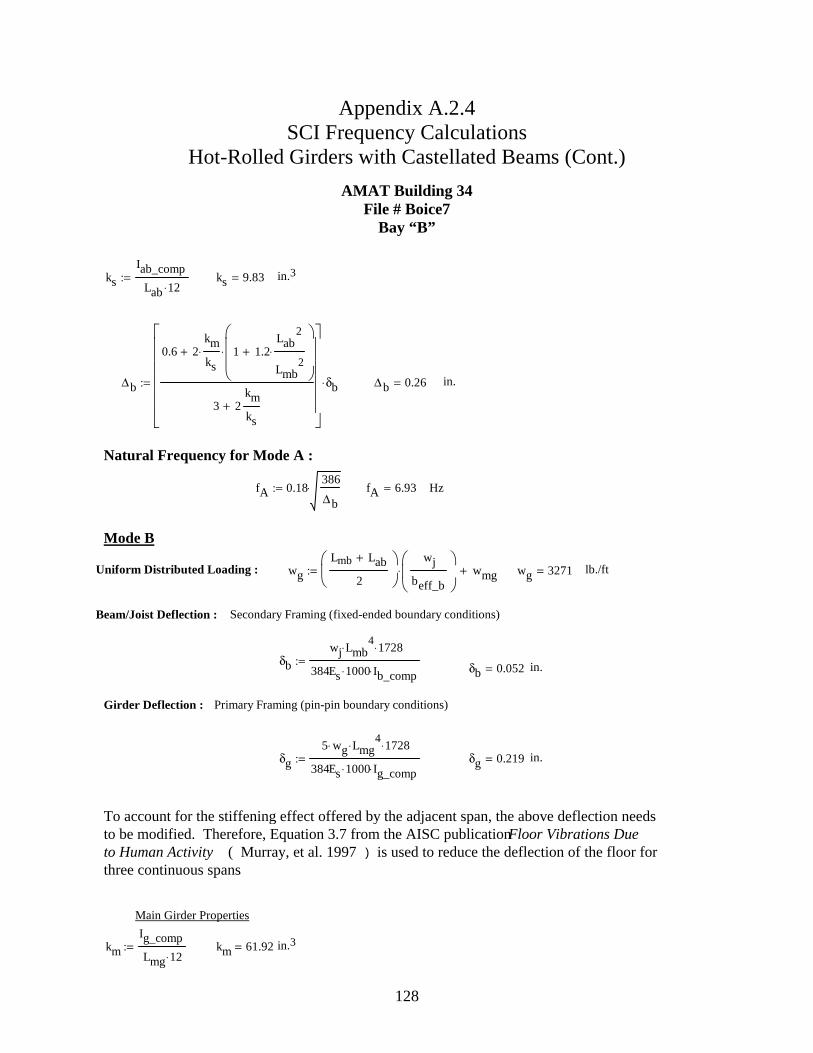
128
Appendix A.2.4 SCI Frequency Calculations
Hot-Rolled Girders with Castellated Beams (Cont.)
AMAT Building 34 File # Boice7
Bay “B”
in.3km 61.92=km
Ig_comp
Lmg 12⋅:=
Main Girder Properties
To account for the stiffening effect offered by the adjacent span, the above deflection needs to be modified. Therefore, Equation 3.7 from the AISC publication Floor Vibrations Due to Human Activity ( Murray, et al. 1997 ) is used to reduce the deflection of the floor for three continuous spans.
in.δg 0.219=δg
5 wg⋅ Lmg4⋅ 1728⋅
384Es 1000⋅ Ig_comp⋅:=
Primary Framing (pin-pin boundary conditions)Girder Deflection :
in.δb 0.052=δb
wj Lmb4⋅ 1728⋅
384Es 1000⋅ Ib_comp⋅:=
Secondary Framing (fixed-ended boundary conditions)Beam/Joist Deflection :
lb./ftwg 3271=wg
Lmb Lab+
2
wj
beff_b
⋅ wmg+:=Uniform Distributed Loading :
Mode B
HzfA 6.93=fA 0.18386
∆b⋅:=
Natural Frequency for Mode A :
in.∆b 0.26=∆b
0.6 2km
ks⋅ 1 1.2
Lab2
Lmb2
⋅+
⋅+
3 2km
ks+
δb⋅:=
in.3ks 9.83=ks
Iab_comp
Lab 12⋅:=
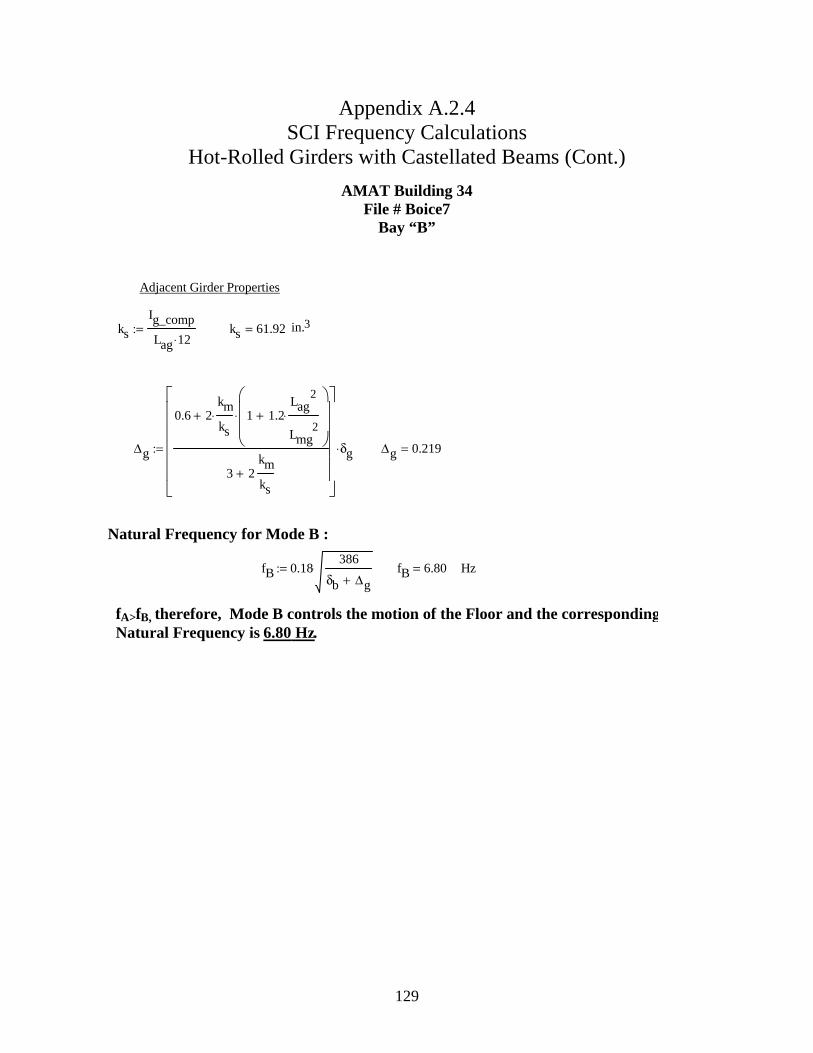
129
Appendix A.2.4 SCI Frequency Calculations
Hot-Rolled Girders with Castellated Beams (Cont.)
AMAT Building 34 File # Boice7
Bay “B”
Adjacent Girder Properties
ks
Ig_comp
Lag 12⋅:= ks 61.92= in.3
∆g
0.6 2km
ks⋅ 1 1.2
Lag2
Lmg2
⋅+
⋅+
3 2km
ks+
δg⋅:= ∆g 0.219=
Natural Frequency for Mode B :
fB 0.18386
δb ∆g+⋅:= fB 6.80= Hz
fA>fB, therefore, Mode B controls the motion of the Floor and the corresponding Natural Frequency is 6.80 Hz.
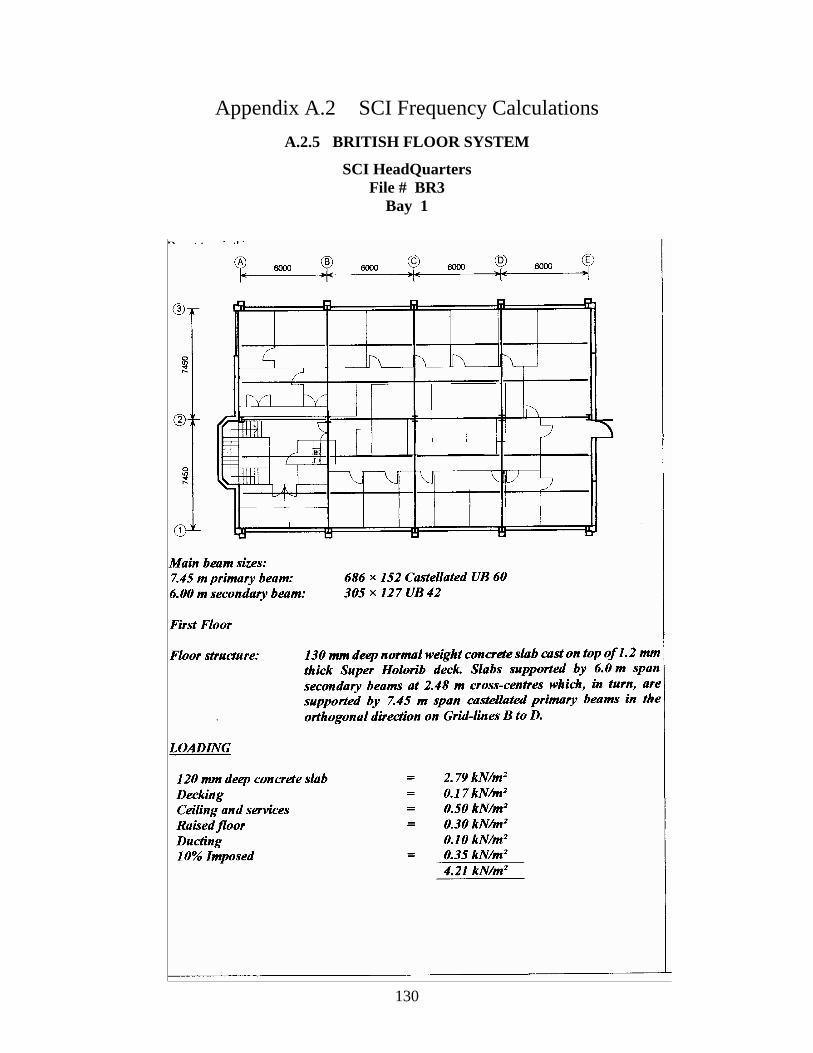
130
Appendix A.2 SCI Frequency Calculations
A.2.5 BRITISH FLOOR SYSTEM
SCI HeadQuarters File # BR3
Bay 1
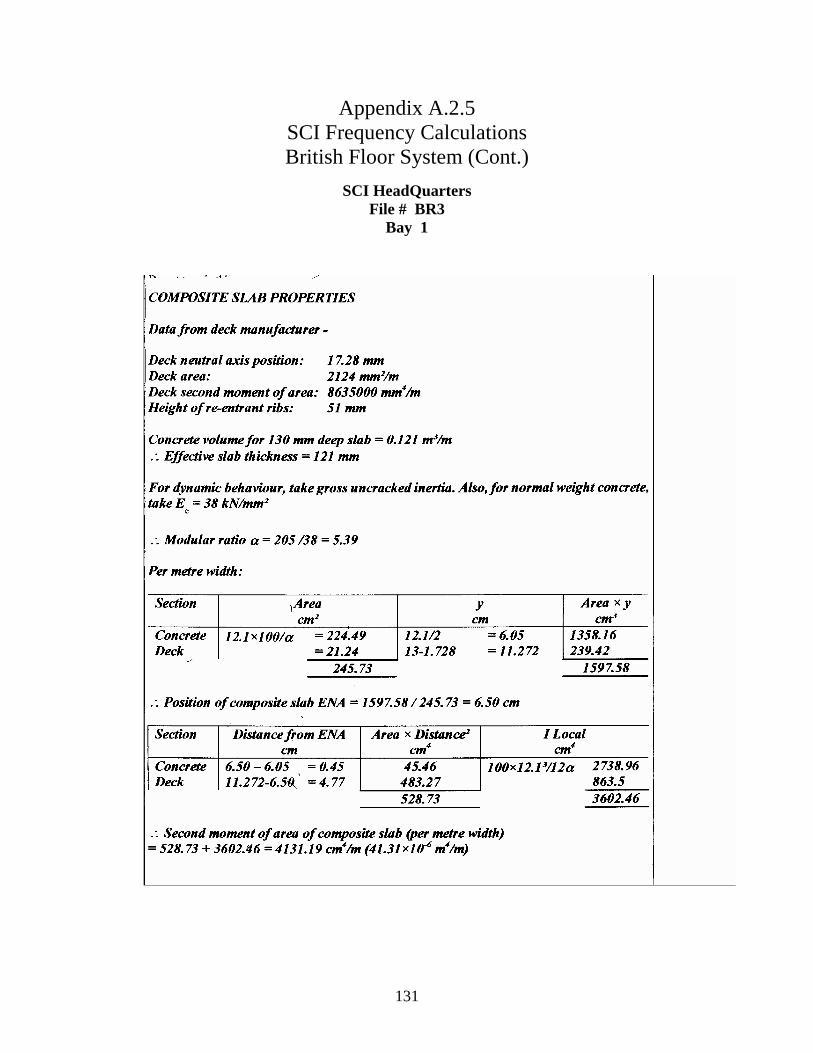
131
Appendix A.2.5 SCI Frequency Calculations British Floor System (Cont.)
SCI HeadQuarters File # BR3
Bay 1
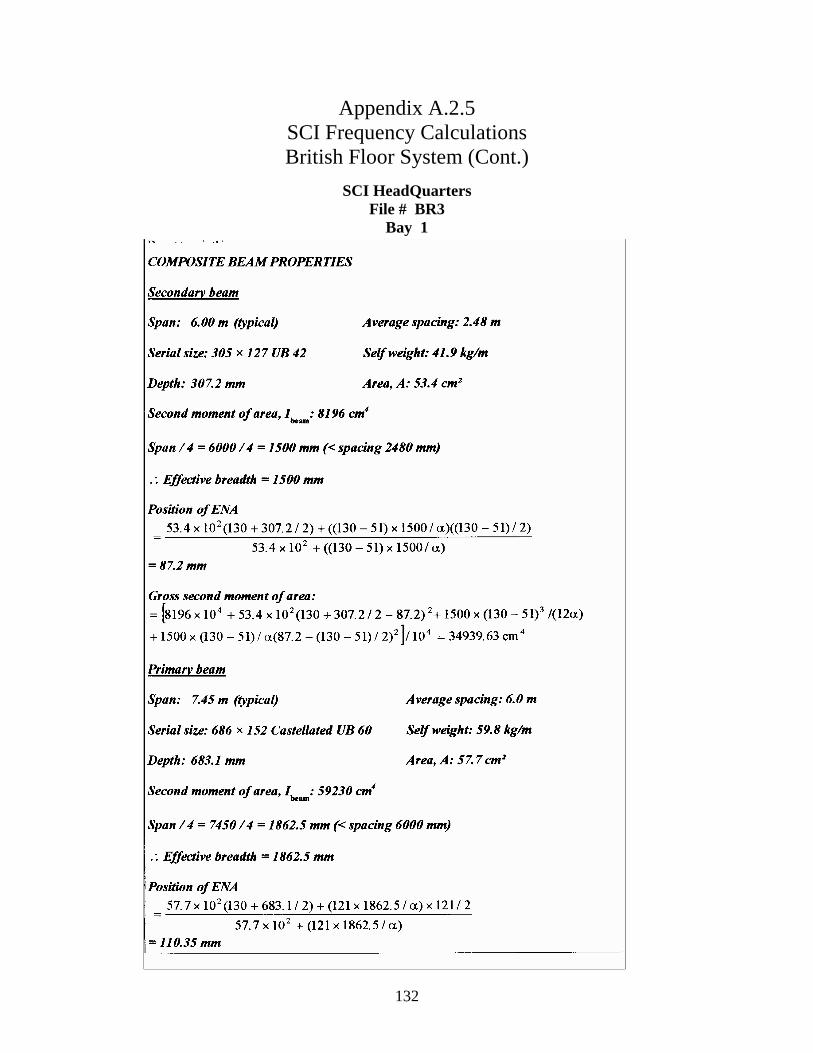
132
Appendix A.2.5 SCI Frequency Calculations British Floor System (Cont.)
SCI HeadQuarters File # BR3
Bay 1
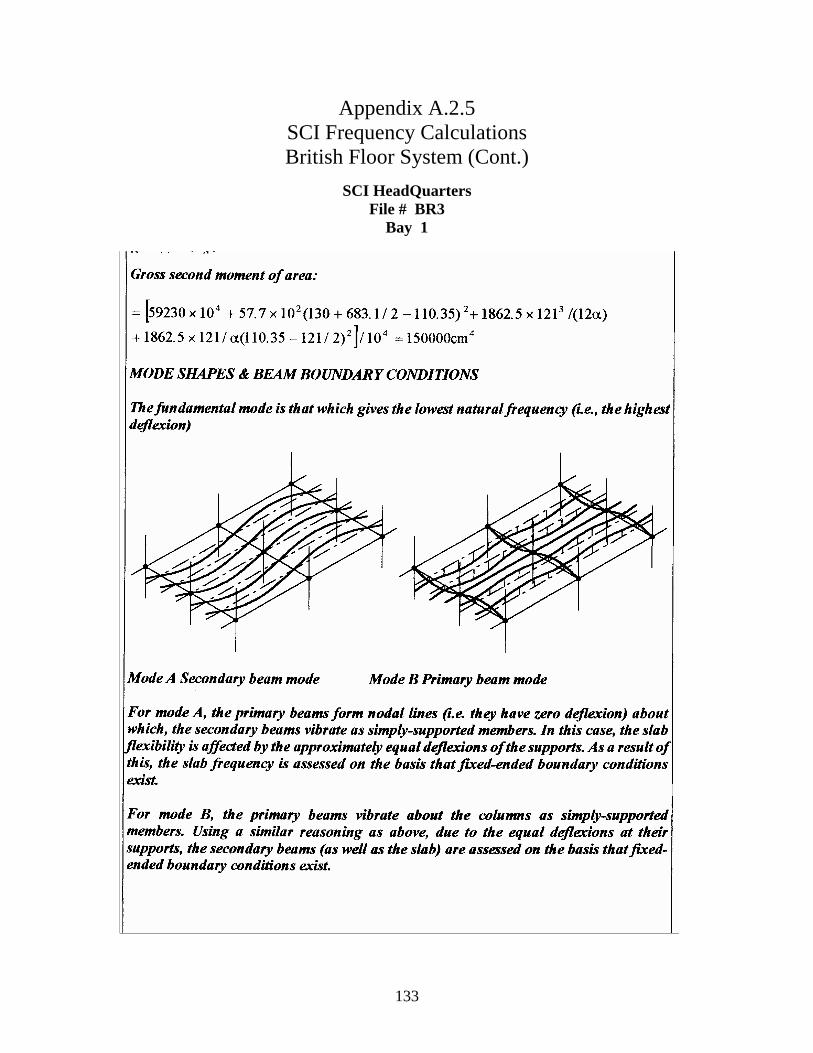
133
Appendix A.2.5 SCI Frequency Calculations British Floor System (Cont.)
SCI HeadQuarters File # BR3
Bay 1
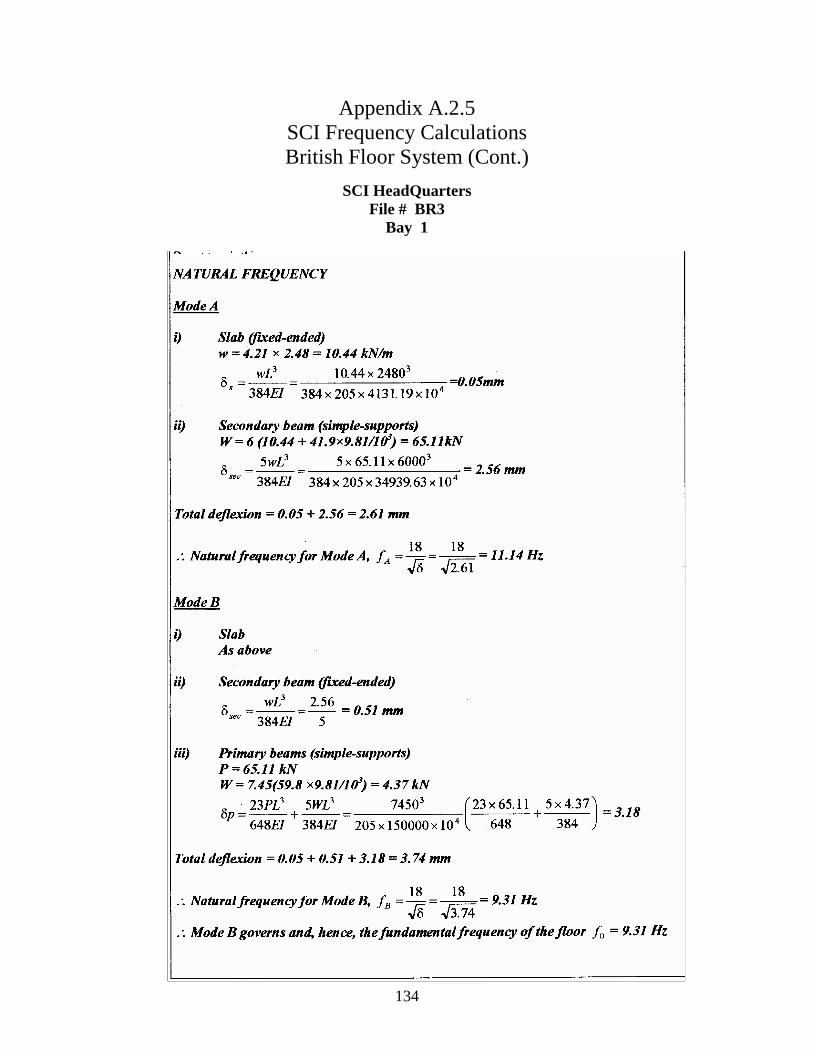
134
Appendix A.2.5 SCI Frequency Calculations British Floor System (Cont.)
SCI HeadQuarters File # BR3
Bay 1
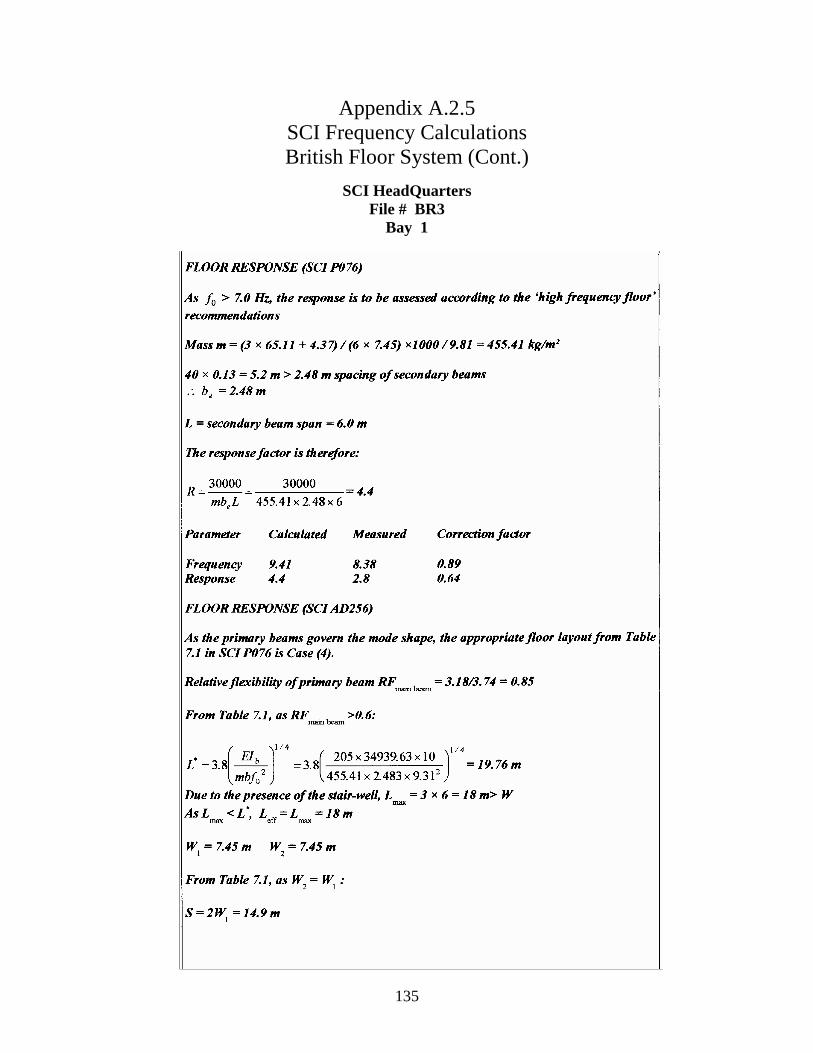
135
Appendix A.2.5 SCI Frequency Calculations British Floor System (Cont.)
SCI HeadQuarters File # BR3
Bay 1
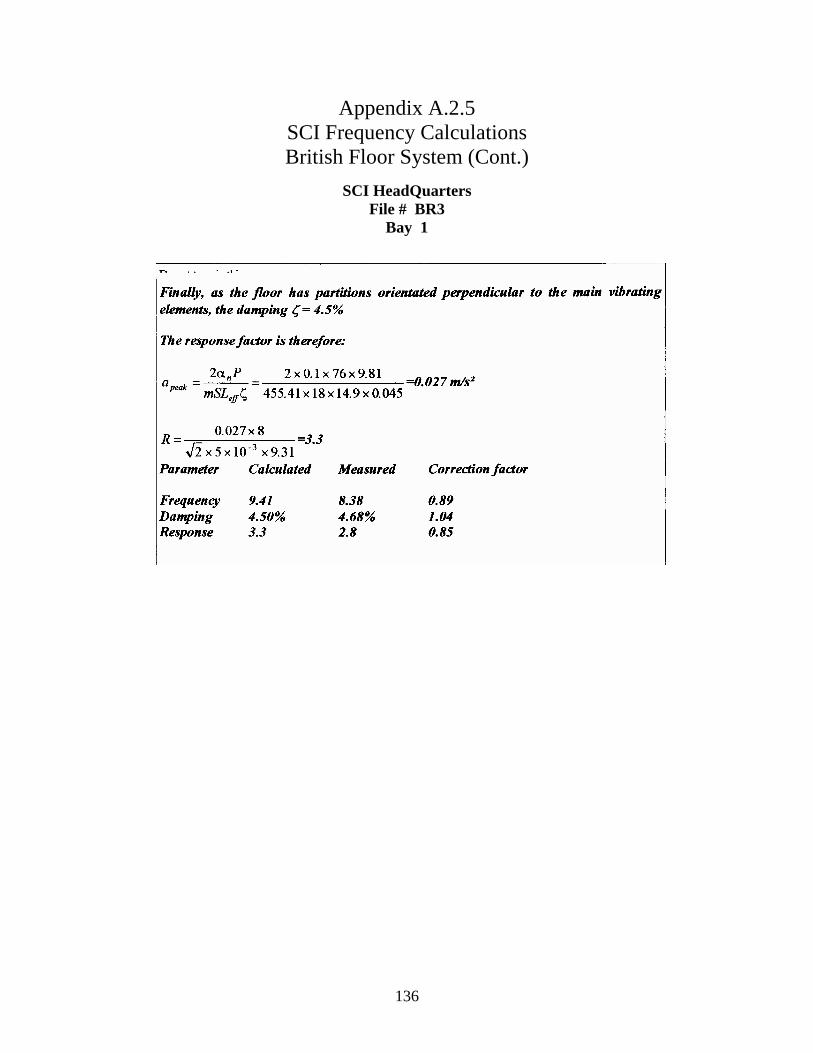
136
Appendix A.2.5 SCI Frequency Calculations British Floor System (Cont.)
SCI HeadQuarters File # BR3
Bay 1
137
APPENDIX A.3 SCI ACCELERATION CALCULATIONS
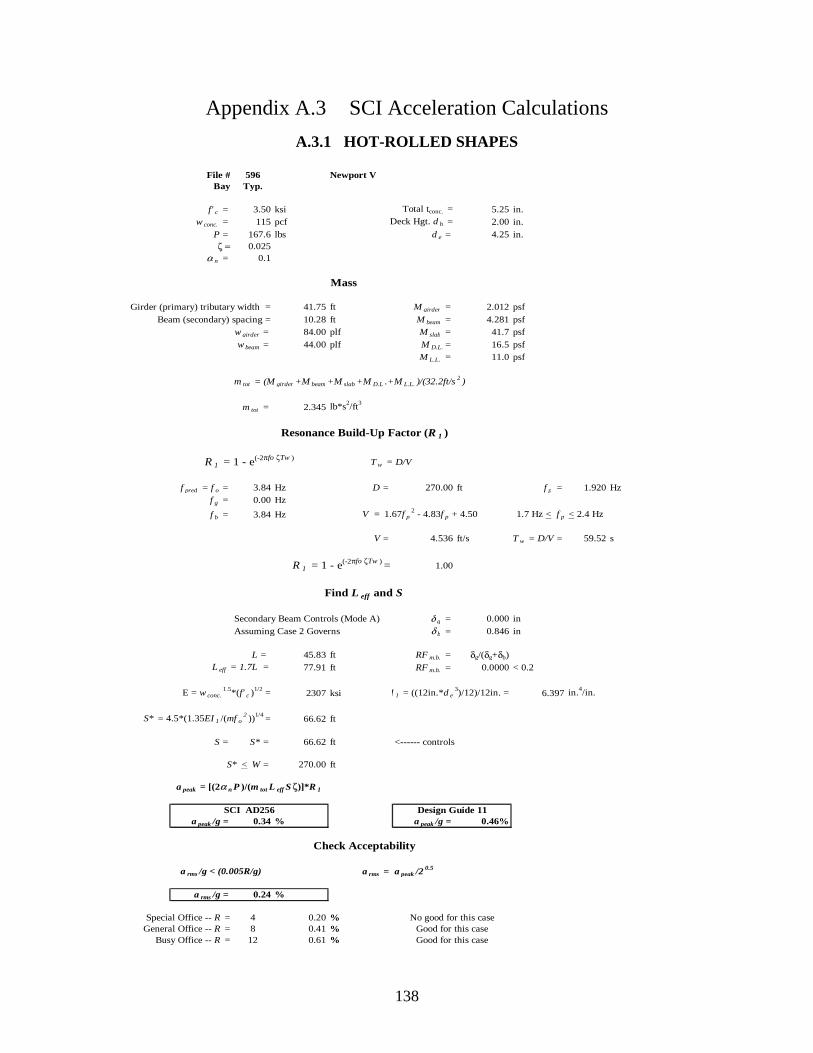
138
Appendix A.3 SCI Acceleration Calculations
A.3.1 HOT-ROLLED SHAPES
File # 596 Newport VBay Typ.
f' c = 3.50 ksi 5.25 in.w conc. = 115 pcf 2.00 in.
P = 167.6 lbs d e = 4.25 in.ζ = 0.025
α n = 0.1
41.75 ft M girder = 2.012 psf10.28 ft M beam = 4.281 psf
w girder = 84.00 plf M slab = 41.7 psfw beam = 44.00 plf M D.L. = 16.5 psf
M L.L. = 11.0 psf
m tot = (M girder +M beam +M slab +M D.L .+M L.L. )/(32.2ft/s 2 )
m tot = 2.345 lb*s2/ft3
f pred = f o = 3.84 Hz D = 270.00 ft f p = 1.920 Hzf g = 0.00 Hz
f b = 3.84 Hz
V = 4.536 ft/s T w = D/V = 59.52 s
1.00
Secondary Beam Controls (Mode A) δ g = 0.000 inAssuming Case 2 Governs δ b = 0.846 in
L = 45.83 ft RF m.b. = δg/(δg+δb) 77.91 ft RF m.b. = 0.0000 < 0.2
2307 ksi 6.397 in.4/in.
66.62 ft
S = S* = 66.62 ft
270.00 ft
a peak /g = 0.34 % a peak /g = 0.46%
a rms = a peak /2 0.5
a rms /g = 0.24 %
4 0.20 %8 0.41 %
12 0.61 %
Resonance Build-Up Factor (R 1 )
1.7 Hz < f p < 2.4 Hz
Girder (primary) tributary width =
Total tconc. =Deck Hgt. d h =
Mass
V = 1.67f p2 - 4.83f p + 4.50
S* < W =
a rms /g < (0.005R/g)
a peak = [(2α n P )/(m tot L eff S ζ)]*R 1
<------ controls
S* = 4.5*(1.35EI 1 /(mf o2 ))1/4 =
R 1 = 1 - e(-2πfo ζTw ) T w = D/V
L eff = 1.7L =
E = w conc.1.5*(f' c )1/2 =
R 1 = 1 - e(-2πfo ζTw ) =
Find L eff and S
I 1 = ((12in.*d e3)/12)/12in. =
Special Office -- R =
Beam (secondary) spacing =
Good for this caseGood for this case
Design Guide 11
General Office -- R =Busy Office -- R =
No good for this case
Check Acceptability
SCI AD256
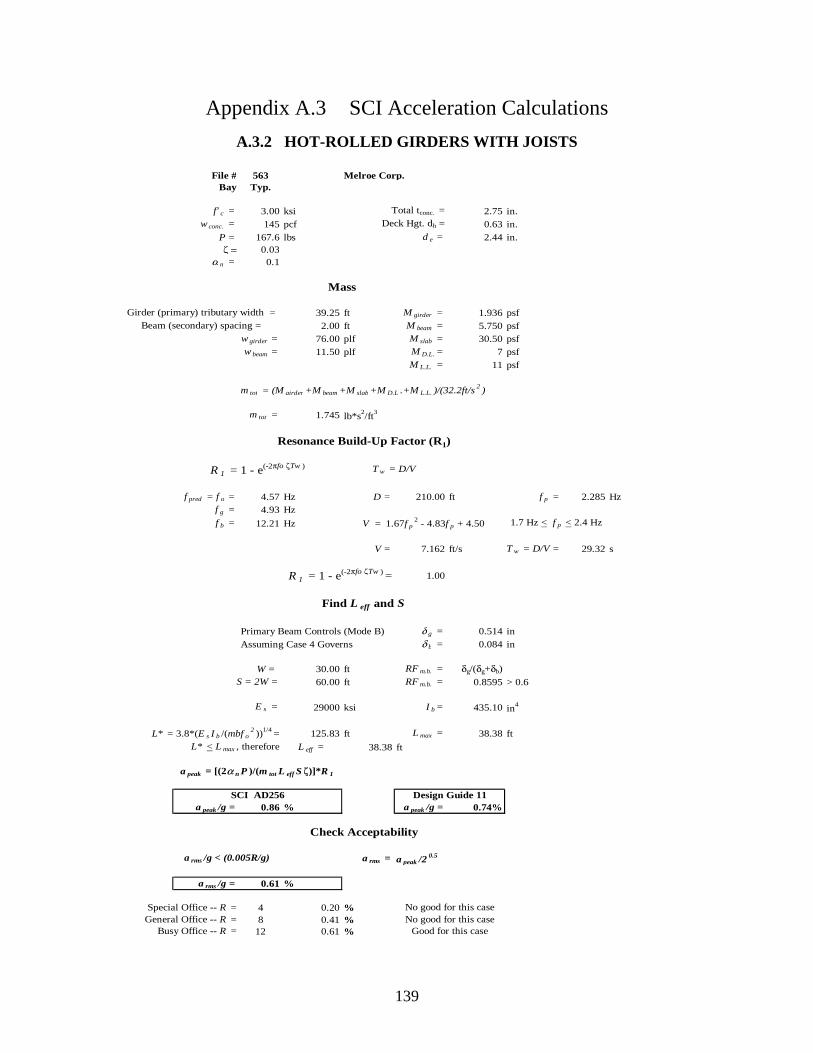
139
Appendix A.3 SCI Acceleration Calculations
A.3.2 HOT-ROLLED GIRDERS WITH JOISTS
File # 563 Melroe Corp.Bay Typ.
f' c = 3.00 ksi 2.75 in.w conc. = 145 pcf 0.63 in.
P = 167.6 lbs d e = 2.44 in.ζ = 0.03
α n = 0.1
39.25 ft M girder = 1.936 psf2.00 ft M beam = 5.750 psf
w girder = 76.00 plf M slab = 30.50 psfw beam = 11.50 plf M D.L. = 7 psf
M L.L. = 11 psf
m tot = (M girder +M beam +M slab +M D.L .+M L.L. )/(32.2ft/s 2 )
m tot = 1.745 lb*s2/ft3
f pred = f o = 4.57 Hz D = 210.00 ft f p = 2.285 Hzf g = 4.93 Hzf b = 12.21 Hz
V = 7.162 ft/s T w = D/V = 29.32 s
1.00
Primary Beam Controls (Mode B) δ g = 0.514 inAssuming Case 4 Governs δ b = 0.084 in
W = 30.00 ft RF m.b. = δg/(δg+δb)
60.00 ft RF m.b. = 0.8595 > 0.6
29000 ksi I b = 435.10 in4
125.83 ft L max = 38.38 ft
L eff = 38.38 ft
a peak /g = 0.86 % a peak /g = 0.74%
a rms = a peak /2 0.5
a rms /g = 0.61 %
4 0.20 %8 0.41 %
12 0.61 %
S = 2W =
Girder (primary) tributary width =Beam (secondary) spacing =
R 1 = 1 - e(-2πfo ζTw ) =
Find L eff and S
Total tconc. =Deck Hgt. dh =
Mass
Resonance Build-Up Factor (R1)
SCI AD256
a rms /g < (0.005R/g)
E s =
L* = 3.8*(E s I b /(mbf o2 ))1/4 =
L* < L max , therefore
V = 1.67f p2 - 4.83f p + 4.50 1.7 Hz < f p < 2.4 Hz
R 1 = 1 - e(-2πfo ζTw ) T w = D/V
No good for this caseGood for this case
General Office -- R =Busy Office -- R =
a peak = [(2α n P )/(m tot L eff S ζ)]*R 1
Special Office -- R =
Design Guide 11
No good for this case
Check Acceptability
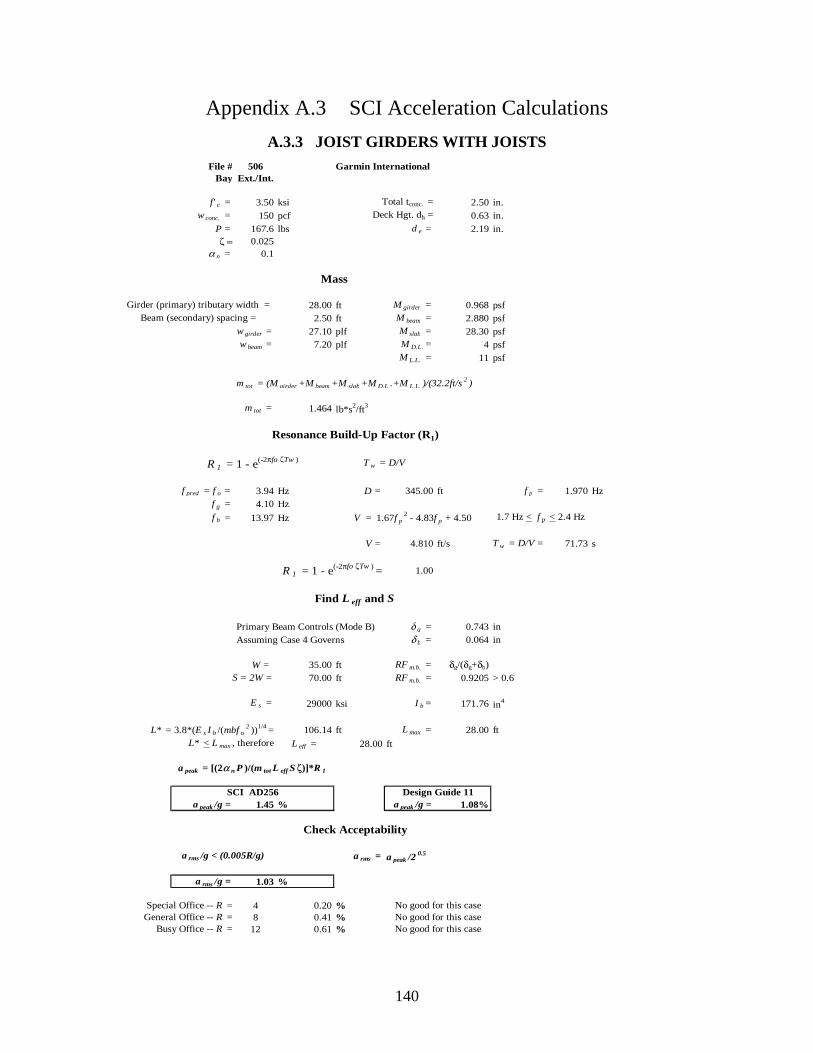
140
Appendix A.3 SCI Acceleration Calculations
A.3.3 JOIST GIRDERS WITH JOISTS File # 506 Garmin International
Bay Ext./Int.
f' c = 3.50 ksi 2.50 in.w conc. = 150 pcf 0.63 in.
P = 167.6 lbs d e = 2.19 in.ζ = 0.025
α n = 0.1
28.00 ft M girder = 0.968 psf2.50 ft M beam = 2.880 psf
w girder = 27.10 plf M slab = 28.30 psfw beam = 7.20 plf M D.L. = 4 psf
M L.L. = 11 psf
m tot = (M girder +M beam +M slab +M D.L .+M L.L. )/(32.2ft/s 2 )
m tot = 1.464 lb*s2/ft3
f pred = f o = 3.94 Hz D = 345.00 ft f p = 1.970 Hzf g = 4.10 Hzf b = 13.97 Hz
V = 4.810 ft/s T w = D/V = 71.73 s
1.00
Primary Beam Controls (Mode B) δ g = 0.743 inAssuming Case 4 Governs δ b = 0.064 in
W = 35.00 ft RF m.b. = δg/(δg+δb)
70.00 ft RF m.b. = 0.9205 > 0.6
29000 ksi I b = 171.76 in4
106.14 ft L max = 28.00 ft
L eff = 28.00 ft
a peak /g = 1.45 % a peak /g = 1.08%
a rms = a peak /2 0.5
a rms /g = 1.03 %
4 0.20 %8 0.41 %
12 0.61 %
S = 2W =
Girder (primary) tributary width =Beam (secondary) spacing =
R 1 = 1 - e(-2πfo ζTw ) =
Find L eff and S
Total tconc. =Deck Hgt. dh =
Mass
Resonance Build-Up Factor (R1)
SCI AD256
a rms /g < (0.005R/g)
E s =
L* = 3.8*(E s I b /(mbf o2 ))1/4 =
L* < L max , therefore
V = 1.67f p2 - 4.83f p + 4.50 1.7 Hz < f p < 2.4 Hz
R 1 = 1 - e(-2πfo ζTw ) T w = D/V
No good for this caseNo good for this case
General Office -- R =Busy Office -- R =
a peak = [(2α n P )/(m tot L eff S ζ)]*R 1
Special Office -- R =
Design Guide 11
No good for this case
Check Acceptability
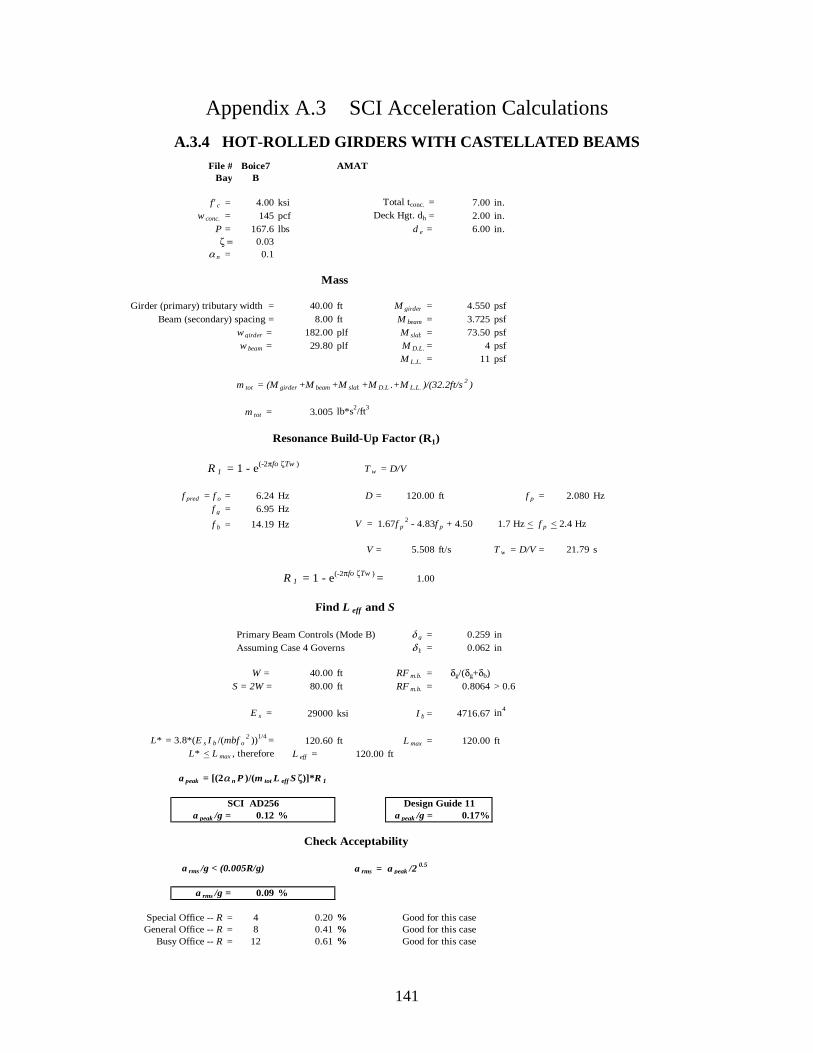
141
Appendix A.3 SCI Acceleration Calculations
A.3.4 HOT-ROLLED GIRDERS WITH CASTELLATED BEAMS File # Boice7 AMAT
Bay B
f' c = 4.00 ksi 7.00 in.w conc. = 145 pcf 2.00 in.
P = 167.6 lbs d e = 6.00 in.ζ = 0.03
α n = 0.1
40.00 ft M girder = 4.550 psf
8.00 ft M beam = 3.725 psfw girder = 182.00 plf M slab = 73.50 psfw beam = 29.80 plf M D.L. = 4 psf
M L.L. = 11 psf
m tot = (M girder +M beam +M slab +M D.L .+M L.L. )/(32.2ft/s 2 )
m tot = 3.005 lb*s2/ft3
f pred = f o = 6.24 Hz D = 120.00 ft f p = 2.080 Hzf g = 6.95 Hz
f b = 14.19 Hz
V = 5.508 ft/s T w = D/V = 21.79 s
1.00
Primary Beam Controls (Mode B) δ g = 0.259 inAssuming Case 4 Governs δ b = 0.062 in
W = 40.00 ft RF m.b. = δg/(δg+δb) 80.00 ft RF m.b. = 0.8064 > 0.6
29000 ksi I b = 4716.67 in4
120.60 ft L max = 120.00 ftL eff = 120.00 ft
a peak /g = 0.12 % a peak /g = 0.17%
a rms = a peak /2 0.5
a rms /g = 0.09 %
4 0.20 %8 0.41 %
12 0.61 %Good for this caseGood for this case
SCI AD256
a rms /g < (0.005R/g)
General Office -- R =Busy Office -- R =
a peak = [(2α n P )/(m tot L eff S ζ)]*R 1
Special Office -- R =
Design Guide 11
Good for this case
Check Acceptability
E s =
L* = 3.8*(E s I b /(mbf o2 ))1/4 =
L* < L max , therefore
Total tconc. =Deck Hgt. dh =
Mass
Resonance Build-Up Factor (R1)
S = 2W =
Girder (primary) tributary width =
Beam (secondary) spacing =
R 1 = 1 - e(-2πfo ζTw ) =
Find L eff and S
V = 1.67f p2 - 4.83f p + 4.50 1.7 Hz < f p < 2.4 Hz
R 1 = 1 - e(-2πfo ζTw )T w = D/V
142
APPENDIX A.4 MURRAY CRITERION CALCULATIONS
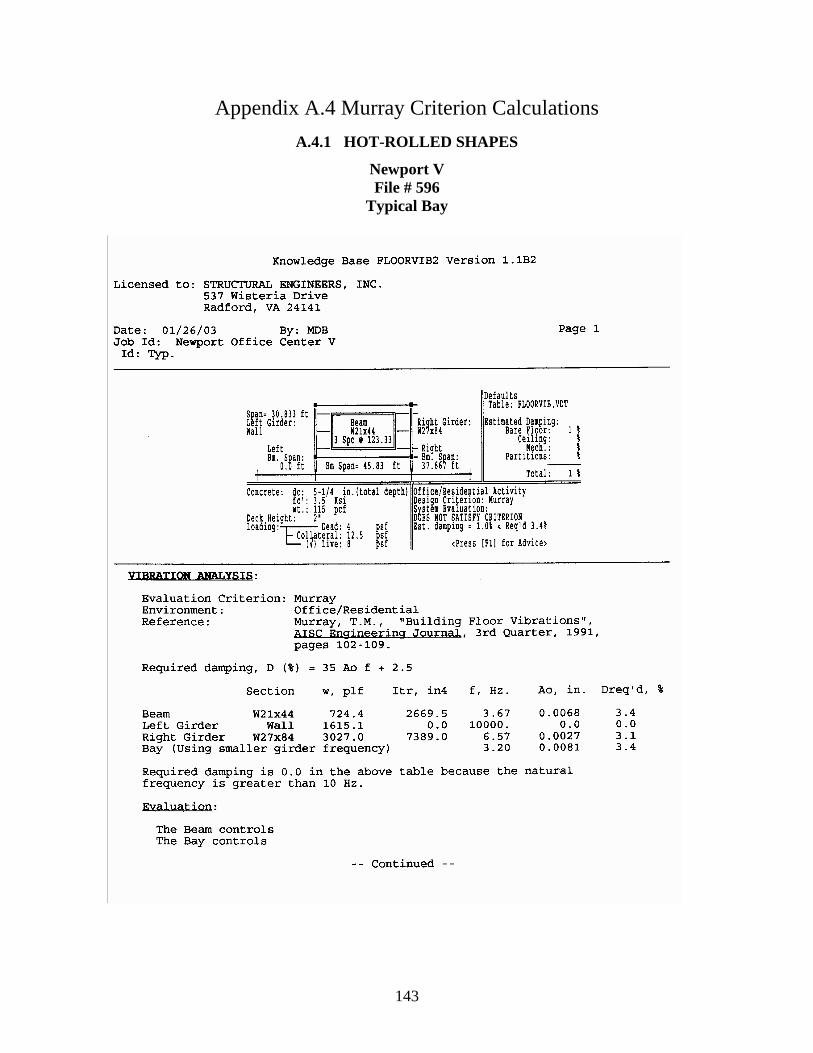
143
Appendix A.4 Murray Criterion Calculations
A.4.1 HOT-ROLLED SHAPES
Newport V File # 596
Typical Bay
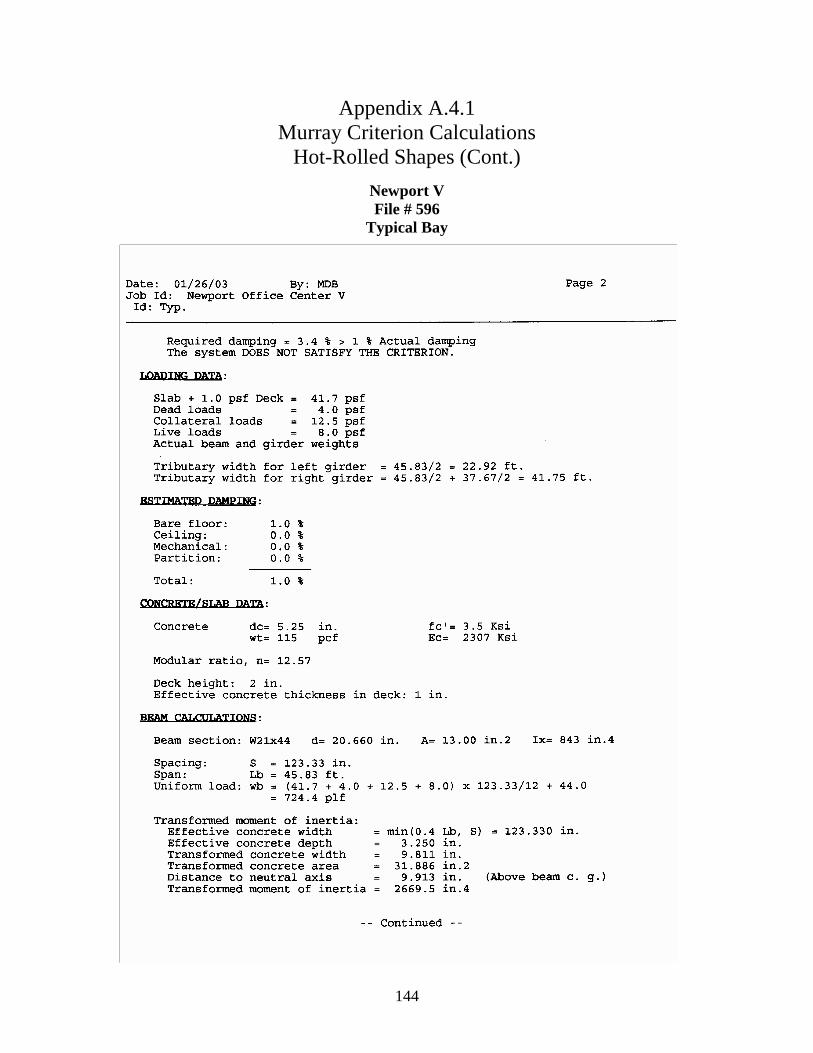
144
Appendix A.4.1 Murray Criterion Calculations
Hot-Rolled Shapes (Cont.)
Newport V File # 596
Typical Bay
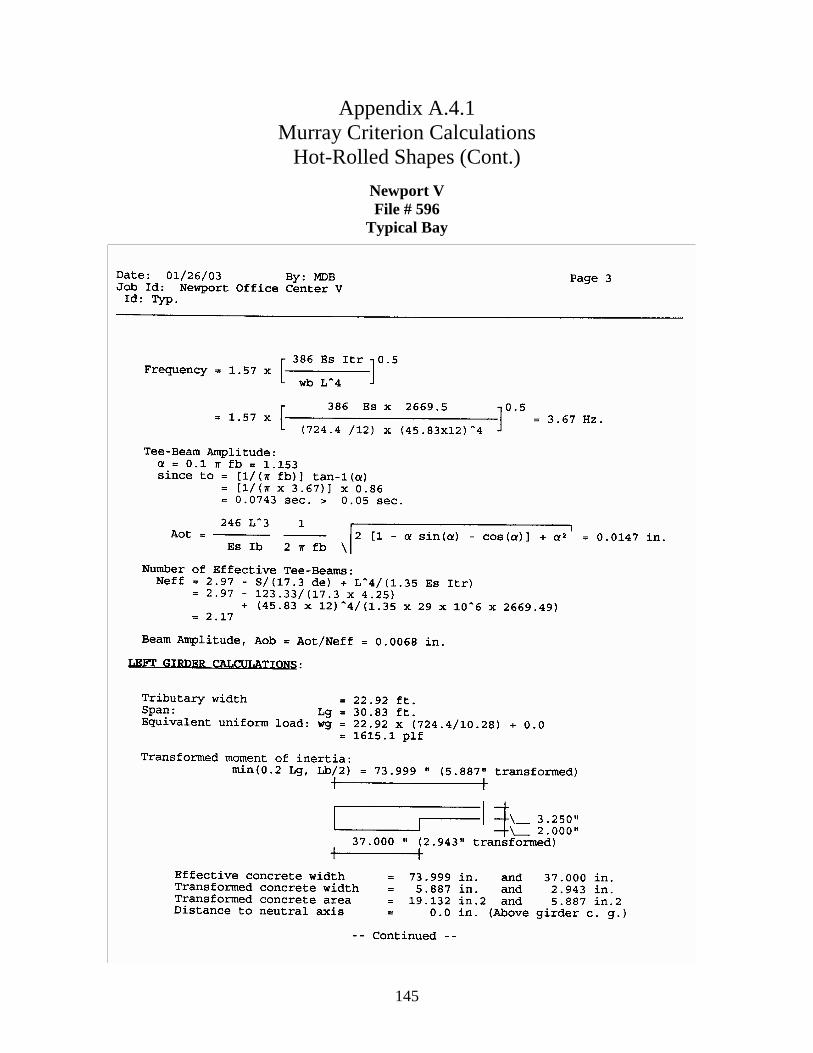
145
Appendix A.4.1 Murray Criterion Calculations
Hot-Rolled Shapes (Cont.)
Newport V File # 596
Typical Bay
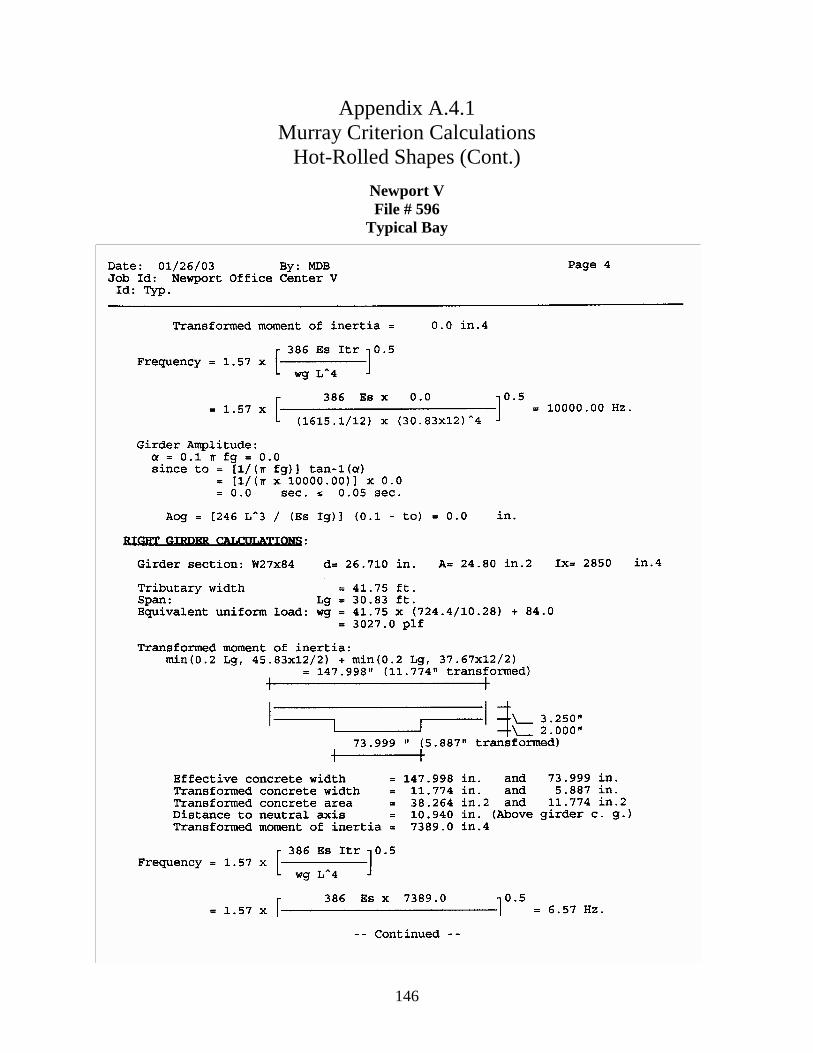
146
Appendix A.4.1 Murray Criterion Calculations
Hot-Rolled Shapes (Cont.)
Newport V File # 596
Typical Bay
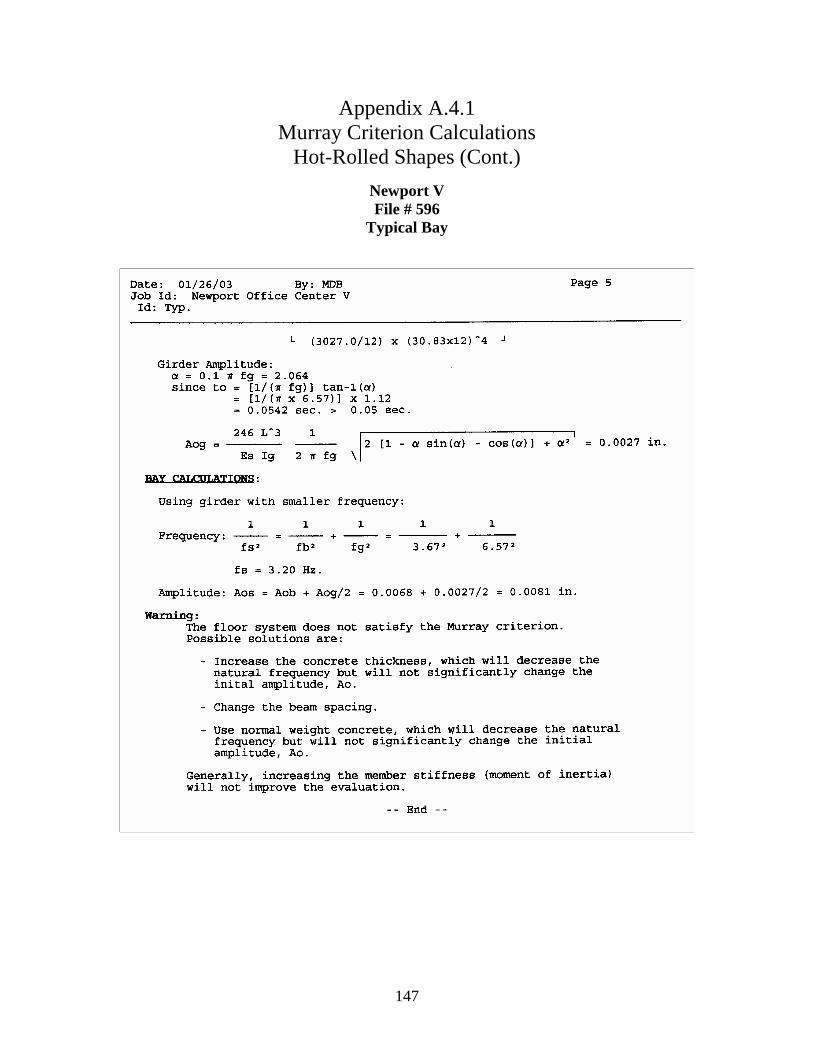
147
Appendix A.4.1 Murray Criterion Calculations
Hot-Rolled Shapes (Cont.)
Newport V File # 596
Typical Bay
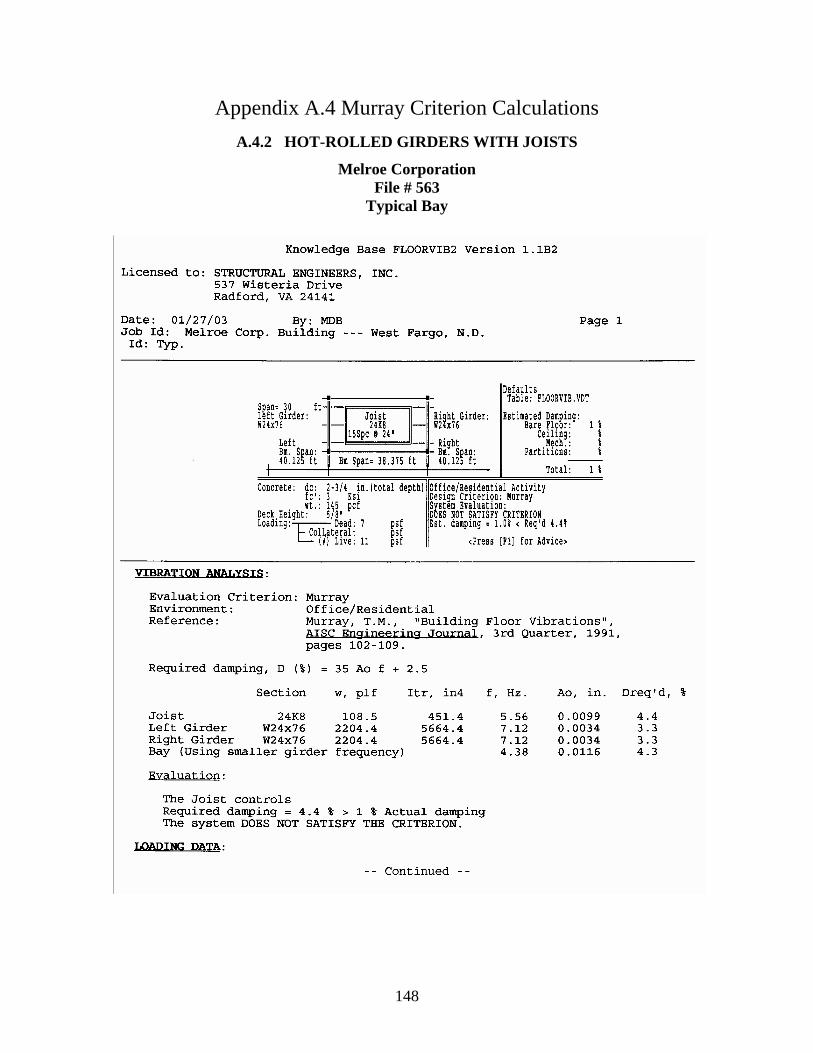
148
Appendix A.4 Murray Criterion Calculations
A.4.2 HOT-ROLLED GIRDERS WITH JOISTS
Melroe Corporation File # 563
Typical Bay
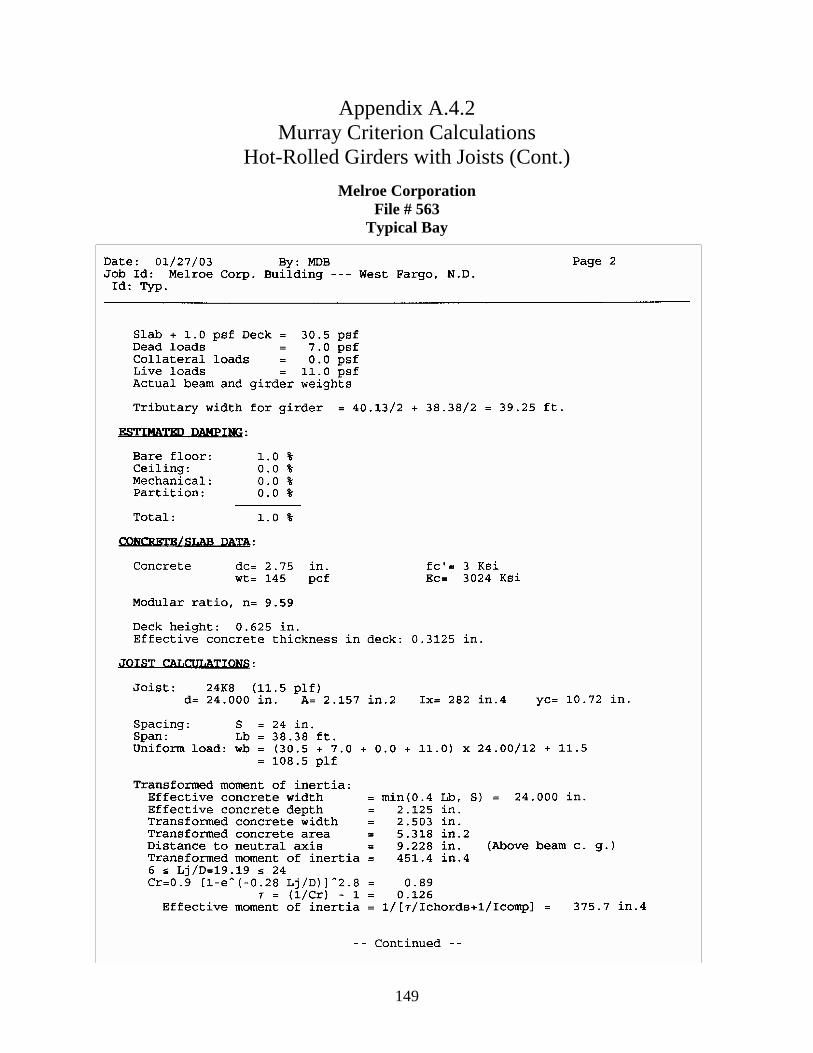
149
Appendix A.4.2 Murray Criterion Calculations
Hot-Rolled Girders with Joists (Cont.)
Melroe Corporation File # 563
Typical Bay
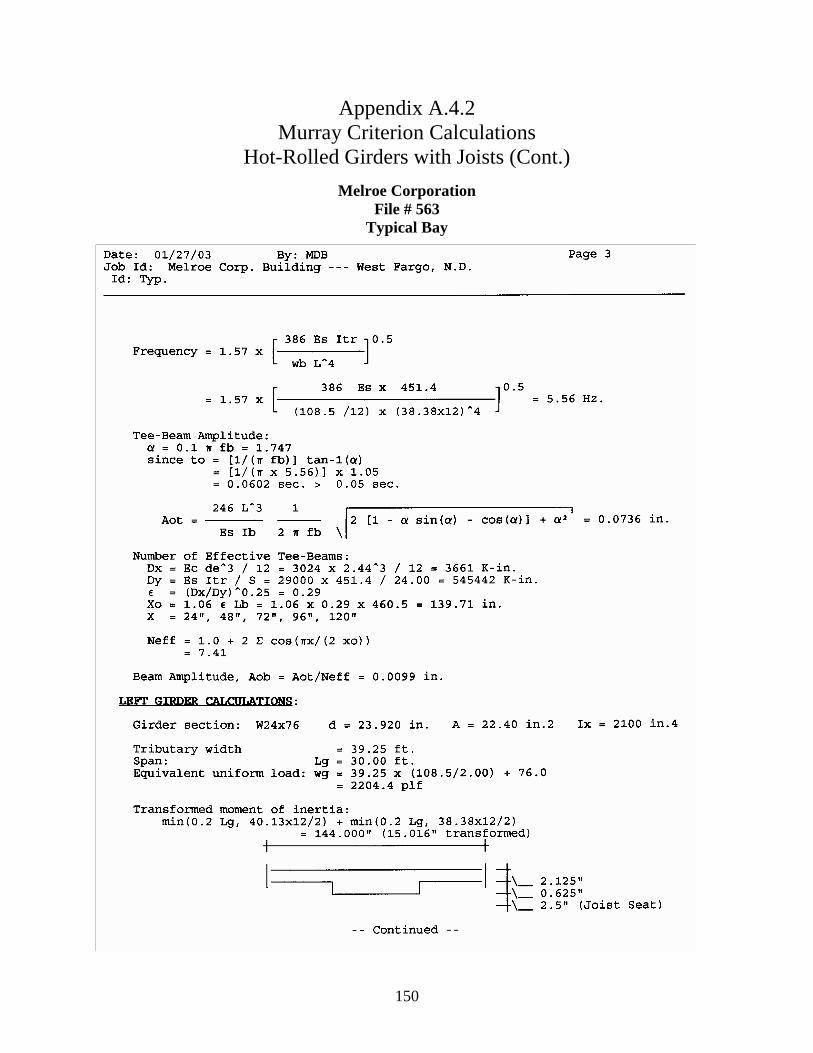
150
Appendix A.4.2 Murray Criterion Calculations
Hot-Rolled Girders with Joists (Cont.)
Melroe Corporation File # 563
Typical Bay
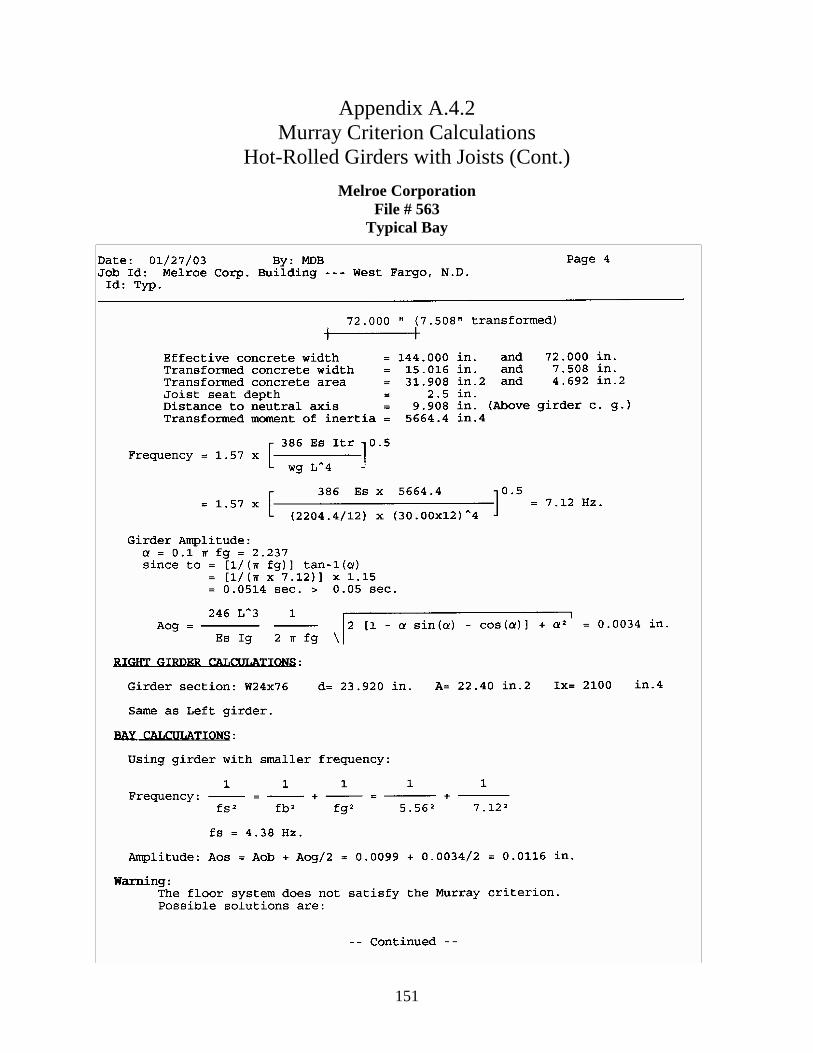
151
Appendix A.4.2 Murray Criterion Calculations
Hot-Rolled Girders with Joists (Cont.)
Melroe Corporation File # 563
Typical Bay
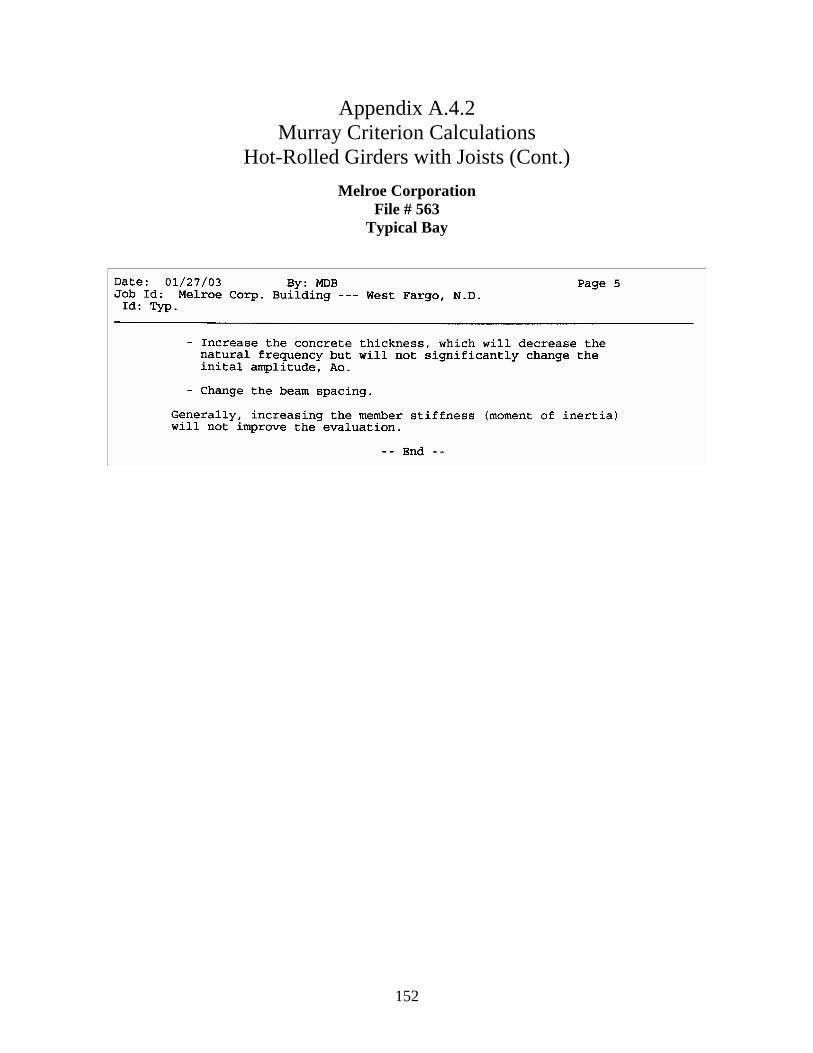
152
Appendix A.4.2 Murray Criterion Calculations
Hot-Rolled Girders with Joists (Cont.)
Melroe Corporation File # 563
Typical Bay
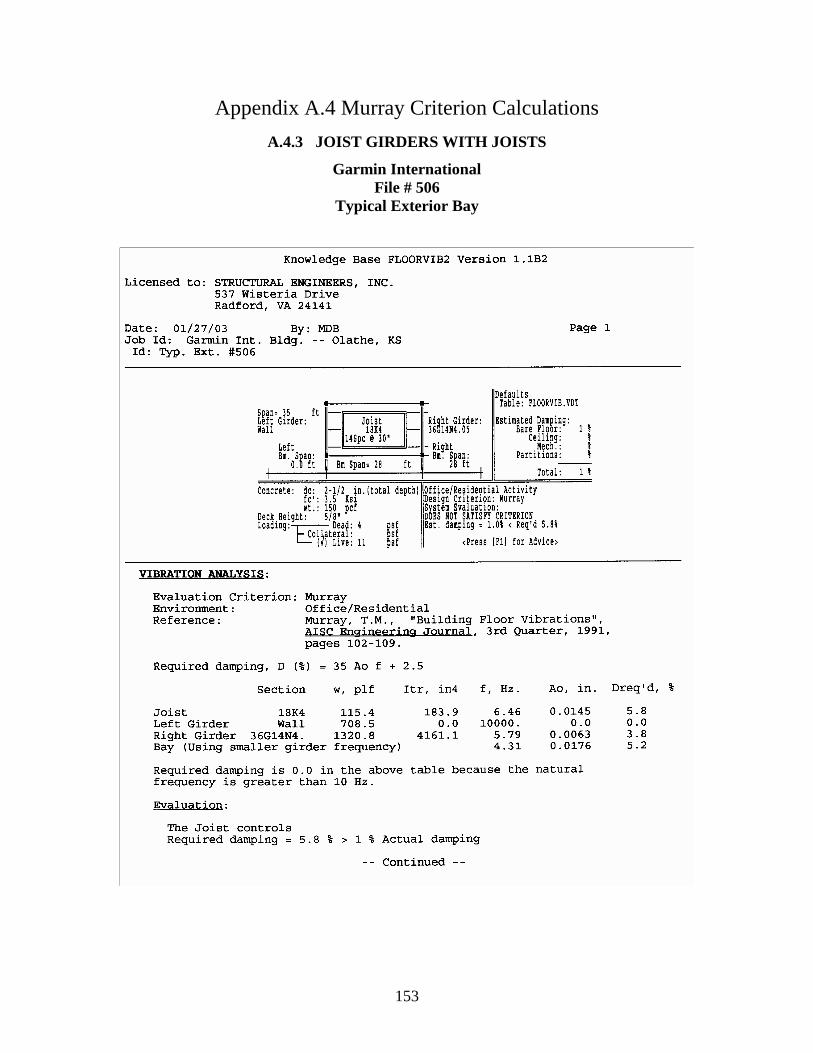
153
Appendix A.4 Murray Criterion Calculations
A.4.3 JOIST GIRDERS WITH JOISTS
Garmin International File # 506
Typical Exterior Bay
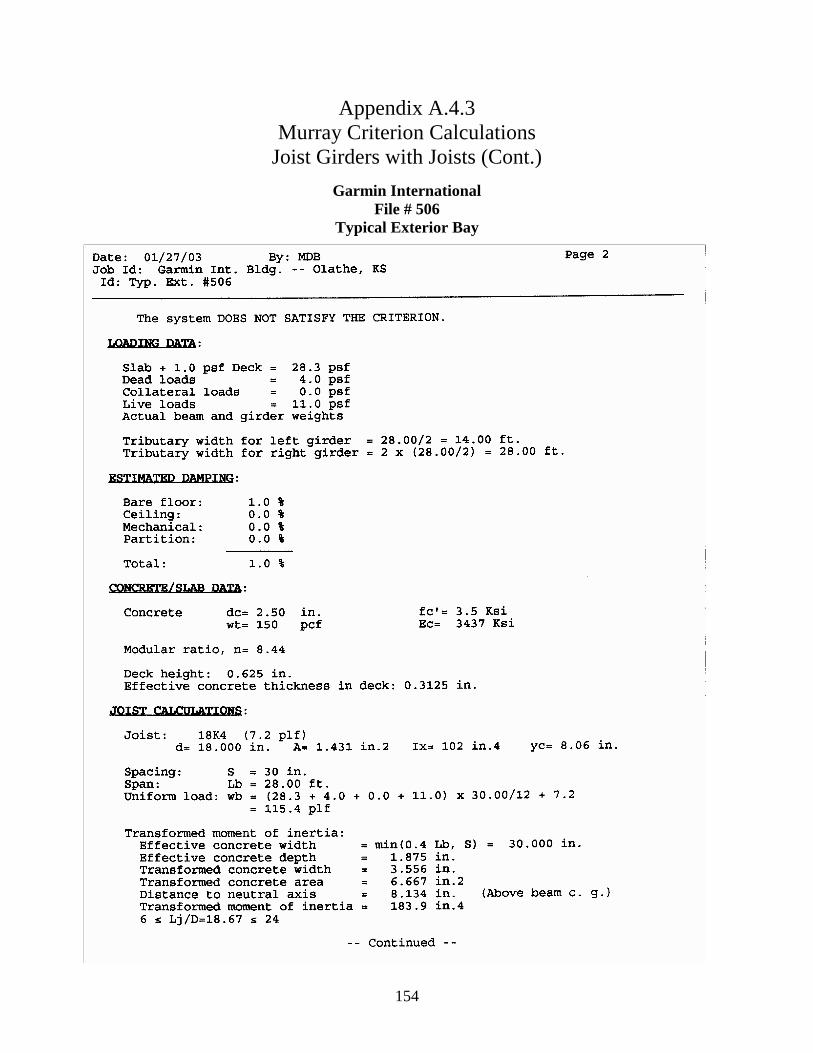
154
Appendix A.4.3 Murray Criterion Calculations
Joist Girders with Joists (Cont.)
Garmin International File # 506
Typical Exterior Bay
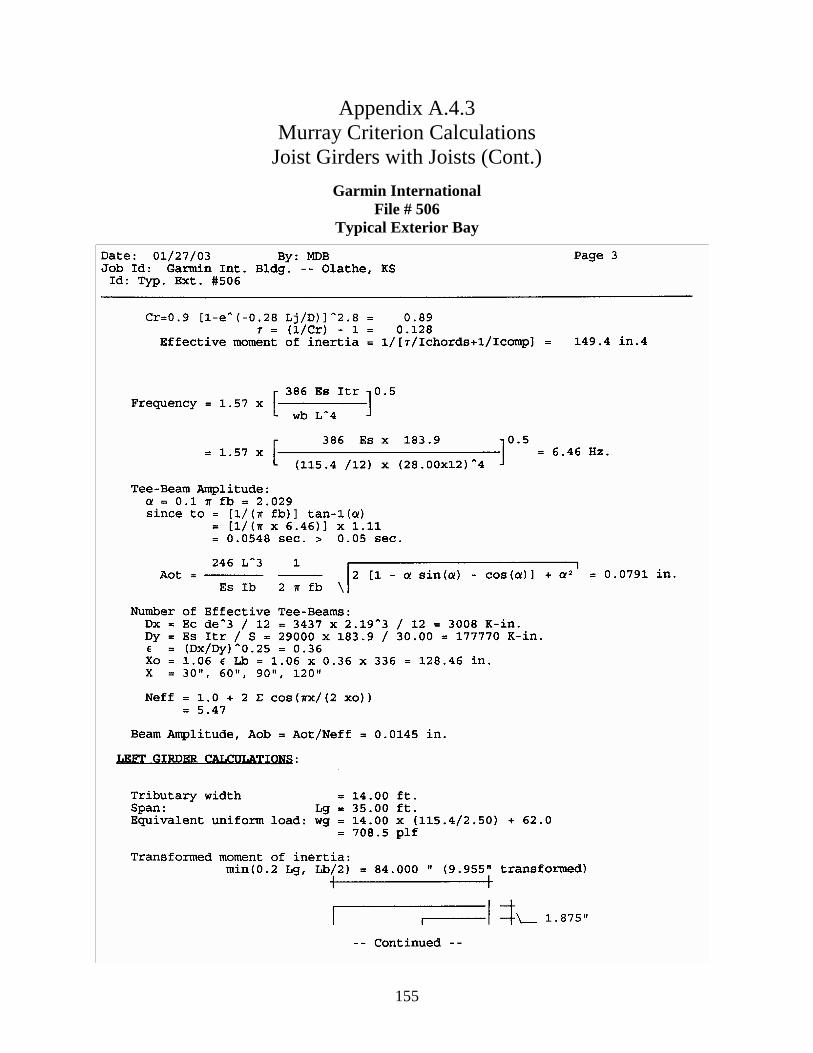
155
Appendix A.4.3 Murray Criterion Calculations
Joist Girders with Joists (Cont.)
Garmin International File # 506
Typical Exterior Bay
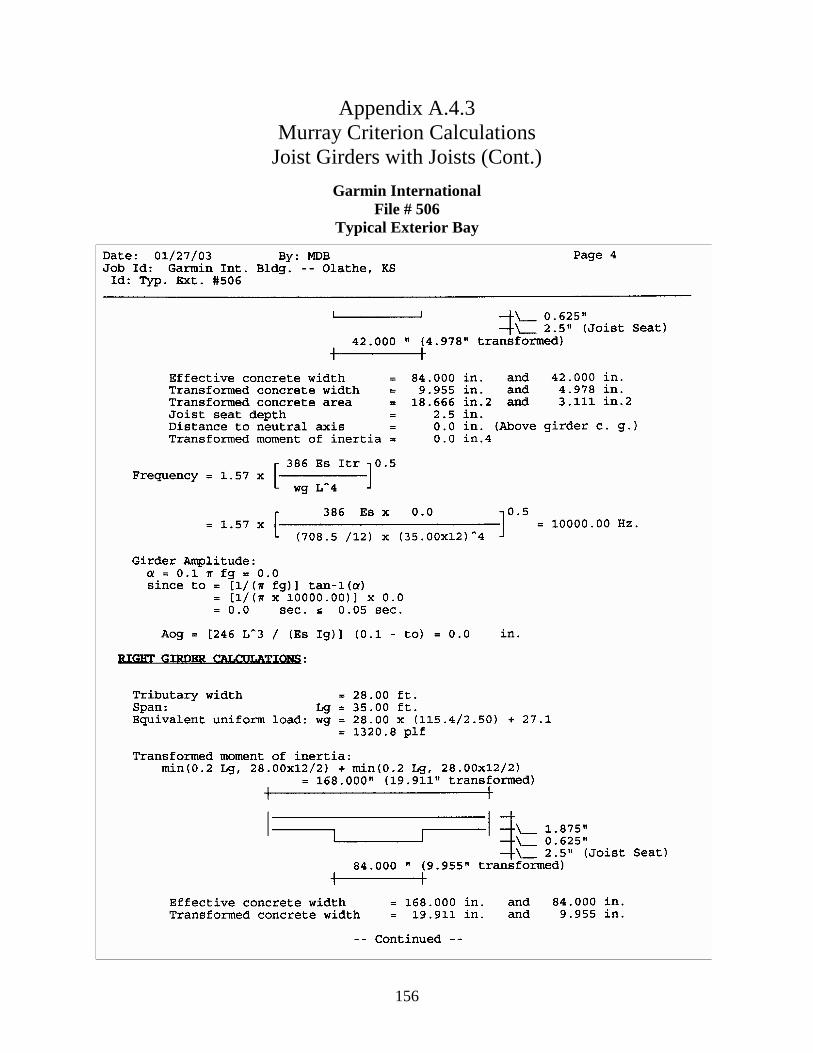
156
Appendix A.4.3 Murray Criterion Calculations
Joist Girders with Joists (Cont.)
Garmin International File # 506
Typical Exterior Bay
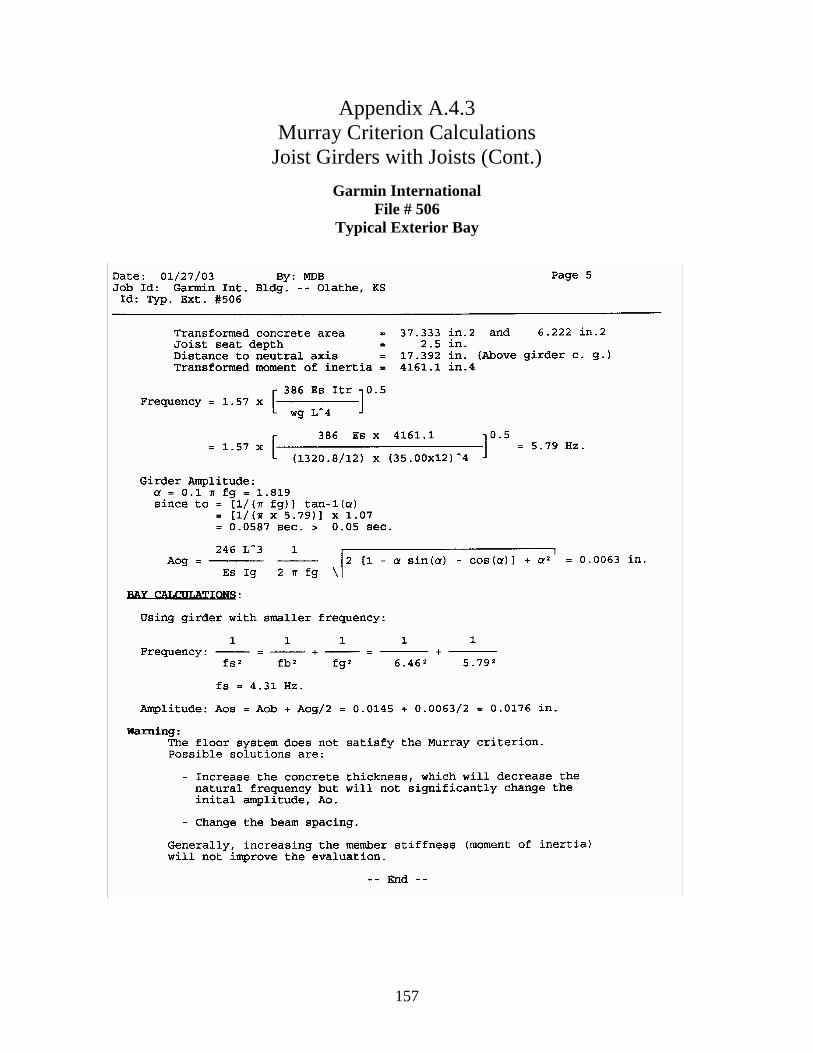
157
Appendix A.4.3 Murray Criterion Calculations
Joist Girders with Joists (Cont.)
Garmin International File # 506
Typical Exterior Bay
158
APPENDIX A.5 MODIFIED REIHER-MEISTER CALCULATIONS
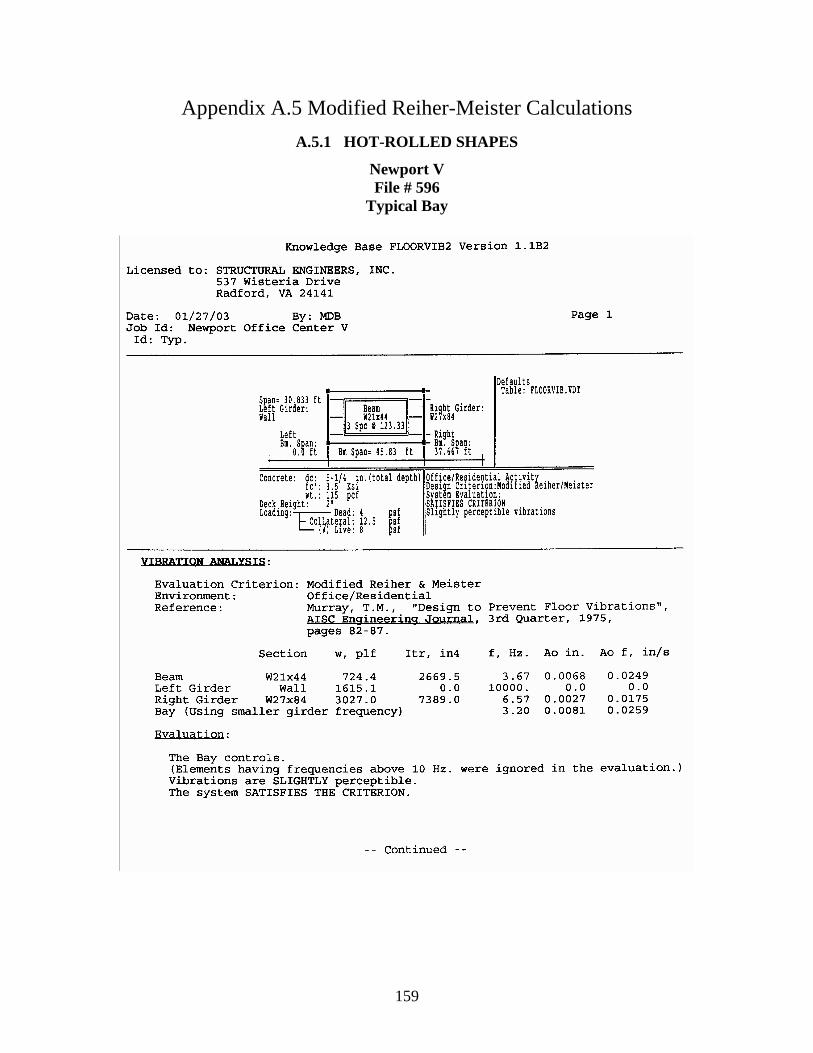
159
Appendix A.5 Modified Reiher-Meister Calculations
A.5.1 HOT-ROLLED SHAPES
Newport V File # 596
Typical Bay
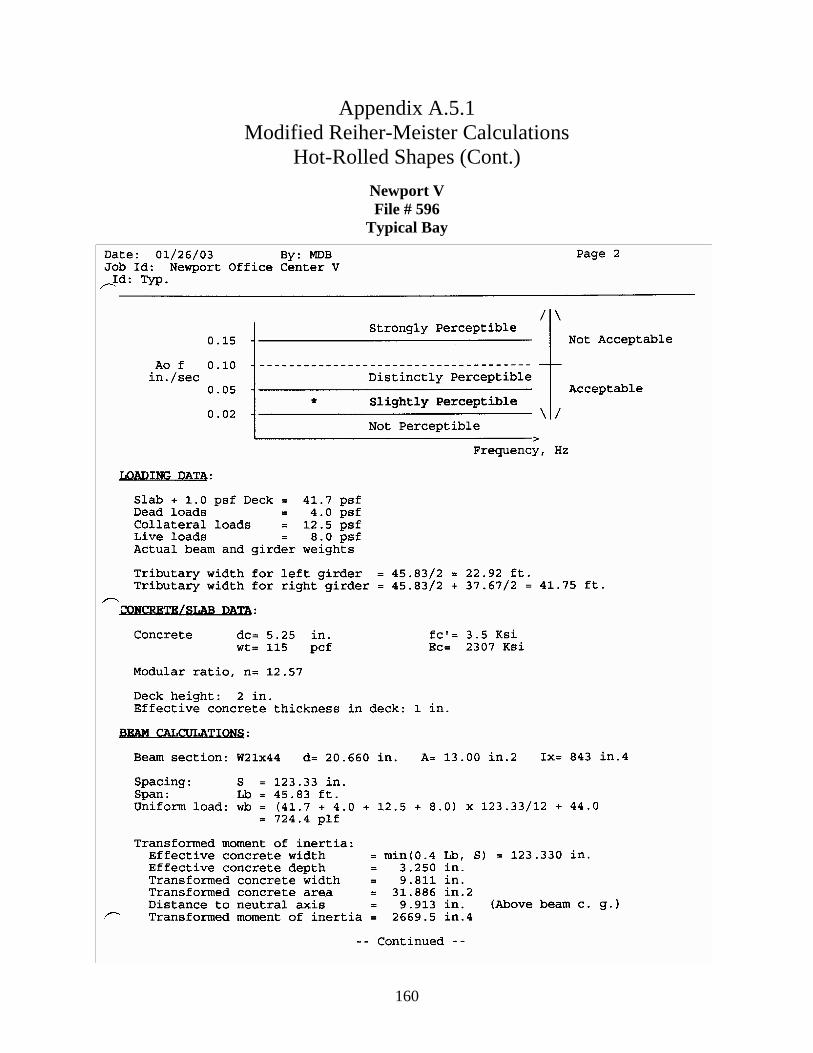
160
Appendix A.5.1 Modified Reiher-Meister Calculations
Hot-Rolled Shapes (Cont.)
Newport V File # 596
Typical Bay
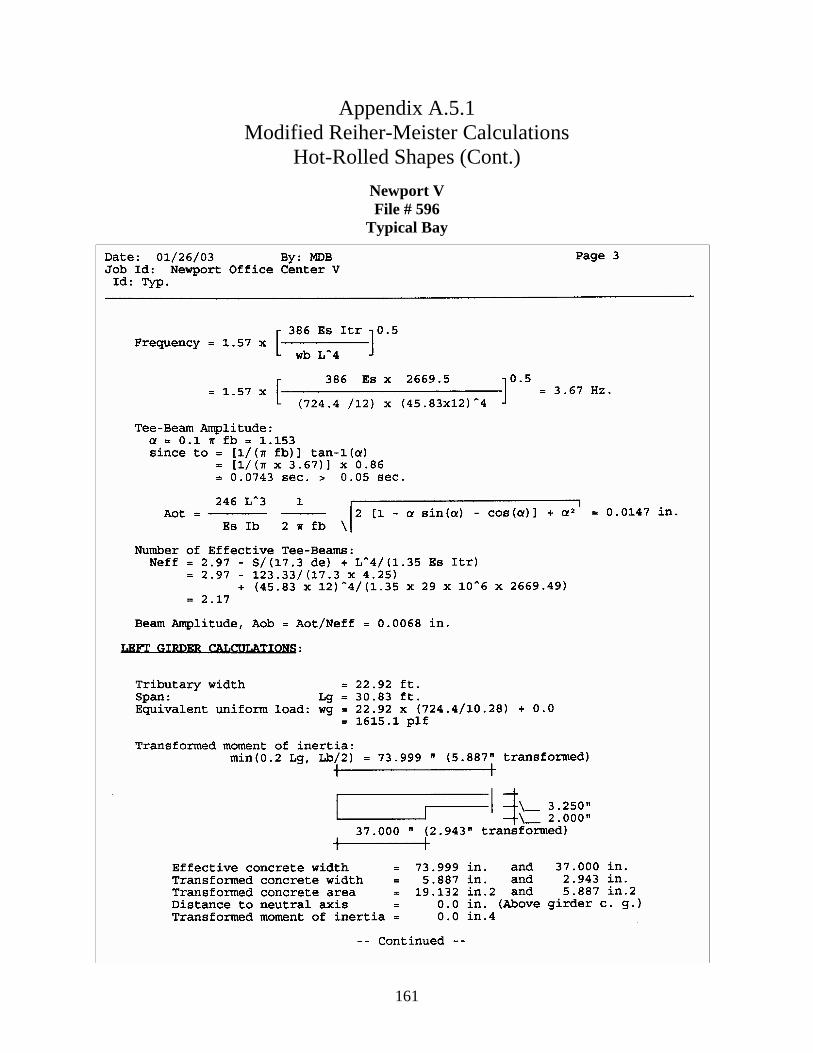
161
Appendix A.5.1 Modified Reiher-Meister Calculations
Hot-Rolled Shapes (Cont.)
Newport V File # 596
Typical Bay
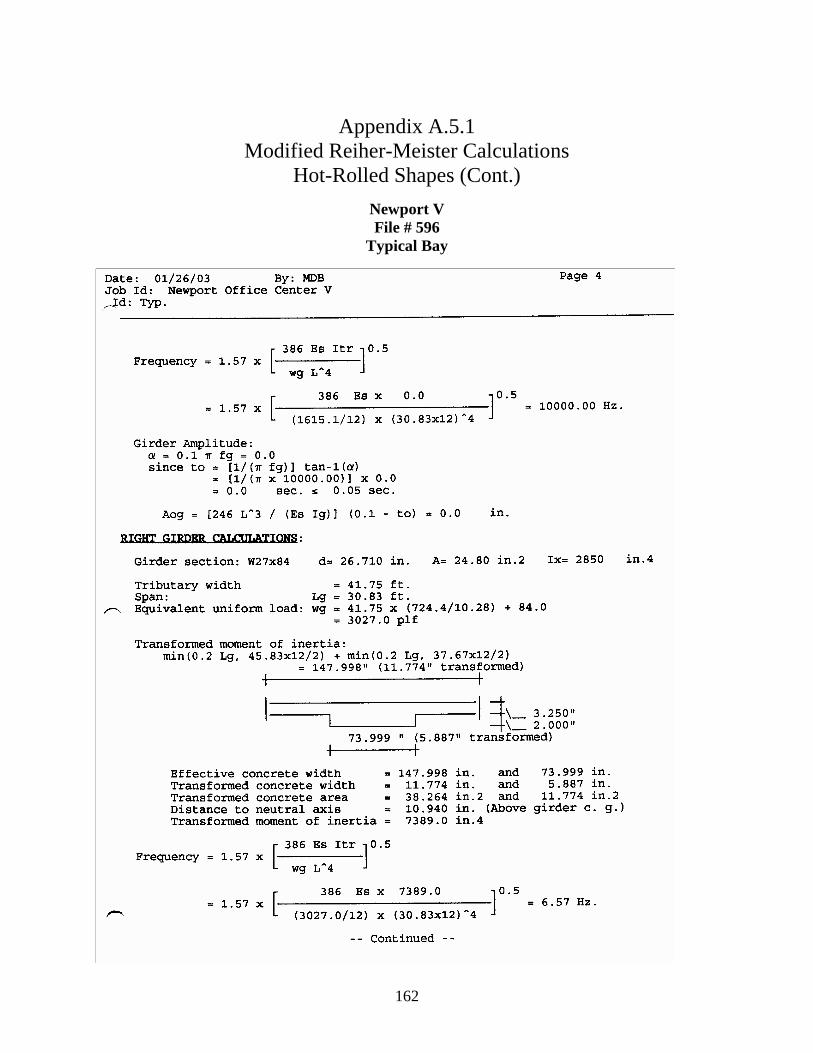
162
Appendix A.5.1
Modified Reiher-Meister Calculations Hot-Rolled Shapes (Cont.)
Newport V File # 596
Typical Bay
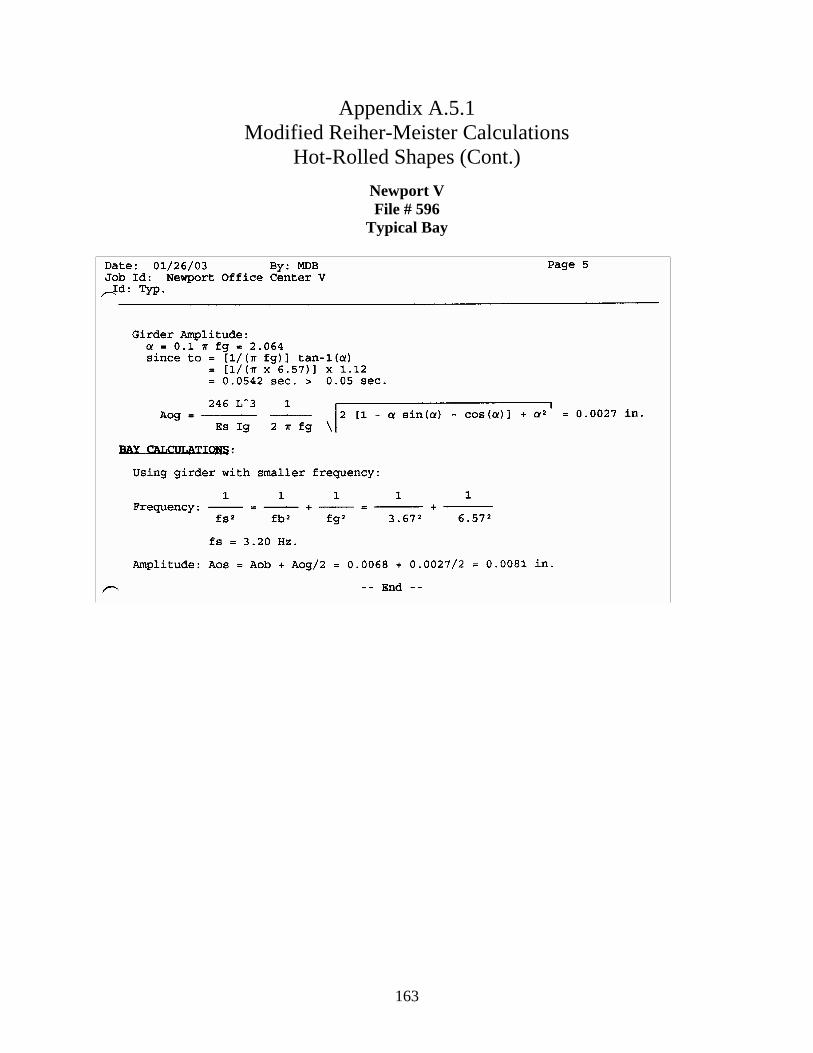
163
Appendix A.5.1 Modified Reiher-Meister Calculations
Hot-Rolled Shapes (Cont.)
Newport V File # 596
Typical Bay
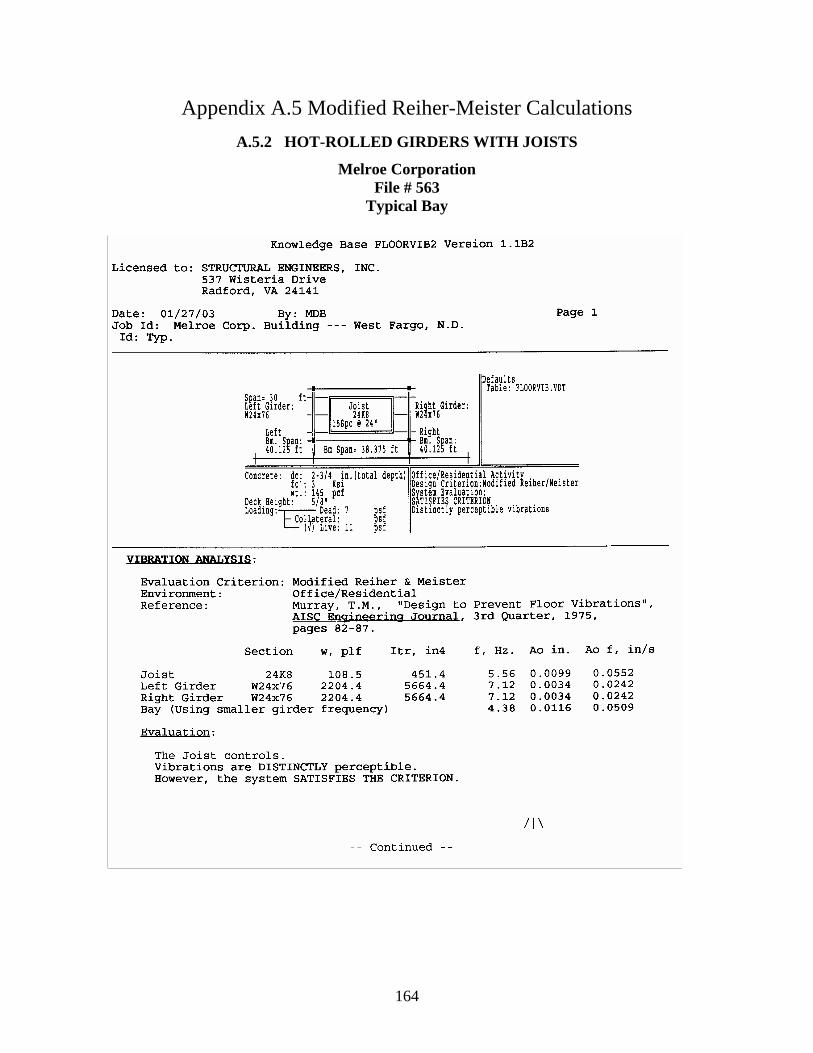
164
Appendix A.5 Modified Reiher-Meister Calculations
A.5.2 HOT-ROLLED GIRDERS WITH JOISTS
Melroe Corporation File # 563
Typical Bay
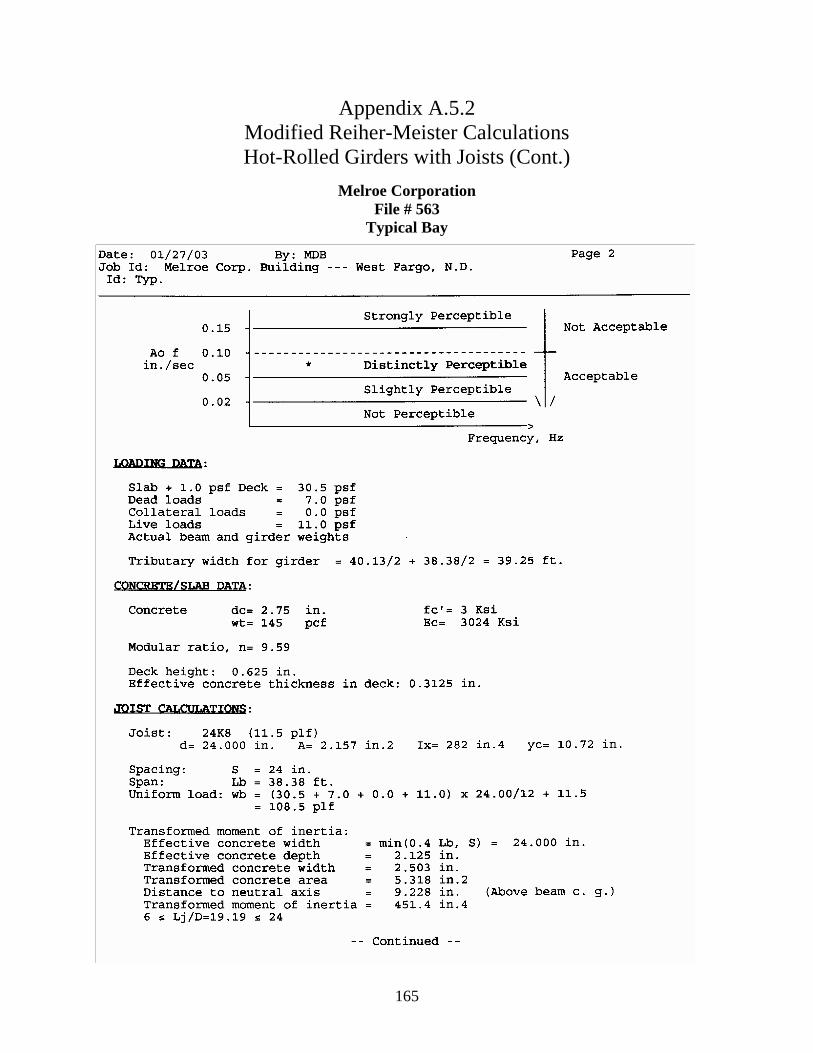
165
Appendix A.5.2 Modified Reiher-Meister Calculations Hot-Rolled Girders with Joists (Cont.)
Melroe Corporation File # 563
Typical Bay
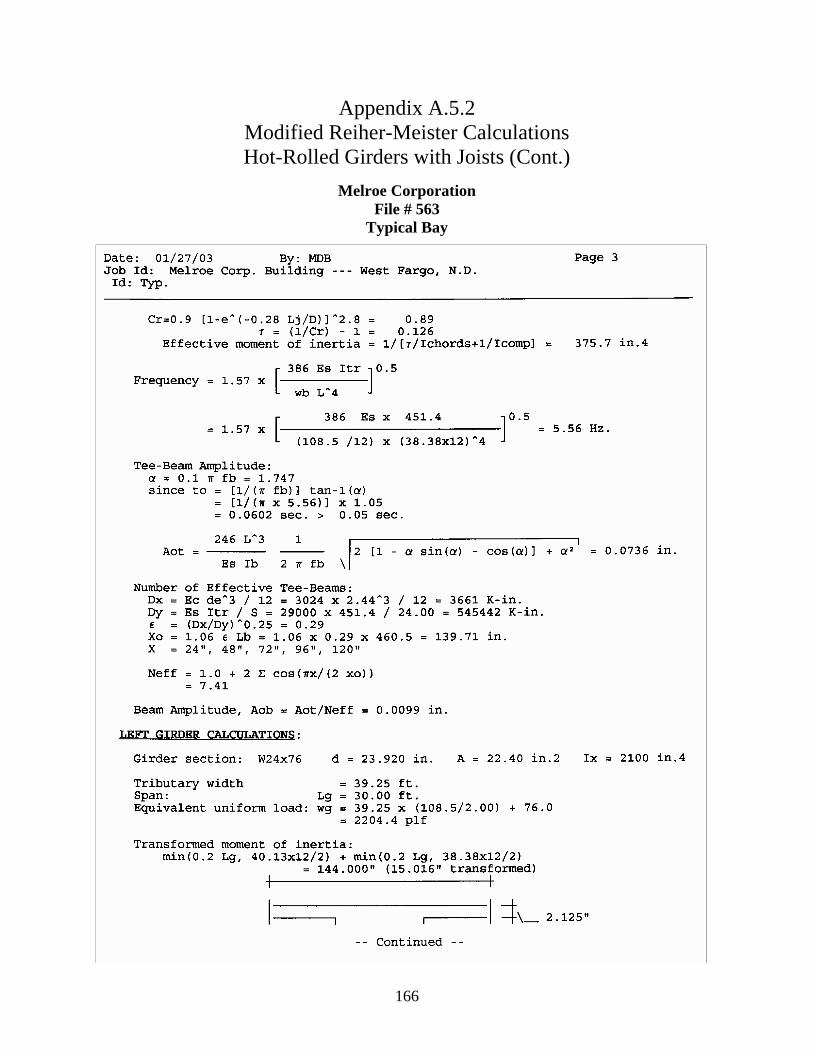
166
Appendix A.5.2 Modified Reiher-Meister Calculations Hot-Rolled Girders with Joists (Cont.)
Melroe Corporation File # 563
Typical Bay
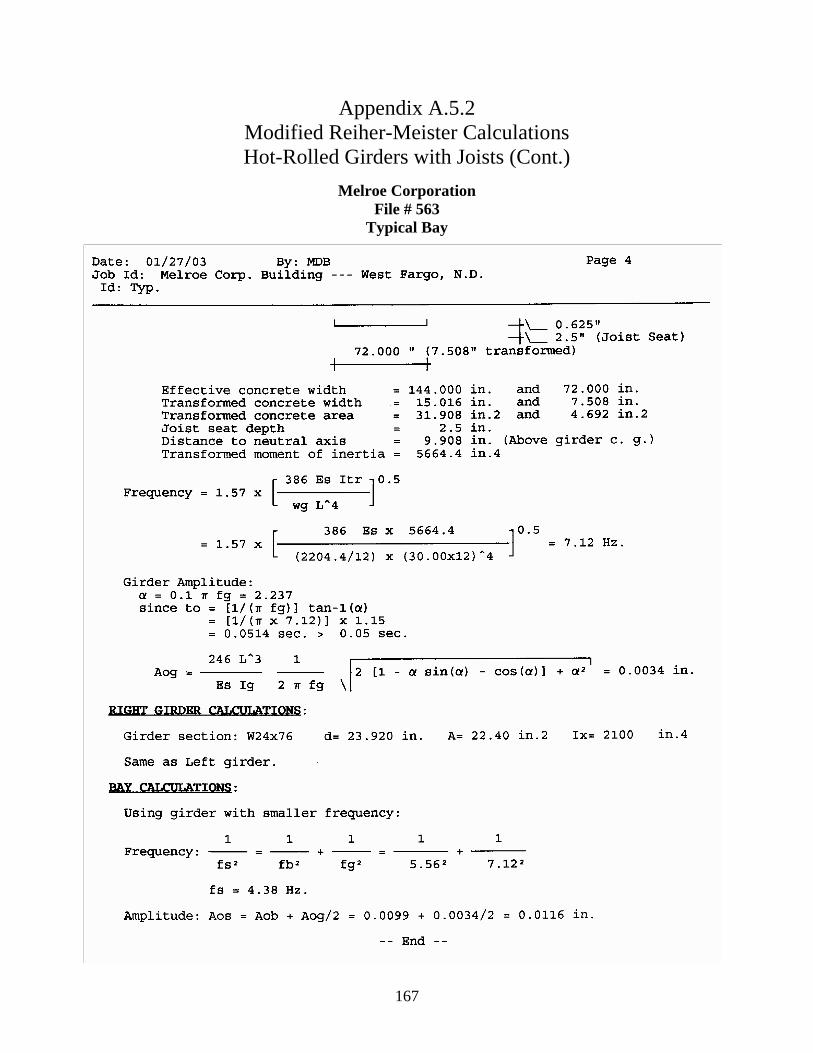
167
Appendix A.5.2 Modified Reiher-Meister Calculations Hot-Rolled Girders with Joists (Cont.)
Melroe Corporation File # 563
Typical Bay
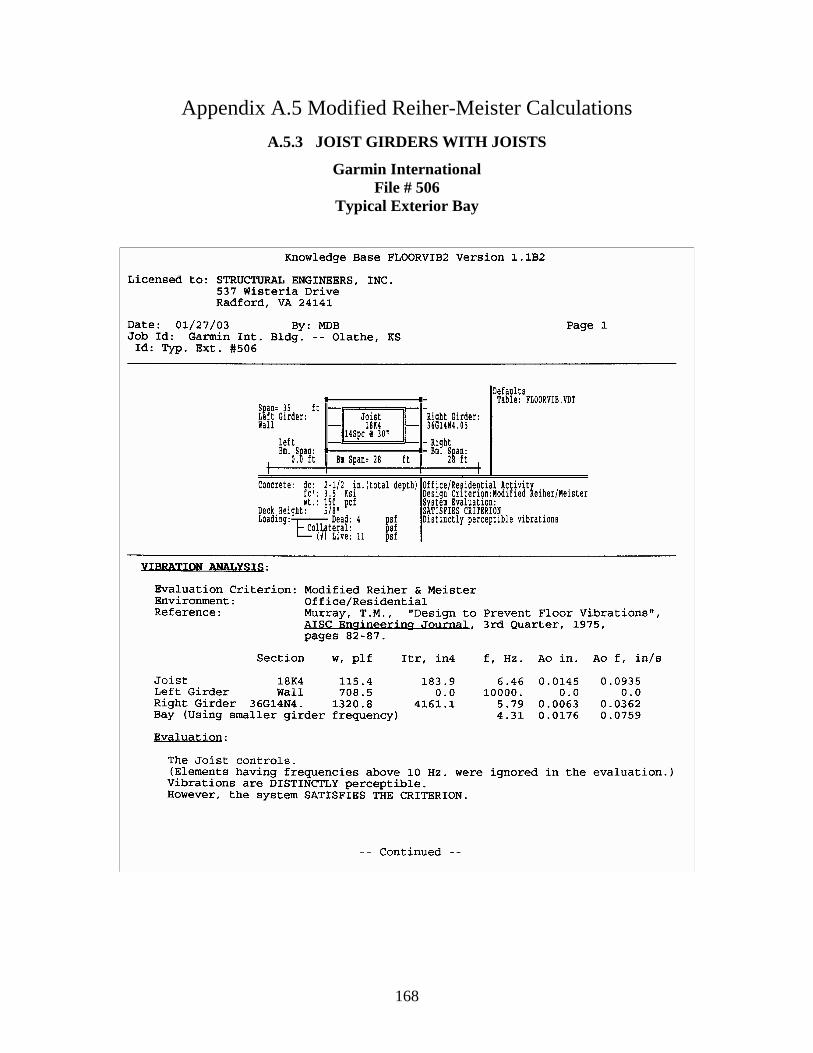
168
Appendix A.5 Modified Reiher-Meister Calculations
A.5.3 JOIST GIRDERS WITH JOISTS
Garmin International File # 506
Typical Exterior Bay
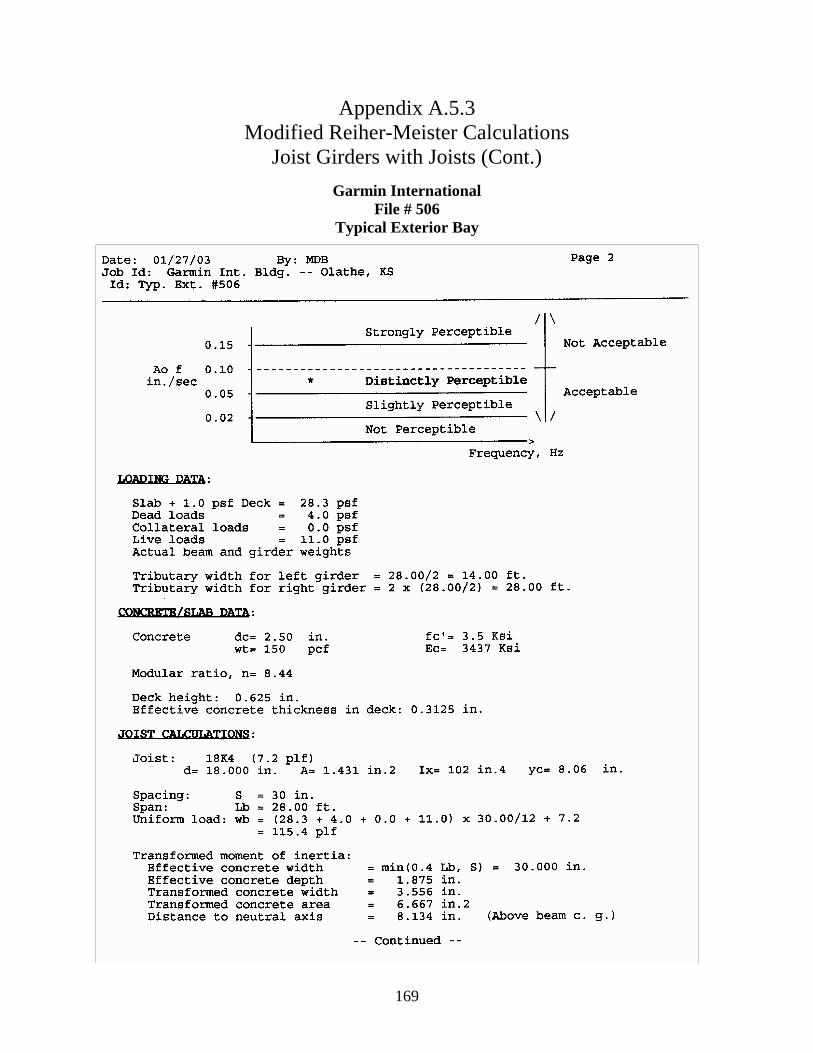
169
Appendix A.5.3 Modified Reiher-Meister Calculations
Joist Girders with Joists (Cont.)
Garmin International File # 506
Typical Exterior Bay
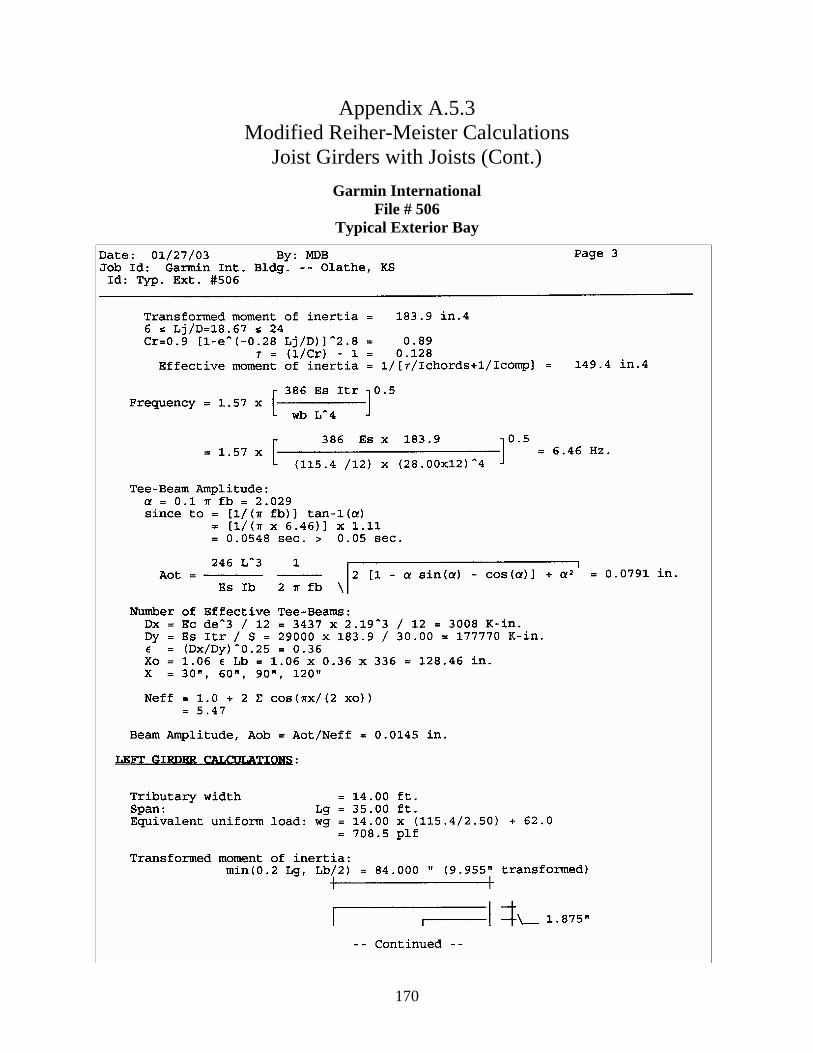
170
Appendix A.5.3 Modified Reiher-Meister Calculations
Joist Girders with Joists (Cont.)
Garmin International File # 506
Typical Exterior Bay
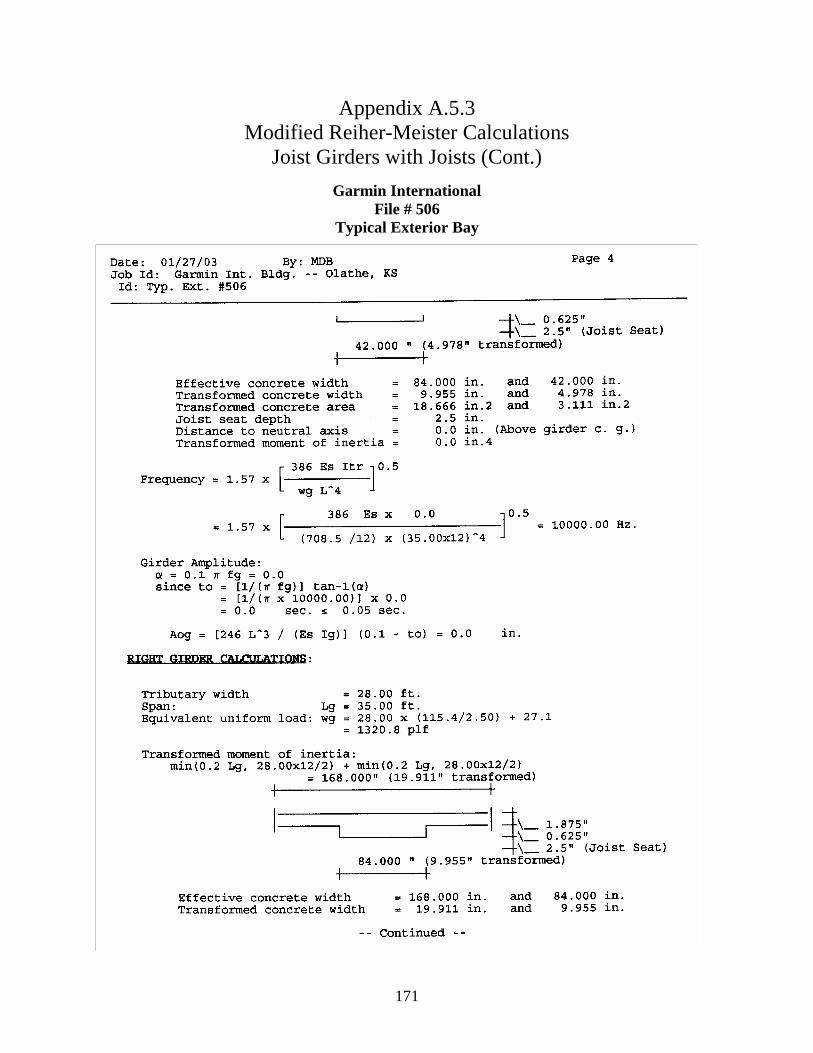
171
Appendix A.5.3 Modified Reiher-Meister Calculations
Joist Girders with Joists (Cont.)
Garmin International File # 506
Typical Exterior Bay
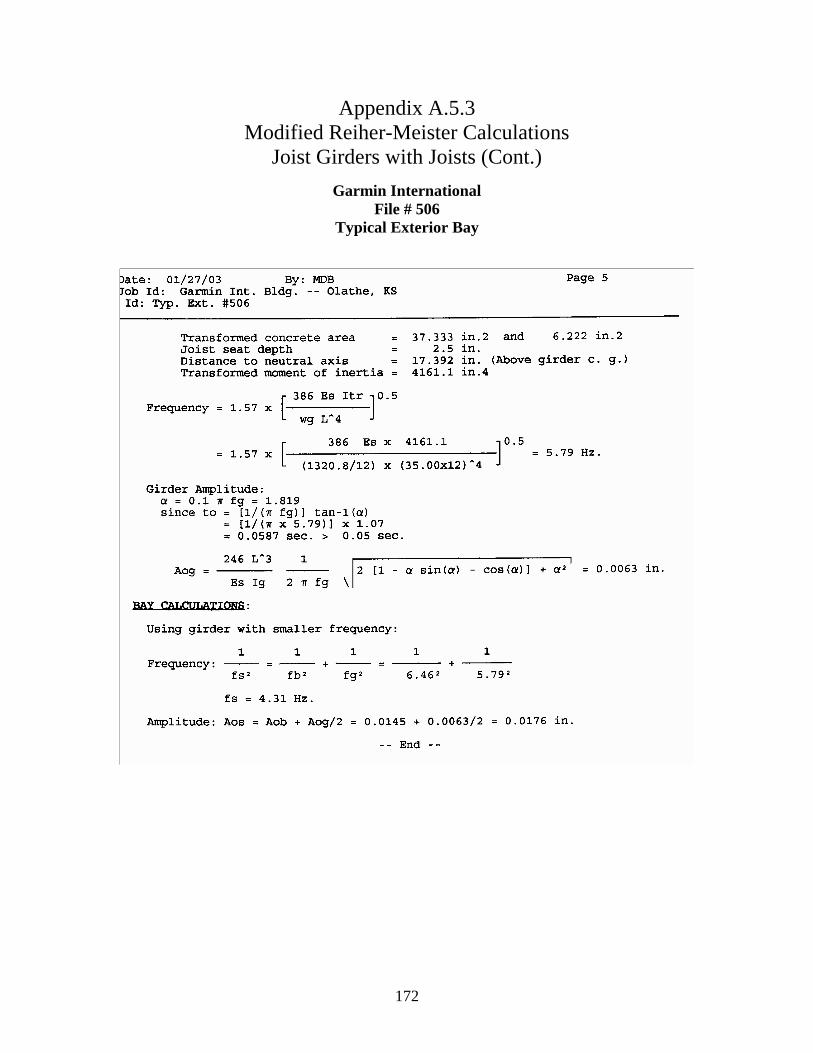
172
Appendix A.5.3 Modified Reiher-Meister Calculations
Joist Girders with Joists (Cont.)
Garmin International File # 506
Typical Exterior Bay
173
VITA
Michael D. Boice was born in West Palm Beach, Florida on Sunday, March 5,
1978 to Sharan and Gary Boice. He was raised in West Palm Beach and graduated from
John. I. Leonard High School in June of 1996. In December 2000, he received his
Bachelor of Science degree in Civil Engineering from the University of Florida. In
August of 2001, Michael began his graduate career at the Virginia Polytechnic Institute
and State University to obtain his Master of Science degree in Civil Engineering. He
received his degree with an emphasis in structural design and analysis in February of
2003. From Virginia, Michael went on to bigger and better possibilities in Chicago.
_____________________ Michael DeLancey Boice
P.S. There are those that look at things the way they are, and ask, “Why?” I dream of things that never were, and ask “Why not?” --- Robert F. Kennedy Even a stopped clock gives the right time twice a day. --- Unknown