Embed Size (px)
Citation preview
STUDY ON THE CHOICE OF TRANSPORTATION MODE FOR REGIONAL LOGISTICS
Xu ZHAO Associate Professor Transportation Management College Dalian Maritime University No.1 Linghai Road, Dalian, 116026 China Fax: +86-411-8472-9568 E-mail: [email protected]
Zan YANG Professor Transportation Management College Dalian Maritime University No.1 Linghai Road, Dalian, 116026 China Fax: +86-411-8472-9568 E-mail: [email protected]
Zhongzhen YANG Professor Transportation Management College Dalian Maritime University No.1 Linghai Road, Dalian, 116026 China Fax: +86-411-8472-9568 E-mail: [email protected]
Yu FENG Postgraduate Transportation Management College Dalian Maritime University No.1 Linghai Road, Dalian, 116026 China Fax: +86-411-8472-9568 E-mail: [email protected]
Abstract: This paper studies the characteristics of choice of transportation mode of shippers and carriers based on discrete choice theory. Different transportation modes have different economic characteristics and corresponding competition, shippers and carriers have different preferences when they are choosing the regional transportation mode. The paper firstly analyzes the factors influencing the choice of transportation mode, and then we choose eight kinds of cargoes according to the situation of transportation in the region, confirm the variables of every kind of cargo on the basis of questionnaire, set up corresponding choice model of transportation mode and calculate the aggregate probability and elasticity. In the end we test and analyze the results. The result accords with the characteristics of shippers and carriers’ choice of transportation mode. This model has good applicability in choice of transportation mode. The method has the reference to transportation system planning. Key Words: Transportation mode, Freight transport, Discrete choice theory 1. INTRODUCTION At Present, surplus and scarcity of transport infrastructures can be seen simultaneously in China. In one side, large social infrastructure, such as railway, airport, seaport, cannot meet the demand, while highway offers surplus ability for freight transport. In the other side, surplus and scarcity appear by turns in the coastal water transportation. China has divided the management system by transport modes, and then sub-systems such as highway and railway networks are developed on the premise of their own optimization. Therefore, communication and coordination are hardly done among different sections and social resources are wasted. Moreover, because of the limitations of managerial mechanism and method, the choice of the transport mode becomes irregular. Then lots of resources are consumed but transport efficiency and benefit are not optimized. It is necessary to plan the development and division of transport modes according to the inherent technical/economic characteristics and advantages, and to build an integrated
Proceedings of the Eastern Asia Society for Transportation Studies, Vol. 5, pp. 16 - 31, 2005
16
transport system with the harmonious development of various transport modes. This paper analyzes behaviors of choosing transport mode for regional logistics based on discrete choice theory. A choice behavior model is with high logicality, easy shift of time and area, good accuracy and needs fewer samples. The paper studies the choice of transportation mode according to the characteristic of disaggregate theory in order to provide the thinking and the basis for using the resource of transportation system efficiently in China. 2. THE ANALYSIS ON CHOICE OF TRANSPORTATION MODE OF SHIPPERS AND CARRIERS 2.1 Factors Since existing transport modes, water way, highway, railway, air way and pipe, have different characteristics, market adaptability and advantages, different service attributes of them can be found. Every kind of freight has its own suitable transport mode and shippers have different degrees of satisfaction when choosing different transport modes. If the satisfied degree of a shipper on a transport mode is higher than another, shippers think that the utility of the former is better than that of the latter, vice versa. So the evaluation and choosing probability of shippers and carriers for the five transport modes are discussed and studied based on the economic characteristics and the traits of the cargoes. We get the main factors when shippers and carriers are choosing the transportation mode based on actual investigation and analysis.
Cargo value The cargoes are divided into three types, high value, medium value and low value. As for the cargoes with high value, the shippers and carriers will choose the transportation mode with high safety and light hurting to cargo. The safety of the transportation mode will not be regarded important for the cargoes with low value.
Cargo volume When the shippers and carriers transport certain kind of cargo, the capacity of the transportation mode should be thought of. When they transport a large mount of bulk cargo, the vehicle whether can transport this kind of cargo and the cost should be considered.
Distance The distance has some influence on choice of transportation mode. The shippers and carriers should consider whether the distance is within the economical distance in order to save cost, because every transportation mode has economical distance.
Cost The overall transportation cost includes transportation charge, loading and unloading charge and storage cost. The transportation charge is influenced by many factors. For example, if the fixed cost irrelative to the transportation volume occupies large portion in the transportation charge, the transportation frequency will influence the charge. If the carriers make the frequency of transportation higher, the fixed cost will decrease. The transportation charge is
Proceedings of the Eastern Asia Society for Transportation Studies, Vol. 5, pp. 16 - 31, 2005
17
lower when the capacity of vehicle is larger.
Time The time factor includes the transportation time from origin to destination and storage time in the yard or warehouse. So the time factor is relative to the speed of the vehicle and the distance from origin to destination. The storage is influenced by the distribution system and machine operation efficiency. If the distribution system is more advanced and the machine operation is more efficient, the storage time is less.
Contract The trade contract plays an important role in the freight transportation. Sometimes the trade contract tends to determine the choice of transportation mode.
Reliability It means what the ratio of the cargoes is which arrives in time and in good condition. The cargo will swag in the long-distance transportation. Some cargoes such as grains and vegetable will be rotten if they are reserved for too long time. When the cargoes are loaded and unloaded, some cargoes will be lost. They are the cargo loss in the transportation. The transportation reliability is weighed by it. If the shippers and the carriers need high cargo perfection, they will choose the transportation mode with good reliability in order to guarantee the cargo quality.
Obtainable factor Obtainable factor describes whether it is easy to obtain the transportation service. Sometimes certain transportation mode is most suitable to transport some kind of cargo, but it is hard to obtain this transportation service or it should cost much to obtain that, the shippers will choose other transportation mode.
Transportation frequency Transportation frequency means how long time the next vehicle should wait for starting after the first vehicle start to transport the cargoes. The transportation frequency is influenced by vehicle, yard and natural condition. Some cargoes which need constant arrival and have high random is fit for transportation mode with high frequency. Generally speaking, if the transportation mode has higher frequency, the probability of choosing this kind of transportation mode is more.
Accessibility The accessibility describes whether it is easy to obtain the cargoes transported. The quality of transportation service is thought highly in the modern logistics and the accessibility is an important aspect of that. Some shippers will consider accessibility in order to make the consignee more convenient, so they will choose the transportation mode which transports the cargo to the place near to consignee. 2.2 Questionnaire Survey 2.2.1 The Statistics on Questionnaire Survey In this paper we sample the transportation companies in China’s Liaoning province. When the companies carry out their cargoes, they take this field as the origination, destination or
Proceedings of the Eastern Asia Society for Transportation Studies, Vol. 5, pp. 16 - 31, 2005
18
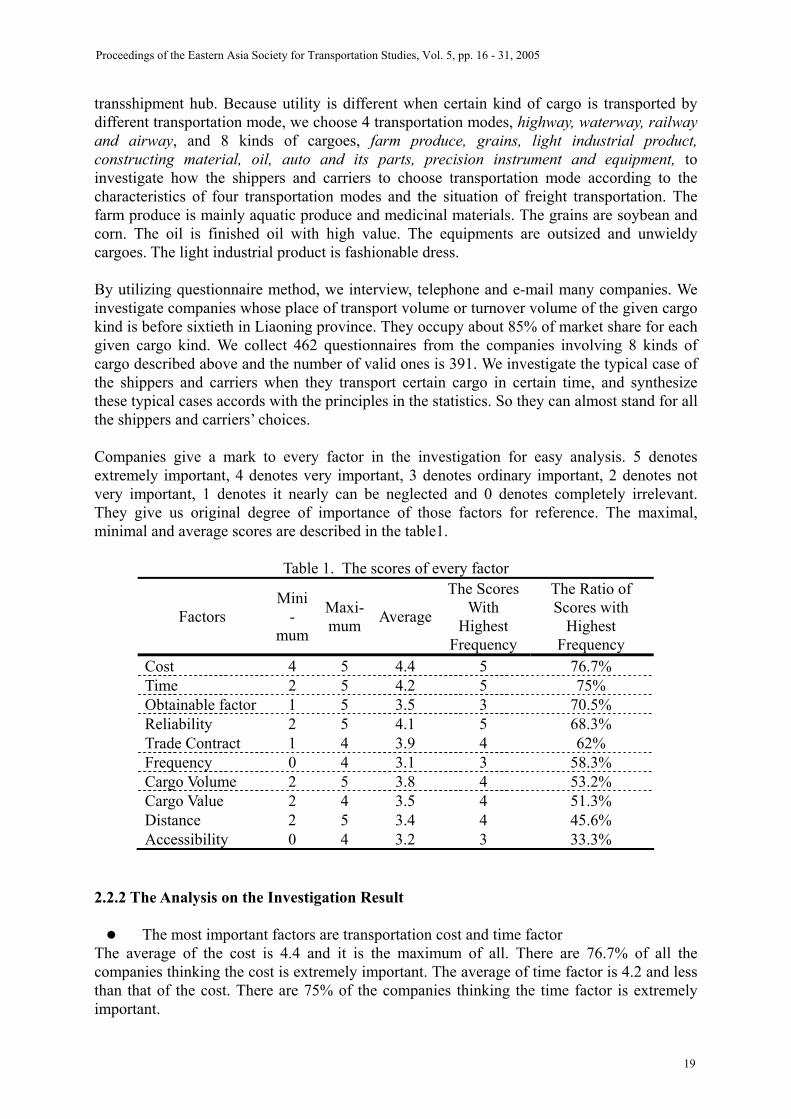
transshipment hub. Because utility is different when certain kind of cargo is transported by different transportation mode, we choose 4 transportation modes, highway, waterway, railway and airway, and 8 kinds of cargoes, farm produce, grains, light industrial product, constructing material, oil, auto and its parts, precision instrument and equipment, to investigate how the shippers and carriers to choose transportation mode according to the characteristics of four transportation modes and the situation of freight transportation. The farm produce is mainly aquatic produce and medicinal materials. The grains are soybean and corn. The oil is finished oil with high value. The equipments are outsized and unwieldy cargoes. The light industrial product is fashionable dress. By utilizing questionnaire method, we interview, telephone and e-mail many companies. We investigate companies whose place of transport volume or turnover volume of the given cargo kind is before sixtieth in Liaoning province. They occupy about 85% of market share for each given cargo kind. We collect 462 questionnaires from the companies involving 8 kinds of cargo described above and the number of valid ones is 391. We investigate the typical case of the shippers and carriers when they transport certain cargo in certain time, and synthesize these typical cases accords with the principles in the statistics. So they can almost stand for all the shippers and carriers’ choices. Companies give a mark to every factor in the investigation for easy analysis. 5 denotes extremely important, 4 denotes very important, 3 denotes ordinary important, 2 denotes not very important, 1 denotes it nearly can be neglected and 0 denotes completely irrelevant. They give us original degree of importance of those factors for reference. The maximal, minimal and average scores are described in the table1.
Table 1. The scores of every factor
Factors Mini
- mum
Maxi-mum Average
The Scores With
Highest Frequency
The Ratio of Scores with
Highest Frequency
Cost 4 5 4.4 5 76.7% Time 2 5 4.2 5 75% Obtainable factor 1 5 3.5 3 70.5% Reliability 2 5 4.1 5 68.3% Trade Contract 1 4 3.9 4 62% Frequency 0 4 3.1 3 58.3% Cargo Volume 2 5 3.8 4 53.2% Cargo Value 2 4 3.5 4 51.3% Distance 2 5 3.4 4 45.6% Accessibility 0 4 3.2 3 33.3%
2.2.2 The Analysis on the Investigation Result
The most important factors are transportation cost and time factor The average of the cost is 4.4 and it is the maximum of all. There are 76.7% of all the companies thinking the cost is extremely important. The average of time factor is 4.2 and less than that of the cost. There are 75% of the companies thinking the time factor is extremely important.
Proceedings of the Eastern Asia Society for Transportation Studies, Vol. 5, pp. 16 - 31, 2005
19
The more important factors are reliability and trade contract
The average of reliability is 4.1 and less than that of cost and time factor. There are 68.3% of all the companies thinking reliability is extremely important when they choose the transportation mode. The average of the three factors above is more than 4. The average of trade contract is 3.9 and there are 62% of all the companies thinking trade contract is ordinary important.
The easy to neglect factors are distance and transportation frequency The average of distance is 3.4. The average of transportation frequency is 3.1, which is the least of all the factors. None of the companies think the two factors are extremely important. In a conclusion, the companies consider cost, time and reliability more when they are choosing transportation mode. Five most important factors are as follows:
cost (average is 4.4) time (average is 4.2) reliability (average is 4.1) trade contract (average is 3.9) volume of cargo (average is 3.8)
3. THE ANALYSIS ON UTILITY FUNCTION We apply discrete choice theory to forecast the unit occurring transportation, whether to travel, choice of transportation mode and choice of route, and then do statistics according to traveling distribution, transportation mode and transportation mode respectively to get model of transportation demand volume. This paper analyzes and forecasts the choice of transportation mode using this theory. This theory forecasts the probability of choice of transportation mode based on the theory of maximizing utility about the preference of companies, rather than does statistics and analysis on existing data simply. 3.1 Model We define the utility function by linear equation:
ininV ε+=inU
ininKKinin xxx εθθθ ++++= ...2211 nAi∈ (1) n : denote shippers or carriers;
inU : the utility function of ; n
inX : the factors observed;
inV : the representative components of the utility of i;
inA : the universal set of alternative of n ;
inε : disturbances;
Kθ : unknown parameters ,.....2,1=k . 3.2 The Choice of Characteristic Variable
Proceedings of the Eastern Asia Society for Transportation Studies, Vol. 5, pp. 16 - 31, 2005
20
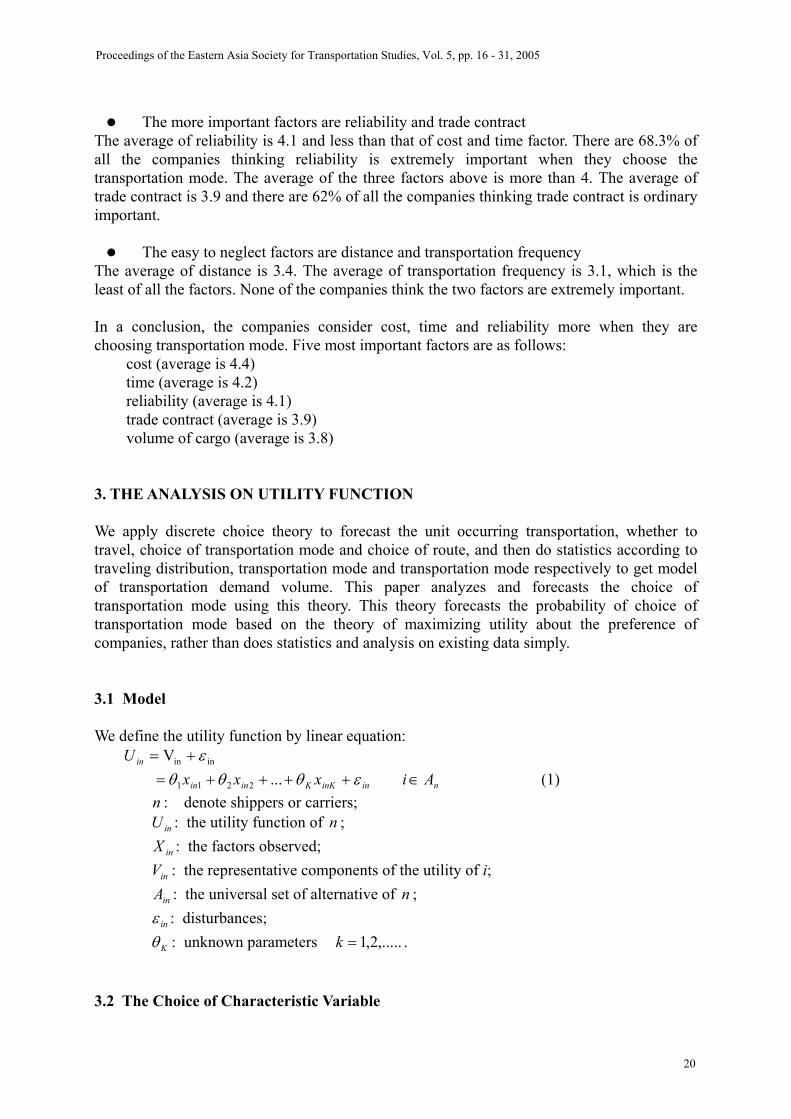
We will mostly review the characteristics of different transportation mode for different shippers and carriers. We suppose other characteristic of transportation mode nearly satisfy the shippers and carriers and bring the influence of shippers and carriers’ appraisal on transportation to inherent constant of alternative and alterable utility item. Characteristic variable can be divided into inherent constant of alternative (0 or 1) and characteristic variables as table 2 shows. Some factors are hardly to be quantified such as contract, reliability, obtainable factor and accessibility, so we convert their original data to a binary choice (0 or 1) when we put them into the model. Because the shippers and carriers have different preferences for transporting different kinds of cargo, characteristic variables are different for different cargo type. The calculating result is in the Part 3.3.
inkX
Table 2. Choice of attribute of alternatives
Alternative Attribute of alternative Characteristic variable Constant of
alternative Cost Time Reliability The other factors
1inX 2inX 3inX 4inX 5inX 6inX ...
Highway 1 0 0 X1n4 X1n5
1,if consider the factor
0,not …
Waterway 0 1 0 X2n4 X2n5 1 or 0 … Railway 0 0 1 X3n4 X3n5 1 or 0 … Airway 0 0 0 X4n4 X4n5 1 or 0 … Unknown parameters 1θ 2θ 3θ 4θ 5θ 6θ
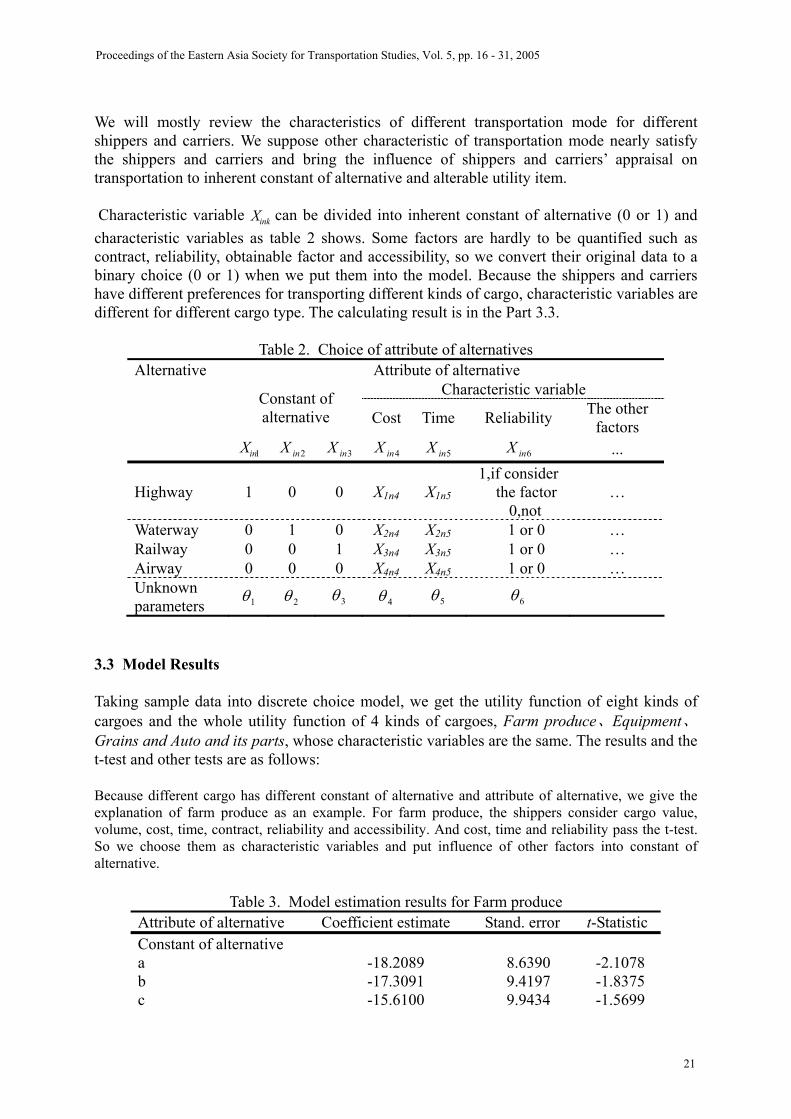
3.3 Model Results Taking sample data into discrete choice model, we get the utility function of eight kinds of cargoes and the whole utility function of 4 kinds of cargoes, Farm produce、Equipment、Grains and Auto and its parts, whose characteristic variables are the same. The results and the t-test and other tests are as follows: Because different cargo has different constant of alternative and attribute of alternative, we give the explanation of farm produce as an example. For farm produce, the shippers consider cargo value, volume, cost, time, contract, reliability and accessibility. And cost, time and reliability pass the t-test. So we choose them as characteristic variables and put influence of other factors into constant of alternative.
Table 3. Model estimation results for Farm produce Attribute of alternative Coefficient estimate Stand. error t-Statistic Constant of alternative a -18.2089 8.6390 -2.1078 b -17.3091 9.4197 -1.8375 c -15.6100 9.9434 -1.5699
Proceedings of the Eastern Asia Society for Transportation Studies, Vol. 5, pp. 16 - 31, 2005
21
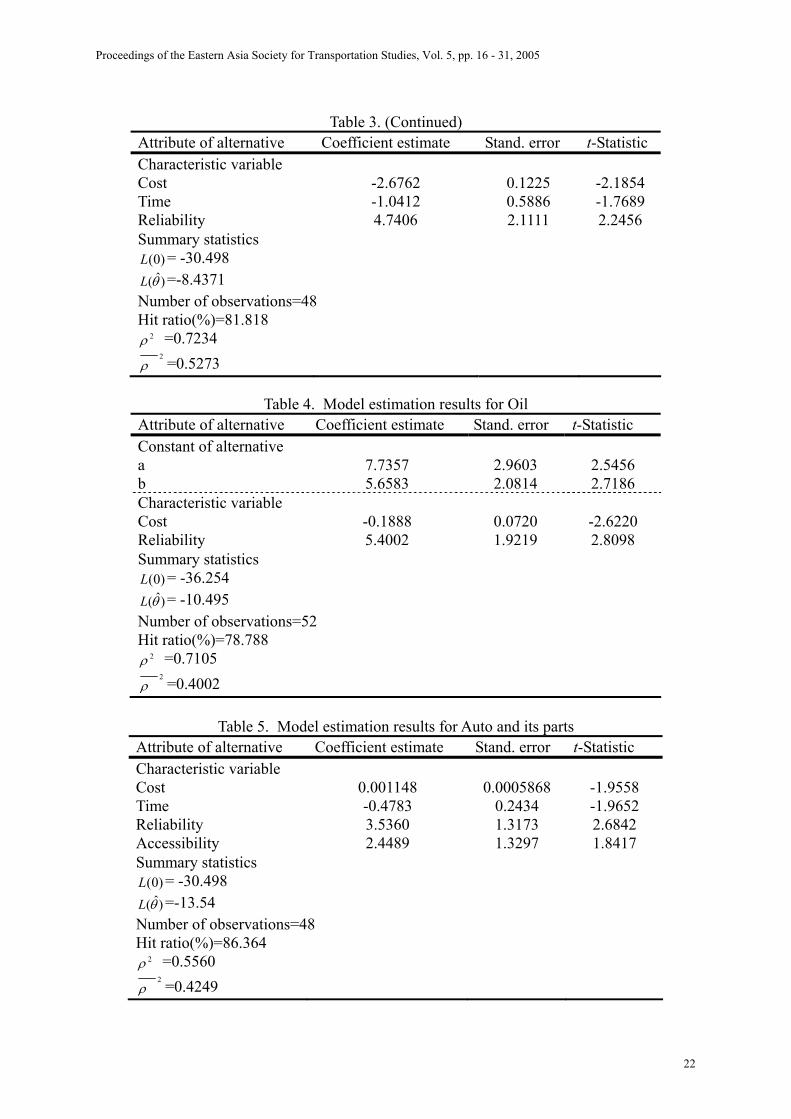
Table 3. (Continued)
Attribute of alternative Coefficient estimate Stand. error t-Statistic Characteristic variable Cost -2.6762 0.1225 -2.1854 Time -1.0412 0.5886 -1.7689 Reliability 4.7406 2.1111 2.2456 Summary statistics
)0(L = -30.498 )ˆ(θL =-8.4371
Number of observations=48 Hit ratio(%)=81.818
2ρ =0.7234 2
ρ =0.5273
Table 4. Model estimation results for Oil Attribute of alternative Coefficient estimate Stand. error t-Statistic Constant of alternative a 7.7357 2.9603 2.5456 b 5.6583 2.0814 2.7186 Characteristic variable Cost -0.1888 0.0720 -2.6220 Reliability 5.4002 1.9219 2.8098 Summary statistics
)0(L = -36.254 )ˆ(θL = -10.495
Number of observations=52 Hit ratio(%)=78.788
2ρ =0.7105 2
ρ =0.4002
Table 5. Model estimation results for Auto and its parts Attribute of alternative Coefficient estimate Stand. error t-Statistic Characteristic variable Cost 0.001148 0.0005868 -1.9558 Time -0.4783 0.2434 -1.9652 Reliability 3.5360 1.3173 2.6842 Accessibility 2.4489 1.3297 1.8417 Summary statistics
)0(L = -30.498 )ˆ(θL =-13.54
Number of observations=48 Hit ratio(%)=86.364
2ρ =0.5560 2
ρ =0.4249
Proceedings of the Eastern Asia Society for Transportation Studies, Vol. 5, pp. 16 - 31, 2005
22
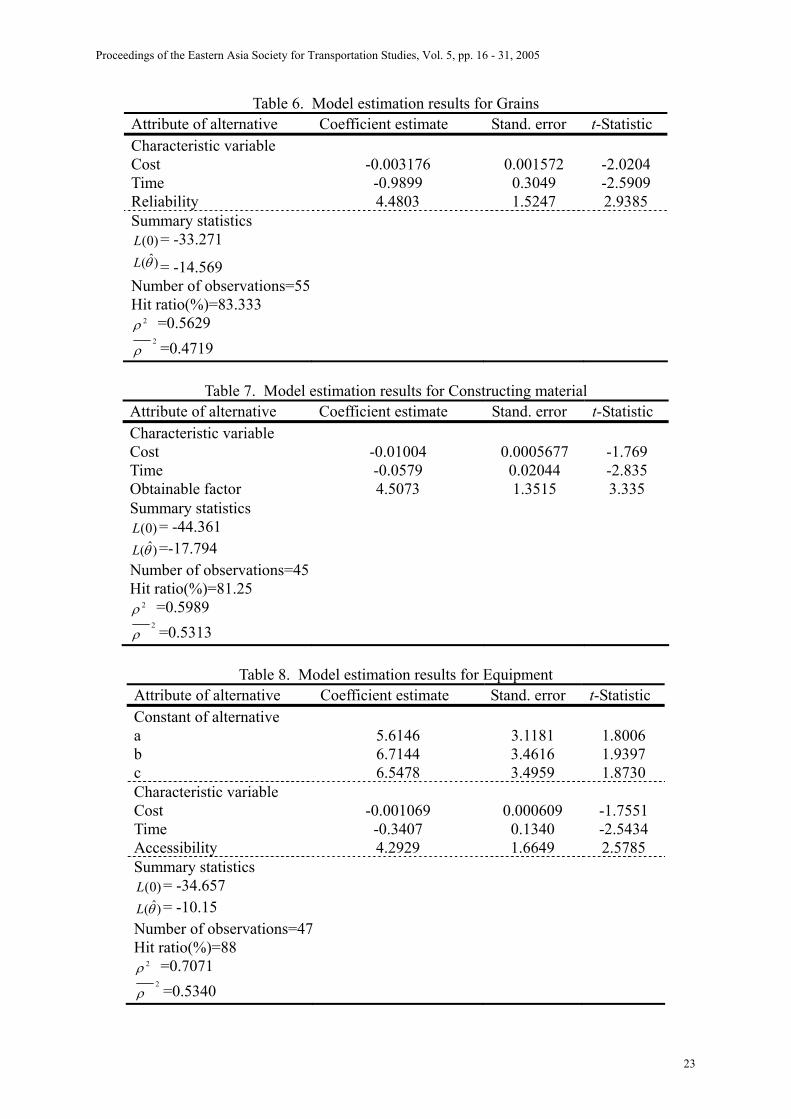
Table 6. Model estimation results for Grains Attribute of alternative Coefficient estimate Stand. error t-Statistic Characteristic variable Cost -0.003176 0.001572 -2.0204 Time -0.9899 0.3049 -2.5909 Reliability 4.4803 1.5247 2.9385 Summary statistics
)0(L = -33.271 )ˆ(θL = -14.569
Number of observations=55 Hit ratio(%)=83.333
2ρ =0.5629 2
ρ =0.4719
Table 7. Model estimation results for Constructing material Attribute of alternative Coefficient estimate Stand. error t-Statistic Characteristic variable Cost -0.01004 0.0005677 -1.769 Time -0.0579 0.02044 -2.835 Obtainable factor 4.5073 1.3515 3.335 Summary statistics
)0(L = -44.361 )ˆ(θL =-17.794
Number of observations=45 Hit ratio(%)=81.25
2ρ =0.5989 2
ρ =0.5313
Table 8. Model estimation results for Equipment
Attribute of alternative Coefficient estimate Stand. error t-Statistic Constant of alternative a 5.6146 3.1181 1.8006 b 6.7144 3.4616 1.9397 c 6.5478 3.4959 1.8730 Characteristic variable Cost -0.001069 0.000609 -1.7551 Time -0.3407 0.1340 -2.5434 Accessibility 4.2929 1.6649 2.5785 Summary statistics
)0(L = -34.657 )ˆ(θL = -10.15
Number of observations=47 Hit ratio(%)=88
2ρ =0.7071 2
ρ =0.5340
Proceedings of the Eastern Asia Society for Transportation Studies, Vol. 5, pp. 16 - 31, 2005
23
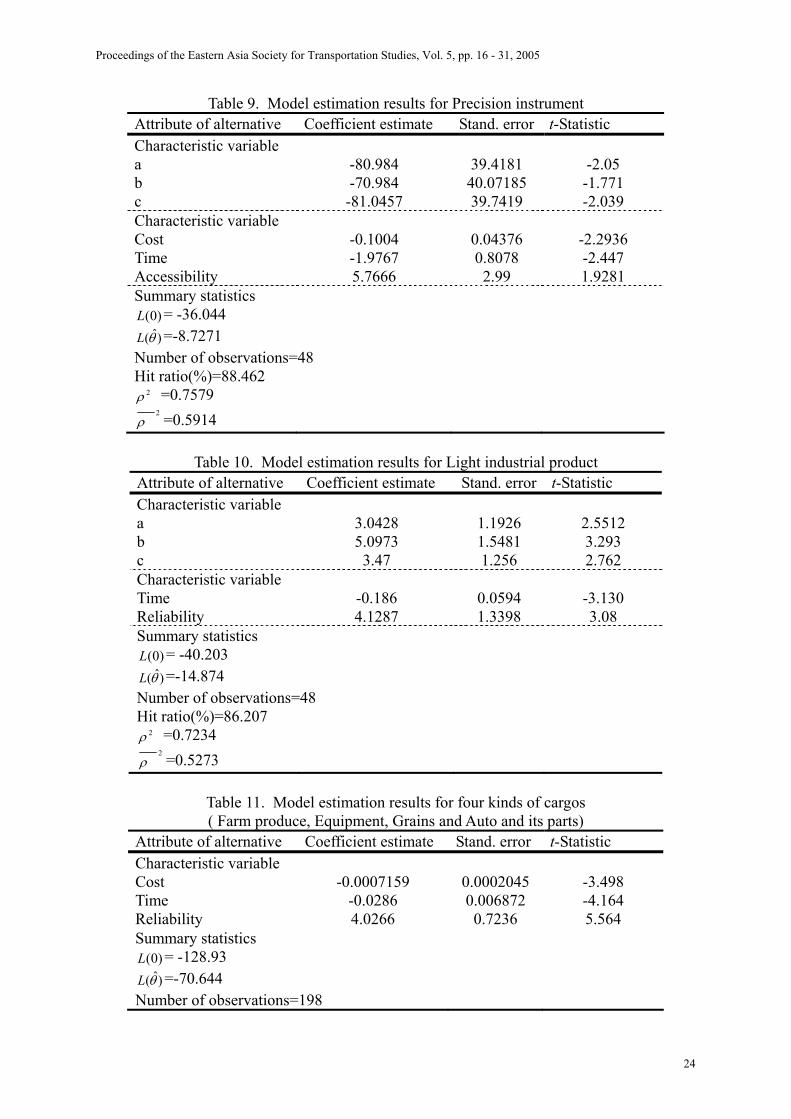
Table 9. Model estimation results for Precision instrument Attribute of alternative Coefficient estimate Stand. error t-Statistic Characteristic variable a -80.984 39.4181 -2.05 b -70.984 40.07185 -1.771 c -81.0457 39.7419 -2.039 Characteristic variable Cost -0.1004 0.04376 -2.2936 Time -1.9767 0.8078 -2.447 Accessibility 5.7666 2.99 1.9281 Summary statistics
)0(L = -36.044 )ˆ(θL =-8.7271
Number of observations=48 Hit ratio(%)=88.462
2ρ =0.7579 2
ρ =0.5914
Table 10. Model estimation results for Light industrial product Attribute of alternative Coefficient estimate Stand. error t-Statistic Characteristic variable a 3.0428 1.1926 2.5512 b 5.0973 1.5481 3.293 c 3.47 1.256 2.762 Characteristic variable Time -0.186 0.0594 -3.130 Reliability 4.1287 1.3398 3.08 Summary statistics
)0(L = -40.203 )ˆ(θL =-14.874
Number of observations=48 Hit ratio(%)=86.207
2ρ =0.7234 2
ρ =0.5273
Table 11. Model estimation results for four kinds of cargos ( Farm produce, Equipment, Grains and Auto and its parts)
Attribute of alternative Coefficient estimate Stand. error t-Statistic Characteristic variable Cost -0.0007159 0.0002045 -3.498 Time -0.0286 0.006872 -4.164 Reliability 4.0266 0.7236 5.564 Summary statistics
)0(L = -128.93 )ˆ(θL =-70.644
Number of observations=198
Proceedings of the Eastern Asia Society for Transportation Studies, Vol. 5, pp. 16 - 31, 2005
24
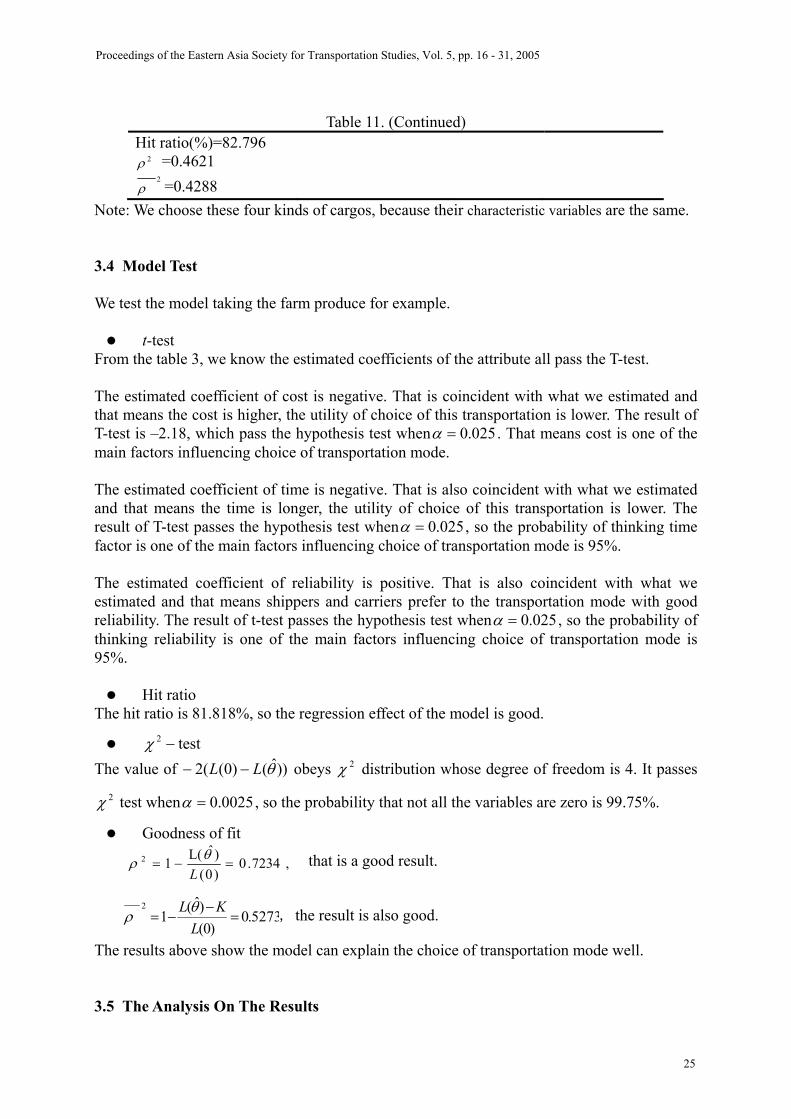
Table 11. (Continued)
Hit ratio(%)=82.796 2ρ =0.4621
2ρ =0.4288
Note: We choose these four kinds of cargos, because their characteristic variables are the same. 3.4 Model Test We test the model taking the farm produce for example.
t-test From the table 3, we know the estimated coefficients of the attribute all pass the T-test. The estimated coefficient of cost is negative. That is coincident with what we estimated and that means the cost is higher, the utility of choice of this transportation is lower. The result of T-test is –2.18, which pass the hypothesis test when 025.0=α . That means cost is one of the main factors influencing choice of transportation mode. The estimated coefficient of time is negative. That is also coincident with what we estimated and that means the time is longer, the utility of choice of this transportation is lower. The result of T-test passes the hypothesis test when 025.0=α , so the probability of thinking time factor is one of the main factors influencing choice of transportation mode is 95%. The estimated coefficient of reliability is positive. That is also coincident with what we estimated and that means shippers and carriers prefer to the transportation mode with good reliability. The result of t-test passes the hypothesis test when 025.0=α , so the probability of thinking reliability is one of the main factors influencing choice of transportation mode is 95%.
Hit ratio The hit ratio is 81.818%, so the regression effect of the model is good.
test2 −χThe value of obeys distribution whose degree of freedom is 4. It passes
test when
))ˆ()0((2 θLL −− 2χ
2χ 0025.0=α , so the probability that not all the variables are zero is 99.75%.
Goodness of fit
,7234.0)0()ˆL(12 =−=
Lθρ that is a good result.
5273.0)0(
)ˆ(12
=−
−=L
KL θρ , the result is also good.
The results above show the model can explain the choice of transportation mode well. 3.5 The Analysis On The Results
Proceedings of the Eastern Asia Society for Transportation Studies, Vol. 5, pp. 16 - 31, 2005
25
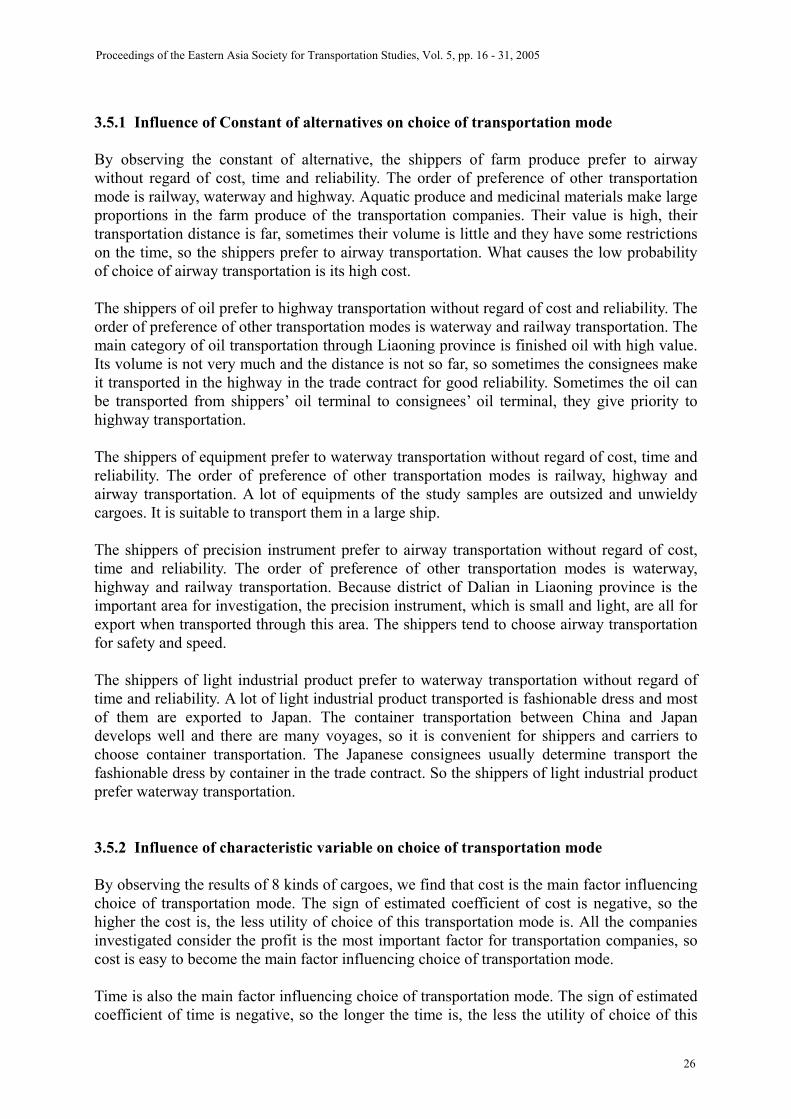
3.5.1 Influence of Constant of alternatives on choice of transportation mode By observing the constant of alternative, the shippers of farm produce prefer to airway without regard of cost, time and reliability. The order of preference of other transportation mode is railway, waterway and highway. Aquatic produce and medicinal materials make large proportions in the farm produce of the transportation companies. Their value is high, their transportation distance is far, sometimes their volume is little and they have some restrictions on the time, so the shippers prefer to airway transportation. What causes the low probability of choice of airway transportation is its high cost. The shippers of oil prefer to highway transportation without regard of cost and reliability. The order of preference of other transportation modes is waterway and railway transportation. The main category of oil transportation through Liaoning province is finished oil with high value. Its volume is not very much and the distance is not so far, so sometimes the consignees make it transported in the highway in the trade contract for good reliability. Sometimes the oil can be transported from shippers’ oil terminal to consignees’ oil terminal, they give priority to highway transportation. The shippers of equipment prefer to waterway transportation without regard of cost, time and reliability. The order of preference of other transportation modes is railway, highway and airway transportation. A lot of equipments of the study samples are outsized and unwieldy cargoes. It is suitable to transport them in a large ship. The shippers of precision instrument prefer to airway transportation without regard of cost, time and reliability. The order of preference of other transportation modes is waterway, highway and railway transportation. Because district of Dalian in Liaoning province is the important area for investigation, the precision instrument, which is small and light, are all for export when transported through this area. The shippers tend to choose airway transportation for safety and speed. The shippers of light industrial product prefer to waterway transportation without regard of time and reliability. A lot of light industrial product transported is fashionable dress and most of them are exported to Japan. The container transportation between China and Japan develops well and there are many voyages, so it is convenient for shippers and carriers to choose container transportation. The Japanese consignees usually determine transport the fashionable dress by container in the trade contract. So the shippers of light industrial product prefer waterway transportation. 3.5.2 Influence of characteristic variable on choice of transportation mode By observing the results of 8 kinds of cargoes, we find that cost is the main factor influencing choice of transportation mode. The sign of estimated coefficient of cost is negative, so the higher the cost is, the less utility of choice of this transportation mode is. All the companies investigated consider the profit is the most important factor for transportation companies, so cost is easy to become the main factor influencing choice of transportation mode. Time is also the main factor influencing choice of transportation mode. The sign of estimated coefficient of time is negative, so the longer the time is, the less the utility of choice of this
Proceedings of the Eastern Asia Society for Transportation Studies, Vol. 5, pp. 16 - 31, 2005
26
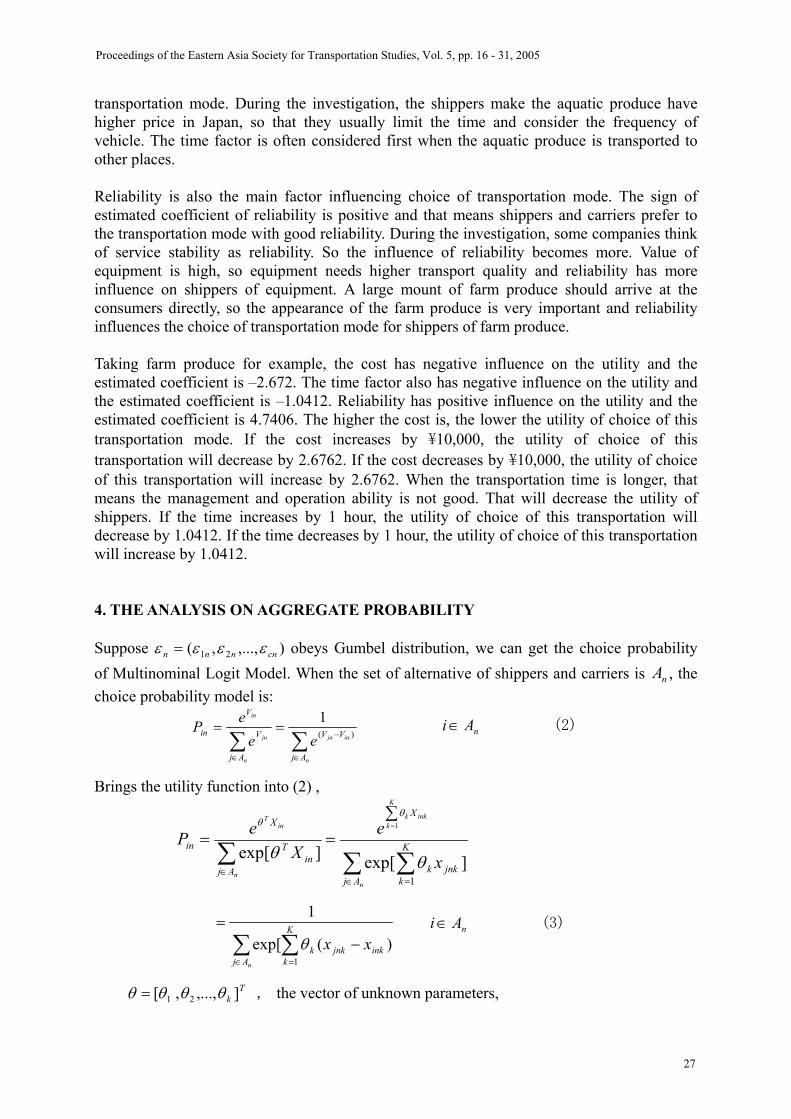
transportation mode. During the investigation, the shippers make the aquatic produce have higher price in Japan, so that they usually limit the time and consider the frequency of vehicle. The time factor is often considered first when the aquatic produce is transported to other places. Reliability is also the main factor influencing choice of transportation mode. The sign of estimated coefficient of reliability is positive and that means shippers and carriers prefer to the transportation mode with good reliability. During the investigation, some companies think of service stability as reliability. So the influence of reliability becomes more. Value of equipment is high, so equipment needs higher transport quality and reliability has more influence on shippers of equipment. A large mount of farm produce should arrive at the consumers directly, so the appearance of the farm produce is very important and reliability influences the choice of transportation mode for shippers of farm produce. Taking farm produce for example, the cost has negative influence on the utility and the estimated coefficient is –2.672. The time factor also has negative influence on the utility and the estimated coefficient is –1.0412. Reliability has positive influence on the utility and the estimated coefficient is 4.7406. The higher the cost is, the lower the utility of choice of this transportation mode. If the cost increases by ¥10,000, the utility of choice of this transportation will decrease by 2.6762. If the cost decreases by ¥10,000, the utility of choice of this transportation will increase by 2.6762. When the transportation time is longer, that means the management and operation ability is not good. That will decrease the utility of shippers. If the time increases by 1 hour, the utility of choice of this transportation will decrease by 1.0412. If the time decreases by 1 hour, the utility of choice of this transportation will increase by 1.0412. 4. THE ANALYSIS ON AGGREGATE PROBABILITY Suppose ),...,,( 21 cnnnn εεεε = obeys Gumbel distribution, we can get the choice probability of Multinominal Logit Model. When the set of alternative of shippers and carriers is , the choice probability model is:
nA
∑∑∈
−
∈
==
n
injn
n
jn
in
Aj
VV
Aj
V
V
inee
eP )(
1 nAi∈ (2)
Brings the utility function into (2) ,
∑ ∑∑∈ =
∈
∑==
=
n
K
kinkk
n
inT
Aj
K
kjnkk
X
Ajin
T
X
in
x
eX
eP]exp[]exp[
1
1
θθ
θθ
∑ ∑∈ =
−=
nAj
K
kinkjnkk xx
1)(exp[
1
θ nAi∈ (3)
Tk ],...,,[ 21 θθθθ = , the vector of unknown parameters,
Proceedings of the Eastern Asia Society for Transportation Studies, Vol. 5, pp. 16 - 31, 2005
27
],...,,...,[ 1 inKinkinin xxxX = , the vector of attribute of alternative.
Aggregate forecast is to sum and forecast the result of disaggregate behavior model. If N
denotes the number of aggregate objects and i denotes alternative, the average probability of
the aggregate object choosing i is:
∑=
=N
nini P
NP
1
1 (4)
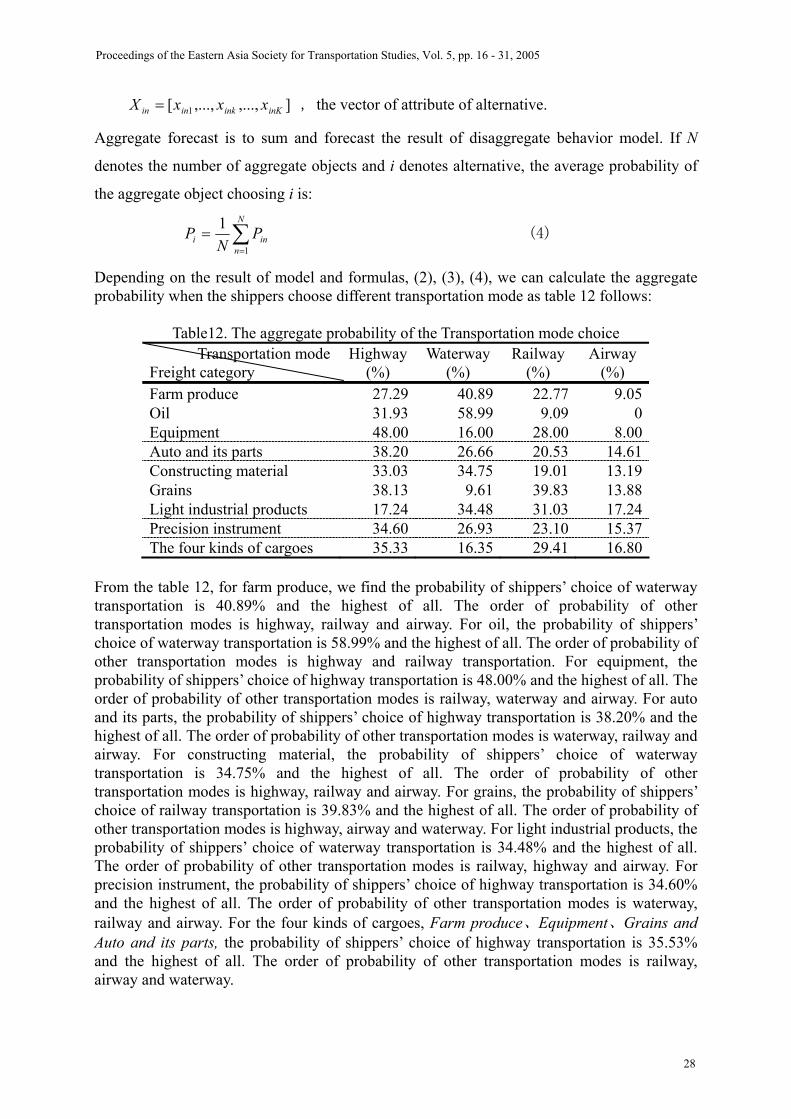
Depending on the result of model and formulas, (2), (3), (4), we can calculate the aggregate probability when the shippers choose different transportation mode as table 12 follows:
Table12. The aggregate probability of the Transportation mode choice Transportation mode
Freight category Highway
(%) Waterway
(%) Railway
(%) Airway
(%) Farm produce 27.29 40.89 22.77 9.05 Oil 31.93 58.99 9.09 0 Equipment 48.00 16.00 28.00 8.00 Auto and its parts 38.20 26.66 20.53 14.61 Constructing material 33.03 34.75 19.01 13.19 Grains 38.13 9.61 39.83 13.88 Light industrial products 17.24 34.48 31.03 17.24 Precision instrument 34.60 26.93 23.10 15.37 The four kinds of cargoes 35.33 16.35 29.41 16.80
From the table 12, for farm produce, we find the probability of shippers’ choice of waterway transportation is 40.89% and the highest of all. The order of probability of other transportation modes is highway, railway and airway. For oil, the probability of shippers’ choice of waterway transportation is 58.99% and the highest of all. The order of probability of other transportation modes is highway and railway transportation. For equipment, the probability of shippers’ choice of highway transportation is 48.00% and the highest of all. The order of probability of other transportation modes is railway, waterway and airway. For auto and its parts, the probability of shippers’ choice of highway transportation is 38.20% and the highest of all. The order of probability of other transportation modes is waterway, railway and airway. For constructing material, the probability of shippers’ choice of waterway transportation is 34.75% and the highest of all. The order of probability of other transportation modes is highway, railway and airway. For grains, the probability of shippers’ choice of railway transportation is 39.83% and the highest of all. The order of probability of other transportation modes is highway, airway and waterway. For light industrial products, the probability of shippers’ choice of waterway transportation is 34.48% and the highest of all. The order of probability of other transportation modes is railway, highway and airway. For precision instrument, the probability of shippers’ choice of highway transportation is 34.60% and the highest of all. The order of probability of other transportation modes is waterway, railway and airway. For the four kinds of cargoes, Farm produce、Equipment、Grains and Auto and its parts, the probability of shippers’ choice of highway transportation is 35.53% and the highest of all. The order of probability of other transportation modes is railway, airway and waterway.
Proceedings of the Eastern Asia Society for Transportation Studies, Vol. 5, pp. 16 - 31, 2005
28
5. THE ANALYSIS ON ELASTICITY A disaggregate elasticity represents the responsiveness of an individual’s choice probability to a change in the value of some attribute. The simplest case is the elasticity of the probability of an individual choosing alternative i with respect to a change in some attribute that is an independent variable in the model, namely one of the k ’s. In this case the direct elasticity of logit is given b
inxy
kinknink
n
n
ink
ink
niPx xiP
xiP
iPx
xiP
E n
jnkθ)](1[
ln)(ln
)()()( −=
∂∂
=⋅∂∂
= (5)
The disaggregate cross elasticity of the probability alternative i that is selected with respect to an attribute of alternative is j
kjnknjnk
niPx xjP
xiP
E n
jnkθ)(
ln)(ln)( −=
∂∂
= , for ij ≠ . (6)
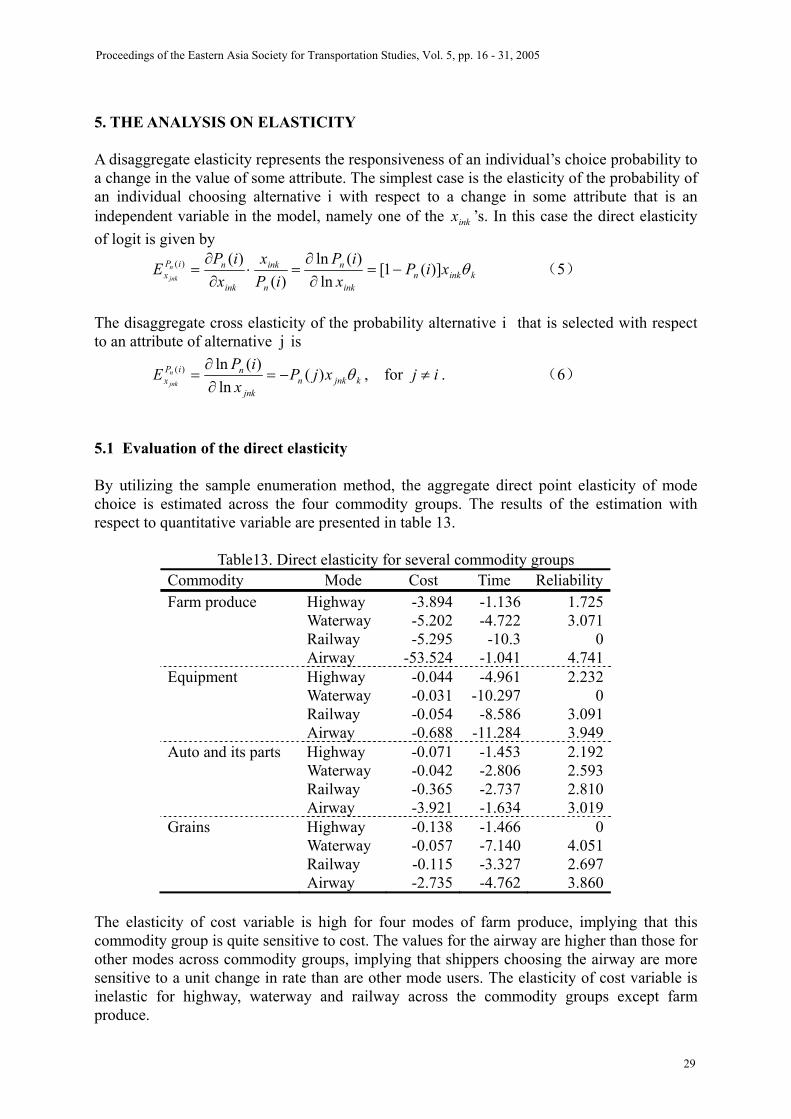
5.1 Evaluation of the direct elasticity By utilizing the sample enumeration method, the aggregate direct point elasticity of mode choice is estimated across the four commodity groups. The results of the estimation with respect to quantitative variable are presented in table 13.
Table13. Direct elasticity for several commodity groups Commodity Mode Cost Time Reliability Farm produce Highway -3.894 -1.136 1.725 Waterway -5.202 -4.722 3.071 Railway -5.295 -10.3 0 Airway -53.524 -1.041 4.741 Equipment Highway -0.044 -4.961 2.232 Waterway -0.031 -10.297 0 Railway -0.054 -8.586 3.091 Airway -0.688 -11.284 3.949 Auto and its parts Highway -0.071 -1.453 2.192 Waterway -0.042 -2.806 2.593 Railway -0.365 -2.737 2.810 Airway -3.921 -1.634 3.019 Grains Highway -0.138 -1.466 0 Waterway -0.057 -7.140 4.051 Railway -0.115 -3.327 2.697 Airway -2.735 -4.762 3.860
The elasticity of cost variable is high for four modes of farm produce, implying that this commodity group is quite sensitive to cost. The values for the airway are higher than those for other modes across commodity groups, implying that shippers choosing the airway are more sensitive to a unit change in rate than are other mode users. The elasticity of cost variable is inelastic for highway, waterway and railway across the commodity groups except farm produce.
Proceedings of the Eastern Asia Society for Transportation Studies, Vol. 5, pp. 16 - 31, 2005
29
As to elasticity for time variable, this variable of auto and grains has considerable influence on waterway users and that of equipment and grains influence airway users greatly. The elasticity of time variable is high for four transportation modes of equipment, implying that this commodity group is quite sensitive to time. The elasticity of reliability variable is high for four transportation modes of auto and for waterway, railway and airway of grains, implying that these commodity groups are quite sensitive to reliability. This variable is highly elastic for four transportation modes across the commodity groups. Consequently, the results of direct elasticity indicate that time exert the greatest influence on the shippers’ mode choice response for the four commodity groups for four modes; cost and reliability have less influence for four modes. 5.2 Evaluation of the disaggregate cross elasticity We choose equipment to calculate disaggregate cross elasticity. The cross elasticity of the probability of choice of waterway, railway and airway is 0.041 relative to the cost of highway transportation, 4.5788 relative to the time factor of highway, -2.06 relative to the reliability of highway. The cross elasticity of the probability of choice of highway, railway and airway is 0.006 relative to the cost of waterway transportation, 1.97 relative to the time factor of waterway, 0 relative to the reliability of waterway. The cross elasticity of the probability of choice of highway, waterway and airway is 0.021 relative to the cost of railway transportation, 3.34 relative to the time factor of railway, -1.202 relative to the reliability of highway. The cross elasticity of the probability of choice of highway, waterway and railway is 0.06 relative to the cost of airway transportation, 0.98 relative to the time factor of airway, -0.3434 relative to the reliability of airway. From the calculation above, as for equipment, the positive cross elasticity of the probability of choice of waterway, railway and airway is the highest of all relative to the time factor of highway. That means the time of highway transportation increases by 1% will cause the probability of choice of waterway, railway and airway transportation increases by 4.58% and the highway transportation can be substituted easily on time factor. The negative cross elasticity of the probability of choice of waterway, railway and airway is the highest of all relative to the reliability of highway. That means the reliability of highway transportation increases by 1% will cause the probability of choice of waterway, railway and airway transportation decreases by 2.06% and the highway transportation has good complement to other transportation modes on reliability. The cross elasticity of the probability of choice of highway, railway and airway is 0 relative to the reliability of waterway, so as for reliability, waterway transportation have no substitution and complement for other transportation modes. 6. CONCLUSION This paper studies the characteristic of choice of transportation mode using discrete choice model. We get shippers and carriers’ transportation utility functions and they pass the tests. And then we calculate aggregate probability, direct elasticity and indirect elasticity. The result accords with the characteristic of shippers and carriers’ choice of transportation mode, so discrete choice model has good applicability in choice of transportation mode. We estimate
Proceedings of the Eastern Asia Society for Transportation Studies, Vol. 5, pp. 16 - 31, 2005
30
the trend of choice of transportation mode by the analysis on aggregate probability. We know how much the factors influence the choice of transportation mode by calculating direct elasticity. We calculated the cross elasticity, when the characteristic variables, cost, time, reliability change, we can forecast the change of choice of transportation mode. By comparing elasticity of choice of transportation mode, we can choose some shippers or carriers whose elasticity is higher for special analysis, make sure the direction of choice of transportation mode and find out the trend of choice of transportation mode as a whole for optimal utilization of the social transportation resource. The unit which occurs on activity is taken as the study unit of discrete choice model. According to our investigation and calculation and the difference of factors influencing the preference of shippers and carriers, we sum up three main factors, cost, time and reliability. So we bring these main factors into model. Though the average of some factors is not high, sometimes they determine the choice of transportation mode, such as cargo volume and value. Some cargoes with high value in volume or weight unit and the volume of them is not much, so only airway transportation is suitable for these cargoes for fast arrival and less accident. The bulk cargoes such as oil, grains and constructing material, are fit for waterway transportation for large load, efficient loading and unloading and cheap package and transportation cost. We will continue our study on how to bring these factors into model.
REFERENCES Lu, H. (1998) The Theory and Method of Traffic Planning. Tsinghua University Press, Beijing, China. Ben-Akiva, M.E. and Lerman S.R. (1997) Discrete Choice Analysis: Theory and Application to Travel Demand, the MIT press Cambridge, Massachusetts, USA. Nam, Ki-chan. (1997) A study on the estimation and aggregation of disaggregate models of mode choice for freight transport, Transportation Research-E, Vol. 33, No. 3, 223-231. Kockelman, K. M., Krishnamurthy, Sriram. (2004) A new approach for travel demand modeling: LinkingRoy’s Identity to discrete choice, Transportation Research Part B 38, 459-475. Jin, A. (1997) The research on model and application of transportation mode choice, Highway and Transportation in Inner Mongolia, No.50, 33-35. Tiwari. P. (2003) Shipper’s port and carrier selection behavior in china: A discrete choice analysis, Maritime Economics and Logistics, 2003,5, 23-29. Maier, G.. (2002) Modeling preferences and stability among transport alternatives, Transport Research Part E,No.38, 319-334.
Proceedings of the Eastern Asia Society for Transportation Studies, Vol. 5, pp. 16 - 31, 2005
31


![Vns fashion logistics [compatibility mode]](https://img.pdfslide.us/doc/110x75/555c6d98d8b42ab6748b556c/vns-fashion-logistics-compatibility-mode.jpg)


![2008 brokerage 06 multimodal logistics [compatibility mode]](https://img.pdfslide.us/doc/110x75/58f3252d1a28ab07378b45db/2008-brokerage-06-multimodal-logistics-compatibility-mode-58f7a8b05b9ce.jpg)