Embed Size (px)
Citation preview
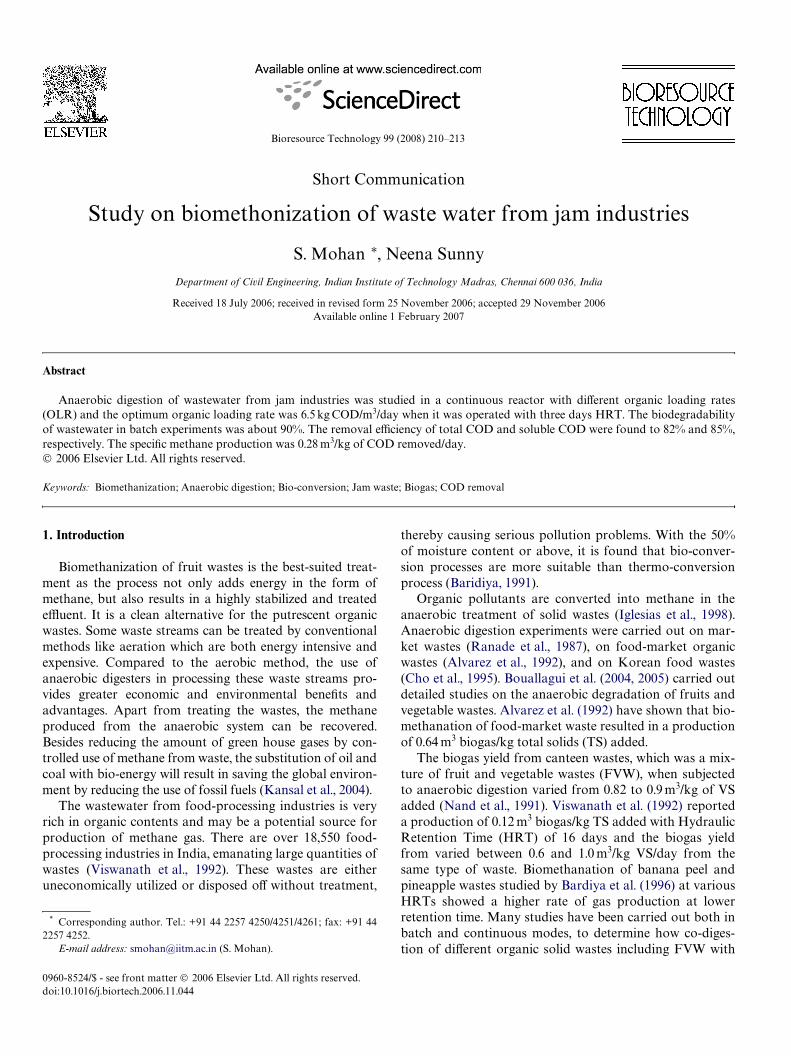
Bioresource Technology 99 (2008) 210–213
Short Communication
Study on biomethonization of waste water from jam industries
S. Mohan ¤, Neena Sunny
Department of Civil Engineering, Indian Institute of Technology Madras, Chennai 600 036, India
Received 18 July 2006; received in revised form 25 November 2006; accepted 29 November 2006Available online 1 February 2007
Abstract
Anaerobic digestion of wastewater from jam industries was studied in a continuous reactor with diVerent organic loading rates(OLR) and the optimum organic loading rate was 6.5 kg COD/m3/day when it was operated with three days HRT. The biodegradabilityof wastewater in batch experiments was about 90%. The removal eYciency of total COD and soluble COD were found to 82% and 85%,respectively. The speciWc methane production was 0.28 m3/kg of COD removed/day.© 2006 Elsevier Ltd. All rights reserved.
Keywords: Biomethanization; Anaerobic digestion; Bio-conversion; Jam waste; Biogas; COD removal
1. Introduction thereby causing serious pollution problems. With the 50%
Biomethanization of fruit wastes is the best-suited treat-ment as the process not only adds energy in the form ofmethane, but also results in a highly stabilized and treatedeZuent. It is a clean alternative for the putrescent organicwastes. Some waste streams can be treated by conventionalmethods like aeration which are both energy intensive andexpensive. Compared to the aerobic method, the use ofanaerobic digesters in processing these waste streams pro-vides greater economic and environmental beneWts andadvantages. Apart from treating the wastes, the methaneproduced from the anaerobic system can be recovered.Besides reducing the amount of green house gases by con-trolled use of methane from waste, the substitution of oil andcoal with bio-energy will result in saving the global environ-ment by reducing the use of fossil fuels (Kansal et al., 2004).
The wastewater from food-processing industries is veryrich in organic contents and may be a potential source forproduction of methane gas. There are over 18,550 food-processing industries in India, emanating large quantities ofwastes (Viswanath et al., 1992). These wastes are eitheruneconomically utilized or disposed oV without treatment,
* Corresponding author. Tel.: +91 44 2257 4250/4251/4261; fax: +91 442257 4252.
E-mail address: [email protected] (S. Mohan).
0960-8524/$ - see front matter © 2006 Elsevier Ltd. All rights reserved.doi:10.1016/j.biortech.2006.11.044
of moisture content or above, it is found that bio-conver-sion processes are more suitable than thermo-conversionprocess (Baridiya, 1991).
Organic pollutants are converted into methane in theanaerobic treatment of solid wastes (Iglesias et al., 1998).Anaerobic digestion experiments were carried out on mar-ket wastes (Ranade et al., 1987), on food-market organicwastes (Alvarez et al., 1992), and on Korean food wastes(Cho et al., 1995). Bouallagui et al. (2004, 2005) carried outdetailed studies on the anaerobic degradation of fruits andvegetable wastes. Alvarez et al. (1992) have shown that bio-methanation of food-market waste resulted in a productionof 0.64 m3 biogas/kg total solids (TS) added.
The biogas yield from canteen wastes, which was a mix-ture of fruit and vegetable wastes (FVW), when subjectedto anaerobic digestion varied from 0.82 to 0.9 m3/kg of VSadded (Nand et al., 1991). Viswanath et al. (1992) reporteda production of 0.12 m3 biogas/kg TS added with HydraulicRetention Time (HRT) of 16 days and the biogas yieldfrom varied between 0.6 and 1.0 m3/kg VS/day from thesame type of waste. Biomethanation of banana peel andpineapple wastes studied by Bardiya et al. (1996) at variousHRTs showed a higher rate of gas production at lowerretention time. Many studies have been carried out both inbatch and continuous modes, to determine how co-diges-tion of diVerent organic solid wastes including FVW with
S. Mohan, N. Sunny / Bioresource Technology 99 (2008) 210–213 211
cattle slurry can improve the eYciency of degradation (Cal-laghan et al., 1999, 2002). The present study was intended toassess the biogas potential of wastewater from Jam indus-tries in terms of waste stabilization eYciency and net energyrecovery.
2. Methods
Batch experiments were carried out in four identicalreactors of 2-l capacity each with liquid displacement sys-tem for biogas collection. Three equally spaced ports weredesigned along the height of the reaction zone. The bottlewas made air tight with a rubber stopper through which agas collection tube passed. The other end of the tube wasconnected to a bottle, which was Wlled with alkali solution(2 N KOH). The reactor was mounted on a magnetic stirrer(2 MLH) for mixing.
For the continuous study, the cylindrical shape reactor(two litre capacity) was used. Sludge zone and gas phasewere designed to have 10% of the eVective volume each.Feeding was done from the bottom with a peristaltic pumpand withdrawal of sample was made from the top of thereactor. Mixing was carried out using magnetic stirrer.Feeding rate was adjusted based on the HRT and OLR,both in continuous mode and semi-continuous mode usingthe peristaltic pump. During the operation, each OLR wasmaintained until a steady state was attained.
2.1. Analysis
Samples were withdrawn when the steady state wasreached. Parameters like pH, moisture content, solid con-tents in terms of total solids (TS), volatile solids (VS), totalsuspended solids (TSS) and volatile suspended solids (VSS),Chemical Oxygen Demand (COD), Volatile Fatty Acid(VFA), and Alkalinity were analyzed following the meth-ods prescribed by using APHA (1998). Total KjeldahlNitrogen (TKN) was measured by macro Kjeldahl method(APHA, 1998).
3. Results and discussion
Anaerobic sludge seed for the digestion study was col-lected from an existing Up-Xow Anaerobic Sludge Blanket(UASB) reactor. The sludge was taken from the bottomportion of the UASB reactor of 12.5 m3 capacity. The pH ofthe sludge was in the range of 6.63–6.61, while the moisturecontent, TS, VS, TSS, VSS and alkalinity were 83.8%, 162,106, 110.5, 53 and 4.5 g/l, respectively. The average moisturecontent of the waste was about 96.5%. The pH, TS, VS,COD and BOD concentrations varied from 3.2–4.3, 2.5–3.5%, 2.3–2.4%, 19.2–26.8 g/l, and 13.89–21.7 g/l, respectively.
3.1. Batch reactor
In the biodegradability study, COD is one of the criticalparameters to determine the treatment eYciency of
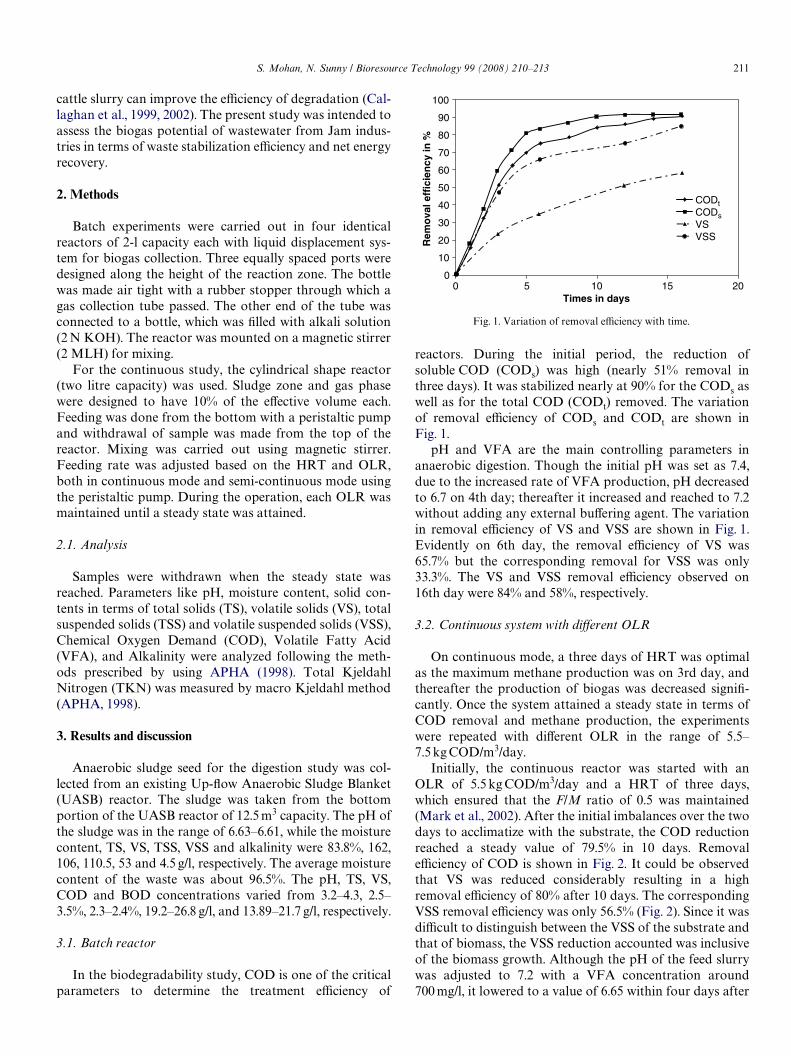
reactors. During the initial period, the reduction ofsoluble COD (CODs) was high (nearly 51% removal inthree days). It was stabilized nearly at 90% for the CODs aswell as for the total COD (CODt) removed. The variationof removal eYciency of CODs and CODt are shown inFig. 1.
pH and VFA are the main controlling parameters inanaerobic digestion. Though the initial pH was set as 7.4,due to the increased rate of VFA production, pH decreasedto 6.7 on 4th day; thereafter it increased and reached to 7.2without adding any external buVering agent. The variationin removal eYciency of VS and VSS are shown in Fig. 1.Evidently on 6th day, the removal eYciency of VS was65.7% but the corresponding removal for VSS was only33.3%. The VS and VSS removal eYciency observed on16th day were 84% and 58%, respectively.
3.2. Continuous system with diVerent OLR
On continuous mode, a three days of HRT was optimalas the maximum methane production was on 3rd day, andthereafter the production of biogas was decreased signiW-cantly. Once the system attained a steady state in terms ofCOD removal and methane production, the experimentswere repeated with diVerent OLR in the range of 5.5–7.5 kg COD/m3/day.
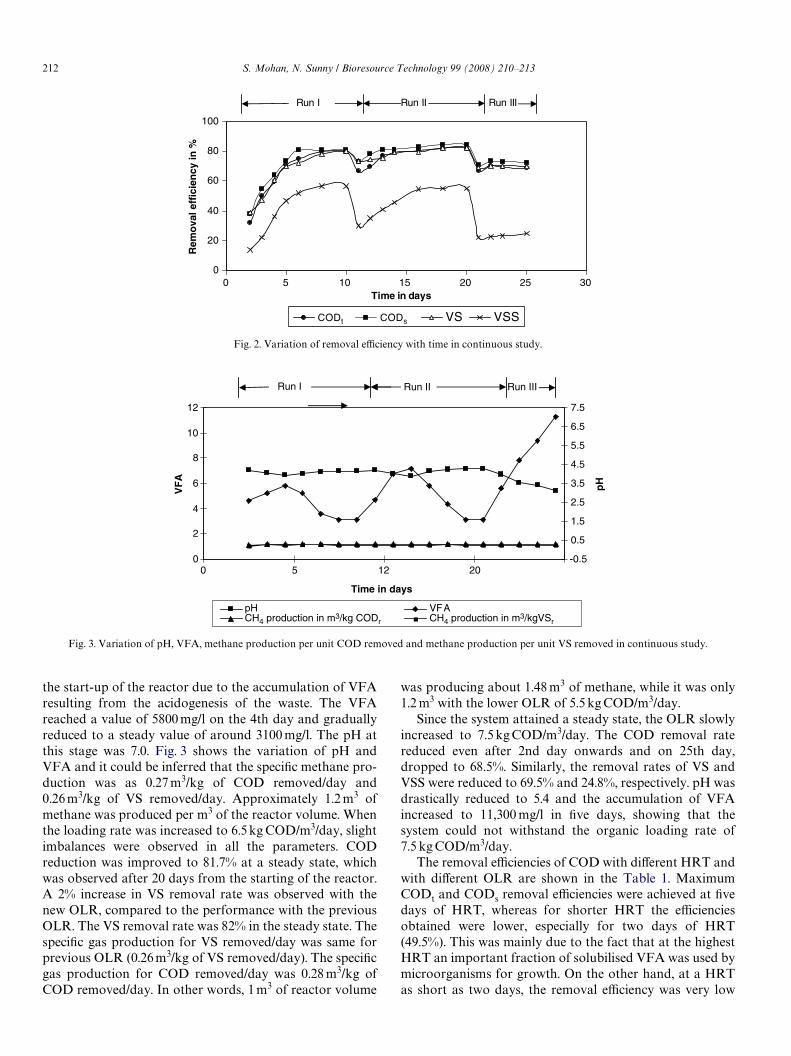
Initially, the continuous reactor was started with anOLR of 5.5 kg COD/m3/day and a HRT of three days,which ensured that the F/M ratio of 0.5 was maintained(Mark et al., 2002). After the initial imbalances over the twodays to acclimatize with the substrate, the COD reductionreached a steady value of 79.5% in 10 days. RemovaleYciency of COD is shown in Fig. 2. It could be observedthat VS was reduced considerably resulting in a highremoval eYciency of 80% after 10 days. The correspondingVSS removal eYciency was only 56.5% (Fig. 2). Since it wasdiYcult to distinguish between the VSS of the substrate andthat of biomass, the VSS reduction accounted was inclusiveof the biomass growth. Although the pH of the feed slurrywas adjusted to 7.2 with a VFA concentration around700 mg/l, it lowered to a value of 6.65 within four days after
Fig. 1. Variation of removal eYciency with time.
0
10
20
30
40
50
60
70
80
90
100
0 5 10 15 20Times in days
Rem
ova
l eff
icie
ncy
in %
CODtCODsVSVSS
212 S. Mohan, N. Sunny / Bioresource Technology 99 (2008) 210–213
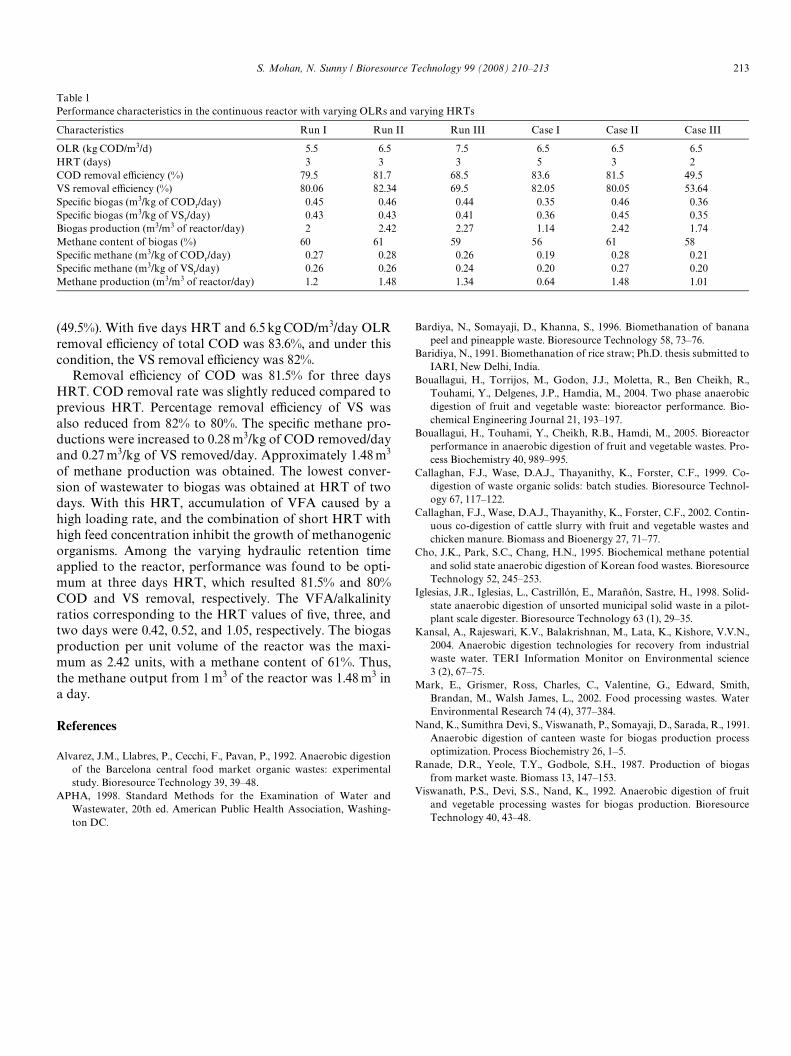
the start-up of the reactor due to the accumulation of VFAresulting from the acidogenesis of the waste. The VFAreached a value of 5800 mg/l on the 4th day and graduallyreduced to a steady value of around 3100 mg/l. The pH atthis stage was 7.0. Fig. 3 shows the variation of pH andVFA and it could be inferred that the speciWc methane pro-duction was as 0.27 m3/kg of COD removed/day and0.26 m3/kg of VS removed/day. Approximately 1.2 m3 ofmethane was produced per m3 of the reactor volume. Whenthe loading rate was increased to 6.5 kg COD/m3/day, slightimbalances were observed in all the parameters. CODreduction was improved to 81.7% at a steady state, whichwas observed after 20 days from the starting of the reactor.A 2% increase in VS removal rate was observed with thenew OLR, compared to the performance with the previousOLR. The VS removal rate was 82% in the steady state. ThespeciWc gas production for VS removed/day was same forprevious OLR (0.26 m3/kg of VS removed/day). The speciWcgas production for COD removed/day was 0.28 m3/kg ofCOD removed/day. In other words, 1 m3 of reactor volume
was producing about 1.48 m3 of methane, while it was only1.2 m3 with the lower OLR of 5.5 kg COD/m3/day.
Since the system attained a steady state, the OLR slowlyincreased to 7.5 kg COD/m3/day. The COD removal ratereduced even after 2nd day onwards and on 25th day,dropped to 68.5%. Similarly, the removal rates of VS andVSS were reduced to 69.5% and 24.8%, respectively. pH wasdrastically reduced to 5.4 and the accumulation of VFAincreased to 11,300 mg/l in Wve days, showing that thesystem could not withstand the organic loading rate of7.5 kg COD/m3/day.
The removal eYciencies of COD with diVerent HRT andwith diVerent OLR are shown in the Table 1. MaximumCODt and CODs removal eYciencies were achieved at Wvedays of HRT, whereas for shorter HRT the eYcienciesobtained were lower, especially for two days of HRT(49.5%). This was mainly due to the fact that at the highestHRT an important fraction of solubilised VFA was used bymicroorganisms for growth. On the other hand, at a HRTas short as two days, the removal eYciency was very low
Fig. 2. Variation of removal eYciency with time in continuous study.
Run I Run II Run III
0
20
40
60
80
100
0 5 10 15 20 25 30Time in days
Rem
ova
l eff
icie
ncy
in %
CODt CODs VS VSS
Fig. 3. Variation of pH, VFA, methane production per unit COD removed and methane production per unit VS removed in continuous study.
Run I Run II Run III
0
2
4
6
8
10
12
0 5 12 20
Time in days
VF
A
-0.5
0.5
1.5
2.5
3.5
4.5
5.5
6.5
7.5
pH
pH VFACH4 production in m3/kg CODr CH4 production in m3/kgVSr
S. Mohan, N. Sunny / Bioresource Technology 99 (2008) 210–213 213
(49.5%). With Wve days HRT and 6.5 kg COD/m3/day OLRremoval eYciency of total COD was 83.6%, and under thiscondition, the VS removal eYciency was 82%.
Removal eYciency of COD was 81.5% for three daysHRT. COD removal rate was slightly reduced compared toprevious HRT. Percentage removal eYciency of VS wasalso reduced from 82% to 80%. The speciWc methane pro-ductions were increased to 0.28 m3/kg of COD removed/dayand 0.27 m3/kg of VS removed/day. Approximately 1.48 m3
of methane production was obtained. The lowest conver-sion of wastewater to biogas was obtained at HRT of twodays. With this HRT, accumulation of VFA caused by ahigh loading rate, and the combination of short HRT withhigh feed concentration inhibit the growth of methanogenicorganisms. Among the varying hydraulic retention timeapplied to the reactor, performance was found to be opti-mum at three days HRT, which resulted 81.5% and 80%COD and VS removal, respectively. The VFA/alkalinityratios corresponding to the HRT values of Wve, three, andtwo days were 0.42, 0.52, and 1.05, respectively. The biogasproduction per unit volume of the reactor was the maxi-mum as 2.42 units, with a methane content of 61%. Thus,the methane output from 1 m3 of the reactor was 1.48 m3 ina day.
References
Alvarez, J.M., Llabres, P., Cecchi, F., Pavan, P., 1992. Anaerobic digestionof the Barcelona central food market organic wastes: experimentalstudy. Bioresource Technology 39, 39–48.
APHA, 1998. Standard Methods for the Examination of Water andWastewater, 20th ed. American Public Health Association, Washing-ton DC.
Bardiya, N., Somayaji, D., Khanna, S., 1996. Biomethanation of bananapeel and pineapple waste. Bioresource Technology 58, 73–76.
Baridiya, N., 1991. Biomethanation of rice straw; Ph.D. thesis submitted toIARI, New Delhi, India.
Bouallagui, H., Torrijos, M., Godon, J.J., Moletta, R., Ben Cheikh, R.,Touhami, Y., Delgenes, J.P., Hamdia, M., 2004. Two phase anaerobicdigestion of fruit and vegetable waste: bioreactor performance. Bio-chemical Engineering Journal 21, 193–197.
Bouallagui, H., Touhami, Y., Cheikh, R.B., Hamdi, M., 2005. Bioreactorperformance in anaerobic digestion of fruit and vegetable wastes. Pro-cess Biochemistry 40, 989–995.
Callaghan, F.J., Wase, D.A.J., Thayanithy, K., Forster, C.F., 1999. Co-digestion of waste organic solids: batch studies. Bioresource Technol-ogy 67, 117–122.
Callaghan, F.J., Wase, D.A.J., Thayanithy, K., Forster, C.F., 2002. Contin-uous co-digestion of cattle slurry with fruit and vegetable wastes andchicken manure. Biomass and Bioenergy 27, 71–77.
Cho, J.K., Park, S.C., Chang, H.N., 1995. Biochemical methane potentialand solid state anaerobic digestion of Korean food wastes. BioresourceTechnology 52, 245–253.
Iglesias, J.R., Iglesias, L., Castrillón, E., Marañón, Sastre, H., 1998. Solid-state anaerobic digestion of unsorted municipal solid waste in a pilot-plant scale digester. Bioresource Technology 63 (1), 29–35.
Kansal, A., Rajeswari, K.V., Balakrishnan, M., Lata, K., Kishore, V.V.N.,2004. Anaerobic digestion technologies for recovery from industrialwaste water. TERI Information Monitor on Environmental science3 (2), 67–75.
Mark, E., Grismer, Ross, Charles, C., Valentine, G., Edward, Smith,Brandan, M., Walsh James, L., 2002. Food processing wastes. WaterEnvironmental Research 74 (4), 377–384.
Nand, K., Sumithra Devi, S., Viswanath, P., Somayaji, D., Sarada, R., 1991.Anaerobic digestion of canteen waste for biogas production processoptimization. Process Biochemistry 26, 1–5.
Ranade, D.R., Yeole, T.Y., Godbole, S.H., 1987. Production of biogasfrom market waste. Biomass 13, 147–153.
Viswanath, P.S., Devi, S.S., Nand, K., 1992. Anaerobic digestion of fruitand vegetable processing wastes for biogas production. BioresourceTechnology 40, 43–48.
Table 1Performance characteristics in the continuous reactor with varying OLRs and varying HRTs
Characteristics Run I Run II Run III Case I Case II Case III
OLR (kg COD/m3/d) 5.5 6.5 7.5 6.5 6.5 6.5HRT (days) 3 3 3 5 3 2COD removal eYciency (%) 79.5 81.7 68.5 83.6 81.5 49.5VS removal eYciency (%) 80.06 82.34 69.5 82.05 80.05 53.64SpeciWc biogas (m3/kg of CODr/day) 0.45 0.46 0.44 0.35 0.46 0.36SpeciWc biogas (m3/kg of VSr/day) 0.43 0.43 0.41 0.36 0.45 0.35Biogas production (m3/m3 of reactor/day) 2 2.42 2.27 1.14 2.42 1.74Methane content of biogas (%) 60 61 59 56 61 58SpeciWc methane (m3/kg of CODr/day) 0.27 0.28 0.26 0.19 0.28 0.21SpeciWc methane (m3/kg of VSr/day) 0.26 0.26 0.24 0.20 0.27 0.20Methane production (m3/m3 of reactor/day) 1.2 1.48 1.34 0.64 1.48 1.01