Embed Size (px)
Citation preview
NASA CONTRACTOR
REPORT
LOAN COPY: RETUKI’\l TO AFWL (WLIL-2)
&IRTLANDAFB,N MEX
STUDY OF VIBRATION MEASUREMENT BY LASER METHODS
by Gail A. Massey . .
Prepared by
SYLVANIA ELECTRONIC SYSTEMS
Mountain View, Calif.
for Ames Research Center
NATIONAL AERONAUTICS AND SPACE ADMINISTRATION . WASHINGTON, D. C. . JANUARY 1968
https://ntrs.nasa.gov/search.jsp?R=19680004601 2018-05-14T14:25:03+00:00Z
- .
00b02L~ NASA CR-985 -
STUDY OF VIBRATION MEASUREMENT BY LASER METHODS
By Gail A. Massey
Distribution of this report is provided in the interest of information exchange. Responsibility for the contents re.sides in the author or organization that prepared it. .
Prepared under Contract No. NAS 2-3643 by SYLVANIA ELECTRONIC SYSTEMS
Mountain View, Calif.
for Ames Research Center
NATIONAL AERONAUTICS AND SPACE ADMINISTRATION
For sale by the Clearinghouse for Federal Scientific and Technical Information Springfield, Virginia 22151 - CFSTI price $3.00

TABLE OF CONTENTS
TITLE PAGE
SUMMARY
INTRODUCTION
INTERMEDIATE FREQUENCY OPTICAL HETERODYNE SYSTEM
General Analysis of Heterodyne Detection
Depth of Focus
Breadboard System
Laser
Diffraction Frequency Translator
Optical System
Mechanical System
Optical Signal Detection
Electronic Receivers
Experimental Results
' Spectrum Analyzer Tests
Limiter-Discriminator Tests
Tracking Receiver Tests
Additional Experimental Data
INTERFERENCE MAPPING
Analysis
Experimental Results
Surface Model
CONCLUSION
REFERENCES
APPENDIX A: PHOTOMIXING WITH DIFFUSELY REFLECTED LIGHT
vii 1
3
3
13
14
15
15
18
20
23
25
34
34
38
41
46
50
50
54
54
61
62
63
iii

LIST OF ILLUSTRATIONS
FIGURE TITLE PAGE
1.
2.
3.
4.
5.
6.
7.
8.
9.
10.
11.
12.
13.
14.
15.
16.
17.
1.8 .
19.
20.
21.
22.
Block Diagram, Intermediate Frequency System.
Schematic Diagram, Optical System.
Diffraction Frequency Translator.
Photograph, Optical System.
Photograph, Optical and Mechanical Systems.
Schematic Diagram, Limiter-Discriminator Receiver.
Block Diagram, Phase-Locked Loop.
Phase Detector Output.
Low Pass Loop Filter.
Schematic Diagram, Tracking Receiver.
Spectra From Aluminum Painted Model.
Mode Pattern Spectra, Aluminum Painted Surface.
Limiter-Discriminator Output.
Tracking Receiver Output.
Tracking Receiver Output Near Threshold.
Effect of Beam Dither.
Spectra With 2 kHz Beam Deflector.
Interference Displacement Mapping System.
Surface Model.
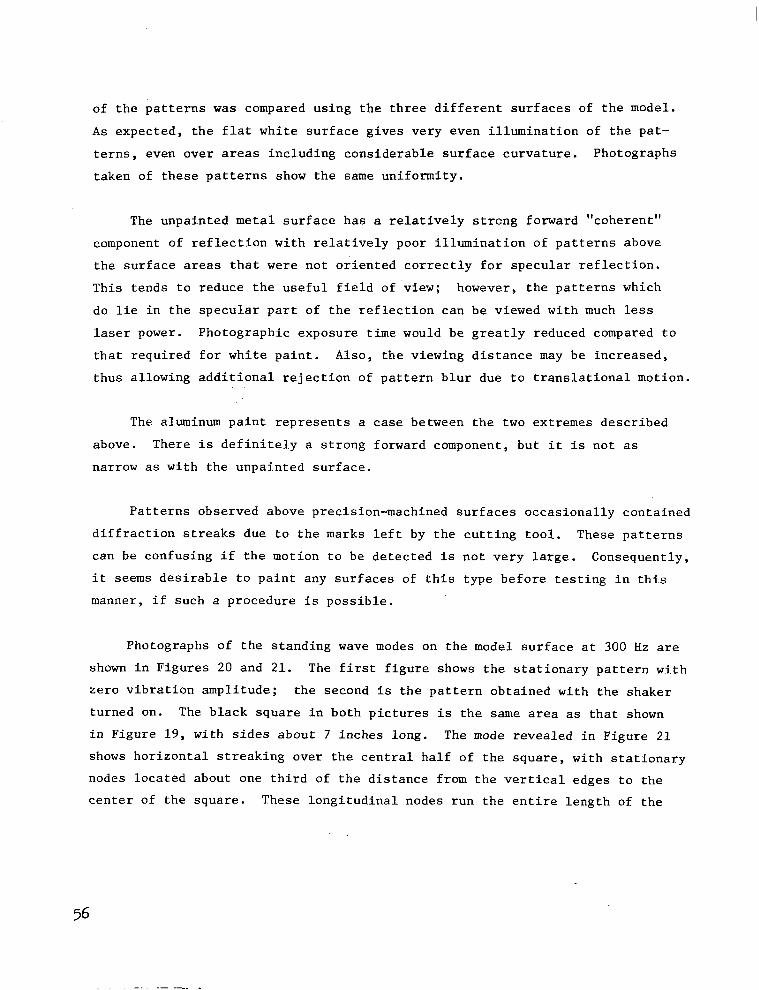
Interference Pattern Without Vibration.
Interference Pattern With Vibration.
Mode Pattern Spectra, White Painted Surface.
4
16
19
21
22
26
28
29
30
33
36
39
40
43
44
45
47
51
55
57
58
60
V

STUDY OF VIBRATION MEASUREMENT BY LASER METHODS
By G. A. Massey
Sylvania Electronic Systems
SUMMARY
This report describes results of the second phase of a study of tech-
niques for using laser radiation to detect and measure vibration of mechanical
structures. During the first study phase, a number of methods were suggested
and demonstrated; two of these were selected as sufficiently promising to
merit further investigation. One of these methods is the intermediate fre-
quency optical heterodyne system, which provides quantitative data about the
motion of a particular very small area on the mechanical structure. The other
method is a qualitative interference technique for observing the vibrational
mode patterns, so that the number of points to be measured by other methods
can be reduced. During the second study phase, these two methods have been
developed analytically and experimentally. A breadboard optical heterodyne
system was built, and detection of audio frequency vibrations at levels from
one centimeter to less than 0.1 micron peak-to-peak has been achieved with
a variety of surface materials. The performance of this system using two
different types of demodulation circuits was investigated in detail. A model
structure was fabricated for tests involving comparisons of the qualitative
and quantitative methods. It has been shown that a very good knowledge of the
vibrational modes can be obtained using the two methods in combination. The qualitative interference method also has been extended to include the measure-
ment of axes of rotation.
vii
INTRODUCTION
This report describes the work performed during a six-month study sponsored
by the National Aeronautics and Space Administration, Ames Research Center. The
purpose of this study was to investigate and develop methods for employing
optical devices to measure vibrations of a mechanical structure. In particular,
the novel techniques made possible by laser sources of great spatial and spectral
coherence have been investigated. Since other devices for vibration analysis
are already in use and have been developed extensively, it is reasonable to ask
whether laser measuring systems offer any advantages over the older methods.
There are, in fact, a number of important advantages, some of which are listed
below. .
(1) Measurements can be made without attaching any mass to the structure.
(2) The working distance between the structure and the test instrument
is limited only by source power and the maximum size of the optical
system that is tolerable.
(3) The area over which the measurement is made can be variable and
may be small, since the optical beam can be focused.
(4) The frequency response is not limited by resonances such as those
present in mechanical strain gauges or accelerometers.
(5). The sensitivity to small motion is, at least for some of .the optical
systems proposed, much better than most applications require as a
minimum.
During a previous study, several methods were investigated. These systems
included interferometric methods, high-frequency subcarrier modulation systems,
and radiometric devices sensitive to image motion. Of these techniques, two
were selected for further study because initial tests were highly successful.
Both depend on the relative monochromaticity of the laser light and achieve
their sensitivity by interference effects. The first system, which has been
called the intermediate frequency optical heterodyne, provides an electrical
output which varies in time as the velocity of a small area on the structure.
The other method, which is later referred to as interference displacement
mapping, gives a qualitative picture of the vibrational mode patterns existing
over large areas of the structure. The analytical and experimental results
obtained for both of these systems are presented below.
2
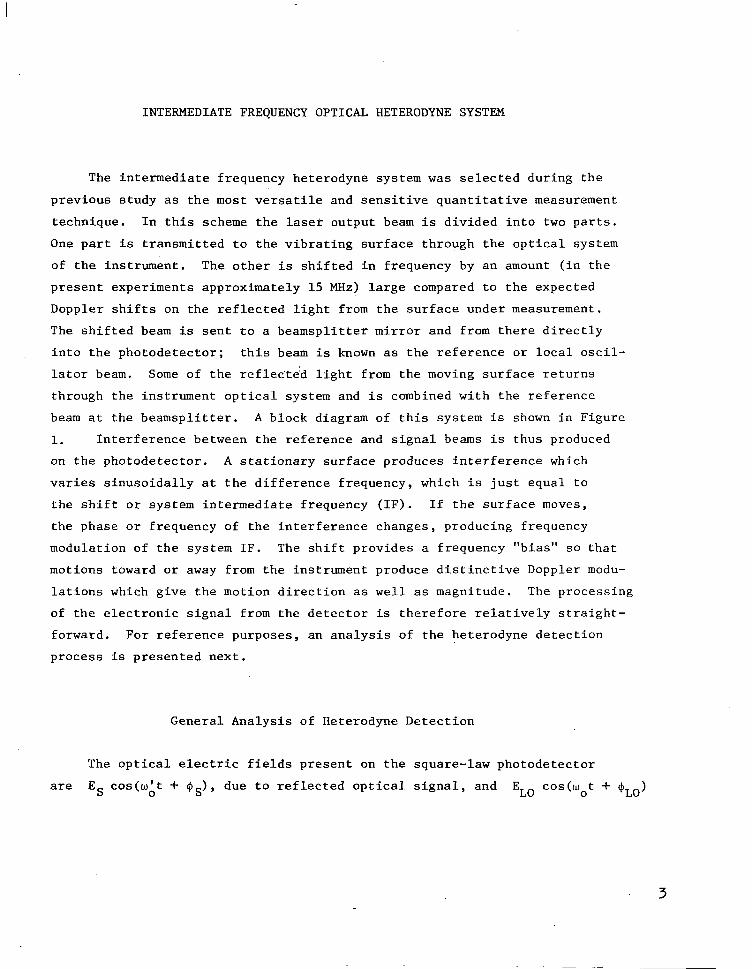
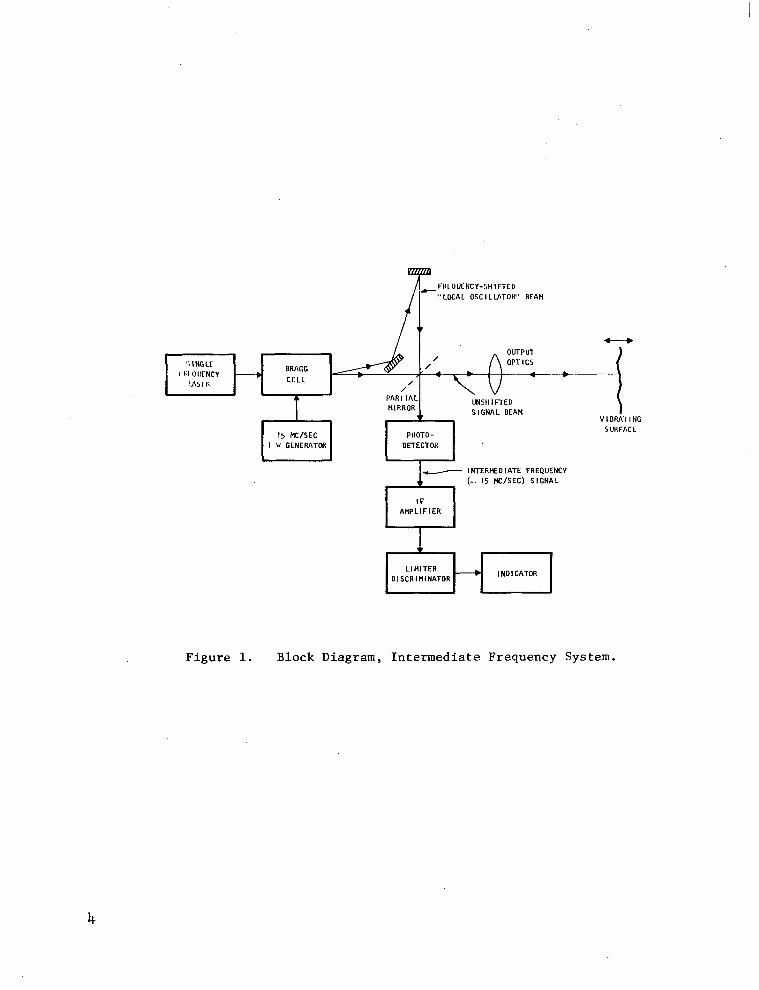
INTERMEDIATE FREQUENCY OPTICAL HETERODYNE SYSTEM
The intermediate frequency heterodyne system was selected during the
previous study as the most versatile and sensitive quantitative measurement
technique. In this scheme the laser output beam is divided into two parts.
One part is transmitted to the vibrating surface through the optical system
of the instrument. The other is shifted in frequency by an amount (in the
present experiments approximately 15 MHz) large compared to the expected
Doppler shifts on the reflected light from the surface under measurement.
The shifted beam is sent to a beamsplitter mirror and from there directly
into the photodetector; this beam is known as the reference or local oscil-
lator beam. Some of the reflected light from the moving surface returns
through the instrument optical system and is combined with the reference
beam at the beamsplitter. A block diagram of this system is shown in Figure
1. Interference between the reference and signal beams is thus produced
on the photodetector. A stationary surface produces interference which
varies sinusoidally at the difference frequency, which is just equal to
the shift or system intermediate frequency (IF). If the surface moves,
the phase or frequency of the interference changes, producing frequency
modulation of the system IF. The shift provides a frequency "bias" so that
motions toward or away from the instrument produce distinctive Doppler modu-
lations which give the motion direction as well as magnitude. The processing
of the electronic signal from the detector is therefore relatively straight-
forward. For reference purposes, an analysis of the heterodyne detection
process is presented next.
General Analysis of Heterodyne Detection
The optical electric fields present on the square-law photodetector
are ES cos(wAt -I- $I,), due to reflected optical signal, and EL0 cos(WOt + @Lo)
3
/i
FRLOUCNCY-SHIFTED -“LOCAL OSCI LVITOH” BEAkl
OUrPUT OPT I CS
- 1 INTERMDIATE FREQUENCY (-, IS NC/SEC) SIGNAL
IF AflPLlFlER
1
LIMITER ---, DISCRIMINATOR
I NDI CATOR
i VIBRATING
SURFACE
Figure 1. Block Diagram, Intermediate Frequency System.
4
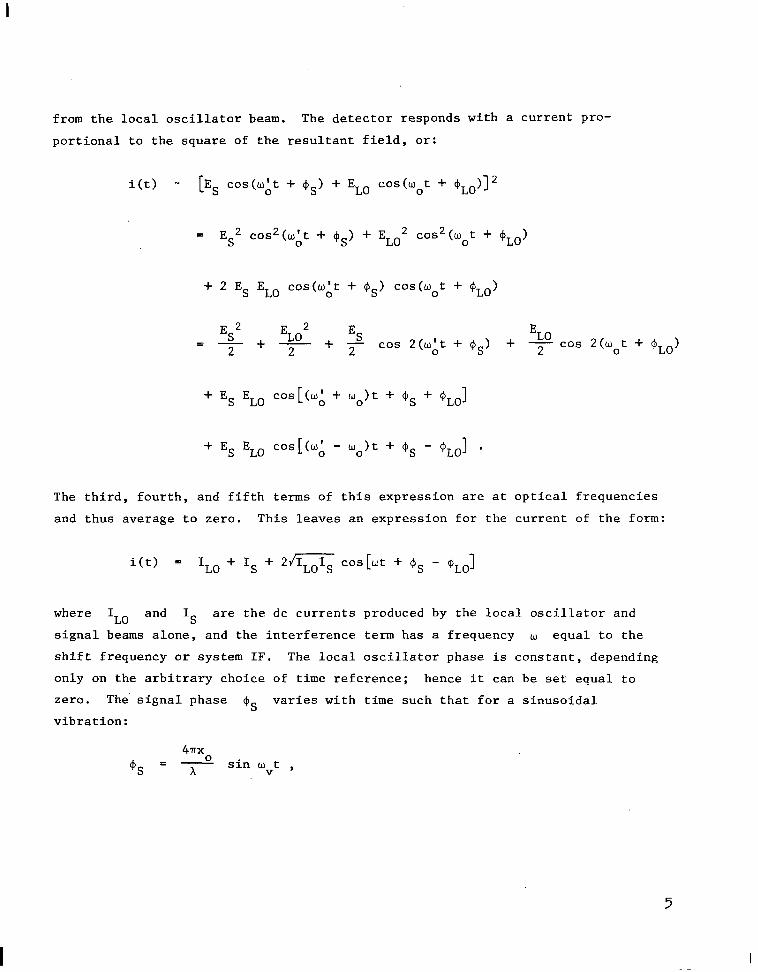
from the local oscillator beam. The detector responds with a current pro-
portional to the square of the resultant field, or:
i(t) - [Es dw;t + a,) + EL0 cos(oot + $LO)12
= ES2 cOs2h;t + $,) + EL02 cos2(wot + $L,)
+ 2 ES ELO cos(fJ.p + $Q cos(wot + eLo)
Es2 E 2 LO ES E LO =
2+2+ 2 cos 2<,;t + 9,) + --Yj-- cos 2(wot + $,,)
+ ES ELO cos [cm:, + wo)t + 9, + +,,I
+ ES EL0 cos[(w; - wo)t + 0, - @Lo] .
The third, fourth, and fifth terms of this expression are at optical frequencies
and thus average to zero. This leaves an expression for the current of the form:
i(t) = IL0 + IS + 2G cos[wt + $S - $Lo]
where IL0 and IS are the dc currents produced by the local oscillator and
signal beams alone, and the interference term has a frequency w equal to the
shift frequency or system IF. The local oscillator phase is constant, depending
only on the arbitrary choice of time reference; hence it can be set equal to
zero. The signal phase 9, varies with time such that for a sinusoidal
vibration:
4lrx 0
% = h sin w t , V
5
I
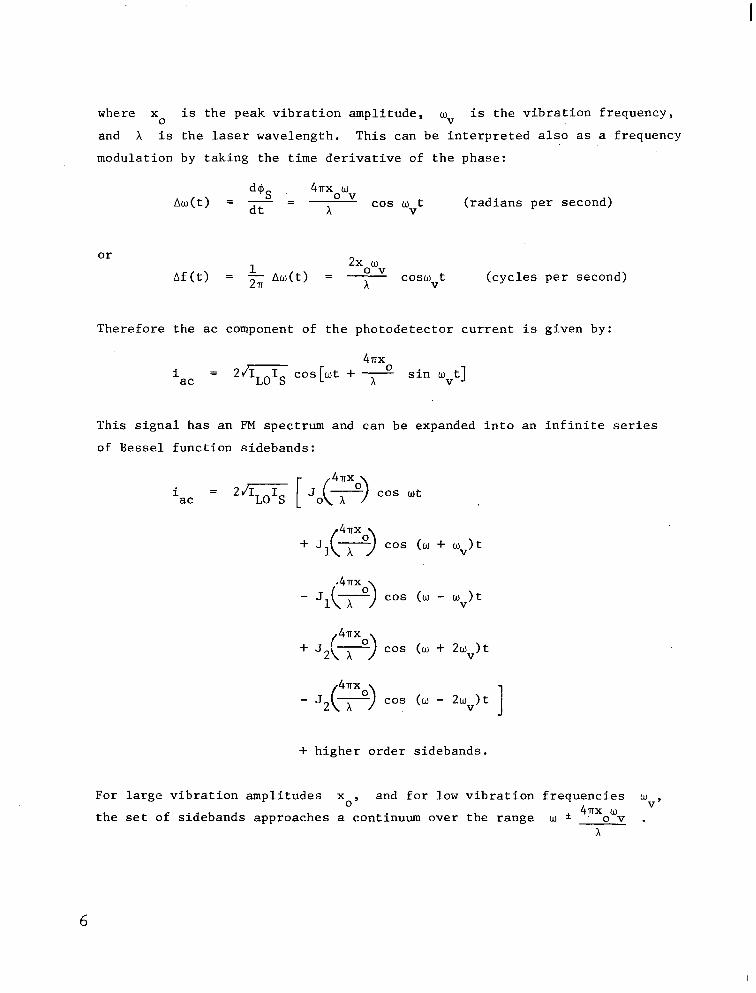
where x 0
is the peak vibration amplitude, wv is the vibration frequency,
and )\ is the laser wavelength. This can be interpreted also as a frequency
modulation by taking the time derivative of the phase:
d% 4lTx w ov Aw(t) = dt = - x cos wvt (radians per second)
or
Af(t) = 2xowv h Aw(t) = 7 coswvt (cycles per second)
Therefore the ac component of the photodetector current is given by:
4Tlx i =
ac 2m cos[wt + * sin tivt]
This signal has an FM spectrum and can be expanded into an infinite series
of Bessel function sidebands:
i = ac 2G [Jo(P) cos wt
4ax
+J1 x 0 ( 1 - cos (w + wJt
.4Tlx
-J1 x 0
Cl+) cos (w - qt
41Tx
+J2 A 0
( ) - cos (w + 2wv)t
47Tx 0
-J2x ( 1 - cos (w - 2wv)t 1 + higher order sidebands.
For large vibration amplitudes x0, and for low vibration frequencies (LJ ,
the set of sidebands approaches a continuum over the range w * 477x w v ov .
x
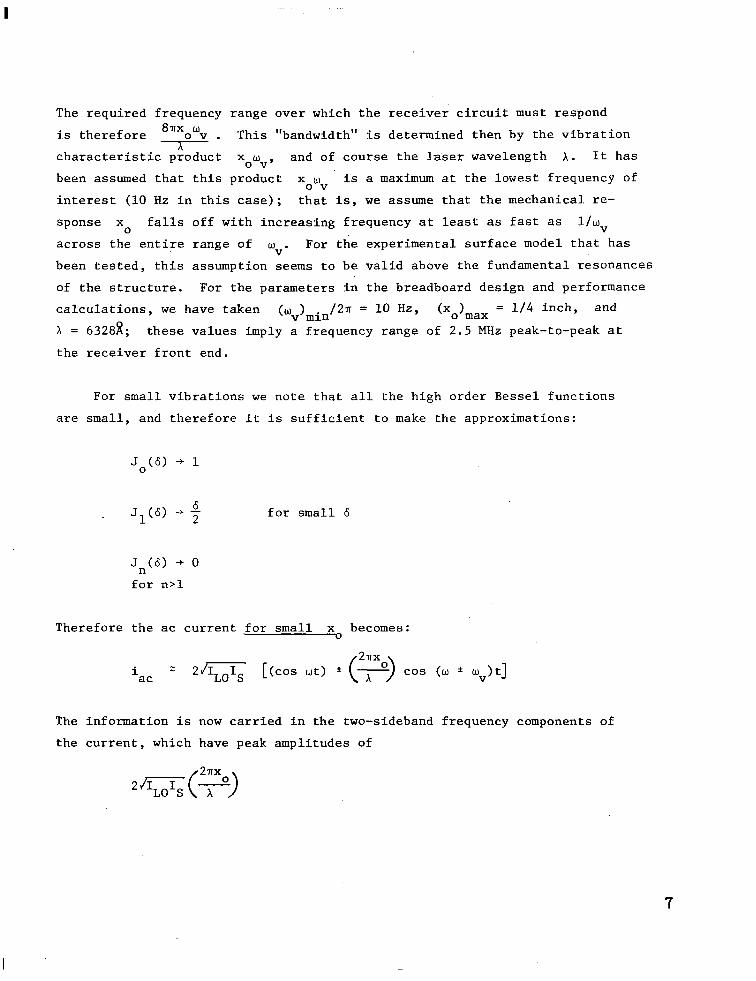
The required frequency range over which the receiver circuit must respond
is therefore 8nx w -I='
This "bandwidth" is determined then by the vibration
characteristic product x w 0 v' and of course the laser wavelength A. It has
been assumed that this product xouv is a maximum at the lowest frequency of
interest (10 Hz in this case); that is, we assume that the mechanical re-
sponse x 0
falls off with increasing frequency at least as fast as l/w V
across the entire range of "V.
For the experimental surface model that has
been tested, this assumption seems to be valid above the fundamental resonances
of the structure. For the parameters in the breadboard design and performance
calculations, we have taken (~v)~i~/27~ =.lO Hz, (xo)max = l/4 inch, and
X = 63288; these values imply a frequency range of 2.5 MHz peak-to-peak at
the receiver front end.
For small vibrations we note that all the high order Bessel functions
are small, and therefore it is sufficient to make the approximations:
for small 6
J,(a) + 0 for n>l
Therefore the ac current for small x becomes:
i ac = 2q [(cos wt) * cos (w * w,>t]
The information is now carried in the two-sideband frequency components of
the current, which have peak amplitudes of
7
or r.m.s. amplitudes of
Essentially all of the returning light is used in producing the IF carrier
component at w. The detection process must not only recover the carrier, but
must distinguish the sideband currents above the system noise in an instan-
taneous receiver bandwidth B. Using a relatively strong local oscillator beam
and a sensitive multiplier phototube detector, the main noise contribution is
from shot noise in the dc current produced by the local oscillator beam. This
noise is given by:
i = J2 e IL0 B n (r.m.s.>
where e is the electronic charge 1.6 x 10-l' coulombs.
The detection will therefore have a unit signal-to-noise ratio when the
sideband current power is the same as the noise power in the circuit. Then:
21 I S/N = 2 eL':
LO
or x = 0 y?yE
(Xo)min = p F - f S
If we further note that a square-law detector of quantum efficiency r) has
the characteristic:
neP IS = hv
S
8
where hv is the energy of a photon of wavelength h and Ps is the reflected
optical power incident on the detector, we arrive at a final expression for
small vibration sensitivity:
(Xo)min = $Y /!$+ S
For Ps = 10 -6 watts and B = 2000 Hz, a detector with n = 10
-2 gives a
minimum measurable vibration amplitude (x ) 0 min f l/48 or about 0.001 micro-
inches. Even for Ps = 10 -10 watts, the value for (xo)min is 0.1 microinches,
so that very small motions are always resolvable provided the assumptions above
are satisfied and the instantaneous receiver bandwidth is only audio.
Analysis of Heterodyne Detection of Diffusely Reflected Light
Up to this point, the signal from the moving surface has been treated as
a coherent wave with undistorted phase fronts, suitable for detection by in-
terferometric techniques. When the surface is an optically diffuse reflector
these conditions may not be true. It is easily shown (see Appendix A) that
for diffuse reflectors, the average or expected value of the ac heterodyne
current is reduced by a factor of 00 -4
below that obtained with a specular
surface of the same reflectivity. Here N is the square of the ratio of the
illuminated spot diameter, d, to the optical wavelength:
N= f 0 2
x Thus the heterodyne ac current is attenuated by the factor d . It is clearly
desirable to make d as small as possible, but diffraction limits d to
values much larger than X, since
Cd> AR min -D
9
where D is the transmitter aperture diameter and R is the distance from
the transmitter to the surface. It is evident, however, that the laser beam
must be focused on the diffuse surface if d is to be minimum, and that large
apertures should work better than small ones because of diffraction. The
breadboard heterodyne system was designed with these results in mind.
The signal obtained from a focused spot (with equal transmitting and
receiving apertures) is spatially coherent because it originates over an area
no larger than the resolution limit for the receiver. Therefore the original
heterodyne analysis applies, but it is necessary to estimate the value for
received power by accounting for the average level of light scattered away
from the receiver (geometric attenuation) as well as the uneven scattering
distribution due to coherent interference effects. The geometric optical
signal attenuation is easily estimated if the surface is a Lambertian reflector:
PR =
Here pR is the signal power received in the aperture of diameter D ata
distance R from the focused spot. The total reflected power is PO. In
the experiments conducted during this study, the calculated value for this
attenuation 'R"o was approximately 10 -3 .
Interference effects cause the heterodyne current to vary about the
probable value predicted above when experiments are actually performed on
diffuse surfaces. Since the phases of the contributing fields from the
large number of random surface irregularities in the illuminated area add
up as vectors in a two-dimensional random walk phenomenon, the probability
d.istribution for the heterodyne current approximates a Rayleigh distribution
with the Lambert's law result as a most probable value. The distribution
function is:
10
F(i) = 1 _ e-%(i/1>2
and the probability density is:
f(i) = i/I2 e -%(i/I) 2
, 0 6 i
, 06i
where I is the most probable value for the photocurrent. Using Lambert's
law, this is approximately:
I = d2 ILo Is where Is = E PO kBg)2
This probability density is broadly peaked, so that there is considerable
probability of having heterodyne beat values substantially different from the
mean. This is apparent because the mean value of i, E(i) is
E(i) = jmi2,12 e-4(i/I)2 0
di=AI
and the mean square, E(i2) is
E(i2) di = 212 0
Thus the variance 02 = E(i2) - [E(i)]2 = 9 I2 ( J which is roughly 25 percent
of the mean square. The only requirement here is that the focused spot have
an area large compared to a square wavelength (the smallest effective roughness
element). This is always satisfied in practice. Note that since these quan-
tities describe current fluctuations, the signal-to-noise or power fluctuations
are even more drastic. The ratio of the variance to the mean square is a con-
stant unaffected by the number of roughness elements within the spot; it is
therefore desirable to minimize that number. for the reasons given earlier. If
different areas of a surface are illuminated successively, the result at each!
11
.
position represents one trial of the probability law, and therefore the result
obtained by averaging the currents over several positions should be near the
mean. In principle, this provides a.method for reducing the statistical
spread in S/N values obtained in making a measurement. Experimentally, if
a number of independent areas are illuminated and the results averaged during
each resolution interval for the measurement, the effect should be nearly the
same as if the surface were a true Lambertian reflector. Since it is the
small values of heterodyne current which interrupt the measurement, such a
procedure reduces the probability of obtaining currents well below the mean
which may cause signal dropouts.
The technique for accomplishing this procedure in practice is very simple.
One of the mirrors in the optical system is scanned at a rate well above the
highest vibration frequency to be measured. Then during each portion of a
vibration cycle, the returns from several nearby surface areas are measured
and averaged. The scanning mirror must move the mirror over several spot
diameters at rates of several thousand scans per second. The intensity and
phase changes produced on the scanning beam by the surface roughness produce
a broad "noise" spectrum in the receiver, but the modulation components are
all at frequencies above the maximum vibration rate and can be eliminated by
low pass filtering. Thus a method exists for obtaining dependable results from
diffuse surfaces which would otherwise give large fluctuations. How well the
technique works in practice depends on the receiver bandwidth and therefore
on the optical power available, since the full spectrum of the noise-like
carrier produced by scanning must be admitted into the receiver.
A simpler but less reliable procedure is to count on the fact that signals
well below the mean should be rarely obtained. This amounts to moving the
transmitted beam around on the surface manually until a useful signal is
achieved. This approach is subject to the effects of drafts of air and large,
low frequency vibrations, which cause the beam to wander slightly about the
chosen spot, usually into areas which return very much less signal. Since
12
these wanderings are usually at slow rates, long periods of signal dropouts
may occur, and any transient or acquisition problems in the receiver are
aggravated.
Depth of Focus
In connection with the results for diffuse surfaces presented above, it
is useful to derive an approximate value for the depth of focus over which
the heterodyne receiver gives essentially full output without readjustment
of the focusing optical system. This is important for detection of very large
vibration amplitudes. Above it was pointed out that with the transmitted beam
focused on the surface the strongest signal is obtained, since the number of
independent reflector elements in the spot is then a minimum. In that case
the surface lies in the pupil plane of a very small aperture (the focused spot)
whose effective near field extends a short distance on either side of the sur-
face. One criterion for the depth of focus is then the length of the near
field region, which is easily estimated. If the spot size at focus is d, the
extent of the near field down the axis in one direction from the surface is
r = d2 x-
Taking the total length of the region in front and behind the surface as R,
the depth of focus, we have
11 2d2 = --I--
For large optical systems and small working distances, which are necessary
to obtain useful values of S/N, II is not a large distance. Taking the working
distance as R and the transceiver aperture as D, we have
13
or 11 = 8h($)2
R In the present experiments, 5 = 15; thus 11 = 1800~ = 1140 microns or 0.045
inches. Outside this range the heterodyne signal will decrease; the exact
behavior depends on the illumination cross-section and lens aberrations in a
real case. In any event it is clear that very large excursions necessarily
imply some change in the signal during the vibration cycle. It should be
noted that the maximum velocity points during a cycle occur at the rest
position. We then expect to be able to obtain the velocity extremes, even in
cases where the signal is lost near the displacement extremes.
Breadboard System
At the outset of the program it was decided that the results of the
experiments would be meaningful only if the breadboard model really approxi-
mated the system performance that could be expected in a useful instrument.
Therefore, a considerable part of the effort on this project was devoted to
the design and construction of the breadboard heterodyne system. Operation
of this breadboard device for several months has certainly justified this
approach, since a number of design concepts have been reduced to practice
and the operating characteristics have been determined. Stability and relia-
bility of the interferometer adjustments during the experiments were addi-
tional advantages provided by the carefully constructed breadboard.
A number of features were initially chosen as goals in the breadboard
design:
(1) As much of the light as possible should be used. This implies
avoidance of stray beams from an excessive number of beamsplitter
mirrors in the interferometer optical system. It also means ef-
ficient utilization of the outputs from the optical frequency
translator.
14
(2)
(3)
(4)
(5)
All adjustments must be easily made and stable, so that different
experiments can easily be performed.
Focusing and positioning of the output beam over a wide range
must be provided. These adjustments must not affect the system
alignment adjustments.
The aperture must be as large as practical, so that a reasonably
large working distance and sensitivity to small signals can be
obtained.
The receiver and demodulator circuitry must provide a voltage analog
of the motion on as many different types of reflecting surfaces as
possible, operating with Doppler shifts over a 2.5-MHz range at audio
rates between 10 Hz and 2 kHz.
The basic system diagram, developed during the first phase of this work,
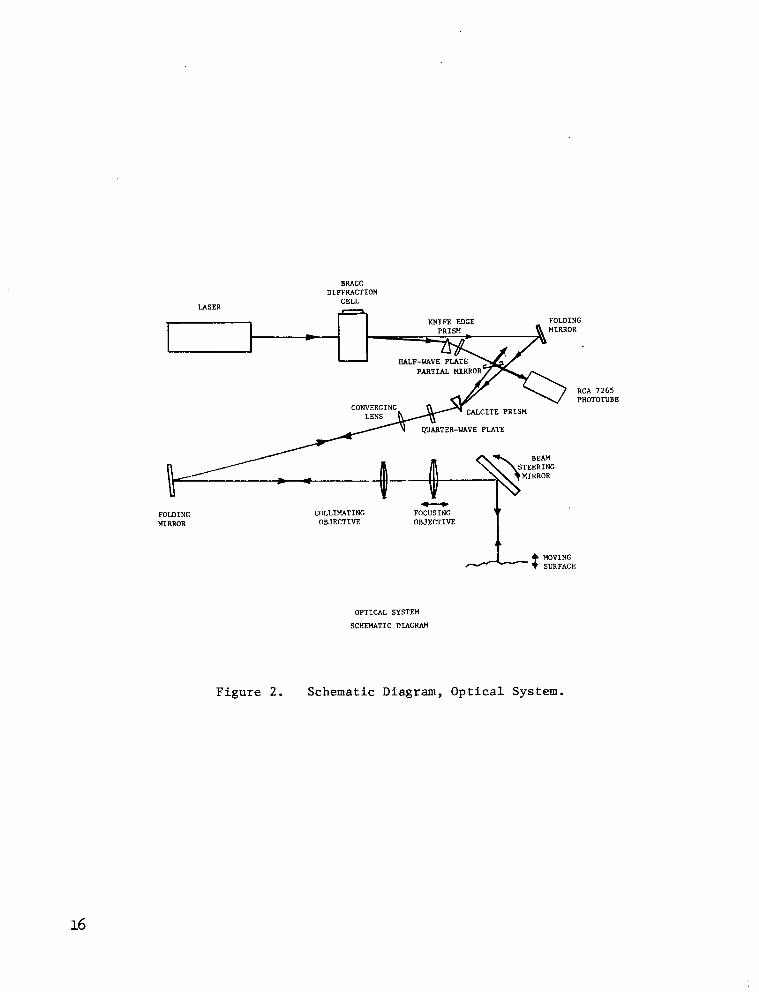
was shown in Figure 1. In Figure 2 we have a schematic diagram of the actual
optical system developed during this program. A number of features are worth
noting.
(1) Laser. A Spectra-Physics Model 119 single-frequency He-Ne laser,
operating at 63282 with approximately 100 microwatts output, was
chosen as the optical source. This device is essentially free from
spurious modulations which could be troublesome in this application,
and the single frequency allows large path differences to exist in
the interferometer with no mode beat cancellation effects.
(2) Diffraction Frequency Translator. Frequency shifting by diffraction
from radio frequency acoustic waves in water was the method selected
for producing the local oscillator or reference beam for the inter-
ferometer. The diffraction cell has the following advantages:
15
BRAGG DIFFRACTION
KNIFE EDGE PRISH
FOLDING MIRROR
HALF-WAVE PLiTE \ PARTIAL MIRROR=
, CONVERCINC n/
QUARTER-WAVE PLATE
FOLDING COLLI"ATING FOCUSING "IRROR "IUECTIVE OBJECTIVE
I
OPTICAL SYSTEM
SCHEMATIC DIAGRAM
RCA 7265 PHOTOTUBE
Figure 2. Schematic Diagram, Optical System.
16
(a) The output frequency components are cleanly separated into
beams leaving the cell at different angles.
(b) The cell is reliable, relatively inexpensive to construct,
does not affect the spatial coherence of the beam, and re-
quires no adjustments in operation.
(c) The drive power required is less than one watt, and the
operating frequency can be selected in the convenient range
from 5 to 50 MHz. This application requires the intermediate
frequency to be in this range for best results.
The frequency translator constructed for this program contains a
5-cm diameter, 5 MHz quartz transducer operating at the third over-
tone, 15.1 MHz. This was mounted in the end of a stainless steel
tank filled with water, so that the quartz crystal was in contact
with the water on one face and backed only by air on the other face.
Light enters and leaves the tank through two optically flat windows
on the sides. A reactive matching transformer, which efficiently
couples the 15 MHz power input on the 50 ohm transmission line to
the resonant crystal, is mounted in a closed metal tube attached to
the tank behind the crystal. The tube eliminates radiation which
would otherwise create an RF1 problem in the system receiver. A
similar problem exists if there is appreciable amplitude modulation
on either of the beams leaving the frequency translator. This effect
is always present to some extent because of scattering in the water;
however, the spurious optical modulation was measured at a level of
40 db below the power-in the translated beam in the present device.
Methods for eliminating most of this small residual are discussed
below in the section on signal detection.
Since the desired Bragg diffraction must occur for a single traveling
acoustic wave only, if the diffracted light is to contain only one
17
(3)
frequency, it is necessary to eliminate standing acoustic waves
which might interact with the light to produce spurious modulation.
This can be done with an absorber in the end of the tank opposite
the transducer, or by tilting that end of the tank so that the
reflected acoustical wave does not interact with the light. The
latter procedure was adopted here, since nothing is then introduced
into the water which might contaminate the liquid and increase the
scattering. This device is shown in Figure 3.
Optical System. Two features of the optical system are worth noting.
The first is the calcite prism and quarter-wave plate combination,
which acts as an efficient optical directional coupler. The principle
of operation is based on the birefringent property of the calcite
prism, which has two effective angles of deviation, one for each re-
fractive index. The light leaving the system through the prism is
linearly polarized vertically; this polarization interacts only with
the lower index of the calcite and is refracted through an angle
along the telescope optical axis. As the light leaves the prism it
passes through the quarter-wave plate, which is so oriented that the
vertical linear polarization becomes circular polarization. Now
light returning down the telescope axis with the same circular po-
larization will be converted to horizontal linear polarization by
the second passage through the quarter-wave plate. Thus, received
light approaches the prism polarized at 90' to the plane of the
transmitted light. But this is the condition required for refraction
with the greater index of the crystal; thus the refracted returning
signal leaves the prism along a different path from the outgoing beam.
For specular surfaces at the focus of the telescope this process can
be essentially 100 percent efficient -- several times better than
with an additional beamsplitter mirror to do the same job. For sur-
faces which randomly polarize the reflected light, the efficiency
drops to 50 percent, but the lost power was not suitably polarized
for heterodyne detection in any case.
18
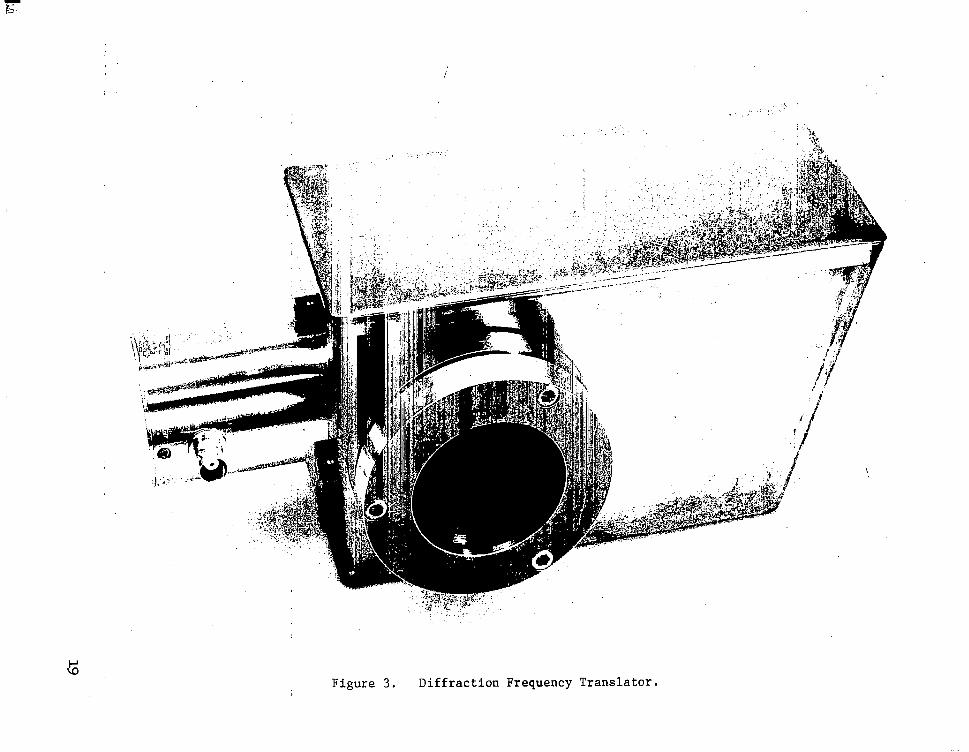
Figure 3. Diffraction Frequency Translator.
The inclusion of the optical directional coupler makes it practical
to transmit and receive through the same optical system. This in
turn removes the excessive mechanical alignment tolerances within
the telescope optical system.which could not otherwise be avoided
with heterodyne detection. These advantages occur because the moving
surface is in a focal plane and reflected energy retraces its path
exactly, even if some of the elements are misaligned slightly due to
focusing or aiming adjustments.
A second feature of this optical system is the telescope relay
system, which projects a focused spot on the vibrating surface
using a pair of 3.2-inch objective lenses with focal lengths of
48 inches. The light is collimated between these lenses so that
their spacing may be varied over a lo-inch range without intro-
ducing additional aberrations which might lower the heterodyne
efficiency. This results in a working distance of approximately
four feet that can be adjusted over a lo-inch range to accommodate
three-dimensional structural surfaces. A five-inch optical flat
mounted at the optical system output aperture provides a scanning
capability, so that complex structural shapes can be probed using
the vertical, horizontal, and depth adjustments on the breadboard.
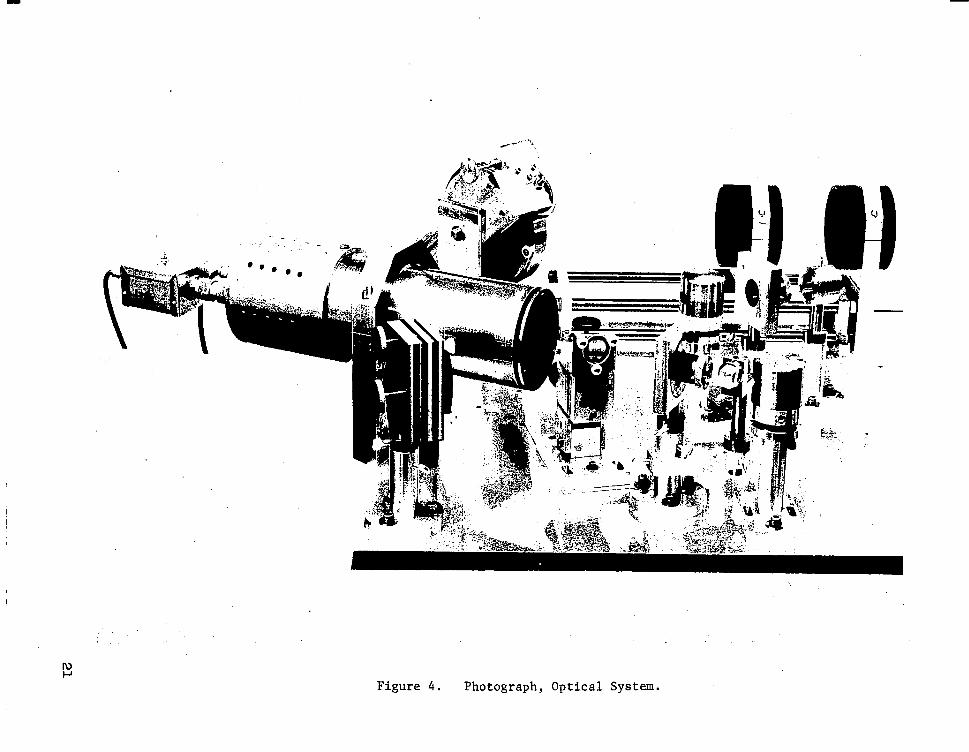
During the tests using the beam deflector system, the beam deflector
was inserted into the optical system between the directional coupler
elements and the converging lens of the relay telescope, shown in
Figure 2. Figures 4 and 5 show the optical and mechanical systems.
(4) Mechanical System. The optical components of the breadboard are
mounted on a special three-legged metal table which Sylvania has
previously used in optical systems experiments of this type. This
table consists of a large machined jig-plate casting, 4 feet by
2 feet in area and 3/4-inch thick, mounted on three aluminum pipe
legs 2 inches in diameter. The legs are heavily braced with side
20
nl P
Figure 4. Photograph, Optical System.
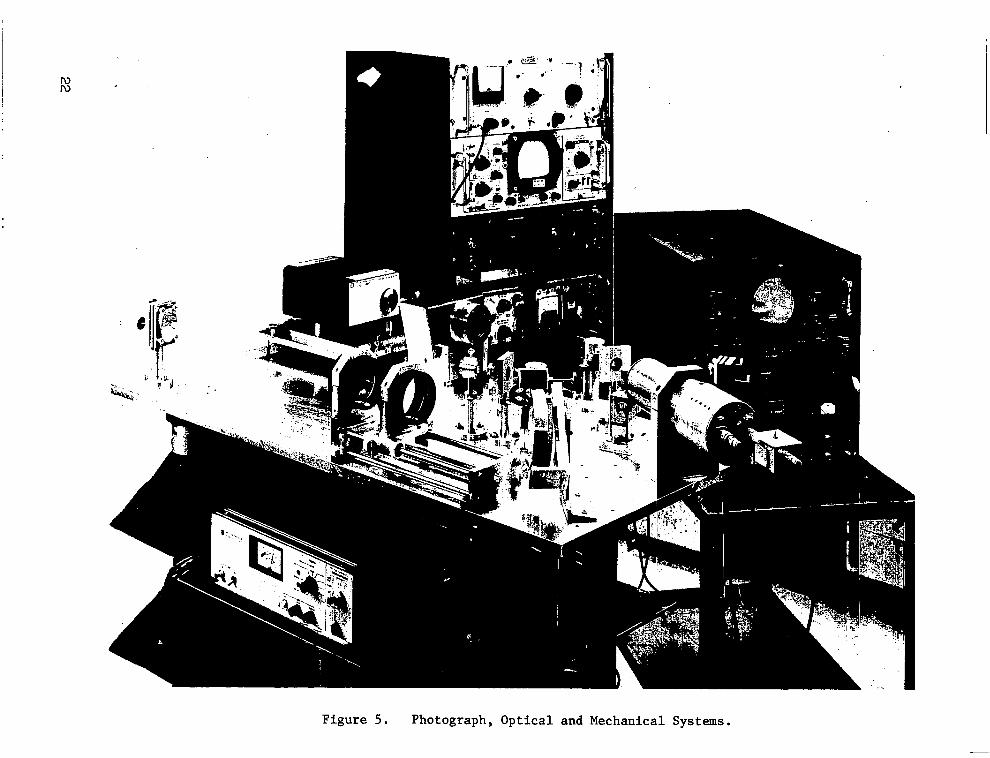
Figure 5. Photograph, Optical and Mechanical Systems.
panels, and shelves for associated electronic equipment are provided
as part of the bracing. The laser and Bragg diffraction cell are
mounted on fixtures which provide the necessary adjustments and can
be locked in place securely. All of the precision mirror adjust-
ments within the system are made with metal spring hinges so that
no mechanical "play" is introduced. Fine adjustment of the beam-
splitter alignment is made by distorting the metal block on which
the mirror is supported. This approach has proved easy to use and
very reliable during the course of the experiments.
No isolation of the mechanical system from floor vibrations in
the laboratory environment was required in any of the tests, even
though some of the vibration amplitudes measured at higher audio
frequencies were as small as l/10 wavelength. Placement of the
laser power supply, which contains a cooling fan, on one of the
shelves in the table structure did cause some measurable spurious
modulation of the signal, but this was remedied by placing a 2-inch
foam rubber pad between the power supply and the shelf.
(5) Optical Signal Detection. As shown in the optical system diagram,
the present breadboard uses only a single phototube detector even
though there are two bean& leaving the beamsplitter mirror. This
was done because only a single tube of the proper type was available
in the laboratory; however, an additional 3 db of signal as well as
substantial reduction of spurious amplitude modulation can be achieved
when both beams are detected, as pointed out below.
The tube used in these experiments is an RCA 7265 multiplier photo-
tube, with an S-20 photosurface and 14 stages of current multipli-
cation. This photosurface is the best available for detection at
63282, with a quantum efficiency of 5% near that wavelength. A
narrowband interference filter and a small aperture were mounted
in front of the pho.tocathode to eliminate the effects of room lighting.
23
The large number of multiplier stages can provide small signal
current gains up to 20 million; however, the relatively strong
local oscillator beam in this system places a much lower gain limit
on the tube, since a DC current-of one milliampere should not be
exceeded at the anode.
In the breadboard, the voltage on the last several dynodes is
reduced to limit the current to safe operating levels. The mul-
tiplier still provides considerable gain in this case, so that the
noise figure of the following amplifier circuit does not have to be
extremely low. It should be pointed out that the local oscillator
beam produces so much photocurrent that dark noise in the tube is
also negligible; in fact, the only important noise source is shot
noise in the photocathode current. Ideal heterodyne detection, ex-
cept for optical phase variations across the beam due to lens aber-
rations, is therefore easily achieved with this tube.
The advantages of detecting both beams (balanced mixer operation)
were mentioned above. It is important to note that the signal modu-
lation or beat frequency produced in detecting the beams has a 180'
phase shift between the detectors, since energy is conserved at the
beamsplitter mirror and no envelope variations are assumed to be
present on the local oscillator and signal beams before they reach
the beamsplitter. However, if power fluctuations do occur, they - will produce in-phase variations at both detectors. Therefore, the
ideal electrical connection to the detectors is to take the difference
of their outputs, so that subtraction returns the beat signal to in-
phase relationship but cancels out the power variations.
An alternative to this scheme is to use a single detector for both *
beams, with one beam delayed by one-half the wavelength at 15 MHz.
This is a path difference of 10 meters, with the practical disad-
vantage that many reflections from very low-loss mirrors are required
24
(6)
to achieve the delay in a reasonable space. Some experiments with
this technique have been carried out.
A second alternative is possible if the object is only to eliminate
spurious coherent modulation at the intermediate frequency. This
simply involves injection of an electrical signal of the proper
phase and amplitude to cancel the undesired modulation. This is
practical because the spurious modulation produced in the diffraction
cell is phase coherent with the RF signal source. This fact has
been confirmed experimentally, and the validity of this procedure has
been verified. It has been particularly useful in making measurements
of small vibration amplitudes using the spectrum analyzer, where
spurious components at the carrier frequency can distort the apparent
relative sizes of the modulation sidebands.
Electronic Receivers.
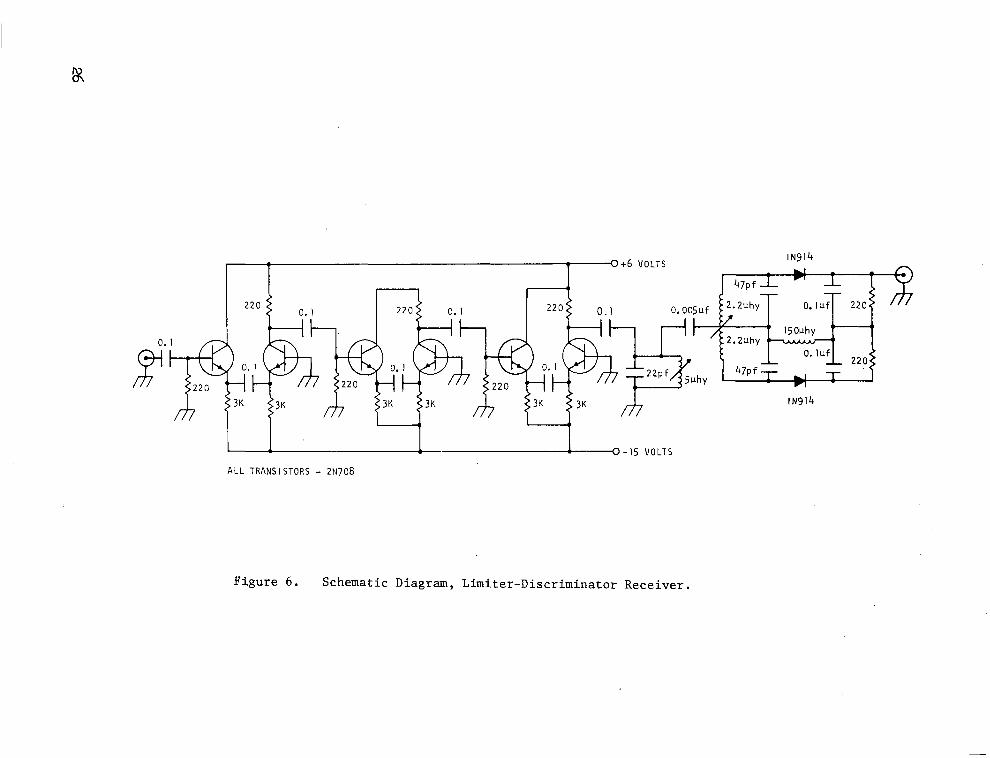
(a) Limiter-Discriminator Receiver.- The original receiver built
for this system was a straightforward design using three limiter
stages and a tuned circuit discriminator. The circuit diagram is
shown in Figure 6. It was found that the signal levels obtained
from most of the surfaces tested were too low to produce adequate
limiting in this circuit. This was because the maximum allowed DC
current in the Phototube anode circuit was reached before the full
gain of the multiplier stages could be used. To avoid this problem,
additional stages of amplification were added, until the circuit
would function with test signals down to -84 dbm. The lowest mea-
sured phototube outputs were always above -70 dbm. However, shot
noise across the 4 MHz bandwidth of the RF stages caused the limiters
to saturate on noise when the S/N ratio referred to 4 MHz bandwidth
was poor, as described below. Since the information rate is only
audio, the bandwidth limit here is clearly not optimum; hence
another design approach was taken.
25
IN914
-+6 “OLTS - 1 I I r-i J 47Pf-L - ' -I- T l- XL-
r 3K
ALL TRANSISTORS =
IN914
Figure 6. Schematic Diagram, Limiter-Discriminator Receiver.
(b) Tracking Receiver.- To avoid the difficulties inherent in
detection of weak signals in noise with wideband nonlinear circuits,
a second method was proposed and demonstrated. This new method
takes advantage of the fact that the signals of interest in this
applications often sweep over wide frequency ranges at low rates.
Thus,an ideal receiver would have a narrow instantaneous bandwidth,
just adequate to accommodate the important sidebands due to the
sweeping frequency, but would have a time-varying band-center fre-
quency which follows the large frequency excursions of the signal.
A practical embodiment of this concept is a heterodyne receiver
circuit in which the local oscillator frequency is servo-controlled
to match the incoming signal frequency exactly and maintain a constant
phase relationship or zero-beat condition between the signal and
the local oscillator. The voltage in the feedback loop which forces
the local oscillator to track the signal frequency variations be-
comes the output signal of the receiver system. Such a receiver
has been called a phase-locked loop.
General Characteristics:
Functionally the phase-locked loop (PLL) is a narrow-band filter
that continuously servos itself to the strongest signal frequency
in. the input spectrum. The PLL is used to "lock-on" to the strongest
incoming signal, which is shifting in frequency. The PLL utilizes
active components (with gain) and a feedback loop, with the feedback
loop providing the filtering and frequency servo action. The PLL is
designed to accept incoming frequencies ranging from 14.0 MHz to 16.b
MHz with a passband (or noise bandwidth) of approximately 2 kHz. The
PLL generally shifts the phase, making it lag by 90 degrees.
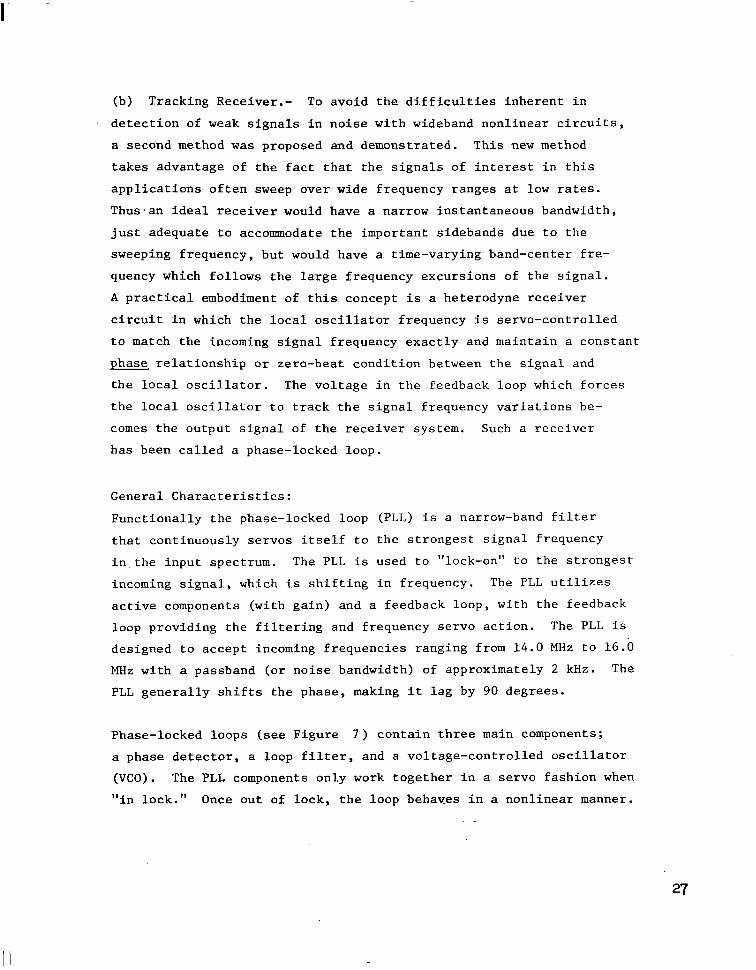
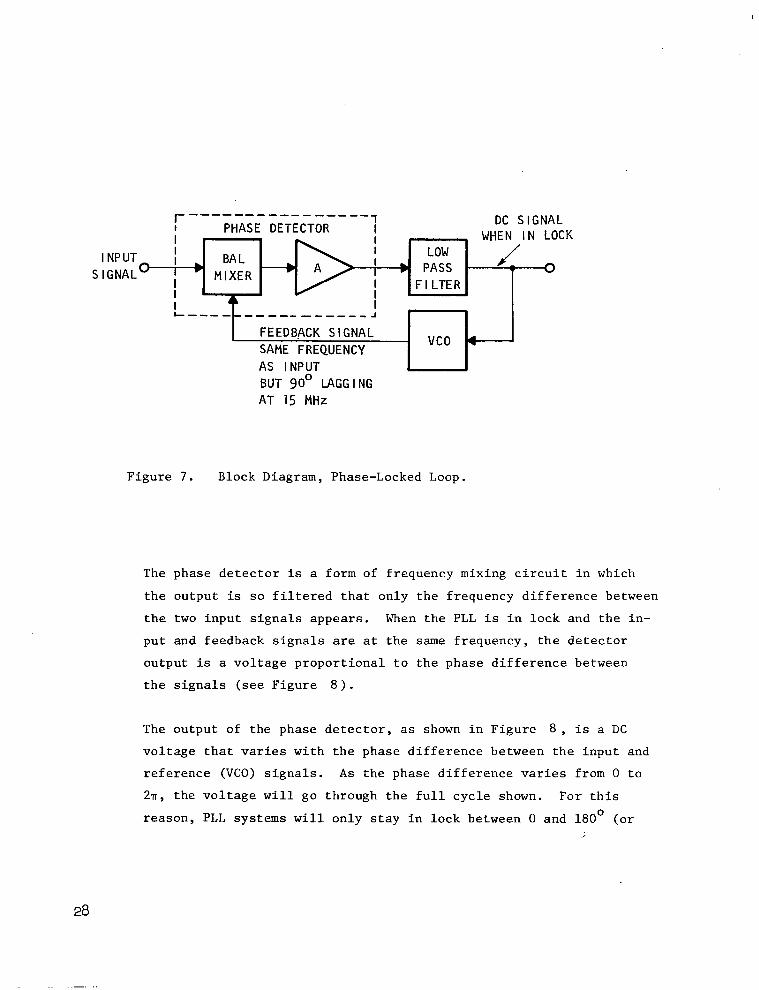
Phase-locked loops (see Figure 7) contain three main components;
a phase detector, a loop filter, and a voltage-controlled oscillator
(VCO) . The PLL components only work together in a servo fashion when
"in lock." Once out of lock, the loop behaves in a nonlinear manner.
27
r---------- -----:
PHASE DETECTOR
I NPUT SI GNAL
DC SIGNAL WHEN IN LOCK
LOW -b PASS
FILTER
I FEEDBACK S I GNAL SAME FREQUENCY
- vco 4
AS INPUT 1 I BUT 90’ LAGGING AT 15 MHz
Figure 7. Block Diagram, Phase-Locked Loop.
The phase detector is a form of frequency mixing circuit in which
the output is so filtered that only the frequency difference between
the two input signals appears. When the PLL is in lock and the in-
put and feedback signals are at the same frequency, the detector
output is a voltage proportional to the phase difference between
the signals (see Figure 8).
The output of the phase detector, as shown in Figure 8, is a DC
voltage that varies with the phase difference between the input and
reference (VCO) signals. As the phase difference varies from 0 to
2a, the voltage will go through the full cycle shown. For this
reason, PLL systems will only stay in lock between 0 and 180' (or
28
..-..
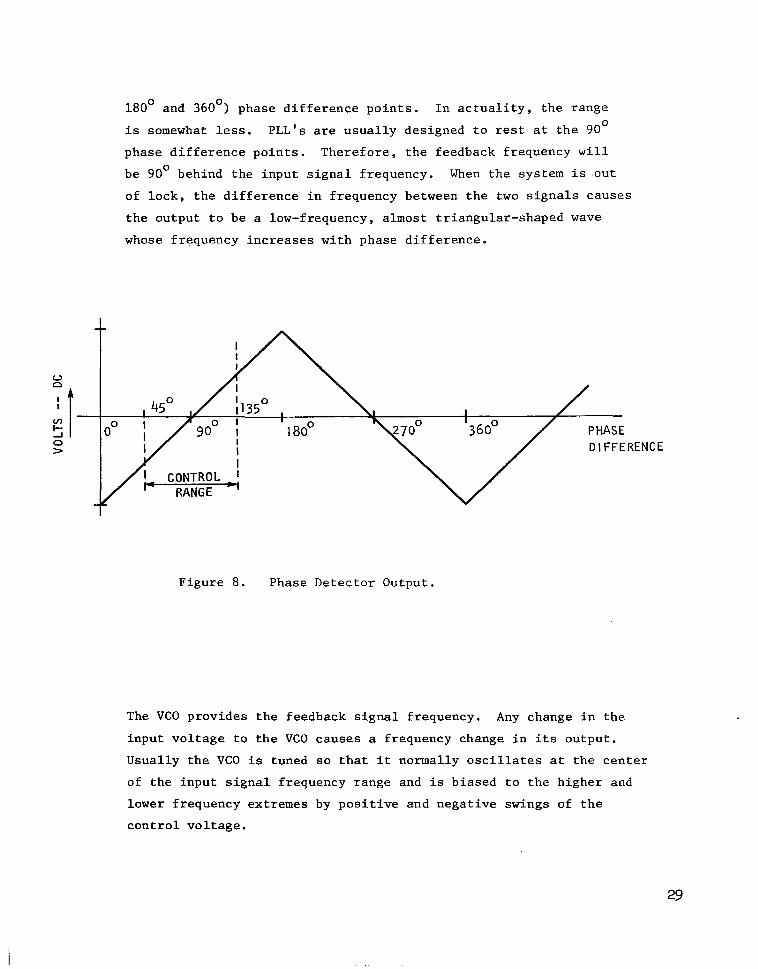
180° and 360') phase difference points. In actuality, the range
is somewhat less. PLL's are usually designed to rest at the 90°
phase difference points. Therefore, the feedback frequency will
be 90° behind the input signal frequency. When the system is .out
of lock, the difference in frequency between the two signals causes
the output to be a low-frequency, almost triangular-shaped wave
whose frequency increases with phase difference.
x : if 2 I > D I FFERENCE
Figure 8. Phase Detector Output.
The VCO provides the feedback signal frequency. Any change in the
input voltage to the VCO causes a frequency change in its output.
Usually the VCO is tuned so that it normally oscillates at the center
of the input signal frequency range and is biased to the higher and
lower frequency extremes by positive and negative swings of the
control voltage.
29
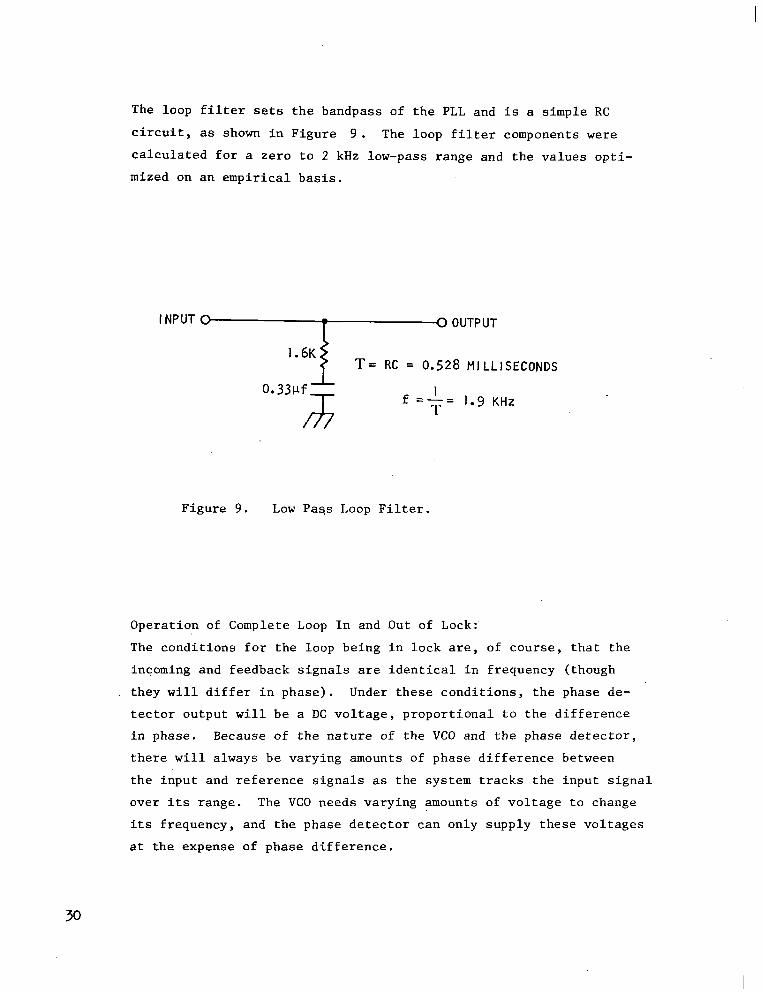
The loop filter sets the bandpass of the PLL and is a simple RC
circuit, as shown in Figure 9. The loop filter components were
calculated for a zero to 2 kHz low-pass range and the values opti-
mized on an empirical basis.
I NPUT 000 OUTPUT
1.6K T= RC = 0.528 MILLISECONDS
f ' =-= T
1.9 KHz
Figure 9. Low Pas,s Loop Filter.
Operation of Complete Loop In and .Out of Lock:
The conditions for the loop being in lock are, of course, that the
incoming and feedback signals are identical in frequency (though
they will differ in phase). Under these conditions, the phase de-
tector output will be a DC voltage, proportional to the difference
in phase. Because of the nature of the VCO and the phase detector,
there will always be varying amounts of phase difference between
the input and reference signals as the system tracks the input signal
over its range. The VCO needs varying amounts of voltage to change
its frequency, and the phase detector can only supply these voltages
at the expense of phase difference.
30
As shown in Figure 8, the phase difference that would occur in the
system as it tracks the input signal might vary from 45 to 135 degrees.
The system gains are set so that the phase detector provides control
voltages large enough to cause the VCO to decrease or increase, in
frequency, as the phase difference varies 45 degrees below and above
the 90 degree resting phase lag.
A "safe" phase difference variation of 45 - 135 degrees has been
chosen; while large ranges, say, 10 - 170 degrees, might use more of
the phase detector's capability, this would increase the danger that
the system would then go out of lock at 180°. It stands to reason,
therefore, that the smaller the phase error (@,), the more efficient
the PLL will be as a filter. But, then, more gain is required in
the system.
As long as the changes of input signal frequency are slow enough so
that they remain within the bandwidth of the loop, and this is
determined mainly by the filter, the PLL will stay in lock. However,
once the frequency of the phase difference signal goes past the
filter's roll-off frequency, the correction signal reaching the VCO
will become so attenuated that the VCO will revert to the midpoint
frequency and the system will break out of lock. Once a rapid change
in the input signal has caused the loop to break out of lock, the
difference between input and output signals will cause the phase
detector to put out its triangular wave signal.
The higher the frequency difference between input signal and the VCO,
the more the filter attenuates the signal being passed to the VCO.
However, the filter time constant will allow some of the higher fre-
quencies (although attenuated) to get through to the VCO. The VCO
will sense this attenuated higher frequency signal and produce cor-
responding fluctuations around its resting frequency. These will
build up around the loop, and eventually provide a reference signal
at a frequency that coincides with the input signal frequency and at
the point lock will occur.
31
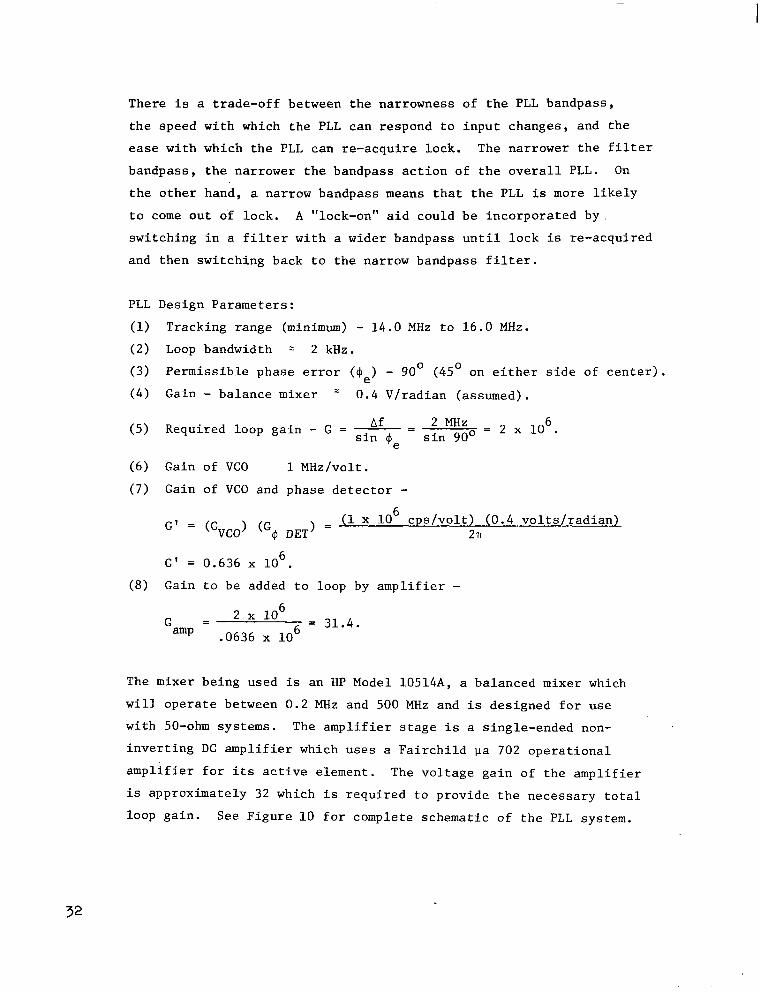
There is a trade-off between the narrowness of the PLL bandpass,
the speed with which the PLL can respond to input changes, and the
ease with which the PLL can re-acquire lock. The narrower the filter
bandpass, the narrower the bandpass action of the overall PLL. On
the other hand, a narrow bandpass means that the PLL is more likely
to come out of lock. A "lock-on" aid could be incorporated by.
switching in a filter with a wider bandpass until lock is re-acquired
and then switching back to the narrow bandpass filter.
PLL Design Parameters:
(1) Tracking range (minimum) - 14.0 MHz to 16.0 MHz.
(2) Loop bandwidth 2 2 kHz.
(3) Permissible phase error (4,) - 90' (45' on either side of center).
(4) Gain - balance mixer = 0.4 V/radian (assumed).
(5) Required loop gain - G = --&- = 2 MHz sin 90'
= 2 x 10% e
(6) Gain of VCO
(7) Gain of VCO and
G ’ = GVCo> (G4
1 MHz/volt.
phase detector -
DET) = (1 x lo6 cps/volt) (0.4 volts/radian1
2n
G' = 0.636 x 10%
(8) Gain to be added to loop by amplifier -
G = 2 x lo6
amP .0636 x lo6 = 31.4.
The mixer being used is an HP Model 10514A, a balanced mixer which
will operate between 0.2 MHz and 500 MHz and is designed for use
with 50-ohm systems. The amplifier stage is a single-ended non-
inverting DC amplifier which uses a Fairchild na 702 operational
amplifier for its active element. The voltage gain of the amplifier
is approximately 32 which is required to provide the necessary total
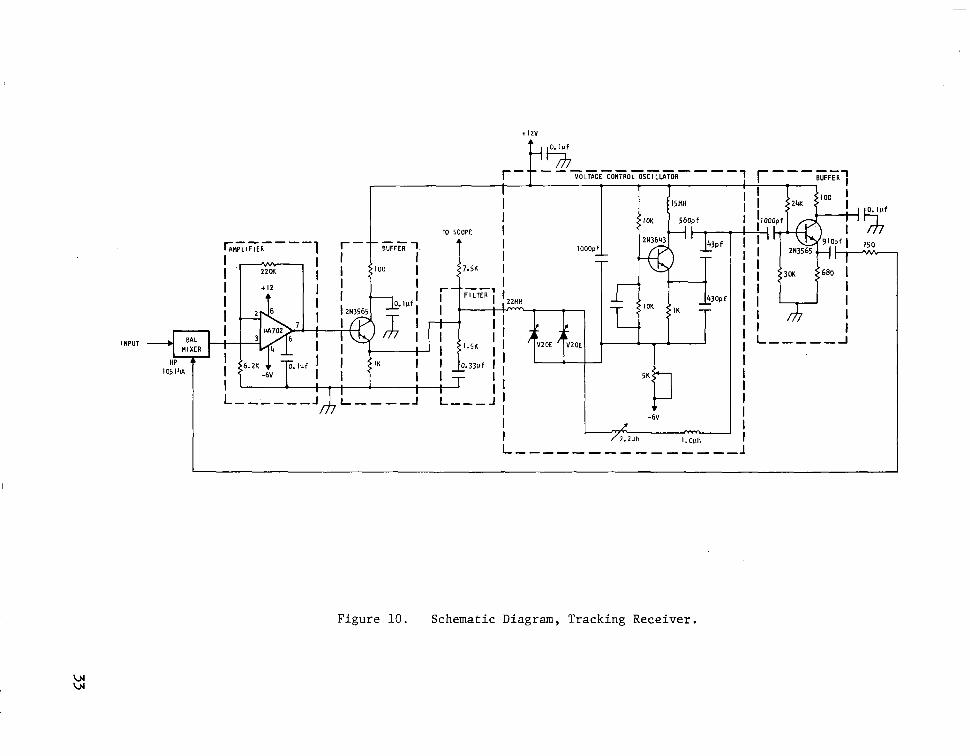
loop gain. See Figure 10 for complete schematic of the PLL system.
32
INPUT
r- VOLTAGE CONTROL OSCILLATOR I
I
--------- ------, ‘------~ 1 I I
I TO SCOPE i I
I&& I ’ I ! 9 I I T’O” f ‘” T
I L ------ J/j,L-.m-.A L---J; I
Figure 10. Schematic Diagram, Tracking Receiver.
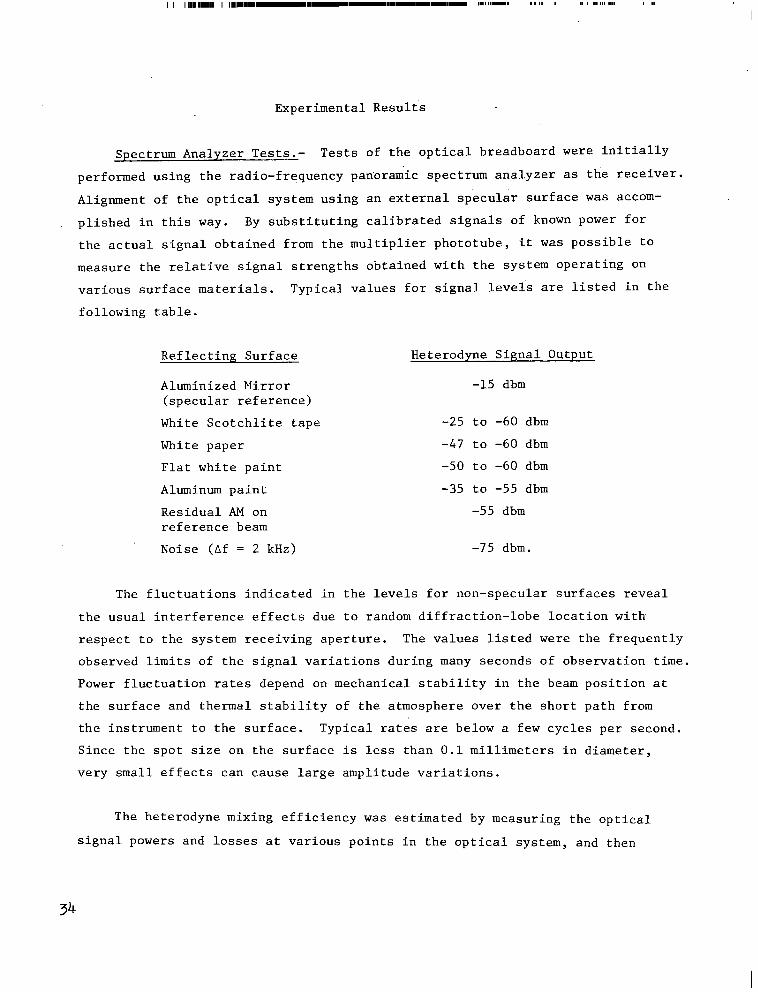
Experimental Results
Spectrum Analyzer Tests.- Tests of the optical breadboard were initially
performed using the radio-frequency panoramic spectrum analyzer as the receiver.
Alignment of the optical system using an external specular surface was accom-
plished in this way. By substituting calibrated signals of known power for
the actual signal obtained from the multiplier phototube, it was possible to
measure the relative signal strengths obtained with the system operating on
various surface materials. Typical values for signal levels are listed in the
following table.
Reflecting Surface Heterodyne Signal Output
Aluminized Mirror (specular reference)
White Scotchlite tape
White paper
Flat white paint
Aluminum paint
Residual AM on reference beam
Noise (Af = 2 kHz)
-15 dbm
-25 to -60 dbm
-47 to -60 dbm
-50 to -60 dbm
-35 to -55 dbm
-55 dbm
-75 dbm.
The fluctuations indicated in the levels for non-specular surfaces reveal
the usual interference effects due to random diffraction-lobe location with
respect to the system receiving aperture. The values listed were the frequently
observed limits of the signal variations during many seconds of observation time.
Power fluctuation rates depend on mechanical stability in the beam position at
the surface and thermal stability of the atmosphere over the short path from
the instrument to the surface. Typical rates are below a few cycles per second.
Since the spot size on the surface is less than 0.1 millimeters in diameter,
very small effects can cause large amplitude variations.
The heterodyne mixing efficiency was estimated by measuring the optical
signal powers and losses at various points in the optical system, and then
34
comparing the calculated phototube signal-to-noise ratio to that obtained
in practice. The value thus obtained was approximately lo%, although mea-
surements made later with the system readjusted inrdicated possibly twice
this efficiency. This quantity measures the effect of aberrations and mis-
alignment on the heterodyne beat signal; it is unity for an aberration-free
system. It is of interest that less than SO% of the laser power was incident
on the surface, due primarily to lens reflection losses in the breadboard
optical system. With every refractive element coated for minimum reflection
and very low loss mirrors, essentially all of this loss can be eliminated.
This indicates that a well-engineered working instrument canhave performance
substantially better than this initial breadboard version.
When the surface was vibrated, the velocity spectrum could easily be
examined using the spectrum analyzer. With the analyzer scan rate properly
set, the effects of amplitude fluctuations on this display usually are not
objectionable, since some time-averaging is performed.
Spectra of this type, obtained by driving the electrodynamic shaker
attached to the surface model, are shown in Figure 11. kt the lower fre-
quencies the motion amplitude is many wavelengths; thus the sidebands are
unresolved but the spectral spread is considerable, as in Figure 11 (a) and
(b).
At higher frequencies the sidebands are fewer and spaced so that they
are resolved, as in Figure 11 (d) and (e). Since the vibration frequency is
known, the amplitude can be determined from the spectrum, either from the
overall spread (indicating the peak-to-peak Doppler shift) at low frequencies
and large amplitudes, or from a table of Bessel functions for small vibrations
at frequencies for which the sidebands are resolved.
As an example, consider again the spectrum of Figure 11 (a). The sideband spread, measured by the calibrated marker in the spectrum analyzer, is 100 kHz.
35
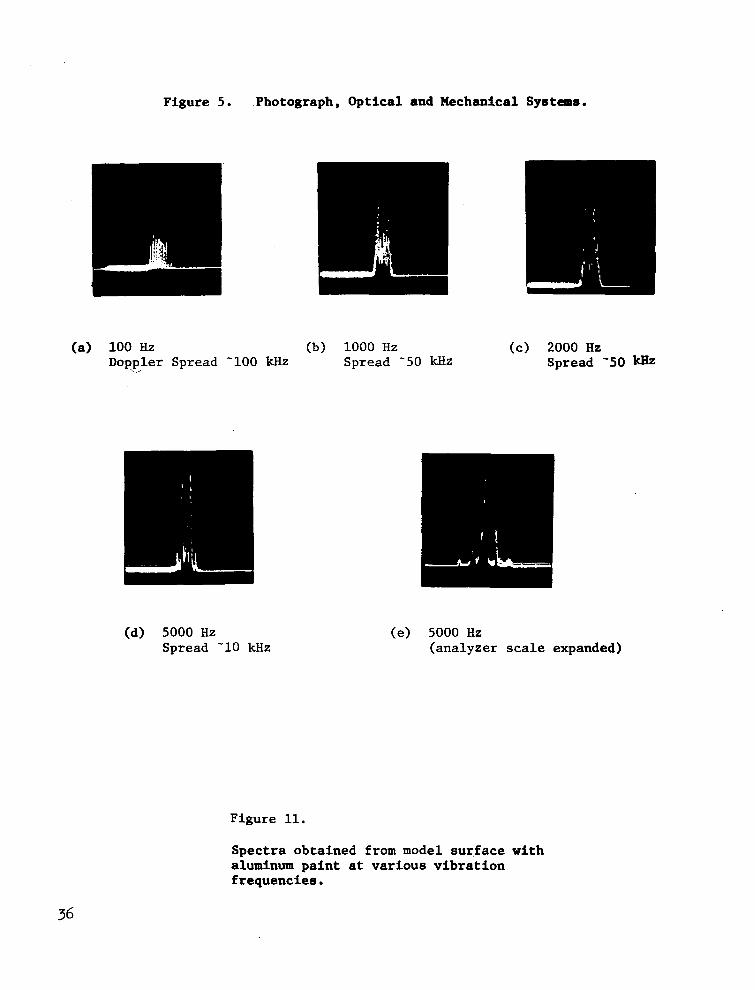
Figure 5. Photograph, Optical and Mechanical Systems.
(a) 100 Hz Doppler Spread
(b) 1000 Hz (c) 2000 Hz 100 kHz Spread -50 kHz Spread '50 kHZ
(d) 5000 Hz Spread -10 kHz
Figure 11.
(e) 5000 Hz (analyzer scale expanded)
Spectra obtained from model sur.face with aluminum paint at various vibration frequencies.
36
I -
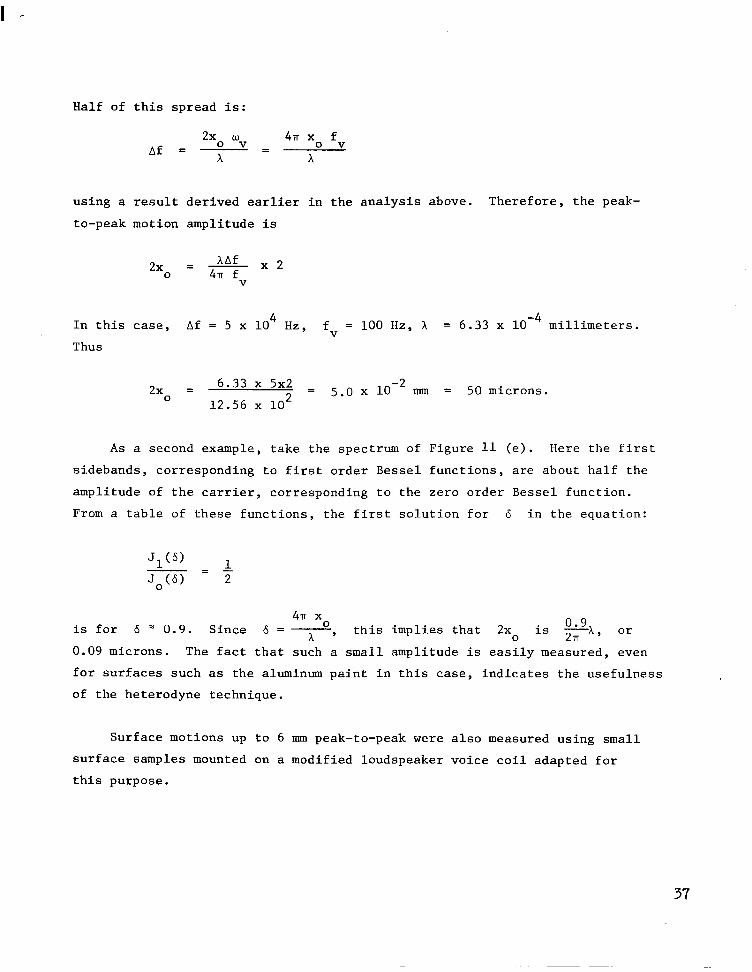
Half of this spread is:
2xo WV Af =x= 41T x0 f
V
)i
using a result derived earlier in the analysis above. Therefore, the peak-
to-peak motion amplitude is
2xo = * x 2 V
In this case, Af = 5 x lo4 Hz, fv = 100 Hz, X = 6.33 x 10 -4 millimeters.
Thus
2x0 = 6.33 x 5x2 = lo2
5.0 x 1o-2 mm = 50 microns. 12.56 x
As a second example, take the spectrum of Figure 11 (e). Here the first
sidebands, corresponding to first order Bessel functions, are about half the
amplitude of the carrier, corresponding to the zero order Bessel function.
From a table of these functions, the first solution for 6 in the equation:
J1(G - = 1 Jo@> 2
4Tr x is for 6 Z 0.9. Since 6 = *, this implies that 2x is - o.gA
0 27l ' Or 0.09 microns. The fact that such a small amplitude is easily measured, even
for surfaces such as the aluminum paint in this case, indicates the usefulness
of the heterodyne technique.
Surface motions up to 6 mm peak-to-peak were also measured using small
surface samples mounted on a modified loudspeaker voice coil adapted for
this purpose.
37
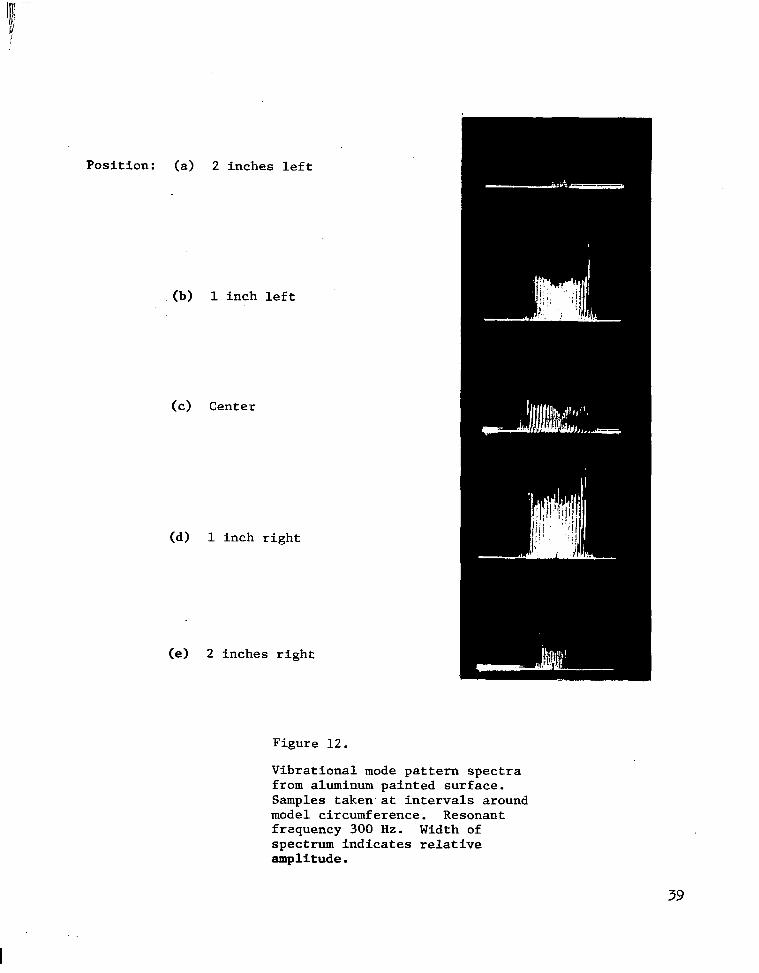
Modes on the structural surface model were also observed with the spectrum
analyzer receiver. This was done by moving the beam over the surface using
the S-inch steering mirror and measuring the spectrum width at each point by
the methods just outlined in the examples above. A typical scan is depicted
in Figure 12, taken on an aluminum-painted area on the structural surface
model. The spatial standing wave pattern set up by a vibrational resonance
at 300 Hz is indicated by the widths of the spectra at positions (a) through
(e> . This 4-inch scan covers approximately one-half of a spatial period of
the mode, with a normal velocity maximum located at the center of the scan.
A correlation between data taken in this manner and data taken using
the interference mapping technique is described in the experimental section
of this report for the interference technique.
Limiter-Discriminator Tests.- As soon as the limiter-discriminator
circuit was completed, it was tested in conjunction with the optical system
and the various simulator target surfaces. On the specular surfaces, the
circuit demodulated the target velocity information very well. With Scotchlite
reflective tape as a surface, the demodulated signal was often very good, but
there were frequent dropouts when the optical signal faded due to interference.
At first no signal could be obtained from the other diffusely reflecting
materials. At this point, gain was added to the receiver and a new plasma
tube was put in the laser. The results of Figure 13 are indicative of the
better performance obtained with these changes. Again the specular surface
gave very good results, with useful results from Scotchlite tape and poor
results on white paper.
The poor performance on "flat" diffuse reflectors is caused by a charac-
teristic of FM receivers of this type. This circuit must accommodate-modu-
lations of the 15 MHz carrier at very high deviation ratios, sometimes as
great as lo3 to ios. Thus the information bandwidth is quite small, only 2 kHz,
but the front end bandwidth in the RF stages must be at least 2.5 MHz. Provided
the limiting occurs due to signal voltage variations in the IF strip, the
38
Position: (a> 2 inches left
(b) 1 inch left
(c) Center
(d) 1 inch right
(e) 2 inches right
Figure 12.
Vibrational mode pattern spectra from aluminum painted surface. Samples taken.at intervals around model circumference. Resonant frequency 300 HZ. Width of spectrum indicates relative amplitude.
39
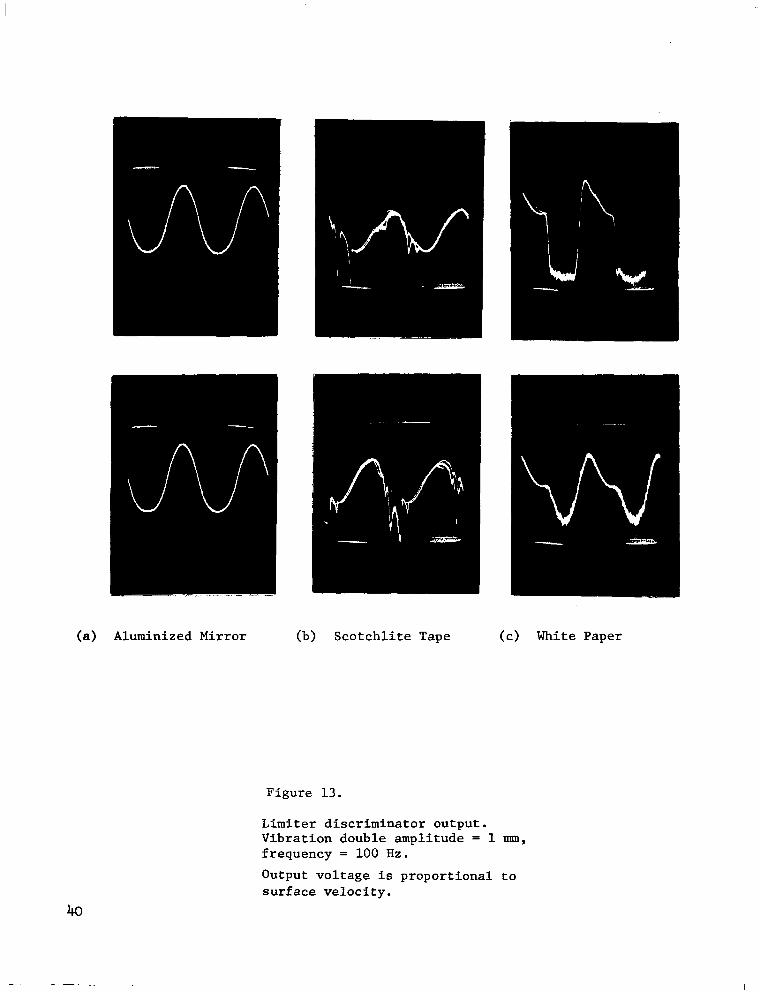
(a) Aluminized Mirror (b) Scotchlite Tape (12) White Paper
Figure 13.
Limiter discriminator output. Vibration double amplitude = 1 mm, frequency = 100 Hz.
Output voltage is proportional to surface velocity.
40
-.--_-. __
narrowband filtering in the post-detection audio stages is effective, and
receiver performance is good. The signal-to-noise ratio is that obtained for
a 2 kHz bandwidth. However, if the modulated signal falls below the rms level
of shot noise, referred to the front end bandwidth, the limiting is no longer
on signal but on broadband noise. The IF amplifier is then saturated at times
which have no relation to periods of maximum signal voltage, and the post-de-
tection filtering is not effective, The receiver behaves as though the infor-
mation bandwidth had expanded to greater than 2.5 MHz. For this reason, the
circuit fails to provide optimum response for weak signals.
Tracking Receiver Tests.- The tracking receiver was designed to avoid'.
the weak-signal limitations of the previous approach. A description of the
theory of operation of this receiver, as well as the design parameters, was
given above in the discussion of the experimental breadboard circuitry.
Preliminary tests of the first tracking circuit, with a servo bandwidth
of only a few hundred cycles per second, indicated that the small-signal per-
formance was greatly improved over the original limiter-discriminator design;
however, there was some problem in acquisition of the "lock-on" condition
when the signal was interrupted. Widening of the filter characteristic to :
approximately 2 kHz eliminated the signal acquisition difficulties, apparently
because large phase shifts occur only at rates low enough for good tracking
with this bandwidth. It is interesting to note that the servo loop bandwidth
may be less than the information bandwidth, since tracking is only required
to keep the mixing RF signals near phase quadrature. The mixer acts as a
phase demodulator even for frequencies at which the servo loop gain is greatly
reduced. In other words, error signals can exist at some points in the cir-
cuit even though the control loop fails to respond to these signals. System
bandwidth would then be determined by the bandwidth of the audio circuitry which
processes the error signal output.
Results obtained with the modified tracking receiver were generally
acceptable on all surfaces, with occasional signal dropouts on the white
41
paper, white paint, and reflective tape surfaces. The flat white paint
appeared to give the worst performance, while aluminum paint was nearly
as good as the reflective tape for near-normal incidence.
Figure 14 shows typical large vibration amplitude waveforms obtained
from a variety of surface samples attached to the vibrating loudspeaker coil.
The frequency'spread here was 2.5 MHz. Results at small amplitudes were also
excellent; frequency shifts of the order of 1000 Hz were easily measured,
with the limit at that level set by residual RF leakage and hum pickup in the
breadboard circuit, rather than by shot noise. For the aluminized mirror
surface, sensitivity was sufficient that tracking could be obtained at any
position of the focusing objective within its range of several inches.
The performance of the circuit at very low optical signal levels is
indicated in Figure 15. In this test the optical signal was deliberately
attenuated to levels near the receiver threshold. As the output voltage
traces indicate, the voltage controlled oscillator returns to its free-running
(zero signal) condition more frequently as the signal amplitude diminishes.
However, the portion of the cycle over which tracking does occur remains a
reasonably good record of the surface velocity at that time.
Using this receiver, tests were made of the.beam dither technique described
earlier in the section on heterodyne detection of diffusely reflected light.
The output beam was scanned sinusoidally over the vibrating surface at a 2 kHz
dither frequency, using a mirror on a resonant suspension driven by an electro-
dynamic coil. Dither amplitudes of several spot diameters were easily achieved
in this way.
The effect of beam dither on the receiver output waveform is shown in
Figure 16. The surface vibration frequency in this case was approximately
200 Hz, with a vibration level providing a peak frequency shift of 0.5 MHz.
The frequency modulation due to the 2 kHz scan appears as an additive modu-
lation. As the scan amplitude is increased, the receiver begins to drop out
42
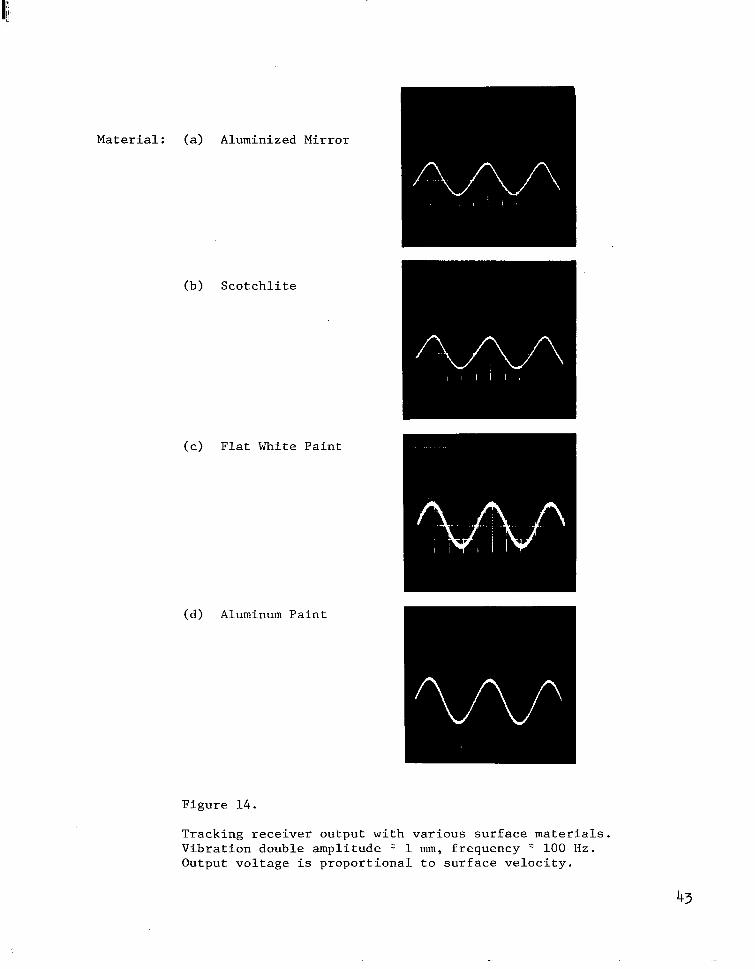
Material: (a) Aluminized Mirror
(b) Scotchlite
(c) Flat White Paint
(d) Aluminum Paint
Figure 14.
Tracking receiver output with various surface materials. Vibration double amplitude -2 1 mm, frequency Z 100 Hz. Output voltage is proportional to surface velocity.
43
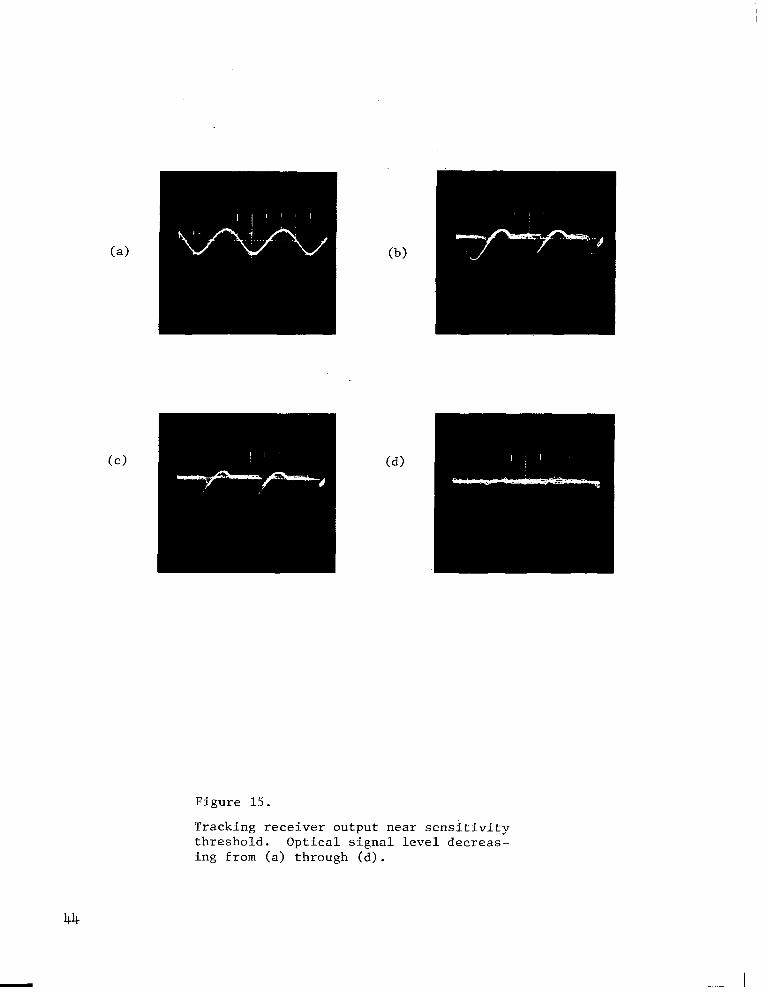
Figure 15.
Tracking receiver output near sensitivity threshold. Optical signal level decreas- ing from (a) through (d).
44
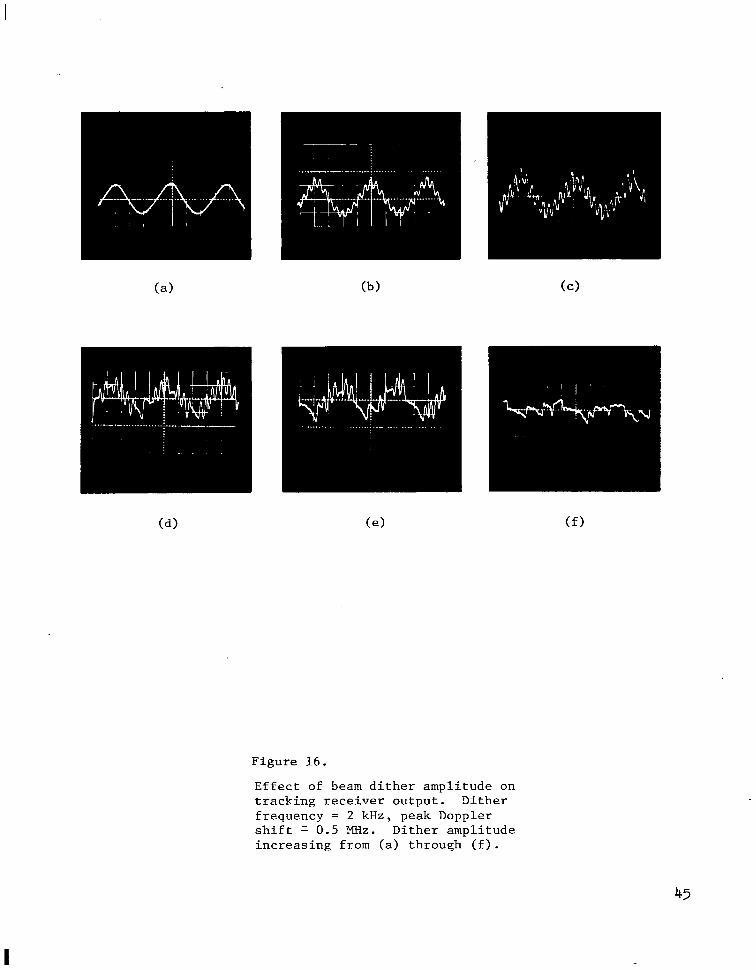
Figure 16.
Effect of beam dither amplitude on tracking receiver output. Dither frequency = 2 kHz, peak Doppler shift 1 0.5 MHz. Dither amplitude increasing from (a) through (f).
45
of lock more frequently. At amplitudes of only three spot diameters, the
output was often similar to that of Figure 16 (f), which bears little resem-
blance to the original signal. Thus th.e tracking fails just at levels where
statistical averaging becomes useful.
The problem here seems to be the roughness of the surface. Motion of
only one spot diameter apparently provides so large a phase shift that the
receiver cannot follow the frequency variations. The scan rate must be above
the vibration frequency in order for cycle-to-cycle averaging to be achieved.
Thus the sidebands from the dither can easily extend beyond the frequency
range over which the receiver is designed to work. The broad extent of the
dither-induced sidebands was verified using the spectrum analyzer to display
the heterodyne signal, as in Figure 17. The variations in the spectral en-
velope caused by focusing adjustments were clearly revealed. This spectrum,
of course, contains both amplitude and frequency modulation sidebands, since
both effects are present in the composite signal from the many randomly-phased
surface elements illuminated periodically by the sweeping beam.
It may still be possible to achieve signal enhancements using the dither
method, perhaps with a slower scan rate combined with a synchronizing technique
in which the output display is triggered only when the beam arrives at a point
on the surface providing sufficient optical power to allow the receiver to
track. Some further investigation beyond the results of the present study
may be justified, therefore.
Additional Experimental Datal- The focal depth calculation made earlier
was checked using the aluminized mirror as a reference surface. This mirror
was mounted on a micropositioner so that it could be moved along the axis of
the transmitted beam near the focal region. The heterodyne signal was mea-
sured by substitution at each point along the axis. The following table gives
the signal relative to that obtained at the best position, versus distance away
from the optimum spot.
46
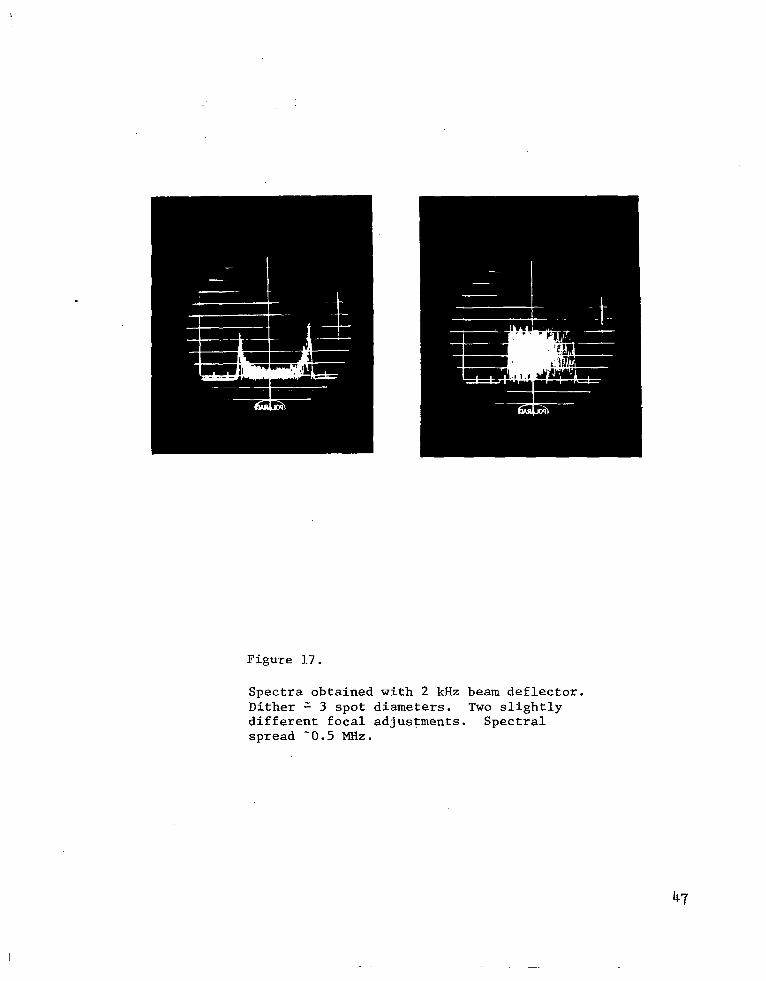
Figure 17.
Spectra obtained with 2 kHz beam deflector. Dither = 3 spot diameters. Two slightly different focal adjustments. Spectral spread '0.5 MHz.
47
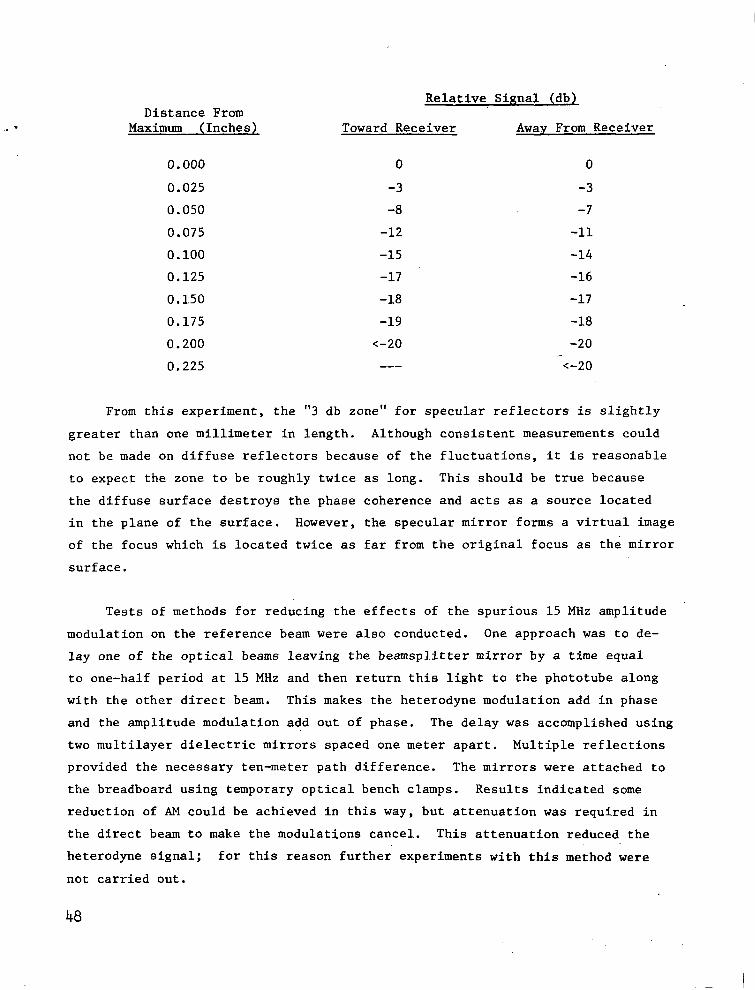
Distance From Maximum (Inches)
Relative Signal (db)
Toward Receiver Away From Receiver
0.000 0 0
0.025 -3 -3
0.050 -8 -7
0.075 -12 -11
0.100 -15 -14
0.125 -17 -16
0.150 -18 -17
0.175 -19 -18
0.200 c-20 -20
0.225 -em c-20
From this experiment, the "3 db zone" for specular reflectors is slightly
greater than one millimeter in length. Although consistent measurements could
not be made on diffuse reflectors because of the fluctuations, it is reasonable
to expect the zone to be roughly twice as long. This should be true because
the diffuse surface destroys the phase coherence and acts as a source located
in the plane of the surface. However, the specular mirror forms a virtual image
of the focus which is located twice as far from the original focus as the mirror
surface.
Tests of methods for reducing the effects of the spurious 15 MHz amplitude
modulation on the reference beam were also conducted. One approach was to de-
lay one of the optical beams leaving the beamsplitter mirror by a time equal
to one-half period at 15 MHz and then return this light to the phototube along
with the other direct beam. This makes the heterodyne modulation add in phase
and the amplitude modulation add out of phase. The delay was accomplished using
two multilayer dielectric mirrors spaced one meter apart. Multiple reflections
provided the necessary ten-meter path difference. The mirrors were attached to
the breadboard using temporary optical bench clamps. Results indicated some
reduction of AM could be achieved in this way, but attenuation was required in
the direct beam to make the modulations cancel. This attenuation reduced the
heterodyne signal; for this reason further experiments with this method were
not carried out.
48
A second, very successful technique was then demonstrated. This in-
volves the addition of a suitably phased RF signal to the heterodyne output,
SO that the residual AM signal is cancelled. This was done by taking power
from the signal source for the diffraction cell. The injected signal was
passed through a large isolation resistor and added to the signal leaving
the multiplier'phototube. A variable attenuator and coaxial delay line were
used to adjust the phase and amplitude for best suppression of the spurious
15 MHz modulation. It was found that the best adjustments reduced the unde-
sired signal to an unmeasurable level, using the spectrum analyzer or the other
receivers. This experiment proved that even without balanced mixer operation,
a single detector can be used with no AM interference from the frequency
translator.
Of course, these methods are of interest only in experiments in which only
a single optical detector can be used. In an operational instrument, the bal-
anced mixer configuration with two detectors is always superior.
49
INTERFERENCE MAPPING
The interference mapping technique is a method, developed during the
initial study phase of this work, for obtaining qualitative information
about the vibrational modes of diffuse reflectors. It is of practical in-
terest because it can greatly reduce the number of surface points at which
quantitative data is needed, and easily presents a graphic picture of the
surface motion even for very complex modes. During this phase of the study,
the technique was investigated experimentally using the cylindrical model
structure excited by the Goodmans shaker. Comparisons of results obtained
:- in this way with scans made using the heterodyne system were made. Also,
the effects of different surface paints on the visibility of the interference
patterns have been noted. The method has also been extended to include pre-
cision measurement of the axis-of rotation of diffusely reflecting objects.
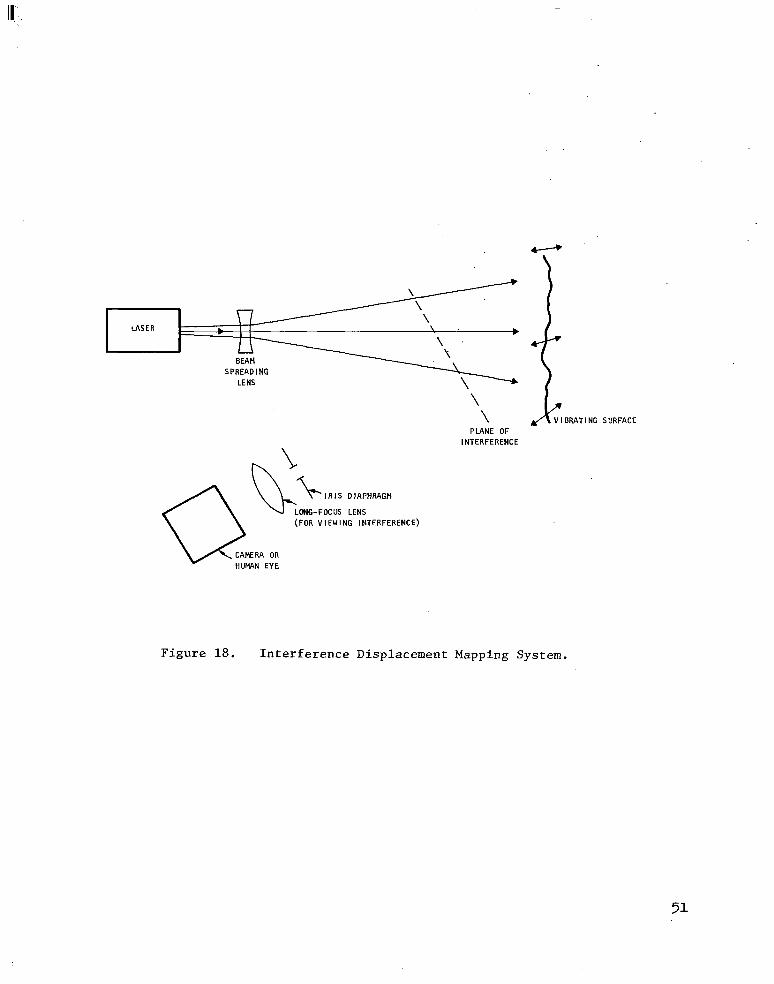
Analysis
The basic configuration used in interference mapping is shown in Figure
18. A large area on the object is illuminated by the laser beam, and the in-
terference produced by the diffusely reflected light is viewed in some plane
in front of the surface using a lens and iris diaphragm. From simple ray
optical considerations, it is clear that the iris permits only a small area
on the surface to reflect light through a point in the interference plane
and also through the iris. The fraction of reflected light that satisfies
this geometrical condition is useful for viewing the pattern. Note that
there is good correlation between points on the surface and points in the
observed pattern. The approximate width of a surface region within which
all points reflect useful light through a single point in the observed pattern
is given by:
L w zwJ
r iL i'
LENS
\ \
PLANE OF INTERFERENCE
Q v- -L- IRIS DIAPHRACH
LONG-FOCUS LENS (FOR VIEW I NC INTERFERENCE)
CAMEERA OR HUW\N EYE
:1: VI BRATI NC SURFACE
Figure 18. Interference Displacement Mapping System.
51
where w r is the diameter of the region, .mi is the diameter of the iris,
Lr is the distance between the region and the interference plane, and Li
is the distance from the plane to the iris. For normal viewing the focal
length of the viewing lens is made equal to Li.
The sensitivity of the method depends on the fact that the width wL
of a lobe (a bright spot) in the interference pattern is given by:
wL = Lr " = Li " . r i
Since this is a diffraction-limited interference effect, a uniform change
in phase across wr of about one cycle will move the lobe laterally through
a distance roughly equal to its width. A tilt of the surface due to a gra-
dient in the normal component of displacement will accomplish just such a
phase shift if the differential displacement is about ~12 across the dis-
tance wr* For differential displacements greater than this, at frequencies
unresolved by the human observer or the photographic exposure, the pattern
areas corresponding to the tilting surface areas will be streaked in the
direction of the gradient. This s'treaking of the interference pattern is
the effect of interest using this method. The vibration level at which
streaking begins to appear is therefore that amplitude for which the peak
difference in displacement for points on the surface separated by w r is just
x/2. The minimum tilt angle is therefore:
x Li h CL =2wr= q2w * i
Thus if the motion is to be resolved over surface elements as small as 5 milli-
meters (=wr) and the wavelength is roughly 10 -3 millimeters, the minimum de-
tectable tilt angle is 10 -4 radian, and the peak differential displacement is
of course 10 -3 millimeters. Sensitivity in this range is useful because it is
good enough for many practical applications yet not so good that minor ambient
vibrations disturb the result.
52
The effect of translation of the surface during observation is of im-
portance for applications in which the structure is excited by a linear
displacement, as in a shake table test. The interference is directly cor-
related with the position of the surface if the illuminator is located at
any practical distance from the structure. Therefore a translation of the
structure through a distance Ax imposes an identical displacement in the
pattern. Since Ax will always be present at some level, it is important
to determine how large it can be before it substantially affects the sensi-
tivity of the method. This is easily found by equating the translation and
the lobe width:
(Ax)~~~ = WL = Lr " = Li " . r i
In a real situation, X and Ax may be fixed. But Li and wi are con-
trolled by the operator; thus if space permits, it is always possible to
increase the iris distance L i until Ax is less than wL. For the numbers
in the example above, with w = 5 mm and r Ax = 0.1 mm, Lr = 0.5 meters.
If we choose wi = wr, then L i also is 0.5 meters, and the total distance
from the observer to the surface is a minimum of one meter, a reasonable sepa-
ration. Thus the method is practical in such cases.
Rotational motion of the surface can also be detected by this method.
The interference pattern at any distance from the surface rotates with the
surface, so that for rotation angles greater than a few degrees the circular
streaking is easily seen. The axis is indicated by the point in the inter-
ference pattern where the streaking reduces to zero. This is easily found
since all the streaks are concentric with the axis. If two interference planes
are examined, at different distances from the surface, the direction of the
rotational axis is then determined within an error equal to one lobe width
%* The angular accuracy of this measurement of the axial direction is very
good; the error is the angle CL = x/wr, which is easily made to be 10 -4
radians for practical values of *r* Evidently the illuminated region
53
determines its axis of rotation to within the diffraction limit for that
area as a coherent optical aperture. This interesting fact may be appli-
cable for finding rotational axes of vibration of very compliant structures,
and it also looks promising as a. tool for precision alignment of bearings
where the axis is not accessible, or for gyroscopic readout, etc.
Experimental Results
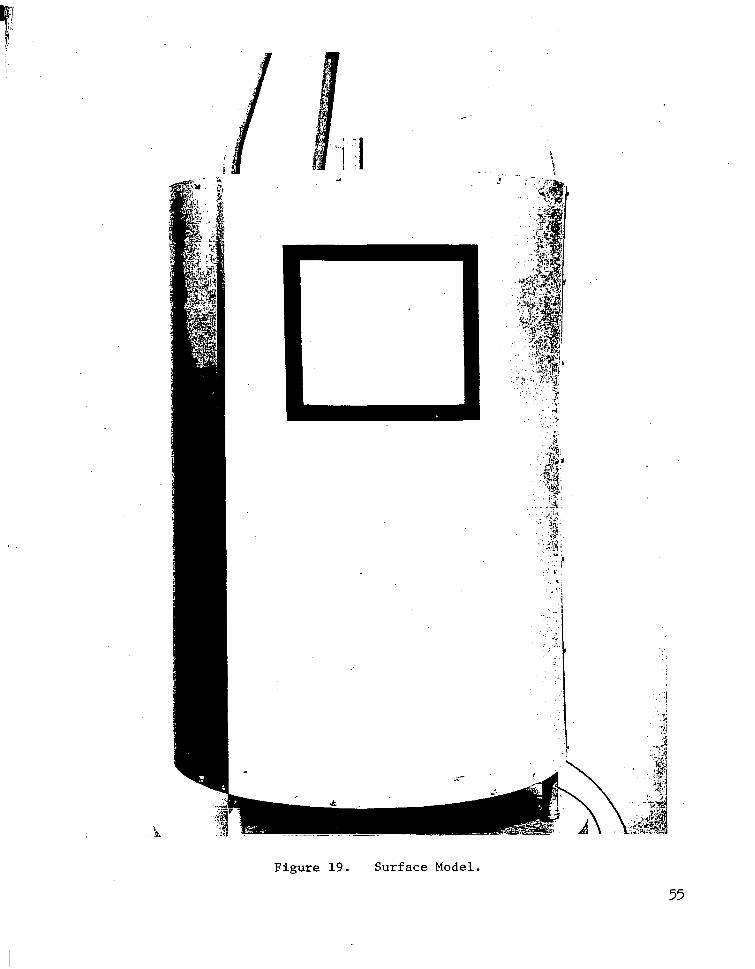
Surface Model.- -For tests with the interference mapping technique, as well
as with the intermediate frequency heterodyne breadboard, a surface model
was constructed. This is shown in Figure 19. The model is a hollow cylinder
18 inches in diameter and 28 inches high. The ends of the cylinder are
circular aluminum bulkhead plates l/2 inch thick, and the wall is a sheet
of aluminum 0.050 inches thick screwed to the outside of the end plates and
fastened along the vertical seam. The end plates are supported on three
steel tubes which run the length of the model inside the sheet metal cylinder.
The cylinder rests on rubber feet attached to the ends of the tubes, and a
Goodmans Industries Model 390A shaker is bolted to the bottom plate and also
to the platform on which the model rests. The rubber feet act as a compliant
suspension so that the model can be vibrated along a vertical axis by the
shaker. Resonant modes of the structure with displacements in various di-
rections can be excited through the mechanical cross-coupling in the structure.
One third-of the outside cylinder area was left unpainted; the other
two thirds were coated with aluminum paint and flat white paint. The purpose
of this was to test the optical properties of these surfaces as they relate
to the two methods of measurement under investigation.
Test Results.- A Spectra-Physics Model 116 laser with approximately 10 milli-
watts output at 63282 was used as an illuminator. Lenses were used to spread
the beam to a diameter of approximately 10 inches on the surface. Visibility
.
54
i i
:
Figure 19. Suirface Model.
55
of the patterns was compared using the three different surfaces of the model.
As expected, the flat white surface gives very even illumination of the pat-
terns, even over areas including considerable surface curvature. Photographs
taken of these patterns show the same uniformity.
The unpainted metal surface has a relatively strcng forward "coherent"
component of reflection with relatively poor illumination of patterns above
the surface areas that were not oriented correctly for specular reflection.
This tends to reduce the useful field of.view; however, the patterns which
do lie in the specular part of the reflection can be viewed with much less
laser power. Photographic exposure time would be greatly reduced compared to
that required for white paint. Also, the viewing distance may be increased,
thus allowing additional rejection of pattern blur due to translational motion.
The aluminum paint represents a case between the two extremes described
above. There is definitely a strong forward component, but it is not as
narrow as with the unpainted surface.
Patterns observed above precision-machined surfaces occasionally contained
diffraction streaks due to the marks left by the cutting tool. These patterns
can be confusing if the motion to be detected is not very large. Consequently,
it seems desirable to paint any surfaces of this type before testing in this
manner, if such a procedure is possible.
Photographs of the standing wave modes on the model surface at 300 Hz are
shown in Figures 20 and 21. The first figure shows the stationary pattern with
zero vibration amplitude; the second is the pattern obtained with the shaker
turned on. The black square in both pictures is the same area as that shown
in Figure 19, with sides about 7 inches long. The mode revealed in Figure 21
shows horizontal streaking over the central half of the square, with stationary
nodes located about one third of the distance from the vertical edges to the
center of the square. These longitudinal nodes run the entire length of the
56
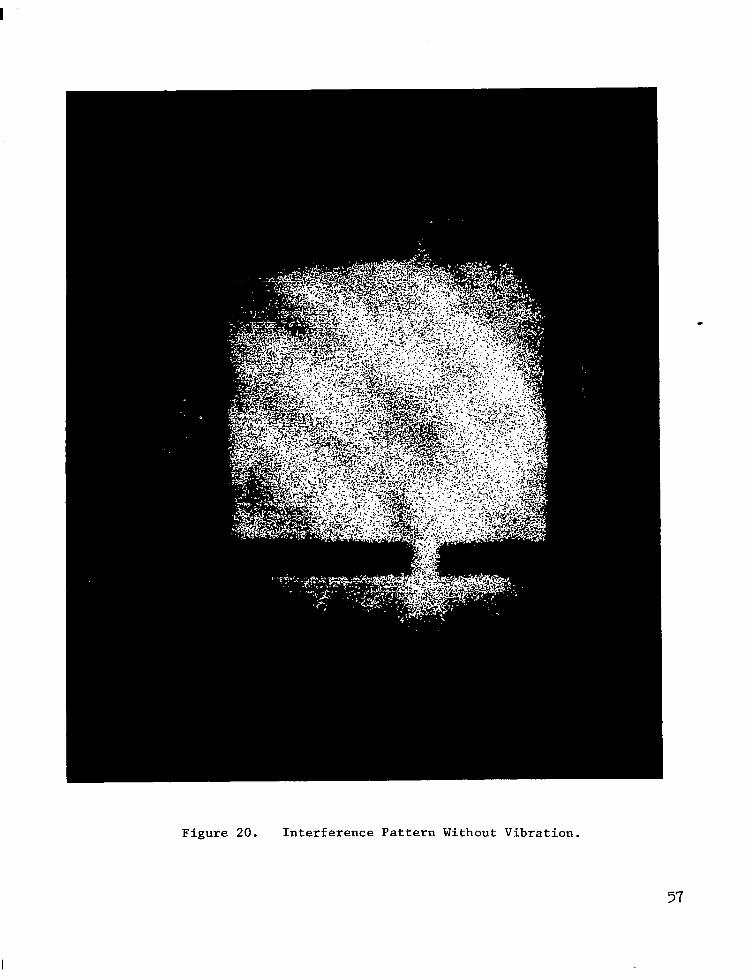
Figure 20. Interference Pattern Without Vibration.
57
.
Figure 21. Interference Pattern With Vibrat'ion.
58
model at the 300-Hz resonant frequency. The nodes represent zones where the
surface tilt is minimized; consequently, we would expect the normal velocity
to be a minimum or a maximum there. This was verified using the heterodyne
system, as Figure 22 indicates. The heterodyne beam was moved across the sur-
face and the vibration spectrum recorded at four points. The node on the
left was found to be a velocity maximum.
Observation of the effects predicted for surface rotation was done visually.
Expected results described in the analysis above were verified, but it was also
noticed that, even with the illuminated area well away from the point on the
surface at the axis of rotation, the concentricity of the streaking could be
identified. This had not been obvious in the analysis, since this is a case
in which different, entirely uncorrelated surface areas move under the beam
at different times during the rotation. In this case the patterns not only
rotate but constantly merge into new patterns. However, it is not difficult
to interpret the motion of these complex patterns visually to determine the
center of rotation.
59
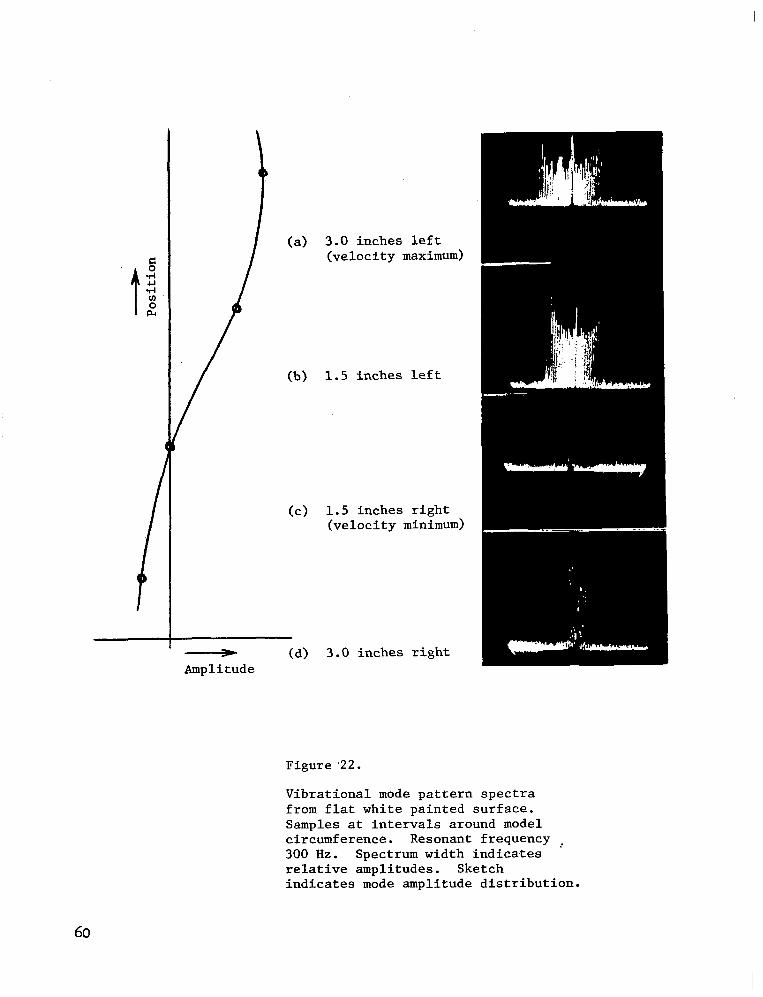
(a) 3.0 inches left (velocity maximum)
(b) 1.5 inches left
(c) 1.5 inches right (velocity minimum)
4 (d) 3.0 inches right Amplitude
Figure 22.
Vibrational mode pattern spectra from flat white painted surface. Samples at intervals around model circumference. Resonant frequency ~ 300 Hz. Spectrum width indicates relative amplitudes. Sketch indicates mode amplitude distribution.
60
CONCLUSION
The intermediate frequency optical heterodyne system has been extensively
tested in breadboard form, It has been possible to obtain measurements of
vibrations of a variety of surface types, over a wide range of amplitudes and
frequencies. The quality of these measurements, which have been made using
equipment which is realistic but certainly not optimum, indicates the prac-
tical utility of this technique. Additional study effort in this area would
logically include an investigation of other laser sources, such as high power,
mode-locked lasers, using the types of receivers developed during the present
study. There is the possibility that further work with the beam dither idea
might provide a better answer to the problem of heterodyne detection of dif-
fusely reflected light. However, most of the work remaining in this area is
primarily concerned with instrument design, which is best done after speci-
fications for a particular application have been determined. The absence
of frequency response limitations and the extremely good sensitivity to small
motions make the optical heterodyne a useful tool in transducer and sensor
calibration as well as for analysis of modes on larger structures. The re-
sults with the beam dither technique also indicate that the heterodyne system
may be very useful in measuring surface roughness.
It is clear from the performance data obtained in this study that an in-
strument operating on this principle can now be constructed with assurance
that good results can be obtained in a wide range of applications, as mentioned
above.
In these experiments the interference mapping technique has been a useful
means for observing the behavior of modes on compliant portions of the model
structure. Comparisons of the results of both methods show good agreement
and also verify that the analysis of the mapping process is essentially an
accurate one. The application of this method to location of rotational axes
has been pointed out.
61
REFERENCES
The following is a brief list of references related to the present
areas of investigation.
a) Optical Heterodyne Detection
1. Oliver, B. M.: Signal to Noise Ratios in Photoelectric Mixing. Proc. IRE (Correspondence), vol. 49, Dec. 1961, p. 1960.
2. Haus, H. A., Townes, C. H., and Oliver, B. M.: Comments on Noise in Photoelectric Mixing. Proc. IRE (Correspondence), vol. 50, June 1962, p. 1544.
3. Gould, G., Jacobs, S., LaTourrette, J., Newstein, M., and Rabinowitz, P.: Coherent Detection of Light Scattered from a Diffusely Reflecting Sur- face. Appl. Optics, vol. 3, no. 5, May 1964, pp. 648-649.
4. Siegman, A. E.: The Antenna Properties of Optical Heterodyne Receivers. Appl. Optics, vol. 5, no. 10, Oct. 1966, pp. 1588-1594.
b) Optical Frequency Translation
1.
2.
3.
4.
5.
Cummins, H. Z., and Knable, N.: Single Sideband Modulation of Coherent Light by Bragg Reflection from Acoustical Waves. Proc. IEEE (Corres- pondence), vol. 51, Sept. 1963, p. 1246.
Cook, B. D., and Hiedemann, E. A.: Diffraction of Light by Ultrasonic Waves of Various Standing Wave Ratios. J. Acoust. Sot. Am., vol. 33, no. 7, July 1961, pp. 945-948.
Kleinhans, W., and Fried, D. L.: Efficient Diffraction of Light from Acoustic Waves in Water. Appl. Phys. Letters, vol. 7, no. 1, 1 July 1965, pp. 19-21.
Willard, G. W.: Criteria for Normal and Abnormal Ultrasonic Light Diffraction Effects. J. Acoust. Sot. Am., vol. 21, no. 2, March 1949, pp. 101-108.
Hargrove, L. E.: Optical Effects of Ultrasonic Waves Producing Phase and Amplitude Modulation. J. Acoust. Sot. Am., vol. 34, no. 10, Oct. 1962, pp. 1547-1552.
c> Laser Interference Patterns
1. Rigden, J. D., and Gordon, E. I.: The Granularity of Scattered Optical Maser Light. Proc. IRE, vol. 50, Nov. 1962, pp. 2362-2368.
2. Huntley, Jr., W. H.: New Coherent Light Diffraction Technique. IEEE Spectrum, vol. 1, Jan. 1964, p. 118.
3. Goldfischer, L. I.: Autocorrelation Function and Power Spectral Density of Laser-Produced Speckle Patterns. J. Opt. Sot. Am., vol. 55, no. 3, March 1965, pp. 247-253.
62
APPENDIX A
PHOTOMIXING WITH DIFFUSELY REFLECTED LIGHT
G. A. Massey
Published in Applied Optics, Vol. 4, No. 7, July 1965, pp. 781-784.
63
Reprinted from APPLIED OPTICS. Vol. 4. page 781. July 1965 Copyright 1965 by the Optical Society of America and reprinted by permissmn of the copyright owner
Photomixing with Diffusely Reflected Light
G. A. Massey
I method is presented for estimat.ing the sensit.ivity of a coherent opkrl heterodynr rerciver in ~h~lc:~~l- ing laser radiation reflected from a diffuse surface. A configuratirjn t.ypical of many opt ic%I rad:~’ :lppli- cations is considered, and the effects of transmitt,er beam size, receiver aperture, and helcrodyne field IIf view on the beat frequency signal are calculated. Two idealized surface models are u*etl in the :IIM~JS~S.
It is shown that the size of the scattering reflector elements in the surface can aRect t.he opt.imum <cl. llf receiver parameters. The range of values of these parameters for most efficient detection is derived fljr both surface types and a given transmitter beam angle. The advant.age of a receiver wilh l:uge ul)“rtllrr and field of view equal to the transmitted beam width is demonstrated. The magnitude+ of err~~r* in-
troduced by the simplifying approximations are discussed.
I. Introduction III SOIW applications it may be useful to employ co-
IWWI~ detect ion techniques in an optical receiver which c:ollects laser lighi reflected from a rough surface. Cnhrrcnt~ rcceptjon of diffusely reflected radiation at 6.78 A has bcol accomplished in t.his laborat,ory using a variety df reflector materials at distances up to several nretcrs from t hc receiver. Recently otJ~e~~ workers have reported similar theoretical and experimental resuks for one particular transmit.ter-receiver confikurati0n.l This paper treats the c*ase in whirh a coherent trans- mit.t.er iIlumina~es a uniform, circular area on the re- flecting surface, and the relative dctcction efficiency of a coherent, rccciver system is calculated as a function of receiver design parameters. Because the optical char- ackerisfics of t.he surface affect the receiver perform- ance, two rrprcsentat,ive surface models have been con- sidered in f he analysis.
II. Surface Characteristics It is assumed t,hat the reflecting surface is illuminated
by a linearly polarized plane wave of wavelength X. The illuminated arca is a disk of diameter d. Two types of surfaces can be considered, bot,h of which have the propert,y of reflecting a collimated incident wave over a large solid angle.
This classificat,ion was made after a number of mat.erials were illuminat,ed by a 6328-A He-Ne laser and examined wit.h a microscope of large numerical aperture. Some surfaces, such as paper, certain types of paint, and roughly cut metal, appeared t.o contain many point source reflectors even under the highest
~- .- The author is with Electronic Defense Laboratories, Sylvania
Electronic Syst.ems, Mount.ain View, California. Received 0 October 1964.
magnificat.ion. Other materials, including rough- ground glass, produced extended illumination wilh in- terference palterns; this suggests t.hat ~hc: surfacr WII- tains smooth areas that are considerably INOW IIL~II a
wavelength across. The surface n~~lols &owl IO rcbp- resent these mat.crials in t.hc analysis ar(t:
Type A : small elenlen ts. The eletncn 1 ary arc-a ovcl which the phase of the reflected wave: rclllnitls (IS- sentially uniform is about one wavclcngth across, and the phases of waves reflected from different clcmcnts are random. E’or this model, t.he light from PWI~ &- ment diffracts into a large solid angle, and all c:lclllenls contribute light to each point, in the far-fi&l pal Iern. This model t.ypifics a surface such as paper.
Type B: large elements. The element. arcas pro- ducing nearly uniphase reflected light arc largcb corn-- pared t.o a wavclengt,h but are tilted at random angks to the incoming radiation. The reflected lobe of a single element is much narrower than for type A; IWI~CC,
not all elements cont,ribute light, to any one point in I he far-field pattern. A ground glass surface might br an example of a type B surface.
For eit,her type, the number N of Itearly uniphasr surface elements wikhin the illumirlakd diarncfcr rl can be as small as unity, if d is reduced to one clcmerlf. diameter. N is never larger than approxilllatcly (d/Q *, since the area of the smallest, type A clement is about X2. The size of the element,s and the spot, size affect the far-field intensi t,y patterns. It is possible to avoid a consideration of the far-field interference by analyzing the phase effects directly in the plant of t.hc photodetector.
Ill. Receiver In a coherent receiver, the collected signal wave is
superimposed on a local oscillator wave on the sur-
July 1965 / Vol. 4, No. 7 / APPLIED OPTICS 781
64
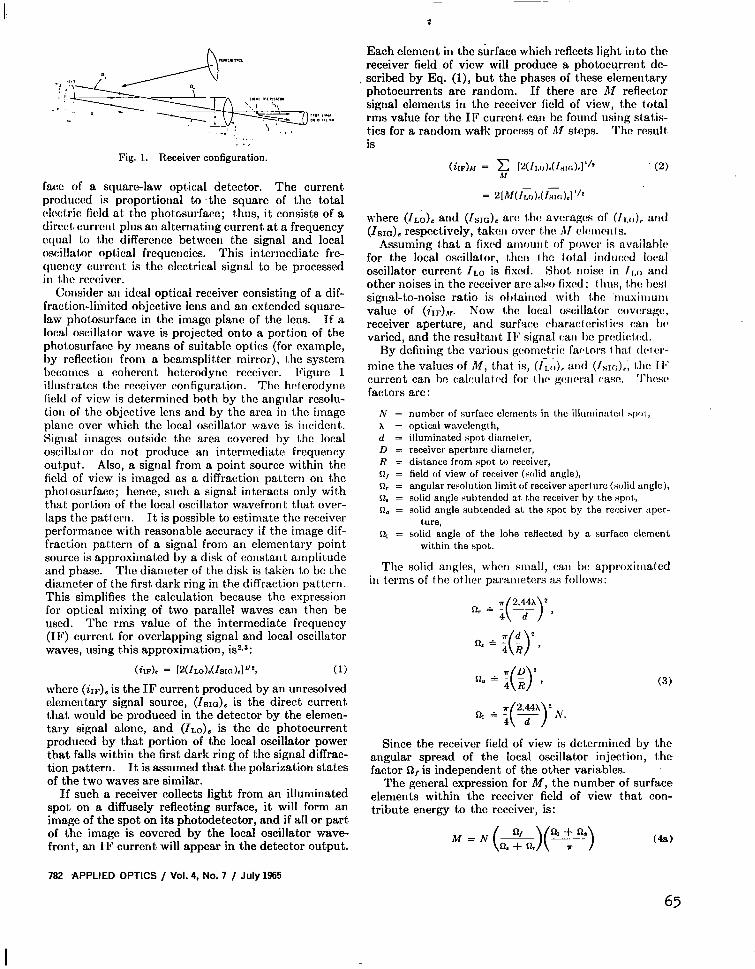
T
., Fig. 1. Receiver configuration.
fact of a square-law optical detector. The current produced is proportional to ,the square of the total c!lcc:i.ric field at. t,he photosurface; t,hus, it consists of a dirccl, currcnl plus an alternating current, at a frequency equal to the differcncc between the signal and local oscillal.or optical frequencies. This intermediate fre- quency current is the electrical signal to be processed in t,hc rcccivcr.
Consider an idcal optical receiver consisting of a dif- fraction-limited objective lens and an extended square- law photosurface in the image plane of the lens. If a local oscillator wave is projected onto a portion of the photosurfacc hy means of suitabla opl.ics (for example, by reflection from a bcamsplitter mirror), l.hc system becomes a coherent heterodync receiver. Vigure 1 illustrates l.hc receiver configuralion. The hcl.crodyne field of view is determined both by the angular rcsolu- tion of the objective lens and by the area in the image plane over which the local oscillator wave is incident. Signal images outside the area covered hy Lhc local oscillator do not produce an intermediate frequency output. Also, a signal from a point source within tho field of view is imaged as a diffraction pattern on the phol.osurface; hence, such a signal interacts only witah t.hat portion of the local oscillator wavefront that, over- laps the patf err). It is possible to estimate the receive1 performance with reasonable accuracy if the image dif- fraction pattern of a signal from an elementary point source is approximated by a disk of constant amplitude and phase. The diameter of the disk is taken to be the diameter of the first. dark ring in the diffraction pattern. This simplifies the calculation because the expression for optical mixing of two parallel waves can then be used. The rms value of the intermediate frequency (IF) current for overlapping signal and local oscillat.or waves, using this approximation, is2J:
(iw)r = lWLoM~arr.Ll”*, (1)
where (&), is the IF current produced by an unresolved elementary signal source, (Z&c is the direct current) that would be produced in the detector by the elemen- tary signal alone, and (ZL~)~ is the dc photocurrent produced by that portion of the local oscillator power that falls within the first dark ring of the signal diffrac- tion pattern. It is assumed that the polarization states of the two waves are similar.
If such a receiver collects light from an illuminated spot on a diffusely reflecting surface, it will form an image of the spot on its photodetector, and if all or part of the image is covered by the local oscillator wave- front, an IF current will appear in the detector output.
782 APPLIED OPTICS / Vol. 4, No. 7 / July 1965
Each clement in the &face which reflects light into the receiver field of view will produce a photocurrent de- scribed by Eq. (l), but the phases of these elementary photocurrents are random. If there arc Al reflecbor signal elements in the receiver field of view, the total rms value for the IF current, can be found using statis- t.ics for a randotn watk process of M steps. Tho result is
(iwh = G 12(f,.r,).(I,,(:).l”’
= 2IM(f,.o),(l~:).l”~
(2)
where (ILO)= and (Zstc)c arc: t.hc: avcragcs of (/r.o)C and (ZSIo)e rcspcctivcly, taken over iho dl clcni~~l s.
Assuming t.hat a fixchd amount. of power is availahhb for the local oscillalor, then I hc total ittducc~tl local oscillator current ZL~ is fix&. Shot noise in Ir.,, and other noises in the rcccivcr arc: also fixed: thus, i.hc 1)~ signal-to-noise ratio is ol~l.aitwd with the mnsinmnl value of (iI,),,. ITow the local oscillator covwa~c!, receiver aperture, and surface characfcrist ic*s can by varied, and the resultant 111’ signal calI I)c prc:dic:l.c:d.
By defining the various gc!nmc:tric: facQrs i hni (l(~tr:r- mine the values of Af, that is, (ILo), alltl (/S~~)r, t.hc Il.’ current can hc calculatcxl for 1 Iw gcw~ral c.asc. ‘I’hl!sc~ factors are :
N= A = d = D= R = 0, = R, = R. = R. =
R, =
The
number of surface elements in I.he illuminnt.c~l S~III, optical wavelengl h, illuminated spot diamelcr, receiver aperture diameter, distance from spot to receiver, field of view of receiver (solid anglej, angular resotut.ion limit trf receiver aperl.ure (s&l anglej, solid angle subtended at, t.he receiver hy t.he spot, solid angle subtended al. the spot by the receiver apcr-
tare, solid angle of the lohe reflected hy a surface clement
within the spot.
solid angles, when small, can bc approxitnated _. . ^ . . ill terms of t hc other paralnetcrs as follows:
iv.
(3)
Since the receiver field of view is determined by the angular spread of the local oscillator injection, t.he factor Q, is independent of the other variables.
The general expression for M, the number of surface elements within the receiver field of view that con- tribute energy to the receiver, is:
M = h’&)(F) (4a)
65
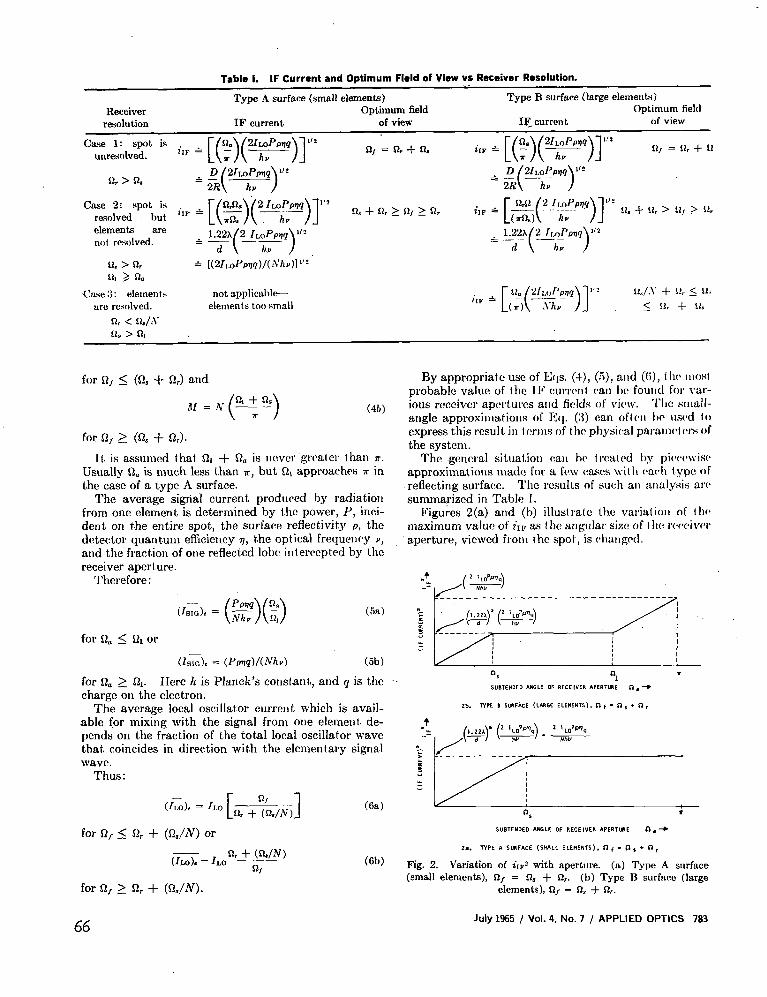
Receiver resolution
Case 1: spot is unresolved.
Table 1. IF Currant and Optimum Field of View vs Receiver Resolution. -- Type A surface (small elements) Type B surface (large elements)
Optimum field Optimum field IF current of view IF_ current of view
QJ = % -+ n. II, = II, + l!
Case 2: spot is resolved h”t ilF f [(g(2qy)]“’ 12, + R, 2 R, 2 n,
elements are not resolved.
Case 7: elements I . not applicnhle- arc resolved. elements t,oo small
for Q, 5 (52, + Q,) and
It is assumed that Q, + Q, is ncvcr -greater than K. Usually Q, is much less than Z, but ‘& approaches T in the case of a type A surface.
The average sigrial current produced by radiation from one element is determined by the power, P, inci- dent OJI the entire spot, the surface reflectivity p, the detector quant.um efficiency )I, t.he optical frequency Y, and the fraction of one reflected lobe intercepted by lhc receiver aperlure.
Therefore:
(5a)
- Ustc). = (PPTIMNhv) (5b)
for Q. 2 0,. Here 16 is Planck’s conslant,, and q is the charge on the electron.
The average local oscillat.or current which is avail- able for mixing with the signal from one element de- pends on the fract.ion of the total local oscillator wave that. coincides in direction wit.h the elementary signal wave.
Thus: - (I,.o)t = JLO C QJ
n. + (l-J./N> 1 (6a)
for a, 5 9, + (R,/N) or
(ILO)* = ILO RI + (WN)
nJ
for i’2, 2 Q, + (WN).
(6b)
66
By appropriate USC of Ells. (4), (5), alld (G), fh(b IIIOSI
probable value of the 114’ curr(bt11 (*an br found for var- ious rcccivcr apclrturcs and fields of vicnw. ‘1’11~ small- angle approximations of Eq. (3) can ofl(bIl 1~ uscbd lo express this rcsull in t(trms of thr physical paralncsi (‘I’S of the system
The -general situatinll call hc 1 rc:alcld by picbc*clwisch approximations inadc for a few casts \villi (bath t ypc of reflecting surface. The rcsulls of such aI1 walysis arch summarized in Table 1.
Figures 2(a) and (b) illuslralc Ihc variat iotl of th(b maximum value of jIF as the angular size of I her r(wiv(~r aperture, viewed from the spot, is c*hallgc,tl.
* ‘~~f:~~__----------------------~-= L-- 4
Fig. 2. Variation of i,$ with aperture. (a) Type A surface (small elements), 0, = f2, + R,. (b) Type R surface (large
elements), Q, = f& + Q,.
July 1965 / Vol. 4. No. 7 / APPLIED OPTICS 783