Embed Size (px)
Citation preview
Study of micropollutant transfer through a
saturated porous media with a term of
biodegradation
V. A. E. Guerin, M. A. Bues
Laboratoire Environnement Geotechnique & Ouvrages
AbstractOur aim is to develop and test a vertical, one-dimensional mathematical modelfor the transport of an organomercurial micropollutant (phenyl mercuricacetate or PMA) through a saturated homogeneous porous media, taking intoaccount the potential for a biological decontamination of contaminatedaquifers. The presence of heavy metals in the environment has alreadyreceived a great deal of attention due to their highly toxic nature andtranslation through the food chain. The roles of a number of differentbacteria in the transformation of mercuric compounds have already beendocumented (Summers [1]).
1 Introduction
As full models of pollutant transport are difficult to test empirically, due totheir dependence on a large number of parameters describing solid, liquid andbacterial phases, it is therefore necessary to begin by testing first interactionsbetween each phase under carefully controlled laboratory conditions. For thattwo types of experiments are carried out, batch and column tests.
Firstly, using batch tests, we studied (i) bacterial growth anddegradation under variable environmental conditions such as temperature,nutrient medium, pollutant concentration and bacterial density, (ii) adsorptionof PMA on various solids, quartz, kaolinite, illite and aluminium hydroxide.Batch tests give information of maximal potential of reaction at theequilibrium.
Secondly, using column tests, and therefore under flow conditions (i)we tested fixing of PMA by evaluating the retardation factor, at differentconcentrations of PMA and under variable pH and ionic strength conditions,(ii) the existence and effects of factor such as pH, ionic strength and flowvalues on bacterial adhesion. Column tests give information on the limitationof processes due to the dynamic conditions.
Transactions on Ecology and the Environment vol 14, © 1997 WIT Press, www.witpress.com, ISSN 1743-3541

300 Water Pollution
2 Materials and methods
PollutantPMA (phenyl mercuric acetate) is an organomercuric compound, used as apesticide in seed culture.Bacterial strainThe strain used in the study was a subclone of isolated PL IV which developsa resistance to PMA (Pseudomonas fluorescens). Only a subclone of strainsfrom the culture isolated in 1986 from the bulk mercury contaminatedsediments of the Rhine river was selected (Mirgain [2]). Strain PL IV is anonsporeforming, gram-negative rod (approximately 0,5 by 2 micrometers).Media and growth conditionsThe nutrient medium used for the batch experiments contained (in gram perliter of distilled water): Casamino-Acids (1), Casein Hydrolysat (1,13),KH2PO4 (3), K2HPO4 (6), (NH4)2SO4 (1), MgSO4,7H2O (0,2) in additionto 1 ml of a trace element stock solution (Meyer [3]; Veron [4]). This growthmedium is called complete medium (CM).
For column experiments, we used distilled water to test the adsorptionof PMA on solids, and initial bacterial adhesion. Also no bacterial growth isobserved in distilled water.Solid systemThe kaolinite (Ker II ) used in the study came from the quarry in Kerbinien(France), the illite from Le Puits (France) and the aluminium oxide (AH 500)from Marseille (France).
The solid used in the column experiments is quartz sand from theRhine sediments, washed and free of all pollution (oxides, organic matter,...).
3 Experimental procedures
PMA and bacteria measurementPMA was measured using the method developed by Marcandella & Bues [5]based on the Hatch-Ott procedure [6] for preparing samples.
Bacterial concentration was measured with the optical density at 640nm.Solid studies in batchThe surface area of the solids determined by argon adsorption and calculatedusing the BET method. It was reexamined using nitrogen adsorption.
Five grams of each soil sample were added to 100 ml of PMA solutionsof varying concentrations (from 1 mg/1 to 4g/l). The pH was the natural pH ofthe material used. The tube was shaken for 24 hours on an end-to-end shaker,and then centrifuged at 5000 rpm for 15 minutes then at 15000 rpm for 15minutes. The supernatant solution was subsequently analyzed for mercury.
Kinetic studies showed that equilibrium was reached typically after 3or 4 hours of adsorption. However due to the very high surface area of theadsorbate a longer adsorption time (24 hours) was applied to avoid having tocontrol the adsorption process by diffusion and to achieve lattice ion concen-trations near the equilibrium.Column studiesThe flow system was a Pyrex chromatography column (inside diameter 2,6cm, length 15 cm) which was autoclaved prior to each experiment, as was thequartz sand used to full the column. The flow of the eluent solution in each
Transactions on Ecology and the Environment vol 14, © 1997 WIT Press, www.witpress.com, ISSN 1743-3541
Water Pollution 301
experiment was regulated by a variable-flow peristaltic pump. The whole flowsystem was kept at a constant temperature (30°C).
The sand was carefully poured into the column to minimizestratification. The sand was slowly saturated from beneath, and a steadyupward flow of experimental medium was maintained for one hour until alltrapped air had been removed and a constant flow rate established. Theexperimental solution (PMA or bacteria) was then substituted. Sampling aredone at regular time intervals from the top of the column dependant on theexperimental conditions.
A stepwise injection of 0,1 M NaCl was introduced into the columnafter the experiments, and the specific conductivity determined. This helped toelucidate the transport characteristics of the column. Once packed in thecolumn the sand was found to have a kinematic porosity of 0,38 +/-0,02.Bottles containing NaCl solution, distilled water, and a suspension of P.fluorescens were connected to the column, and a peristaltic pump was used tosupply these liquid solutions at constant flow velocities. All tubing, glassware,and aquifer sand were autoclaved to avoid contamination.Bacterial studiesThe nutrients were autoclaved with the bulk water (121°C, 15 min), or werefilter sterilized (0,22 micrometer filters).
The bacterial strain for batch experiments was prepared as follows: (i)the strain was grown from a sample stocked at -20°C by spreading on solidagar for 32 to 38 h, (ii) the strain was then grown at 30°C aerated by gentleswirling on a rotary shaker (125 rpm) for 15 to 18 h in 250 ml Erlenmeyerflasks containing 100 ml of complete medium to ensure that they had enteredan exponential stage, and (iii) finally, just before the beginning of theexperiments, the medium was regenerated by removing cells from thesuspension by centrifugation at 5000 rpm for 5 min. These cells were put insuspension in a fresh nutrient medium.
In the case of column experiments using bacteria, the medium used forregeneration was either distilled water or an NaCl solution (that is to say themedium of the experiments). Just before a pulse of bacteria was introducedinto the column, concentration was measured using the turbidity at 640 nm.
4 Batch tests
Degradation and growth rates of bacterial strain were always studied in opti-mum conditions and therefore do not give any reliable results on the effective-ness of degradation in situ. So the influence of a number of parameters on theactivity of the bacterial strain was tested.
4.1 Bacterial growth and degradation
4.1.1. Modelling of the bacterial growthMarcandella [7] has shown that the logistic model proposed by Schmidt [8]describes fairly well the growth of the strain PLIV (Figure 1):
maximal density of population and r : specific growth rate (T
Transactions on Ecology and the Environment vol 14, © 1997 WIT Press, www.witpress.com, ISSN 1743-3541

Water Pollution
For a bacterial density of 0,1 the growth rate is constant with theincrease in PMA up to an inhhibitionnary concentration, after which thegrowth rate decreases to reach zero, as shown in figure 2.
1,0
0,8
0,4
0,2
00
PMA inh
• % * ,
-
t
j r max. specific growth rate "
i i +
5 10Time (h)
Figure 1: Modelling of the growthrate of the strain PL IV
CoFigure 2: Evolution of the growth
with PMA concentration
4.1.2 Modelling of biodegradationIn semi logarithmic coordinates (Figure 3), the evolution of reducedconcentration C/Co versus time shows that two mechanisms take part in PMAdegradation: at the beginning, a high degradation rate appears and then a lowdegradation rate. To explain this evolution, two assumptions were formulatednamely the existence of two mechanisms "in series" i.e.: taking place one afterthe other on the one hand, and two mechanisms "in parallel" i.e.: actingsimultaneously, on the other hand.
The breaking point between the two slopes occured at a "constanttime", after about 40 minutes, (Figure 4) whatever the PMA concentration.This could be related to the end of the lag phase of bacterial growth whichlasted 30 minutes.In this paper, we only consider the case of two mechanisms "in series". Then:
C:
dt
Vd = —= -^Cdt ^
degradation velocityPMA concentration
if
if t> t
t < trupture
rupture
(2)
(3)
X[: degradation rate of, respectively, the first and the second mechanism(i=lor2)
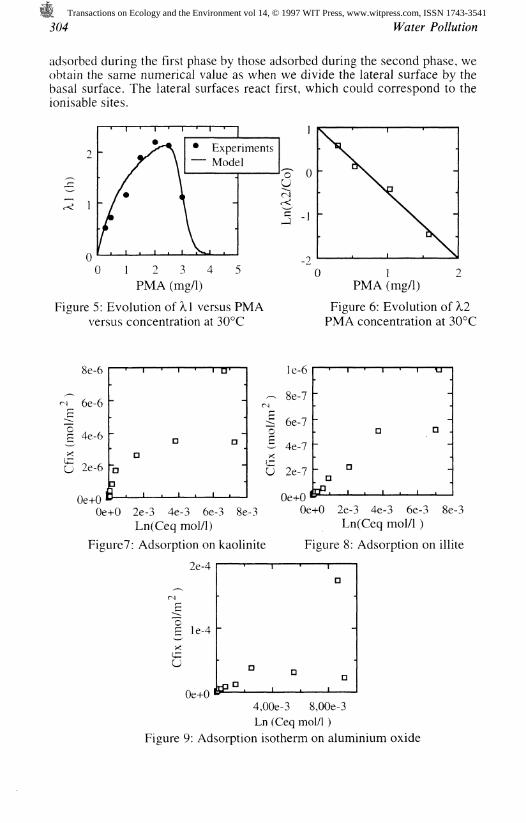
The evolution of k[ with the concentration of PMA (Figure 5)conforms to a Michaelis-Menten model taking into account an inhibitionphenomenon as follows:
1 (4)
Vm- maximal specific velocity of reactionKm : semi saturation constant (ML~3)
Transactions on Ecology and the Environment vol 14, © 1997 WIT Press, www.witpress.com, ISSN 1743-3541

Water Pollution
Kj: Inhibition constant of reaction (ML~3)nj: inhibition order
For PMA concentrations below 0,5 mg/1 for DO=0,K depending on
bacterial concentration, the second mechanism was not found (A,2=0) or A,2=A,i
(Figure 6). Above this value, ?i2/Co as a function of Co in semi-logarithmiccoordinates follows a linear law so that:
r- = A exp(- p Co) (5)
UD
a PMA = 0,3 mg/1
• PMA = 2 mg/1
2 3 4Time (h)
0,8
a3 0,4
^ 0,2
0,0
Figure 3: Logarithm of reducedconcentration versus time
4.2 Pollutant interaction with solid phases
PMA (mg/1)
Figure 4: Breaking pointbetween mechanisms
The capacity of solids to adsorb pollutants leads to their use in depollutionprocesses.
In the case of mercury pollution, the rate at which mercury is adsorbedis clearly dependant not only on the mineralogical composition of clays,oxides and sand, but also on the chemical form of the mercuric compounds. Infact soils can adsorb phenyl mercuric ions as well as phenyl mercuric acetate,hence the quantities of adsorbed PMA are relative to the negative chargeand/or the surface area (total, lateral, basal).
Some experiments described in litterature suggest that PMA isadsorbed by various mechanisms depending on the type of clay minerals(Aomine [9]). This study attempts to investigate the adsorption of PMA ontwo clays/ a kaolinite and an illite, as well as on an aluminium oxide.The results of isotherm are the following:
(i) On the kaolinite adsorption is principally due to physisorption, be-cause if we consider the C.E.C. (due to the lateral surfaces) the adsorption le-vel is to high to be due to chemical adsorption.
(ii) If we consider the capacity of cationic exchange between the Hg andthe Ca from the Illite, we note that the real level of adsorption is lower thanpredicted. This could be explained by the divergence in size and charge of Hgand Ca which do not allow cationic exchange. The adsorption to the Illite sur-face must therefore be the result of a precipitation mechanism. Thisprecipitation seems to occur in two phases. If we divide the quantities
Transactions on Ecology and the Environment vol 14, © 1997 WIT Press, www.witpress.com, ISSN 1743-3541
304 Water Pollution
adsorbed during the first phase by those adsorbed during the second phase, weobtain the same numerical value as when we divide the lateral surface by thebasal surface. The lateral surfaces react first, which could correspond to theionisable sites.
9 -
1 2 3 4 5PMA (mg/1)
Figure 5: Evolution ofXl versus PMAversus concentration at 30°C
0 1 2PMA (mg/1)
Figure 6: Evolution of A,2PMA concentration at 30°C
N
'o
Xl+ZU
%e-b
6e-6
4e-6
2e-6
n nl
i • i • i n-
n n0
0
? . , . , , , ,Oe+0 •*
le-6
— 8e-7r\i
| 6e-7OE 4e-7XU 2e-7
Oe+0Oe+0 2e-3 4e-3 6e-3 8e-3
Ln(Ceq mol/1)
Figure?: Adsorption on kaolinite
2e-4
1 le-4x
U
Oe+0 2e-3 4e-3 6e-3 8e-3Ln(Ceq mol/1)
Figure 8: Adsorption on illite
Oe+04,OOe-3 8,OOe-3Ln (Ceq mol/1 )
Figure 9: Adsorption isotherm on aluminium oxide
Transactions on Ecology and the Environment vol 14, © 1997 WIT Press, www.witpress.com, ISSN 1743-3541
Water Pollution 305
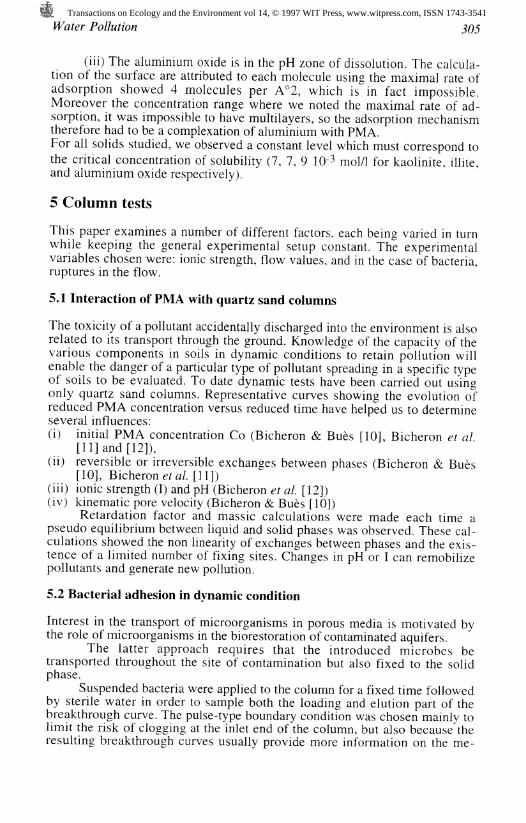
(iii) The aluminium oxide is in the pH zone of dissolution. The calcula-tion of the surface are attributed to each molecule using the maximal rate ofadsorption showed 4 molecules per A°2, which is in fact impossible.Moreover the concentration range where we noted the maximal rate of ad-sorption, it was impossible to have multilayers, so the adsorption mechanismtherefore had to be a complexation of aluminium with PMA.For all solids studied, we observed a constant level which must correspond tothe critical concentration of solubility (7, 7, 9 1Q-3 mol/1 for kaolinite, illite,and aluminium oxide respectively).
5 Column tests
This paper examines a number of different factors, each being varied in turnwhile keeping the general experimental setup constant. The experimentalvariables chosen were: ionic strength, flow values, and in the case of bacteria,ruptures in the flow.
5.1 Interaction of PMA with quartz sand columns
The toxicity of a pollutant accidentally discharged into the environment is alsorelated to its transport through the ground. Knowledge of the capacity of thevarious components in soils in dynamic conditions to retain pollution willenable the danger of a particular type of pollutant spreading in a specific typeof soils to be evaluated. To date dynamic tests have been carried out usingonly quartz sand columns. Representative curves showing the evolution ofreduced PMA concentration versus reduced time have helped us to determineseveral influences:(i) initial PMA concentration Co (Bicheron & Bues [10], Bicheron et al
[11] and [12]),(ii) reversible or irreversible exchanges between phases (Bicheron & Bues
[10], Bicheron et al [11])(iii) ionic strength (I) and pH (Bicheron et al [12])(iv) kinematic pore velocity (Bicheron & Bues [10])
Retardation factor and massic calculations were made each time apseudo equilibrium between liquid and solid phases was observed. These cal-culations showed the non linearity of exchanges between phases and the exis-tence of a limited number of fixing sites. Changes in pH or I can remobilizepollutants and generate new pollution.
5.2 Bacterial adhesion in dynamic condition
Interest in the transport of microorganisms in porous media is motivated bythe role of microorganisms in the biorestoration of contaminated aquifers.
The latter approach requires that the introduced microbes betransported throughout the site of contamination but also fixed to the solidphase.
Suspended bacteria were applied to the column for a fixed time followedby sterile water in order to sample both the loading and elution part of thebreakthrough curve. The pulse-type boundary condition was chosen mainly tolimit the risk of clogging at the inlet end of the column, but also because theresulting breakthrough curves usually provide more information on the me-
Transactions on Ecology and the Environment vol 14, © 1997 WIT Press, www.witpress.com, ISSN 1743-3541
Water Pollution
chanisms affecting transport than the curves obtained with a step increase inconcentration.
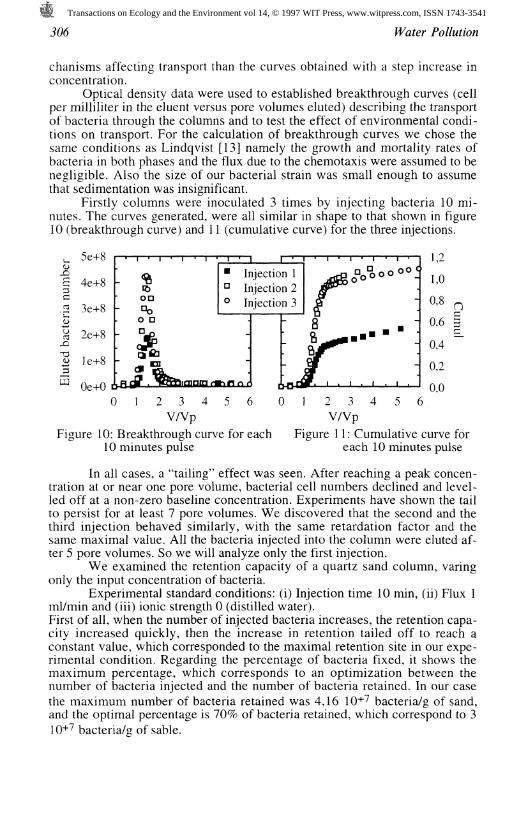
Optical density data were used to established breakthrough curves (cellper milliliter in the eluent versus pore volumes eluted) describing the transportof bacteria through the columns and to test the effect of environmental condi-tions on transport. For the calculation of breakthrough curves we chose thesame conditions as Lindqvist [13] namely the growth and mortality rates ofbacteria in both phases and the flux due to the chemotaxis were assumed to benegligible. Also the size of our bacterial strain was small enough to assumethat sedimentation was insignificant.
Firstly columns were inoculated 3 times by injecting bacteria 10 mi-nutes. The curves generated, were all similar in shape to that shown in figure10 (breakthrough curve) and 11 (cumulative curve) for the three injections.
5e+8
0 1 2 3 4 5V/Vp
Figure 10: Breakthrough curve for each10 minutes pulse
1 2 3 4 5 6V/Vp
Figure 11: Cumulative curve foreach 10 minutes pulse
In all cases, a "tailing" effect was seen. After reaching a peak concen-tration at or near one pore volume, bacterial cell numbers declined and level-led off at a non-zero baseline concentration. Experiments have shown the tailto persist for at least 7 pore volumes. We discovered that the second and thethird injection behaved similarly, with the same retardation factor and thesame maximal value. All the bacteria injected into the column were eluted af-ter 5 pore volumes. So we will analyze only the first injection.
We examined the retention capacity of a quartz sand column, varingonly the input concentration of bacteria.
Experimental standard conditions: (i) Injection time 10 min, (ii) Flux 1ml/min and (iii) ionic strength 0 (distilled water).First of all, when the number of injected bacteria increases, the retention capa-city increased quickly, then the increase in retention tailed off to reach aconstant value, which corresponded to the maximal retention site in our expe-rimental condition. Regarding the percentage of bacteria fixed, it shows themaximum percentage, which corresponds to an optimization between thenumber of bacteria injected and the number of bacteria retained. In our casethe maximum number of bacteria retained was 4,16 10+7 bacteria/g of sand,and the optimal percentage is 70% of bacteria retained, which correspond to 310+7 bacteria/g of sable.
Transactions on Ecology and the Environment vol 14, © 1997 WIT Press, www.witpress.com, ISSN 1743-3541

Water Pollution
Se+y
4e+9
3e+9
2e+9
le+9
Oe+0
• i • i#.
• .
* .
•
• #i . i %
of fixed bacteria
u,/
0,6
0,5
0,4
0,3
D
n
" D °
n
Oe+0 4e+9 8e+9Total injected bacteria
Figure 12: Fixed bacteria as a functionof injected bacteria
Oe+0 4e+9 8e+9Total injected bacteria
Figure 13: Percentage fixedas a function of injected bacteria
The percentage of retained bacteria at 4 pore volumes was also investi-gate using several experiments, one parameter was varied and the others keptfixed. We examine retention under 3 conditions: (i) when the flux was stoppedfor 30 minutes, just after the 10 minutes injection in order to foster cells at-tachment, (ii) when the flux was double and (iii) when ionic strengh was va-ried.
2,35 10+9standard conditions with number of total bacteria injected
Experimentalsetup
standard
59
30minbreak
64
ionic strenght ionic strenght10-2M66% of bacteria
fixedTable 1: Percentage of bacteria retained depending on experimental conditions
The break in flux increased the total number of bacteria retained, by allowingadsorption which cannot occur in dynamic conditions.An increase in ionic strength from 0 to 10-2 M, increased the capacity of re-tention, whereas an increase up to 10-1 M decreased this capacity.The flux value had the most effect on changes in retention capacity.
6 Conclusions and prospects
The modelling of bacterial growth and degradation gives consistent and re-liable information on the behavior of the strain PL IV in variable experimentalconditions.
The study of PMA fixing on solids shows that the spread of PMApollution in groundwater could have various effects depending on compositionof the porous media. Quartz sand is not an efficient barrier to PMA. In contrasta soil containing kaolinite could retain a significant amount of the pollutant.
However, in cases where PMA is immobilized by solids, a problemstill remains, since latent pollution could be released (by NaCl for example).Compared to solids, bacteria ensure total disappearance of pollutant toxicity. Itis for this reason that possibility of PMA degradation at the solid interface isof importance and requires further study
Transactions on Ecology and the Environment vol 14, © 1997 WIT Press, www.witpress.com, ISSN 1743-3541

308 Water Pollution
Quantitative knowledge and an understanding of PMA and microbialtransport will provide the physical link with the reality of effective dispersionof pollutants in porous media. It also holds the promise of biorestorativemiracles afforded by the physiological abilities of microbes to clean up ofcontaminated aquifers.
To this end, further experiments will be carried out as the presentresults were not sufficient to understand dynamic phenomena completely.Understanding the transport of PMA in a mixed medium (sand and clay) in thepresence of bacteria is the ultimate aim of our study.
References
[1]. Summers A. O., 1986, Organization, expression and evolution of genesfor mercury-resistance, Ann. Rev. MicrobioL, 40, 607-634.[2]. Mirgain I., 1992, Degradation bacterienne de deux pesticides (acetate dephenyl mercure et atrazine) dans I'environnement naturel, these de 1'UniverviteLouis Pasteur, Strasbourg, 178 p.[3]. Meyer J. M., M. A. Abdallah, 1978, The fluorescent pigment ofPseudomonas fluorescens: Biosynthesis, purification, and physicochemicalproperties, J. Gen. MicrobioL 107, 319-328.[4]. Veron M., 1975, Nutrition et taxonomie des Enterobacteriaceae et bacte-ries voisines, Anna. Microbiol. (Institut Pasteur), 126A, n°3.[5]. Marcandella E., M. A. Bues, 1995, Caracterisation par des essais enreacteur ferme de la reactivite physicochimique et de la biodegradationbacterienne d'un organomercuriel, Hydrogeology, 1, 79-87.[6]. Hatch W. R., W. L. Ott, 1968, Determination of sub-microgram quantitiesof mercury by atomic absorption spectrophotometer, Annal. Chem., 40, 2085-2087.[7]. Marcandella E., 1996, Caracterisation biophysicochimique du transfer!d'un solute en milieu poreux, These INPL, Nancy, 221 p.[8]. Schmidt S. K., S. Simkins, M. Alexander, 1985, Models for the kinetics ofbiodegradation of organic compounds not supporting growth, Appl. Environ.Microbiol., 50, 323-331.[9]. Aomine S., K. Inoue, 1967, Retention of mercury by soils: II Adsorptionof phenyl mercuric acetate by soil colloids, Soil Science and Plant Nutrition,13,n°6, 195-200.[10]. Bicheron C, Bues M. A. , 1990, "Transfert de 1'acetate de phenylmercure(PMA) a travers un milieu poreux sature" Journal Frangais d'Hydrologie, 21,fasc. 2.[11]. Bicheron C., Strauss J. M., Bues M. A., 1991a, "Comparison of the be-havoiur of two mercurial compounds during their transport through a naturalsaturated porous medium", Computer Methods and Water Resources, Vol. 1,Groundwater Modelling and Pressure Flow, Ed. D. Ben Sari et al, SpringerVerlag, 185-196.[12]. Bicheron C., Strauss J. M., Bues M. A., 1991b, Comparison between si-mulations and laboratory experiments for investigation of reactive solutetransport in homogeneous porous medium", International Seminar OnEfficient Water Use, Mexico.[13]. Lindqvist R., Soo Cho J., Enfield C. G., 1994, A kinetic model for celldensity dependent bacterial transport in porous media, Water ResourcesResearch, 30, n°12, 3291-3299.
Transactions on Ecology and the Environment vol 14, © 1997 WIT Press, www.witpress.com, ISSN 1743-3541