Embed Size (px)
Citation preview
Study of electrogenic algae attachment to biophotovoltaic cell electrode materials
Zaida Herrero Medina
Supervisors:
Peter Fojan, Aalborg University
Ioanis Katakis, Universitat Rovira i Virgili
9-10th Semester. Master thesis in Nanobiotechnology
2017-2018
2
Department of Physics and Nanotechnology
Skjernvej 4A – 9220 Aalborg Øst, Denmark
http://www.physics.aau.dk
Title:
Study of electrogenic algae
attachment to biophotovoltaic cell
electrode materials
Theme:
9-10th semester Project
Project Period:
Start: September 1st, 2017
End: May 31st, 2018.
Authors:
Zaida Herrero Medina
Supervisors:
Dr. Peter Fojan Dr. Ioanis Katakis
Number of copies: 1
Report page count: 56
Total number of pages: 63
Appendix page count: 2
The content of this report is freely available, but publication is only permitted with statement of source.
, such as algae and cyanobacteria that are
capable of harnessing solar light and by using
water as an electron source, generate power
from the harvesting of electrons during the
photosynthesis process5,6.
Biophotovoltaic cells use photoautrophic
microorganisms capable of harnessing solar
light that generate power from the
harvesting of electrons during the
photosynthesis process. The aim of this
project was to survey different electrode
materials to efficiently immobilized the
microalgae Scenedesmus sp. and the
cyanobacteria Synechocystis PCC6803 to
improve current generation. The surfaces of
gold and glassy carbon electrodes were
modified with different surface modification
techniques. The best immobilization method
was the crosslinking of Polyethilenimine
(PEI) with Poly (ethylene glycol)(200)
diglycidyl ether (PEDGE) which formed an
hydrogel that achieved high photosynthetic
microorganism immobilization. The
immobilized cells were electrochemically
and microscopically characterized. Although
no direct electron transfer was observed for
Synechocystis, both photosynthetic
microorganisms achieved current generation
of ca. 10μA/cm2 by mediated electron
transfer.

3
PREFACE
This report has been written by Zaida Herrero Medina on the 9-10th semester under the
supervision of Dr. Ioanis Katakis (Universitat Rovira i Virgili), in Nanobiotechnology course at
Aalborg University. It has been produced in the period starting from September the 1st of 2017
to May the 31st of 2018. The subject of the report is Study of electrogenic algae attachment to
biophotovoltaic cell electrode materials.
Reading Guide
Throughout the report, there will be references to various sources. These will be found on the
form (#) where the information inside the brackets refers to the author of a specific source in
the bibliography at the end of the report. Tables and figures are listed after the number of the
section in which they are displayed as Figure# or Table#. To each table or figure a short
descriptive caption will be made together with a bibliographic reference. If there is no reference
in a caption, the figure is produced by the group itself. Abbreviations will be found in the next
page.
_______________________
Zaida Herrero Medina
Aalborg, 2018
4
ABBREVIATIONS
AUT : 11-Amino-1-undecanethiol hydrochloride
BPV : Biophotovoltaic cell
BES : Bioelectrochemical systems
CA : Chronoamperometry
CV : Cyclic voltammetry
DET : Direct Electron Transfer
GCE : Glassy Carbon Elecrode
IET : Indirect Electron Transfer
MET : Mediated Electron Transfer
MH : Mercaptohexanol
MFC : Microbial Fuel Cell
NQ : Naphthoquinone
PEI : Polyethyleneimine
PEDGE : Poly(ethylene glycol) (200) diglycidyl ether
SAM : Self- assembled monolayer
5
CONTENTS
1. INTRODUCTION .................................................................................................................. 6 1.1. STATE OF THE ART: ................................................................................................................. 6 1.2. ELECTRODES: ........................................................................................................................... 8 1.3. SURFACE MODIFICATIONS: ................................................................................................... 9 1.4. PHOTOSYNTHETIC MICROORGANISMS: ........................................................................... 10 1.5. ELECTRON TRANSFER MEDIATORS. .................................................................................. 11 1.6. ELECTROCHEMICAL CHARACTERIZATION ........................................................................ 11
1.6.1. CYCLIC VOLTAMMETRY:......................................................................................................... 11 1.6.2. CHRONOAMPEROMETRY: ..................................................................................................... 12
2. AIM OF THE PROJECT: .................................................................................................... 13
3. MATERIALS AND METHODS: ......................................................................................... 15 3.1. MATERIALS ............................................................................................................................ 15 3.2. PHOTOSYNTHETIC MICROORGANISMS CULTURE AND CELL GROWTH:..................... 15 3.3. SELECTION OF THE IMMOBILIZATION METHOD: ............................................................ 16
3.3.1. EVALUATION OF THE MINIMUM OPTIMAL INCUBATION TIME: .............................. 16 3.3.2. SURFACE MODIFICATIONS: ................................................................................................... 18 3.3.3. EVALUATION OF SYNCECHOCYSTIS CAPABILITY TO DIRECT ELECTRON TRANFER IN DIFFERENT SURFACE MODIFICATIONS ONTO GOLD AND GCE: .............................................. 20
3.4. MEDIATED ELECTRON TRANSFER CHARACTERIZATION OF PHTOTOSYNTHETIC MICROORGANISMS ONTO AU-PEI/PEDGE AND GCE-PEI/PEDGE: ............................................ 21
3.4.1. FLUORESCENCE MICROSCOPY OF Synechocystis AND Scenedesmus ONTO AU-PEI/PEDGE AND ONTO GCE-PEI/PEDGE: .............................................................................................. 21 3.4.2. EVALUATION OF Synechocystis CAPABILITY OF MEDIATED ELECTRON TRANSFER ONTO AU-PEI/PEDGE AND ONTO GCE-PEI/PEDGE: ......................................................................... 21 3.4.3. EVALUATION OF Scenedesmus CAPABILITY OF MEDIATED ELECTRON TRANSFER ONTO AU-PEI/PEDGE AND ONTO GCE-PEI/PEDGE: ......................................................................... 22
4. RESULTS AND DISCUSSION: ........................................................................................... 24 4.1. CHLOROPHYLL CONCENTRATION: ..................................................................................... 24 4.2. SELECTION OF THE IMMOBILIZATION METHOD: ............................................................ 24
4.2.1. INCUBATION TIME:.................................................................................................................. 24 4.2.2. SURFACE MODIFICATIONS: ................................................................................................... 26 4.2.3. EVALUATION OF SYNCECHOCYSTIS CAPABILITY TO DIRECT ELECTRON TRANFER IN DIFFERENT SURFACE MODIFICATIONS ONTO GOLD AND GCE: .............................................. 32
4.3. MEDIATED ELECTRON TRANSFER CHARACTERIZATION OF Synechocystis AND Scenedesmus ONTO AU-PEI/PEDGE AND GCE-PEI/PEDGE ........................................................ 34
4.3.1. FLUORESCENCE MICROSCOPY OF Synechocystis AND Scenedesmus ONTO AU-PEI/PEDGE AND ONTO GCE-PEI/PEDGE: .............................................................................................. 35 4.3.2. EVALUATION OF Synechocystis CAPABILITY OF MEDIATED ELECTRON TRANSFER ONTO AU-PEI/PEDGE AND ONTO GCE-PEI/PEDGE: ......................................................................... 39 4.3.3. EVALUATION OF Scenedesmus CAPABILITY OF MEDIATED ELECTRON TRANSFER ONTO AU-PEI/PEDGE AND ONTO GCE-PEI/PEDGE: ......................................................................... 49
5. CONCLUSIONS .................................................................................................................. 59
6. FUTURE TASKS: ................................................................................................................ 60
7. REFERENCES: .................................................................................................................... 61
8. APPENDIX: ...................................................................................................................... 64
6
1. INTRODUCTION
1.1. STATE OF THE ART:
Since the awareness of climate change and the prospect of fossil fuel depletion, new
technologies for harnessing renewable energy are emerging. From an engineering point of view,
selecting a renewable primary energy source on which to focus innovation efforts requires an
analysis of the technical potential of said source. As “technical potential” is defined the net
energy that can reasonably reach the consumer based on best technologies available and taking
into consideration, not simply the total earth flux, but land, geographical distribution,
conversion, and ecosystem disturbance constraints. Such analysis shows that only solar energy
(either directly through light conversion to energy or indirectly through energy extraction from
biomass) can satisfy humanity’s growing energy needs1. Although solar thermal plants and
photovoltaics show promising advances in light-to-electricity conversion efficiency, the
productive model for the future will require that such solutions be developed in parallel to
biorefineries that will also provide the raw materials that today are supplied by fossil
hydrocarbons and coal. Among biorefineries, those based on algae, show partial sustainability
promise since they would not compete for land and other resources with agriculture. However,
overall sustainability can only be achieved if algae biorefineries are implemented in large scale,
if all fractions of chemical compounds are exploited (without limiting exploitation to fatty acids
and biofuels), and if the overall energy return on energy invested (EROI) is superior to 5. Current
state of the art barely reaches this last requirement. It is therefore imperative that for the algae
biorefinery of the future, more energy be extracted during algae growth. One possibility to do
this is through the extraction of electricity during growth in biophotovoltaic cells (BPVs).
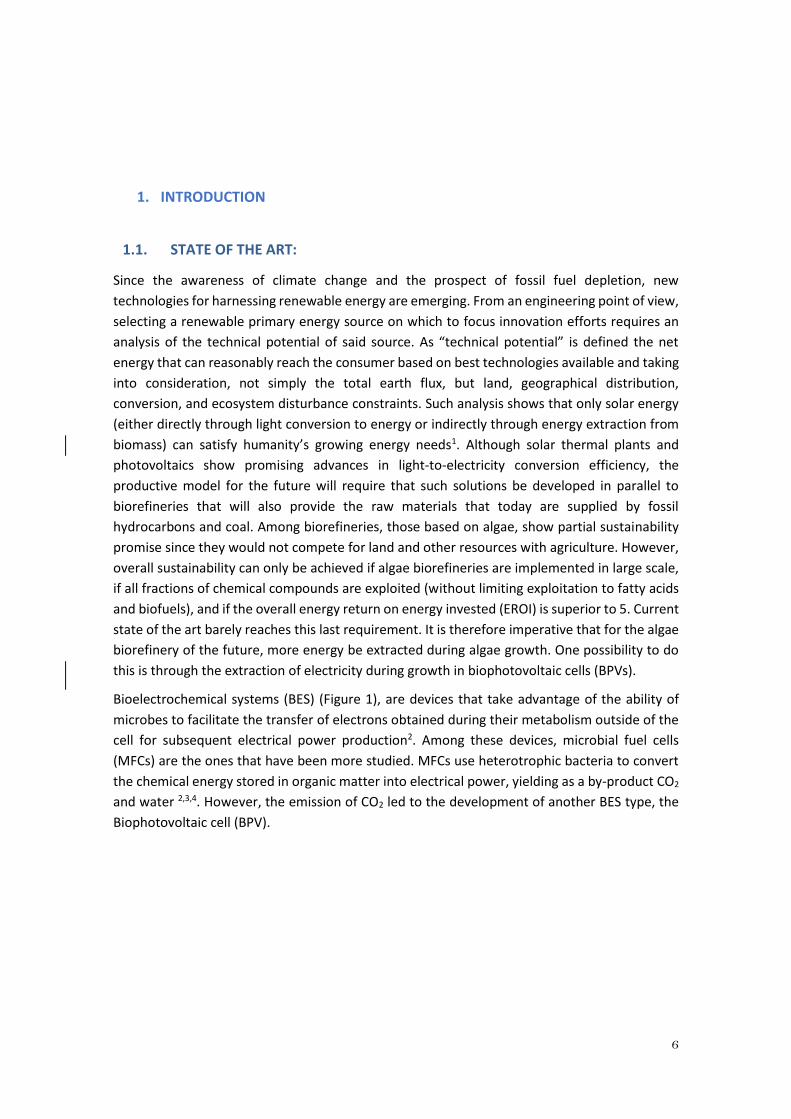
Bioelectrochemical systems (BES) (Figure 1), are devices that take advantage of the ability of
microbes to facilitate the transfer of electrons obtained during their metabolism outside of the
cell for subsequent electrical power production2. Among these devices, microbial fuel cells
(MFCs) are the ones that have been more studied. MFCs use heterotrophic bacteria to convert
the chemical energy stored in organic matter into electrical power, yielding as a by-product CO2
and water 2,3,4. However, the emission of CO2 led to the development of another BES type, the
Biophotovoltaic cell (BPV).
7
Figure1.1. Diagram of the different types of bioelectrochemical systems (BESs) retrieved from
McCormick.A et al 2015 2
Unlike MFCs, BPVs do not require the addition of organic matter to the system. In addition, they
are a promising alternative for the removal of CO2 from the environment. They are devices that
use photoautrophic microorganisms, such as algae and cyanobacteria that are capable of
harnessing solar light and by using water as an electron source, generate power from the
harvesting of electrons during the photosynthesis process5,6.
Both MFCs and BPVs have other applications besides electricity generation, such as waste water
treatment, fuel production (hydrogen, organic molecules) and other products of interest for the
food and the pharmaceutical industry.2,7
Despite the fact that MFCs are more efficient than BPVs in terms of power generation, reaching
with the latter only a few mW/m2,2 BPVs are still of interest since the primary fuels (i.e., solar
light and CO2) are unlimited. The advantages of using algae are that they are relatively
inexpensive to culture, and are capable of power production during the day and surprisingly also
during the night. The capability to produce electricity in dark conditions seems to be a
consequence of the breakdown of accumulated carbon intermediates during light conditions5.
However, the power outputs obtained are low due to intrinsic metabolic losses and intracellular
competition for energy resources. The use of exogenous mediators to facilitate the electron
transfer from the algae to the anode, indirect electron transfer (IET) or mediated electron
transfer (MET), also affects the power generation due to the limitations of mass transport5 and
also can lead to a limitation of algae viability. In addition, the presence of such mediators
imposes further limitations to efficiency in large scale applications since they would have to be
separated and recycled due to toxicity and cost (in most cases). Biofilm at the anode increases
power generation due to direct contact between cell and electrode and because the internal
potential losses are reduced. Bombelli et al4 have grown Synechocystis onto InSnBi alloy anode
in a microfluidic BPV device with power outputs around 270 and 290 mW m-2, for dark and light
conditions respectively. Therefore, current studies are focused on direct electron transfer (DET),
trying to grow a film on the anode, by just simple attachment or by pili induction.2
8
1.2. ELECTRODES:
The anode must be biocompatible, stable, high conductive, inexpensive and, should allow light
to enter the biofilm and present high surface area or porosity to allow high density of
immobilised cells The activation losses and metabolic losses can be improved by selecting a
proper anode.5
Several anode materials have been tested for BPV so far: Jain et al.8 grew biofilms of Shewanella
loihica onto graphite electrodes; Erbay et al.9 grew multi-wall CNTs (MWCNT) on stainless steel
meshes (SSM) by chemical vapor deposition (CVD) for a MFC; Indium tin oxide (ITO) or fluorine-
doped tin oxide (FTO) deposited onto glass have been used in several studies7.
Carbon, in different versions, as an electrode has been widely used. Although carbon has low
conductivity, can be counterbalanced with high internal surface area, i.e., in the case of
activated carbon cloth7. Glassy carbon electrodes (GCE) are one of the most used electrodes in
electrochemistry. Glassy carbon is a non-graphitizable carbon that has high temperature
resistance, high chemical inertness and low electrical resistance. Glassy carbon is made up of
aromatic ribbon molecules, randomly oriented and tangled in a complicated manner10. Although
it does not present high surface area, it is a relatively well characterised and reproducible carbon
surface used for basic electrochemical studies such as this work.
Metal electrodes, such as gold, platinum, titanium and stainless steel (SS), are highly conductive
but present low surface roughness which may limit surface adhesion of microbes.7 Gold is the
electrode par excellence in electrochemistry since is chemically inert, has high conductivity and
very high ductility.
The topography of the electrode influences the cell adhesion and the chemistry of the electrode
influences the electron transfer between the cells and the electrode. For direct electron transfer,
the attractive or repulsive interactions are decisive for cell adhesion to the electrode, therefore
the surface chemistry plays an important role, such as: the capability of forming hydrogen
bonds; the electrostatic interactions, i.e., it has been proved that positively charged surfaces are
better for the formation of biofilms onto the anode; and Van der Waals (VDW) interactions.
Hydrophobicity is also important for microorganism adhesion. Regarding the topography of the
electrode, nano-roughness provides more anchoring points for microorganisms, thus enhancing
cell adhesion. For instance, increasing the roughness of the glassy carbon anode 10 times
enhanced S.oneidensis biofilm formation11. Porous materials provide large surface area for
reaction and reduce diffusion resistances12.
The cathode should facilitate the rapid reaction of oxygen reduction to form water in order not
to rate limit the BPV, so it is important that the cathode has also a high surface area and high
conductivity. The best catalyst to reduce oxygen is platinum although it is very expensive.
Although substitutes exist, cathode optimisation is not the object of this work.
9
1.3. SURFACE MODIFICATIONS:
Current studies are focused on surface modification of the electrode to increase its surface area
for a suitable cell adhesion, since biofilm at the anode increases power generation due to direct
contact between cell and electrode and because the internal potential losses are reduced5.
There are several types of surface engineering, however the most extensively used in bioanodes
are the self-assembled monolayer (SAM) and surface polymerization.
Guedri et al immobilized C.vulgaris onto platinum interdigitate electrodes by means of SAMs of
3-mercaptopropionic acid13. SAMs can be formed with alkanethiols onto noble metal surfaces,
such as gold. The crystalline-like monolayers formed has a (√3×√3)R30º structure on gold with
the thiol chains tilted approximately 30º from the surface14. The driving forces involved in the
self-assembly are the semi-covalent bond of sulfur-gold and the hydrophobic Van der Waals
interactions between the methylene carbons on the alkane chains, which causes the chains to
tilt to lower the overall surface energy. Within alkanethiols that have the same head groups, the
longer the chain the more favored the adsorption is15.
Le et al.16 immobilized some bacteria in poly-3,4-ethylenedioxythiophene (PEDOT), a conductive
polymer, by electrochemical polymerization onto ITO electrodes. Lobakova et al. immobilized
cyanobacteria and microalgae onto polyethyleneimine (PEI)-sorbents with an attachment up to
70% of the cells in 3h of incubation17.
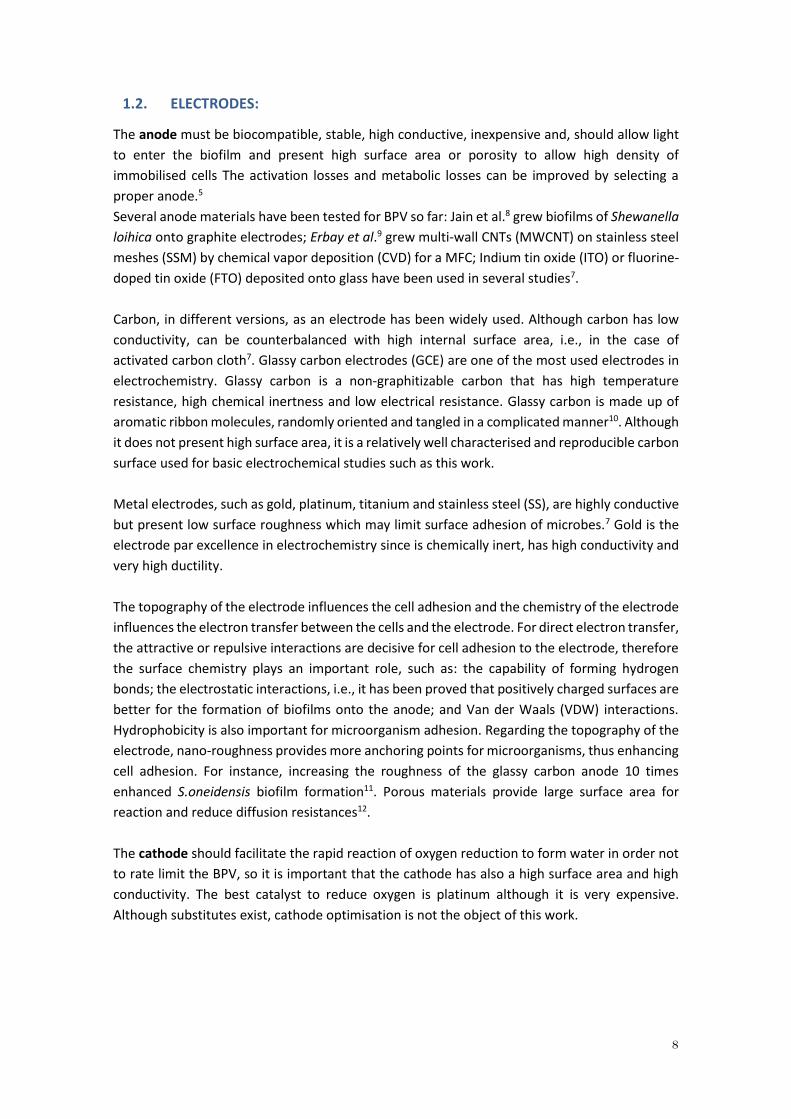
PEI is a polymer that contains primary, secondary and tertiary amino groups, see Figure 1.2. It
has a strong anion exchange capacity and can be crosslinked with different molecules to form a
matrix-like hydrogel. In this project, PEI was crosslinked with Poly (ethylene glycol)(200)
diglycidyl ether (PEDGE) to immobilize the photosynthetic microorganisms onto the electrodes.
Figure 1.2. Chemical structure of Polyethyleneimine (PEI)
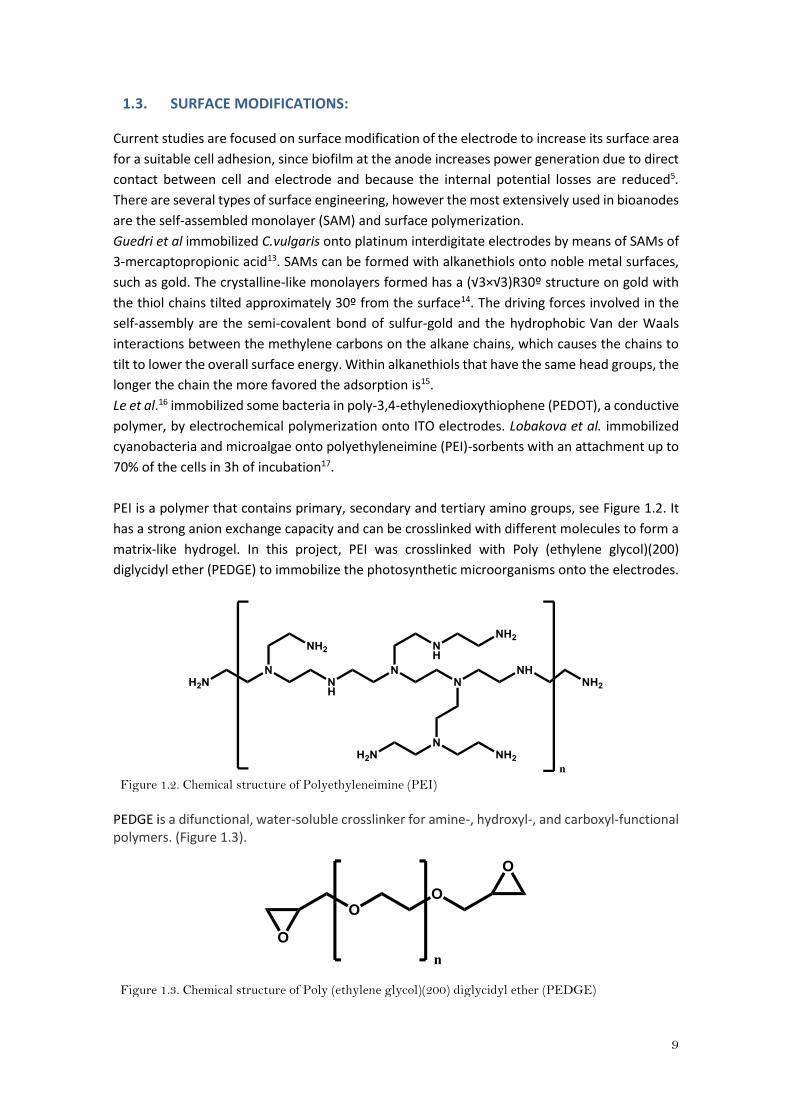
PEDGE is a difunctional, water-soluble crosslinker for amine-, hydroxyl-, and carboxyl-functional polymers. (Figure 1.3).
Figure 1.3. Chemical structure of Poly (ethylene glycol)(200) diglycidyl ether (PEDGE)
10
1.4. PHOTOSYNTHETIC MICROORGANISMS:
Microalgae (eukaryote) and cyanobacteria (prokaryote) are photosynthetic microorganisms that
contain chlorophyll, a pigment that absorbs the energy of the light to hydrolyse water and
provide electrons. These electrons can be transferred to an electrode and produce current, thus
generating electric energy. The process of the photosynthesis is carried out in thylakoids for
microalgae and in chloroplasts for cyanobacteria. The photosynthetic electron transfer chain
PETC) consists of three major protein complexes: Photosystem I (PSI), photosystem II (PSII) and
cytochrome b6f complex (Cyt b6f). Chlorophyll, in PSII, gets excited when absorbs light and is
relaxed by taking the electrons from water oxidation by the oxygen evolving complex (OEC) and
leads to the formation of oxygen. The electrons are then transferred via series of electron
carriers by two consecutive two-electron reduction steps. Then electrons are transferred to PSI
via Cyt b6f and pastocyanin (PC). PSI pigments are also excited by the light and transfers theses
electrons to ferredoxin (Fd) to form nicotinamide adenine dinucleotide phosphate (NADPH)
which reduces atmospheric CO2 to produce carbohydrates18.
The electrons from PETC can be transferred directly to the electrode via pili or nanowires. Type
IV pili (TFP) are the most prevalent pili in microorganisms, they are proteinaceous, hair-like
appendages grown on the surface of cells. Among other functions, as shown in Geobacter
sulfurreducens, TFP facilitate electron transfer from cells to extracellular electron acceptors. It
has been demonstrated that other filamentous-like structures, such as flagella in
Pelatomaculum thermopropionicum or extensions of outer membrane and periplasm in
Shewanella oneidensis, are also able to transfer electrons. Therefore, the term “microbial
nanowire” emerged to describe all the electrically conductive extracellular nanofilaments that
have been observed in microorganisms.19 It seems that the electron transfer through these
microbial nanowires in G. sulfurreducens is due to π-π stacking between aromatic amino acids,
which promotes electron delocalization conferring metal-like conductivity to the nanowire20.
Synechocystis sp. has been widely used in BPV studies. Synechocystis are cyanobacteria that
produce microbial nanowires. It has been shown that the production of these nanowires is
carbon source limited19. The pili like-structures (PLS) in Synechocystis were of 4.5-7 nm in
diameter and 2 to several μm long. Sure et al.19 analyzed the amino acid sequence of the PLS,
and they found that this sequence was composed of some aromatic amino acids, which would
explain the conductivity of these nanowires. The formation of nanowires is higher during the
exponential phase of the growth.
Scenedesmus sp. is a microalga. Some species of Scenedesmus have been reported to have long
appendages of about 20-40 μm length21, however, it is not demonstrated that these are
conductive. These two species were chosen for the present study as they provide an interesting
combination of proof of potentiality of direct electron transfer and exploration potential.
11
1.5. ELECTRON TRANSFER MEDIATORS.
Exogenous electron transfer mediators are molecules that can freely diffuse into the membrane
where all the photosynthetic system is, and pick up the electrons and transfer them to the
electrode. Many electron transfer mediators, such as ferricyanide(FeCN), benzoquinone (BQ)
and derivates have been used in BPVs2. In this project, naphthoquinone (NQ) was used as
electron mediator.
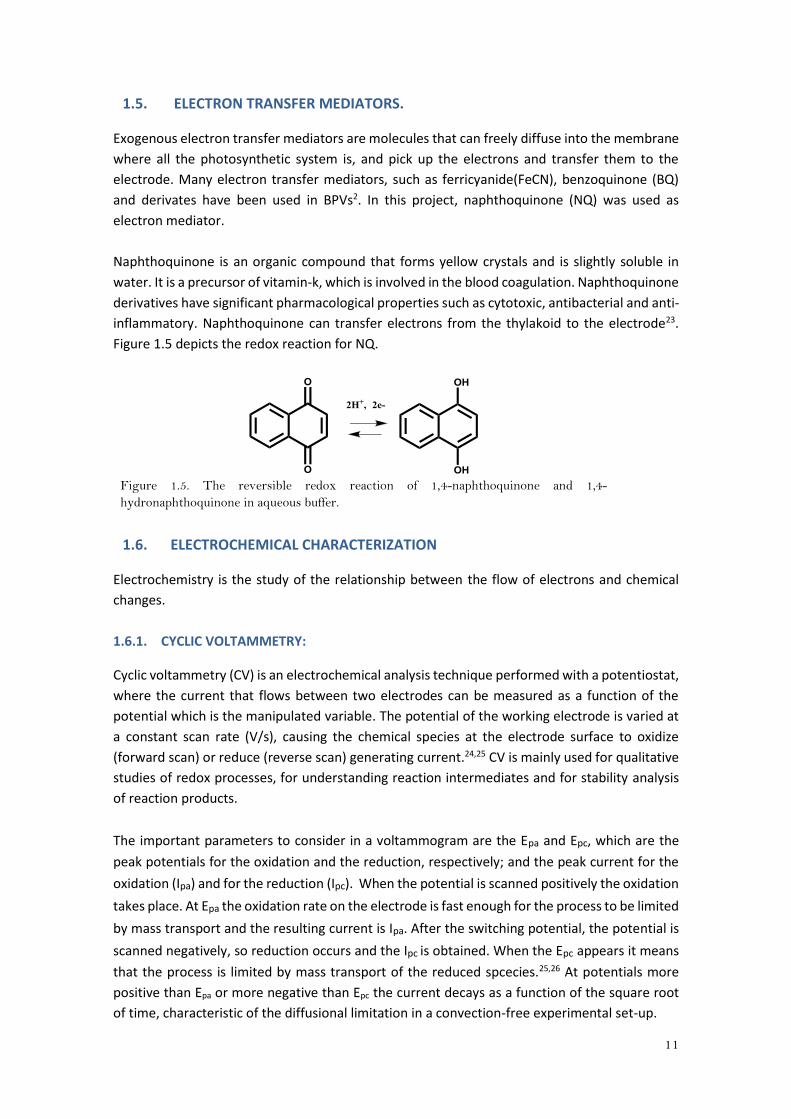
Naphthoquinone is an organic compound that forms yellow crystals and is slightly soluble in
water. It is a precursor of vitamin-k, which is involved in the blood coagulation. Naphthoquinone
derivatives have significant pharmacological properties such as cytotoxic, antibacterial and anti-
inflammatory. Naphthoquinone can transfer electrons from the thylakoid to the electrode23.
Figure 1.5 depicts the redox reaction for NQ.
Figure 1.5. The reversible redox reaction of 1,4-naphthoquinone and 1,4-
hydronaphthoquinone in aqueous buffer.
1.6. ELECTROCHEMICAL CHARACTERIZATION
Electrochemistry is the study of the relationship between the flow of electrons and chemical
changes.
1.6.1. CYCLIC VOLTAMMETRY:
Cyclic voltammetry (CV) is an electrochemical analysis technique performed with a potentiostat,
where the current that flows between two electrodes can be measured as a function of the
potential which is the manipulated variable. The potential of the working electrode is varied at
a constant scan rate (V/s), causing the chemical species at the electrode surface to oxidize
(forward scan) or reduce (reverse scan) generating current.24,25 CV is mainly used for qualitative
studies of redox processes, for understanding reaction intermediates and for stability analysis
of reaction products.
The important parameters to consider in a voltammogram are the Epa and Epc, which are the
peak potentials for the oxidation and the reduction, respectively; and the peak current for the
oxidation (Ipa) and for the reduction (Ipc). When the potential is scanned positively the oxidation
takes place. At Epa the oxidation rate on the electrode is fast enough for the process to be limited
by mass transport and the resulting current is Ipa. After the switching potential, the potential is
scanned negatively, so reduction occurs and the Ipc is obtained. When the Epc appears it means
that the process is limited by mass transport of the reduced spcecies.25,26 At potentials more
positive than Epa or more negative than Epc the current decays as a function of the square root
of time, characteristic of the diffusional limitation in a convection-free experimental set-up.
12
The redox process is described by the Nerst equation (equation 1) that relates the potential of
the electrochemical cell (E) to the standard potential of the species and the relative activities of
the oxidized (Ox) and reduced (Red) species in the systems at equilibrium25:
𝐸 = 𝐸0 −𝑅𝑇
𝑛𝐹 𝑙𝑛
[𝑂𝑥]
[𝑅𝑒𝑑]
(1)
where n is the number of electrons, R is the molar gas constant (8,3144 J mol-1 k-1), T is
temperature in (K) and F de Faraday constant (96,485 C/equiv).
If the reaction is reversible (fast) the separation between the two peaks is
𝛥𝐸𝑝 = |𝐸𝑝𝑎 − 𝐸𝑝𝑐| = 2.3𝑅𝑇
𝑛𝐹=
59
𝑛 𝑚𝑉 (𝑎𝑡 298 𝐾)
(2)
The half-wave potential is:
𝐸1/2 = 𝐸𝑝𝑎 + 𝐸𝑝𝑐
2
(3)
The current depends on the transport of electroactive material to the surface and the electron
transfer reaction. The peak current (Ip) in a reversible voltammogram is given by the Randles-
Sevcik equation (equation 4)25 and is related with the concentration and the diffusion coefficient
D (cm2 s-1):
𝑖𝑝 = (2.686 × 10⁵) 𝑛3/2 𝐴𝐶0𝐷1/2𝑣1/2 (4)
Where A is the electrode area (cm2), C0 is the concentration (mol cm-3) and v is the scan rate
(mV/s).
For reversible reactions, the positions of the potential peaks do not change when changing the
voltage scan rate, whereas in irreversible or quasi-reversible (slower) reactions, they do. The
peak currents of reversible redox couples that are freely diffusing in solution, are proportional
to the square root of the scan rate.27
1.6.2. CHRONOAMPEROMETRY:
Chronoamperometry (CA) is an electrochemical technique in which the applied potential to the
electrode (E1), where only non- Faradaic currents are occurring, is abruptly changed to a defined
potential (E2) and the resulting current variation is recorded as a function of time. The mass
transport throughout this process is governed by diffusion, so the current-curve obtained
reflects the change of electroactive species on the electrode surface. As time progresses, the
concentration gradient decreases due to a continuing growth of the diffusion layer related with
the depletion of the reactant. For reversible redox reactions, the Cottrell equation28 (equation
5) describes the observed current at any time following a large forward potential step as a
function of t-1/2.
𝑖 = 𝑛𝐹𝐴𝐷12𝐶(𝜋𝑡)−1/2
(5)
where n is the number of electrons involved in the reaction, F is the Faradaic constant, A is the
surface area, D is the diffusion coefficient, C is the concentration of the electroactive species and
t is time. The non- Faradaic processes (charging currents of the double layer) also contributes to
the current recorded but are only significant immediately just after applying the potential step
since they decay as a function of 1/t.
13
2. AIM OF THE PROJECT:
The low power outputs obtained with BPV are mainly due to electrochemical losses and can be
addressed if the following variables are improved: the photosynthetic microorganism; the
electrodes; the proton exchange membrane (PEM); the electrolyte solution; and the light
intensity. For this project, the focus was only in photosynthetic microorganism – electrode
interaction improvement. Therefore, the aim of this project was to achieve reproducible cell
adhesion of electrogenic microalgae or cyanobacteria onto biophotovoltaic cell electrode
materials to improve the current generation.
Synechocystis PCC6803 (hereafter referred as Synechocystis) and Scenedesmus sp. were the
photosynthetic microorganisms tested.
This project was divided in 2 sections:
The first section was focused on the selection of the immobilization method in which the best
redox response and the higher number of cells on the surface of the electrodes were achieved.
Synechocystis was chosen as the photosynthetic model for this study since they are widely
used in the BPV field and they have microbial nanowires.
- Initially, a study of the minimum optimal time of incubation of the photosynthetic
microorganisms onto the electrode was carried out.
- Second, the surfaces of gold and glassy carbon electrodes were modified by different
procedures and their efficiency to immobilize photosynthetic microorganisms to
enhance the current generation was analyzed. Self-assembled monolayers of 6-
mercapto-1-hexanol (MH) and 11-Amino-1-undecanethiol hydrochloride (AUT) were
formed on gold surfaces to study the influence of the head group on the immobilization
of the photosynthetic microorganism. PEI was cross-linked with PEDGE to form a
hydrogel onto gold and GCE surface as the second modification procedure. The modified
surfaces were characterized electrochemically and microscopically.
- Third, the study of the capability to direct electron transfer (DET) of immobilized
Synechocystis with the modified electrodes.
The second section was a study of the capability to electron transfer (ET) of the immobilized
cyanobacteria and microalgae onto the most suitable modified electrode by means of an
exogenous electron mediator, the naphthoquinone. Both Synechocystis and Scenedesmus were
tested in three different electrolytes:
- Phosphate buffered saline (PBS) was used as a control since it is widely used in the
studies of current generation from photosynthetic microorganisms.
- Their supernatant, which was the culture medium at the time of harvesting. Therefore,
the photosynthetic microorganisms were active in this medium. It was used as
electrolyte to discard current generation from electron mediators excreted by the
photosynthetic microorganism.
- Fresh medium, which had the nutrients and conditions for the optimal growth.
14
Moreover, the response to different variables were evaluated:
- Light/dark conditions
- Glucose addition
15
3. MATERIALS AND METHODS:
3.1. MATERIALS
Reagents and materials:
Synechocystis PCC6803 and Scenedesmus sp. were obtained from the Spanish Culture Collection.
Cyanobacteria BG-11 freshwater solution 50x, potassium ferricyanide (K3[Fe(CN)6), SYTOX™
Green Dead Cell Stain, 11-Amino-1-undecanethiol hydrochloride 99%, 6-mercapto-1-hexanol,
poly(ethyleinimine) solution ~50% in H20, 2-morpholin-4-ylethanesulfonic acid (MES),
phosphate buffer saline (PBS), Phosphate buffer saline with tween (PBS-Tween) and 1,4-
Naphthoquinone were purchased from Sigma-Aldrich. All of them of analytic grade.
Gold disk electrodes of 2 mm diameter, glassy carbon disk electrodes (GCE) of 3 mm diameter,
silver chloride (Ag/AgCl) reference electrode, platinum wire 0.20m, alumina polish powders
(Micro polish powder 0.05μ and 0.3μ) were purchased from CH Instruments.Inc.
Hydrogen peroxide 30%, sulfuric acid and acetone, all of them of analytical grade were
purchased from Scharlau, Spain.
Poly (ethylene glycol)(200) diglycidyl ether (PEDGE) was purchased from Polyscience, Inc.
Potassium nitrate was purchased from Acros organics. Zirconium/silicon pearls were purchased
from BIioSpec Products, USA. Ethanol was purchased from Panreac Quimica SLU.
Equipments:
Algae were grown in a Selecta rotabit incubator from Scharlau Microbiology and centrifuged
with MPW 350R centrifuge from MPW medical Instruments. Optical density of the algae cultures
was measured with Spectra max 340 PC microplate reader spectrophotometer from Molecular
Devices. The extraction of chlorophyll was performed with Mini-bead beater from BioSpec
Products and centrifuge Centrifuge 5417 R (Eppendorf) Electrode cleaning was conducted using
a ultrasonic cleaner Branson 2000. Electrochemical analysis were performed with EcoChemi
Autolab PGSTAT12 galvanostat/potentiostat and General Purpose Electrochemical System
(GPES) version 4.9 (Eco Chemie B.V) software. The electrochemical cell was illuminated with a
strip of Blue LEDs of 12V DC. Surface analysis was performed employing a Nikon fluorescence
microscope NIkon TE 2000-E, images were captured with NIS-Elements software and treated
with Image J software.
3.2. PHOTOSYNTHETIC MICROORGANISMS CULTURE AND CELL GROWTH:
Cells were grown in 250mL shaker flasks containing 100mL of sterile water with 2% of
Cyanobacteria BG-11 freshwater solution 50x (BG11) medium, as recommended by the
suppliers. Cultures were grown at 20-22°C with gentle agitation, 150 rpm, in a light/dark cycle
of 16/8 h. Culture growth was monitored with spectrophotometry, at a wavelength of 680 nm
(chlorophyll absorbance). Cyanobacteria and microalgae were harvested when cultures reached
an absorbance of 0.5 – 0.7 optical density (OD) coinciding in general with the end of the
exponential phase.
.
16
Chlorophyll pigments were extracted by the acetone method: 500μL of cells were harvested at
0.5-07OD and centrifuged for 15 minutes at 15000rpm at 4°C. The pellet was mashed with
0.5mm zirconium/silicon pearls in a homogenizer for 2 minutes and then 1mL of pure acetone
was added and kept for 8h at 4°C. Afterwards, the samples were centrifuged at 5000rpm for 10
minutes at 4ºC and the chlorophyll a (Chl-a) content was determined in the supernatant by a
spectrophotometric method6 at 630nm (OD630), 645nm (OD645) and 665nm (OD665) wavelength.
The Chl-a concentration (mg/L) was calculated using the following equation (3.1), considering
the volume of acetone (Va) and the volume of the culture (Vc).
[𝐶ℎ𝑙 − 𝑎] = 𝐶𝑎 ×𝑉𝑎
𝑉𝑐
(3.1)
where,
𝐶𝑎 = 11.6×𝑂𝐷665 − 1.31×𝑂𝐷645 − 0.14×𝑂𝐷630 (3.2)
3.3. SELECTION OF THE IMMOBILIZATION METHOD:
The first part of the project was focused on surveying the surface modification methods and
electrode materials and correlating them to photosynthetic microorganism attachment to the
electrode. This screening was carried out by electrochemical and fluorescence microscopy
characterization just in one strain, Synechocystis.
3.3.1. EVALUATION OF THE MINIMUM OPTIMAL INCUBATION TIME:
Prior to studying the different surface modifications, an investigation of the minimum incubation
time necessary to achieve a good cell attachment was carried out in order to streamline the
experiments. The choice of the time of incubation was done by a combination of electrochemical
analysis and fluorescence microscopy.
These studies were carried out incubating the suspension of Synechocystis onto gold (Au) disk
electrodes, and incubating its incubating its supernatant (after cells were removed by
centrifugation) as control.
Gold electrode polishing:
Gold electrodes were put in a petri dish with a grid pad stuck on it and polished with aqueous
slurries of alumina polishing powder 0.05 μ for 5 minutes making 8-shape movements. Then
they were rinsed with Millipore water and ultrasonicated with acetone for 5 minutes and with
Millipore sequentially. Then the electrodes were immersed into Piranha solution (H2SO4: H2O2
(30%), 3:1) for 20 minutes. Warning! Piranha solutions are extremely corrosive and can be
explosive if not handled with appropriate training and due care. This work can only be carried
out in a sufficiently revised fume hood)
The incubation times tested were: 1.5h; 4h; 18h; and 24h.
Cells were harvested at 0.5-0.7OD, in the exponential growth phase. 400μL of the suspension
were placed in a 0.5μL Eppendorf and left inverted for the time of incubation at 19ªC onto the
gold electrode to allow the cells be physisorbed on it.
17
after centrifuging 5 mL of cell culture suspension at 5000 rpm for 15 minutes at 4°C. Triplicates
were run for each experiment and the standard deviation is reported in error bars.
3.3.1.1. Electrochemical characterization of the minimum optimal incubation time:
The electrochemical study of the minimum optimal incubation time of Synechocystis was
performed in a conventional three-electrode electrochemical cell. Gold electrode (Au) was the
working electrode, Silver chloride electrode (Ag/AgCl) was the reference electrode, and
platinum wire (Pt) was the counter electrode. The electrodes were connected to a potentiostat.
The electrolyte was 1mM of potassium ferricyanide in a solution of 1M potassium nitrate (1mM
K3Fe[(CN)6] in 1M KNO3). Cyclic voltammetries were run from -0.2V to 0.55V at different scan
rates from 25mV/s to 200mV/s, with 10s of equilibrium time.
From the software, the peak potentials and the peak currents were extracted to an Excel to
calculate the peak separation (ΔEp), equation 3.3, and the electroactive surface area (A) of the
ferricyanide (FeCN) redox.
𝛥𝐸𝑝 = |𝐸𝑝𝑎 − 𝐸𝑝
𝑐| (3.3)
The A was calculated by plotting the anodic peak currents (Ipc) against the square root of the
scan rate (ν1/2) and by applying the Randles-Sevcick equation (equation 3.4).
𝑖𝑝 = (2.686 × 10⁵) 𝑛3/2 𝐴𝐶0𝐷1/2𝑣1/2 (3.4)
3.3.1.2. Fluorescence microscopy characterization of the minimum optimal incubation
time:
The incubated electrodes were washed with Millipore water in a beaker and then stained with
a solution of 0.5μM of SYTOX™ Green Dead Cell Stain for 30 minutes under dark conditions. Then
the electrodes were washed again with Millipore water and kept in falcon tubes filled with an
aqueous solution of 2%BG11 for keeping the cells alive.
The surface of the electrodes was analyzed under fluorescence microscopy at two excitation
wavelengths to observe the dead and live cells.
SYTOX™ Green Dead Cell Stain is a green fluorochrome with an excitation/emission (exc/em) of
504/523nm that binds to nucleic acid but only penetrates dead cells. Photosynthetic organisms
have chlorophyll pigments that present autofluorescence with an exc/em of 630/(650-
700)nm29. This dual-fluorescence viability method is perfect for differentiating live from dead
cells, since the emission wavelengths of both fluorochromes do not overlap.
Image J was used to merge the pictures taken at the two fluorescence emission lights and color
them in green for the dead cells, and blue for the live cells.
18
3.3.2. SURFACE MODIFICATIONS:
The surface modifications were performed onto gold disk electrodes and glassy carbon disk
electrodes (GCE)
Modification via SAM: only for gold electrodes
Gold surface modifications were carried out by self-assembly monolayers with 2 different
alkanethiols: 11-amino-1-undecanethiol and mercaptohexanol.
Both alkanethiols formed SAMs onto the surface of the gold electrodes following the same
procedure: 20μl at 100μM concentration of alkanethiol in pure ethanol were dropped onto the
electrode and left incubating overnight (O/N) on top of a box filled with ethanol in a wet
chamber. Then the electrodes were washed in a beaker with PBS-tween.
To analyze if the SAMs were formed, a reductive desorption of thiol from the gold surface with
0.1M KOH in aqueous solution was carried out. The potential was scanned from 0 to -1.1V at
50mV/s30.
Modification via hydrogel:
Gold electrodes and GCE were modified with an hydrogel formed by crosslinking
poly(ethyleinimine) solution ~50% in H20 (PEI) with Poly (Ethylene glycol)(200) Diglycidyl ether
(PEDGE).
First the polymer solutions were prepared:
PEI solution: 5mg of PEI were diluted up to 10mL of Millipore water and then diluted to a in 2-
morpholin-4-ylethanesulfonic acid (MES) to a final concentration of 25mg/mL. The pH was
adjusted to 7. The molarity of the solution was calculated considering the molecular weight
(473g/mol) and the 4 primary amines that were expected to react with the crosslinker, PEDGE.
25𝑚𝑔
𝑚𝑙×
1𝑔
103𝑚𝑔×
1𝑚𝑜𝑙
473.5𝑔×
103𝑚𝑙
1𝑙×4 = 0.216𝑀
(3.5)
PEDGE solution: 55mg of PEDGE were diluted in 10mL of Millipore water. The molarity of the
solution was calculated considering the molecular weight (306g/mol) and the 2 epoxy groups
that were expected to react with PEI.
5𝑚𝑔
𝑚𝑙×
1𝑔
103𝑚𝑔×
1𝑚𝑜𝑙
306𝑔×
103𝑚𝑙
1𝑙×2 = 0.032𝑀
(3.6)
The hydrogel was formed, immediately before the drop casting onto the electrode, by mixing
the polymers in a volume ratio of 1:1, which is equivalent to a molar ratio of PEI/PEDGE 6.75/1.
5μl of PEI/PEDGE were dropped onto the gold electrodes and left incubating O/N under vacuum
in a desiccator.
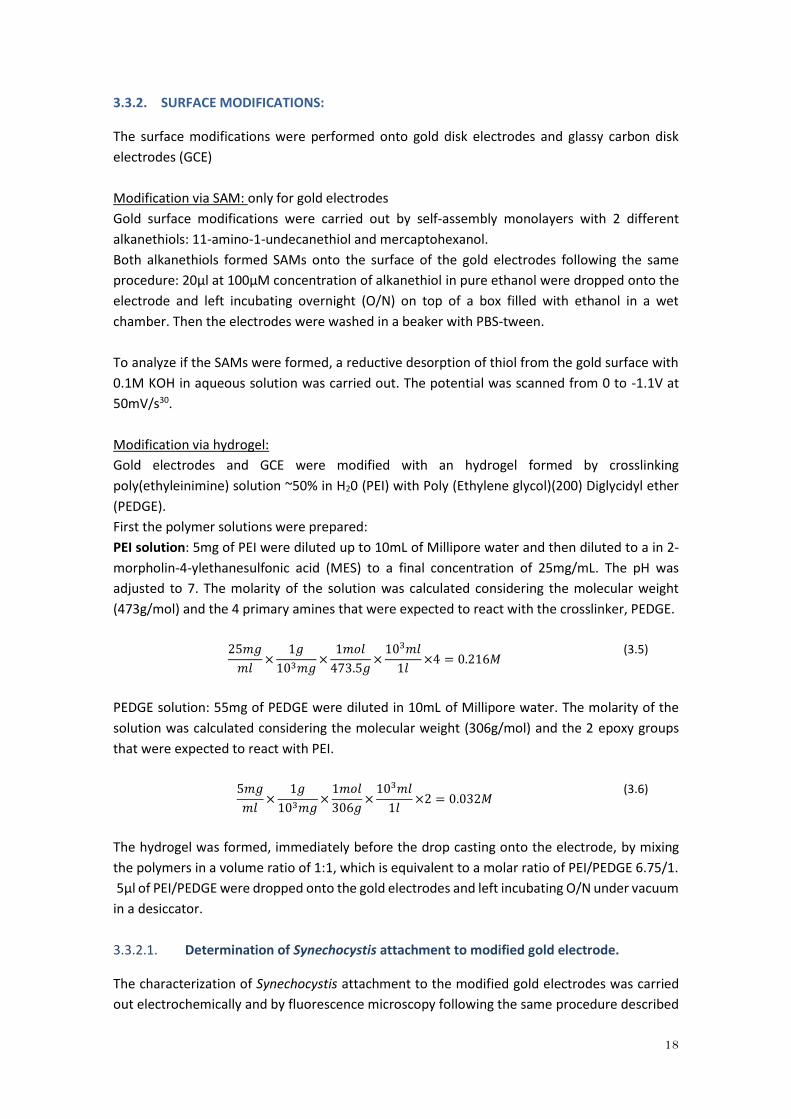
3.3.2.1. Determination of Synechocystis attachment to modified gold electrode.
The characterization of Synechocystis attachment to the modified gold electrodes was carried
out electrochemically and by fluorescence microscopy following the same procedure described
19
in sections 3.3.1.1 and 3.3.1.2. The working electrodes were the modified gold electrodes with
and without having been incubated with Synechocystis. The following diagram (Figure 3.1)
depicts the surface modifications and the electrodes tested (working electrodes):
Figure 3.1. Diagram of modified gold electrodes characterize electrochemically and microscopically
with Synechocystis
Triplicates of each electrode were analyzed for statistical studies.
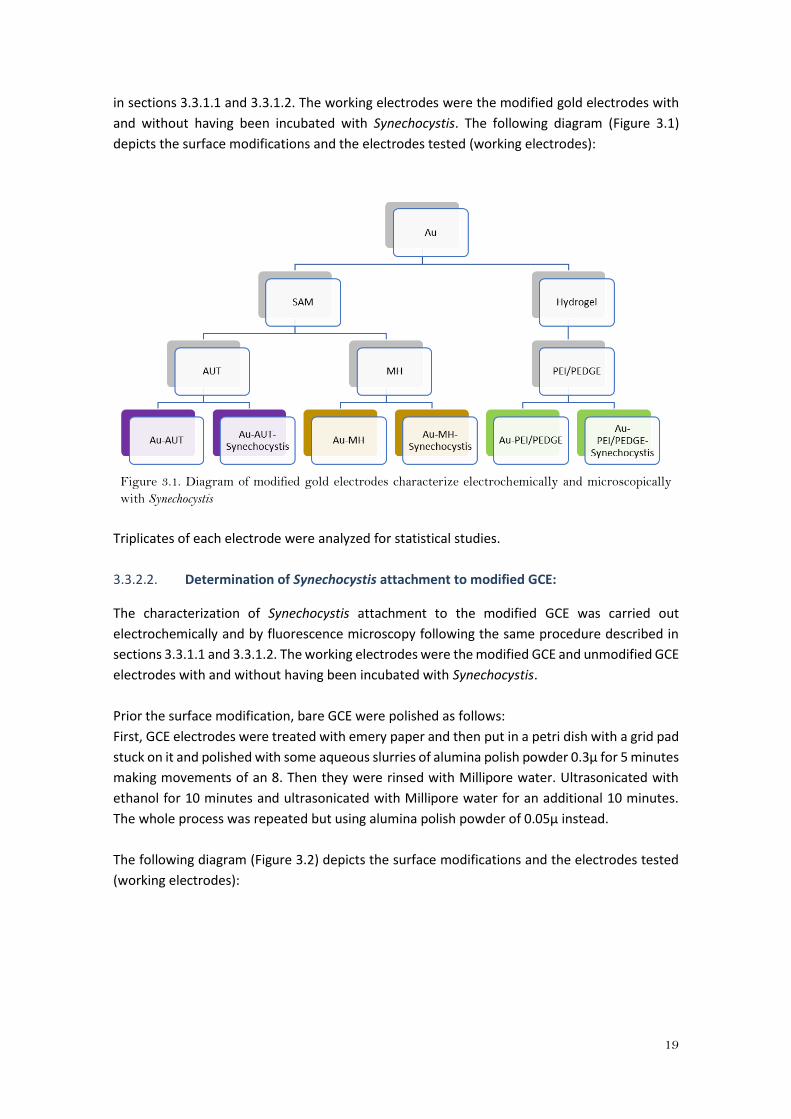
3.3.2.2. Determination of Synechocystis attachment to modified GCE:
The characterization of Synechocystis attachment to the modified GCE was carried out
electrochemically and by fluorescence microscopy following the same procedure described in
sections 3.3.1.1 and 3.3.1.2. The working electrodes were the modified GCE and unmodified GCE
electrodes with and without having been incubated with Synechocystis.
Prior the surface modification, bare GCE were polished as follows:
First, GCE electrodes were treated with emery paper and then put in a petri dish with a grid pad
stuck on it and polished with some aqueous slurries of alumina polish powder 0.3μ for 5 minutes
making movements of an 8. Then they were rinsed with Millipore water. Ultrasonicated with
ethanol for 10 minutes and ultrasonicated with Millipore water for an additional 10 minutes.
The whole process was repeated but using alumina polish powder of 0.05μ instead.
The following diagram (Figure 3.2) depicts the surface modifications and the electrodes tested
(working electrodes):
20
Figure 3.2. Diagram of modified gold electrodes characterize electrochemically and microscopically
with Synechocystis
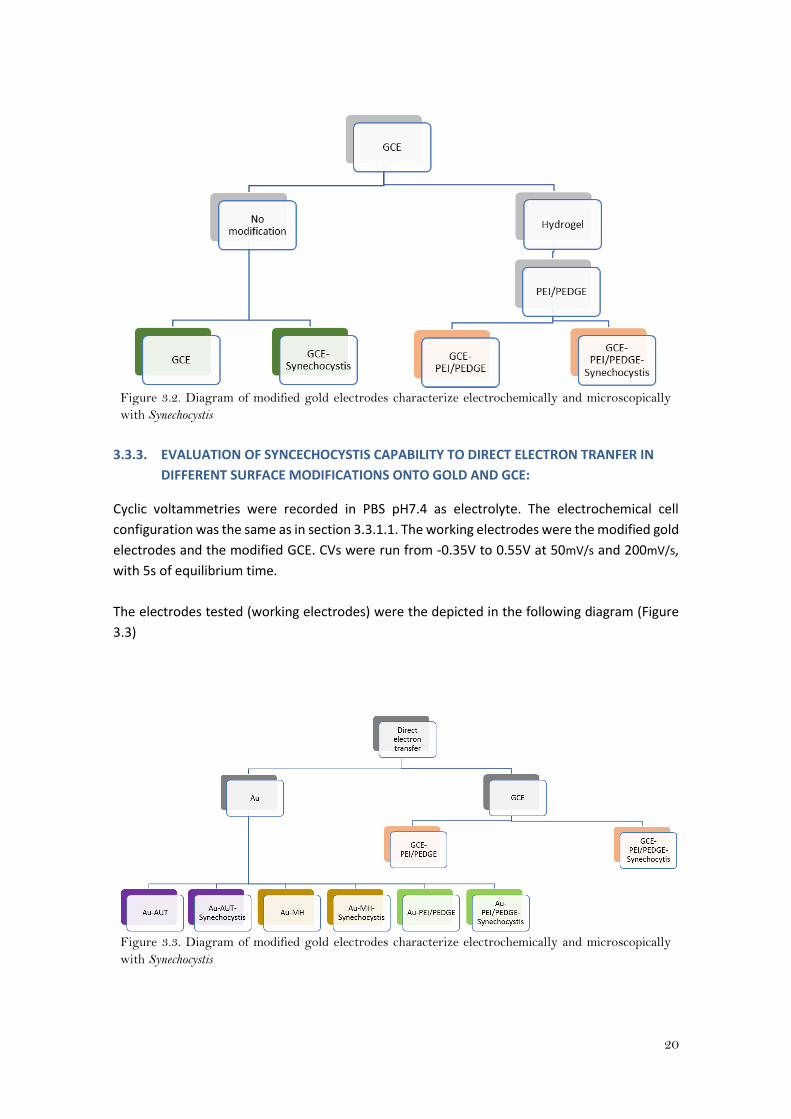
3.3.3. EVALUATION OF SYNCECHOCYSTIS CAPABILITY TO DIRECT ELECTRON TRANFER IN
DIFFERENT SURFACE MODIFICATIONS ONTO GOLD AND GCE:
Cyclic voltammetries were recorded in PBS pH7.4 as electrolyte. The electrochemical cell
configuration was the same as in section 3.3.1.1. The working electrodes were the modified gold
electrodes and the modified GCE. CVs were run from -0.35V to 0.55V at 50mV/s and 200mV/s,
with 5s of equilibrium time.
The electrodes tested (working electrodes) were the depicted in the following diagram (Figure
3.3)
Figure 3.3. Diagram of modified gold electrodes characterize electrochemically and microscopically
with Synechocystis
21
3.4. MEDIATED ELECTRON TRANSFER CHARACTERIZATION OF PHTOTOSYNTHETIC
MICROORGANISMS ONTO AU-PEI/PEDGE AND GCE-PEI/PEDGE:
3.4.1. FLUORESCENCE MICROSCOPY OF Synechocystis AND Scenedesmus ONTO AU-
PEI/PEDGE AND ONTO GCE-PEI/PEDGE:
Fluorescence microscopy was carried out for Synechocystis and Scenedesmus immobilized onto
GCE-PEI/PEDGE and Au-PEI/PEDGE and compared with their immobilization onto the
unmodified electrodes. The same procedure described in section 3.3.1.2.
3.4.2. EVALUATION OF Synechocystis CAPABILITY OF MEDIATED ELECTRON TRANSFER ONTO
AU-PEI/PEDGE AND ONTO GCE-PEI/PEDGE:
Cyclic voltammetries and chronoamperotmetries were performed under the same
electrochemical cell configuration as in section 3.3.1.1. The incubation of Synechocystis was
carried out as described in section 3.3.1.
All the electrodes were analyzed in three different electrolytes: PBS pH7, the supernatant of
Synechocystis(SN Syne)a and the fresh medium (BG11). Naphthoquinone was dissolved in these
electrolytes to a final concentration of 0.6mM (PBS+NQ; SN Syne+NQ; BG11+NQ).
The cell suspension was used as a control. 5mL of cells at 0.5-0.7OD were harvested and
centrifuged at 5000rpm for 15 minutes at 4°C. The pellet was resuspended in the electrolyte
tested, PBS+NQ and SN Syne+NQ.
For the study of change in electrochemical behavior due to illumination, the electrochemical cell
was placed in a porexpan box covered with foil paper to prevent the cells from the light. A strip
of blue LEDS of 12V DC were placed under the electrochemical cell.
Cyclic voltammetry:
CVs were recorded under light and dark conditions in PBS+NQ, SN Syne+NQ and in BG11+NQ for
each electrode tested. CVs were run from -0.5V to 0.55V at 50mV/s with 5s of equilibrium time.
The window potential was large enough to observe the redox peaks for the NQ based in the
formal potential (E0’) obtained in PBS and to observe any other current changes due to the
cyanobacteria.
Chronoamperometry:
CAs were recorded under light/dark cycles in PBS+NQ, SN Syne+NQ and in BG11+NQ for ca.
1700s to each tested electrode. The potential applied was 0V. There were 3 “light on” cycles of
120s and 3 “light off” cycles of 180s prior the injection of 1ml of 1M glucose. Glucose was
injected by a syringe after the fourth “light on” cycle. Then 2 more cycles of “light on”/”light off”
were applied.
a SN Syne was obtained following the same procedure described in section 3.3.1.
22
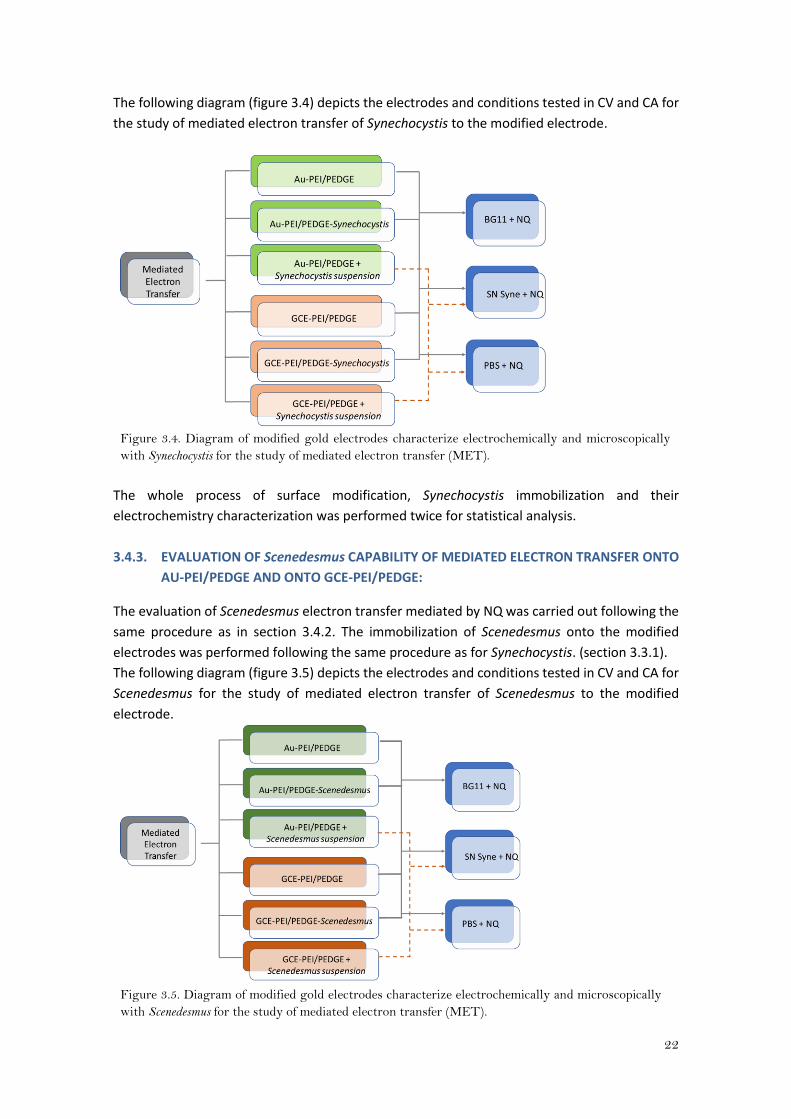
The following diagram (figure 3.4) depicts the electrodes and conditions tested in CV and CA for
the study of mediated electron transfer of Synechocystis to the modified electrode.
Figure 3.4. Diagram of modified gold electrodes characterize electrochemically and microscopically
with Synechocystis for the study of mediated electron transfer (MET).
The whole process of surface modification, Synechocystis immobilization and their
electrochemistry characterization was performed twice for statistical analysis.
3.4.3. EVALUATION OF Scenedesmus CAPABILITY OF MEDIATED ELECTRON TRANSFER ONTO
AU-PEI/PEDGE AND ONTO GCE-PEI/PEDGE:
The evaluation of Scenedesmus electron transfer mediated by NQ was carried out following the
same procedure as in section 3.4.2. The immobilization of Scenedesmus onto the modified
electrodes was performed following the same procedure as for Synechocystis. (section 3.3.1).
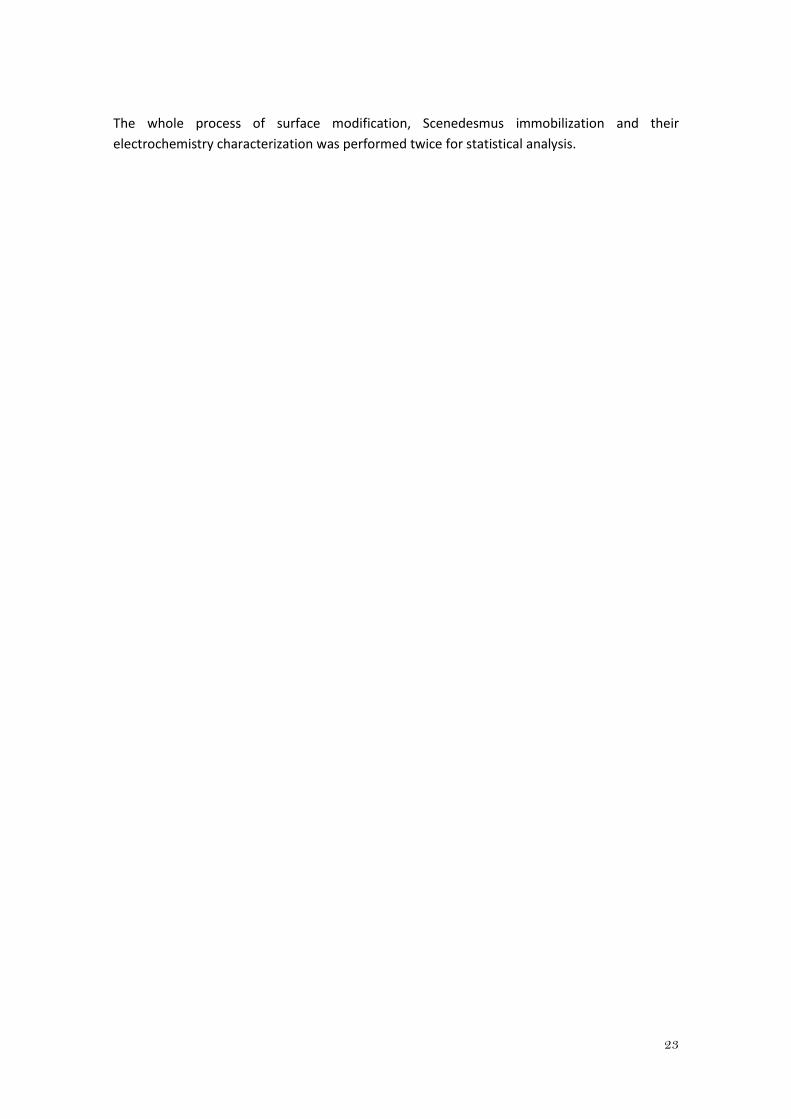
The following diagram (figure 3.5) depicts the electrodes and conditions tested in CV and CA for
Scenedesmus for the study of mediated electron transfer of Scenedesmus to the modified
electrode.
Figure 3.5. Diagram of modified gold electrodes characterize electrochemically and microscopically
with Scenedesmus for the study of mediated electron transfer (MET).
23
The whole process of surface modification, Scenedesmus immobilization and their
electrochemistry characterization was performed twice for statistical analysis.
24
4. RESULTS AND DISCUSSION:
4.1. CHLOROPHYLL CONCENTRATION:
The concentration of chlorophyll a (Chl-a) was of 2.16mg/L for Synechocystis and 6.18mg/L for
Scenedesmus.
4.2. SELECTION OF THE IMMOBILIZATION METHOD:
4.2.1. INCUBATION TIME:
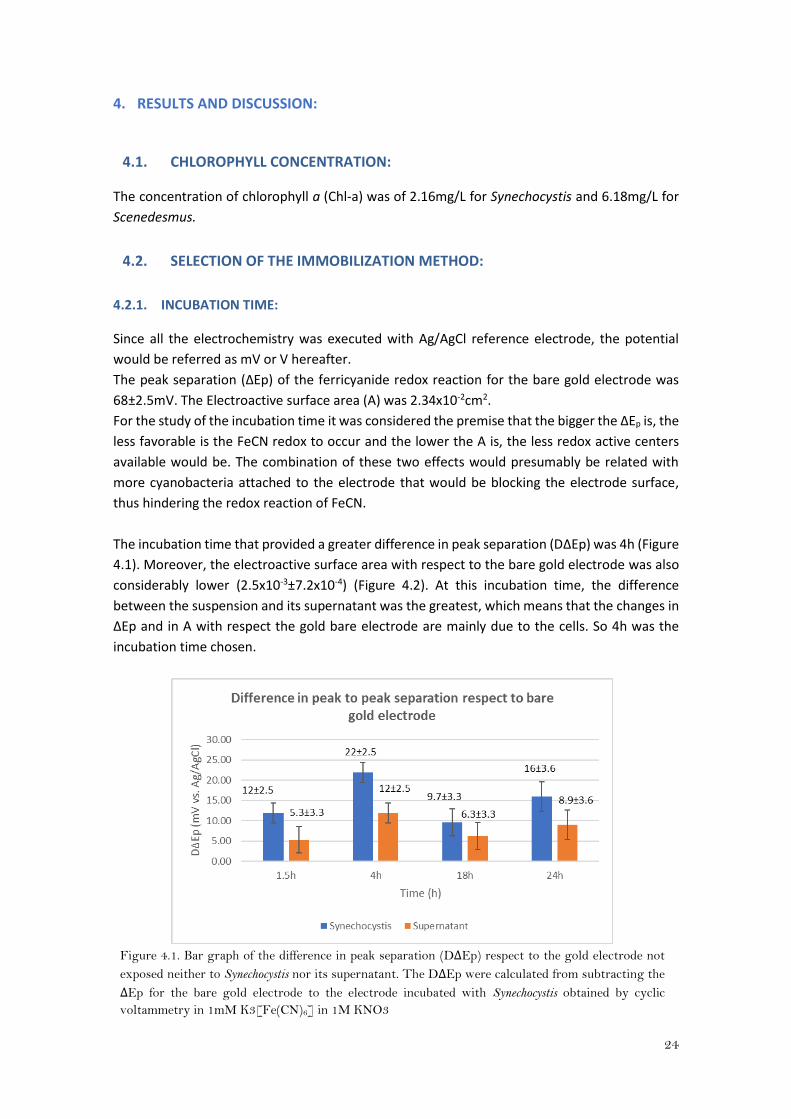
Since all the electrochemistry was executed with Ag/AgCl reference electrode, the potential
would be referred as mV or V hereafter.
The peak separation (ΔEp) of the ferricyanide redox reaction for the bare gold electrode was
68±2.5mV. The Electroactive surface area (A) was 2.34x10⁻²cm2.
For the study of the incubation time it was considered the premise that the bigger the ΔEp is, the
less favorable is the FeCN redox to occur and the lower the A is, the less redox active centers
available would be. The combination of these two effects would presumably be related with
more cyanobacteria attached to the electrode that would be blocking the electrode surface,
thus hindering the redox reaction of FeCN.
The incubation time that provided a greater difference in peak separation (DΔEp) was 4h (Figure
4.1). Moreover, the electroactive surface area with respect to the bare gold electrode was also
considerably lower (2.5x10⁻³±7.2x10⁻⁴) (Figure 4.2). At this incubation time, the difference
between the suspension and its supernatant was the greatest, which means that the changes in
ΔEp and in A with respect the gold bare electrode are mainly due to the cells. So 4h was the
incubation time chosen.
Figure 4.1. Bar graph of the difference in peak separation (DΔEp) respect to the gold electrode not
exposed neither to Synechocystis nor its supernatant. The DΔEp were calculated from subtracting the
ΔEp for the bare gold electrode to the electrode incubated with Synechocystis obtained by cyclic
voltammetry in 1mM K3[Fe(CN)6] in 1M KNO3
25
Figure 4.2. Bar graph of the difference in electroactive surface area (A) respect to the gold electrode
not exposed neither to Synechocystis nor its supernatant.
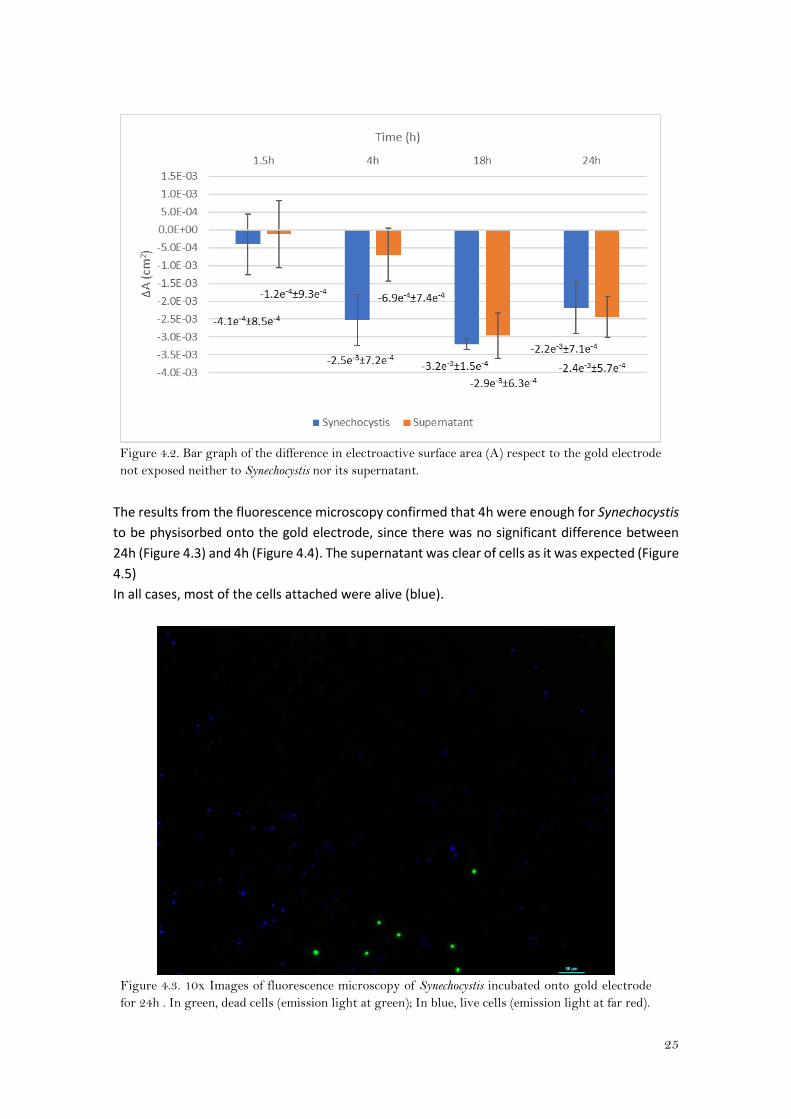
The results from the fluorescence microscopy confirmed that 4h were enough for Synechocystis
to be physisorbed onto the gold electrode, since there was no significant difference between
24h (Figure 4.3) and 4h (Figure 4.4). The supernatant was clear of cells as it was expected (Figure
4.5)
In all cases, most of the cells attached were alive (blue).
Figure 4.3. 10x Images of fluorescence microscopy of Synechocystis incubated onto gold electrode
for 24h . In green, dead cells (emission light at green); In blue, live cells (emission light at far red).
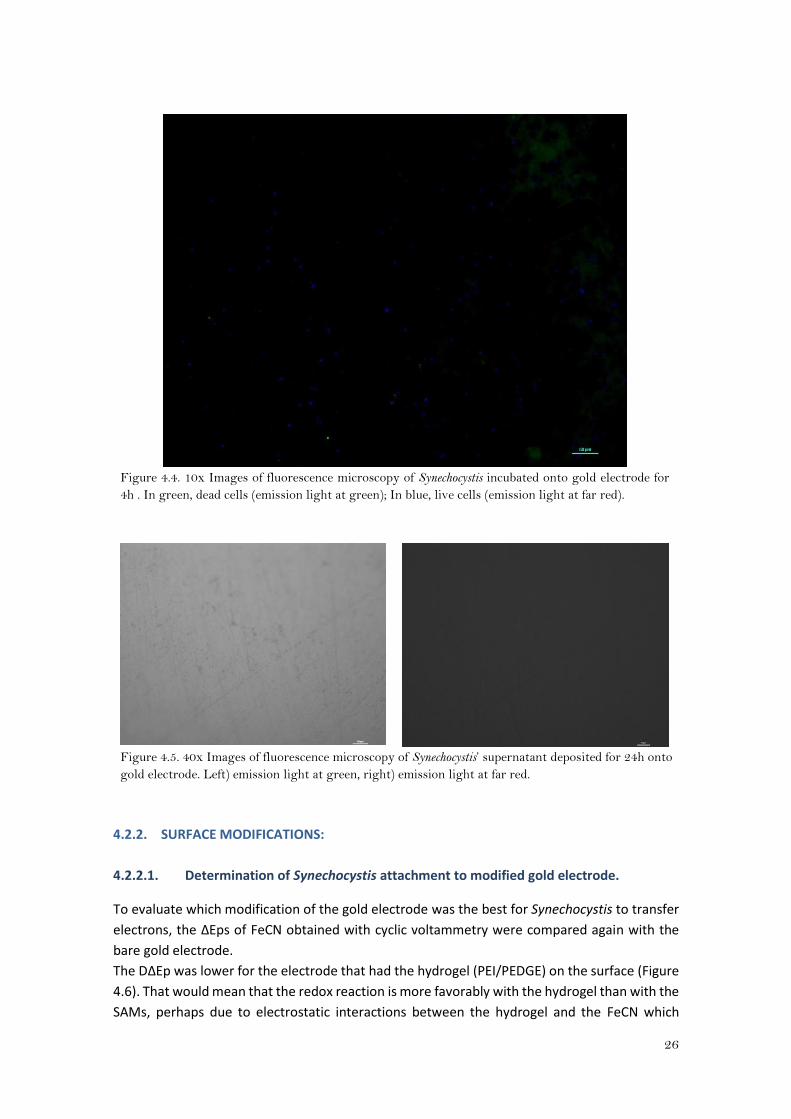
26
Figure 4.4. 10x Images of fluorescence microscopy of Synechocystis incubated onto gold electrode for
4h . In green, dead cells (emission light at green); In blue, live cells (emission light at far red).
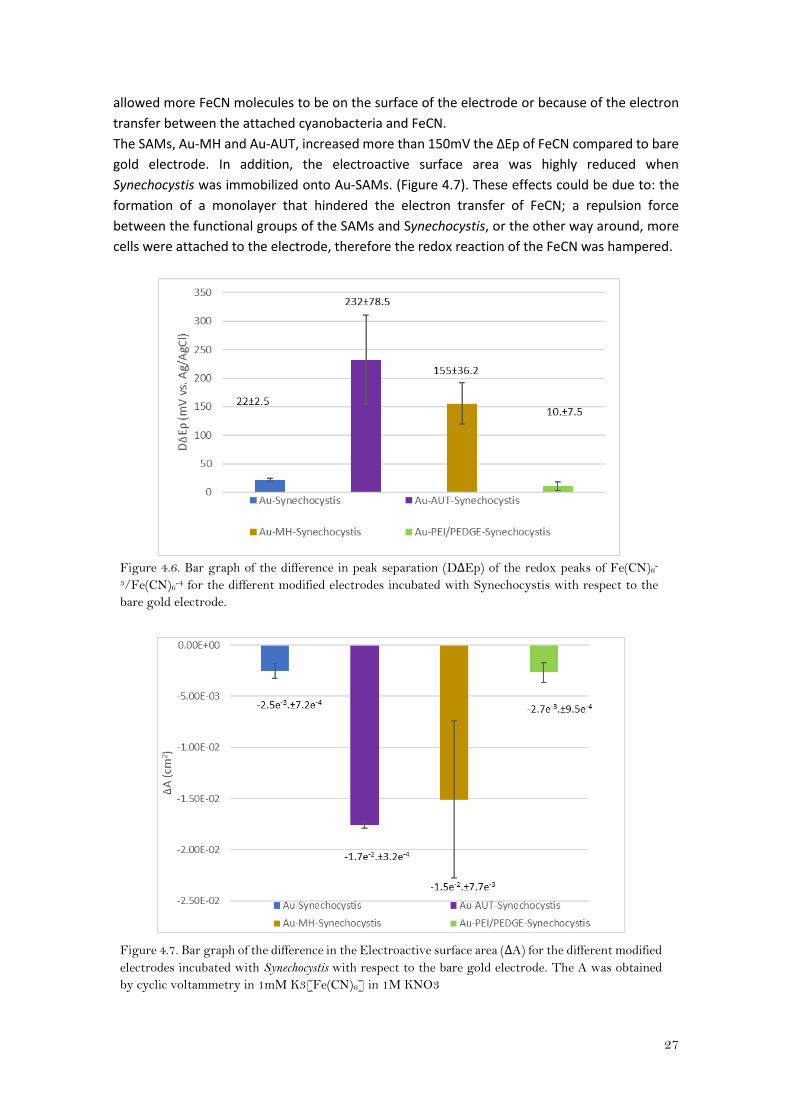
Figure 4.5. 40x Images of fluorescence microscopy of Synechocystis’ supernatant deposited for 24h onto
gold electrode. Left) emission light at green, right) emission light at far red.
4.2.2. SURFACE MODIFICATIONS:
4.2.2.1. Determination of Synechocystis attachment to modified gold electrode.
To evaluate which modification of the gold electrode was the best for Synechocystis to transfer
electrons, the ΔEps of FeCN obtained with cyclic voltammetry were compared again with the
bare gold electrode.
The DΔEp was lower for the electrode that had the hydrogel (PEI/PEDGE) on the surface (Figure
4.6). That would mean that the redox reaction is more favorably with the hydrogel than with the
SAMs, perhaps due to electrostatic interactions between the hydrogel and the FeCN which
27
allowed more FeCN molecules to be on the surface of the electrode or because of the electron
transfer between the attached cyanobacteria and FeCN.
The SAMs, Au-MH and Au-AUT, increased more than 150mV the ΔEp of FeCN compared to bare
gold electrode. In addition, the electroactive surface area was highly reduced when
Synechocystis was immobilized onto Au-SAMs. (Figure 4.7). These effects could be due to: the
formation of a monolayer that hindered the electron transfer of FeCN; a repulsion force
between the functional groups of the SAMs and Synechocystis, or the other way around, more
cells were attached to the electrode, therefore the redox reaction of the FeCN was hampered.
Figure 4.6. Bar graph of the difference in peak separation (DΔEp) of the redox peaks of Fe(CN)6
-
3/Fe(CN)6-4 for the different modified electrodes incubated with Synechocystis with respect to the
bare gold electrode.
Figure 4.7. Bar graph of the difference in the Electroactive surface area (ΔA) for the different modified
electrodes incubated with Synechocystis with respect to the bare gold electrode. The A was obtained
by cyclic voltammetry in 1mM K3[Fe(CN)6] in 1M KNO3
28
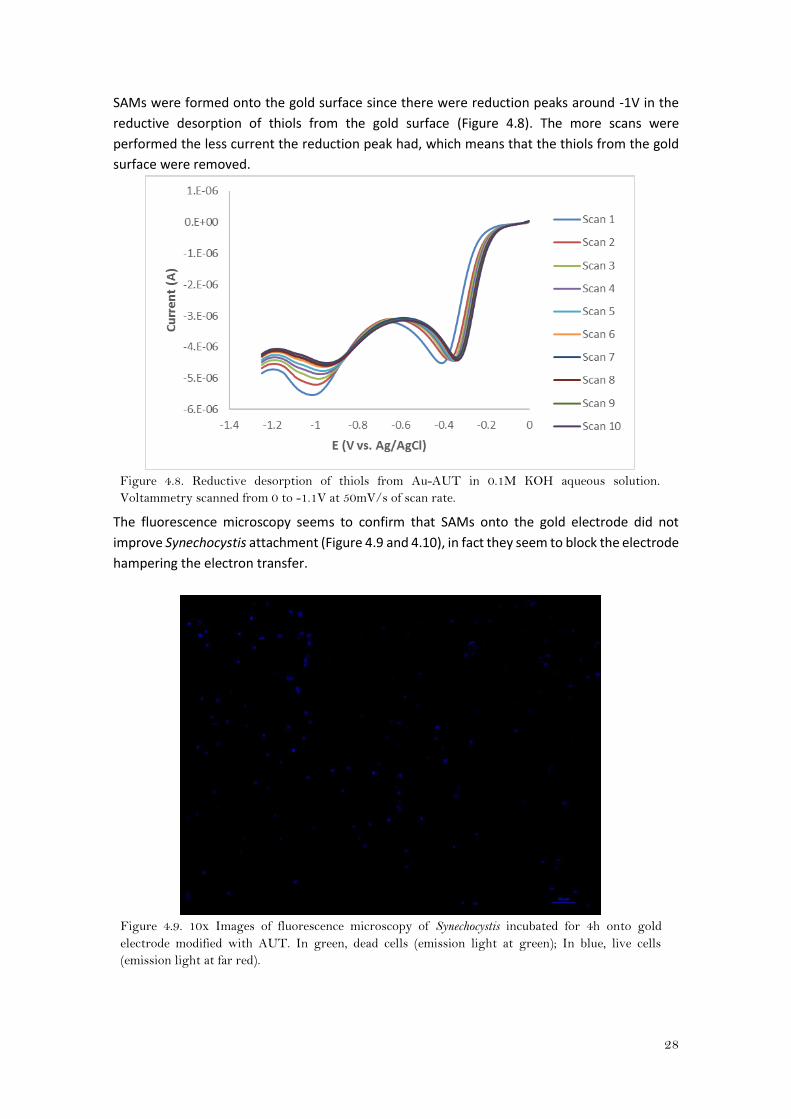
SAMs were formed onto the gold surface since there were reduction peaks around -1V in the
reductive desorption of thiols from the gold surface (Figure 4.8). The more scans were
performed the less current the reduction peak had, which means that the thiols from the gold
surface were removed.
Figure 4.8. Reductive desorption of thiols from Au-AUT in 0.1M KOH aqueous solution.
Voltammetry scanned from 0 to -1.1V at 50mV/s of scan rate.
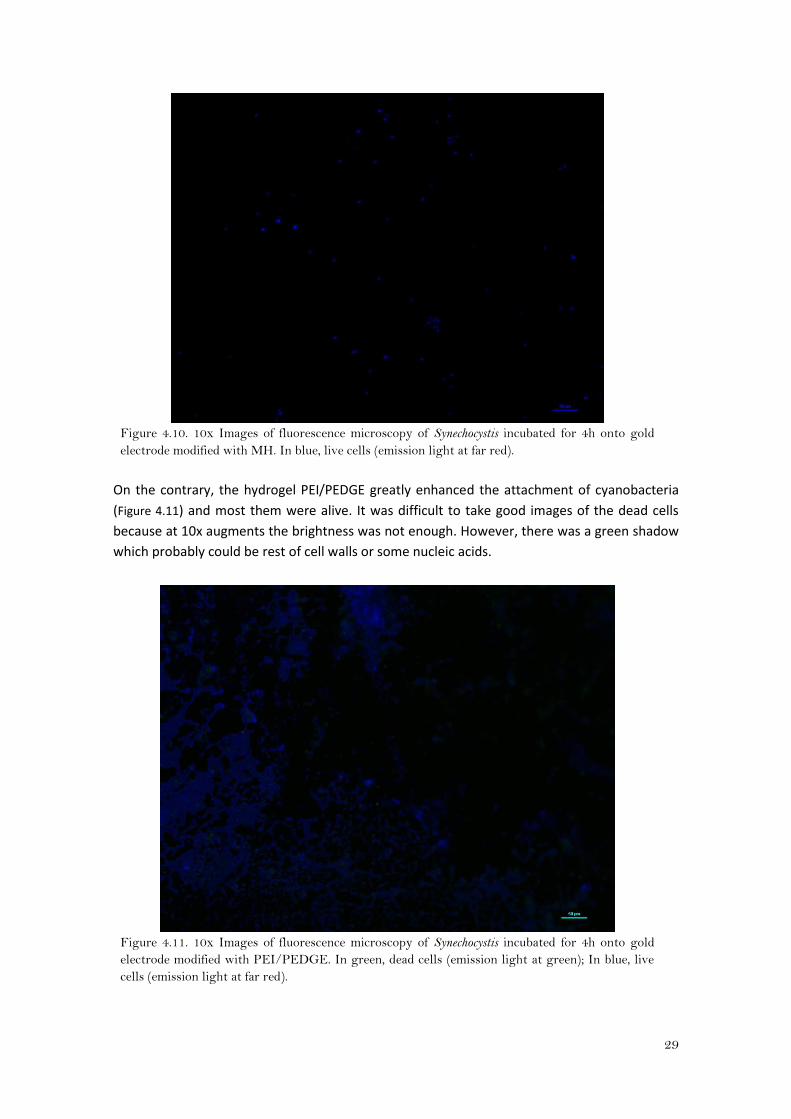
The fluorescence microscopy seems to confirm that SAMs onto the gold electrode did not
improve Synechocystis attachment (Figure 4.9 and 4.10), in fact they seem to block the electrode
hampering the electron transfer.
Figure 4.9. 10x Images of fluorescence microscopy of Synechocystis incubated for 4h onto gold
electrode modified with AUT. In green, dead cells (emission light at green); In blue, live cells
(emission light at far red).
29
Figure 4.10. 10x Images of fluorescence microscopy of Synechocystis incubated for 4h onto gold
electrode modified with MH. In blue, live cells (emission light at far red).
On the contrary, the hydrogel PEI/PEDGE greatly enhanced the attachment of cyanobacteria
(Figure 4.11) and most them were alive. It was difficult to take good images of the dead cells
because at 10x augments the brightness was not enough. However, there was a green shadow
which probably could be rest of cell walls or some nucleic acids.
Figure 4.11. 10x Images of fluorescence microscopy of Synechocystis incubated for 4h onto gold
electrode modified with PEI/PEDGE. In green, dead cells (emission light at green); In blue, live
cells (emission light at far red).
30
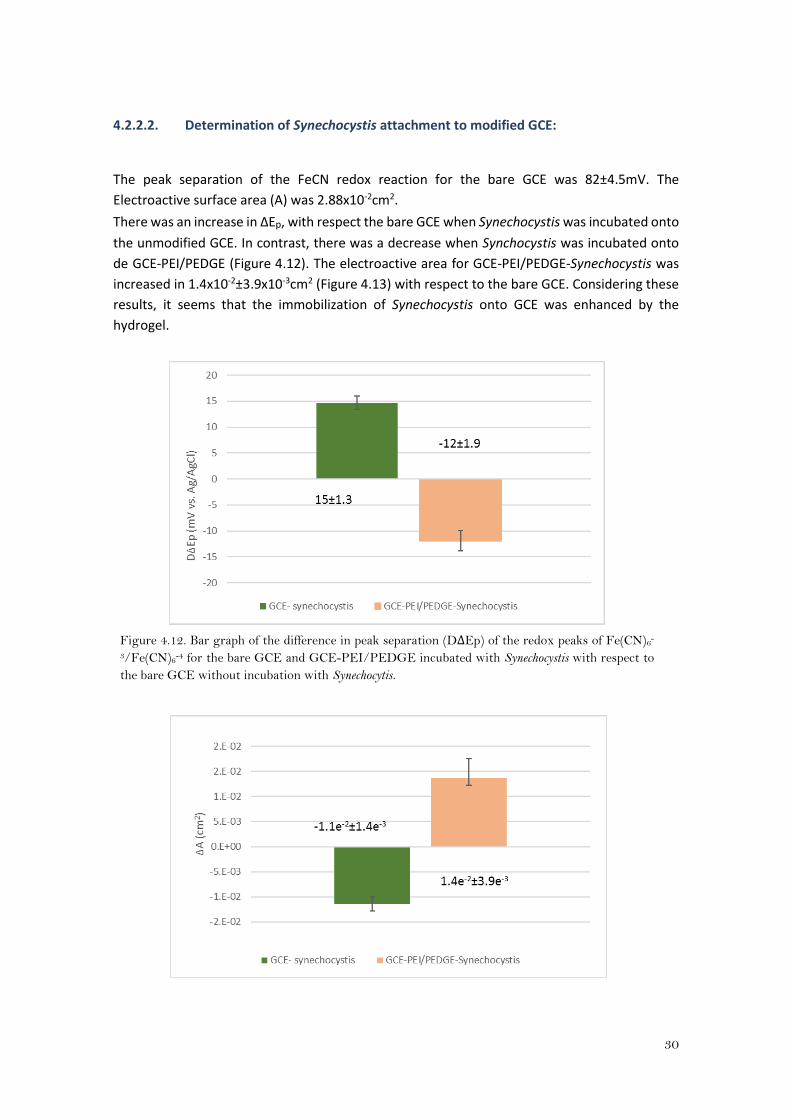
4.2.2.2. Determination of Synechocystis attachment to modified GCE:
The peak separation of the FeCN redox reaction for the bare GCE was 82±4.5mV. The
Electroactive surface area (A) was 2.88x10⁻²cm2.
There was an increase in ΔEp, with respect the bare GCE when Synechocystis was incubated onto
the unmodified GCE. In contrast, there was a decrease when Synchocystis was incubated onto
de GCE-PEI/PEDGE (Figure 4.12). The electroactive area for GCE-PEI/PEDGE-Synechocystis was
increased in 1.4x10⁻²±3.9x10⁻³cm2 (Figure 4.13) with respect to the bare GCE. Considering these
results, it seems that the immobilization of Synechocystis onto GCE was enhanced by the
hydrogel.
Figure 4.12. Bar graph of the difference in peak separation (DΔEp) of the redox peaks of Fe(CN)6-
3/Fe(CN)6-4 for the bare GCE and GCE-PEI/PEDGE incubated with Synechocystis with respect to
the bare GCE without incubation with Synechocytis.
31
Figure 4.13. Bar graph of the difference in the Electroactive surface area (A) for for the bare GCE
and GCE-PEI/PEDGE incubated with Synechocystis with respect to the bare GCE without
incubation with Synechocytis. The A was obtained by cyclic voltammetry in 1mM K3[Fe(CN)6] in
1M KNO3
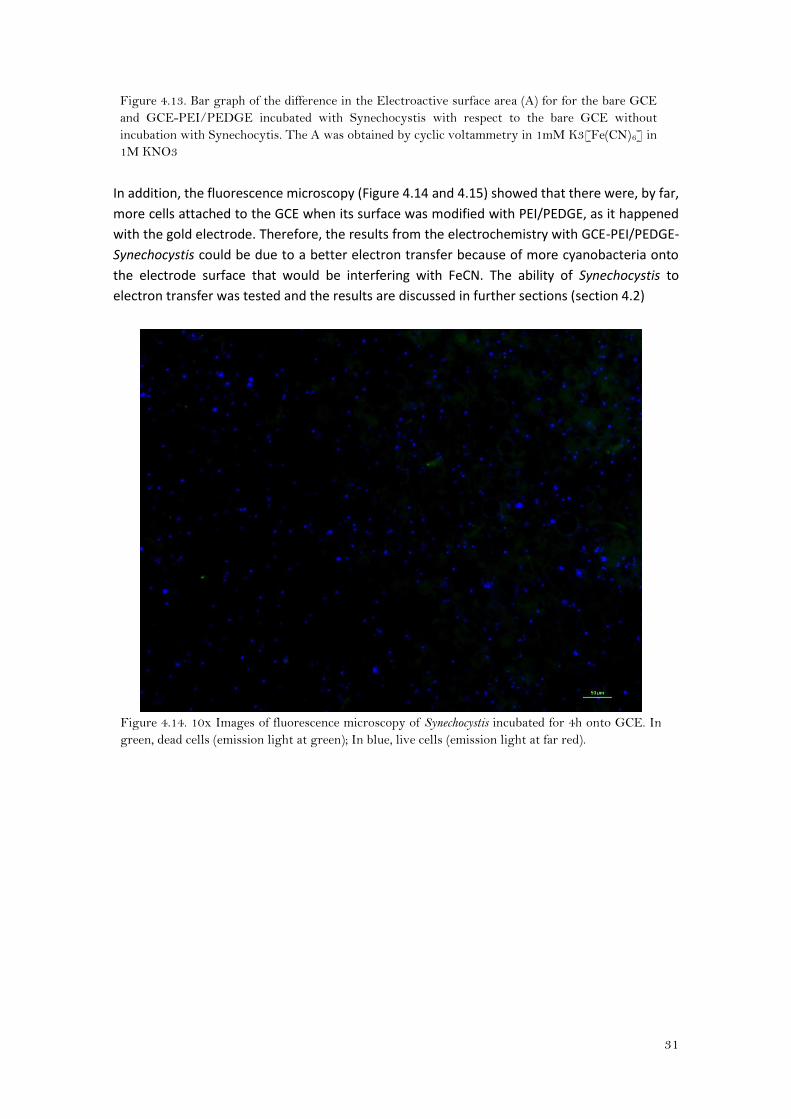
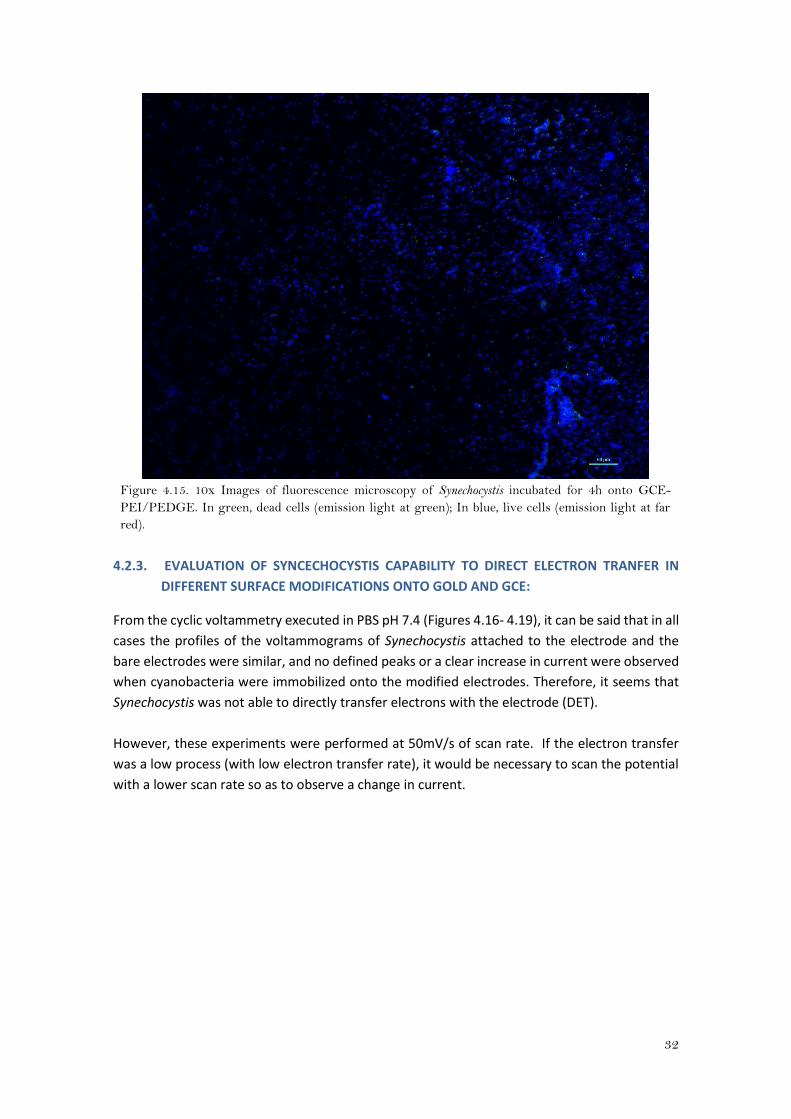
In addition, the fluorescence microscopy (Figure 4.14 and 4.15) showed that there were, by far,
more cells attached to the GCE when its surface was modified with PEI/PEDGE, as it happened
with the gold electrode. Therefore, the results from the electrochemistry with GCE-PEI/PEDGE-
Synechocystis could be due to a better electron transfer because of more cyanobacteria onto
the electrode surface that would be interfering with FeCN. The ability of Synechocystis to
electron transfer was tested and the results are discussed in further sections (section 4.2)
Figure 4.14. 10x Images of fluorescence microscopy of Synechocystis incubated for 4h onto GCE. In
green, dead cells (emission light at green); In blue, live cells (emission light at far red).
32
Figure 4.15. 10x Images of fluorescence microscopy of Synechocystis incubated for 4h onto GCE-
PEI/PEDGE. In green, dead cells (emission light at green); In blue, live cells (emission light at far
red).
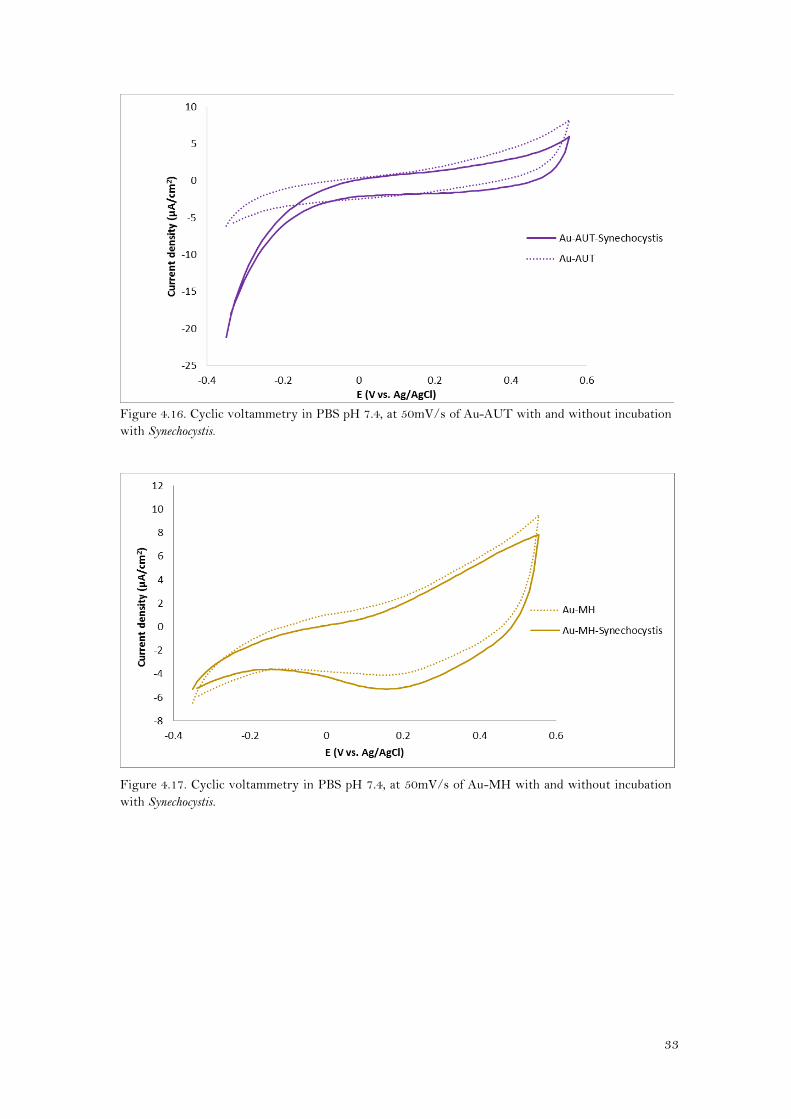
4.2.3. EVALUATION OF SYNCECHOCYSTIS CAPABILITY TO DIRECT ELECTRON TRANFER IN
DIFFERENT SURFACE MODIFICATIONS ONTO GOLD AND GCE:
From the cyclic voltammetry executed in PBS pH 7.4 (Figures 4.16- 4.19), it can be said that in all
cases the profiles of the voltammograms of Synechocystis attached to the electrode and the
bare electrodes were similar, and no defined peaks or a clear increase in current were observed
when cyanobacteria were immobilized onto the modified electrodes. Therefore, it seems that
Synechocystis was not able to directly transfer electrons with the electrode (DET).
However, these experiments were performed at 50mV/s of scan rate. If the electron transfer
was a low process (with low electron transfer rate), it would be necessary to scan the potential
with a lower scan rate so as to observe a change in current.
33
Figure 4.16. Cyclic voltammetry in PBS pH 7.4, at 50mV/s of Au-AUT with and without incubation
with Synechocystis.
Figure 4.17. Cyclic voltammetry in PBS pH 7.4, at 50mV/s of Au-MH with and without incubation
with Synechocystis.
34
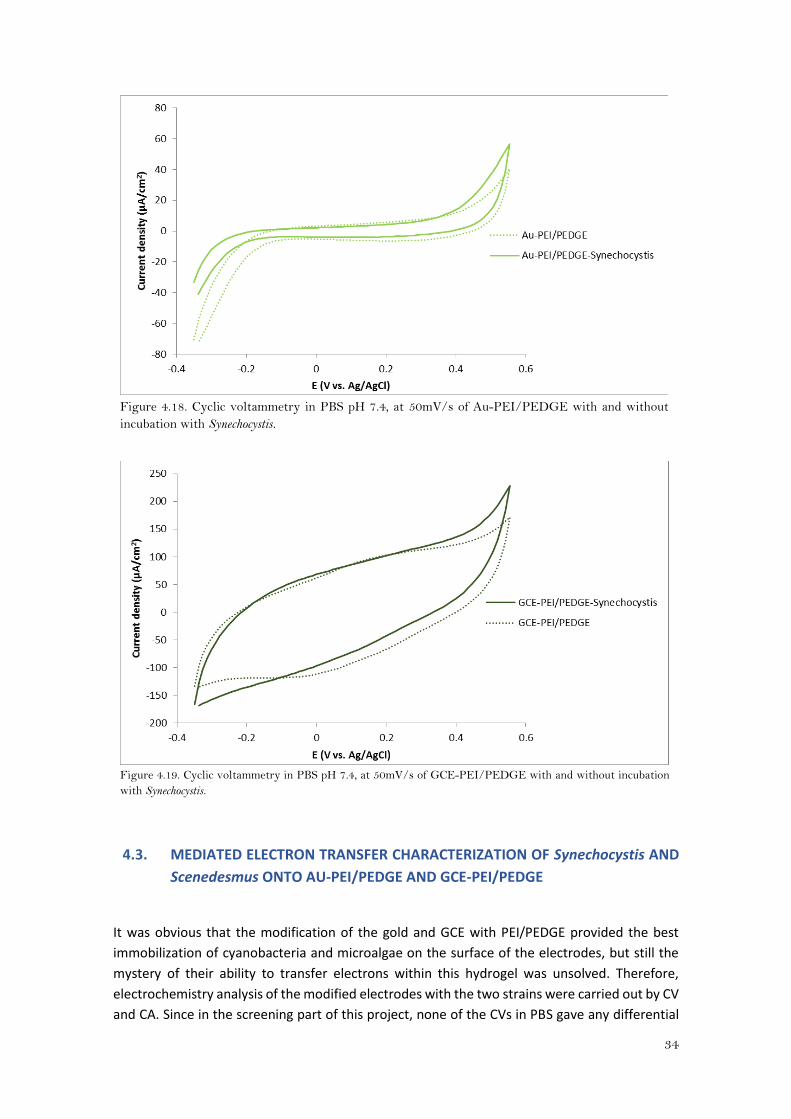
Figure 4.18. Cyclic voltammetry in PBS pH 7.4, at 50mV/s of Au-PEI/PEDGE with and without
incubation with Synechocystis.
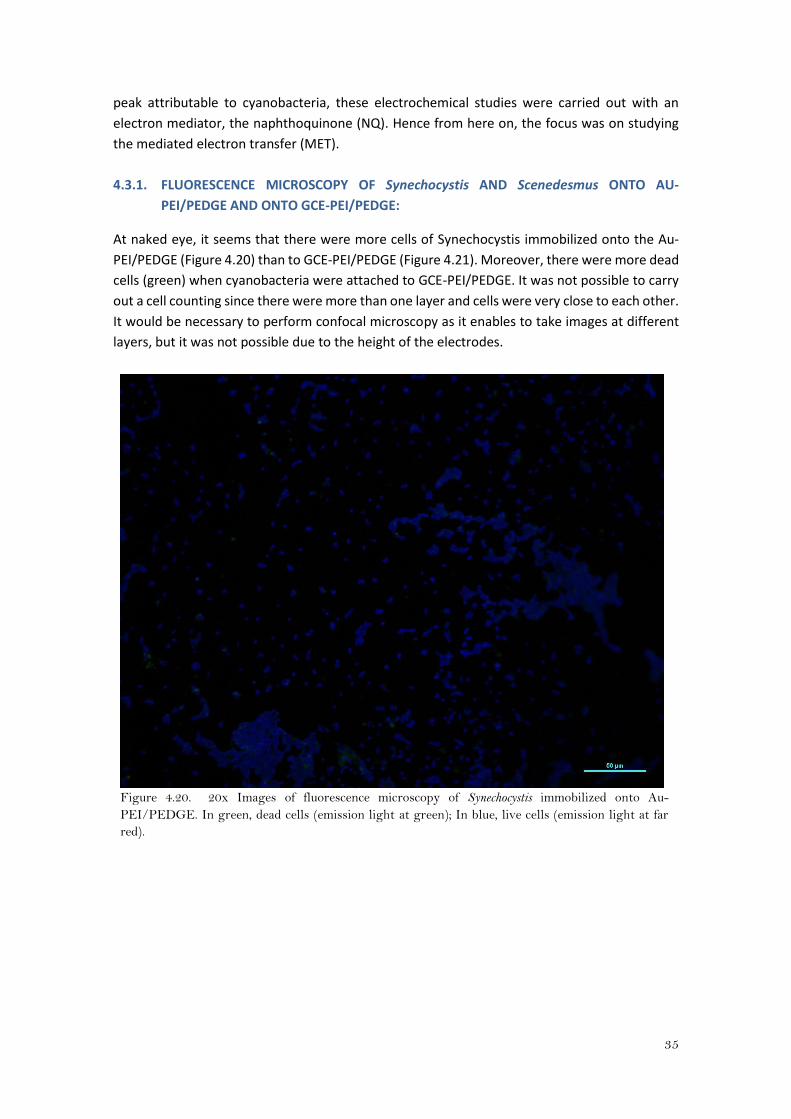
Figure 4.19. Cyclic voltammetry in PBS pH 7.4, at 50mV/s of GCE-PEI/PEDGE with and without incubation
with Synechocystis.
4.3. MEDIATED ELECTRON TRANSFER CHARACTERIZATION OF Synechocystis AND
Scenedesmus ONTO AU-PEI/PEDGE AND GCE-PEI/PEDGE
It was obvious that the modification of the gold and GCE with PEI/PEDGE provided the best
immobilization of cyanobacteria and microalgae on the surface of the electrodes, but still the
mystery of their ability to transfer electrons within this hydrogel was unsolved. Therefore,
electrochemistry analysis of the modified electrodes with the two strains were carried out by CV
and CA. Since in the screening part of this project, none of the CVs in PBS gave any differential
35
peak attributable to cyanobacteria, these electrochemical studies were carried out with an
electron mediator, the naphthoquinone (NQ). Hence from here on, the focus was on studying
the mediated electron transfer (MET).
4.3.1. FLUORESCENCE MICROSCOPY OF Synechocystis AND Scenedesmus ONTO AU-
PEI/PEDGE AND ONTO GCE-PEI/PEDGE:
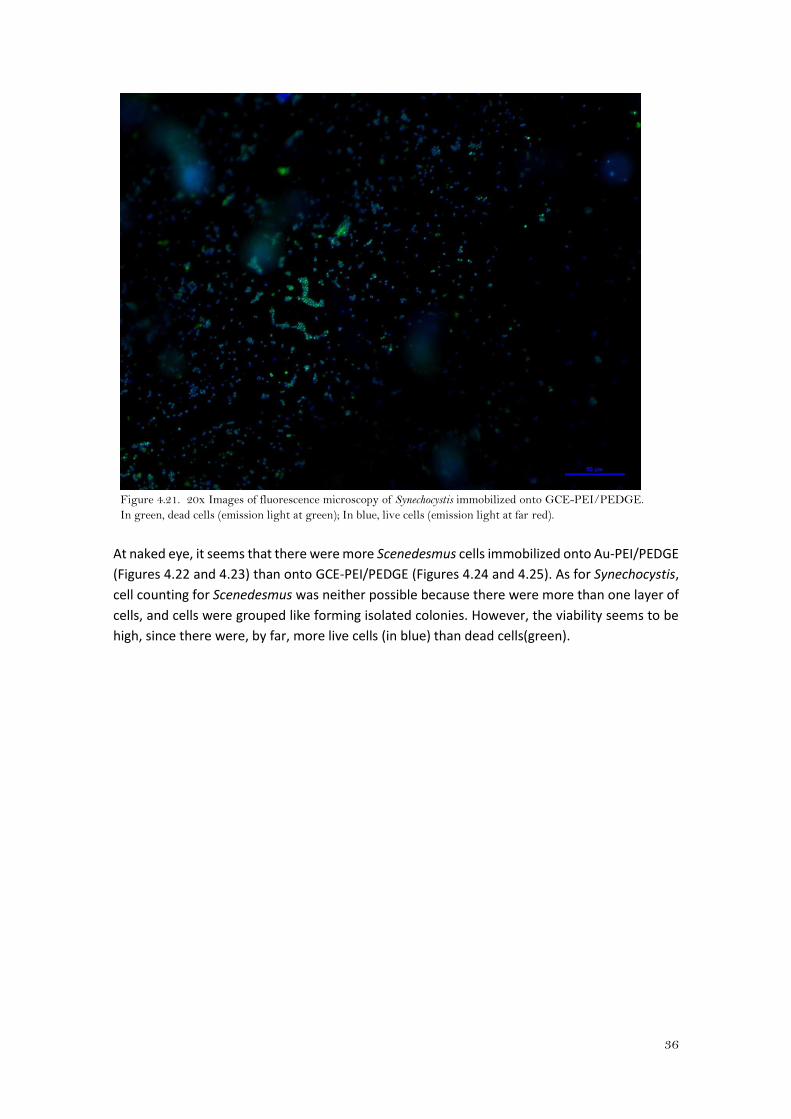
At naked eye, it seems that there were more cells of Synechocystis immobilized onto the Au-
PEI/PEDGE (Figure 4.20) than to GCE-PEI/PEDGE (Figure 4.21). Moreover, there were more dead
cells (green) when cyanobacteria were attached to GCE-PEI/PEDGE. It was not possible to carry
out a cell counting since there were more than one layer and cells were very close to each other.
It would be necessary to perform confocal microscopy as it enables to take images at different
layers, but it was not possible due to the height of the electrodes.
Figure 4.20. 20x Images of fluorescence microscopy of Synechocystis immobilized onto Au-
PEI/PEDGE. In green, dead cells (emission light at green); In blue, live cells (emission light at far
red).
36
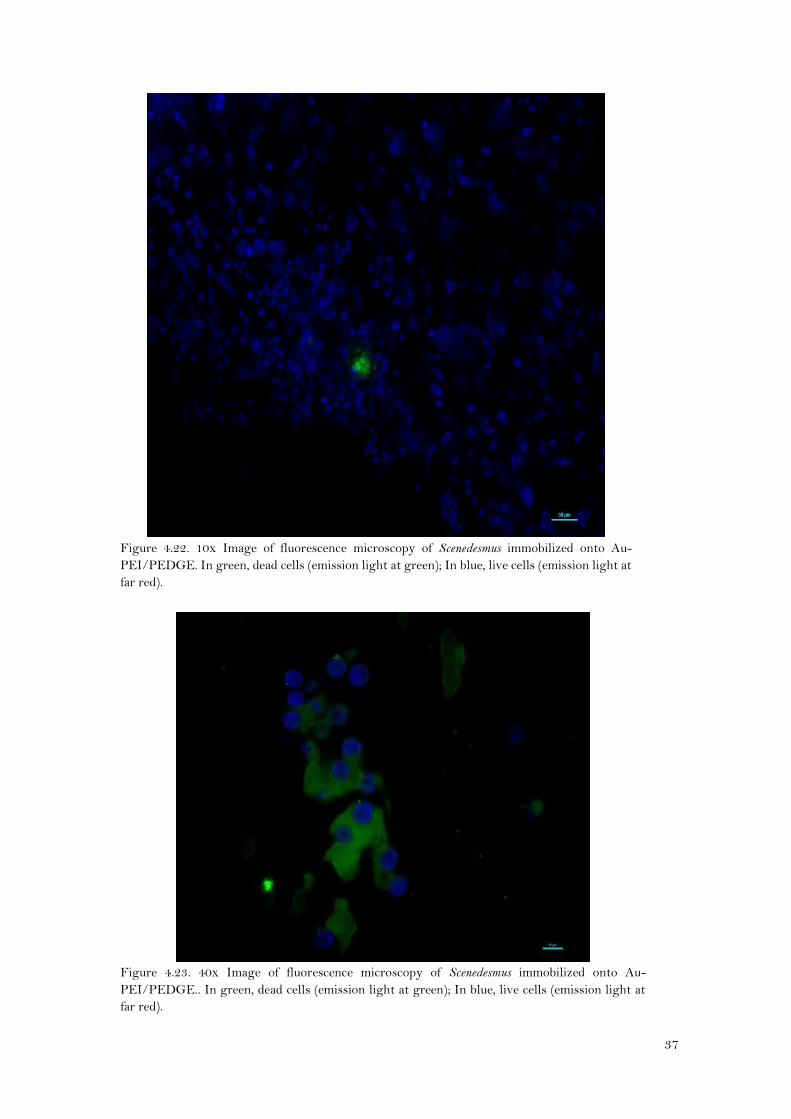
Figure 4.21. 20x Images of fluorescence microscopy of Synechocystis immobilized onto GCE-PEI/PEDGE.
In green, dead cells (emission light at green); In blue, live cells (emission light at far red).
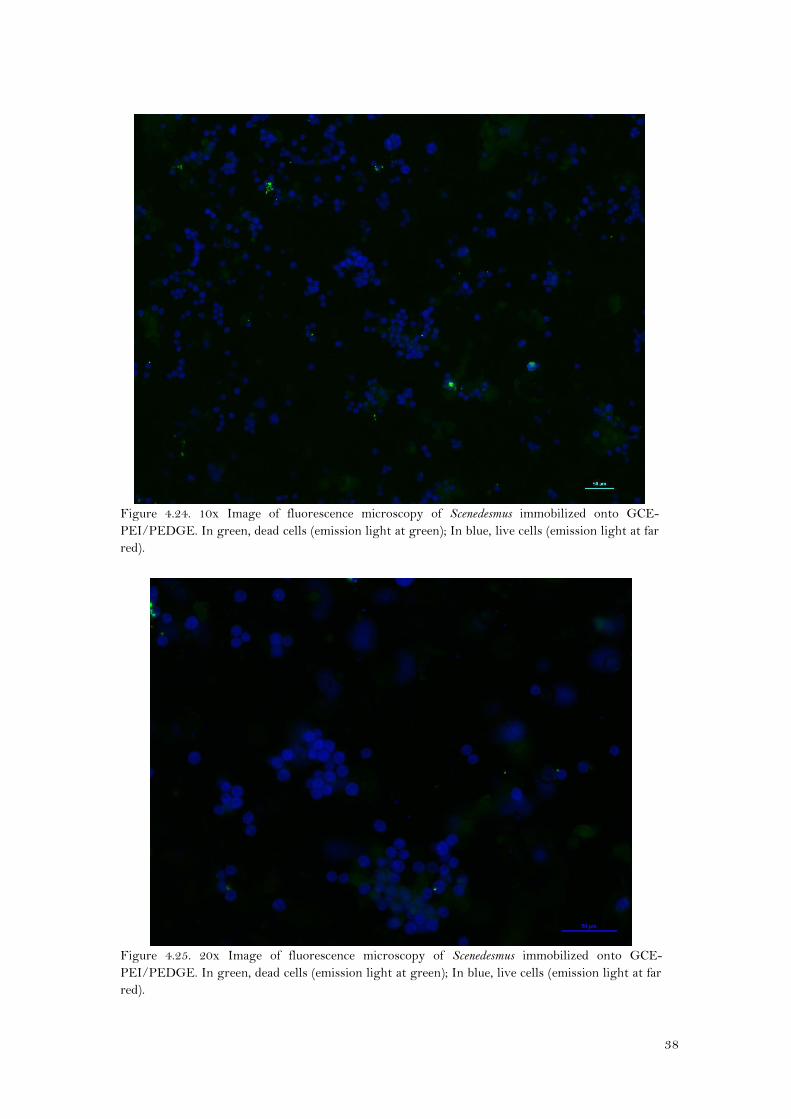
At naked eye, it seems that there were more Scenedesmus cells immobilized onto Au-PEI/PEDGE
(Figures 4.22 and 4.23) than onto GCE-PEI/PEDGE (Figures 4.24 and 4.25). As for Synechocystis,
cell counting for Scenedesmus was neither possible because there were more than one layer of
cells, and cells were grouped like forming isolated colonies. However, the viability seems to be
high, since there were, by far, more live cells (in blue) than dead cells(green).
37
Figure 4.22. 10x Image of fluorescence microscopy of Scenedesmus immobilized onto Au-
PEI/PEDGE. In green, dead cells (emission light at green); In blue, live cells (emission light at
far red).
Figure 4.23. 40x Image of fluorescence microscopy of Scenedesmus immobilized onto Au-
PEI/PEDGE.. In green, dead cells (emission light at green); In blue, live cells (emission light at
far red).
38
Figure 4.24. 10x Image of fluorescence microscopy of Scenedesmus immobilized onto GCE-
PEI/PEDGE. In green, dead cells (emission light at green); In blue, live cells (emission light at far
red).
Figure 4.25. 20x Image of fluorescence microscopy of Scenedesmus immobilized onto GCE-
PEI/PEDGE. In green, dead cells (emission light at green); In blue, live cells (emission light at far
red).
39
4.3.2. EVALUATION OF Synechocystis CAPABILITY OF MEDIATED ELECTRON TRANSFER ONTO
AU-PEI/PEDGE AND ONTO GCE-PEI/PEDGE:
4.3.2.1. Mediated electron transfer of Synechocystis immobilized onto Au-
PEI/PEDGE:
4.3.2.1.1. PBS as electrolyte:
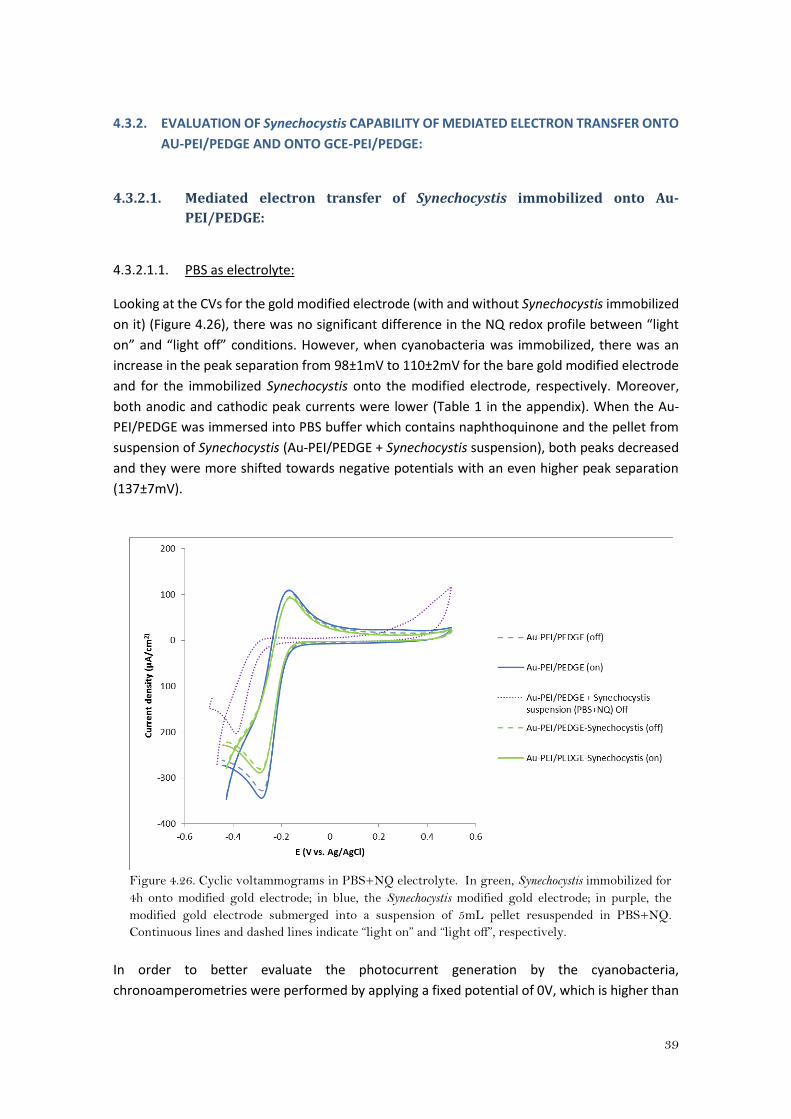
Looking at the CVs for the gold modified electrode (with and without Synechocystis immobilized
on it) (Figure 4.26), there was no significant difference in the NQ redox profile between “light
on” and “light off” conditions. However, when cyanobacteria was immobilized, there was an
increase in the peak separation from 98±1mV to 110±2mV for the bare gold modified electrode
and for the immobilized Synechocystis onto the modified electrode, respectively. Moreover,
both anodic and cathodic peak currents were lower (Table 1 in the appendix). When the Au-
PEI/PEDGE was immersed into PBS buffer which contains naphthoquinone and the pellet from
suspension of Synechocystis (Au-PEI/PEDGE + Synechocystis suspension), both peaks decreased
and they were more shifted towards negative potentials with an even higher peak separation
(137±7mV).
Figure 4.26. Cyclic voltammograms in PBS+NQ electrolyte. In green, Synechocystis immobilized for
4h onto modified gold electrode; in blue, the Synechocystis modified gold electrode; in purple, the
modified gold electrode submerged into a suspension of 5mL pellet resuspended in PBS+NQ.
Continuous lines and dashed lines indicate “light on” and “light off”, respectively.
In order to better evaluate the photocurrent generation by the cyanobacteria,
chronoamperometries were performed by applying a fixed potential of 0V, which is higher than
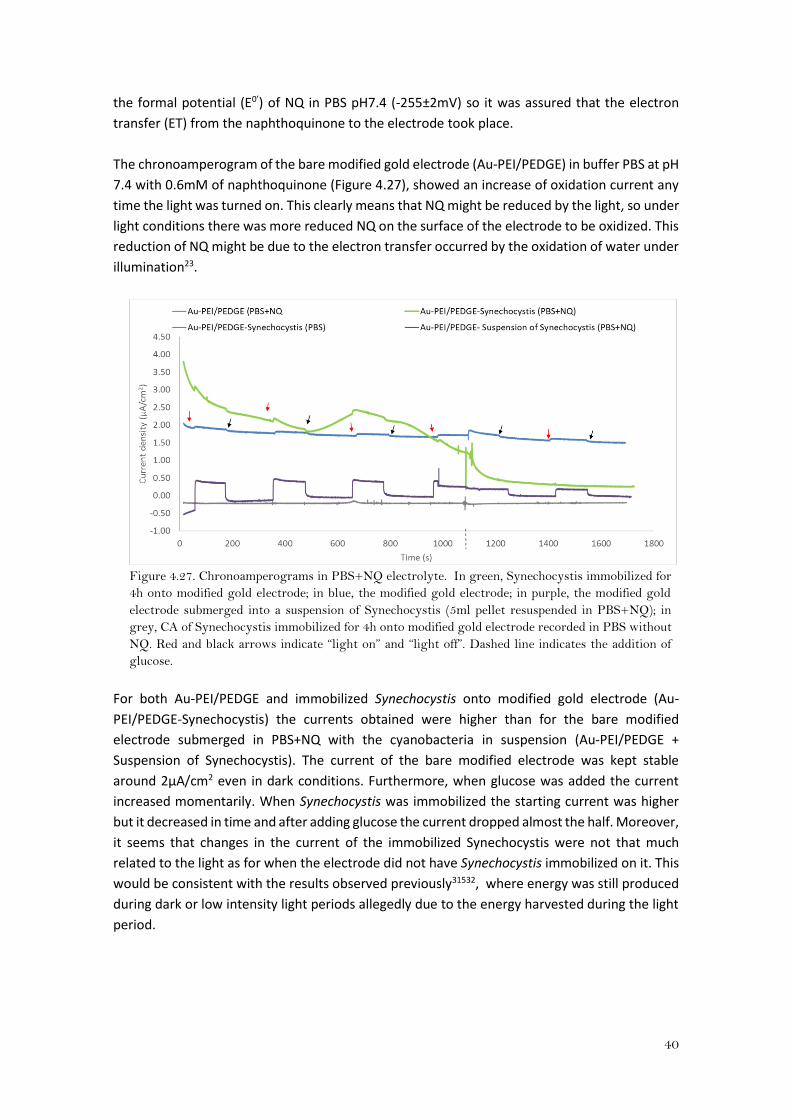
40
the formal potential (E0’) of NQ in PBS pH7.4 (-255±2mV) so it was assured that the electron
transfer (ET) from the naphthoquinone to the electrode took place.
The chronoamperogram of the bare modified gold electrode (Au-PEI/PEDGE) in buffer PBS at pH
7.4 with 0.6mM of naphthoquinone (Figure 4.27), showed an increase of oxidation current any
time the light was turned on. This clearly means that NQ might be reduced by the light, so under
light conditions there was more reduced NQ on the surface of the electrode to be oxidized. This
reduction of NQ might be due to the electron transfer occurred by the oxidation of water under
illumination23.
Figure 4.27. Chronoamperograms in PBS+NQ electrolyte. In green, Synechocystis immobilized for
4h onto modified gold electrode; in blue, the modified gold electrode; in purple, the modified gold
electrode submerged into a suspension of Synechocystis (5ml pellet resuspended in PBS+NQ); in
grey, CA of Synechocystis immobilized for 4h onto modified gold electrode recorded in PBS without
NQ. Red and black arrows indicate “light on” and “light off”. Dashed line indicates the addition of
glucose.
For both Au-PEI/PEDGE and immobilized Synechocystis onto modified gold electrode (Au-
PEI/PEDGE-Synechocystis) the currents obtained were higher than for the bare modified
electrode submerged in PBS+NQ with the cyanobacteria in suspension (Au-PEI/PEDGE +
Suspension of Synechocystis). The current of the bare modified electrode was kept stable
around 2μA/cm2 even in dark conditions. Furthermore, when glucose was added the current
increased momentarily. When Synechocystis was immobilized the starting current was higher
but it decreased in time and after adding glucose the current dropped almost the half. Moreover,
it seems that changes in the current of the immobilized Synechocystis were not that much
related to the light as for when the electrode did not have Synechocystis immobilized on it. This
would be consistent with the results observed previously31532, where energy was still produced
during dark or low intensity light periods allegedly due to the energy harvested during the light
period.
41
4.3.2.1.2. Supernatant of Synechocystis as electrolyte:
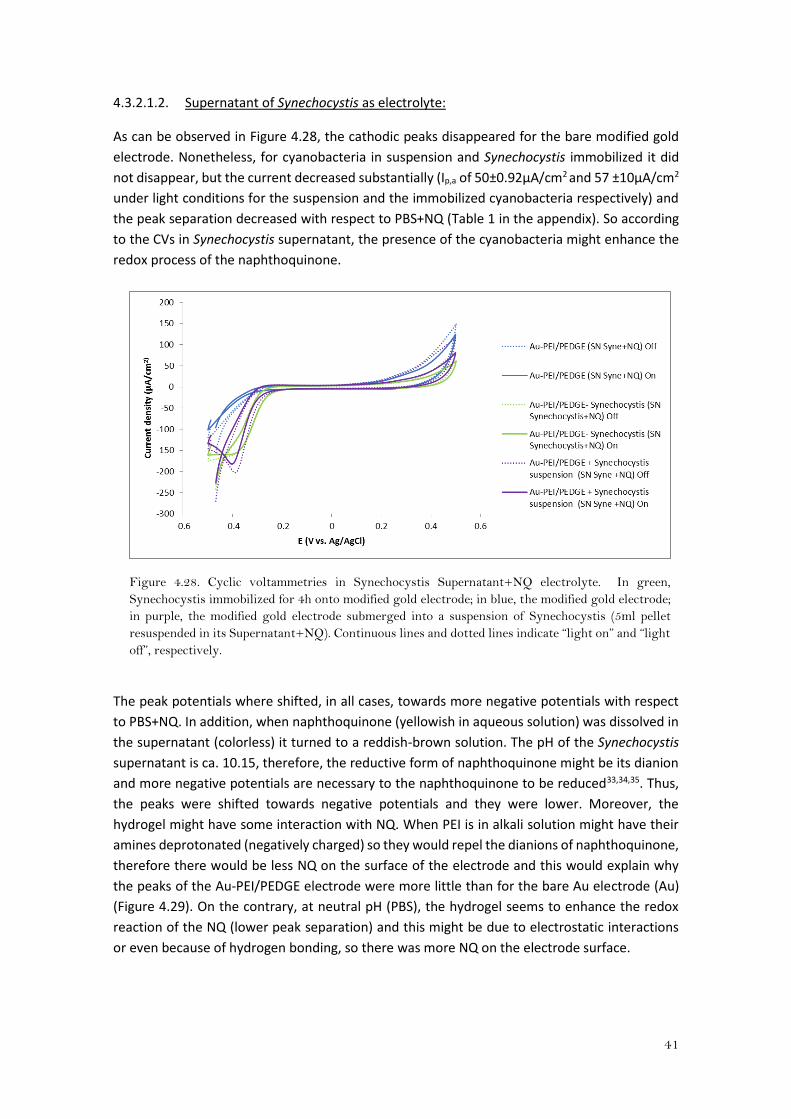
As can be observed in Figure 4.28, the cathodic peaks disappeared for the bare modified gold
electrode. Nonetheless, for cyanobacteria in suspension and Synechocystis immobilized it did
not disappear, but the current decreased substantially (Ip,a of 50±0.92μA/cm2 and 57 ±10μA/cm2
under light conditions for the suspension and the immobilized cyanobacteria respectively) and
the peak separation decreased with respect to PBS+NQ (Table 1 in the appendix). So according
to the CVs in Synechocystis supernatant, the presence of the cyanobacteria might enhance the
redox process of the naphthoquinone.
Figure 4.28. Cyclic voltammetries in Synechocystis Supernatant+NQ electrolyte. In green,
Synechocystis immobilized for 4h onto modified gold electrode; in blue, the modified gold electrode;
in purple, the modified gold electrode submerged into a suspension of Synechocystis (5ml pellet
resuspended in its Supernatant+NQ). Continuous lines and dotted lines indicate “light on” and “light
off”, respectively.
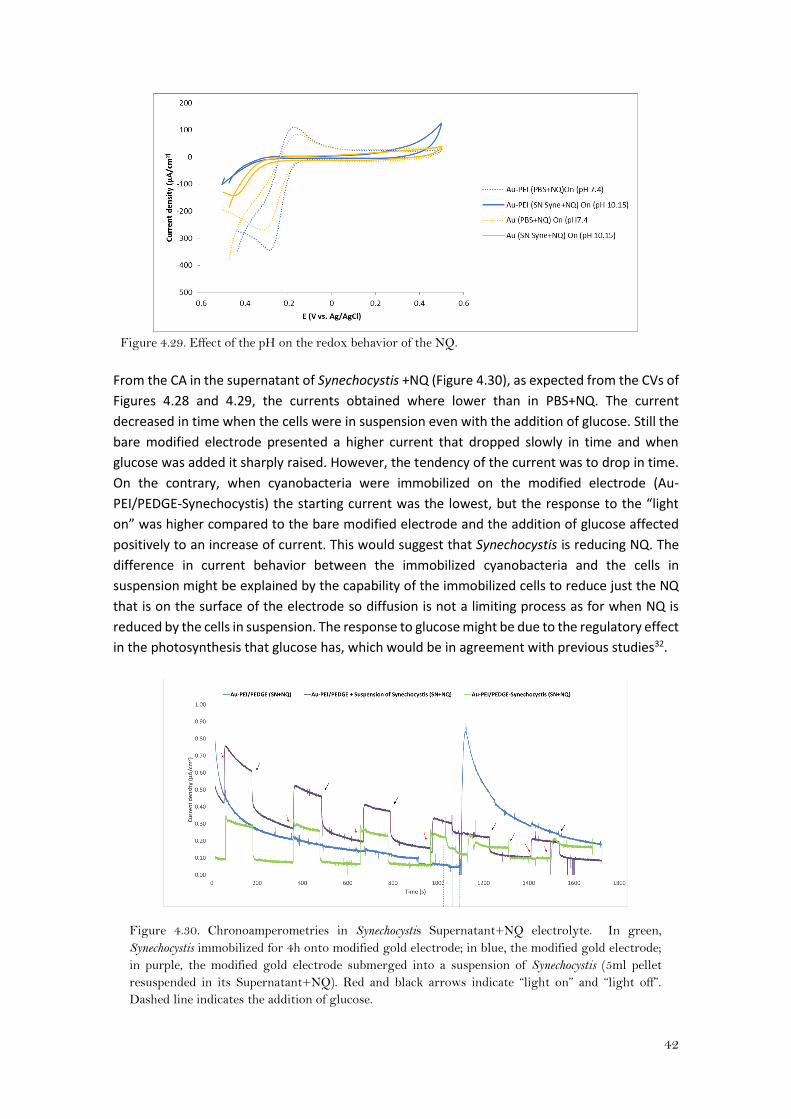
The peak potentials where shifted, in all cases, towards more negative potentials with respect
to PBS+NQ. In addition, when naphthoquinone (yellowish in aqueous solution) was dissolved in
the supernatant (colorless) it turned to a reddish-brown solution. The pH of the Synechocystis
supernatant is ca. 10.15, therefore, the reductive form of naphthoquinone might be its dianion
and more negative potentials are necessary to the naphthoquinone to be reduced33,34,35. Thus,
the peaks were shifted towards negative potentials and they were lower. Moreover, the
hydrogel might have some interaction with NQ. When PEI is in alkali solution might have their
amines deprotonated (negatively charged) so they would repel the dianions of naphthoquinone,
therefore there would be less NQ on the surface of the electrode and this would explain why
the peaks of the Au-PEI/PEDGE electrode were more little than for the bare Au electrode (Au)
(Figure 4.29). On the contrary, at neutral pH (PBS), the hydrogel seems to enhance the redox
reaction of the NQ (lower peak separation) and this might be due to electrostatic interactions
or even because of hydrogen bonding, so there was more NQ on the electrode surface.
42
Figure 4.29. Effect of the pH on the redox behavior of the NQ.
From the CA in the supernatant of Synechocystis +NQ (Figure 4.30), as expected from the CVs of
Figures 4.28 and 4.29, the currents obtained where lower than in PBS+NQ. The current
decreased in time when the cells were in suspension even with the addition of glucose. Still the
bare modified electrode presented a higher current that dropped slowly in time and when
glucose was added it sharply raised. However, the tendency of the current was to drop in time.
On the contrary, when cyanobacteria were immobilized on the modified electrode (Au-
PEI/PEDGE-Synechocystis) the starting current was the lowest, but the response to the “light
on” was higher compared to the bare modified electrode and the addition of glucose affected
positively to an increase of current. This would suggest that Synechocystis is reducing NQ. The
difference in current behavior between the immobilized cyanobacteria and the cells in
suspension might be explained by the capability of the immobilized cells to reduce just the NQ
that is on the surface of the electrode so diffusion is not a limiting process as for when NQ is
reduced by the cells in suspension. The response to glucose might be due to the regulatory effect
in the photosynthesis that glucose has, which would be in agreement with previous studies32.
Figure 4.30. Chronoamperometries in Synechocystis Supernatant+NQ electrolyte. In green,
Synechocystis immobilized for 4h onto modified gold electrode; in blue, the modified gold electrode;
in purple, the modified gold electrode submerged into a suspension of Synechocystis (5ml pellet
resuspended in its Supernatant+NQ). Red and black arrows indicate “light on” and “light off”.
Dashed line indicates the addition of glucose.
43
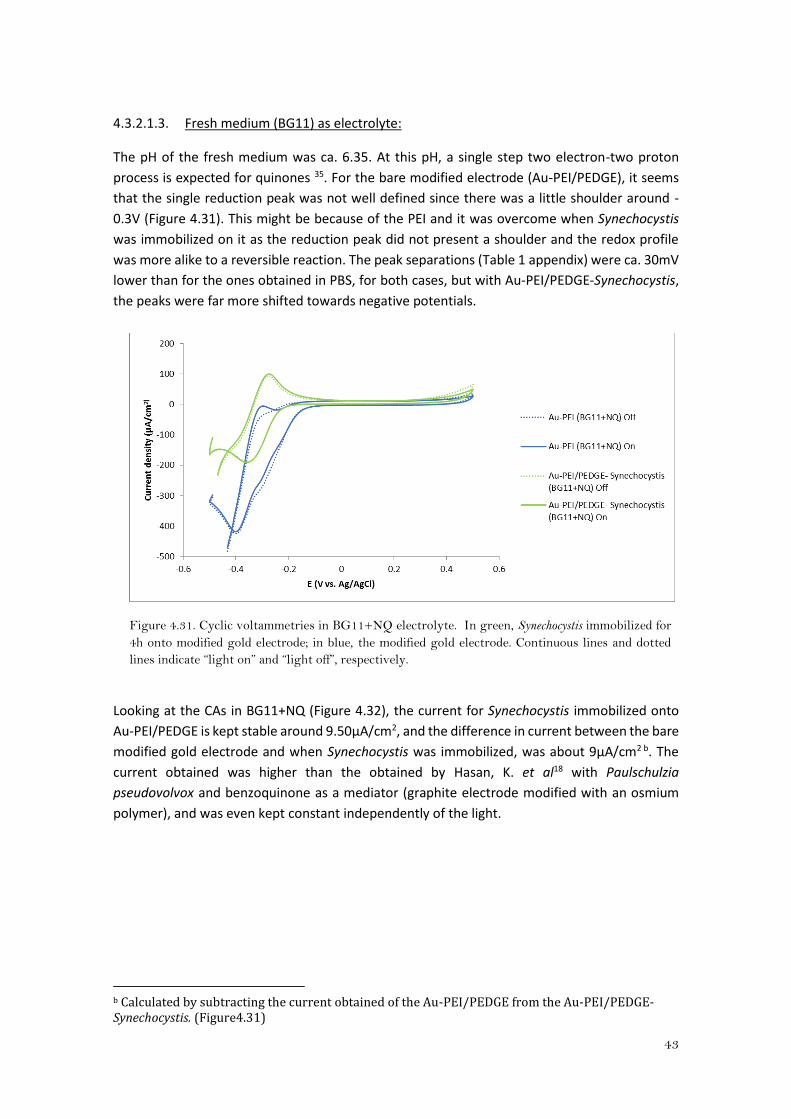
4.3.2.1.3. Fresh medium (BG11) as electrolyte:
The pH of the fresh medium was ca. 6.35. At this pH, a single step two electron-two proton
process is expected for quinones 35. For the bare modified electrode (Au-PEI/PEDGE), it seems
that the single reduction peak was not well defined since there was a little shoulder around -
0.3V (Figure 4.31). This might be because of the PEI and it was overcome when Synechocystis
was immobilized on it as the reduction peak did not present a shoulder and the redox profile
was more alike to a reversible reaction. The peak separations (Table 1 appendix) were ca. 30mV
lower than for the ones obtained in PBS, for both cases, but with Au-PEI/PEDGE-Synechocystis,
the peaks were far more shifted towards negative potentials.
Figure 4.31. Cyclic voltammetries in BG11+NQ electrolyte. In green, Synechocystis immobilized for
4h onto modified gold electrode; in blue, the modified gold electrode. Continuous lines and dotted
lines indicate “light on” and “light off”, respectively.
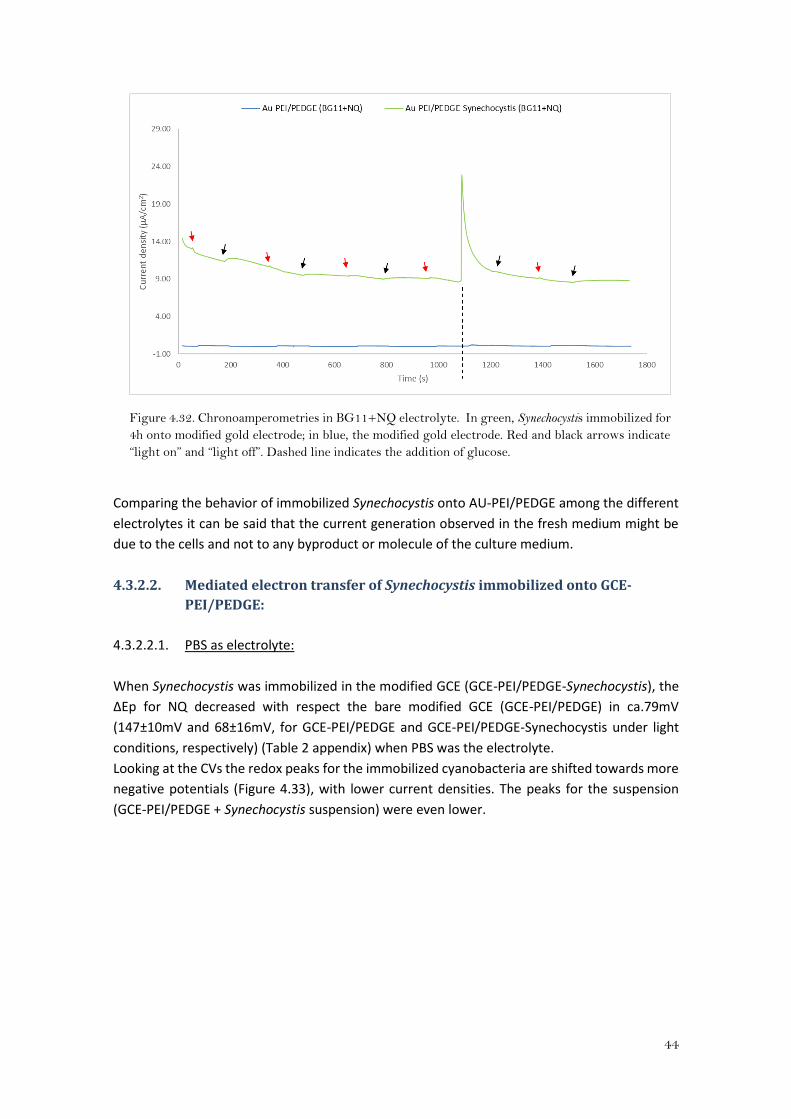
Looking at the CAs in BG11+NQ (Figure 4.32), the current for Synechocystis immobilized onto
Au-PEI/PEDGE is kept stable around 9.50μA/cm2, and the difference in current between the bare
modified gold electrode and when Synechocystis was immobilized, was about 9μA/cm2 b. The
current obtained was higher than the obtained by Hasan, K. et al18 with Paulschulzia
pseudovolvox and benzoquinone as a mediator (graphite electrode modified with an osmium
polymer), and was even kept constant independently of the light.
b Calculated by subtracting the current obtained of the Au-PEI/PEDGE from the Au-PEI/PEDGE-Synechocystis. (Figure4.31)
44
Figure 4.32. Chronoamperometries in BG11+NQ electrolyte. In green, Synechocystis immobilized for
4h onto modified gold electrode; in blue, the modified gold electrode. Red and black arrows indicate
“light on” and “light off”. Dashed line indicates the addition of glucose.
Comparing the behavior of immobilized Synechocystis onto AU-PEI/PEDGE among the different
electrolytes it can be said that the current generation observed in the fresh medium might be
due to the cells and not to any byproduct or molecule of the culture medium.
4.3.2.2. Mediated electron transfer of Synechocystis immobilized onto GCE-
PEI/PEDGE:
4.3.2.2.1. PBS as electrolyte:
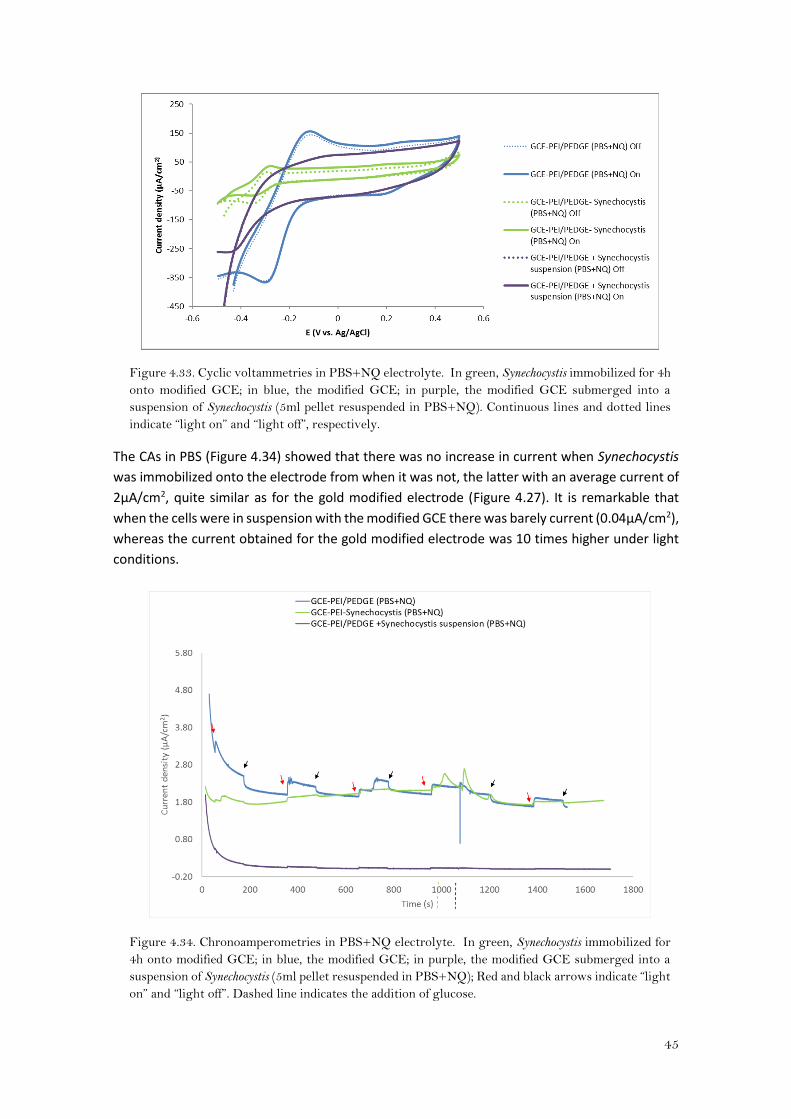
When Synechocystis was immobilized in the modified GCE (GCE-PEI/PEDGE-Synechocystis), the
ΔEp for NQ decreased with respect the bare modified GCE (GCE-PEI/PEDGE) in ca.79mV
(147±10mV and 68±16mV, for GCE-PEI/PEDGE and GCE-PEI/PEDGE-Synechocystis under light
conditions, respectively) (Table 2 appendix) when PBS was the electrolyte.
Looking at the CVs the redox peaks for the immobilized cyanobacteria are shifted towards more
negative potentials (Figure 4.33), with lower current densities. The peaks for the suspension
(GCE-PEI/PEDGE + Synechocystis suspension) were even lower.
45
Figure 4.33. Cyclic voltammetries in PBS+NQ electrolyte. In green, Synechocystis immobilized for 4h
onto modified GCE; in blue, the modified GCE; in purple, the modified GCE submerged into a
suspension of Synechocystis (5ml pellet resuspended in PBS+NQ). Continuous lines and dotted lines
indicate “light on” and “light off”, respectively.
The CAs in PBS (Figure 4.34) showed that there was no increase in current when Synechocystis
was immobilized onto the electrode from when it was not, the latter with an average current of
2μA/cm2, quite similar as for the gold modified electrode (Figure 4.27). It is remarkable that
when the cells were in suspension with the modified GCE there was barely current (0.04μA/cm2),
whereas the current obtained for the gold modified electrode was 10 times higher under light
conditions.
Figure 4.34. Chronoamperometries in PBS+NQ electrolyte. In green, Synechocystis immobilized for
4h onto modified GCE; in blue, the modified GCE; in purple, the modified GCE submerged into a
suspension of Synechocystis (5ml pellet resuspended in PBS+NQ); Red and black arrows indicate “light
on” and “light off”. Dashed line indicates the addition of glucose.
46
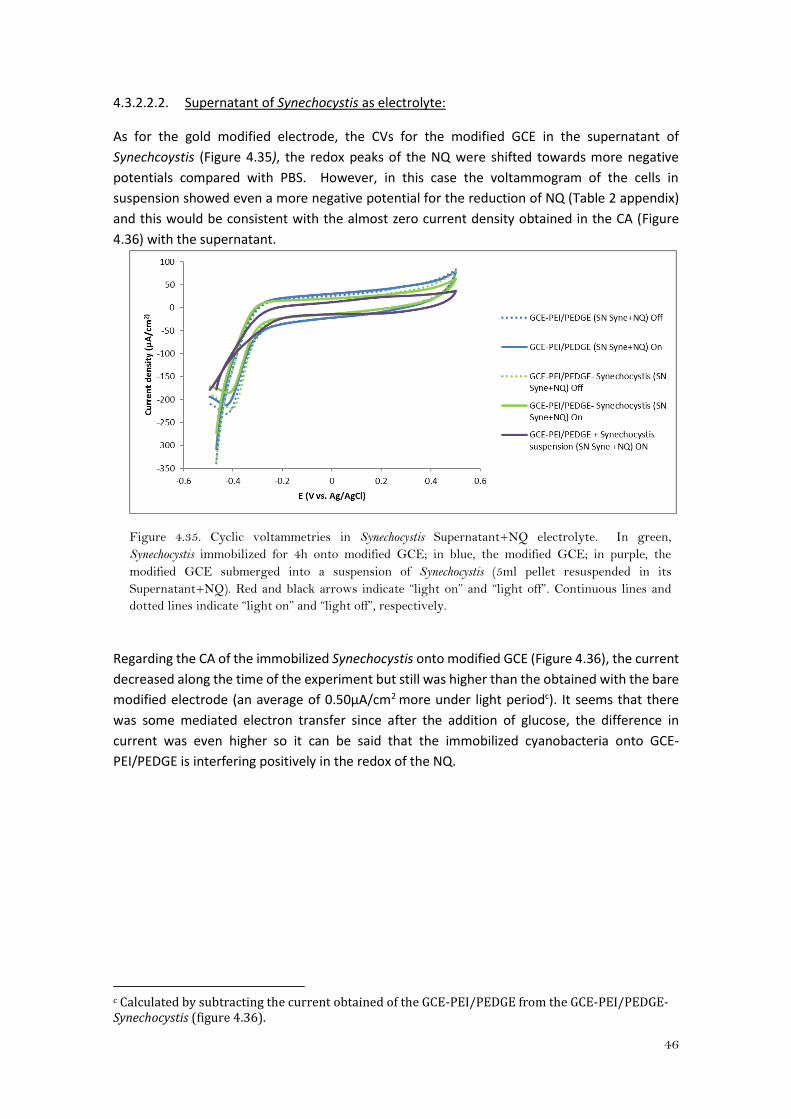
4.3.2.2.2. Supernatant of Synechocystis as electrolyte:
As for the gold modified electrode, the CVs for the modified GCE in the supernatant of
Synechcoystis (Figure 4.35), the redox peaks of the NQ were shifted towards more negative
potentials compared with PBS. However, in this case the voltammogram of the cells in
suspension showed even a more negative potential for the reduction of NQ (Table 2 appendix)
and this would be consistent with the almost zero current density obtained in the CA (Figure
4.36) with the supernatant.
Figure 4.35. Cyclic voltammetries in Synechocystis Supernatant+NQ electrolyte. In green,
Synechocystis immobilized for 4h onto modified GCE; in blue, the modified GCE; in purple, the
modified GCE submerged into a suspension of Synechocystis (5ml pellet resuspended in its
Supernatant+NQ). Red and black arrows indicate “light on” and “light off”. Continuous lines and
dotted lines indicate “light on” and “light off”, respectively.
Regarding the CA of the immobilized Synechocystis onto modified GCE (Figure 4.36), the current
decreased along the time of the experiment but still was higher than the obtained with the bare
modified electrode (an average of 0.50μA/cm2 more under light periodc). It seems that there
was some mediated electron transfer since after the addition of glucose, the difference in
current was even higher so it can be said that the immobilized cyanobacteria onto GCE-
PEI/PEDGE is interfering positively in the redox of the NQ.
c Calculated by subtracting the current obtained of the GCE-PEI/PEDGE from the GCE-PEI/PEDGE-Synechocystis (figure 4.36).
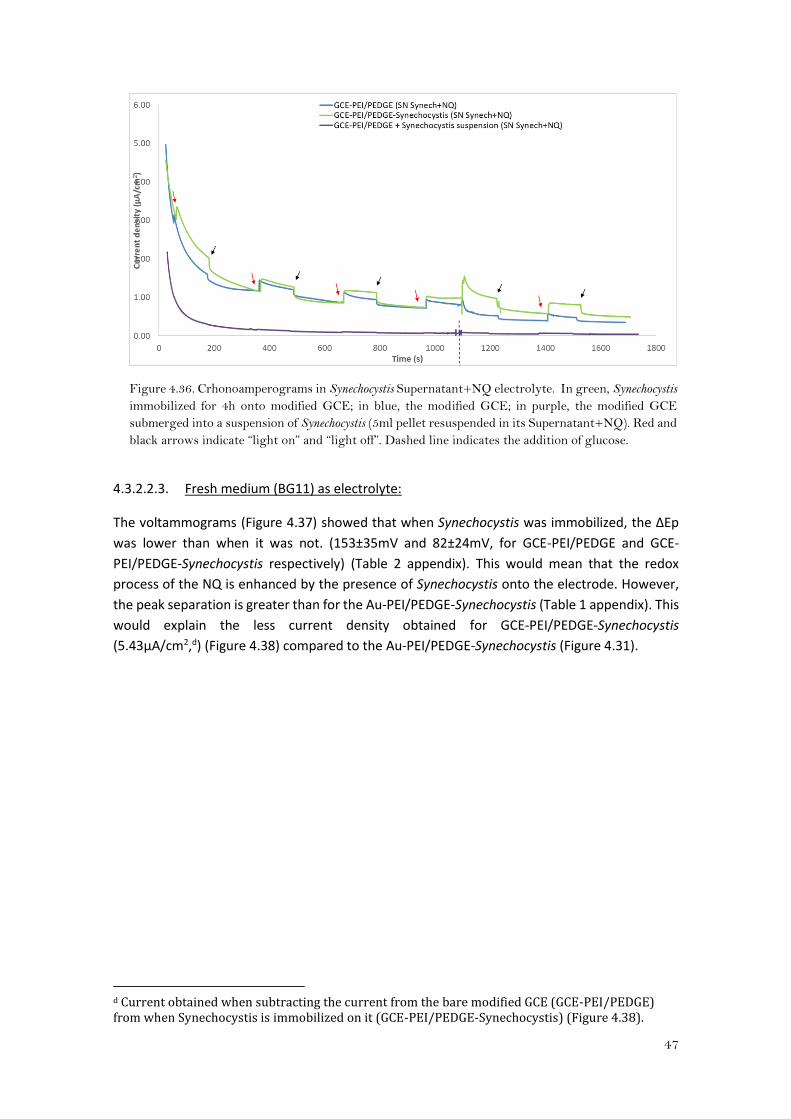
47
Figure 4.36. Crhonoamperograms in Synechocystis Supernatant+NQ electrolyte. In green, Synechocystis
immobilized for 4h onto modified GCE; in blue, the modified GCE; in purple, the modified GCE
submerged into a suspension of Synechocystis (5ml pellet resuspended in its Supernatant+NQ). Red and
black arrows indicate “light on” and “light off”. Dashed line indicates the addition of glucose.
4.3.2.2.3. Fresh medium (BG11) as electrolyte:
The voltammograms (Figure 4.37) showed that when Synechocystis was immobilized, the ΔEp
was lower than when it was not. (153±35mV and 82±24mV, for GCE-PEI/PEDGE and GCE-
PEI/PEDGE-Synechocystis respectively) (Table 2 appendix). This would mean that the redox
process of the NQ is enhanced by the presence of Synechocystis onto the electrode. However,
the peak separation is greater than for the Au-PEI/PEDGE-Synechocystis (Table 1 appendix). This
would explain the less current density obtained for GCE-PEI/PEDGE-Synechocystis
(5.43μA/cm2,d) (Figure 4.38) compared to the Au-PEI/PEDGE-Synechocystis (Figure 4.31).
d Current obtained when subtracting the current from the bare modified GCE (GCE-PEI/PEDGE) from when Synechocystis is immobilized on it (GCE-PEI/PEDGE-Synechocystis) (Figure 4.38).
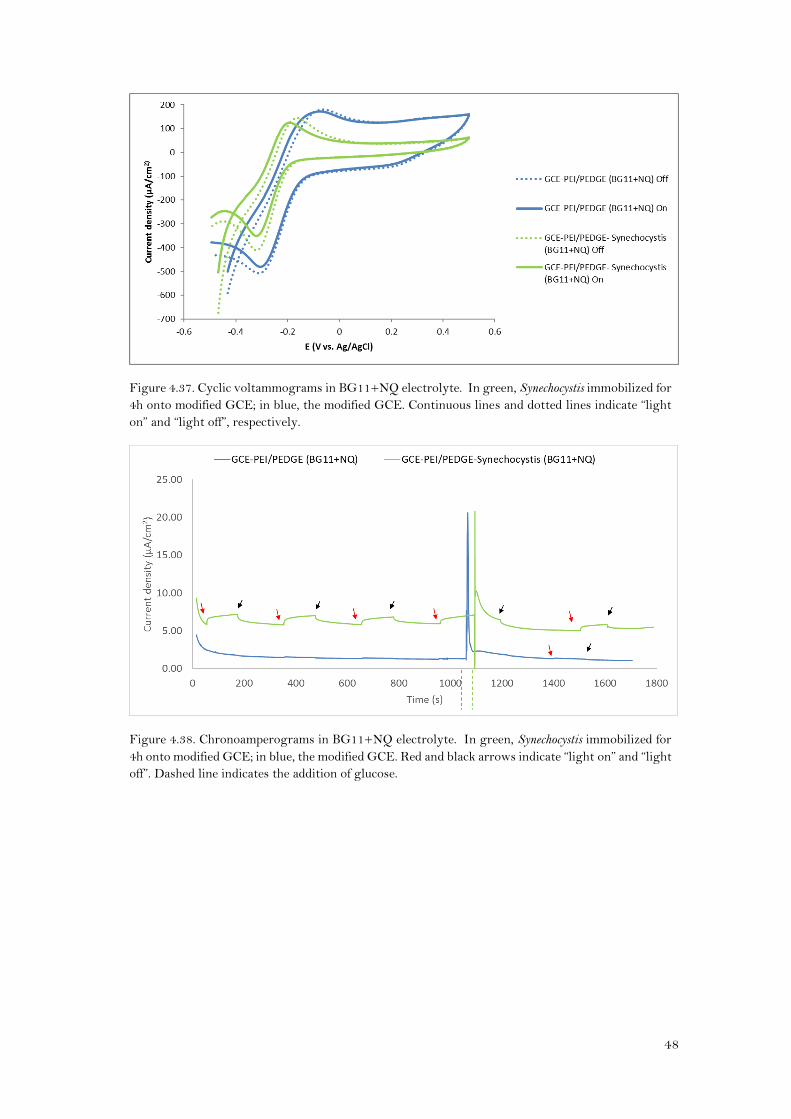
48
Figure 4.37. Cyclic voltammograms in BG11+NQ electrolyte. In green, Synechocystis immobilized for
4h onto modified GCE; in blue, the modified GCE. Continuous lines and dotted lines indicate “light
on” and “light off”, respectively.
Figure 4.38. Chronoamperograms in BG11+NQ electrolyte. In green, Synechocystis immobilized for
4h onto modified GCE; in blue, the modified GCE. Red and black arrows indicate “light on” and “light
off”. Dashed line indicates the addition of glucose.
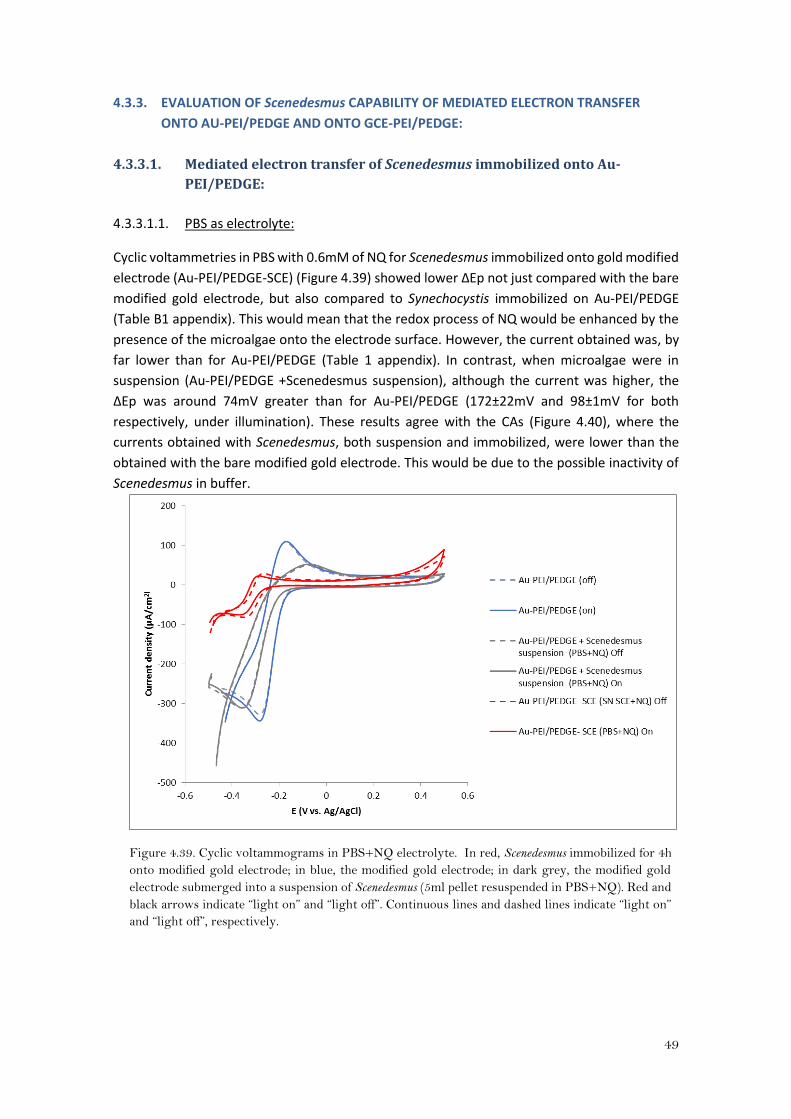
49
4.3.3. EVALUATION OF Scenedesmus CAPABILITY OF MEDIATED ELECTRON TRANSFER
ONTO AU-PEI/PEDGE AND ONTO GCE-PEI/PEDGE:
4.3.3.1. Mediated electron transfer of Scenedesmus immobilized onto Au-
PEI/PEDGE:
4.3.3.1.1. PBS as electrolyte:
Cyclic voltammetries in PBS with 0.6mM of NQ for Scenedesmus immobilized onto gold modified
electrode (Au-PEI/PEDGE-SCE) (Figure 4.39) showed lower ΔEp not just compared with the bare
modified gold electrode, but also compared to Synechocystis immobilized on Au-PEI/PEDGE
(Table B1 appendix). This would mean that the redox process of NQ would be enhanced by the
presence of the microalgae onto the electrode surface. However, the current obtained was, by
far lower than for Au-PEI/PEDGE (Table 1 appendix). In contrast, when microalgae were in
suspension (Au-PEI/PEDGE +Scenedesmus suspension), although the current was higher, the
ΔEp was around 74mV greater than for Au-PEI/PEDGE (172±22mV and 98±1mV for both
respectively, under illumination). These results agree with the CAs (Figure 4.40), where the
currents obtained with Scenedesmus, both suspension and immobilized, were lower than the
obtained with the bare modified gold electrode. This would be due to the possible inactivity of
Scenedesmus in buffer.
Figure 4.39. Cyclic voltammograms in PBS+NQ electrolyte. In red, Scenedesmus immobilized for 4h
onto modified gold electrode; in blue, the modified gold electrode; in dark grey, the modified gold
electrode submerged into a suspension of Scenedesmus (5ml pellet resuspended in PBS+NQ). Red and
black arrows indicate “light on” and “light off”. Continuous lines and dashed lines indicate “light on”
and “light off”, respectively.
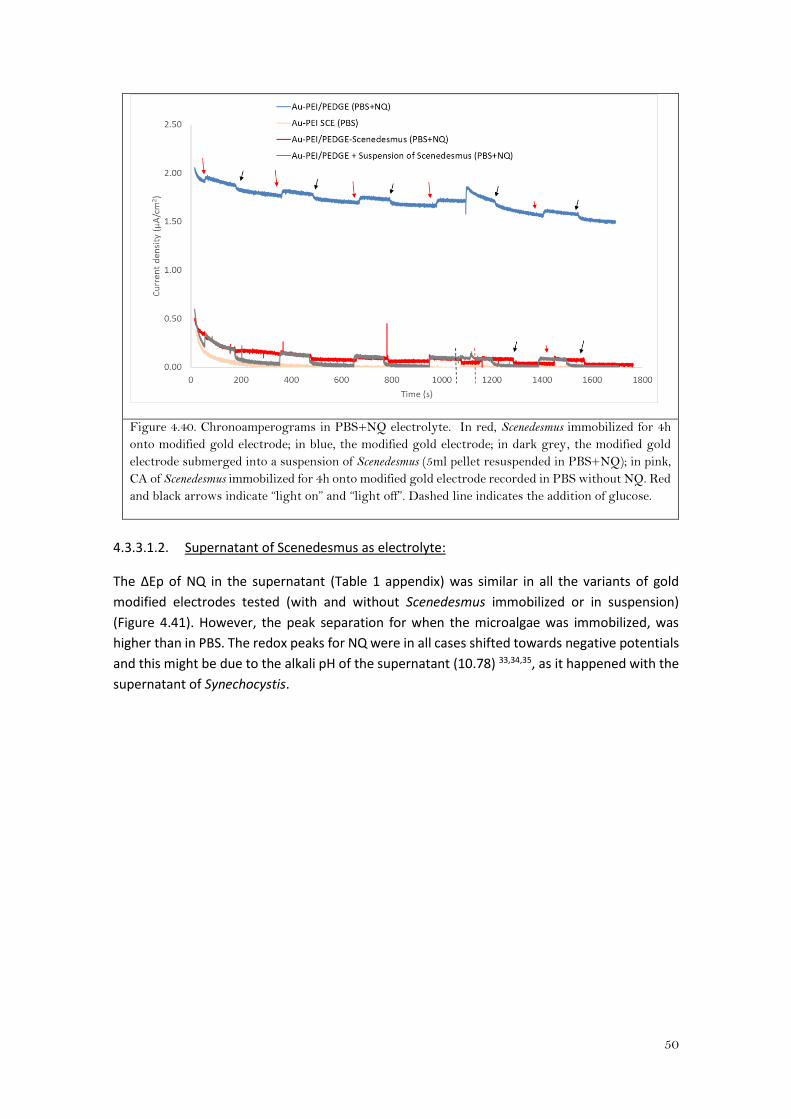
50
Figure 4.40. Chronoamperograms in PBS+NQ electrolyte. In red, Scenedesmus immobilized for 4h
onto modified gold electrode; in blue, the modified gold electrode; in dark grey, the modified gold
electrode submerged into a suspension of Scenedesmus (5ml pellet resuspended in PBS+NQ); in pink,
CA of Scenedesmus immobilized for 4h onto modified gold electrode recorded in PBS without NQ. Red
and black arrows indicate “light on” and “light off”. Dashed line indicates the addition of glucose.
4.3.3.1.2. Supernatant of Scenedesmus as electrolyte:
The ΔEp of NQ in the supernatant (Table 1 appendix) was similar in all the variants of gold
modified electrodes tested (with and without Scenedesmus immobilized or in suspension)
(Figure 4.41). However, the peak separation for when the microalgae was immobilized, was
higher than in PBS. The redox peaks for NQ were in all cases shifted towards negative potentials
and this might be due to the alkali pH of the supernatant (10.78) 33,34,35, as it happened with the
supernatant of Synechocystis.
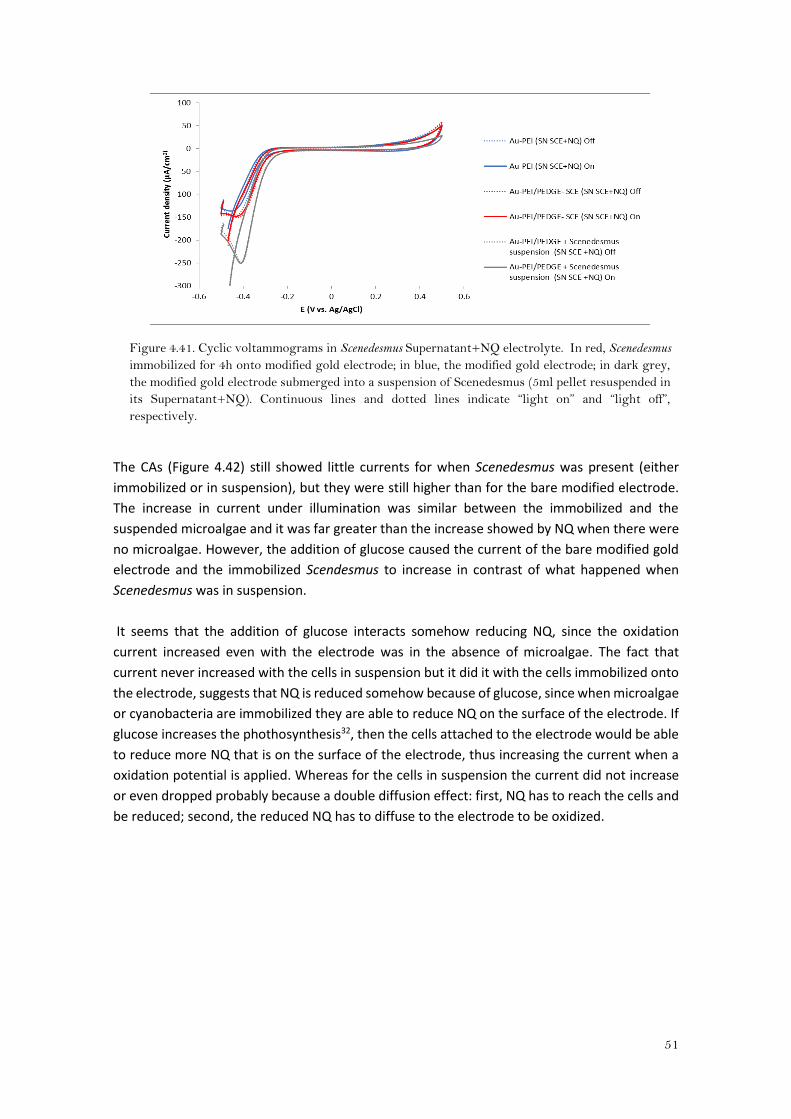
51
Figure 4.41. Cyclic voltammograms in Scenedesmus Supernatant+NQ electrolyte. In red, Scenedesmus
immobilized for 4h onto modified gold electrode; in blue, the modified gold electrode; in dark grey,
the modified gold electrode submerged into a suspension of Scenedesmus (5ml pellet resuspended in
its Supernatant+NQ). Continuous lines and dotted lines indicate “light on” and “light off”,
respectively.
The CAs (Figure 4.42) still showed little currents for when Scenedesmus was present (either
immobilized or in suspension), but they were still higher than for the bare modified electrode.
The increase in current under illumination was similar between the immobilized and the
suspended microalgae and it was far greater than the increase showed by NQ when there were
no microalgae. However, the addition of glucose caused the current of the bare modified gold
electrode and the immobilized Scendesmus to increase in contrast of what happened when
Scenedesmus was in suspension.
It seems that the addition of glucose interacts somehow reducing NQ, since the oxidation
current increased even with the electrode was in the absence of microalgae. The fact that
current never increased with the cells in suspension but it did it with the cells immobilized onto
the electrode, suggests that NQ is reduced somehow because of glucose, since when microalgae
or cyanobacteria are immobilized they are able to reduce NQ on the surface of the electrode. If
glucose increases the phothosynthesis32, then the cells attached to the electrode would be able
to reduce more NQ that is on the surface of the electrode, thus increasing the current when a
oxidation potential is applied. Whereas for the cells in suspension the current did not increase
or even dropped probably because a double diffusion effect: first, NQ has to reach the cells and
be reduced; second, the reduced NQ has to diffuse to the electrode to be oxidized.
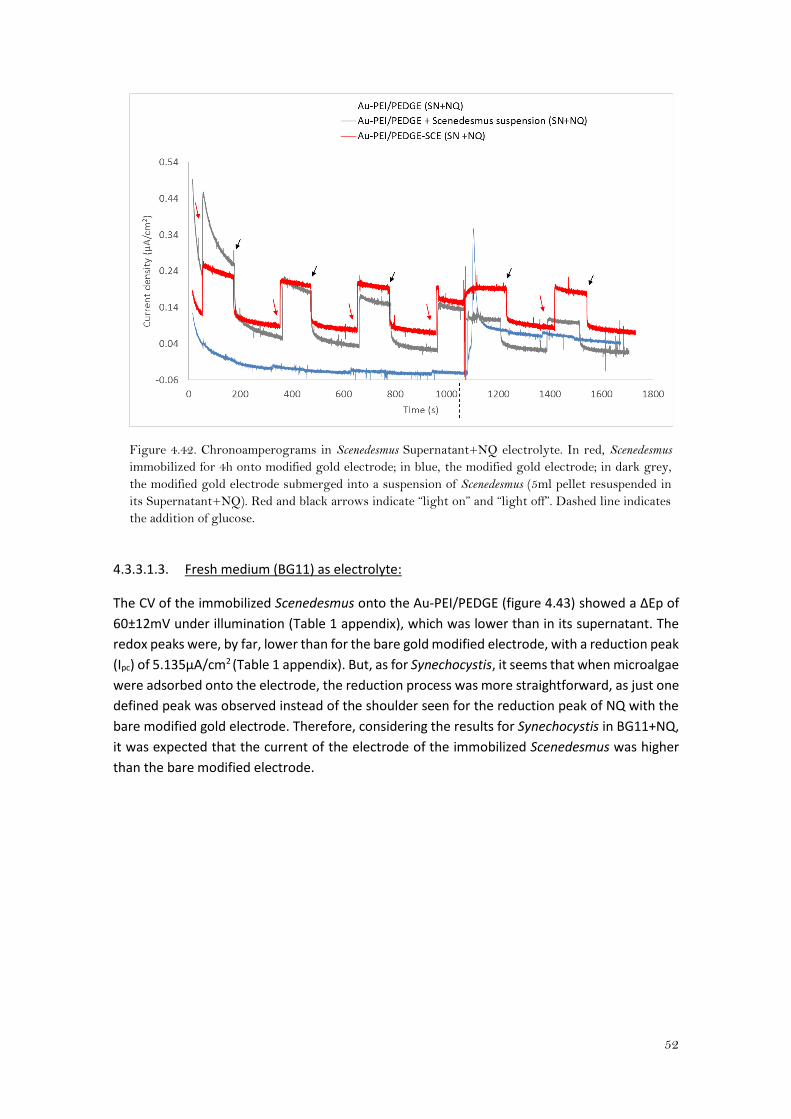
52
Figure 4.42. Chronoamperograms in Scenedesmus Supernatant+NQ electrolyte. In red, Scenedesmus
immobilized for 4h onto modified gold electrode; in blue, the modified gold electrode; in dark grey,
the modified gold electrode submerged into a suspension of Scenedesmus (5ml pellet resuspended in
its Supernatant+NQ). Red and black arrows indicate “light on” and “light off”. Dashed line indicates
the addition of glucose.
4.3.3.1.3. Fresh medium (BG11) as electrolyte:
The CV of the immobilized Scenedesmus onto the Au-PEI/PEDGE (figure 4.43) showed a ΔEp of
60±12mV under illumination (Table 1 appendix), which was lower than in its supernatant. The
redox peaks were, by far, lower than for the bare gold modified electrode, with a reduction peak
(Ipc) of 5.135μA/cm2 (Table 1 appendix). But, as for Synechocystis, it seems that when microalgae
were adsorbed onto the electrode, the reduction process was more straightforward, as just one
defined peak was observed instead of the shoulder seen for the reduction peak of NQ with the
bare modified gold electrode. Therefore, considering the results for Synechocystis in BG11+NQ,
it was expected that the current of the electrode of the immobilized Scenedesmus was higher
than the bare modified electrode.
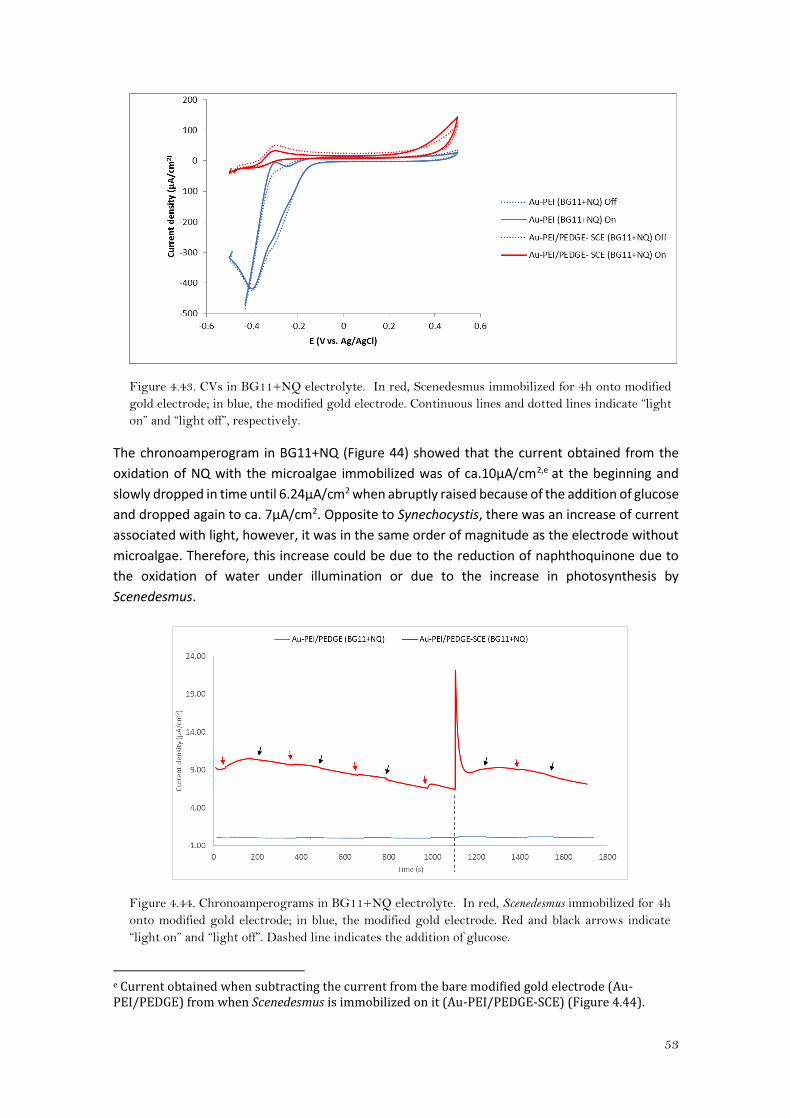
53
Figure 4.43. CVs in BG11+NQ electrolyte. In red, Scenedesmus immobilized for 4h onto modified
gold electrode; in blue, the modified gold electrode. Continuous lines and dotted lines indicate “light
on” and “light off”, respectively.
The chronoamperogram in BG11+NQ (Figure 44) showed that the current obtained from the
oxidation of NQ with the microalgae immobilized was of ca.10μA/cm2,e at the beginning and
slowly dropped in time until 6.24μA/cm2 when abruptly raised because of the addition of glucose
and dropped again to ca. 7μA/cm2. Opposite to Synechocystis, there was an increase of current
associated with light, however, it was in the same order of magnitude as the electrode without
microalgae. Therefore, this increase could be due to the reduction of naphthoquinone due to
the oxidation of water under illumination or due to the increase in photosynthesis by
Scenedesmus.
Figure 4.44. Chronoamperograms in BG11+NQ electrolyte. In red, Scenedesmus immobilized for 4h
onto modified gold electrode; in blue, the modified gold electrode. Red and black arrows indicate
“light on” and “light off”. Dashed line indicates the addition of glucose.
e Current obtained when subtracting the current from the bare modified gold electrode (Au-PEI/PEDGE) from when Scenedesmus is immobilized on it (Au-PEI/PEDGE-SCE) (Figure 4.44).
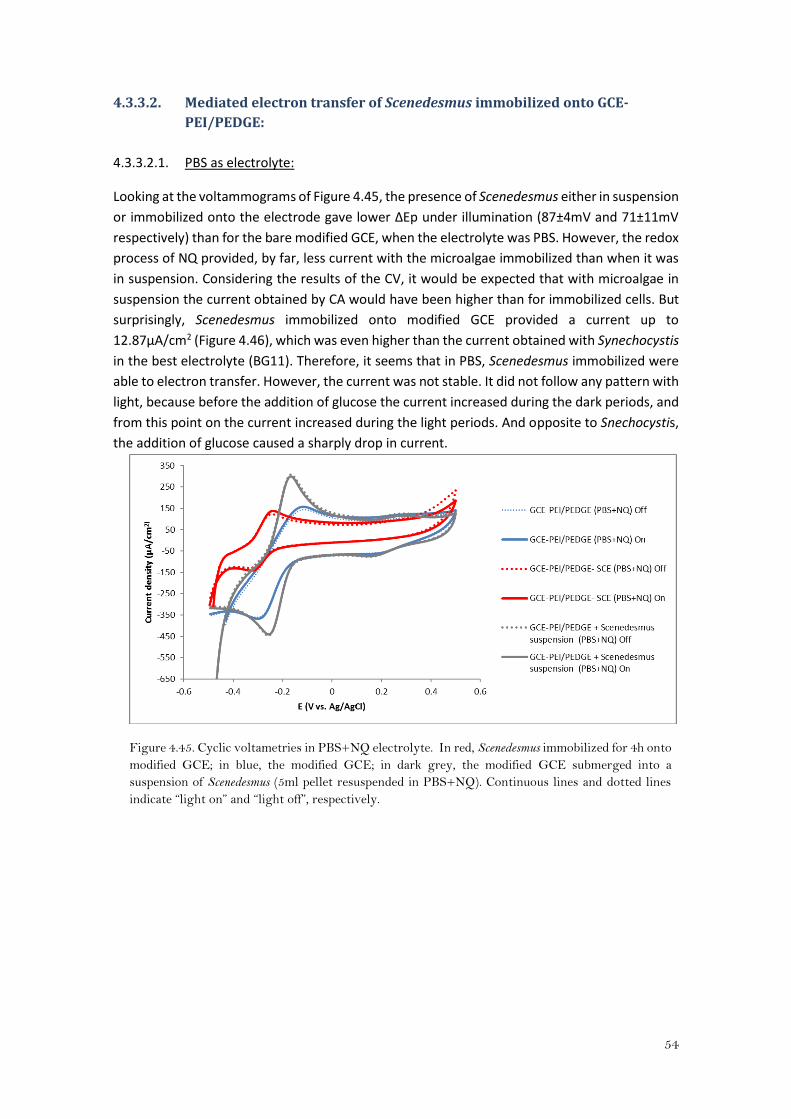
54
4.3.3.2. Mediated electron transfer of Scenedesmus immobilized onto GCE-
PEI/PEDGE:
4.3.3.2.1. PBS as electrolyte:
Looking at the voltammograms of Figure 4.45, the presence of Scenedesmus either in suspension
or immobilized onto the electrode gave lower ΔEp under illumination (87±4mV and 71±11mV
respectively) than for the bare modified GCE, when the electrolyte was PBS. However, the redox
process of NQ provided, by far, less current with the microalgae immobilized than when it was
in suspension. Considering the results of the CV, it would be expected that with microalgae in
suspension the current obtained by CA would have been higher than for immobilized cells. But
surprisingly, Scenedesmus immobilized onto modified GCE provided a current up to
12.87μA/cm2 (Figure 4.46), which was even higher than the current obtained with Synechocystis
in the best electrolyte (BG11). Therefore, it seems that in PBS, Scenedesmus immobilized were
able to electron transfer. However, the current was not stable. It did not follow any pattern with
light, because before the addition of glucose the current increased during the dark periods, and
from this point on the current increased during the light periods. And opposite to Snechocystis,
the addition of glucose caused a sharply drop in current.
Figure 4.45. Cyclic voltametries in PBS+NQ electrolyte. In red, Scenedesmus immobilized for 4h onto
modified GCE; in blue, the modified GCE; in dark grey, the modified GCE submerged into a
suspension of Scenedesmus (5ml pellet resuspended in PBS+NQ). Continuous lines and dotted lines
indicate “light on” and “light off”, respectively.
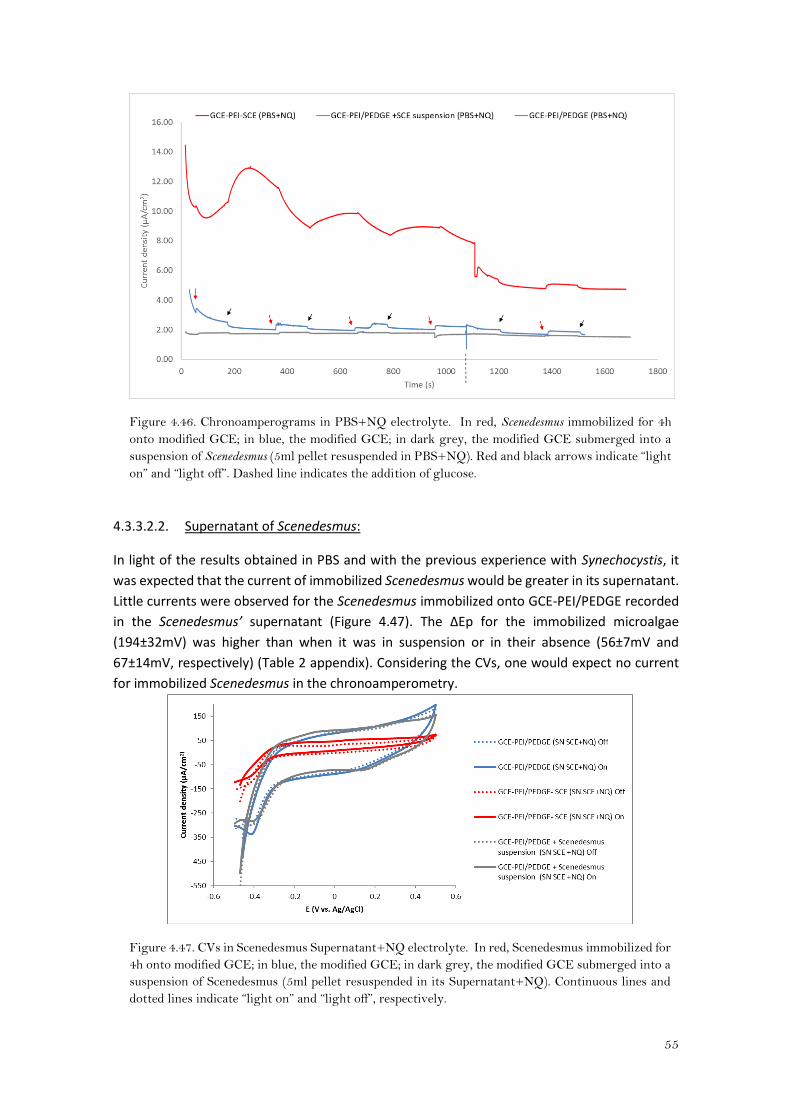
55
Figure 4.46. Chronoamperograms in PBS+NQ electrolyte. In red, Scenedesmus immobilized for 4h
onto modified GCE; in blue, the modified GCE; in dark grey, the modified GCE submerged into a
suspension of Scenedesmus (5ml pellet resuspended in PBS+NQ). Red and black arrows indicate “light
on” and “light off”. Dashed line indicates the addition of glucose.
4.3.3.2.2. Supernatant of Scenedesmus:
In light of the results obtained in PBS and with the previous experience with Synechocystis, it
was expected that the current of immobilized Scenedesmus would be greater in its supernatant.
Little currents were observed for the Scenedesmus immobilized onto GCE-PEI/PEDGE recorded
in the Scenedesmus’ supernatant (Figure 4.47). The ΔEp for the immobilized microalgae
(194±32mV) was higher than when it was in suspension or in their absence (56±7mV and
67±14mV, respectively) (Table 2 appendix). Considering the CVs, one would expect no current
for immobilized Scenedesmus in the chronoamperometry.
Figure 4.47. CVs in Scenedesmus Supernatant+NQ electrolyte. In red, Scenedesmus immobilized for
4h onto modified GCE; in blue, the modified GCE; in dark grey, the modified GCE submerged into a
suspension of Scenedesmus (5ml pellet resuspended in its Supernatant+NQ). Continuous lines and
dotted lines indicate “light on” and “light off”, respectively.
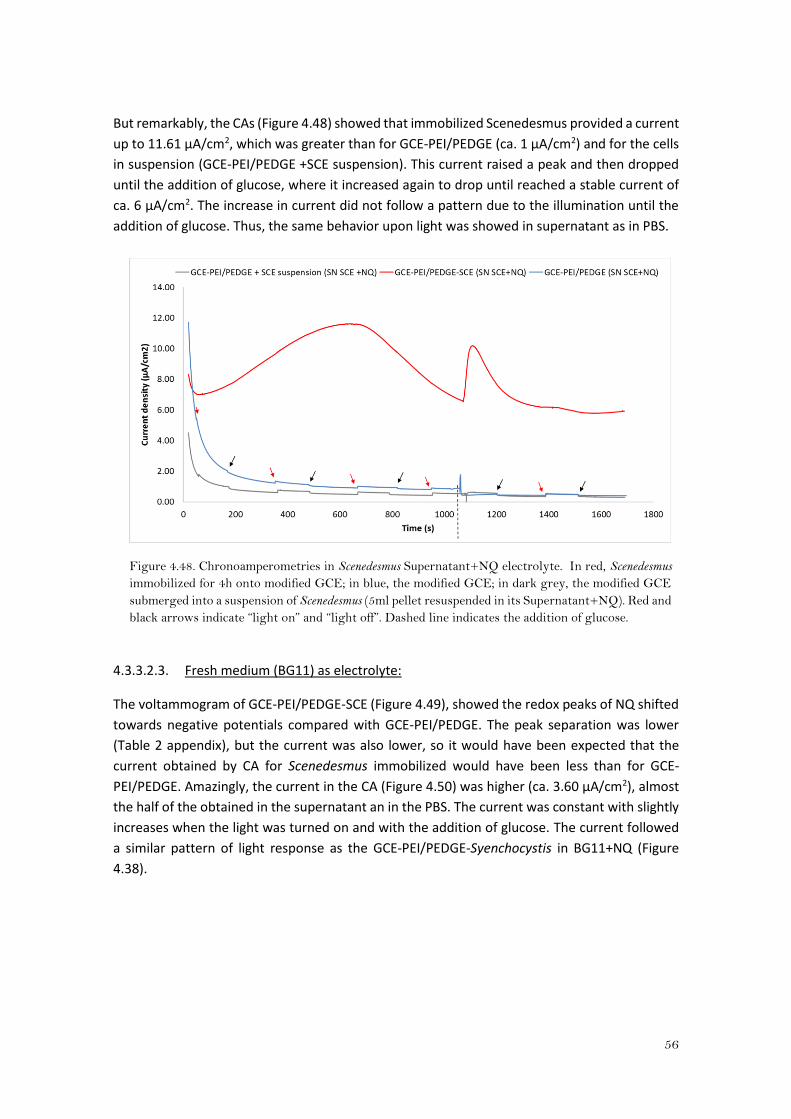
56
But remarkably, the CAs (Figure 4.48) showed that immobilized Scenedesmus provided a current
up to 11.61 μA/cm2, which was greater than for GCE-PEI/PEDGE (ca. 1 μA/cm2) and for the cells
in suspension (GCE-PEI/PEDGE +SCE suspension). This current raised a peak and then dropped
until the addition of glucose, where it increased again to drop until reached a stable current of
ca. 6 μA/cm2. The increase in current did not follow a pattern due to the illumination until the
addition of glucose. Thus, the same behavior upon light was showed in supernatant as in PBS.
Figure 4.48. Chronoamperometries in Scenedesmus Supernatant+NQ electrolyte. In red, Scenedesmus
immobilized for 4h onto modified GCE; in blue, the modified GCE; in dark grey, the modified GCE
submerged into a suspension of Scenedesmus (5ml pellet resuspended in its Supernatant+NQ). Red and
black arrows indicate “light on” and “light off”. Dashed line indicates the addition of glucose.
4.3.3.2.3. Fresh medium (BG11) as electrolyte:
The voltammogram of GCE-PEI/PEDGE-SCE (Figure 4.49), showed the redox peaks of NQ shifted
towards negative potentials compared with GCE-PEI/PEDGE. The peak separation was lower
(Table 2 appendix), but the current was also lower, so it would have been expected that the
current obtained by CA for Scenedesmus immobilized would have been less than for GCE-
PEI/PEDGE. Amazingly, the current in the CA (Figure 4.50) was higher (ca. 3.60 μA/cm2), almost
the half of the obtained in the supernatant an in the PBS. The current was constant with slightly
increases when the light was turned on and with the addition of glucose. The current followed
a similar pattern of light response as the GCE-PEI/PEDGE-Syenchocystis in BG11+NQ (Figure
4.38).
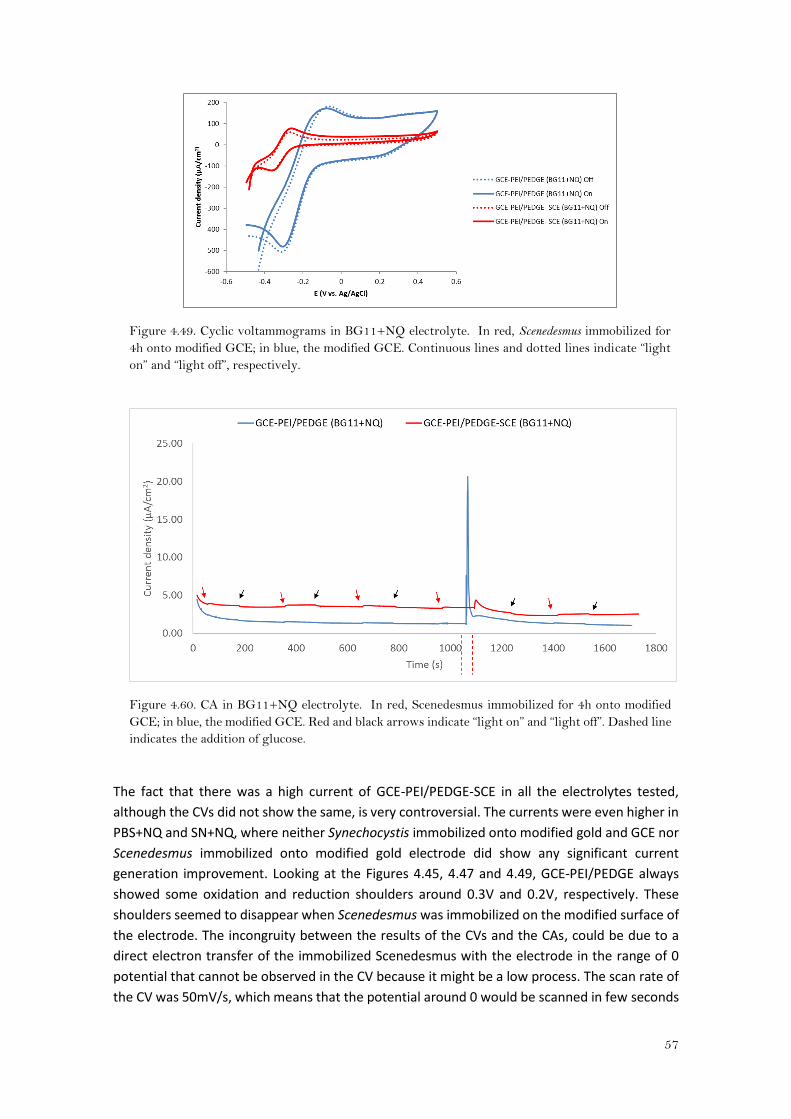
57
Figure 4.49. Cyclic voltammograms in BG11+NQ electrolyte. In red, Scenedesmus immobilized for
4h onto modified GCE; in blue, the modified GCE. Continuous lines and dotted lines indicate “light
on” and “light off”, respectively.
Figure 4.60. CA in BG11+NQ electrolyte. In red, Scenedesmus immobilized for 4h onto modified
GCE; in blue, the modified GCE. Red and black arrows indicate “light on” and “light off”. Dashed line
indicates the addition of glucose.
The fact that there was a high current of GCE-PEI/PEDGE-SCE in all the electrolytes tested,
although the CVs did not show the same, is very controversial. The currents were even higher in
PBS+NQ and SN+NQ, where neither Synechocystis immobilized onto modified gold and GCE nor
Scenedesmus immobilized onto modified gold electrode did show any significant current
generation improvement. Looking at the Figures 4.45, 4.47 and 4.49, GCE-PEI/PEDGE always
showed some oxidation and reduction shoulders around 0.3V and 0.2V, respectively. These
shoulders seemed to disappear when Scenedesmus was immobilized on the modified surface of
the electrode. The incongruity between the results of the CVs and the CAs, could be due to a
direct electron transfer of the immobilized Scenedesmus with the electrode in the range of 0
potential that cannot be observed in the CV because it might be a low process. The scan rate of
the CV was 50mV/s, which means that the potential around 0 would be scanned in few seconds
58
and if the electron transfer rate is low, the time during that the potential is in this range is so
short that is not enough to perceive a clear peak or change in current28. But the
chronoamperometry was taken for 1700s applying a potential of 0, this time should be enough
to observe a current even if the electron transfer rate was low. Furthermore, the fact that high
currents were observed as well in PBS as in the supernatant discards the possible current
generation due to byproducts or electron mediators excreted by Scenedesmus. Therefore, it
would be interesting to evaluate if direct electron transfer is taken place by performing some
chronoamperometries in PBS, BG11 and the supernatant but without the addition of
naphthoquinone.
59
5. CONCLUSIONS
The object of this project was to achieve an improvement of current generation by immobilizing
photosynthetic microorganisms onto electrodes. With the results obtained from the
immobilization of Synechocystis and Scenedesmus onto modified gold and glassy carbon
electrodes, a set of axioms can be stated:
- 4h was enough time to immobilize Synechocystis and Scenedesmus onto gold and GCE.
- Self-assembled monolayers of 6-mercapto-1-hexanol and 11-Amino-1-undecanethiol
proved not to be a suitable surface modification for current generation improvement of
Synechocystis.
- The hydrogel of Poly(ethyleinimine)/ Poly (ethylene glycol)(200) diglycidyl ether
(PEI/PEDGE) was demonstrated to be a good material for cyanobacteria and microalgae
immobilization onto electrodes.
- Synechocystis did not show direct electron transfer with modified gold electrodes and
modified GCE in PBS solution.
- Fluorescence microscopy was a suitable technique to check the attachment of
cyanobacteria and microalga to the electrode. However, is not suitable to make a proper
immobilization study and analyze the surface area coverage (SAC) and the viability of
the cells since it does not allow to analyze more than one layer.
- It has been proved that the immobilization of Synechocystis and Scenedesmus onto gold
and glassy carbon electrodes via PEI/PEDGE surface modification improved the current
generation with naphthoquinone as electron mediator.
- The best electrolyte for Synechocystis to electron transfer was fresh medium BG11,
achieving up to 9μA/cm2 of current onto gold electrode modified with PEI/PEDGE.
- Scenedesmus immobilized onto gold electrodes modified with PEI/PEDGE generated up
to 7μA/cm2 in fresh medium BG11 with naphthoquinone.
- Up to 12μA/cm2 were achieved with Scenedesmus immobilized onto GCE modified with
PEI/PEDGE when naphthoquinone was used as electron mediator.
- The results from the electrochemical study of mediated electron transfer of
Scenedesmus onto GCE-PEI/PEDGE arouse the incipient suspicion that this microalga is
capable of direct electron transfer.
- It seems that glucose increases somehow the reduction of naphthoquinone.
- The current usually increased for both strains and types of electrodes under illumination
However, it cannot be discerned if this response is due to the reduction of
naphthoquinone by the oxidation of water or by the electron transfer of the
photosynthetic microorganisms due to an increase in photosynthesis.
- Scenedesmus immobilized onto GCE/PEI-PEDGE clearly did not show a current-light
response.
60
6. FUTURE TASKS:
- Study Scenedesmus direct electron transfer by performing chronoamperometries at
different step potentials in PBS, the supernatant and the fresh medium without
naphthoquinone.
- Continue the electrochemical study of mediated electron transfer of Synechocystis and
Scenedesmus in the presence of an electron transfer inhibitor.
- Test Synechocystis and Scenedesmus immobilization onto other electrode materials via
PEI/PEDGE
61
7. REFERENCES:
1. Moriarty, P. & Honnery, D. What is the global potential for renewable energy? Renew. Sustain.
Energy Rev. 16, 244–252 (2012).
2. McCormick, A. J. et al. Biophotovoltaics: oxigenic photosynthetic organisms in the world of
bioelectrochemical systems †. Energy Environ. Sci. 8, 1092–1109 (2015).
3. Logan, B. E., Hamelers, B., Rozendal, R. & Rabaey, K. Microbial Fuel Cells : Methodology and
Technology †. Environ. Sci. Technol. 40, 5181–5192 (2006).
4. Bombelli, P., Müller, T., Herling, T. W., Howe, C. J. & Knowles, T. P. J. A High Power-Density ,
Mediator-Free , Microfl uidic Biophotovoltaic Device for Cyanobacterial Cells. Adv. energy Mater.
5, 1–6 (2015).
5. Mccormick, A. J. et al. Photosynthetic biofilms in pure culture harness solar energy in a
mediatorless bio-photovoltaic cell (BPV) system. Energy Environ. Sci. 4, 4699–4709 (2011).
6. Ciniciato, G. P. M. K. et al. Investigating the association between photosynthetic efficiency and
generation of biophotoelectricity in autotrophic microbial fuel cells. Nat. Publ. Gr. 1–10 (2016).
doi:10.1038/srep31193
7. Schneider, K., Thorne, R. J., Cameron, P. J., Schneider, K. & Cameron, P. J. An investigation of anode
and cathode materials in photomicrobial fuel cells Subject Areas : Authors for correspondence :
Phil.Trans. R.Soc A374:20150, (2016).
8. Jain, A. et al. Electron transfer mechanism in Shewanella loihica PV-4 biofilms formed at graphite
electrode. Bioelectrochemistry 87, 28–32 (2012).
9. Erbay, C. et al. Control of geometrical properties of carbon nanotube electrodes towards high-
performance microbial fuel cells. J. Power Sources 280, 347–354 (2015).
10. Dekanski, A., Stevanović, J., Stevanović, R., Nikolić, B. Ž. & Jovanović, V. M. Glassy carbon
electrodes. Carbon N. Y. 39, 1195–1205 (2001).
11. Guo, K., Prévoteau, A., Patil, S. A. & Rabaey, K. Engineering electrodes for microbial
electrocatalysis. Curr. Opin. Biotechnol. 33, 149–156 (2015).
12. Hou, J., Liu, Z., Yang, S. & Zhou, Y. Three-dimensional macroporous anodes based on stainless steel
fiber felt for high-performance microbial fuel cells. J. Power Sources 258, 204–209 (2014).
13. Guedri, H. & Durrieu, C. A self-assembled monolayers based conductometric algal whole cell
biosensor for water monitoring. Microchim. Acta 163, 179–184 (2008).
14. Lawrence, H. & Ralph, G. Synthesis, structure, and properties of model organic surfaces. Annu.
Rev. Chem. 43, 437–463 (1992).
15. Bain, C. D. & Whitesides, G. M. Formation of two-component surfaces by the spontaneous
assembly of monolayers on gold from solutions containing mixtures of organic thiols. J. Am. Chem.
Soc. 110, 6560–6561 (1988).
16. Le, D. Q., Tokonami, S., Nishino, T., Shiigi, H. & Nagaoka, T. Electrochemical evaluation of poly(3,4-
ethylenedioxythiophene) films doped with bacteria based on viability analysis.
62
Bioelectrochemistry 105, 50–55 (2015).
17. Lobakova, E. S. et al. Immobilization of cyanobacteria and microalgae on polyethylenimine-based
sorbents. Microbiol. (Russian Fed. 86, 629–639 (2017).
18. Hasan, K. et al. Photoelectrochemical Wiring of Paulschulzia pseudovolvox (Algae) to Osmium
Polymer Modified Electrodes for Harnessing Solar Energy. Adv. Energy Mater. 5, 1–11 (2015).
19. Sure, S. et al. Inquisition of Microcystis aeruginosa and Synechocystis nanowires: characterization
and modelling. Antonie van Leeuwenhoek, Int. J. Gen. Mol. Microbiol. 108, 1213–1225 (2015).
20. Malvankar, N. S. & Lovley, D. R. Microbial nanowires: A new paradigm for biological electron
transfer and bioelectronics. ChemSusChem 5, 1039–1046 (2012).
21. Trainor, F. & Burg, C. Detection of bristles in Scnedesmus species. J. Phycol. 139–144 (1965).
22. Apandi, N. M., Radin Mohamed, R. M. S., Latiffi, N. A. A., Rozlan, N. F. M. & Al-Gheethi, A. A. S.
Protein and Lipid Content of Microalgae Scenedesmus sp. Biomass Grown in Wet Market
Wastewater. MATEC Web Conf. 103, 6011 (2017).
23. Hasan, K. et al. Photoelectrochemical communication between thylakoid membranes and gold
electrodes through different quinone derivatives. ChemElectroChem 1, 131–139 (2014).
24. Princeton Applied Research. Basics of Voltammetry and Polarography. 12
25. Kounaves, S. P. in Handbook of Instrumental Techniques for Analytical Chemistry (ed. Settle, F. A.)
709–726 (Prentice Hall Upper Saddle River, 1998).
26. Quiroga, A. Cyclic Voltammetry - Chemistry LibreTexts. The LibreTexts libraries, UCD (2017).
Available at:
https://chem.libretexts.org/Core/Analytical_Chemistry/Instrumental_Analysis/Cyclic_Voltamme
try. (Accessed: 26th September 2017)
27. Linear Sweep and Cyclic Voltametry: The Principles. Department of Chemical Engineering and
Biotechnology. University of Cambridge Available at:
https://www.ceb.cam.ac.uk/research/groups/rg-eme/teaching-notes/linear-sweep-and-cyclic-
voltametry-the-principles. (Accessed: 26th September 2017)
28. Brownson, D. A. C. & Banks, C. E. in The Handbook of Graphene Electrochemistry 1–201 (2014).
doi:10.1007/978-1-4471-6428-9
29. Kodama, Y. Time gating of chloroplast autofluorescence allows clearer fluorescence imaging in
planta. PLoS One 11, 1–8 (2016).
30. Sumi, T. & Uosaki, K. Electrochemical Oxidative Formation and Reductive Desorption of a Self-
Assembled Monolayer of Decanethiol on a Au(111) Surface in KOH Ethanol Solution. J. Phys. Chem.
B 108, 6422–6428 (2004).
31. Bombelli, P. et al. Quantitative analysis of the factors limiting solar power transduction by
Synechocystis sp. PCC 6803 in biological photovoltaic devices. Energy Environ. Sci. 4, 4690 (2011).
32. Xie, X. H., Li, E. L. & Kang Tang, Z. Mediator toxicity and dual effect of glucose on the lifespan for
current generation by Cyanobacterium Synechocystis PCC 6714 based photoelectrochemical cells.
J. Chem. Technol. Biotechnol. 86, 109–114 (2011).
33. Bailey, S. I., Ritchie, I. M. & Hewgill, F. R. The construction and use of potential?pH diagrams in
organic oxidation?reduction reactions. J. Chem. Soc. Perkin Trans. 2 645 (1983).
63
doi:10.1039/p29830000645
34. Gerhardt, M. . et al. Quinone electrochemistry in acidic and alkaline solutions and its application
in large scale energy storage. in American Chemical Society (2015).
35. Guin, P. S., Das, S. & Mandal, P. C. Electrochemical Reduction of Quinones in Different Media: A
Review. Int. J. Electrochem. 2011, 1–22 (2011).

64
8. APPENDIX:
Table 1: Peak currents and peak potentials for Au-PEI/PEDGE……………….……………..65
Table 2: Peak currents and peak potentials for GCE-PEI/PEDGE…………………..………..66
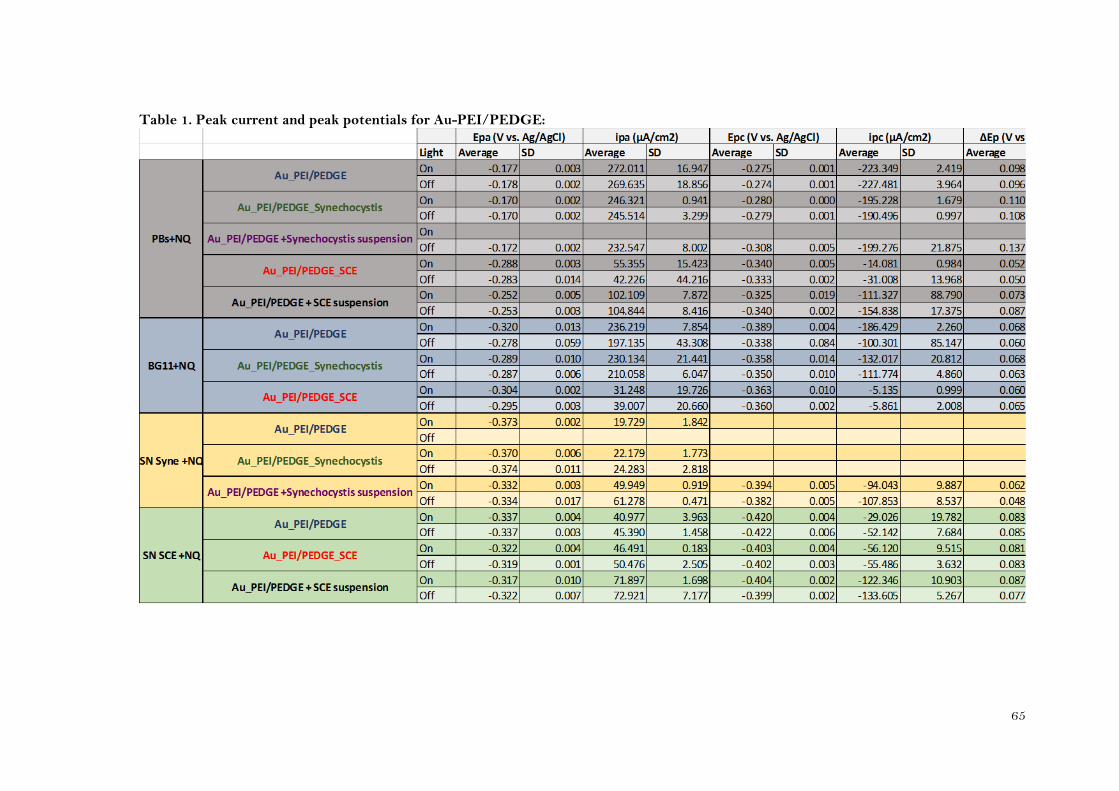
65
Table 1. Peak current and peak potentials for Au-PEI/PEDGE:
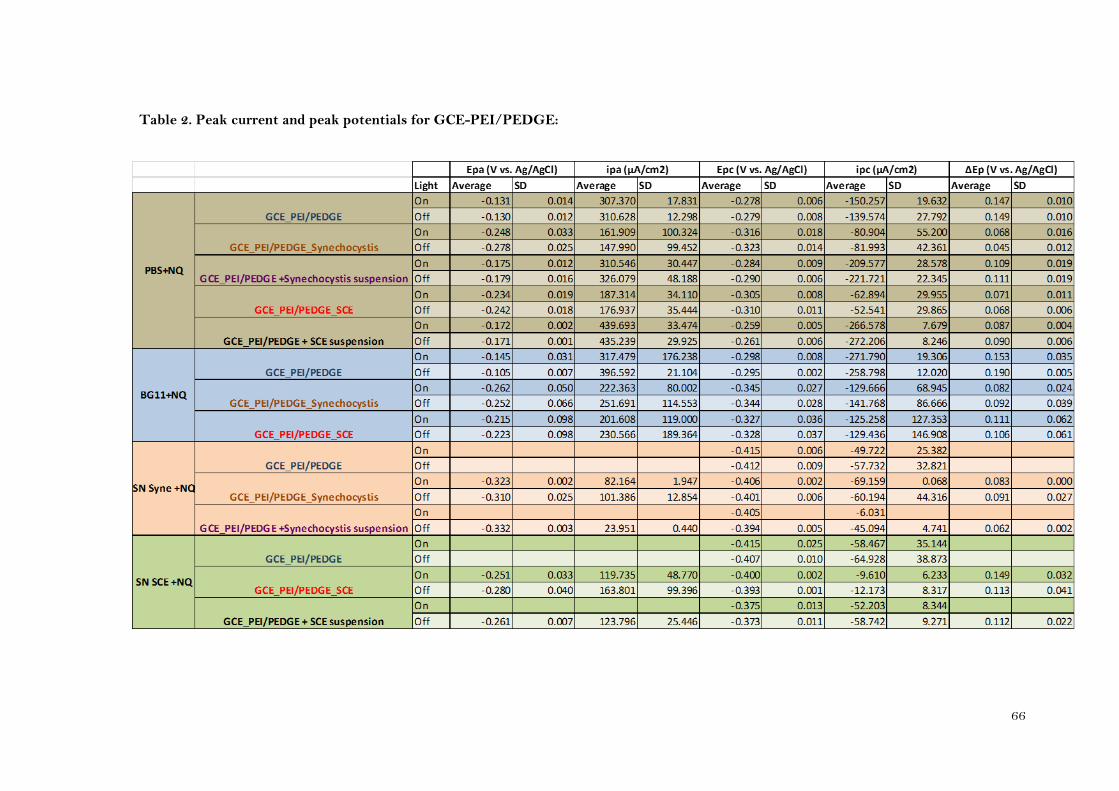
66
Table 2. Peak current and peak potentials for GCE-PEI/PEDGE: