Embed Size (px)
Citation preview
STUDY OF AIRPORT SNOW AND ICE REMOVAL AND ITS ECONOMIC
IMPLICATIONS
by
Andreas Lichliter
A thesis submitted to the Faculty of the University of Delaware in partial fulfillment of the requirements for the degree of Master in Civil Engineering
Spring 2012
Copyright 2012 Lichliter All Rights Reserved
STUDY OF AIRPORT SNOW AND ICE REMOVAL AND ITS ECONOMIC
IMPLICATIONS
by
Andreas Lichliter
Approved: __________________________________________________________ Ardeshir Faghri, Ph.D. Professor in charge of thesis on behalf of the Advisory Committee Approved: __________________________________________________________ Harry W. Shenton III, Ph.D. Chair of the Department of Civil and Environmental Engineering Approved: __________________________________________________________ Babatunde A. Ogunnaike, Ph.D. Interim Dean of the College of Engineering Approved: __________________________________________________________ Charles G. Riordan, Ph.D. Vice Provost for Graduate and Professional Education
iii
ACKNOWLEDGMENTS
I want to thank my advisors, Sue McNeil and Ardeshir Faghri for their
help and assistance on my thesis. I would also like to express my appreciation to Eric
Silverman of Philadelphia Airport, William Wieners of Boston Logan International
Airport, Roger Richter of Frankfurt International Airport, and Andreas Edelmann of
Vienna International Airport for the information they so generously provided me on
their respective airports and for the interest and encouragement they extended to me.
iv
TABLE OF CONTENTS
LIST OF TABLES ....................................................................................................... vii LIST OF FIGURES ..................................................................................................... viii ABSTRACT ................................................................................................................... x Chapter 1. INTRODUCTION .............................................................................................. 1
1.1 Background ............................................................................................. 1 1.2 Problem Statement .................................................................................. 5 1.3 Purpose and Objective ............................................................................ 6 1.4 Scope of the Work .................................................................................. 7 1.5 Organization of Thesis ........................................................................... 8 1.6 Definition of Terms ................................................................................ 8
2. LITERATURE REVIEW ................................................................................. 10
2.1 Cost Reduction ..................................................................................... 10 2.2 Safety .................................................................................................... 12 2.3 Summary of Chapter 2 .......................................................................... 14
3. DATA COLLECTION AND REDUCTION ................................................... 15 3.1 Introduction to the Airports Studied in this Thesis .............................. 15
3.1.1 Philadelphia .............................................................................. 16 3.1.2 Boston ....................................................................................... 18 3.1.3 Frankfurt/Main ......................................................................... 20 3.1.4 Vienna ....................................................................................... 22 3.1.5 Comparison of the four Airports .............................................. 24
3.1.5.1 Runway Dimensions Worksheet .................................. 25 3.1.5.2 Taxiway and Apron Worksheet .................................... 27
3.2 Snow Clearing Equipment .................................................................... 29
v
3.2.1 Snow Plow/Blower ................................................................... 29 3.2.2 Snow Broom ............................................................................. 31 3.2.3 Chemical Spraying Vehicles .................................................... 32 3.2.4 Friction Testing Vehicle ........................................................... 33 3.2.5 Snow Removal Techniques ...................................................... 34
3.2.5.1 Airport Ground Equipment Inventory Worksheet ........ 36
3.3 Deicing Methods .................................................................................. 38
3.3.1 Glycol Based ............................................................................ 38 3.3.2 Infra-Red ................................................................................... 39 3.3.3 Deicing Aircraft and Cost Determination ................................. 40
3.3.3.1 Aircraft Data Worksheet ............................................... 40 3.3.3.2 Deicing Cost Worksheet ............................................... 42
3.4 Legislation ............................................................................................ 44
3.4.1 U.S. Passenger Delay ............................................................... 44 3.4.2 EU Passenger Delay ................................................................. 45
3.5 Summary of Chapter 3 .......................................................................... 45
4. DATA ANALYSIS AND METHODOLOGY ................................................ 47 4.1 Procedure .............................................................................................. 47 4.2 Data Collection Methodology .............................................................. 48 4.3 Overview of the Data and Analysis ...................................................... 49 4.4 Data Analysis Methodology ................................................................. 51
4.4.1 Description of the Storms ......................................................... 52 4.4.2 Storm Data Worksheet ............................................................. 55 4.4.3 Distribution Worksheet ............................................................ 57 4.4.4 Delay Worksheet ...................................................................... 59
4.5 Summary of Chapter 4 .......................................................................... 61
5. RESULTS ......................................................................................................... 62 5.1 Philadelphia .......................................................................................... 62 5.2 Boston ................................................................................................... 64 5.3 Frankfurt ............................................................................................... 65
vi
5.4 Vienna ................................................................................................... 67 5.5 Cost Effectiveness Analysis ................................................................. 68 5.6 Analysis of Results ............................................................................... 78 5.7 Summary of Chapter 5 .......................................................................... 81
6. CONCLUSIONS & RECOMMENDATIONS ................................................ 82 6.1 Summary ............................................................................................... 82 6.2 Conclusions .......................................................................................... 83 6.3 Recommendations ................................................................................ 85 6.4 Application ........................................................................................... 85 6.5 Summary of Chapter 6 .......................................................................... 86
REFERENCES ............................................................................................................. 87 Appendix EQUIPMENT DATA INFORMATION ...................................................................... 91
vii
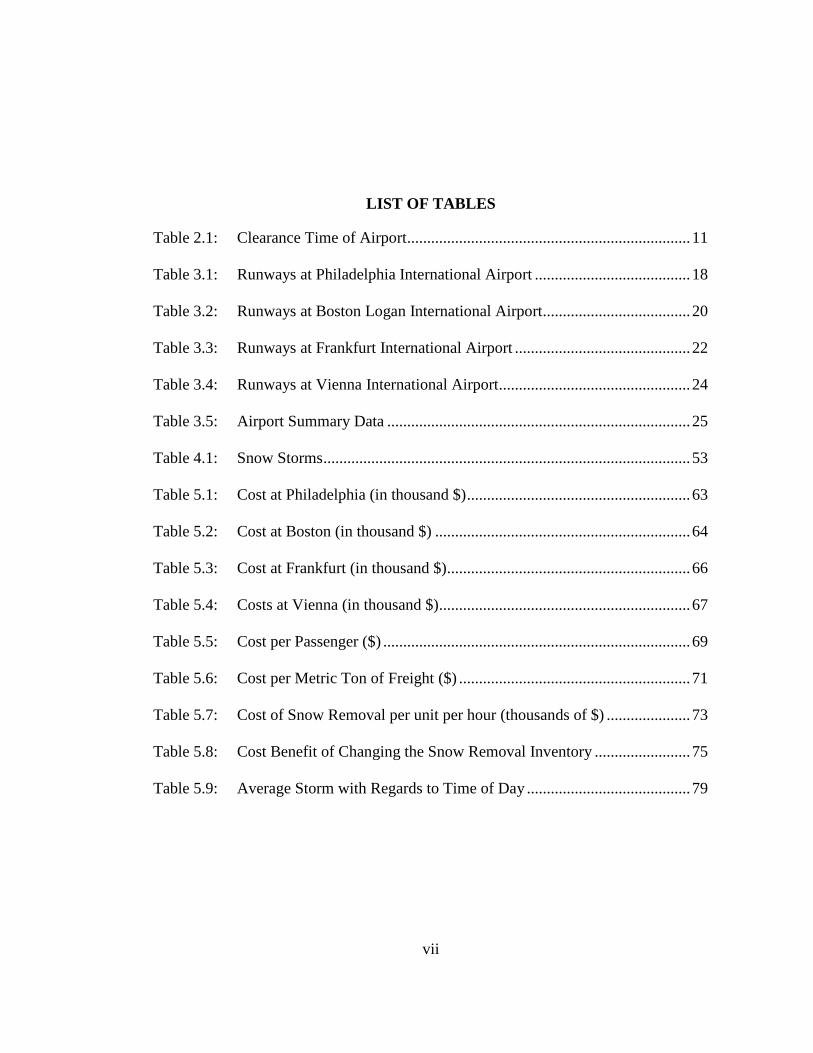
LIST OF TABLES
Table 2.1: Clearance Time of Airport ....................................................................... 11
Table 3.1: Runways at Philadelphia International Airport ....................................... 18
Table 3.2: Runways at Boston Logan International Airport ..................................... 20
Table 3.3: Runways at Frankfurt International Airport ............................................ 22
Table 3.4: Runways at Vienna International Airport ................................................ 24
Table 3.5: Airport Summary Data ............................................................................ 25
Table 4.1: Snow Storms ............................................................................................ 53
Table 5.1: Cost at Philadelphia (in thousand $) ........................................................ 63
Table 5.2: Cost at Boston (in thousand $) ................................................................ 64
Table 5.3: Cost at Frankfurt (in thousand $) ............................................................. 66
Table 5.4: Costs at Vienna (in thousand $) ............................................................... 67
Table 5.5: Cost per Passenger ($) ............................................................................. 69
Table 5.6: Cost per Metric Ton of Freight ($) .......................................................... 71
Table 5.7: Cost of Snow Removal per unit per hour (thousands of $) ..................... 73
Table 5.8: Cost Benefit of Changing the Snow Removal Inventory ........................ 75
Table 5.9: Average Storm with Regards to Time of Day ......................................... 79
viii
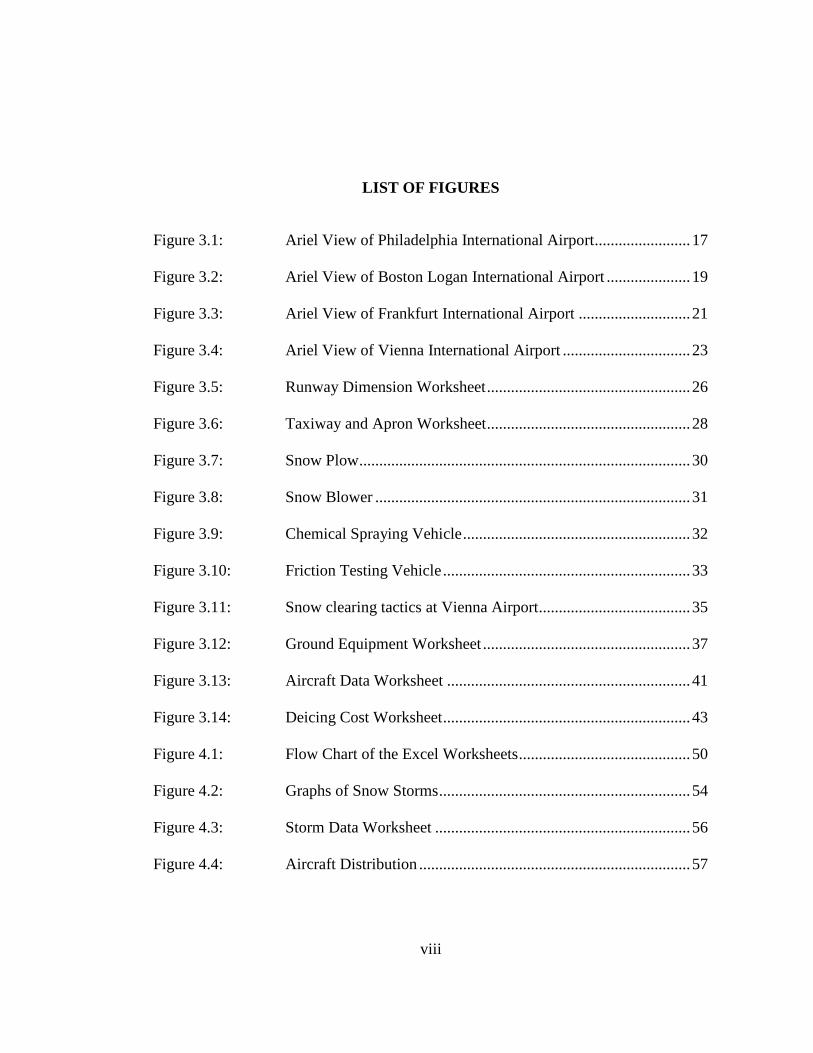
LIST OF FIGURES
Figure 3.1: Ariel View of Philadelphia International Airport ........................ 17
Figure 3.2: Ariel View of Boston Logan International Airport ..................... 19
Figure 3.3: Ariel View of Frankfurt International Airport ............................ 21
Figure 3.4: Ariel View of Vienna International Airport ................................ 23
Figure 3.5: Runway Dimension Worksheet ................................................... 26
Figure 3.6: Taxiway and Apron Worksheet ................................................... 28
Figure 3.7: Snow Plow ................................................................................... 30
Figure 3.8: Snow Blower ............................................................................... 31
Figure 3.9: Chemical Spraying Vehicle ......................................................... 32
Figure 3.10: Friction Testing Vehicle .............................................................. 33
Figure 3.11: Snow clearing tactics at Vienna Airport ...................................... 35
Figure 3.12: Ground Equipment Worksheet .................................................... 37
Figure 3.13: Aircraft Data Worksheet ............................................................. 41
Figure 3.14: Deicing Cost Worksheet .............................................................. 43
Figure 4.1: Flow Chart of the Excel Worksheets ........................................... 50
Figure 4.2: Graphs of Snow Storms ............................................................... 54
Figure 4.3: Storm Data Worksheet ................................................................ 56
Figure 4.4: Aircraft Distribution .................................................................... 57
ix
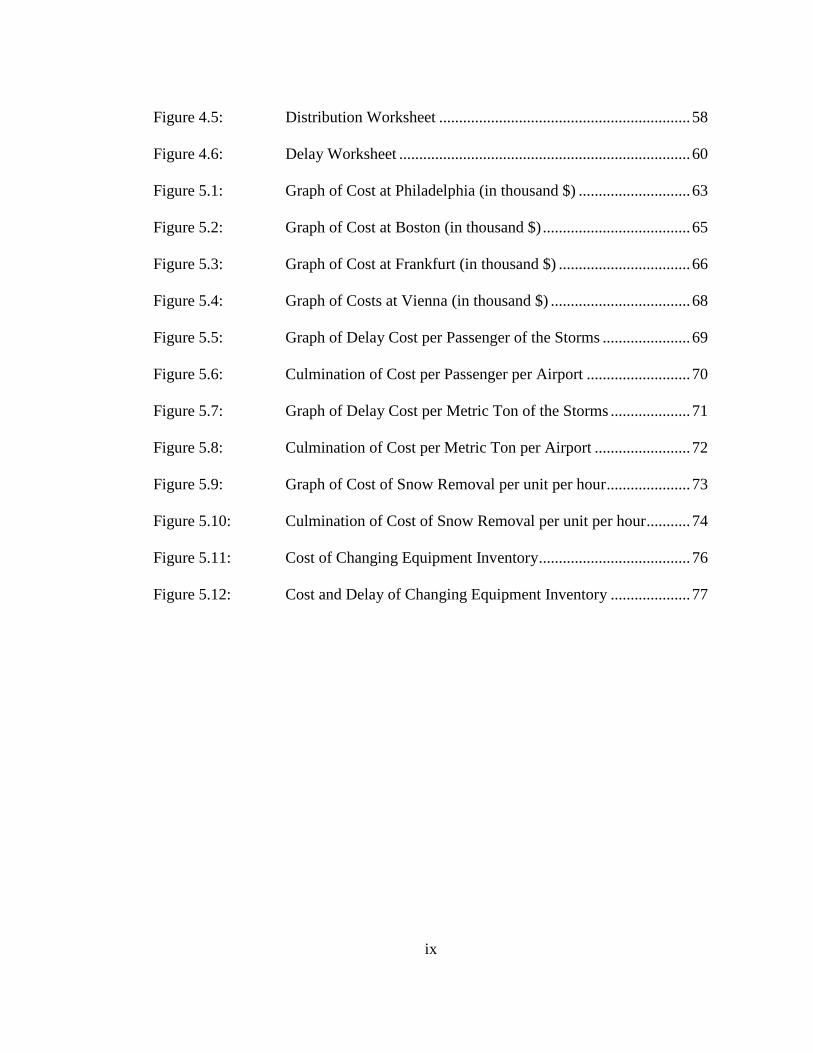
Figure 4.5: Distribution Worksheet ............................................................... 58
Figure 4.6: Delay Worksheet ......................................................................... 60
Figure 5.1: Graph of Cost at Philadelphia (in thousand $) ............................ 63
Figure 5.2: Graph of Cost at Boston (in thousand $) ..................................... 65
Figure 5.3: Graph of Cost at Frankfurt (in thousand $) ................................. 66
Figure 5.4: Graph of Costs at Vienna (in thousand $) ................................... 68
Figure 5.5: Graph of Delay Cost per Passenger of the Storms ...................... 69
Figure 5.6: Culmination of Cost per Passenger per Airport .......................... 70
Figure 5.7: Graph of Delay Cost per Metric Ton of the Storms .................... 71
Figure 5.8: Culmination of Cost per Metric Ton per Airport ........................ 72
Figure 5.9: Graph of Cost of Snow Removal per unit per hour ..................... 73
Figure 5.10: Culmination of Cost of Snow Removal per unit per hour ........... 74
Figure 5.11: Cost of Changing Equipment Inventory ...................................... 76
Figure 5.12: Cost and Delay of Changing Equipment Inventory .................... 77
x
ABSTRACT
For airports that regularly encounter storms with snow and ice in an average
year, removal of this snow and ice is essential for maintaining safe operations. This
snow and ice removal must not only ensure safe operations but also must be efficient
because efficient removal is crucial to reducing airport delays and the resulting cost
and impact that a snow storm has on an airport and its surrounding economy. The
purpose of this thesis is to assist airports in determining whether they are appropriately
managing their snow and ice removal resources and applying engineering best
practices.
Two airports in Europe and two airports in the U.S. that have approximately
the same amount of annual snow fall and handle the same mix and volume array of
aircraft have been identified for analysis of their snow and ice removal practices.
These airports are Frankfurt, Germany and Vienna, Austria in Europe and Philadelphia
and Boston in the United States.
Data collection and categorization has been done by means of a Microsoft®
Excel workbook, consisting of eight worksheets, to model the characteristics of the
airport, the ground equipment, the storm, the aircraft and the time of day. This input
information, in turn, generates the output consisting of delays and costs associated
xi
with a given scenario and allows for comparison with the other airports being studied.
The excel workbook has been run on the four airports and on six snow storms.
The analysis identifies which airports allocated their resources most efficiently
and provides a basis for recommendations to the airports. The model may also be
replicated for use by other airports.
The thesis concludes that the airports in Europe are more prepared for and have
a more efficient snow and ice removal strategy than the airports in the United States.
Analysis was done for numerous parameters; the cost per passenger, the cost per
metric ton of cargo, and the cost per hour that the pieces of equipment were in use. For
most of the analysis parameters, Vienna International Airport was the most efficient.
1
Chapter 1
1. INTRODUCTION
1.1 Background
While an airport may be simply defined as a location where aircraft take off and
land, modern airports transcend this simple definition. Airports today involve a complex
of interconnected activities, services, and functions that have developed to facilitate this
basic takeoff and landing purpose. For example, one set of interconnected activities,
services, and functions revolve about the impact snow and ice can have on the ability of
aircraft to take off and land.
Because airports need to function as safe transfer hubs for passengers and cargo,
they can face many problems when it comes to snow and ice. Even the casual traveler
recognizes that airports must: 1) observe the weather to ensure safe visibility and
conditions, 2) clear the runways and taxi ways to ensure safe, non-slip conditions for
vehicles using it, 3) deice aircraft to prevent ice buildup on the craft which would
adversely affect its ability to lift off the ground. [1]
It should be noted, however, that even these easily recognizable actions require
complex logistics and varied background activities. For example, airports monitor
weather conditions to determine the appropriate measures to ensure safely functioning
operations. In severe weather conditions at an airport, safe passage of aircraft both on and
off the ground may be jeopardized. Even though arriving and departing aircraft may have
2
an Instrument Landing System (ILS) and a Global Positioning System (GPS) to aid them
in flight, wind shear and microburst can potentially be fatal for the passengers in the
aircraft, if they are not detected and avoided. In the instance of severe weather, at some
airports, aircraft on the ground may need to rely on sight to traverse the airport even
though ground radar, which would allow the tower to aid aircraft on the ground in poor
visibility, is becoming more common. In such a case, where sight must be relied on, the
aircraft could potentially steer off the runway or taxiway, collide with another aircraft or
airport vehicle, or even possibly collide with the terrain.
In winter it is evident that runways and taxiways cleared from snow are essential
to prevent the pilot from losing control of the aircraft due to the lack of friction with the
ground. Snowplows, therefore, plow the runway and then use a chemical mixture on the
surface to melt the remaining snow and ice that is compacted in the groves in the surface
in order to allow for both water drainage and additional friction.
In moist cold weather, it is also clear that deicing an aircraft is essential. While
the aircraft is on the ground, water and precipitation accumulate on the wing. The cold
fuel of the aircraft, which is stored in the wing, [2] and the cold air around the wing
causes the moisture to freeze into a sheet of ice on the surface. When the aircraft attempts
to take off, the ice on the surface disrupts the flow of air and prevents the aircraft from
getting lift. In such a case, while the aircraft will initially obtain lift, it will then become
unstable and uncontrollable and this can ultimately lead to a crash. This was the
unfortunate case on January 13, 1982, with Air Florida flight 90, a Boeing 737-200,
which took off from Washington National Airport having not been properly deiced,
obtained initial lift and became uncontrollable before hitting the 14th Street Bridge and
3
crashing into the frozen Potomac River. [3] Today Type 4 deicing fluid is most
commonly used at commercial airports, because this fluid allows for the longest amount
of time before needing to be reapplied to the surface and also has the characteristic of
shedding off the surface at high speeds to permit the aircraft to safely become airborne.
[4]
A cursory review of weather conditions, runway snow removal, and aircraft
deicing reveal complex systems engaged in accomplishing the basic airport purpose of
facilitating aircraft to take off and land. It also suggests that many more systems must
exist and interact at some optimal level for airports to be able to address the challenges of
snow and ice.
In December 2010, for example, snow and ice crippled European airports. Heavy
wet snow resulted in the closure of numerous airports including London, Paris, and
Amsterdam. The snow and ice also revealed an apparent mismanagement of resources at
Brussels airport where the airport ran out of deicing fluid and had to cancel flights for
several days until supplies could be replenished and aircraft could safely depart. The
airport closures in London, Paris, and Amsterdam resulted in passengers being stranded
and flights already en route, such as those originating in Asia, being required to divert to
open airports such as Frankfurt. [5]
Flight diversions, cancellations, and delays, at a peak holiday travel period,
resulted in a large increase in departing and transit passengers, which in turn placed
unusually heavy demands on terminal and passenger services and systems in Frankfurt.
[6] Wait times to reach the transit desk in order to rebook flights exceeded five hours.
Airport seating capacity was insufficient. Food distribution systems were overwhelmed.
4
To help ease the plight of stranded passengers, the airport provided basic entertainment in
the form of a clown and other street performers [7] as well as food and water, in
accordance with the European Union law regarding the rights of passengers. [8]
Frankfurt, which was already dealing with its own snow problems, had to adjust
for the incoming diverted “heavy” aircraft (long haul flights), which in turn meant that it
could not safely accommodate smaller regional flights. In response to the situation,
Lufthansa cancelled all domestic flights and with the Deutsche Bahn, the German federal
railway, validated and urged use of the airplane tickets on the train. This action
successfully reduced the number of passengers in transit who were stranded in Frankfurt
but created additional problems for the luggage and cargo systems which were thrown
out of synchronization and gradually ground to a halt. [5]
Because certain pieces of luggage were not able to be delivered to their final
destination as routed because of cancelled, diverted, or delayed flights, these pieces of
luggage were pulled from the luggage delivery system and re-routed. However, by the
time that these pieces of luggage were found and re-routed, many of the flights intended
to be used for these pieces of luggage had been cancelled, and the entire distribution
system had again to be re-searched so that these pieces could be found and pulled out.
This led to a downward spiral, which resulted in people’s luggage being laid aside and
then being buried by other luggage. The Frankfurt luggage system collapse trickled down
to the other airports in Europe. It was reported by airport officials that in Frankfurt there
were 20,000 pieces of lost luggage [9] and in Vienna there were 5,000. [10]
Luggage redistribution took a long time, since the airlines had to maintain
continuing holiday level baggage handling, find the luggage from cancelled and rerouted
5
flights, and put individual pieces of luggage on flights that would be able to deliver the
bags to the appropriate final destinations. This process was further complicated due to
different luggage systems between airports and the financial incentives of airlines to fly
cargo rather than passengers and luggage. As a result, on one hand, certain flights were
flying with space available for additional luggage despite there still being accumulated
luggage in the luggage distribution system that could have potentially been on these
flights, and, on the other hand, some flights with available space took luggage which was
bound for airports near the destination airport so that the luggage ended up leapfrogging
to the final destination.
As this simple example of luggage indicates, in today’s airport the challenges
deriving from snow and ice are quite complex and affect many different systems. The
airport systems dealing with weather analysis, runaway snow removal, and aircraft
deicing are clearly the primary systems affected but many other airport systems are also
involved in meeting the challenges deriving from snow and ice. All must be coordinated
in preparation, response, and recovery.
1.2 Problem Statement
The problem, that this thesis investigates, is concerned with the allocation and use
of airport resources with respect to the amount of equipment, supplies and personnel that
are or should be available to address the impact snow and ice can have on airport
systems. Given their limited resources, it is essential that airports appropriately manage
these resources, ensure coordination of systems, apply appropriate engineering principles,
and prevent a collapse of the expected, if not required, level of service. The cost of being
6
unprepared for a snow and ice storm can be quite high, but judgments must be made with
regard to the amount of investment appropriate for an airport to be well equipped for an
unusually large snow occurrence.
1.3 Purpose and Objective
The purpose of this thesis is to assist airports in determining whether they are
appropriately managing their snow and ice removal resources and applying engineering
best practices. To achieve this objective, this purpose will:
• Analyze information from Philadelphia International Airport, Boston Logan
International Airport, Frankfurt International Airport, and Vienna International
Airport.
• Tabulate average snowfall for the airports with an inventory of equipment and
man power available to address the problems generated by the average
snowstorm.
• Consider what can or should be done to prepare for exceptional circumstances and
analyze whether or not the airports are appropriately, under-, or over-prepared in
being able to manage crisis level snow removal.
• Provide a basis that can potentially assist these and other airports in determining
whether they are correctly or under managing their winter resources.
7
1.4 Scope of the Work
This work covers airports that, from the passengers’ perspective, have similar
levels of service in coping with and maintaining operations when dealing with storms
which feature snow and ice. The selected airports regularly experience snow in an
average year. The airports are also significant because each plays an important role in
contributing to and maintaining the local economy. However, due to the differences in
locations different approaches on snow removal are implemented. The analysis is focused
from the airport perspective and assumes a constant distribution pattern.
The airports are as follows:
• Philadelphia International Airport (PHL/KPHL)
• Boston Logan International Airport (BOS/KBOS)
• Frankfurt International Airport (FRA/EDDF)
• Vienna International Airport (VIE/LOWW)
The analysis in the thesis does not factor in the implications of wind and its effect
on the snow removal effort, as wind has a unique influence on the system and is case
specific. The analysis also does not take into account the quantity of wetness in the snow.
It assumes that the equipment is run at a constant level of snow removal efficiency and
that the experience of the drivers and the efficiency of the equipment, with regards to age
and make, do not have an effect on the snow removal effort. It does not differentiate
differences in the efficiency of the deicing chemicals. The analysis also does not factor in
the cost of diverting an aircraft.
8
1.5 Organization of Thesis
The thesis is organized as follows:
Chapter 1 consists of an introduction in which the background, problem
statement, purpose and objective, scope of the work, and the organization of the thesis is
identified. Chapter 1 also provides a definition of the basic terms used in the thesis.
Chapter 2 provides a literature review of the importance of snow and ice removal.
Chapter 3 provides a review of the airports together with some technical and
factual information on these airports. In addition, it describes the two different deicing
methods that are used and different snow removal vehicles that are employed. The
chapter also includes a brief summary of passenger rights in the instance of a delay.
Chapter 4 describes the procedure and methodology used in the data analysis. In
particular, it describes the various sheets of the excel model.
Chapter 5 provides the results of the excel worksheet model.
Chapter 6 summarizes the results. It provides a conclusion of the findings and
provides recommendations to airports.
1.6 Definition of Terms
Ice is the solid state of water with a density of 913 kg/m^3 (57 lb/ft^3). Compacted snow
will turn into ice when the density of compacted snow is about the same as ice.
Snow is a grouping of one or more ice grain crystals.
Dry Snow is snow that has insufficient free water to form cohesive bonding
between individual particles.
9
Wet Snow is snow that has enough free water to permit particles to be cohesive,
thus is easy to compact, but where there is no excess of pore water.
Compacted Snow is compressed snow that will hold together when handled.
Slush is snow that has a very high free water content, thus it takes on far more fluid
properties and water is observed when handled.
Primary Runway is a runway that is used under existing environmental conditions and
handles the majority of aircraft movements.
Secondary runway is a runway that supports the operations of the primary runway, and
thus aircraft movements are less.
Aircraft are the mobile part of the mode which traverses the medium of air.
Heavy Aircraft are aircraft capable of takeoff weights of more than 255,000
pounds whether or not they are operating at this weight during a particular phase
of flight.
Large Aircraft are aircraft of more than 41,000 pounds, maximum certificated
takeoff weight, up to 255,000 pounds.
Small Aircraft are aircraft of 41,000 pounds or less maximum certificated takeoff
weight.
[4] [11]
10
Chapter 2
2. LITERATURE REVIEW
The need for snow and ice removal during and after a winter storm is absolutely
required for safe operations of an airport and the aircraft which it handles. On one hand,
airports and airlines follow the business model, which encourages them to operate to
generate revenue, and this creates a desire to have the system in operation and not to shut
down. On the other hand, airports and airlines must consider the paramount factor of
providing safety and not taking unnecessary risks, which indirectly affects the desirability
for the air carrier or airport to be used. Air carriers and airports carry the initial costs of
snow and ice removal; however, the secondary effects are put on the users.
Research on snow and ice removal has been done in the past, however with
different methodology and inputs fields. This paper builds on previous research and
includes delay associated with air freight and compares European and American airport
snow and ice removal practices. Changes to policies and procedures over the years have
altered many of the parameters used in past studies. In addition to the changes of demand
and inflation, there are new safety regulations which have been introduced by the FAA to
accommodate new types of aircraft. Environmental policies have also been changed by
the EPA which have altered the chemicals used for snow and ice removal. [12]
2.1 Cost Reduction
The reduction of delays at the airport and to the air cargo is very important to
reduce costs and as the saying goes, “time is money”. Keeping the system going in a
11
winter storm is crucial to reducing costs and prioritization is the key. The total cost of
snow removal is ultimately put on to the users. The airport initially caries all the initial
costs but factors the costs to the air carriers in the form of landing fees, and they, in turn,
integrate the costs in the ticket price to the users. [13]
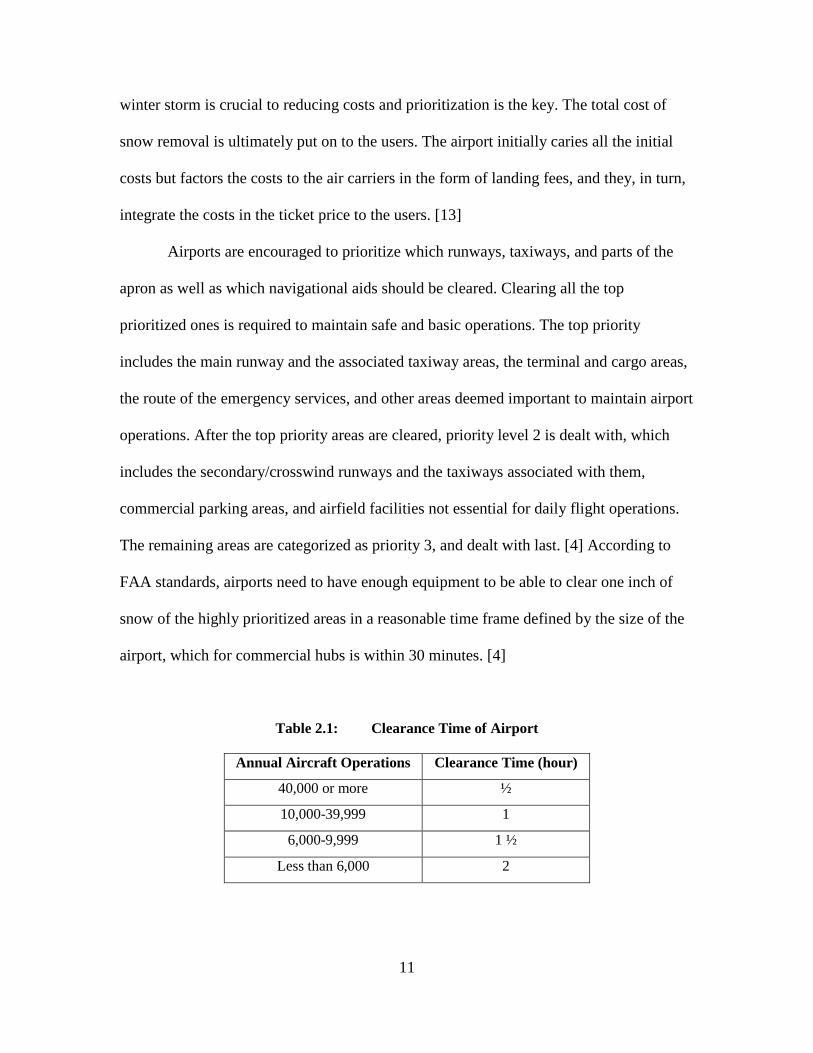
Airports are encouraged to prioritize which runways, taxiways, and parts of the
apron as well as which navigational aids should be cleared. Clearing all the top
prioritized ones is required to maintain safe and basic operations. The top priority
includes the main runway and the associated taxiway areas, the terminal and cargo areas,
the route of the emergency services, and other areas deemed important to maintain airport
operations. After the top priority areas are cleared, priority level 2 is dealt with, which
includes the secondary/crosswind runways and the taxiways associated with them,
commercial parking areas, and airfield facilities not essential for daily flight operations.
The remaining areas are categorized as priority 3, and dealt with last. [4] According to
FAA standards, airports need to have enough equipment to be able to clear one inch of
snow of the highly prioritized areas in a reasonable time frame defined by the size of the
airport, which for commercial hubs is within 30 minutes. [4]
Table 2.1: Clearance Time of Airport
Annual Aircraft Operations Clearance Time (hour)
40,000 or more ½
10,000-39,999 1
6,000-9,999 1 ½
Less than 6,000 2
12
Airports have available references which aid them on how many pieces of
equipment they should have on their premise as suggested by the FAA. [14] However,
airport mangers and airlines alike do not want negative publicity so although the
minimum specifications are meet, no airport or airlines want to be known for incurring
delays.
2.2 Safety
Snow and ice impede the performance of an aircraft and thus jeopardize its safety.
Ice on the wings and the control surfaces of an aircraft disrupt the airflow over the wings
and prevent lift from being obtained. This causes the aircraft not to be able to climb and
easy to stall and thus prone to having the pilots lose control of the aircraft and have the
aircraft crash into the terrain. Snow and ice can also impact the performance of the
navigational tools and lights on the airports by covering them up and preventing their
operational use. Snow and ice can also be thrown up by the wheels of the aircraft and
damage components of the aircraft. Snow and ice also impact the coefficient of friction
and thus impact the ability of the aircraft to accelerate and decelerate as well as impact
the safe maneuverability of the aircraft. [4] In conditions involving ice, pilots are
instructed to increase engine thrust to maneuver over the irregularities in the surfaces. [4]
Safety at airports is quintessential. Snow and ice removal is encouraged to take
place as quickly as possible and to provide minimal hazards. Irrelevant to the situation,
the airport should handle the snow and ice in a similar way as if it were on a wet surface.
[4] To provide such standards, airports are encouraged to have a high standard of care by
providing state-of-the-art snow and ice removal equipment and techniques and having
13
competent crews. [4] Airports are encouraged to have snow and ice control plans (SICP)
which document the procedure to prepare for winter storms before the season, how to
deal with the storm when it is at the doorstep, and finally how to deal with the post storm
effects, in addition to meetings to assess the storm and the season. [4] [15]
With regards to winter storms, airports need to decide many aspects and ensure
former practices are still up to the current standards. They need to designate which areas
should be prioritized, and where the snow should be moved to. They also need to decide
whether modernization and expansion of the snow and ice removal equipment should be
undertaken. Reiterating the training of the personnel in snow and ice removal procedures
and with the equipment is also critical. Airports need to understand and know the proper
communications methods with the control tower to ensure safe and effective operations.
[4] [16] In addition to clearing the runways, taxiways, and apron during a snow storm,
airports also need to ensure that the signage of the taxiways is clear to ensure safe
operations, and to prevent runway incursions.
In preparing for the winter, air carriers need to review their deicing programs
from the previous season and make appropriate changes. They also may need to alter
schedules to accommodate for the deicing procedures, and yet generate revenue by
keeping the time that the aircraft is on the ground to a minimum. [4]
During winter storms airports need to monitor the surroundings. Attention is paid
to the weather radars, to observe location and intensity of precipitations, and to observe
the trends over time. [4] Attention is also paid to both the air temperature, to determine
whether conditions exist which could yield snow and ice, as well as the ground
temperature, to determine the how precipitation would interact with the ground. [2]
14
Improper snow removal from a runway or taxiway lights would constitute a major safety
hazard and thus render the runway or taxiway inoperable. [13] This is because falling
snow melts on the warm LED lights, and then freezes creating an ice layer which affects
the way the light is emitted. [2] This in turn means that the orientation is affected and safe
operations cannot be guaranteed.
2.3 Summary of Chapter 2
Although the clearing and removal of snow and ice is costly and takes time, it is
far less expensive than the alternative costs of human lives and loss of air freight. For this
reason, having safe operations of airports and air carriers is critical. Although the initial
costs of snow and ice removal involve the equipment, the chemicals, and the personnel,
there are further costs associated with the delay to the user of the air network; the
passenger and the air freight. These costs are ever changing as more and more people and
businesses resort to air travel and new technologies are introduced. Thus optimization of
snow and ice removal is needed and the values of delays are ever changing.
15
Chapter 3
3. DATA COLLECTION AND REDUCTION
This chapter reports on the findings uncovered by research of the relevant airports
and their deicing and snow removal methods. To better understand snow and ice removal
strategies, data was obtained from the four airports and analyzed. This chapter describes
the use of an excel workbook and the inputs to worksheets within the excel workbook
which was used to analyze the data. The chapter first describes the airports on which the
research is focused. This is followed by a description of the deicing and snow clearing
methods. Finally the chapter includes a brief narrative on European and American
legislation with regard to delays.
3.1 Introduction to the Airports Studied in this Thesis
Airports are a vital terminal node in the aviation mode of transportation. At the
bare minimum they consist of a landing strip, a runway. More complex airports include
hangers, communication equipment, a tower to monitor movement in the sky and on the
ground, terminals, and pre-flight preparation areas (such as deicing pads). Larger airports
can handle large aircraft capable of transporting over 500 passengers and over 600 metric
tons of freight.
Maintaining an overall situational awareness is imperative for an operating airport
to safely operate. Airport administrators need to exercise oversight over numerous
aspects external to the airport property such as the surrounding airspace, landings, and
departures, as well as to exercise oversight on aspects located on airport property, such as
16
flight operations and safety. [4] Technologies which include radar (air and ground)
contribute to maintaining overall situational awareness and radio communication is
mandatory to establish communication between parties on the ground and in the air. In
the rare case of emergencies, radio frequencies are reserved, so that all vehicles
associated with the recovery can communicate on one channel without excess radio
chatter. [2]
3.1.1 Philadelphia
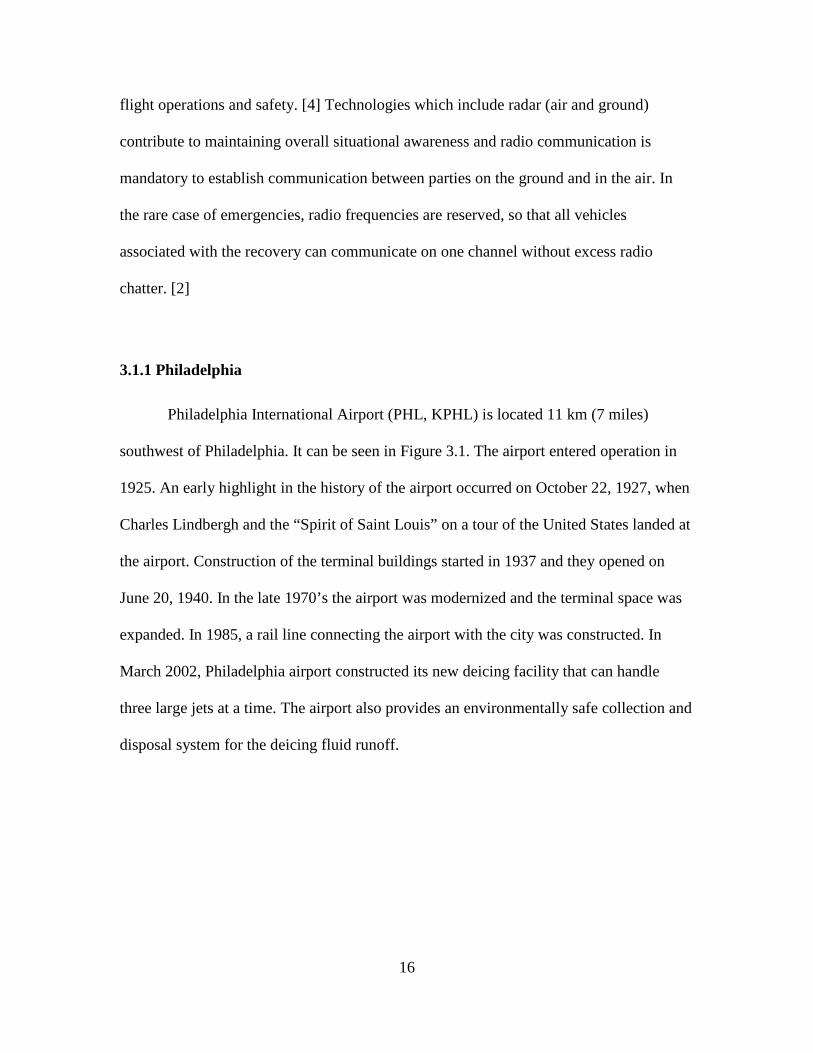
Philadelphia International Airport (PHL, KPHL) is located 11 km (7 miles)
southwest of Philadelphia. It can be seen in Figure 3.1. The airport entered operation in
1925. An early highlight in the history of the airport occurred on October 22, 1927, when
Charles Lindbergh and the “Spirit of Saint Louis” on a tour of the United States landed at
the airport. Construction of the terminal buildings started in 1937 and they opened on
June 20, 1940. In the late 1970’s the airport was modernized and the terminal space was
expanded. In 1985, a rail line connecting the airport with the city was constructed. In
March 2002, Philadelphia airport constructed its new deicing facility that can handle
three large jets at a time. The airport also provides an environmentally safe collection and
disposal system for the deicing fluid runoff.
17
Figure 3.1: Ariel View of Philadelphia International Airport
(©2012 Google, ©2012 Europa Technologies)
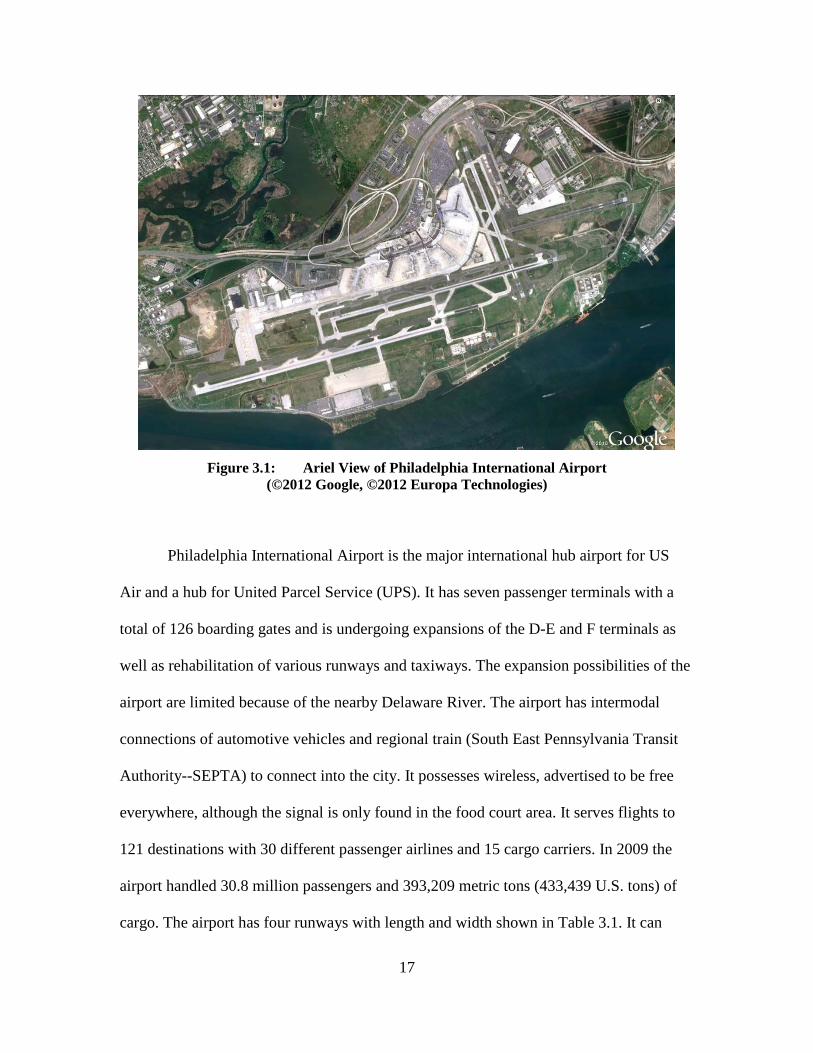
Philadelphia International Airport is the major international hub airport for US
Air and a hub for United Parcel Service (UPS). It has seven passenger terminals with a
total of 126 boarding gates and is undergoing expansions of the D-E and F terminals as
well as rehabilitation of various runways and taxiways. The expansion possibilities of the
airport are limited because of the nearby Delaware River. The airport has intermodal
connections of automotive vehicles and regional train (South East Pennsylvania Transit
Authority--SEPTA) to connect into the city. It possesses wireless, advertised to be free
everywhere, although the signal is only found in the food court area. It serves flights to
121 destinations with 30 different passenger airlines and 15 cargo carriers. In 2009 the
airport handled 30.8 million passengers and 393,209 metric tons (433,439 U.S. tons) of
cargo. The airport has four runways with length and width shown in Table 3.1. It can
18
handle a maximum of about 465,000 flight movements per year. The deicing pads are
located on the western side of the airport. [17] [18]
Table 3.1: Runways at Philadelphia International Airport
Runway Length Width
Rwy 8/26 1,524m (5,000ft) 46m (150ft)
Rwy 9L/27R 3202m (10,506ft) 61m (200ft)
Rwy 9R/27L 2896m (9,500ft) 46m (150ft)
Rwy 17/35 1664m (5460ft) 46m(150ft)
3.1.2 Boston
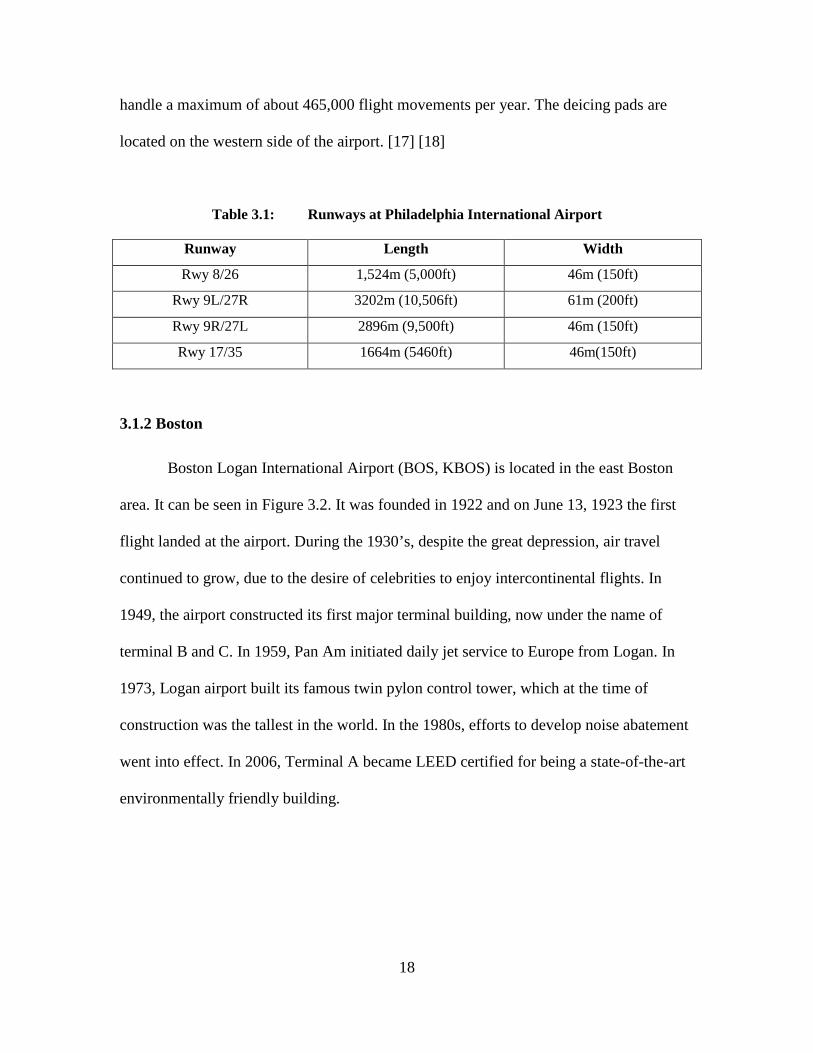
Boston Logan International Airport (BOS, KBOS) is located in the east Boston
area. It can be seen in Figure 3.2. It was founded in 1922 and on June 13, 1923 the first
flight landed at the airport. During the 1930’s, despite the great depression, air travel
continued to grow, due to the desire of celebrities to enjoy intercontinental flights. In
1949, the airport constructed its first major terminal building, now under the name of
terminal B and C. In 1959, Pan Am initiated daily jet service to Europe from Logan. In
1973, Logan airport built its famous twin pylon control tower, which at the time of
construction was the tallest in the world. In the 1980s, efforts to develop noise abatement
went into effect. In 2006, Terminal A became LEED certified for being a state-of-the-art
environmentally friendly building.
19
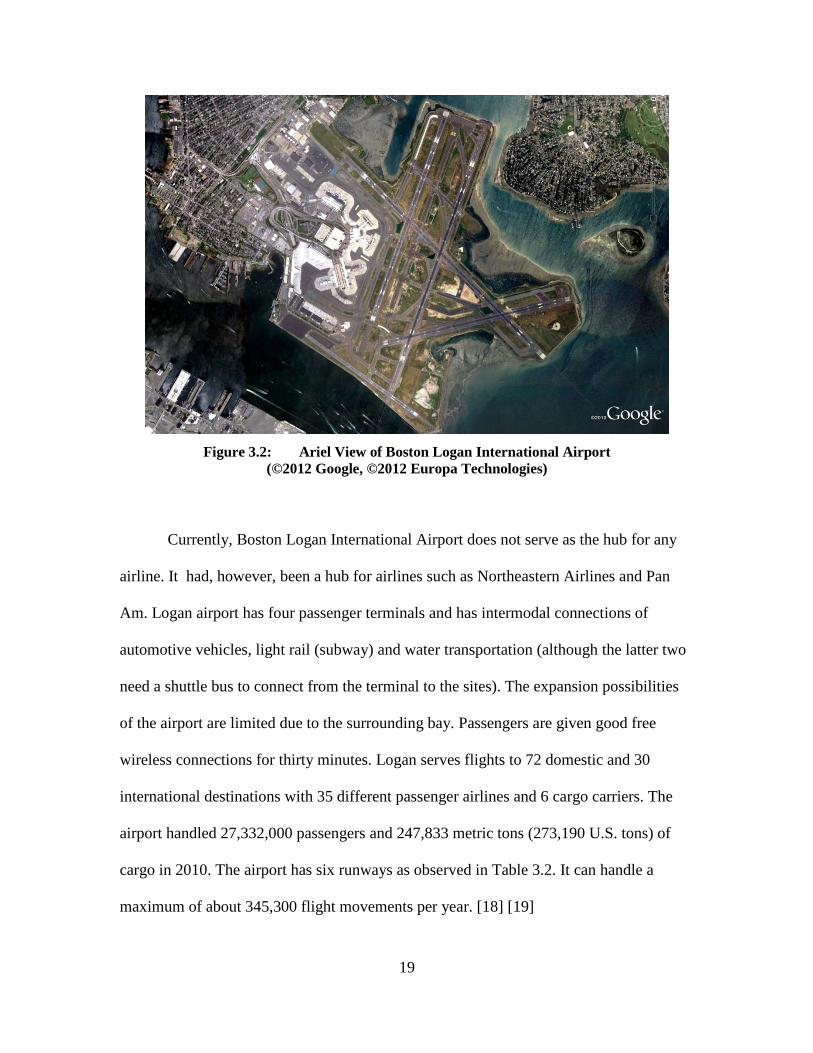
Figure 3.2: Ariel View of Boston Logan International Airport
(©2012 Google, ©2012 Europa Technologies)
Currently, Boston Logan International Airport does not serve as the hub for any
airline. It had, however, been a hub for airlines such as Northeastern Airlines and Pan
Am. Logan airport has four passenger terminals and has intermodal connections of
automotive vehicles, light rail (subway) and water transportation (although the latter two
need a shuttle bus to connect from the terminal to the sites). The expansion possibilities
of the airport are limited due to the surrounding bay. Passengers are given good free
wireless connections for thirty minutes. Logan serves flights to 72 domestic and 30
international destinations with 35 different passenger airlines and 6 cargo carriers. The
airport handled 27,332,000 passengers and 247,833 metric tons (273,190 U.S. tons) of
cargo in 2010. The airport has six runways as observed in Table 3.2. It can handle a
maximum of about 345,300 flight movements per year. [18] [19]
20
Table 3.2: Runways at Boston Logan International Airport
Runway Length Width
Rwy 4L/22R 2,396m (7,861ft) 46m (150ft)
Rwy 4R/22L 3,050m (10,005ft) 46m (150ft)
Rwy 9/27 2,134m (7,000ft) 46m (150ft)
Rwy 14/32 1,524m (5,000ft) 30m(100ft)
Rwy 15L/33R 779m (2,557ft) 30m(100ft)
Rwy 15R/33L 3,073m (10,083ft) 46m (150ft)
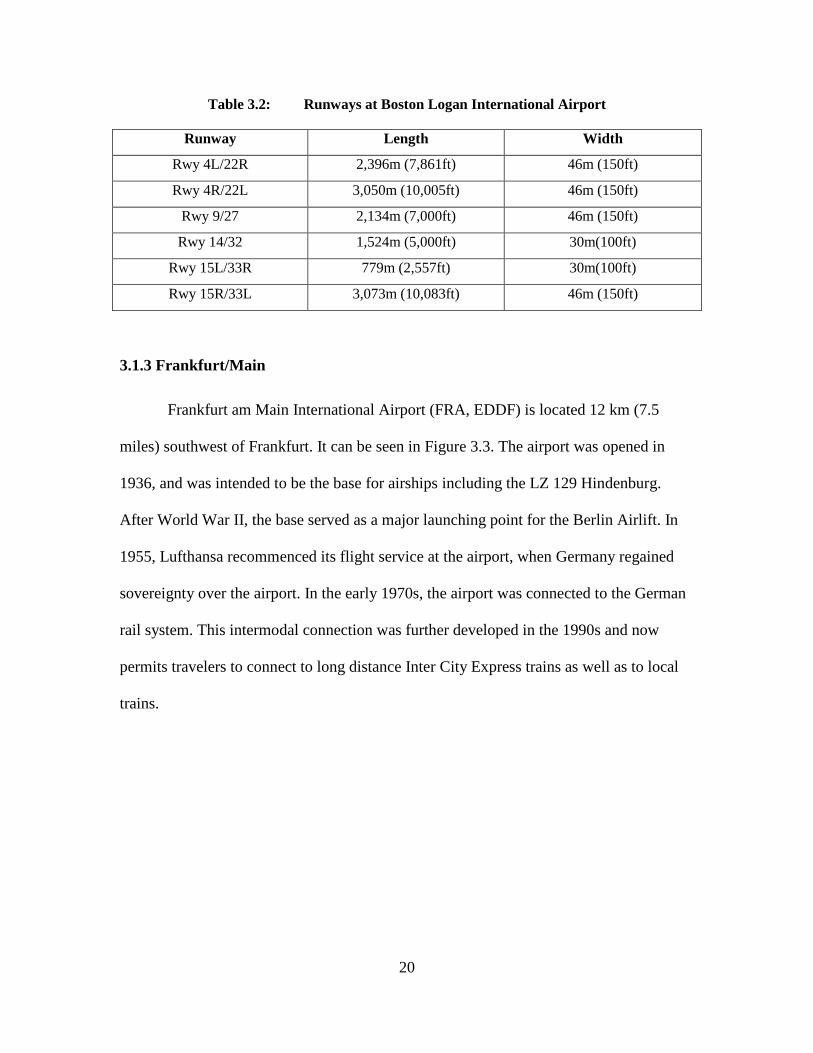
3.1.3 Frankfurt/Main
Frankfurt am Main International Airport (FRA, EDDF) is located 12 km (7.5
miles) southwest of Frankfurt. It can be seen in Figure 3.3. The airport was opened in
1936, and was intended to be the base for airships including the LZ 129 Hindenburg.
After World War II, the base served as a major launching point for the Berlin Airlift. In
1955, Lufthansa recommenced its flight service at the airport, when Germany regained
sovereignty over the airport. In the early 1970s, the airport was connected to the German
rail system. This intermodal connection was further developed in the 1990s and now
permits travelers to connect to long distance Inter City Express trains as well as to local
trains.
21
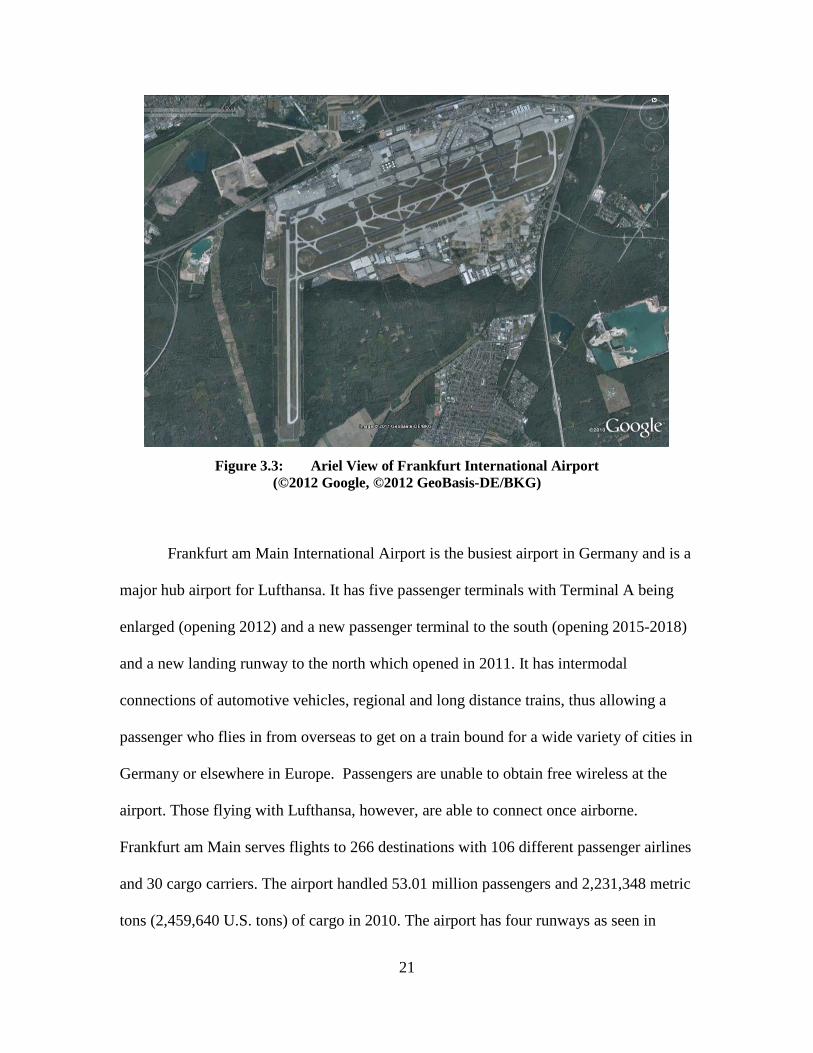
Figure 3.3: Ariel View of Frankfurt International Airport
(©2012 Google, ©2012 GeoBasis-DE/BKG)
Frankfurt am Main International Airport is the busiest airport in Germany and is a
major hub airport for Lufthansa. It has five passenger terminals with Terminal A being
enlarged (opening 2012) and a new passenger terminal to the south (opening 2015-2018)
and a new landing runway to the north which opened in 2011. It has intermodal
connections of automotive vehicles, regional and long distance trains, thus allowing a
passenger who flies in from overseas to get on a train bound for a wide variety of cities in
Germany or elsewhere in Europe. Passengers are unable to obtain free wireless at the
airport. Those flying with Lufthansa, however, are able to connect once airborne.
Frankfurt am Main serves flights to 266 destinations with 106 different passenger airlines
and 30 cargo carriers. The airport handled 53.01 million passengers and 2,231,348 metric
tons (2,459,640 U.S. tons) of cargo in 2010. The airport has four runways as seen in
22
Table 3.3. Under optimal conditions the airport can handle about 464,500 flight
movements per year and a maximum of 126 flight movements per hour. There are
currently 216 parking locations, however, more spaces are being constructed. [9] [18]
Table 3.3: Runways at Frankfurt International Airport
Runway Length Width
Rwy 07C/25C 4,000m (13,123ft) 60m (197ft)
Rwy 07R/25L 4,000m (13,123ft) 45m (148ft) wide with 7.5m
(25ft) shoulders
Rwy18 4,000m (13,123ft) 45m (148ft) wide with 7.5m
(25ft) shoulders
Rwy 07L/25R 2,800m (9,186ft)
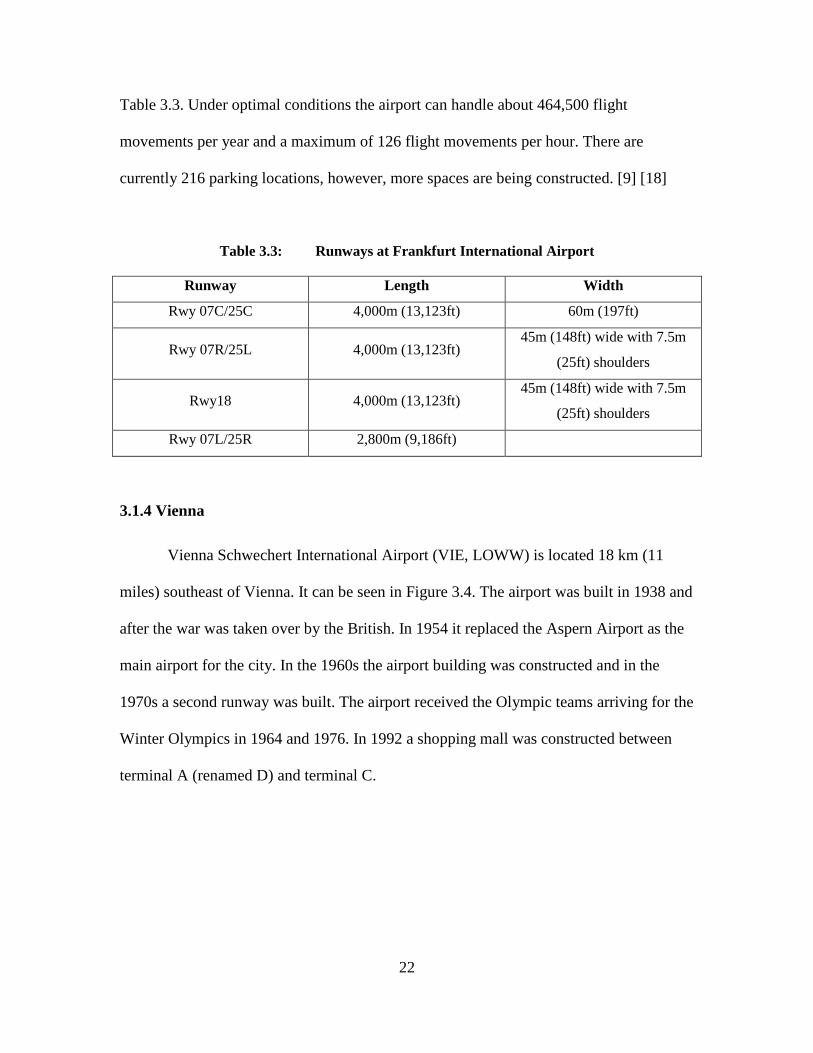
3.1.4 Vienna
Vienna Schwechert International Airport (VIE, LOWW) is located 18 km (11
miles) southeast of Vienna. It can be seen in Figure 3.4. The airport was built in 1938 and
after the war was taken over by the British. In 1954 it replaced the Aspern Airport as the
main airport for the city. In the 1960s the airport building was constructed and in the
1970s a second runway was built. The airport received the Olympic teams arriving for the
Winter Olympics in 1964 and 1976. In 1992 a shopping mall was constructed between
terminal A (renamed D) and terminal C.
23
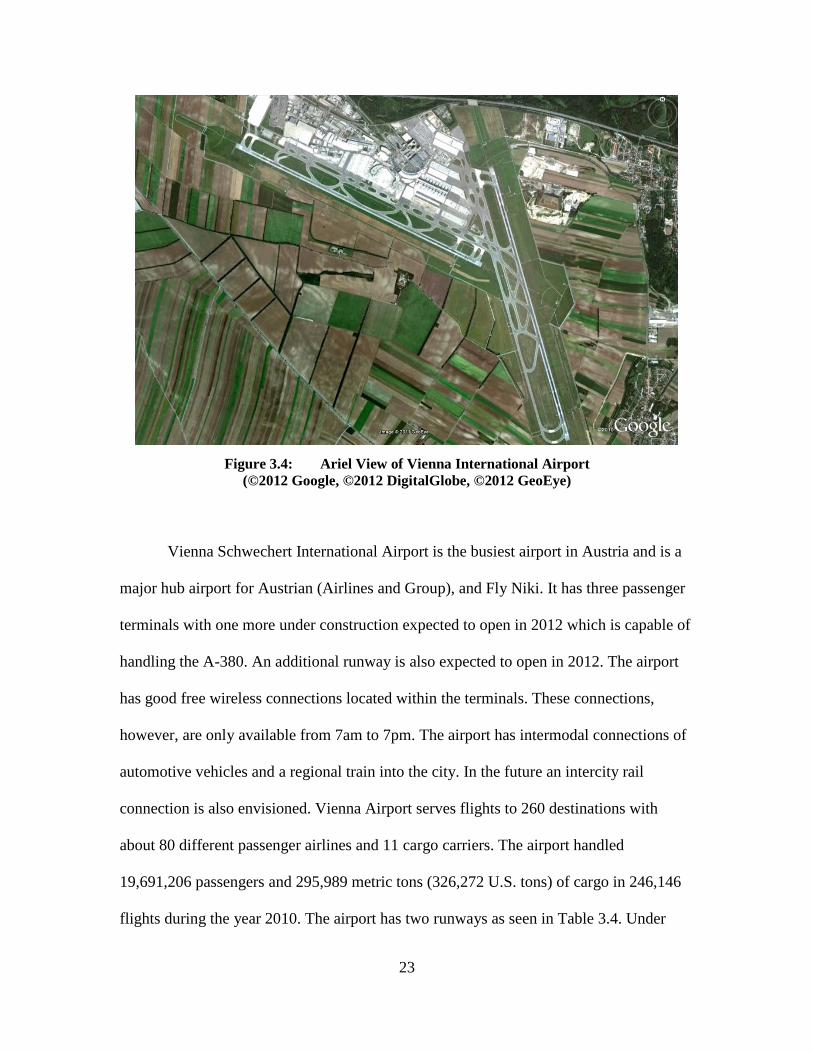
Figure 3.4: Ariel View of Vienna International Airport
(©2012 Google, ©2012 DigitalGlobe, ©2012 GeoEye)
Vienna Schwechert International Airport is the busiest airport in Austria and is a
major hub airport for Austrian (Airlines and Group), and Fly Niki. It has three passenger
terminals with one more under construction expected to open in 2012 which is capable of
handling the A-380. An additional runway is also expected to open in 2012. The airport
has good free wireless connections located within the terminals. These connections,
however, are only available from 7am to 7pm. The airport has intermodal connections of
automotive vehicles and a regional train into the city. In the future an intercity rail
connection is also envisioned. Vienna Airport serves flights to 260 destinations with
about 80 different passenger airlines and 11 cargo carriers. The airport handled
19,691,206 passengers and 295,989 metric tons (326,272 U.S. tons) of cargo in 246,146
flights during the year 2010. The airport has two runways as seen in Table 3.4. Under
24
optimal conditions it can handle a maximum of 68 flight movements per hour, about
246,000 per year. There are 61 commercial parking locations. The deicing pads are
located on the eastern side of the apron. [10]
Table 3.4: Runways at Vienna International Airport
Runway Length Width
Rwy 16/34 3,600m (11,800ft) 45m (148ft) wide with 7.5m
(25ft) shoulders
Rwy 11/29 3,500m (11,500ft) 45m (148ft) wide with 7.5m
(25ft) shoulders
3.1.5 Comparison of the four Airports
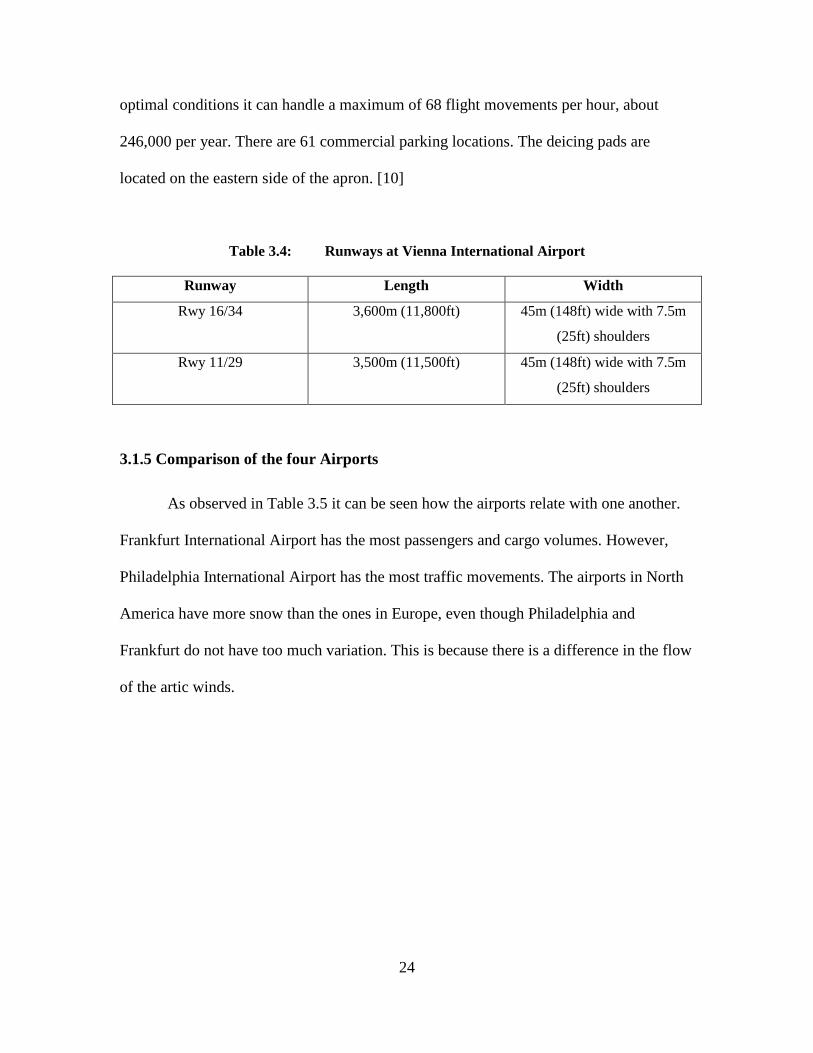
As observed in Table 3.5 it can be seen how the airports relate with one another.
Frankfurt International Airport has the most passengers and cargo volumes. However,
Philadelphia International Airport has the most traffic movements. The airports in North
America have more snow than the ones in Europe, even though Philadelphia and
Frankfurt do not have too much variation. This is because there is a difference in the flow
of the artic winds.
25
Table 3.5: Airport Summary Data
Philadelphia Boston Frankfurt Vienna
Number of
Runways 4 6 4 2
Passengers 30.8 million 27.3 million 53.01 million 19.7 million
Cargo
393,209 metric
tons (433,439
U.S. tons)
247,833 metric
tons (273,190
U.S. tons)
2,231,348 metric
tons (2,459,640
U.S. tons)
295,989 metric
tons (326,272
U.S. tons)
Flights 465,000 345,300 464,500 246,000
Average Annual
Snowfall 38 cm (15 in) 82 cm (32 in) 31 cm (12 in) 22 cm (8 in)
[20]
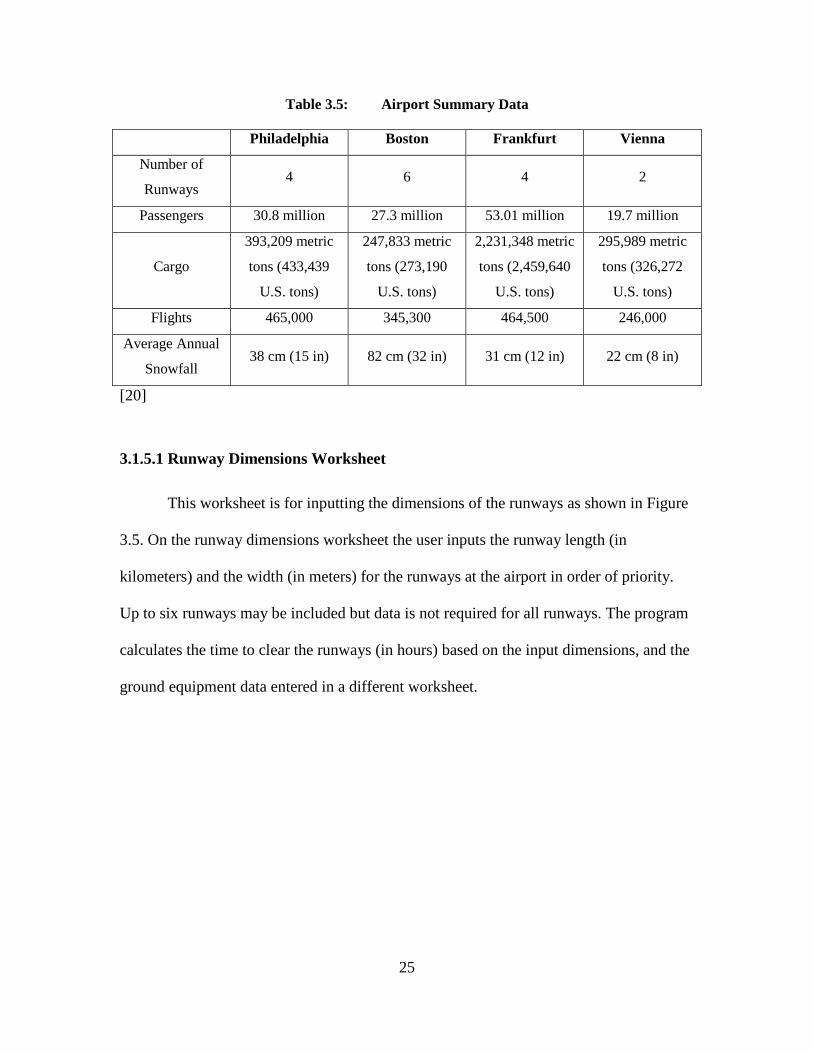
3.1.5.1 Runway Dimensions Worksheet
This worksheet is for inputting the dimensions of the runways as shown in Figure
3.5. On the runway dimensions worksheet the user inputs the runway length (in
kilometers) and the width (in meters) for the runways at the airport in order of priority.
Up to six runways may be included but data is not required for all runways. The program
calculates the time to clear the runways (in hours) based on the input dimensions, and the
ground equipment data entered in a different worksheet.
26
Figure 3.5: Runway Dimension Worksheet
27
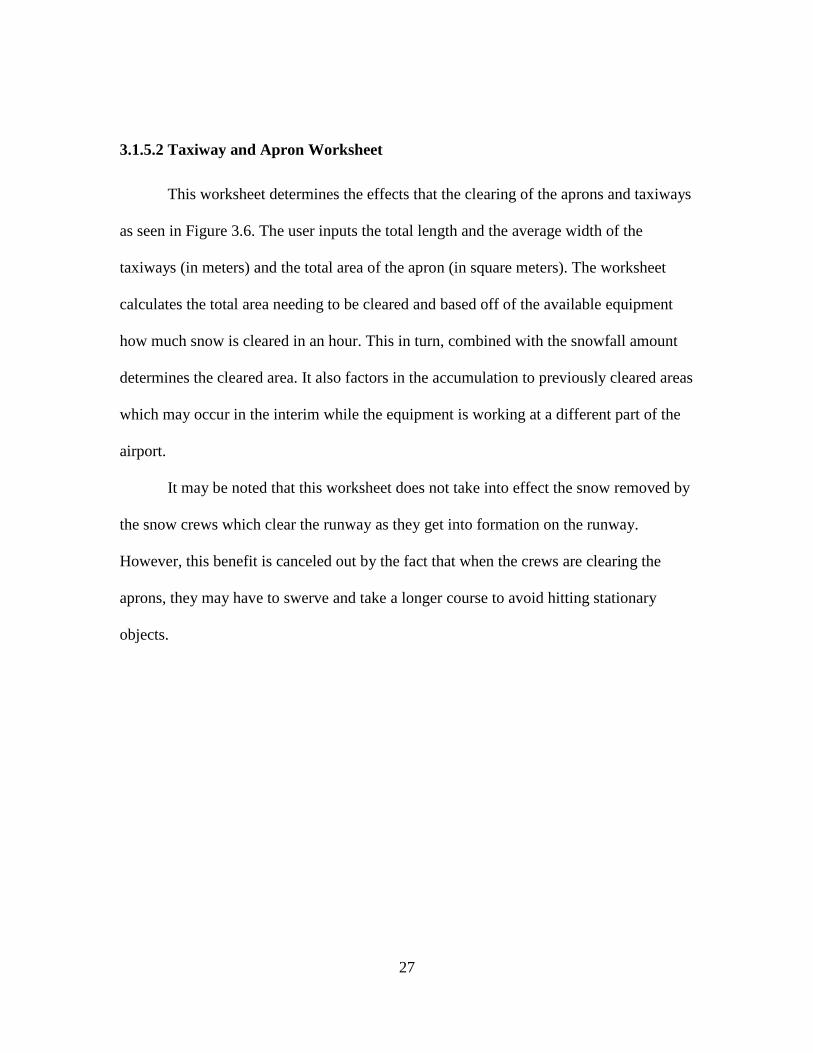
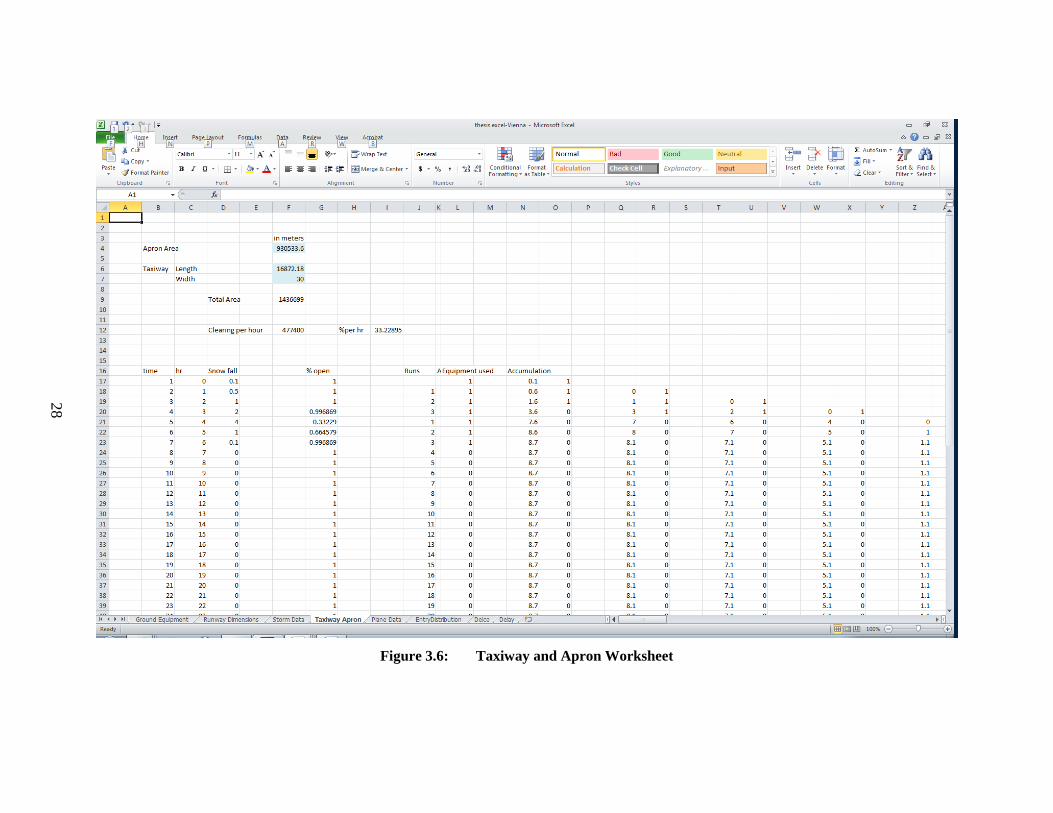
3.1.5.2 Taxiway and Apron Worksheet
This worksheet determines the effects that the clearing of the aprons and taxiways
as seen in Figure 3.6. The user inputs the total length and the average width of the
taxiways (in meters) and the total area of the apron (in square meters). The worksheet
calculates the total area needing to be cleared and based off of the available equipment
how much snow is cleared in an hour. This in turn, combined with the snowfall amount
determines the cleared area. It also factors in the accumulation to previously cleared areas
which may occur in the interim while the equipment is working at a different part of the
airport.
It may be noted that this worksheet does not take into effect the snow removed by
the snow crews which clear the runway as they get into formation on the runway.
However, this benefit is canceled out by the fact that when the crews are clearing the
aprons, they may have to swerve and take a longer course to avoid hitting stationary
objects.
28
Figure 3.6: Taxiway and Apron Worksheet
29
3.2 Snow Clearing Equipment
Clearing snow and ice off of a taxiway or runway is essential in permitting an
aircraft to safely operate, take off and land. If an aircraft is unable to obtain a safe friction
factor with the tarmac the aircraft is prone to slipping off of the contaminated surface,
mainly due to the large thrust forces generated by the engines, which are designed to
overcome ground friction and air resistance. Without the friction on the ground the
aircraft can only rely on its aerodynamic properties for control. However, these properties
do not work as efficiently as ground friction when the aircraft is on the tarmac. Thus it is
very important for the airport to maintain a high and safe ground friction coefficient to
enable safe movements of the aircraft while at the airport.
A runway that is contaminated with snow and ice greatly hinders the safe
operations of the aircraft. Most importantly, snow and ice reduce the friction between the
craft and the ground, which when an aircraft is trying to land, greatly compromises the
effectiveness of the brakes on the tires. A contaminated runway may also result in having
the contaminants on the runway being thrown up into the surrounding environment, and
potentially into the engines by the massive forces of the engines. This can lead to snow
and ice decreasing the performance of the engine, which is critical if an aircraft is
departing.
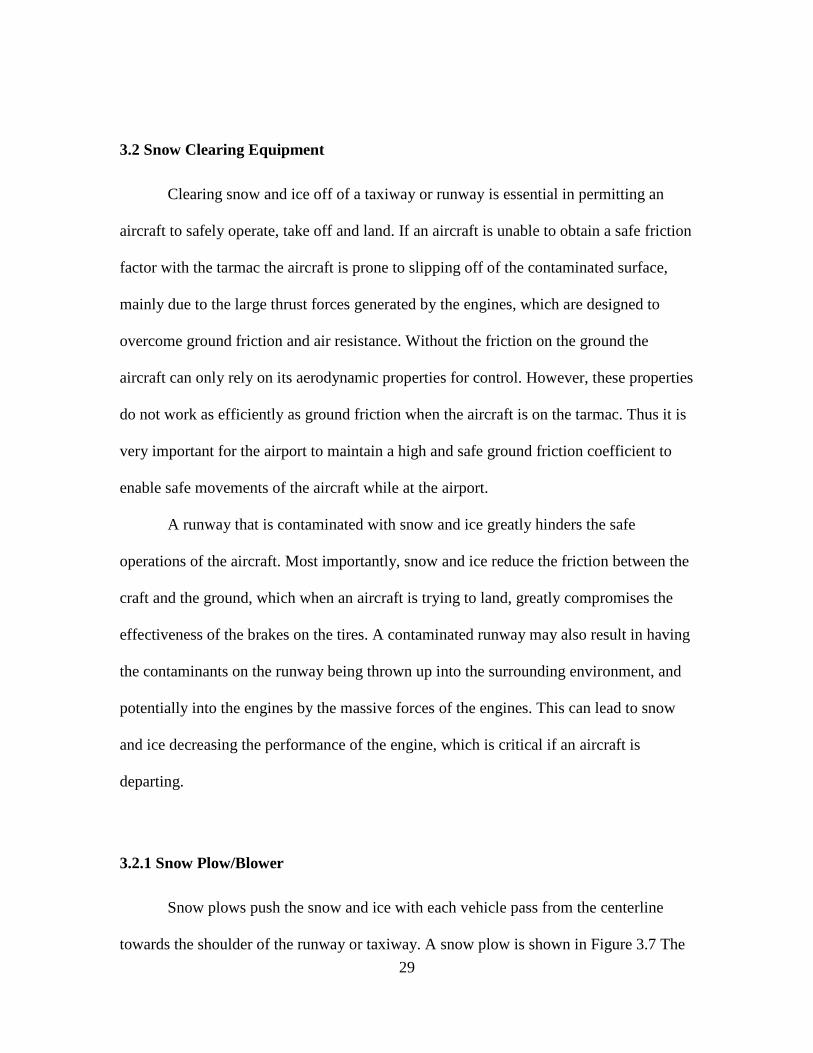
3.2.1 Snow Plow/Blower
Snow plows push the snow and ice with each vehicle pass from the centerline
towards the shoulder of the runway or taxiway. A snow plow is shown in Figure 3.7 The
30
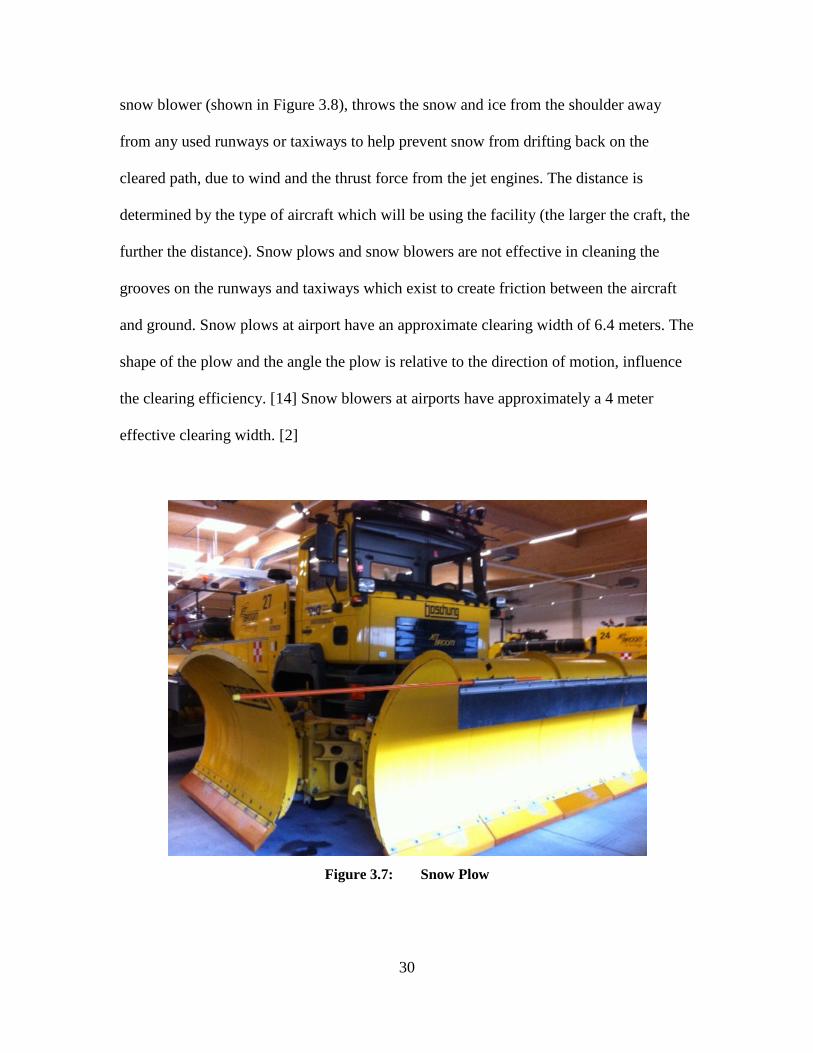
snow blower (shown in Figure 3.8), throws the snow and ice from the shoulder away
from any used runways or taxiways to help prevent snow from drifting back on the
cleared path, due to wind and the thrust force from the jet engines. The distance is
determined by the type of aircraft which will be using the facility (the larger the craft, the
further the distance). Snow plows and snow blowers are not effective in cleaning the
grooves on the runways and taxiways which exist to create friction between the aircraft
and ground. Snow plows at airport have an approximate clearing width of 6.4 meters. The
shape of the plow and the angle the plow is relative to the direction of motion, influence
the clearing efficiency. [14] Snow blowers at airports have approximately a 4 meter
effective clearing width. [2]
Figure 3.7: Snow Plow
31
Figure 3.8: Snow Blower
3.2.2 Snow Broom
The snow broom is part of an airport’s snow removal equipment. It works by
having a rotating circular broom brush compacted snow and ice from grooves in the
taxiways and runways. The cleared grooves increase the friction between the aircraft and
the ground and prevent the aircraft from moving on an unintended course. The snow
broom is approximately 4 meters wide and attached to the back of the plow. The most
popular versions of the snow broom, that combine a unit with a plow, are the Boschung,
Vammas, and Hagie multifunctional vehicles. [2] [14]
32
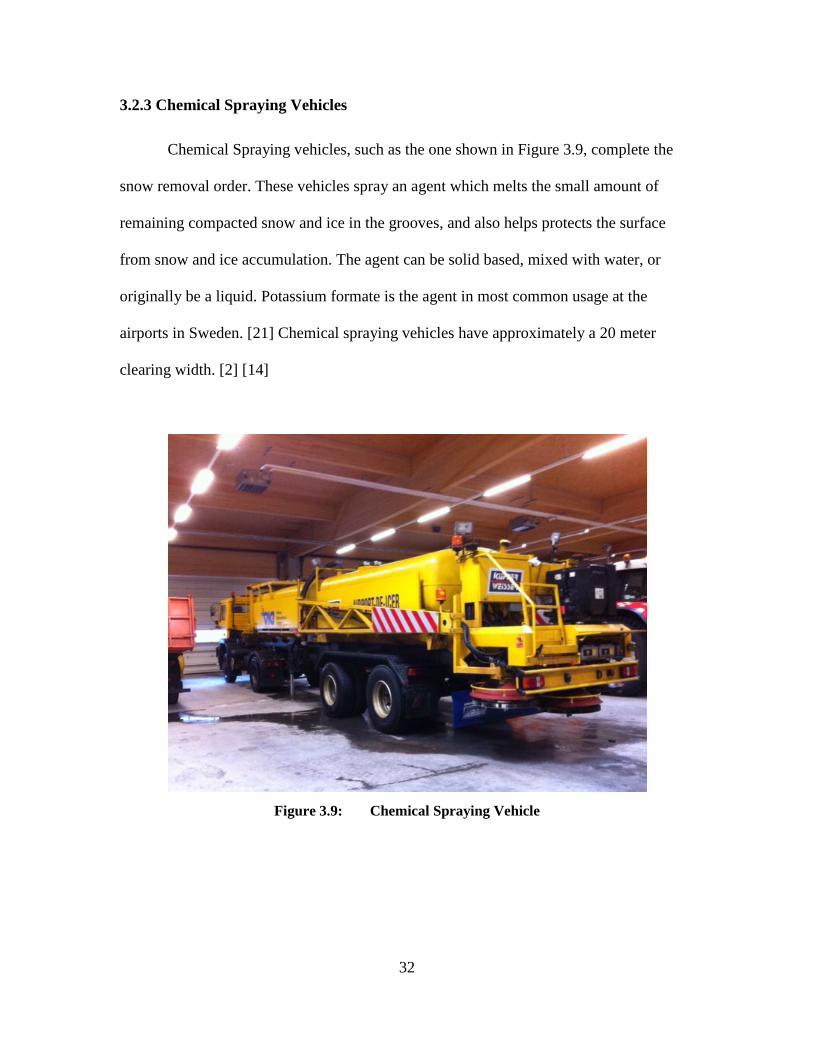
3.2.3 Chemical Spraying Vehicles
Chemical Spraying vehicles, such as the one shown in Figure 3.9, complete the
snow removal order. These vehicles spray an agent which melts the small amount of
remaining compacted snow and ice in the grooves, and also helps protects the surface
from snow and ice accumulation. The agent can be solid based, mixed with water, or
originally be a liquid. Potassium formate is the agent in most common usage at the
airports in Sweden. [21] Chemical spraying vehicles have approximately a 20 meter
clearing width. [2] [14]
Figure 3.9: Chemical Spraying Vehicle
33
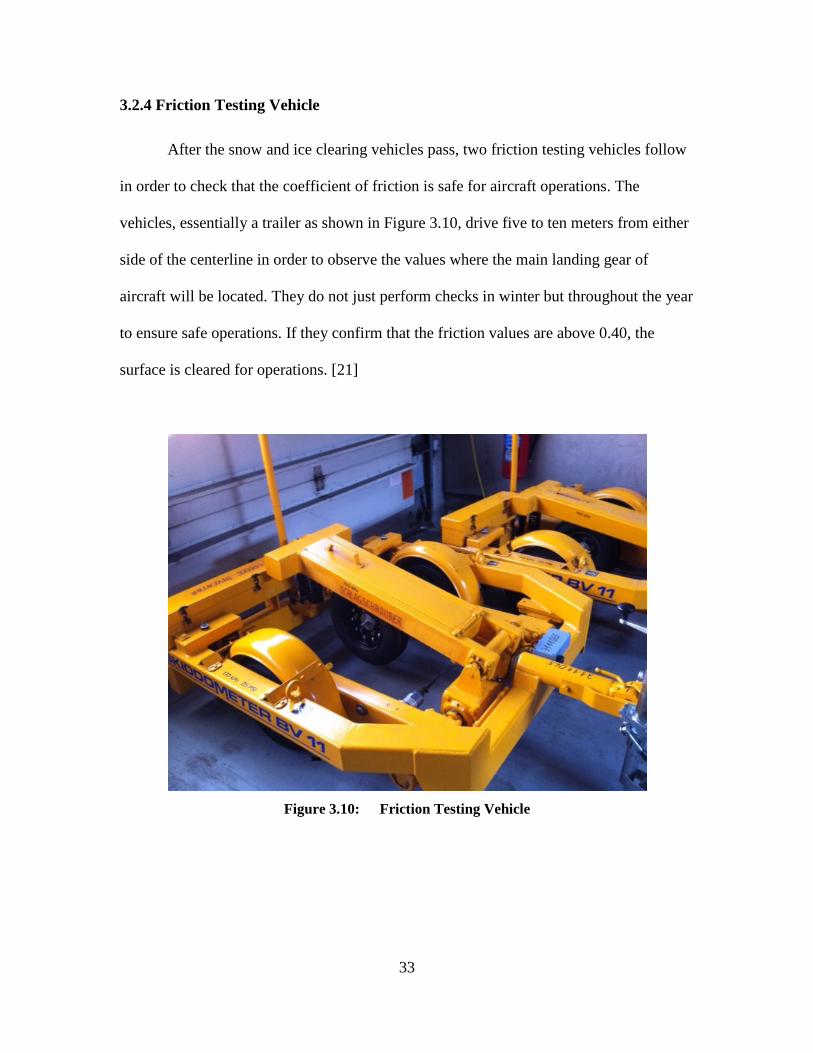
3.2.4 Friction Testing Vehicle
After the snow and ice clearing vehicles pass, two friction testing vehicles follow
in order to check that the coefficient of friction is safe for aircraft operations. The
vehicles, essentially a trailer as shown in Figure 3.10, drive five to ten meters from either
side of the centerline in order to observe the values where the main landing gear of
aircraft will be located. They do not just perform checks in winter but throughout the year
to ensure safe operations. If they confirm that the friction values are above 0.40, the
surface is cleared for operations. [21]
Figure 3.10: Friction Testing Vehicle

34
3.2.5 Snow Removal Techniques
Airports usually will split up their snow removal crews into at least two groups
such that one group is responsible for clearing the ramp areas and the other the taxiways
and runways. The ramp areas that are prioritized are the areas where the gates are located
and where aircraft are parked and prepared, as well as the areas and routes that serve the
ground vehicles responsible for the array of tasks dealing with the aircraft.
When airports designate the crews to deal with snow and ice removal, the prime
objective is to clear the primary runways and supporting taxiways of snow and ice, before
dealing with secondary and cross-wind runways. Extra care needs to be taken for high
speed taxiways, because at higher speed more friction is required in order for the aircraft
to be responsive to the pilot’s commands.
Different airports use different tactics for clearing the runways based on a
configuration of equipment. One configuration is show in Figure 3.11. These tactics can
vary from doing one half of the runway and then turning around and doing the other half,
to doing the entire runway in one sweep. Although it is faster clearing the entire runway
all at once, it requires more staff and equipment to perform. Snow clearing tactics involve
plows pushing the snow off to the side and snow blowers following behind to blow the
snow far away from the runways and taxiways. Fences to prevent the snow from drifting
back on to the runway due to the wind may also be constructed. Behind the plows and
blowers are the chemical deicing vehicles, which spray the runways to ensure all the
snow and ice is melted, and then a friction testing vehicle follows to ensure that a safe
level of friction exists. In certain circumstances, such as in freezing rain where it might
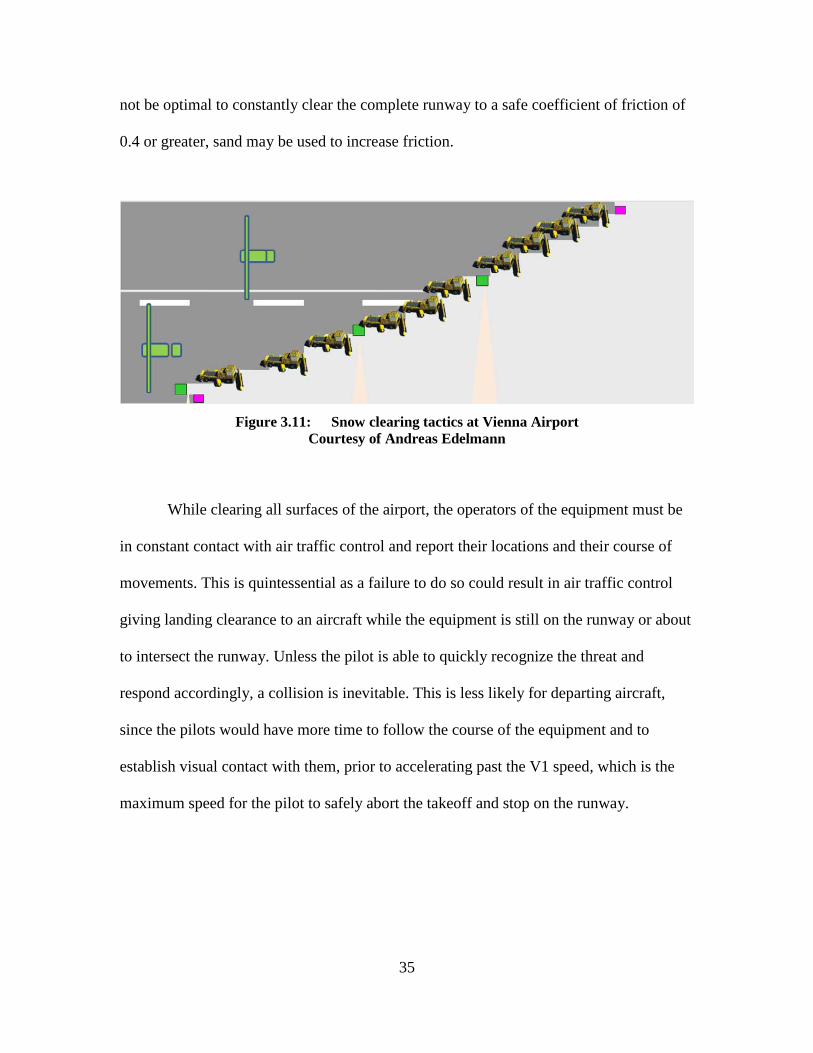
35
not be optimal to constantly clear the complete runway to a safe coefficient of friction of
0.4 or greater, sand may be used to increase friction.
Figure 3.11: Snow clearing tactics at Vienna Airport
Courtesy of Andreas Edelmann
While clearing all surfaces of the airport, the operators of the equipment must be
in constant contact with air traffic control and report their locations and their course of
movements. This is quintessential as a failure to do so could result in air traffic control
giving landing clearance to an aircraft while the equipment is still on the runway or about
to intersect the runway. Unless the pilot is able to quickly recognize the threat and
respond accordingly, a collision is inevitable. This is less likely for departing aircraft,
since the pilots would have more time to follow the course of the equipment and to
establish visual contact with them, prior to accelerating past the V1 speed, which is the
maximum speed for the pilot to safely abort the takeoff and stop on the runway.
36
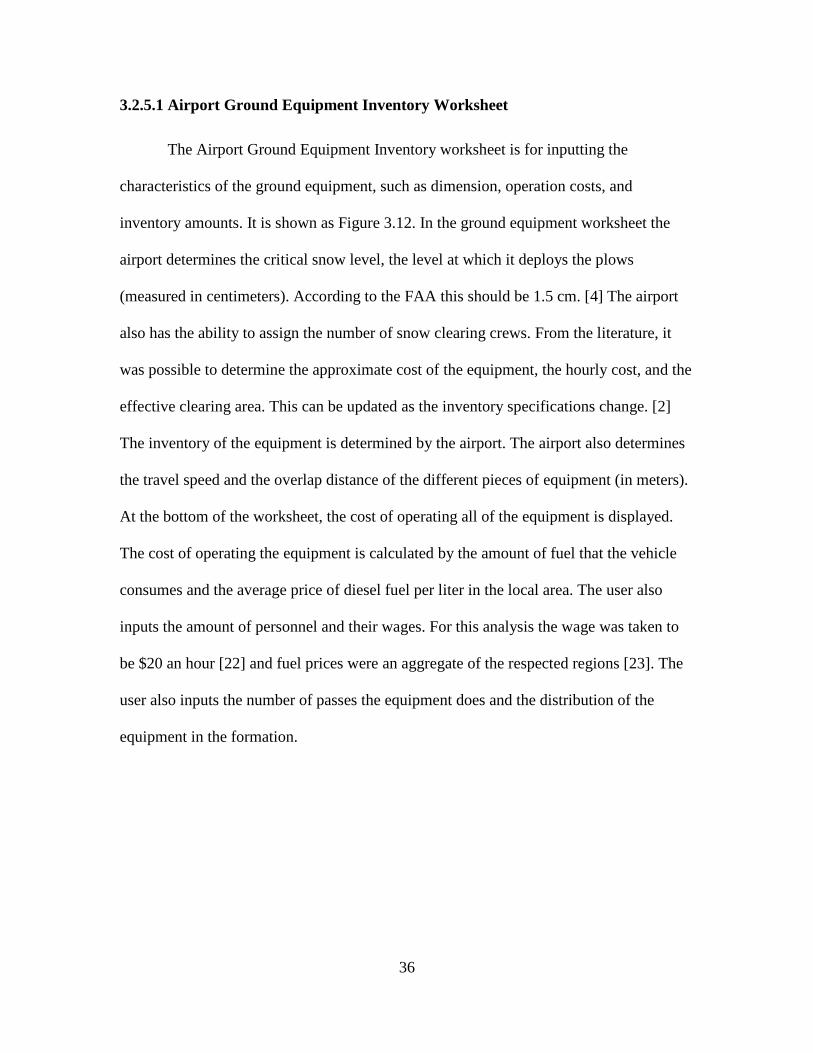
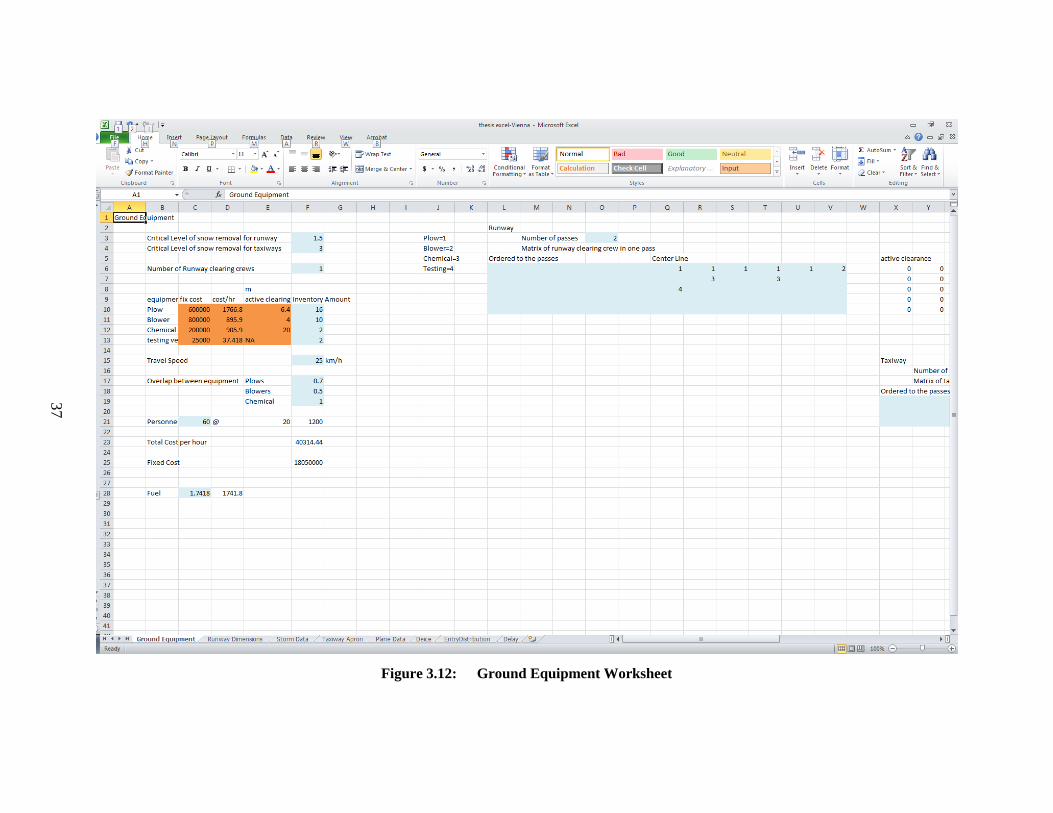
3.2.5.1 Airport Ground Equipment Inventory Worksheet
The Airport Ground Equipment Inventory worksheet is for inputting the
characteristics of the ground equipment, such as dimension, operation costs, and
inventory amounts. It is shown as Figure 3.12. In the ground equipment worksheet the
airport determines the critical snow level, the level at which it deploys the plows
(measured in centimeters). According to the FAA this should be 1.5 cm. [4] The airport
also has the ability to assign the number of snow clearing crews. From the literature, it
was possible to determine the approximate cost of the equipment, the hourly cost, and the
effective clearing area. This can be updated as the inventory specifications change. [2]
The inventory of the equipment is determined by the airport. The airport also determines
the travel speed and the overlap distance of the different pieces of equipment (in meters).
At the bottom of the worksheet, the cost of operating all of the equipment is displayed.
The cost of operating the equipment is calculated by the amount of fuel that the vehicle
consumes and the average price of diesel fuel per liter in the local area. The user also
inputs the amount of personnel and their wages. For this analysis the wage was taken to
be $20 an hour [22] and fuel prices were an aggregate of the respected regions [23]. The
user also inputs the number of passes the equipment does and the distribution of the
equipment in the formation.
37
Figure 3.12: Ground Equipment Worksheet
38
3.3 Deicing Methods
Deicing an aircraft in winter conditions is quintessential to the flight capabilities
of the aircraft. If the control surfaces of the aircraft are not properly cleared of snow and
ice, then when the aircraft takes off, the snow and ice disrupt the smooth airflow over the
wing and prevent it from obtaining lift. This results in the aircraft initially gaining some
elevation, but then causes the aircraft to shake violently and descend. It can also be hard
for the pilots to control the aircraft before it impacts the terrain.
To prevent such a scenario, aircraft are deiced. There are currently two ways of
preparing an aircraft for flight in winter by removing the snow and ice buildup on the
wing. The most common is the Glycol based deicing fluid. In recent years, however,
airports are adopting infra-red deicing, because it results in less damage to the aircraft
and to the environment. [24] Pilots are able to request that the aircraft be deiced if the
aircraft still carries fuel from its previous flight in the wing, and if that fuel has not yet
reached ambient ground temperature. Airports keep this option open until the temperature
reaches about 10C. [2]
3.3.1 Glycol Based
Glycol based deicing consists of a hot fluid combination of glycol and water.
Glycol is a deicing chemical which features two hydroxyl (-OH) groups. Glycerol is a
similar deicing chemical but feature three hydroxyl groups. The first deicing fluid was
Type I, which has a low viscosity and is only effective for short time spans, due to the
fact that the deicing fluid would quickly flow off the aircraft. Type II deicing fluid was
39
developed to prevent the fluid from flowing right off. Glycerol only begins to flow off the
aircraft once the aircraft obtains a speed of 100 knots. Type III deicing fluid was
developed to have the fluid flow off the aircraft at slower speeds, allowing it to be used
on smaller and prop aircraft. The newest type of deicing fluid is Type IV. It is the same as
Type II, except the fluid is able to remain effective for more time, which is important
considering the aircraft may be deiced at the gate and then be required to taxi for some
time before it takes off. [24] [25]
The most effective application technique is to apply the deicing fluid on the
control surface with the minimum amount of time between application and take off. For
this reason many airports have deicing pads located near the ends of runways. Although
these pads collect the deicing fluid to be recycled, glycol based deicing fluid still has
environmental impacts that occur when it falls off of a departing aircraft.
3.3.2 Infra-Red
Recently some airports such as New York JFK and Munich International are
adopting infrared de-icing, which heats the surfaces of the aircraft to melt the snow. The
process involves an aircraft taxiing onto an infra-red deicing pad and infra-red waves
coming from panels melt the snow and ice. This process does not over heat the surfaces,
however, but rather leaves them at the same temperature of a summer day. Infrared de-
icing can be performed on any size aircraft up to a Boeing 747-300 by only one operator.
Moreover, it does not require special care associated with protecting the environment as
is the case of deicing fluid. [24]
40
3.3.3 Deicing Aircraft and Cost Determination
In order to determine the most appropriate method of deicing, an airport has to
consider the volume, distribution, and size of aircraft using the airport. On the basis of
this analysis, average deicing requirements can be calculated and costs determined. To
obtain this information for the purposes of this thesis, two worksheets were developed.
One worksheet focuses on the distribution and size of the aircraft and the other worksheet
focuses on the approximate cost of deicing the average aircraft using the airport.
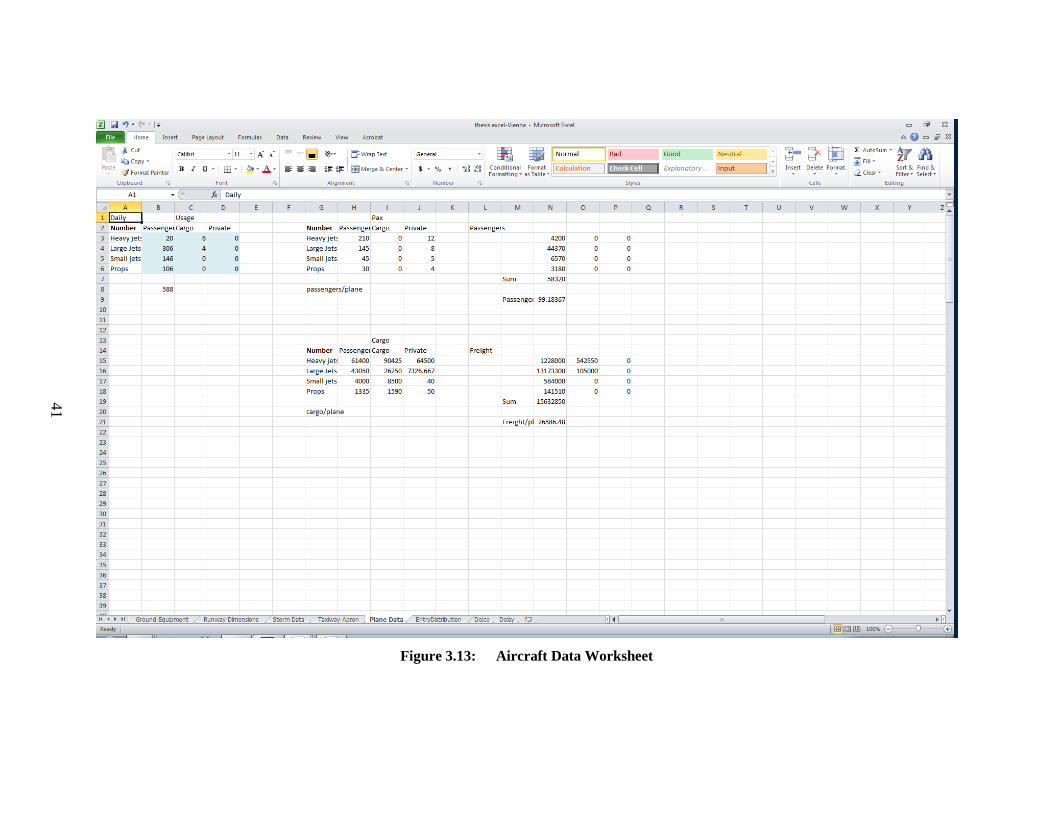
3.3.3.1 Aircraft Data Worksheet
The aircraft data worksheet has been developed to input the distribution of the
aircraft using the airport as seen in Figure 3.13 (which uses the values for Vienna
airport). The user inputs the daily distribution of aircraft types into a matrix. In the matrix
the horizontal axis is the functionality of the aircraft (commercial passenger, cargo, and
private) and on the vertical axis is the aircraft type (heavy, large, small, and turboprop).
The aircraft types were determined based off of the FAA designation of aircraft based off
of their weight classes. This matrix is based on the average flights per hour and the
passenger and cargo values per aircraft in order to determine the values that should be
associated with the average aircraft. The matrix also determines the average passenger
and cargo values per aircraft, by taking a weighted average of the different aircraft types.
The values of cargo and passengers are based off of the operating capacity of aircraft
found in the respective categories based off of FAA and manufacturers websites.
However, this does take into account the actual operating capacity of the aircraft. [26]
[27] [28] [29]
41
Figure 3.13: Aircraft Data Worksheet
42
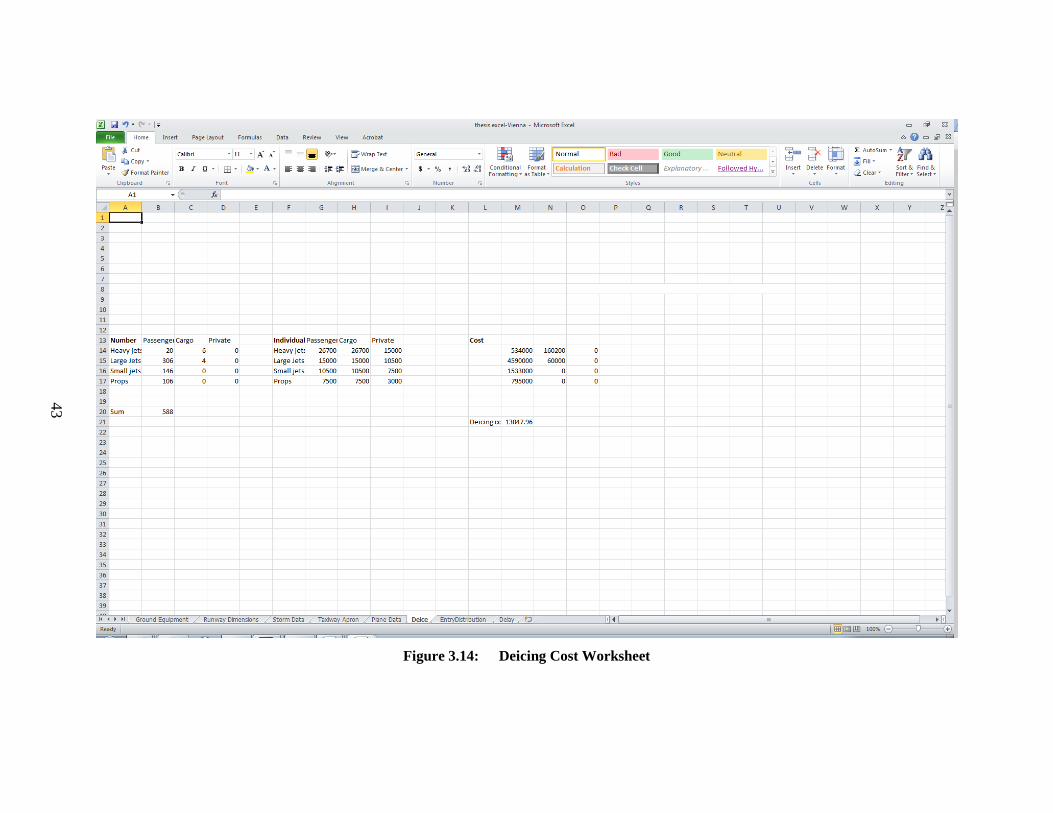
3.3.3.2 Deicing Cost Worksheet
The deicing worksheet, which is seen in Figure 3.14, is to determine the
approximate cost of deicing the average aircraft at the airport. It takes into account the
size of the aircraft in the calculations, and computes a weighted average based off of the
aircraft distribution matrix entered earlier. The costs are indirectly recovered to the
airports as the airlines pay for it in the landing fees.
The FAA recommends that holdover time, the time between application of the
chemical and the departure of the aircraft is kept as short as possible to keep the
probability of ice buildup to a minimum and avoid what occurred to Air Florida Flight
90. Delay with regards to the application of deicing fluid was assumed to be negligible
because, as stated by the FAA, under the severe storms the time between application and
departure must occur within 5 minutes. Thus from the initiation of applying the deicing
fluid until departure, there can be no more than 5 minutes. And thus the driving factor of
delay is not the time to apply the deicing fluid but whether the weather conditions
provided are safe to fly in. [30]
43
Figure 3.14: Deicing Cost Worksheet
44
3.4 Legislation
There is different legislation when it comes to the treatment and rights of
passengers between Europe and the U.S. It is important to understand the legislation of
the country in order to understand the reasoning behind the decision making process for
the airports and aircraft in a given situation. Although these laws are frequently being
revised, the ones in Europe tend to be more geared to customer satisfaction whereas the
ones in the U.S. are more geared to maintaining a safe business operation.
3.4.1 U.S. Passenger Delay
According to United States regulations, when passengers are delayed at an airport
due to snow, it is up to the airline and airport to determine what amenities they are to
provide. There is new regulation in the process of being passed that would require
airlines to provide passengers whose flight has been delayed two or more hours with food
and water. [31] According to the Federal Aviation Association (FAA), the cost of delay
for passengers is estimated to be at $28.60 per passenger per hour. [32]
This new regulation is more geared to keep the airport in operation and give a two
hour buffer before it becomes costly to the airlines. It encourages the delay to be
distributed among all the aircraft to reduce the overall costs and does not put as much
economic pressure on the airline. The passengers are the ones who unfortunately carry
more of the burden and stress.
45
3.4.2 EU Passenger Delay
According to European Union regulations, airlines and airports must “adequately
care” for passengers as defined by EC No 261/2004. Article 9 defines care as:
“1. Where reference is made to this Article, passengers shall be offered
free of charge:
(a) meals and refreshments in a reasonable relation to the waiting time;
(b) hotel accommodation in cases
- where a stay of one or more nights becomes necessary, or
- where a stay additional to that intended by the passenger becomes
necessary” [8]
The law makes the airlines responsible for the care of the passengers, which in a
market driven environment, encourages airlines to pressure airports to remain open, to
reduce excess costs related to delays. This in turn may increase the risks taken. In the
event of an airport closure, in theory, the passenger should be well treated.
3.5 Summary of Chapter 3
Understanding the characteristics of the location with respect to the airport
dimensions and applicable laws is important in grasping the situation at hand with
regards to the flexibility of the airport actions that can be undertaken. The geometry
determines the amount of snow clearing inventory and the laws determine how soon the
clearing needs to be done.
Deicing methods and equipment choices are important in allowing for fine tuning
tactics to suit the airport geometry. It should be recognized, however, that certain nearby
objects may prevent pieces of equipment from being most effectively used. Nevertheless,

46
inputting the data into the excel workbook provides an understanding of the
effectiveness.
47
Chapter 4
4. DATA ANALYSIS AND METHODOLOGY
This chapter describes the steps which were implemented and the decisions
employed in the research. It also describes the procedures used for this thesis with regard
to the collection and analysis of the data. A description of the storms which provided the
basis of the analysis is also included.
In order to be able to categorize the data appropriately and to model how the
various alternative snow and ice removal techniques compare with each other, an excel
workbook was constructed. This chapter describes the use of an excel workbook and the
outputs of the worksheets within the excel workbook which was used to analyze the data.
4.1 Procedure
Two airports in Europe and two airports in the U.S. that have approximately the
same amount of annual snow fall and handle the same mix and volume array of aircraft
were identified. Background research into the airports was conducted to determine
characteristics related to the airports, such as the geometry of the airport, the aircraft and
type handled at the airport. The airports were contacted to obtain data, with regards to the
inventory of snow equipment and number of personnel responsible for snow removal, as
well as financial pieces of data, which subsequently all the airports would not provide.
Further data was researched which would be held as constants in the research.
These included the operating speed and effective clearing width of the snow removal
equipment and the salaries of the people who clear snow and ice. Also the number of
48
passengers, the amount of cargo, and the cost of deicing an aircraft based off of its size
and functionality type were researched. In addition, airports were observed for a day with
regards to the aircraft which they handled, and the aircraft were counted and sorted into
categories.
To analyze this data, an excel data analysis tool was constructed, which is
described later. The worksheets are designed to determine the cost of various sample
snow storms with regard to snow removal and delays to passengers and to freight.
Information with regards to runway geometry, ground equipment characteristics, the
distribution of the type of aircraft present at the airport, and storm details was input into
various fields in the excel worksheet and the outputs of the worksheet is the cost of the
delay of the snow and ice storm. The excel workbook was run on the four airports and on
six snow storms.
Finally, a cost-effectiveness analysis based on the total cost of the storm and the
inventory amount of the equipment and the hours during which the equipment was in use,
the cost of the storm per passenger, and the cost of the storm per unit of cargo were
conducted. This allowed the airports to be able to be compared with one another on the
same denomination.
4.2 Data Collection Methodology
The methodology used is as follows:
• Two EU airports and two US airports were chosen, which regularly have
snow and ice.
49
• Airport administrators were contacted for details regarding the manpower
allocated to snow removal and the number and type of equipment that they
use for snow removal.
• Sample snow storms were used to determine hourly snow fall
accumulation rates.
• The exchange rate between Euro and US dollars is from January 23, 2012
and is $1.31 to €1.00. All figures in the tables are expressed in US dollars.
• The total cost over the number of hours the equipment was implemented,
the cost per passenger, and the cost per unit of air freight were all
analyzed.
4.3 Overview of the Data and Analysis
The data was obtained from each airport. The data includes:
• The snow accumulations for each hour of observation
• Specific parameters of the airport, such as runways dimensions and flight
operation capacity
• The equipment in the snow and ice removal fleet, including dimensions
• The distribution of the type of aircraft
In addition, the cost of delay to passengers is based on the standard FAA value of
delay per person per hour, determined to be $28.60. [32] The delay of the cargo was
50
assumed to be valued at $0.10 per kilogram per hour. The cost of snow removal labor
was determined as $20 per hour. [22]
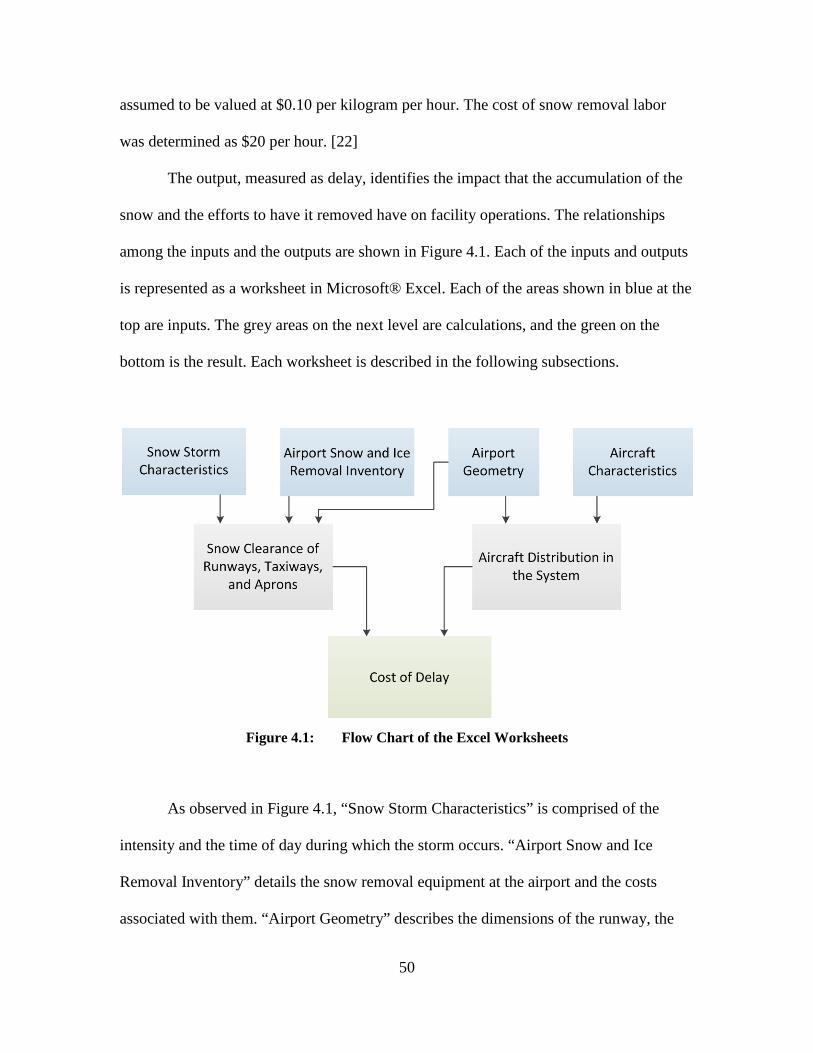
The output, measured as delay, identifies the impact that the accumulation of the
snow and the efforts to have it removed have on facility operations. The relationships
among the inputs and the outputs are shown in Figure 4.1. Each of the inputs and outputs
is represented as a worksheet in Microsoft® Excel. Each of the areas shown in blue at the
top are inputs. The grey areas on the next level are calculations, and the green on the
bottom is the result. Each worksheet is described in the following subsections.
Figure 4.1: Flow Chart of the Excel Worksheets
As observed in Figure 4.1, “Snow Storm Characteristics” is comprised of the
intensity and the time of day during which the storm occurs. “Airport Snow and Ice
Removal Inventory” details the snow removal equipment at the airport and the costs
associated with them. “Airport Geometry” describes the dimensions of the runway, the
51
taxiway, and the aprons. “Aircraft Characteristics” describes the type and size of aircraft
that are at the airport and allows for the determination of the average aircraft. “Snow
Clearance of Runways, Taxiways, and Aprons” calculates the amount of time needed to
clear the surface and combined with the snow fall intensity and, clearing equipment, how
operational the airport is. “Aircraft Distribution in the System” calculates the amount of
aircraft entering the system based off of the airport and time of day. “Cost of Delay”
includes the costs related to equipment deployment, the number of passengers and
amount of cargo, as well as the deicing of aircraft.
4.4 Data Analysis Methodology
For analysis of the data, the thesis developed six scenarios, which featured three
different storms, in pairs, one starting in the morning hours and the other starting in the
evening. This pairing is designed so that the peak of the storm affects the morning and
evening aircraft movement peak hours and one can determine how time of the day of the
storm influences the delay at the airport. The three storms chosen include one which has
the majority of snow at the beginning and then trickles off; the second storm starts off
slow and then peaks and ends suddenly; and the third storm is an 18 hour storm. These
storms are used in the model, which were run for Philadelphia, Boston, Frankfurt, and
Vienna airports. From the model it was possible to estimate approximately how much
these storms cost and it is then possible to compare and analyze how effective these
different airports are with regards to these storms, based off of the cost per piece of
equipment per hour, the cost per passenger, and the cost per metric ton of freight.
52
4.4.1 Description of the Storms
For the analysis, six different storms were considered. The six different storm
scenarios consisted of three pairs of storms. Within each pair, the storms were the same
with respect to intensity but differed in so far as one started in the morning and the other
in the afternoon. This was intended to observe the effect of the storm on the morning
flights and the effect the delay may have created trickle down throughout the day and on
the evening flights and the effect the delay may have created trickle down throughout the
night. The snow fall rates for each storm are summarized in Table 4.1.
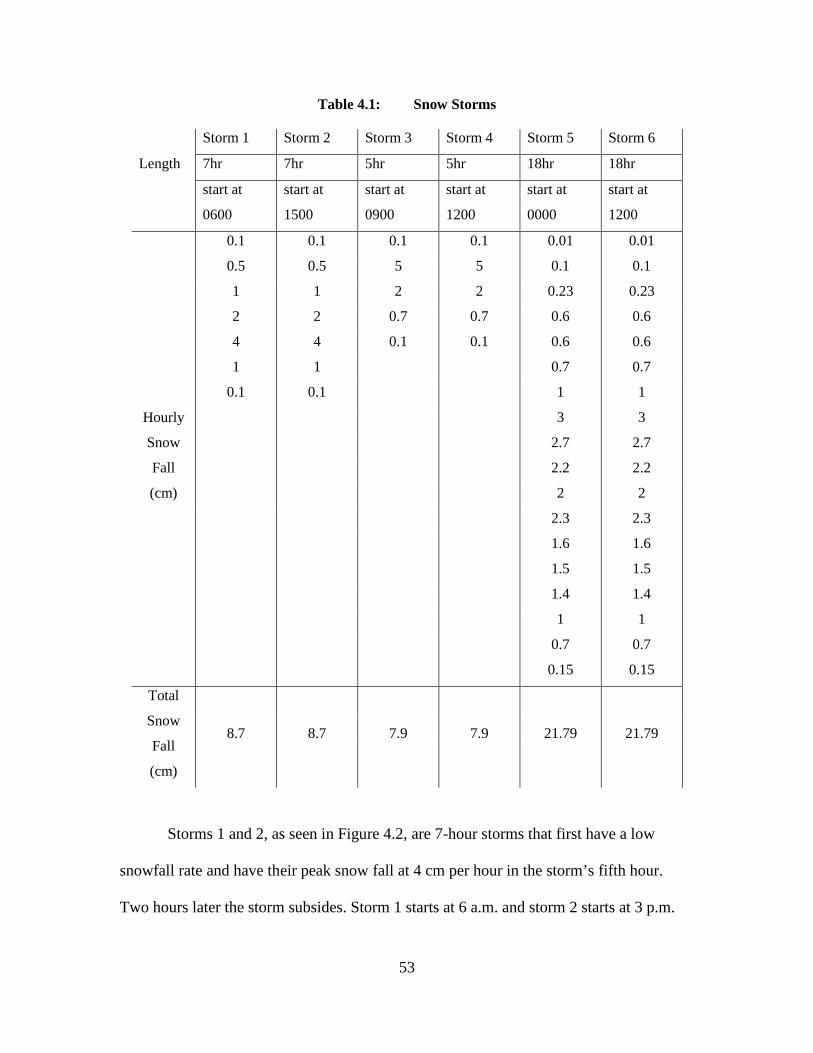
53
Table 4.1: Snow Storms
Storm 1 Storm 2 Storm 3 Storm 4 Storm 5 Storm 6
Length 7hr 7hr 5hr 5hr 18hr 18hr
start at
0600
start at
1500
start at
0900
start at
1200
start at
0000
start at
1200
Hourly
Snow
Fall
(cm)
0.1 0.1 0.1 0.1 0.01 0.01
0.5 0.5 5 5 0.1 0.1
1 1 2 2 0.23 0.23
2 2 0.7 0.7 0.6 0.6
4 4 0.1 0.1 0.6 0.6
1 1 0.7 0.7
0.1 0.1 1 1
3 3
2.7 2.7
2.2 2.2
2 2
2.3 2.3
1.6 1.6
1.5 1.5
1.4 1.4
1 1
0.7 0.7
0.15 0.15
Total
Snow
Fall
(cm)
8.7 8.7 7.9 7.9 21.79 21.79
Storms 1 and 2, as seen in Figure 4.2, are 7-hour storms that first have a low
snowfall rate and have their peak snow fall at 4 cm per hour in the storm’s fifth hour.
Two hours later the storm subsides. Storm 1 starts at 6 a.m. and storm 2 starts at 3 p.m.
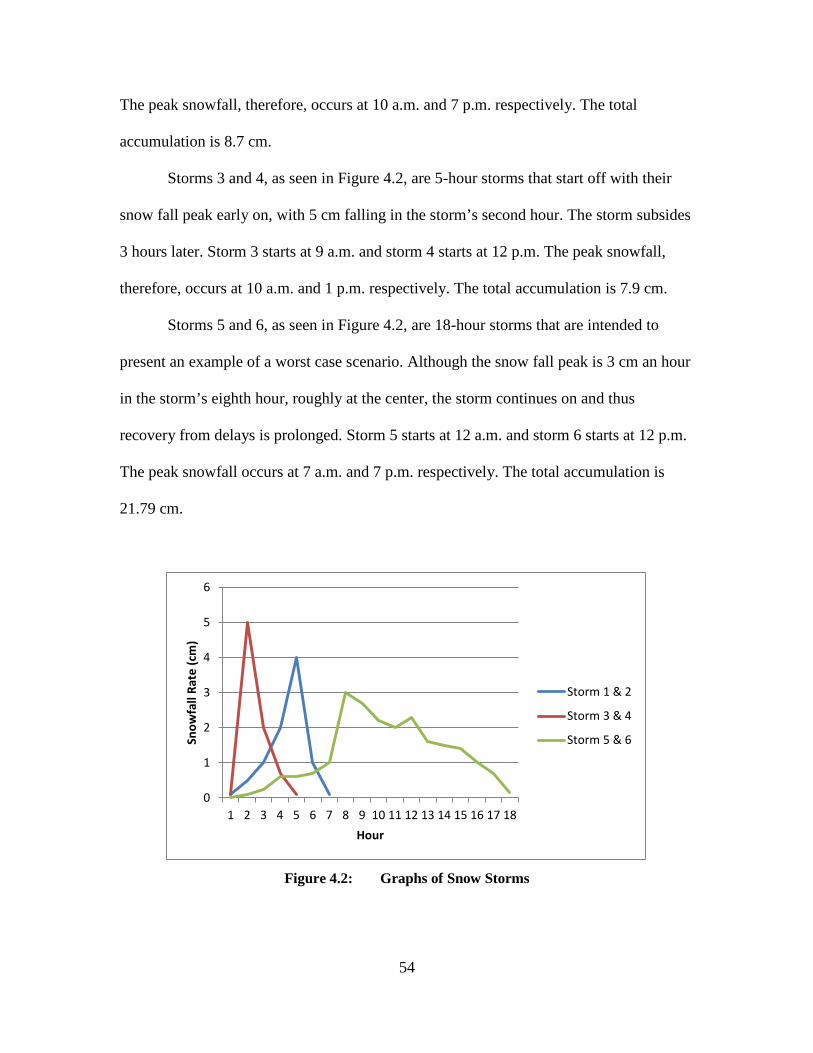
54
The peak snowfall, therefore, occurs at 10 a.m. and 7 p.m. respectively. The total
accumulation is 8.7 cm.
Storms 3 and 4, as seen in Figure 4.2, are 5-hour storms that start off with their
snow fall peak early on, with 5 cm falling in the storm’s second hour. The storm subsides
3 hours later. Storm 3 starts at 9 a.m. and storm 4 starts at 12 p.m. The peak snowfall,
therefore, occurs at 10 a.m. and 1 p.m. respectively. The total accumulation is 7.9 cm.
Storms 5 and 6, as seen in Figure 4.2, are 18-hour storms that are intended to
present an example of a worst case scenario. Although the snow fall peak is 3 cm an hour
in the storm’s eighth hour, roughly at the center, the storm continues on and thus
recovery from delays is prolonged. Storm 5 starts at 12 a.m. and storm 6 starts at 12 p.m.
The peak snowfall occurs at 7 a.m. and 7 p.m. respectively. The total accumulation is
21.79 cm.
Figure 4.2: Graphs of Snow Storms
0
1
2
3
4
5
6
1 2 3 4 5 6 7 8 9 10 11 12 13 14 15 16 17 18
Snow
fall
Rate
(cm
)
Hour
Storm 1 & 2
Storm 3 & 4
Storm 5 & 6
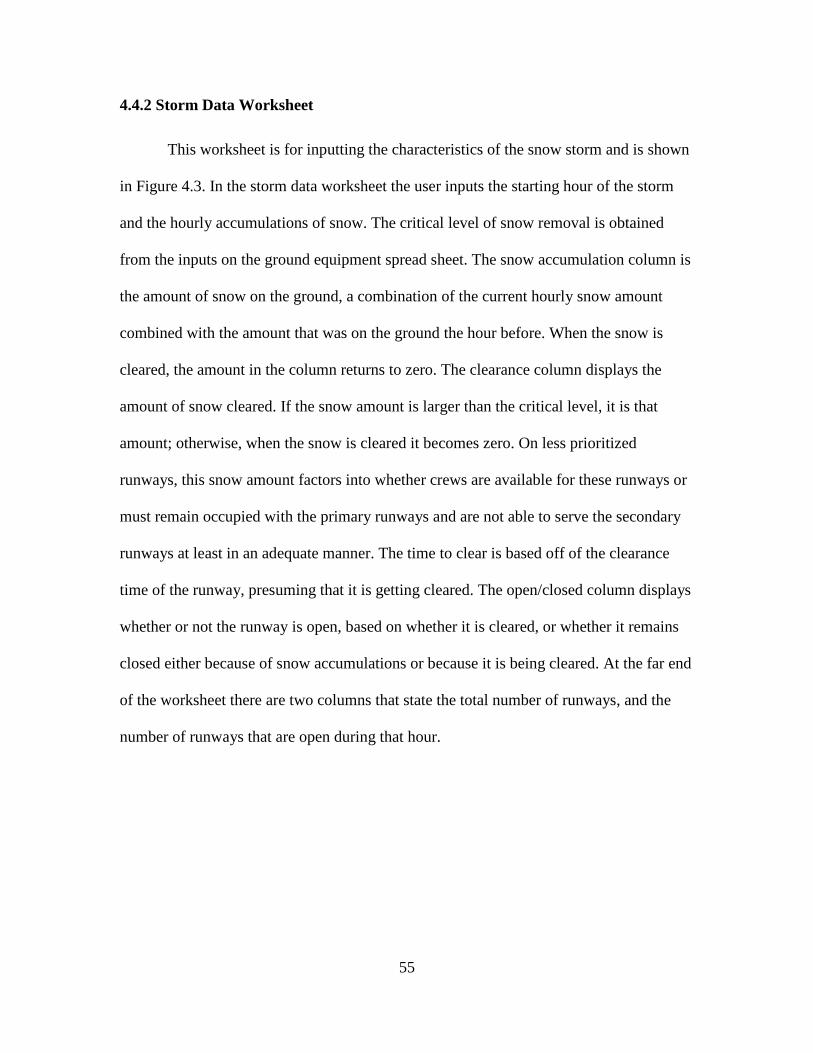
55
4.4.2 Storm Data Worksheet
This worksheet is for inputting the characteristics of the snow storm and is shown
in Figure 4.3. In the storm data worksheet the user inputs the starting hour of the storm
and the hourly accumulations of snow. The critical level of snow removal is obtained
from the inputs on the ground equipment spread sheet. The snow accumulation column is
the amount of snow on the ground, a combination of the current hourly snow amount
combined with the amount that was on the ground the hour before. When the snow is
cleared, the amount in the column returns to zero. The clearance column displays the
amount of snow cleared. If the snow amount is larger than the critical level, it is that
amount; otherwise, when the snow is cleared it becomes zero. On less prioritized
runways, this snow amount factors into whether crews are available for these runways or
must remain occupied with the primary runways and are not able to serve the secondary
runways at least in an adequate manner. The time to clear is based off of the clearance
time of the runway, presuming that it is getting cleared. The open/closed column displays
whether or not the runway is open, based on whether it is cleared, or whether it remains
closed either because of snow accumulations or because it is being cleared. At the far end
of the worksheet there are two columns that state the total number of runways, and the
number of runways that are open during that hour.
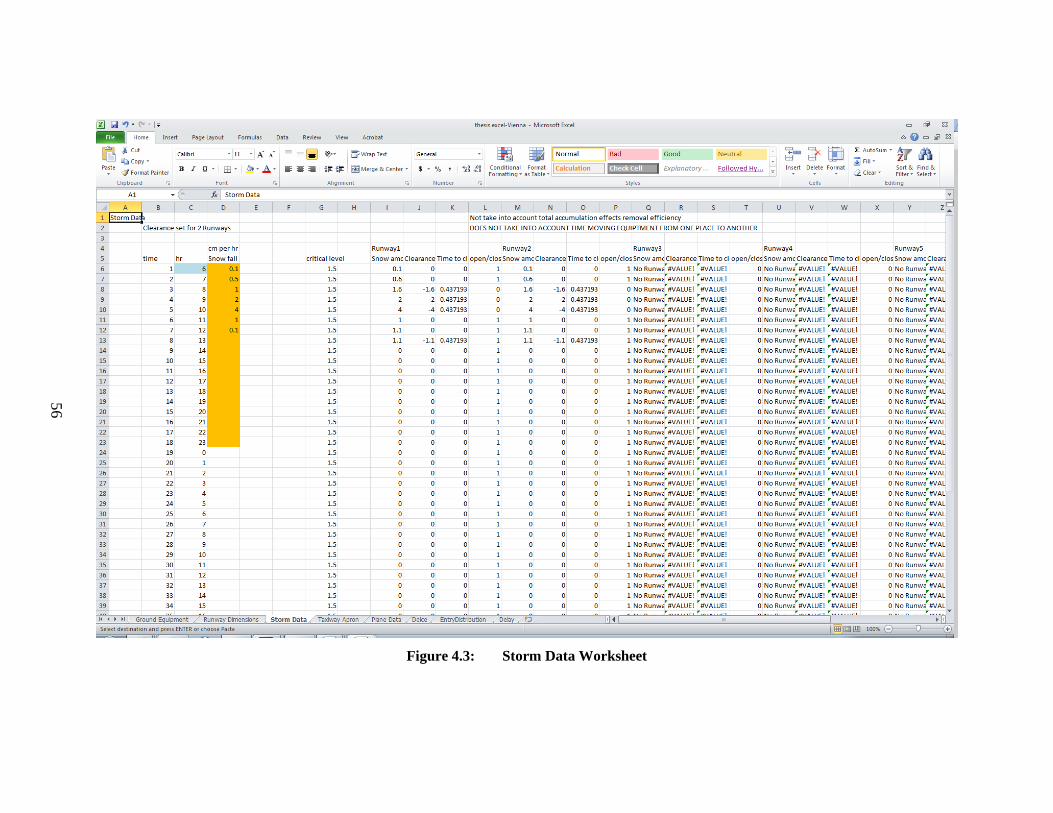
56
Figure 4.3: Storm Data Worksheet
57
4.4.3 Distribution Worksheet
The entry distribution worksheet is for the distribution of aircraft into the system
as seen in Figure 4.5. It has a function (Figure 4.4) which takes into account the peak
hours of 09:30 and 18:00 and a curve which values most traffic at the hours of light in the
day. The function is scaled to the curve based on the maximum amount of traffic that can
be handled per day and is input from the aircraft data worksheet. This is to ensure that the
distribution of air traffic is reasonable, with the majority existing in the hours when
society is awake and that it quiets down during the night. There is also a field which takes
into account an adjustment factor, to adjust to the value to a certain traffic volume.
Figure 4.4: Aircraft Distribution
-10
0
10
20
30
40
50
60
0 5 10 15 20 25
Airc
raft
Hour of the Day
Distribution
Total
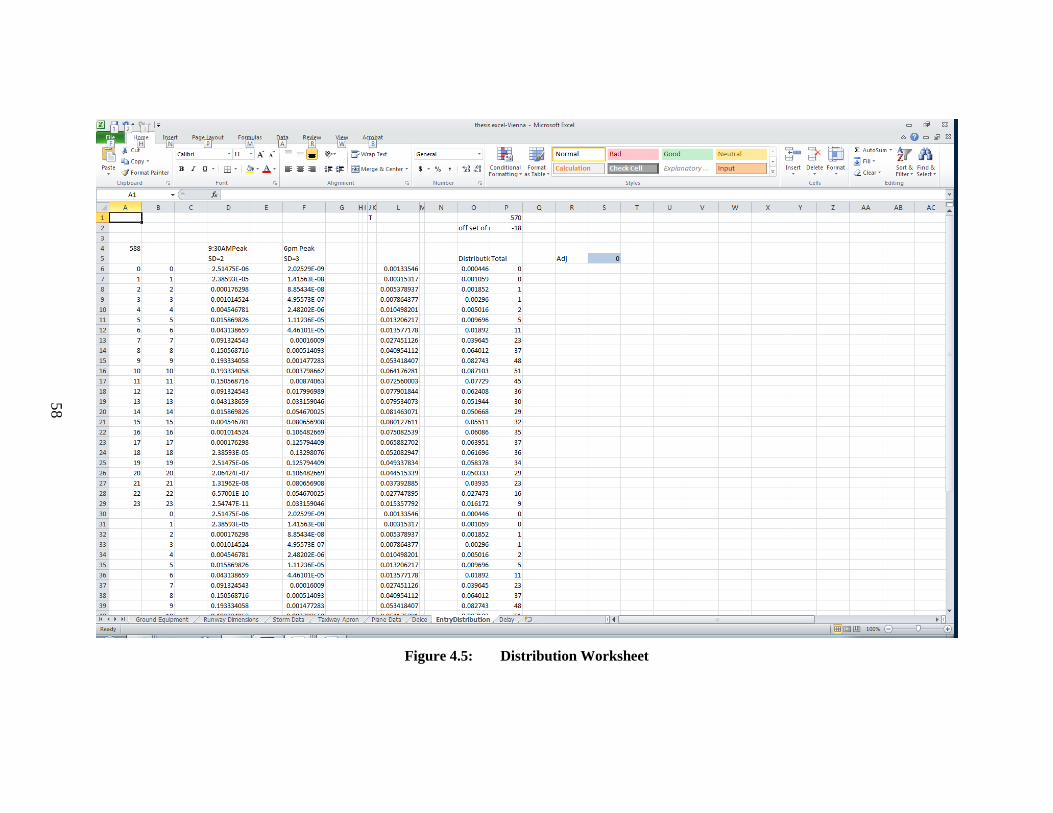
58
Figure 4.5: Distribution Worksheet
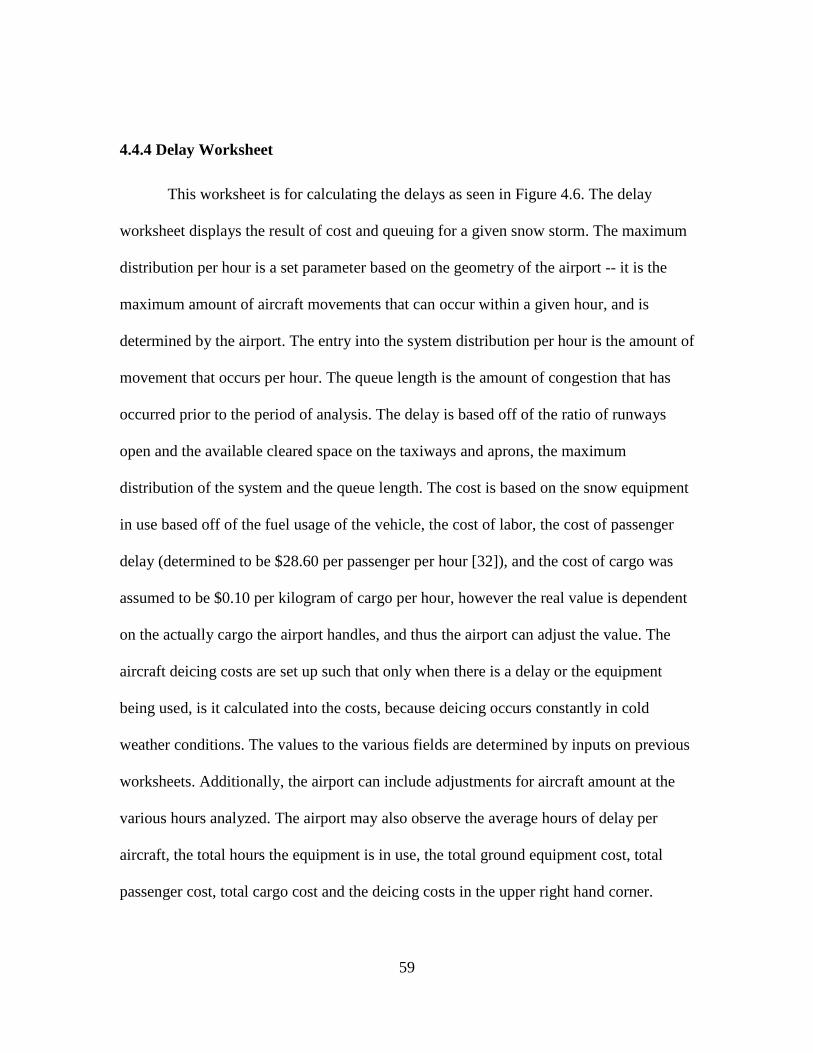
59
4.4.4 Delay Worksheet
This worksheet is for calculating the delays as seen in Figure 4.6. The delay
worksheet displays the result of cost and queuing for a given snow storm. The maximum
distribution per hour is a set parameter based on the geometry of the airport -- it is the
maximum amount of aircraft movements that can occur within a given hour, and is
determined by the airport. The entry into the system distribution per hour is the amount of
movement that occurs per hour. The queue length is the amount of congestion that has
occurred prior to the period of analysis. The delay is based off of the ratio of runways
open and the available cleared space on the taxiways and aprons, the maximum
distribution of the system and the queue length. The cost is based on the snow equipment
in use based off of the fuel usage of the vehicle, the cost of labor, the cost of passenger
delay (determined to be $28.60 per passenger per hour [32]), and the cost of cargo was
assumed to be $0.10 per kilogram of cargo per hour, however the real value is dependent
on the actually cargo the airport handles, and thus the airport can adjust the value. The
aircraft deicing costs are set up such that only when there is a delay or the equipment
being used, is it calculated into the costs, because deicing occurs constantly in cold
weather conditions. The values to the various fields are determined by inputs on previous
worksheets. Additionally, the airport can include adjustments for aircraft amount at the
various hours analyzed. The airport may also observe the average hours of delay per
aircraft, the total hours the equipment is in use, the total ground equipment cost, total
passenger cost, total cargo cost and the deicing costs in the upper right hand corner.
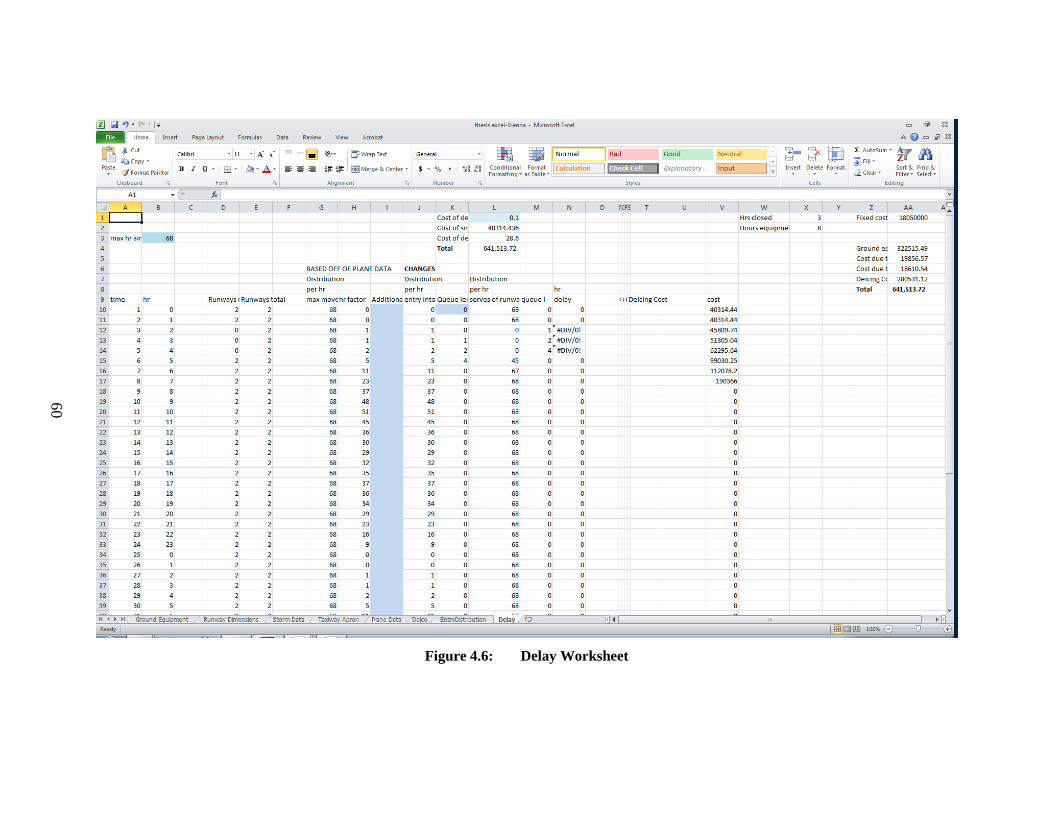
60
Figure 4.6: Delay Worksheet
61
4.5 Summary of Chapter 4
Systematic and uniform collection of data from the airports was important for
consistency and comparison. Putting the various airports under three different snow storm
scenarios and altering the time during which the storms occurred allowed for comparison
and trends to become visible at the various airports.
Data collection and categorization was done by means of an excel workbook,
consisting of eight worksheets, to model the characteristics of the airport, the ground
equipment, the storm, the aircraft and the time of day. This information, in turn, generates
the costs associated with the given scenario and allows for comparison with the other
airports being studied. It is important to observe and compare the efficiency of the
airports, in order to determine which airport has the most efficient usage of its inventory
for snow and ice removal.
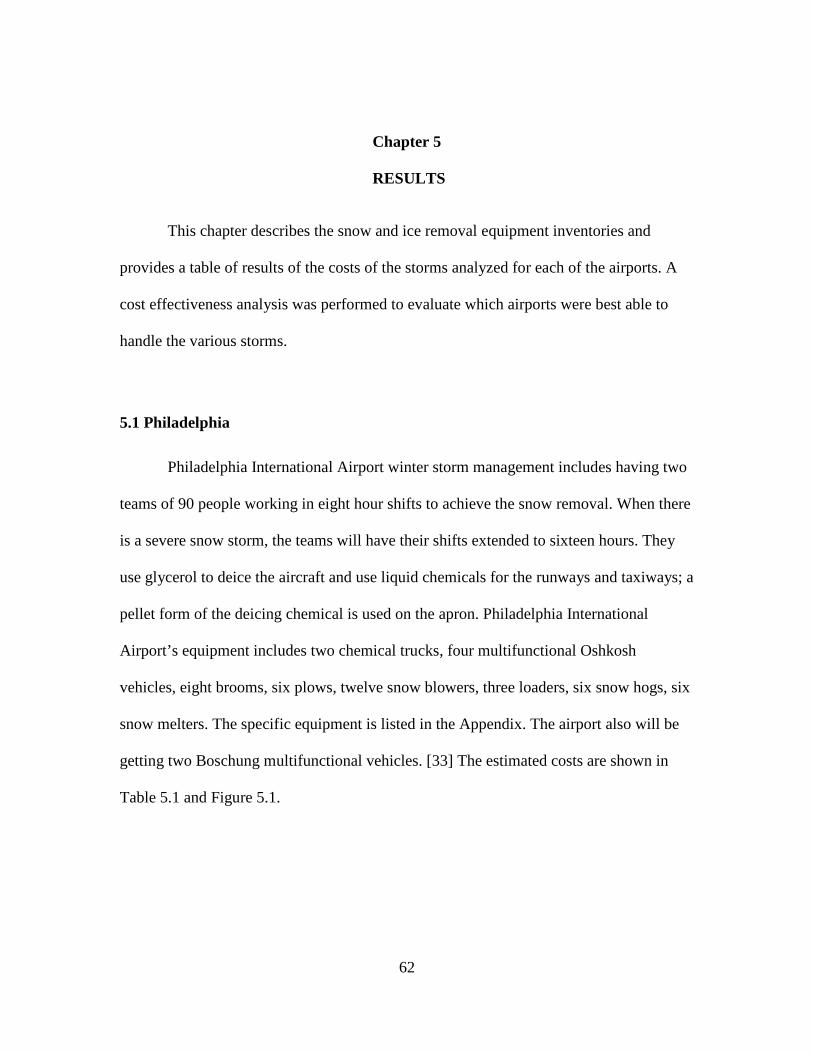
62
Chapter 5
5. RESULTS
This chapter describes the snow and ice removal equipment inventories and
provides a table of results of the costs of the storms analyzed for each of the airports. A
cost effectiveness analysis was performed to evaluate which airports were best able to
handle the various storms.
5.1 Philadelphia
Philadelphia International Airport winter storm management includes having two
teams of 90 people working in eight hour shifts to achieve the snow removal. When there
is a severe snow storm, the teams will have their shifts extended to sixteen hours. They
use glycerol to deice the aircraft and use liquid chemicals for the runways and taxiways; a
pellet form of the deicing chemical is used on the apron. Philadelphia International
Airport’s equipment includes two chemical trucks, four multifunctional Oshkosh
vehicles, eight brooms, six plows, twelve snow blowers, three loaders, six snow hogs, six
snow melters. The specific equipment is listed in the Appendix. The airport also will be
getting two Boschung multifunctional vehicles. [33] The estimated costs are shown in
Table 5.1 and Figure 5.1.
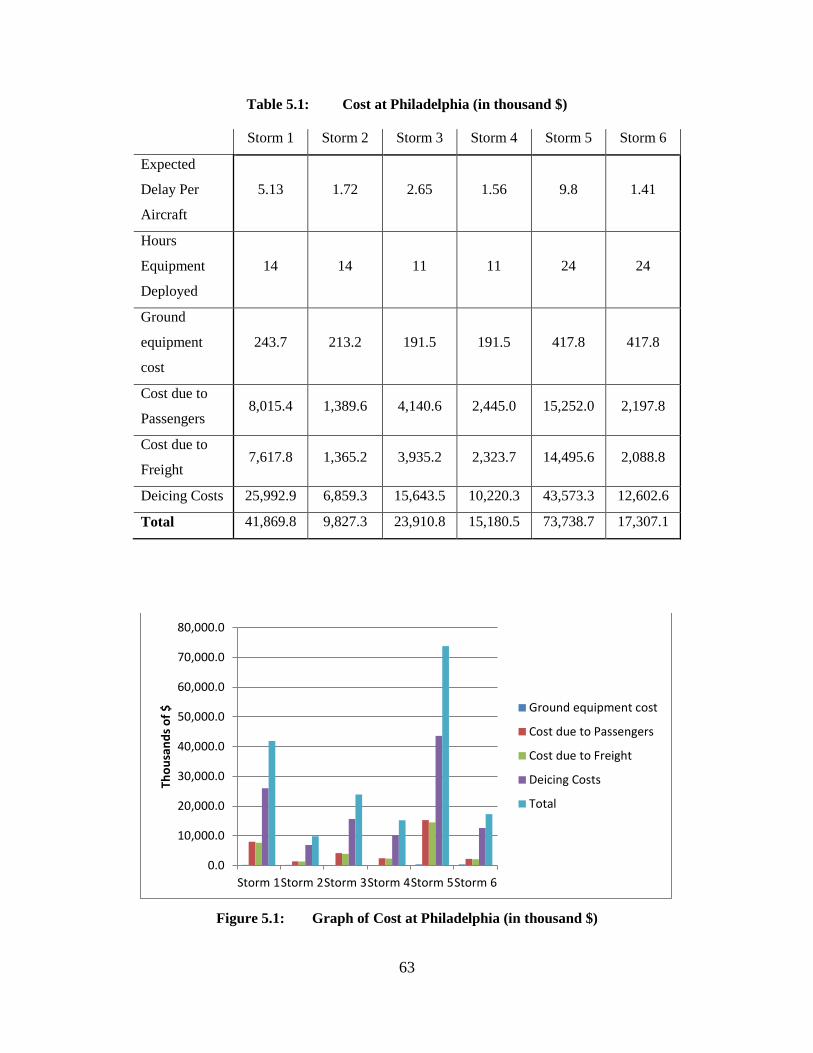
63
Table 5.1: Cost at Philadelphia (in thousand $)
Storm 1 Storm 2 Storm 3 Storm 4 Storm 5 Storm 6
Expected
Delay Per
Aircraft
5.13 1.72 2.65 1.56 9.8 1.41
Hours
Equipment
Deployed
14 14 11 11 24 24
Ground
equipment
cost
243.7 213.2 191.5 191.5 417.8 417.8
Cost due to
Passengers 8,015.4 1,389.6 4,140.6 2,445.0 15,252.0 2,197.8
Cost due to
Freight 7,617.8 1,365.2 3,935.2 2,323.7 14,495.6 2,088.8
Deicing Costs 25,992.9 6,859.3 15,643.5 10,220.3 43,573.3 12,602.6
Total 41,869.8 9,827.3 23,910.8 15,180.5 73,738.7 17,307.1
Figure 5.1: Graph of Cost at Philadelphia (in thousand $)
0.0
10,000.0
20,000.0
30,000.0
40,000.0
50,000.0
60,000.0
70,000.0
80,000.0
Storm 1Storm 2Storm 3Storm 4Storm 5Storm 6
Thou
sand
s of $
Ground equipment cost
Cost due to Passengers
Cost due to Freight
Deicing Costs
Total
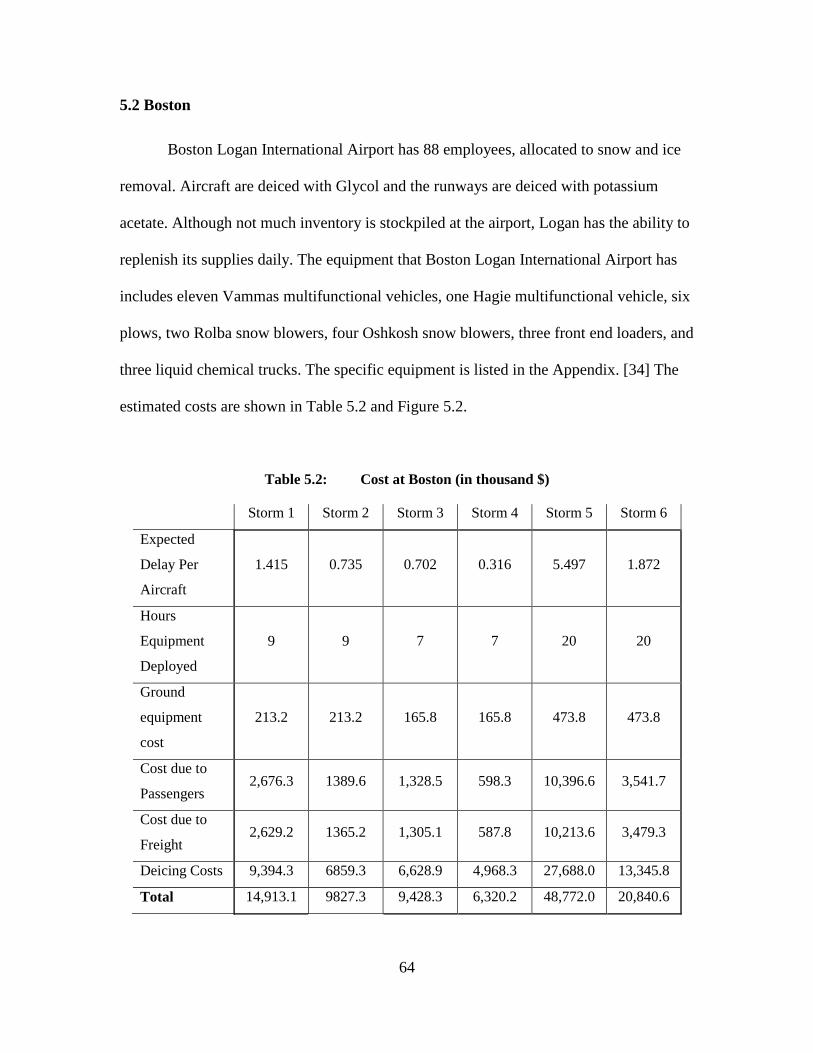
64
5.2 Boston
Boston Logan International Airport has 88 employees, allocated to snow and ice
removal. Aircraft are deiced with Glycol and the runways are deiced with potassium
acetate. Although not much inventory is stockpiled at the airport, Logan has the ability to
replenish its supplies daily. The equipment that Boston Logan International Airport has
includes eleven Vammas multifunctional vehicles, one Hagie multifunctional vehicle, six
plows, two Rolba snow blowers, four Oshkosh snow blowers, three front end loaders, and
three liquid chemical trucks. The specific equipment is listed in the Appendix. [34] The
estimated costs are shown in Table 5.2 and Figure 5.2.
Table 5.2: Cost at Boston (in thousand $)
Storm 1 Storm 2 Storm 3 Storm 4 Storm 5 Storm 6
Expected
Delay Per
Aircraft
1.415 0.735 0.702 0.316 5.497 1.872
Hours
Equipment
Deployed
9 9 7 7 20 20
Ground
equipment
cost
213.2 213.2 165.8 165.8 473.8 473.8
Cost due to
Passengers 2,676.3 1389.6 1,328.5 598.3 10,396.6 3,541.7
Cost due to
Freight 2,629.2 1365.2 1,305.1 587.8 10,213.6 3,479.3
Deicing Costs 9,394.3 6859.3 6,628.9 4,968.3 27,688.0 13,345.8
Total 14,913.1 9827.3 9,428.3 6,320.2 48,772.0 20,840.6
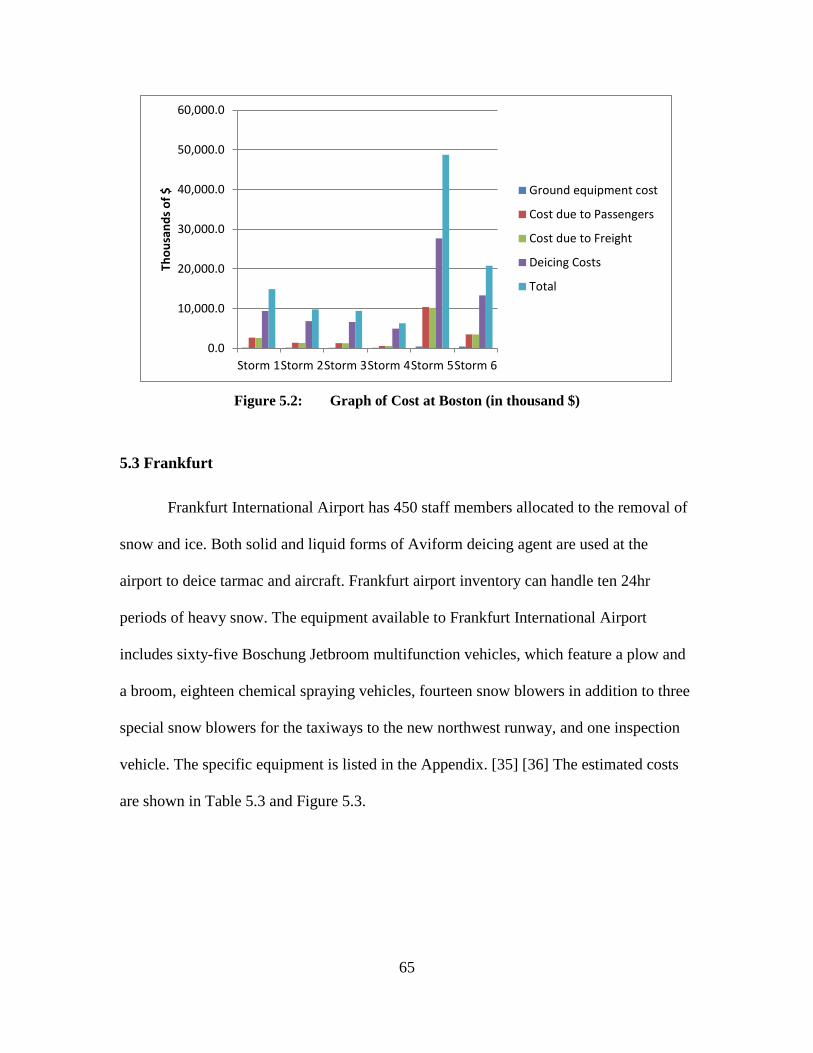
65
Figure 5.2: Graph of Cost at Boston (in thousand $)
5.3 Frankfurt
Frankfurt International Airport has 450 staff members allocated to the removal of
snow and ice. Both solid and liquid forms of Aviform deicing agent are used at the
airport to deice tarmac and aircraft. Frankfurt airport inventory can handle ten 24hr
periods of heavy snow. The equipment available to Frankfurt International Airport
includes sixty-five Boschung Jetbroom multifunction vehicles, which feature a plow and
a broom, eighteen chemical spraying vehicles, fourteen snow blowers in addition to three
special snow blowers for the taxiways to the new northwest runway, and one inspection
vehicle. The specific equipment is listed in the Appendix. [35] [36] The estimated costs
are shown in Table 5.3 and Figure 5.3.
0.0
10,000.0
20,000.0
30,000.0
40,000.0
50,000.0
60,000.0
Storm 1Storm 2Storm 3Storm 4Storm 5Storm 6
Thou
sand
s of $
Ground equipment cost
Cost due to Passengers
Cost due to Freight
Deicing Costs
Total
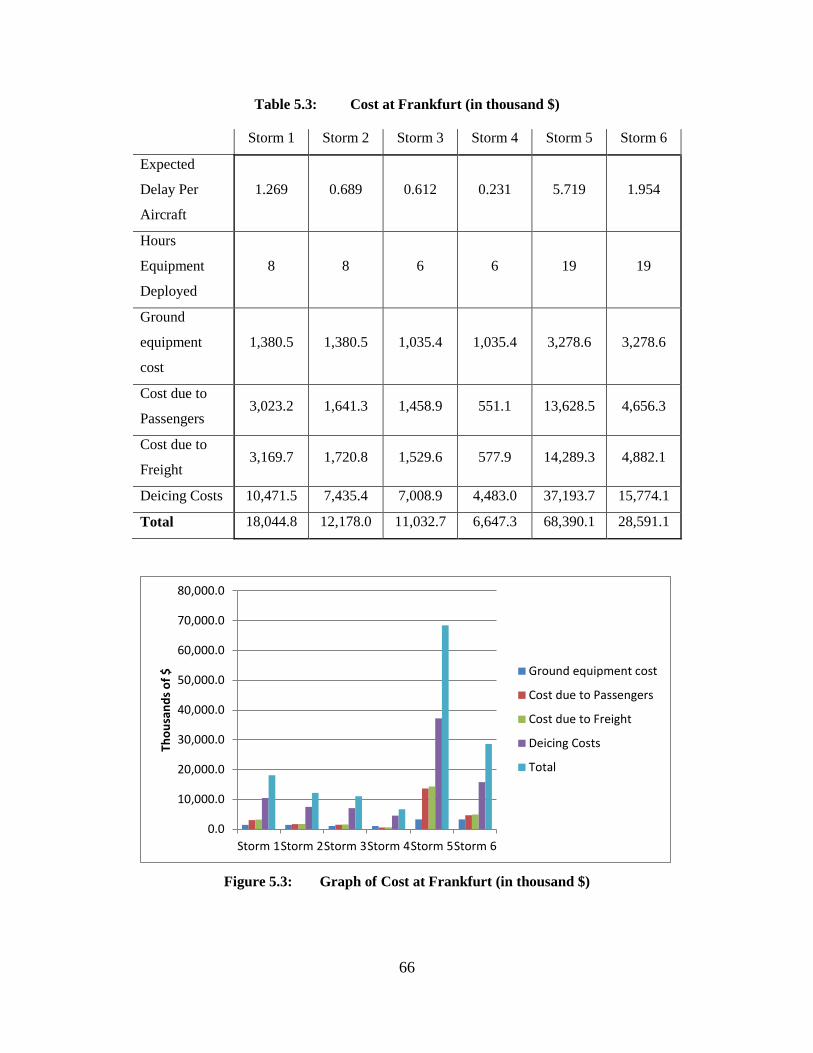
66
Table 5.3: Cost at Frankfurt (in thousand $)
Storm 1 Storm 2 Storm 3 Storm 4 Storm 5 Storm 6
Expected
Delay Per
Aircraft
1.269 0.689 0.612 0.231 5.719 1.954
Hours
Equipment
Deployed
8 8 6 6 19 19
Ground
equipment
cost
1,380.5 1,380.5 1,035.4 1,035.4 3,278.6 3,278.6
Cost due to
Passengers 3,023.2 1,641.3 1,458.9 551.1 13,628.5 4,656.3
Cost due to
Freight 3,169.7 1,720.8 1,529.6 577.9 14,289.3 4,882.1
Deicing Costs 10,471.5 7,435.4 7,008.9 4,483.0 37,193.7 15,774.1
Total 18,044.8 12,178.0 11,032.7 6,647.3 68,390.1 28,591.1
Figure 5.3: Graph of Cost at Frankfurt (in thousand $)
0.0
10,000.0
20,000.0
30,000.0
40,000.0
50,000.0
60,000.0
70,000.0
80,000.0
Storm 1Storm 2Storm 3Storm 4Storm 5Storm 6
Thou
sand
s of $
Ground equipment cost
Cost due to Passengers
Cost due to Freight
Deicing Costs
Total
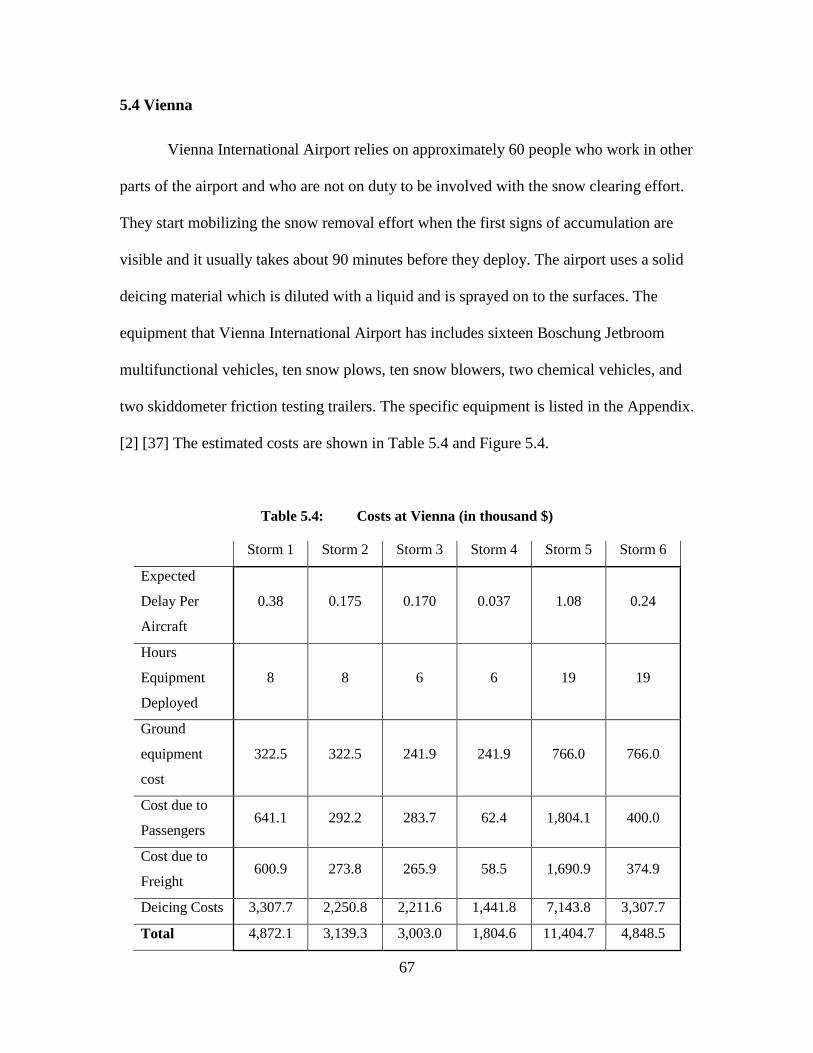
67
5.4 Vienna
Vienna International Airport relies on approximately 60 people who work in other
parts of the airport and who are not on duty to be involved with the snow clearing effort.
They start mobilizing the snow removal effort when the first signs of accumulation are
visible and it usually takes about 90 minutes before they deploy. The airport uses a solid
deicing material which is diluted with a liquid and is sprayed on to the surfaces. The
equipment that Vienna International Airport has includes sixteen Boschung Jetbroom
multifunctional vehicles, ten snow plows, ten snow blowers, two chemical vehicles, and
two skiddometer friction testing trailers. The specific equipment is listed in the Appendix.
[2] [37] The estimated costs are shown in Table 5.4 and Figure 5.4.
Table 5.4: Costs at Vienna (in thousand $)
Storm 1 Storm 2 Storm 3 Storm 4 Storm 5 Storm 6
Expected
Delay Per
Aircraft
0.38 0.175 0.170 0.037 1.08 0.24
Hours
Equipment
Deployed
8 8 6 6 19 19
Ground
equipment
cost
322.5 322.5 241.9 241.9 766.0 766.0
Cost due to
Passengers 641.1 292.2 283.7 62.4 1,804.1 400.0
Cost due to
Freight 600.9 273.8 265.9 58.5 1,690.9 374.9
Deicing Costs 3,307.7 2,250.8 2,211.6 1,441.8 7,143.8 3,307.7
Total 4,872.1 3,139.3 3,003.0 1,804.6 11,404.7 4,848.5
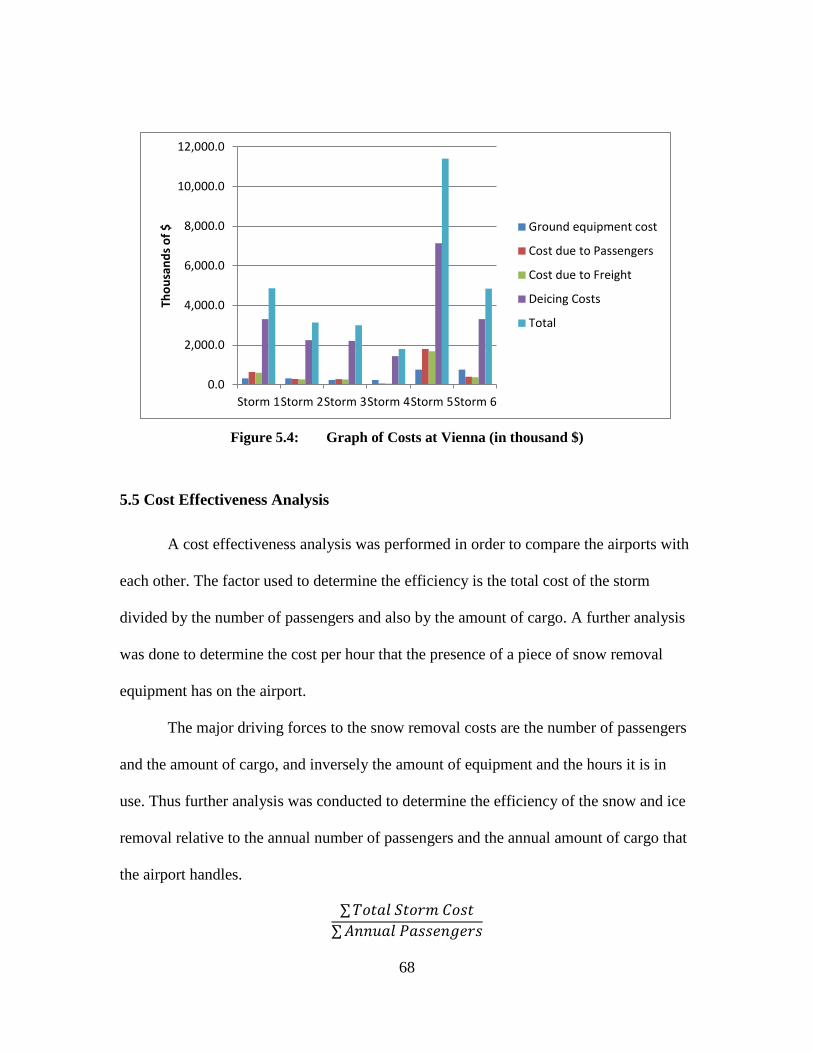
68
Figure 5.4: Graph of Costs at Vienna (in thousand $)
5.5 Cost Effectiveness Analysis
A cost effectiveness analysis was performed in order to compare the airports with
each other. The factor used to determine the efficiency is the total cost of the storm
divided by the number of passengers and also by the amount of cargo. A further analysis
was done to determine the cost per hour that the presence of a piece of snow removal
equipment has on the airport.
The major driving forces to the snow removal costs are the number of passengers
and the amount of cargo, and inversely the amount of equipment and the hours it is in
use. Thus further analysis was conducted to determine the efficiency of the snow and ice
removal relative to the annual number of passengers and the annual amount of cargo that
the airport handles.
∑𝑇𝑜𝑡𝑎𝑙 𝑆𝑡𝑜𝑟𝑚 𝐶𝑜𝑠𝑡∑𝐴𝑛𝑛𝑢𝑎𝑙 𝑃𝑎𝑠𝑠𝑒𝑛𝑔𝑒𝑟𝑠
0.0
2,000.0
4,000.0
6,000.0
8,000.0
10,000.0
12,000.0
Storm 1Storm 2Storm 3Storm 4Storm 5Storm 6
Thou
sand
s of $
Ground equipment cost
Cost due to Passengers
Cost due to Freight
Deicing Costs
Total
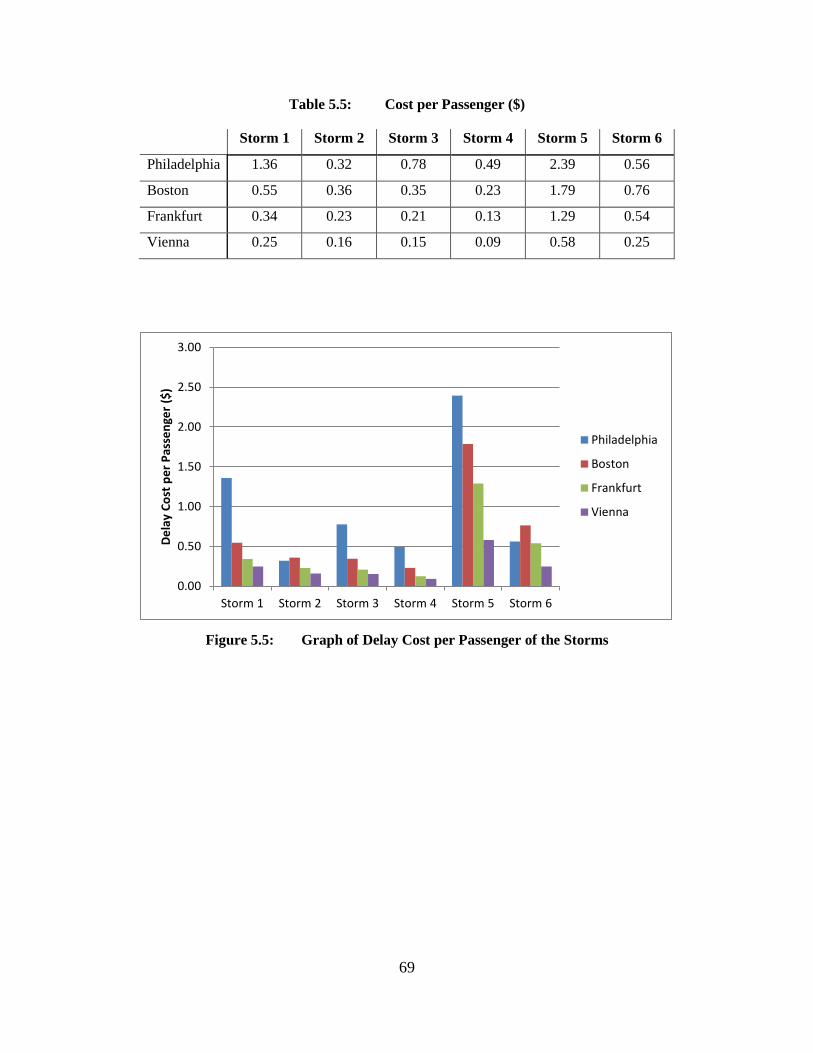
69
Table 5.5: Cost per Passenger ($)
Storm 1 Storm 2 Storm 3 Storm 4 Storm 5 Storm 6
Philadelphia 1.36 0.32 0.78 0.49 2.39 0.56
Boston 0.55 0.36 0.35 0.23 1.79 0.76
Frankfurt 0.34 0.23 0.21 0.13 1.29 0.54
Vienna 0.25 0.16 0.15 0.09 0.58 0.25
Figure 5.5: Graph of Delay Cost per Passenger of the Storms
0.00
0.50
1.00
1.50
2.00
2.50
3.00
Storm 1 Storm 2 Storm 3 Storm 4 Storm 5 Storm 6
Dela
y Co
st p
er P
asse
nger
($)
Philadelphia
Boston
Frankfurt
Vienna
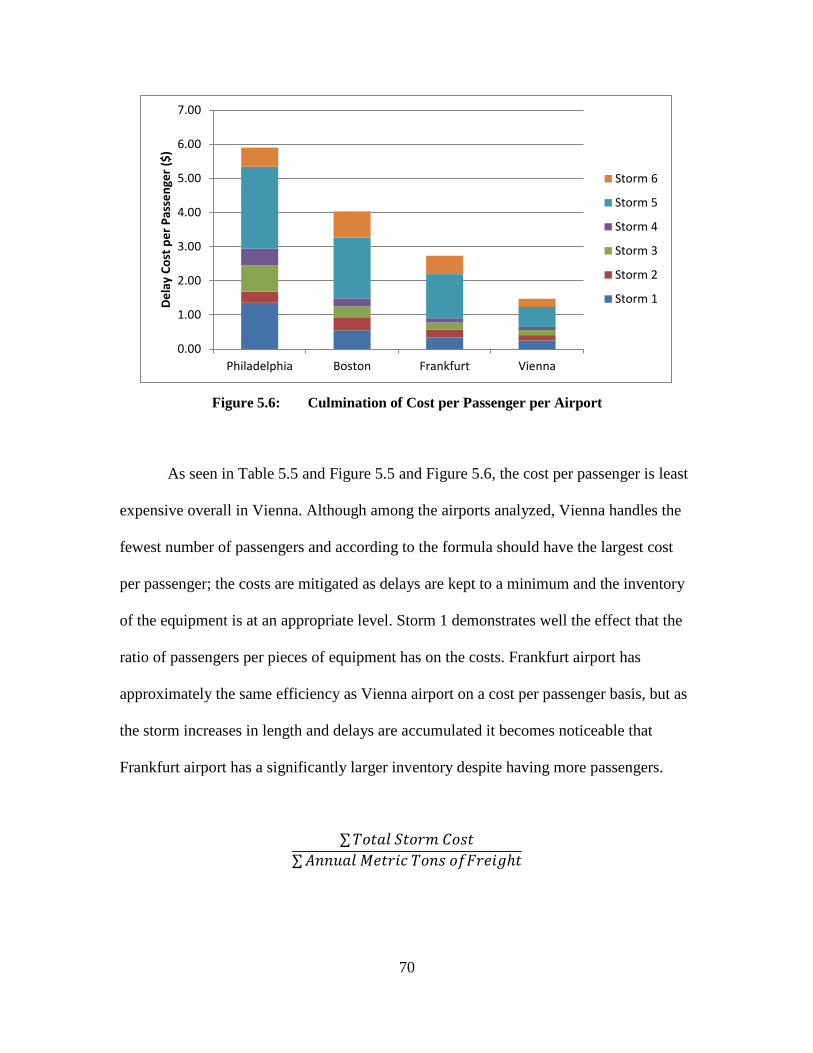
70
Figure 5.6: Culmination of Cost per Passenger per Airport
As seen in Table 5.5 and Figure 5.5 and Figure 5.6, the cost per passenger is least
expensive overall in Vienna. Although among the airports analyzed, Vienna handles the
fewest number of passengers and according to the formula should have the largest cost
per passenger; the costs are mitigated as delays are kept to a minimum and the inventory
of the equipment is at an appropriate level. Storm 1 demonstrates well the effect that the
ratio of passengers per pieces of equipment has on the costs. Frankfurt airport has
approximately the same efficiency as Vienna airport on a cost per passenger basis, but as
the storm increases in length and delays are accumulated it becomes noticeable that
Frankfurt airport has a significantly larger inventory despite having more passengers.
∑𝑇𝑜𝑡𝑎𝑙 𝑆𝑡𝑜𝑟𝑚 𝐶𝑜𝑠𝑡∑𝐴𝑛𝑛𝑢𝑎𝑙 𝑀𝑒𝑡𝑟𝑖𝑐 𝑇𝑜𝑛𝑠 𝑜𝑓𝐹𝑟𝑒𝑖𝑔ℎ𝑡
0.00
1.00
2.00
3.00
4.00
5.00
6.00
7.00
Philadelphia Boston Frankfurt Vienna
Dela
y Co
st p
er P
asse
nger
($)
Storm 6
Storm 5
Storm 4
Storm 3
Storm 2
Storm 1
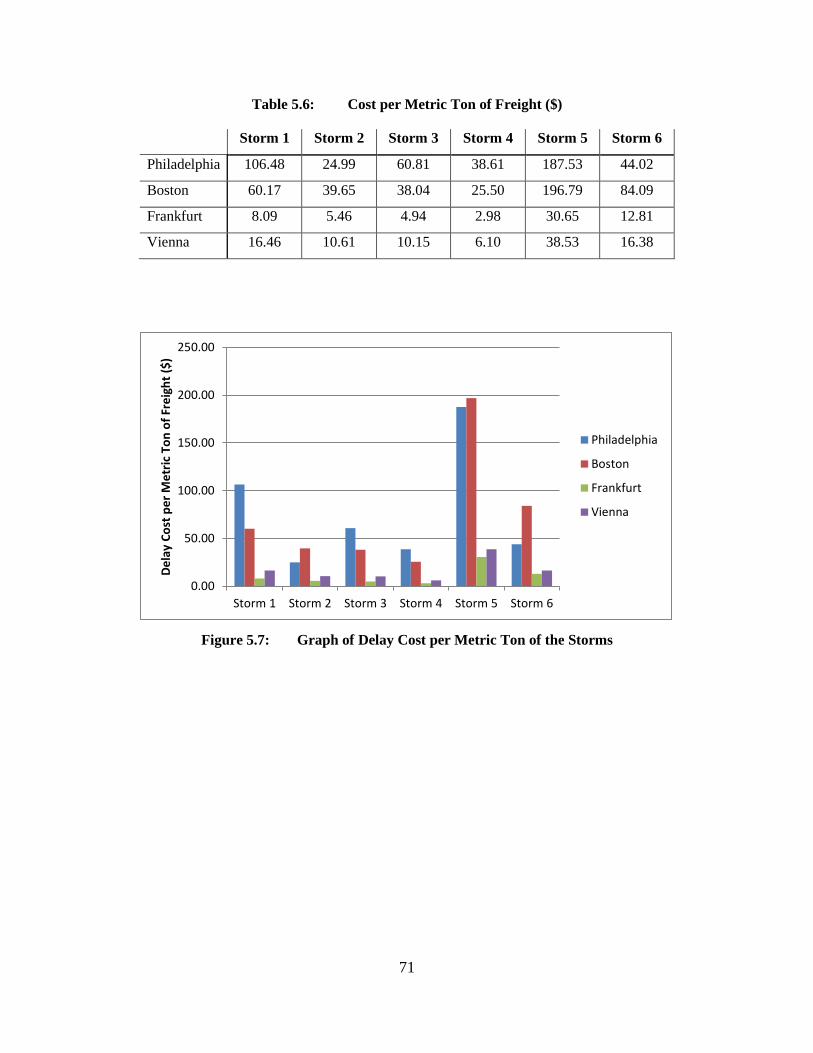
71
Table 5.6: Cost per Metric Ton of Freight ($)
Storm 1 Storm 2 Storm 3 Storm 4 Storm 5 Storm 6
Philadelphia 106.48 24.99 60.81 38.61 187.53 44.02
Boston 60.17 39.65 38.04 25.50 196.79 84.09
Frankfurt 8.09 5.46 4.94 2.98 30.65 12.81
Vienna 16.46 10.61 10.15 6.10 38.53 16.38
Figure 5.7: Graph of Delay Cost per Metric Ton of the Storms
0.00
50.00
100.00
150.00
200.00
250.00
Storm 1 Storm 2 Storm 3 Storm 4 Storm 5 Storm 6
Dela
y Co
st p
er M
etric
Ton
of F
reig
ht ($
)
Philadelphia
Boston
Frankfurt
Vienna
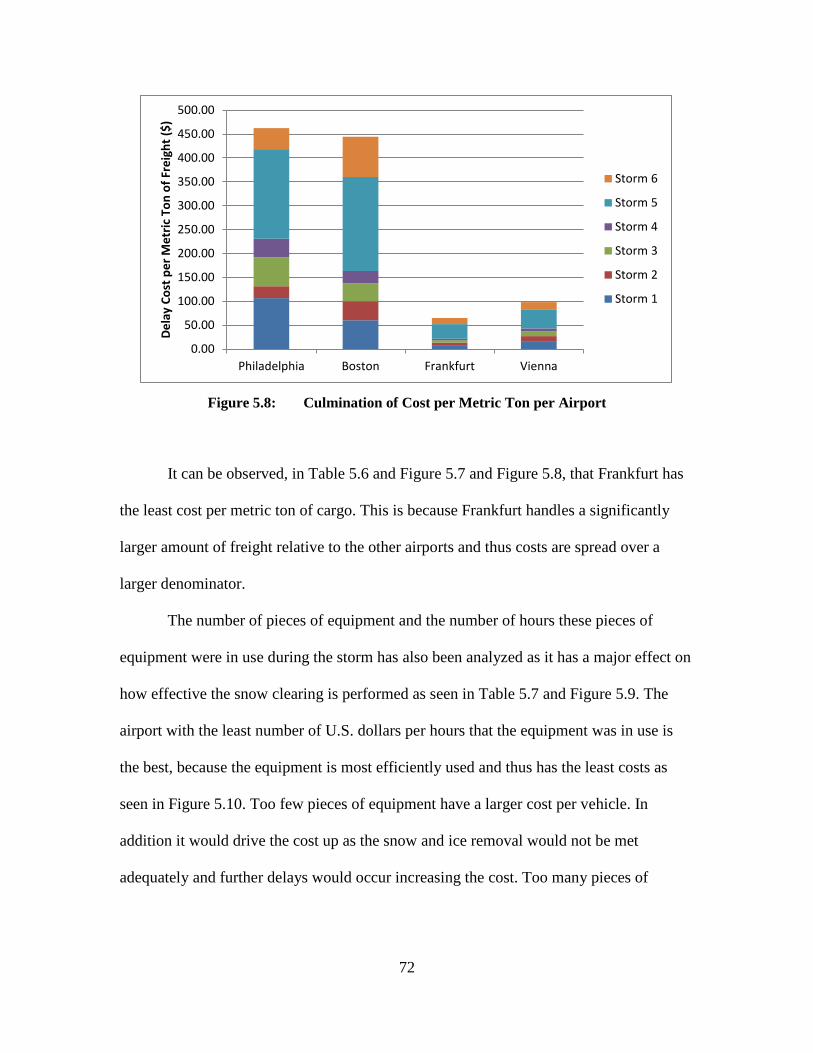
72
Figure 5.8: Culmination of Cost per Metric Ton per Airport
It can be observed, in Table 5.6 and Figure 5.7 and Figure 5.8, that Frankfurt has
the least cost per metric ton of cargo. This is because Frankfurt handles a significantly
larger amount of freight relative to the other airports and thus costs are spread over a
larger denominator.
The number of pieces of equipment and the number of hours these pieces of
equipment were in use during the storm has also been analyzed as it has a major effect on
how effective the snow clearing is performed as seen in Table 5.7 and Figure 5.9. The
airport with the least number of U.S. dollars per hours that the equipment was in use is
the best, because the equipment is most efficiently used and thus has the least costs as
seen in Figure 5.10. Too few pieces of equipment have a larger cost per vehicle. In
addition it would drive the cost up as the snow and ice removal would not be met
adequately and further delays would occur increasing the cost. Too many pieces of
0.00
50.00
100.00
150.00
200.00
250.00
300.00
350.00
400.00
450.00
500.00
Philadelphia Boston Frankfurt Vienna
Dela
y Co
st p
er M
etric
Ton
of F
reig
ht ($
) Storm 6
Storm 5
Storm 4
Storm 3
Storm 2
Storm 1
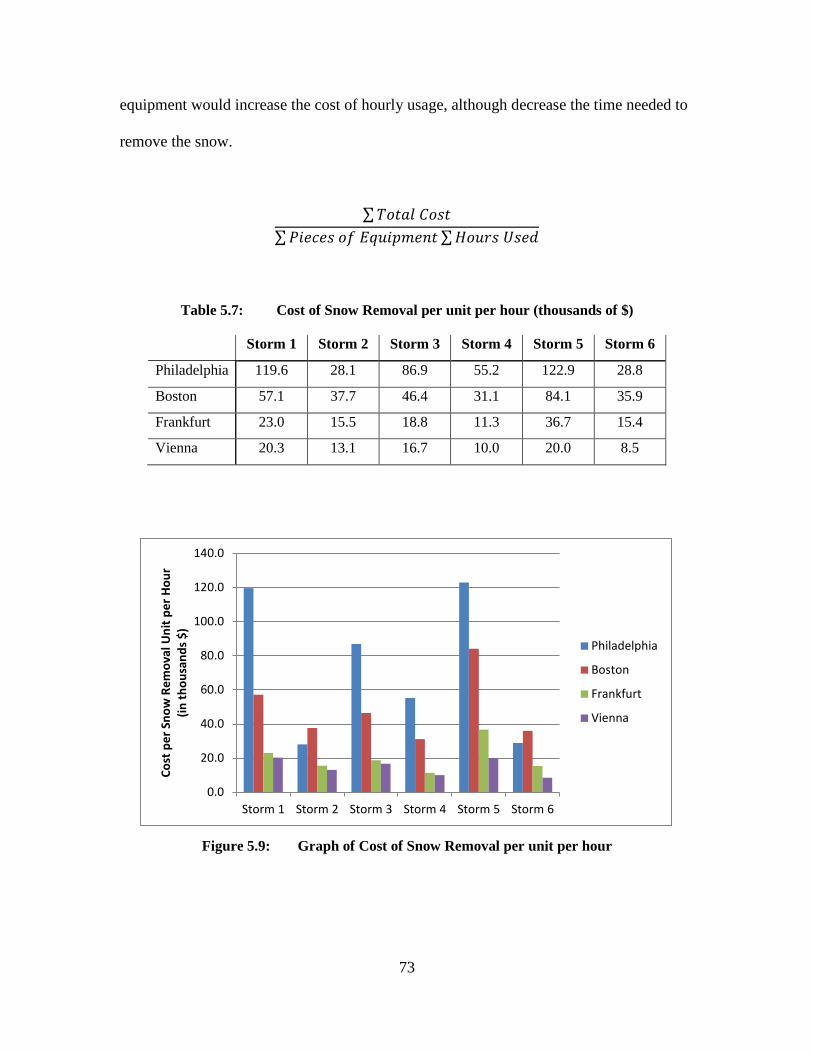
73
equipment would increase the cost of hourly usage, although decrease the time needed to
remove the snow.
∑𝑇𝑜𝑡𝑎𝑙 𝐶𝑜𝑠𝑡∑𝑃𝑖𝑒𝑐𝑒𝑠 𝑜𝑓 𝐸𝑞𝑢𝑖𝑝𝑚𝑒𝑛𝑡 ∑𝐻𝑜𝑢𝑟𝑠 𝑈𝑠𝑒𝑑
Table 5.7: Cost of Snow Removal per unit per hour (thousands of $)
Storm 1 Storm 2 Storm 3 Storm 4 Storm 5 Storm 6
Philadelphia 119.6 28.1 86.9 55.2 122.9 28.8
Boston 57.1 37.7 46.4 31.1 84.1 35.9
Frankfurt 23.0 15.5 18.8 11.3 36.7 15.4
Vienna 20.3 13.1 16.7 10.0 20.0 8.5
Figure 5.9: Graph of Cost of Snow Removal per unit per hour
0.0
20.0
40.0
60.0
80.0
100.0
120.0
140.0
Storm 1 Storm 2 Storm 3 Storm 4 Storm 5 Storm 6
Cost
per
Sno
w R
emov
al U
nit p
er H
our
(in th
ousa
nds $
)
Philadelphia
Boston
Frankfurt
Vienna
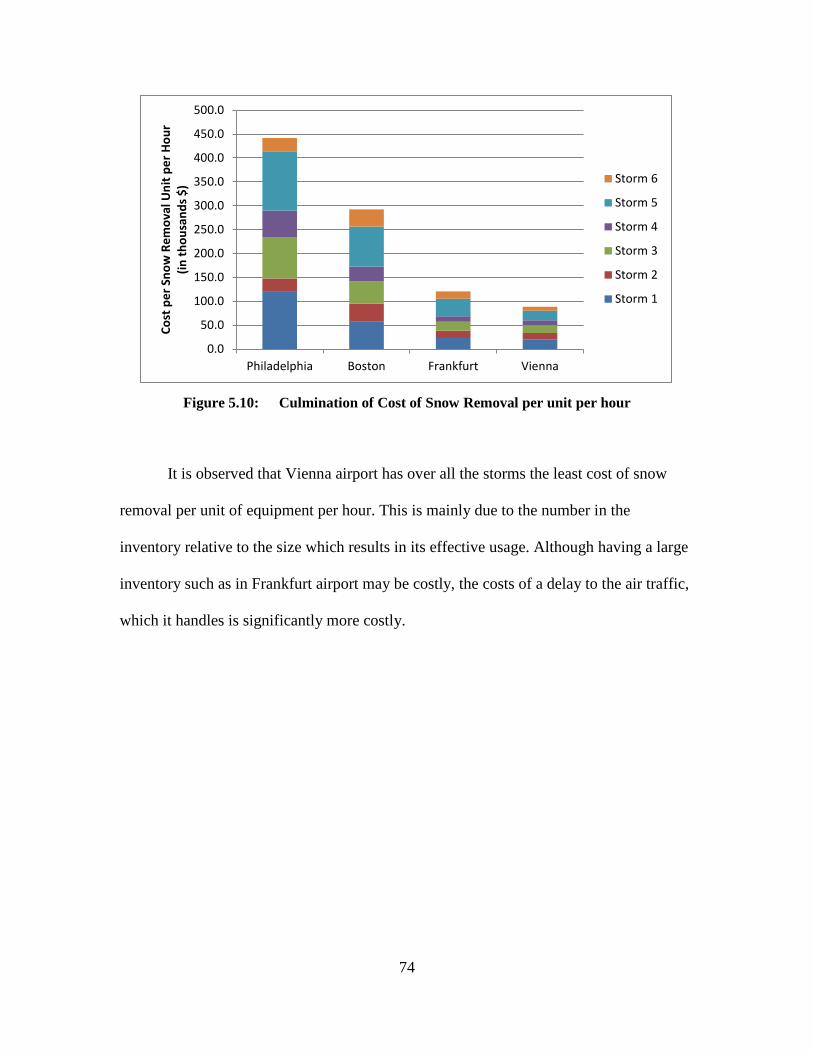
74
Figure 5.10: Culmination of Cost of Snow Removal per unit per hour
It is observed that Vienna airport has over all the storms the least cost of snow
removal per unit of equipment per hour. This is mainly due to the number in the
inventory relative to the size which results in its effective usage. Although having a large
inventory such as in Frankfurt airport may be costly, the costs of a delay to the air traffic,
which it handles is significantly more costly.
0.0
50.0
100.0
150.0
200.0
250.0
300.0
350.0
400.0
450.0
500.0
Philadelphia Boston Frankfurt Vienna
Cost
per
Sno
w R
emov
al U
nit p
er H
our
(in th
ousa
nds $
) Storm 6
Storm 5
Storm 4
Storm 3
Storm 2
Storm 1
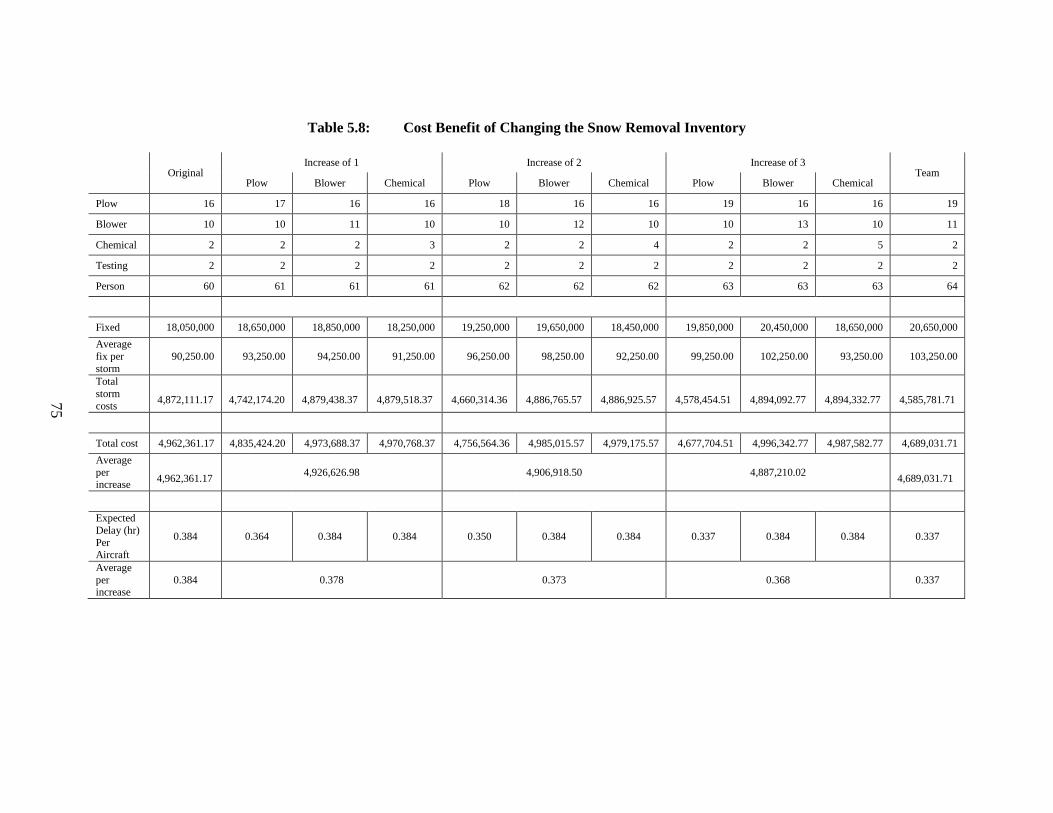
75
Table 5.8: Cost Benefit of Changing the Snow Removal Inventory
Original Increase of 1 Increase of 2 Increase of 3
Team Plow Blower Chemical Plow Blower Chemical Plow Blower Chemical
Plow 16 17 16 16 18 16 16 19 16 16 19
Blower 10 10 11 10 10 12 10 10 13 10 11
Chemical 2 2 2 3 2 2 4 2 2 5 2
Testing 2 2 2 2 2 2 2 2 2 2 2
Person 60 61 61 61 62 62 62 63 63 63 64
Fixed 18,050,000 18,650,000 18,850,000 18,250,000 19,250,000 19,650,000 18,450,000 19,850,000 20,450,000 18,650,000 20,650,000 Average fix per storm
90,250.00 93,250.00 94,250.00 91,250.00 96,250.00 98,250.00 92,250.00 99,250.00 102,250.00 93,250.00 103,250.00
Total storm costs
4,872,111.17
4,742,174.20
4,879,438.37
4,879,518.37
4,660,314.36
4,886,765.57
4,886,925.57
4,578,454.51
4,894,092.77
4,894,332.77
4,585,781.71
Total cost 4,962,361.17 4,835,424.20 4,973,688.37 4,970,768.37 4,756,564.36 4,985,015.57 4,979,175.57 4,677,704.51 4,996,342.77 4,987,582.77 4,689,031.71 Average per increase
4,962,361.17 4,926,626.98 4,906,918.50 4,887,210.02
4,689,031.71
Expected Delay (hr) Per Aircraft
0.384 0.364 0.384 0.384 0.350 0.384 0.384 0.337 0.384 0.384 0.337
Average per increase
0.384 0.378 0.373 0.368 0.337
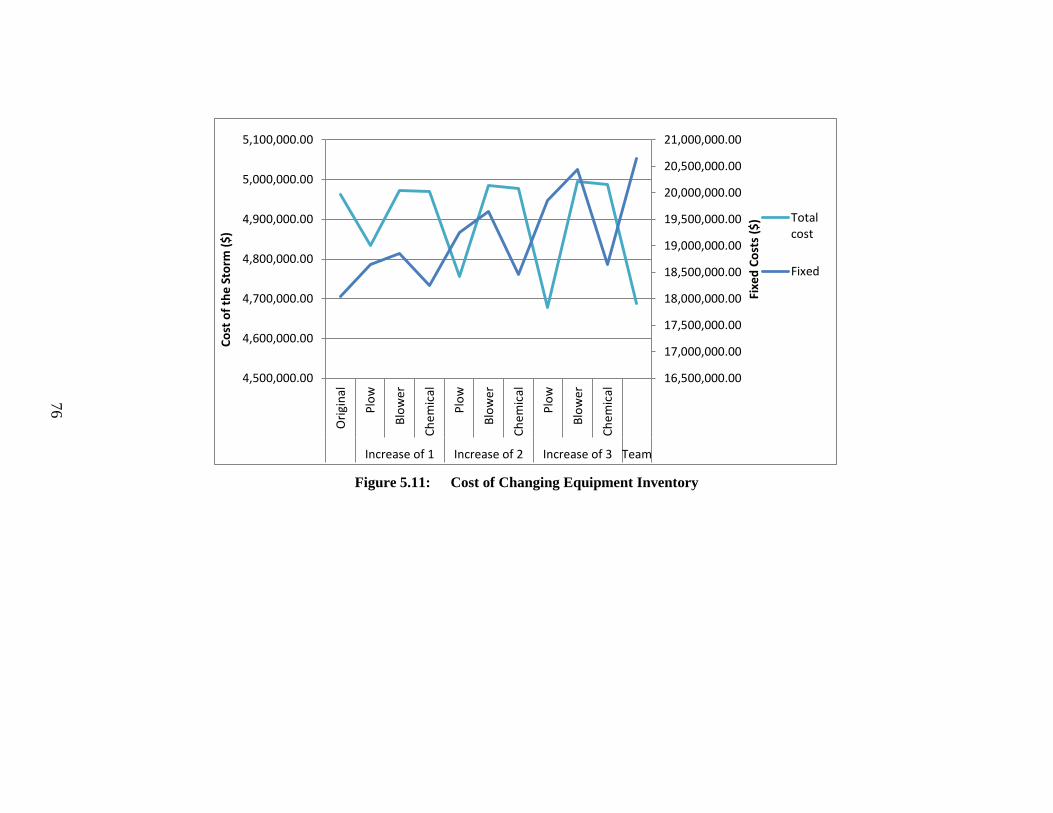
76
Figure 5.11: Cost of Changing Equipment Inventory
16,500,000.00
17,000,000.00
17,500,000.00
18,000,000.00
18,500,000.00
19,000,000.00
19,500,000.00
20,000,000.00
20,500,000.00
21,000,000.00
4,500,000.00
4,600,000.00
4,700,000.00
4,800,000.00
4,900,000.00
5,000,000.00
5,100,000.00
Orig
inal
Plow
Blow
er
Chem
ical
Plow
Blow
er
Chem
ical
Plow
Blow
er
Chem
ical
Increase of 1 Increase of 2 Increase of 3 Team
Fixe
d Co
sts
($)
Cost
of t
he S
torm
($)
Totalcost
Fixed
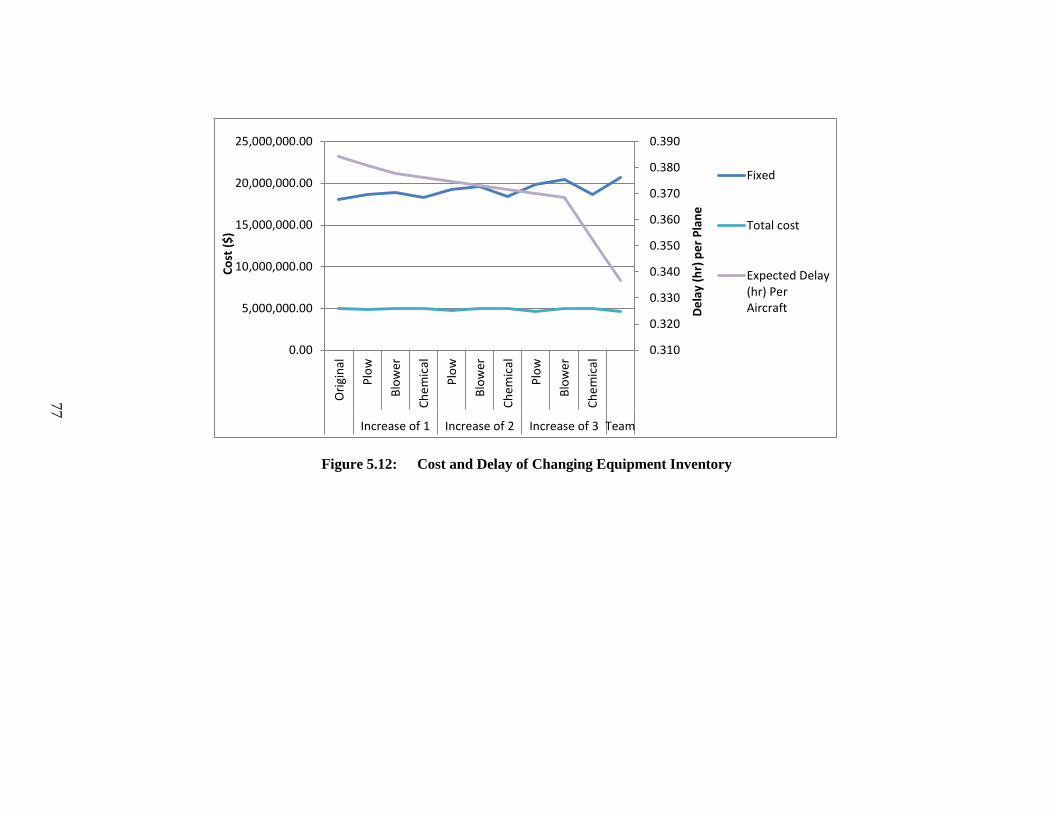
77
Figure 5.12: Cost and Delay of Changing Equipment Inventory
0.310
0.320
0.330
0.340
0.350
0.360
0.370
0.380
0.390
0.00
5,000,000.00
10,000,000.00
15,000,000.00
20,000,000.00
25,000,000.00
Orig
inal
Plow
Blow
er
Chem
ical
Plow
Blow
er
Chem
ical
Plow
Blow
er
Chem
ical
Increase of 1 Increase of 2 Increase of 3 Team
Dela
y (h
r) p
er P
lane
Cost
($)
Fixed
Total cost
Expected Delay(hr) PerAircraft
78
Increasing the inventory can have positive or negative effects. As observed in
Table 5.8, gaining a single piece of equipment will increase the cost; however, when
there are enough diverse pieces they can work together and form a group. This can
decrease the delays and thus the costs are reduced as observed in Figure 5.11. However,
having too few pieces of equipment would have a larger cost per vehicle and would
further drive the cost up as the snow and ice removal would not be met as quickly. In
turn, delays would form and thus cost, due to these delays, as seen in Figure 5.12. Having
too many pieces of equipment would increase the cost of hourly usage. Although it may
appear it would decrease the time needed to remove the snow, it would not, as the storms
occur at a given rate and cannot be expedited.
5.6 Analysis of Results
Although the average aircraft may not be delayed the exact number of hours
calculated, the measure provides a good basis to reference the relative amount of delay
that the storm may have. A smaller delay would mean the impact is minimal and similar
to normal daily operations. However, a larger expected delay is likely to create much
delay and aggregation in the system. This is what happened in December 2010. Given the
number of hours of expected delay identified in this model, one can conclude that Vienna
has the most efficient snow clearing procedure as they have the least number of expected
delay per aircraft (Table 5.4). However, when one looks at the cost of snow removal on
an equipment-hour basis, it also appears that Vienna (Figure 5.10), with the least cost of
snow removal for per unit of equipment per hour it was used, has the most efficient snow
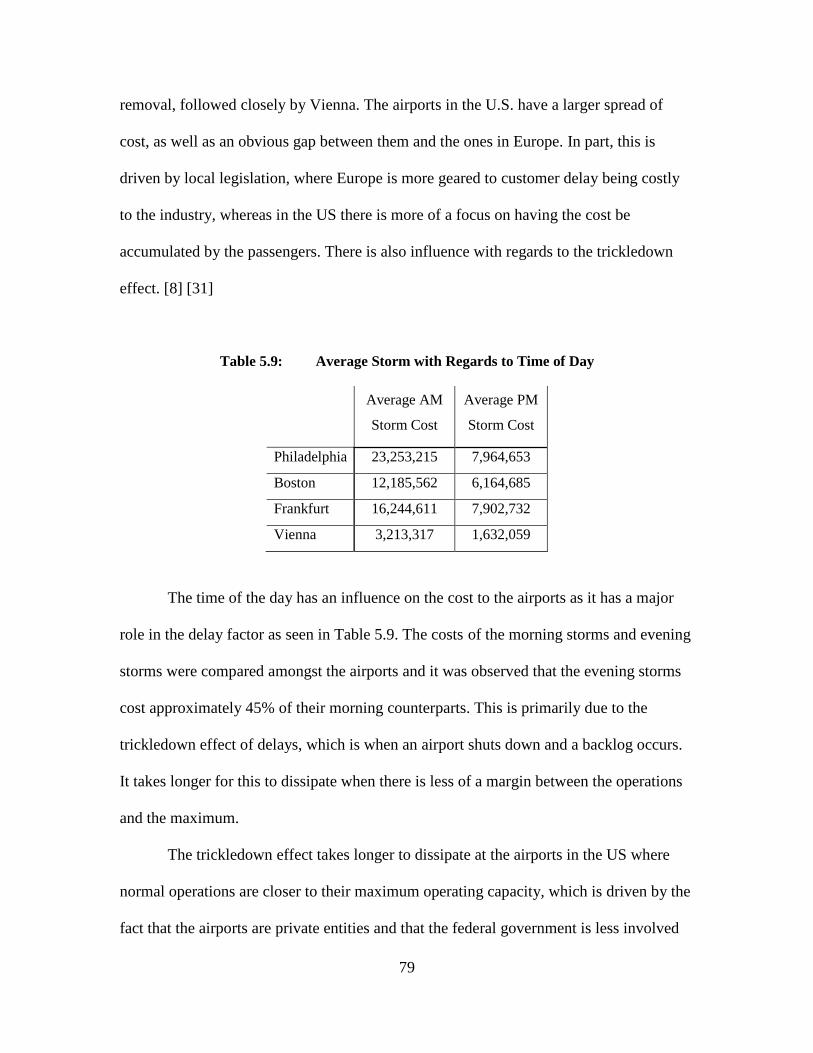
79
removal, followed closely by Vienna. The airports in the U.S. have a larger spread of
cost, as well as an obvious gap between them and the ones in Europe. In part, this is
driven by local legislation, where Europe is more geared to customer delay being costly
to the industry, whereas in the US there is more of a focus on having the cost be
accumulated by the passengers. There is also influence with regards to the trickledown
effect. [8] [31]
Table 5.9: Average Storm with Regards to Time of Day
Average AM
Storm Cost
Average PM
Storm Cost
Philadelphia 23,253,215 7,964,653
Boston 12,185,562 6,164,685
Frankfurt 16,244,611 7,902,732
Vienna 3,213,317 1,632,059
The time of the day has an influence on the cost to the airports as it has a major
role in the delay factor as seen in Table 5.9. The costs of the morning storms and evening
storms were compared amongst the airports and it was observed that the evening storms
cost approximately 45% of their morning counterparts. This is primarily due to the
trickledown effect of delays, which is when an airport shuts down and a backlog occurs.
It takes longer for this to dissipate when there is less of a margin between the operations
and the maximum.
The trickledown effect takes longer to dissipate at the airports in the US where
normal operations are closer to their maximum operating capacity, which is driven by the
fact that the airports are private entities and that the federal government is less involved
80
with them. The trickledown effect of delays in turn greatly influences the costs at the
airports.
The total cost of large volume airports such as Frankfurt is high due to the great
equipment inventory combined with the large number of passengers and freight, thus
when snow and delay are involved, the effect can be colossal. To mitigate this, having a
large inventory is necessary to keep costs related to delays from growing exponentially
quicker than the costs of the equipment. For smaller airports, costs related to an hour of
delay may be small, and thus having a large array of inventory is not justified as the cost
of the equipment is so great. It is then more cost efficient having less equipment and
doing more passes.
Although snow clearing equipment is purchased at a per unit basis and cost
variations exist due to what each piece of equipment can do and how effectively it can do
it, one must recognize that it is necessary to have the proper combination of people and
equipment to clear the runways and taxiways most effectively. Thus having excess pieces
of equipment and not having a complete team is counterproductive to having an efficient
snow clearing solution. Eventually, more equipment allows airports to clear runways in
fewer passes, thus quicker, however the cost associated with a single pass is larger. So if
the cost of an additional pass is less than the cost related to the delay of the additional
pass, then it is worth purchasing more equipment to reduce the number of passes.
However, if the opposite is true, then additional equipment is not needed or possibly even
a reduction of equipment involved in a pass is recommended.
The costs are driven by the amount of cargo and the number of passengers, and
inversely the total amount of hours the equipment is used. Thus the efficiency of the
81
snow and ice removal is proportionate to the amount of passengers and cargo that the
airport handles. As mentioned above, gaining a single piece of equipment will increase
the cost; however, when pieces work together and form a group, the delays are reduced
and thus the costs go down.
5.7 Summary of Chapter 5
The variations of the snow storms are important to allow for comparison between
the airports. It was observed that although the airports are different from one another,
trends between the airports became obvious, relative to the airport’s experience with
snow and ice and local legislation. It was also interesting to observe the efficiency of the
different airports when the ratio of total delay was compared to the number of pieces of
equipment and the hours they were in action, such that airports with significantly greater
numbers of passengers had more equipment than airports with a lesser number
passengers.
82
Chapter 6
6. CONCLUSIONS & RECOMMENDATIONS
This chapter describes the results and draws conclusions from the findings. It
provides recommendations to airports and suggests where this research is applicable. It
also points out where further development and research can and should be done.
6.1 Summary
The results show that the efficiency and effectiveness of the snow removal effort
depends on the amount of equipment/staff at the airport, the amount of air traffic at the
airport, the geometry of the airport, and finally the specifics of the storm. The geometry
of the airport can be an important factor in determining the efficiency of snow removal as
well as the amount of time and distribution of equipment needed to do the job. Airport
geometry affects the way the equipment can be implemented as well as determining the
time the equipment is commuting between two areas on the airport grounds. This is
related to the amount of time that the equipment is required to be used to remove snow
and thus how long it is in use. The distribution of the inventory of the equipment allows
for effective snow removal teams to be established.
In a given storm, the time of day influences the cost of the storm as the amount of
traffic varies with respect to the time of day. This can mean that a lot of snow for an hour
in the middle of the night may be far less costly than half the amount of snow in the
middle of the day. The amount of snow also influences snow clearance and its efficiency
as the amount determines how close together the snow removal runs should be.
83
The airport that has the least total cost is Vienna International Airport because it
has the least amount of people and cargo which pass through it. Vienna International
Airport was the only airport which had the least hours of delay per aircraft, due to having
an optimized snow and ice removal effort. The airport with the lowest cost per hour of
equipment usage is Vienna International Airport because it has the lowest ratio of
passenger and freight costs to the number of pieces of equipment.
6.2 Conclusions
In conclusion, the paper identifies a variety of factors involved in the
implementation of successful snow removal efforts. The amount of snow, the type of
snow, the wind direction, all factor into the efficiency of the snow removal effort. The
tactic used to remove the snow also has an effect. These variables, in turn, combined with
the aircraft traffic at the specific hour, allow for the amount of snow related delay to be
determined.
In order for airport management to be sufficiently prepared for winter storms, it
needs to have an overall grasp of the situation and an understanding of how systems are
interconnected. This is critical as one system failure can lead to another system being
strained and eventually also failing. This process of system failures can occur within an
airport and also between airports as was observed in December 2010 when the closure of
airports such as London and Paris resulted in long haul flights, which were already en-
route, being diverted to airports such as Frankfurt and Munich and, although they did not
fail, the added traffic combined with on-going snow removal activities resulted in
84
additional chaos, as the airports could no longer deal with some of their own scheduled
flights. This initiated a domino effect among many airports in Europe.
Through the analysis, Frankfurt airport has the most effective snow and ice
removal effort. Despite the large number of passengers and the large amount of freight
which it handles, it is able to keep the delays to a minimum and thus have low costs. This
also is important in promoting the economic desirability of the regional economy.
With regard to winter storms, having measures related to mitigating their effect is
important in reducing the overall cost to the economy. Although it may appear expensive
for an airport to have an efficient but safe snow and ice removal strategy in place, such a
strategy works to reduce delays of goods and services, and passengers. This is a
particularly sensitive issue for business travelers where trip delays can have a
significantly adverse impact on their contribution to the economy.
Each airport should justify its snow and ice removal strategy based on
determination of the amount of snow and ice that the airport typically receives on an
annual basis and the number of passengers and amount of freight that it handles. If an
airport annually receives a significant amount of snow and ice, having a large inventory
may be desired; but a large inventory may also be desired if the airport handles many
passengers or freight, where a small delay due to snow and ice can create a costly back
up. In any case, no airport that has a possibility of receiving snow or ice can afford the
risks associated with operating without adequate snow and ice counter measures.
Therefore, even these airports with the only the occasional chance of snow and ice must
at the bare minimum maintain some snow and ice removal equipment.
85
6.3 Recommendations
This research is intended to be able to be used as an example both for further
research in the field and for implementation of best practices by airport facilities. As
noted earlier, more research needs to be done in areas where snow is common throughout
most of the year, as well as at airports where snow rarely occurs. In the meantime, other
airports may be able to adapt the methodology and worksheets to input their own data,
determine their needs, and gauge their standards, based on the relative amount of snow
that they receive.
Based on the findings in this study, Philadelphia International Airport should and
Boston Logan International Airport could consider an increase in their inventory.
Frankfurt International Airport should consider maintaining its current inventory, and
potentially decreasing it by several units as they age. Vienna International Airport should
maintain its current inventory until its new construction is completed or current inventory
needs to be replaced.
6.4 Application
This research is applicable to airports that experience snow every year, but where
snow storms are an “event” and snow does not cover the terrain for significant periods of
the year, as is the case in certain airports in Russia or Scandinavia.
The research contributes to academia by providing methodology and analysis of
ways and factors that snow and ice storms influence airports. It demonstrates that many
factors influence the removal of snow and ice at airports.
86
With additional research from the academic world, it will hopefully be possible to
distinguish cost effective measures of preparedness that different airports, in different
climate zones, that receive different amounts of snow, may take to ensure minimal
disruption deriving from their snow management and make guidelines available to airport
management.
6.5 Summary of Chapter 6
It is important to understand that although the research focused only on two
American and two European airports, it can be extended to other airports and be adapted
for other situations that might arise with changes in the airports over time. The research
has been able to determine the importance of snow and ice removal and has been able to
compare the efficiency of the airports studied and to suggest whether some changes
should occur. Hopefully, further research can be done which in turn will improve and
expand the current research.
87
REFERENCES
1. "Snow and ice cause chaos as Christmas rush hit by transport delays | UK news | guardian.co.uk ." Latest US news, world news, sport and comment from the Guardian | guardiannews.com | The Guardian. [Online], Available: http://www.guardian.co.uk/uk/2010/dec/17/snow-closes-roads-airports-travel-misery [Accessed: 2 Apr. 2012].
2. Edelmann, Andreas. Personal interview. 18 Jan. 2012.
3. "Aircraft Accident Report: Air Florida, Inc, Boeing 737-222, N62AF, Collision with 14th Street Bridge, Near Washington National Airport, Washington, D.C., January 13, 1982.." Embry-Riddle Libraries. [Online]. National Transportation Safety Board, Available: libraryonline.erau.edu/online-full-text/ntsb/aircraft-accident-reports/AAR82-08.pdf [Accessed: 24 Mar. 2012].
4. "AC No 150/5200-30C: Airport Winter Safety and Operations." Federal Aviation Administration. [Online] Available: www.faa.gov/documentLibrary/media/Advisory_Circular/150_5200_30c_consolidated.pdf [Accessed: 11 Apr. 2012].
5. Financial Times. "Snow brings chaos across Europe." Financial Times. [Online] Available: http://www.ft.com/intl/cms/s/0/9d24bb04-09fc-11e0-9bb4-00144feabdc0.html#axzz1q37rDmIf [Accessed: 24 Mar. 2012].
6. Ormsby, Avril. "Snow and ice disrupt pre-Christmas travel in Europe." Business & Financial News, Breaking US & International News | Reuters.com. [Online] Available: http://www.reuters.com/article/2010/12/19/us-europe-weather-idUSTRE6BI0WZ20101219 [Accessed: 2 Apr. 2012].
7. "Monday's Travel and Weather Updates - RTÉ News." RTÉ Ireland's National Television and Radio Broadcaster. [Online] Available: http://www.rte.ie/news/2010/1220/weather.html [Accessed: 2 Apr. 2012].
8. "EUR-Lex - 32004R0261 - EN." EUR-Lex” Access to European Union law. [Online] Available: http://eur-lex.europa.eu/LexUriServ/LexUriServ.do?uri=CELEX:32004R0261:EN:HTML [Accessed: 9 Feb. 2012].
9. "Fraport AG | en." Fraport AG | en. [Online] Available: http://www.fraport.com [Accessed: 14 Sept. 2011].
10. "Vienna Airport." Vienna Airport. [Online] Available: www.viennaairport.com
88
[Accessed: 14 Sept. 2011].
11. "Order 7110.65R: Air Traffic Control." Federal Aviation Administration. [Online] Available: www.faa.gov/documentLibrary/media/Order/ND/7110.65R.pdf [Accessed: 3 Apr. 2012].
12. Janic, Milan. "Modeling Airport Operations Affected by a Large Scale Disruption." Journal of Transportation Engineering 4 (2009): 206-216. Print.
13. "An Analysis of Airport Snow Removal and Ice Control." Defense Technical Information Center. [Online] Federal Aviation Administration, Available: www.dtic.mil/dtic/tr/fulltext/u2/711126.pdf [Accessed 11 Apr. 2012].
14. "AC No: 150/5220-20: Airport Snow and Ice Control Equipment." Federal Aviation Administration. [Online] Available: www.faa.gov/documentLibrary/media/advisory_circular/150-5220-20/150_5220_20.PDF [Accessed: 11 Apr. 2012].
15. Improved planning could help FAA address challenges related to Winter weather operations. Washington, D.C: U.S. Govt. Accountability Office, 2010. Print.
16. Quilty, Stephen M.. Preventing vehicle-aircraft incidents during winter operations and periods of low visibility. Washington, DC: Transportation Research Board, 2008. Print.
17. "PHL - Philadelphia International Airport." PHL - Philadelphia International Airport. [Online] Available: http://www.phl.org [Accessed: 14 Sept. 2011].
18. "FAA: Home." FAA: Home. [Online] Available: http://www.faa.gov [Accessed: 24 Mar. 2012].
19. "Massport." Boston Logan. [Online] Available: http://www.massport.com [Accessed: 14 Sept. 2011].
20. "World Meteorological Homepage | WMO." World Meteorological Organization. [Online] Available: http://www.wmo.int/pages/index_en.html [Accessed: 24 Mar. 2012].
21. Nilsson, Fredrik. "Friction Testing at Swedish Airports." International Airport Review 14.2 (2010): 46-47. Print.
22. "May 2011 National Occupational Employment and Wage Estimates." U.S. Bureau of Labor Statistics. [Online] Available: http://www.bls.gov/oes/current/oes_nat.htm [Accessed: 31 Mar. 2012].
23. "Gas Prices -- Gasoline, Petrol, Fuel Prices." Cost of Living. [Online] Available: http://www.numbeo.com/gas-prices/city_result.jsp [Accessed: 24 Jan. 2012].
89
24. McCormick, Carroll. "Deicing with Infrared." Airports International 41.1 (2007): 28-29. Print.
25. "Aircraft Ground Deicing." FAA: Home. [Online] Available: http://www.faa.gov/other_visit/aviation_industry/airline_operators/airline_safety/deicing [Accessed: 31 Mar. 2012].
26. "Air Traffic Organization Policy." FAA. [Online]. Available: www.faa.gov/documentLibrary/media/Order/7110.65TCHG1.pdf [Accessed: 2 Apr. 2012].
27. "Aircraft Characteristics | Airbus, a leading aircraft manufacturer." Airbus, a leading aircraft manufacturer | A320, A330, A340, A350 XWB & A380 Families of passenger and freighter aircraft. [Online] Available: http://www.airbus.com/support/maintenance-engineering/technical-data/aircraft-characteristics [Accessed: 5 Apr. 2012].
28. "Boeing: Commercial Airplanes - Commercial Aviation Services - Flight Operations - Airport Technology - Airplane Characteristics for Airport Planning." The Boeing Company. [Online] Available: http://www.boeing.com/commercial/airports/plan_manuals.html [Accessed: 5 Apr. 2012].
29. Flight. "Global Flight Status and Airport Information." Global Flight Status and Airport Information. [Online] Available: http://www.flightstats.com [Accessed: 24 Jan. 2012].
30. "2011-2012 Holdover Time Tables." Federal Aviation Administration. [Online]. Available: www.faa.gov/other_visit/aviation_industry/airline_operators/airline_safety/deicing [Accessed: 31 Mar. 2012].
31. "Aviation Consumer Protection and Enforcement." US Department of Transportation. [Online] Available: http://www.airconsumer.dot.gov/publications/flyrights.htm [Accessed: 9 Feb. 2012].
32. "Enhancing Airline Passenger Protections II - Final Regulatory Analysis." Regulations.gov. [Online] Available: http://www.regulations.gov/#!documentDetail;D=DOT-OST-2010-0140-2046 [Accessed: 22 Apr. 2011].
33. Silverman, Eric. Phone interview. 25 Jan. 2012.
34. Wieners, William. Email interview. 14 Nov. 2011.
35. Richter, Roger. Email interview. 1 Jan. 2012.

90
36. Payne, Robert. "Frankfurt Weathers the Winter Challenge." International Airport Review 15.1 (2011): 49-52. Print.
37. International Airport Review. "Vienna International Airport Prepares for the Winter." International Airport Review 14.2 (2010): 40-45. Print.
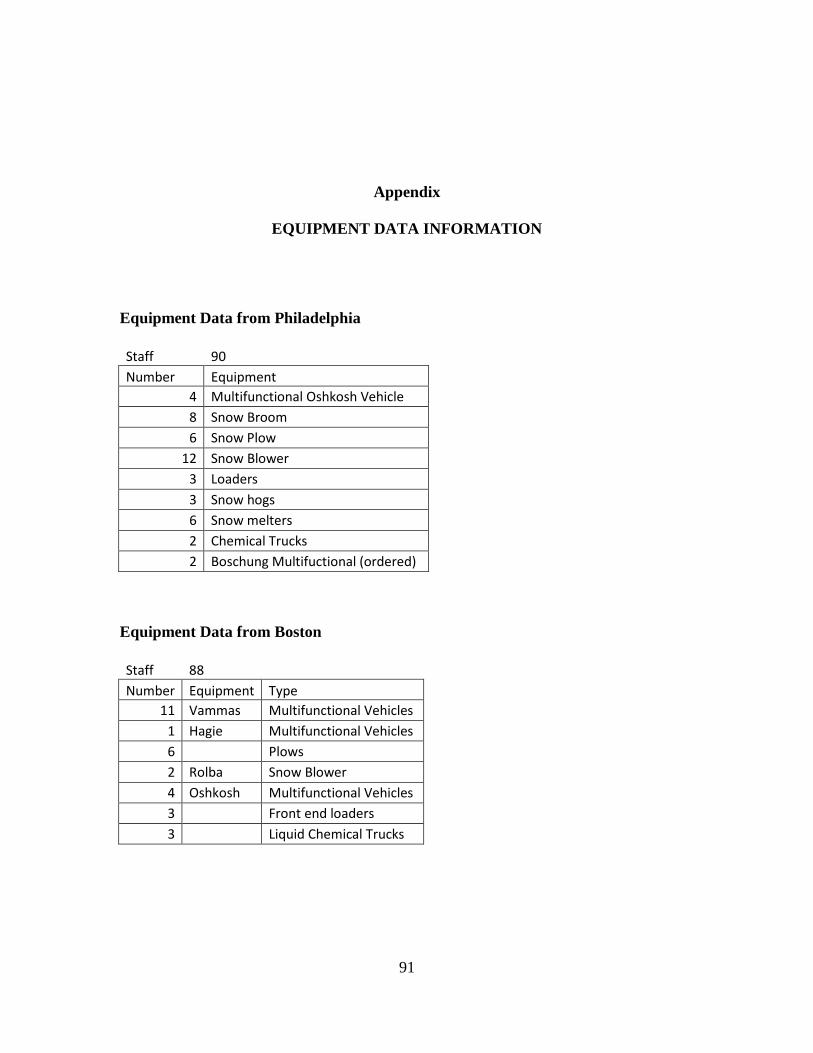
91
Appendix
EQUIPMENT DATA INFORMATION
Equipment Data from Philadelphia
Staff 90 Number Equipment
4 Multifunctional Oshkosh Vehicle 8 Snow Broom 6 Snow Plow
12 Snow Blower 3 Loaders 3 Snow hogs 6 Snow melters 2 Chemical Trucks 2 Boschung Multifuctional (ordered)
Equipment Data from Boston
Staff 88 Number Equipment Type
11 Vammas Multifunctional Vehicles 1 Hagie Multifunctional Vehicles 6 Plows 2 Rolba Snow Blower 4 Oshkosh Multifunctional Vehicles 3 Front end loaders 3 Liquid Chemical Trucks
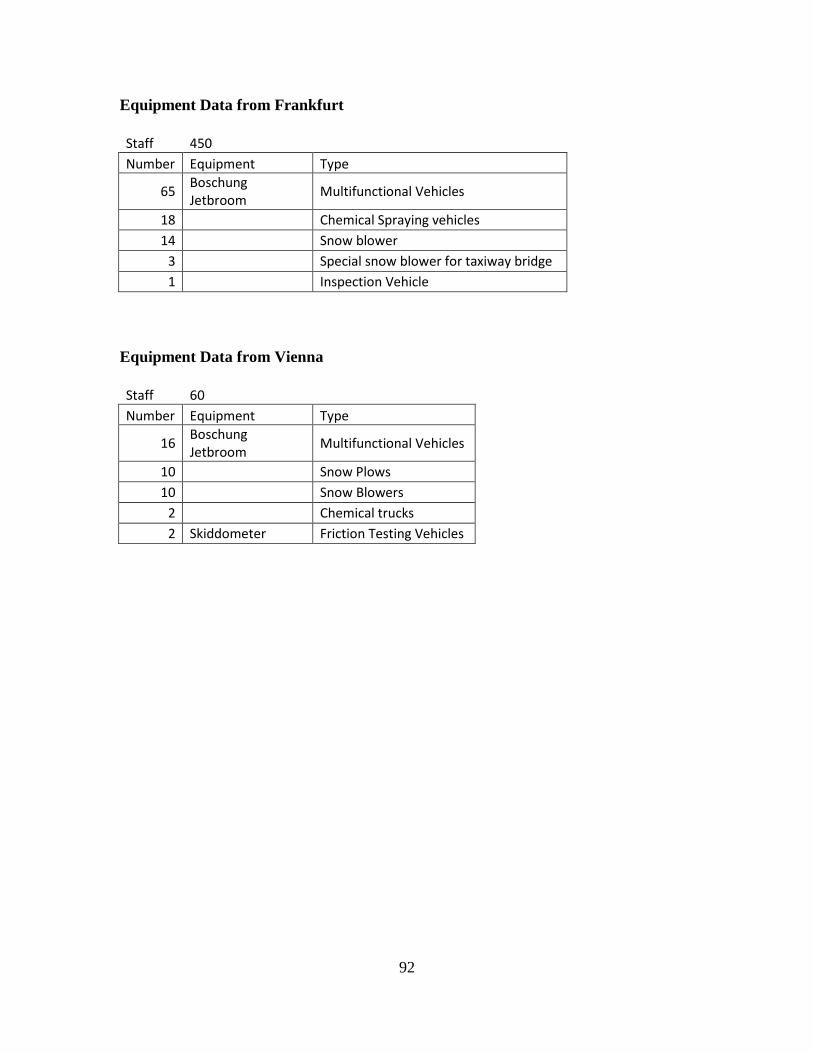
92
Equipment Data from Frankfurt
Staff 450 Number Equipment Type
65 Boschung Jetbroom Multifunctional Vehicles
18 Chemical Spraying vehicles 14 Snow blower
3 Special snow blower for taxiway bridge 1 Inspection Vehicle
Equipment Data from Vienna
Staff 60 Number Equipment Type
16 Boschung Jetbroom Multifunctional Vehicles
10 Snow Plows 10 Snow Blowers
2 Chemical trucks 2 Skiddometer Friction Testing Vehicles