Embed Size (px)
DESCRIPTION
Studing of non-linearity of TileCal s modules TileCal Calibration Tile 2002-2003 testbeam. Lucia Batkova, Lukas Pribyl. 1/3 Analysis:. Motivation: Energy deposited by muon depends non-linearly on muon path lenght for all studed muon signal definitions (mop, TM, mean). - PowerPoint PPT Presentation
Citation preview

Studing of non-linearity Studing of non-linearity of of TileCalTileCals modules s modules
TileCal Calibration TileCal Calibration Tile 2002-2003 testbeamTile 2002-2003 testbeam
Lucia Batkova, Lukas Pribyl
1/3 1/3 Analysis:Analysis:
26.07.09 Lucia Báťková, University Comenius in Bratislava 2
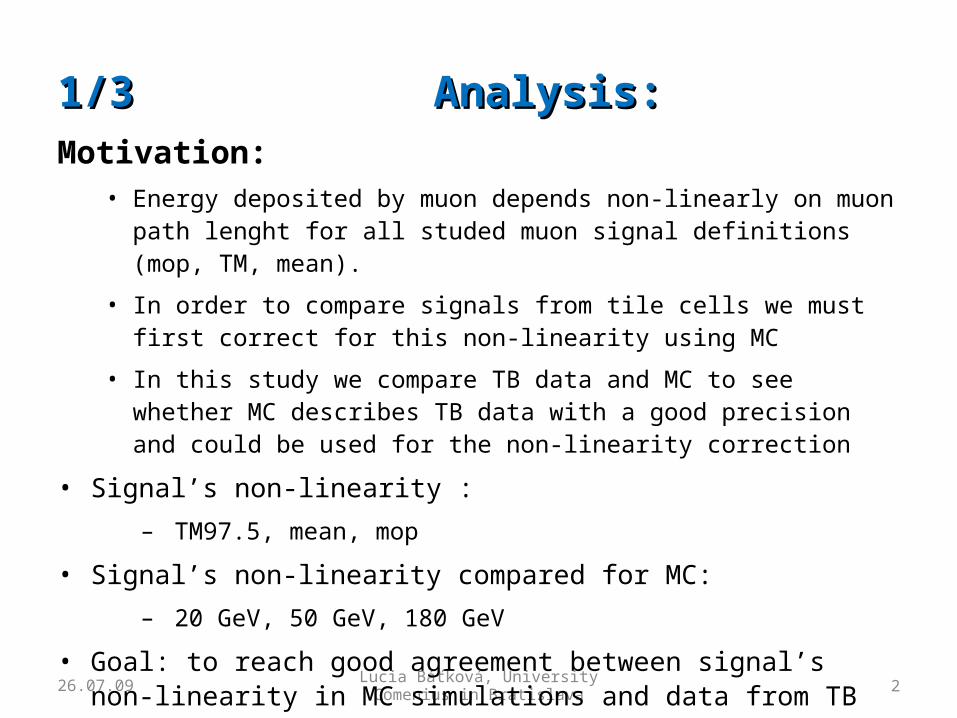
Motivation:• Energy deposited by muon depends non-linearly on muon path lenght
for all studed muon signal definitions (mop, TM, mean).
• In order to compare signals from tile cells we must first correct for this non-linearity using MC
• In this study we compare TB data and MC to see whether MC describes TB data with a good precision and could be used for the non-linearity correction
• Signal’s non-linearity :
– TM97.5, mean, mop
• Signal’s non-linearity compared for MC:
– 20 GeV, 50 GeV, 180 GeV
• Goal: to reach good agreement between signal’s non-linearity in MC simulations and data from TB

2/3 2/3 Analysis:Analysis:
Athena Release 15.0.0 was used to MC simulation of each tilerow of EB(D0) module (180 GeV muons at 90°)
From TB data were used:• July02 (+EB module IFA42)
• June02 (+EB module IFA59)
• July03 (+EB, LB)
Muon beam at 90° to +EB/LB modul (TB data), to +EBD/BA-C module (MC).
tile row # 7 is presented
63 cm
120.6 cm
174.6 cm 223.2
cm 252 cm 262.8
cm
Muon beam at 90° throught 7th Tile row

26.07.09 Lucia Báťková, University Comenius in Bratislava
2/3 2/3 Analysis:Analysis:
Cuts used in TB data:1. Beam chambers (S1cou, S3cou, Xcha2-Xch1,
Ycha2-Ycha1, Ximp, Yimp)
‒ In level 2σ
1. Condition E dep per cell > 1σnoise must be satisfied
(for each cell individually)
– 1σnoise was obtained from spectrum of noise fitted by Gauss

1/2 1/2 Muon signal / muon path length Muon signal / muon path length expressed by expressed by TM97.5TM97.5
26.07.09 Lucia Báťková, University Comenius in Bratislava 5
• Effect of first cell –> signal of first cell is lower than other=> Data Preparation (2-Jul-08) - Uniformity with 90 deg muons (Tomas, Ana)
• MC normalized to data at ~ 63 cm.• Muon signal summed from cells (both PMTs) in tile row. • After normalization MC to data residual difference less ~ 3%.
3%
July02

2/2 2/2 Muon signal / muon path length Muon signal / muon path length expressed by expressed by TM97.5TM97.5
26.07.09 Lucia Báťková, University Comenius in Bratislava 6
TM97.5 = 2.5% the highest energy events are truncated
• After normalization MC to data residual difference
• June02 ~ 1%.• July02 ~ 3%.• July03 ~ 2%.
July02June02
July03

Muon signal / muon path length Muon signal / muon path length expressed by expressed by MopMop
26.07.09 Lucia Báťková, University Comenius in Bratislava 7
Mop is obtained:- convolution L*G fit
• After normalization MC to data residual difference
• June02 ~ 5%• July02 ~ 2%• July03 ~ 2%
June02 July02
July03

Muon signal / muon path length Muon signal / muon path length expressed by expressed by meanmean
26.07.09 Lucia Báťková, University Comenius in Bratislava
8
• MC normalized to data at ~ 63 cm. • Residual difference between MC
and data ~ 7%
June02 July02
July03

Summary: 3 definition for 3 periodSummary: 3 definition for 3 period
26.07.09 Lucia Báťková, University Comenius in Bratislava 9

26.07.09 Lucia Báťková, University Comenius in Bratislava 10
Signal’s non-linearity vs. energies (MC only)Signal’s non-linearity vs. energies (MC only)
Tile row 2 – only result from MC→ mop is least dependent on energy of muon
• Ionization losses mostly contribute to curve under mop
• Radiation losses contribute to right half of curve which are account to mean and TM97.5

Muon signal vs. deposited energy (only MC) Muon signal vs. deposited energy (only MC)
26.07.09 Lucia Báťková, University Comenius in Bratislava
• Values obtained in 235.8 cm muon path length (similar path length which pass projective muon in EB), tilerow # 2
• Mop is least dependent on muon momentum of energy.
• It could be used in analysis of cosmic muon
Energy[GeV]
Mean Mop TM97,5
20 1.258 1.211 1.221
50 1.462 1.21 1.360
180 2.066 1.29 1.690
180/20 1.64 1.11 1.44

Muon signal in LB moduleMuon signal in LB module
Muon beam at 90° throught 2nd Tile rowMC normalized to data at the end of LB module

Muon signal / muon path length Muon signal / muon path length expressed by expressed by TM97.5TM97.5 and and MopMop
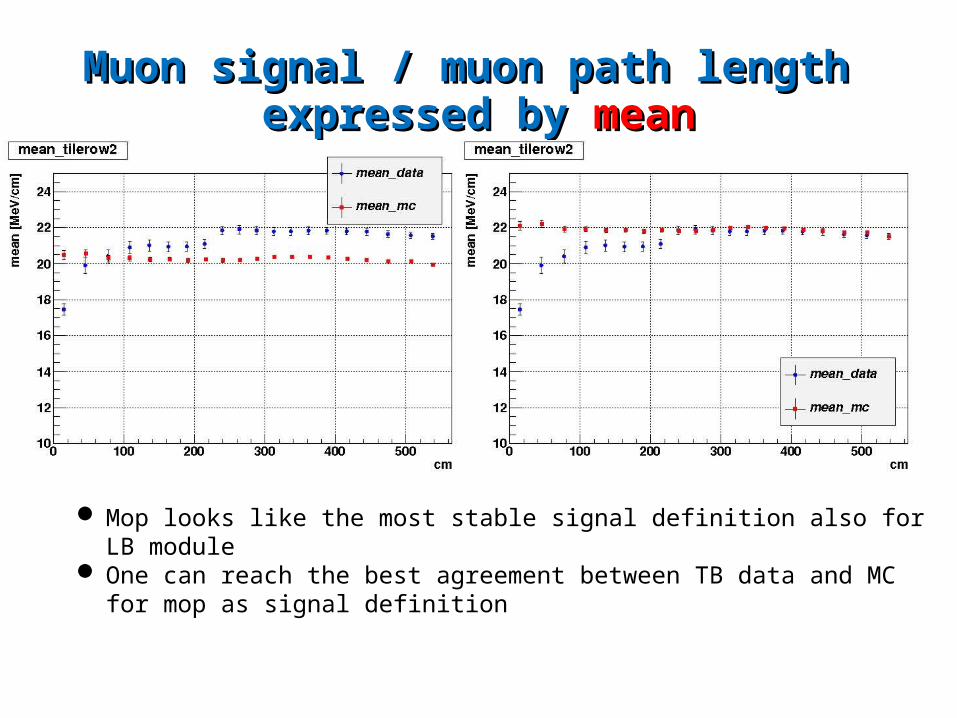
Muon signal / muon path length Muon signal / muon path length expressed by expressed by meanmean
Mop looks like the most stable signal definition also for LB module One can reach the best agreement between TB data and MC for mop as
signal definition
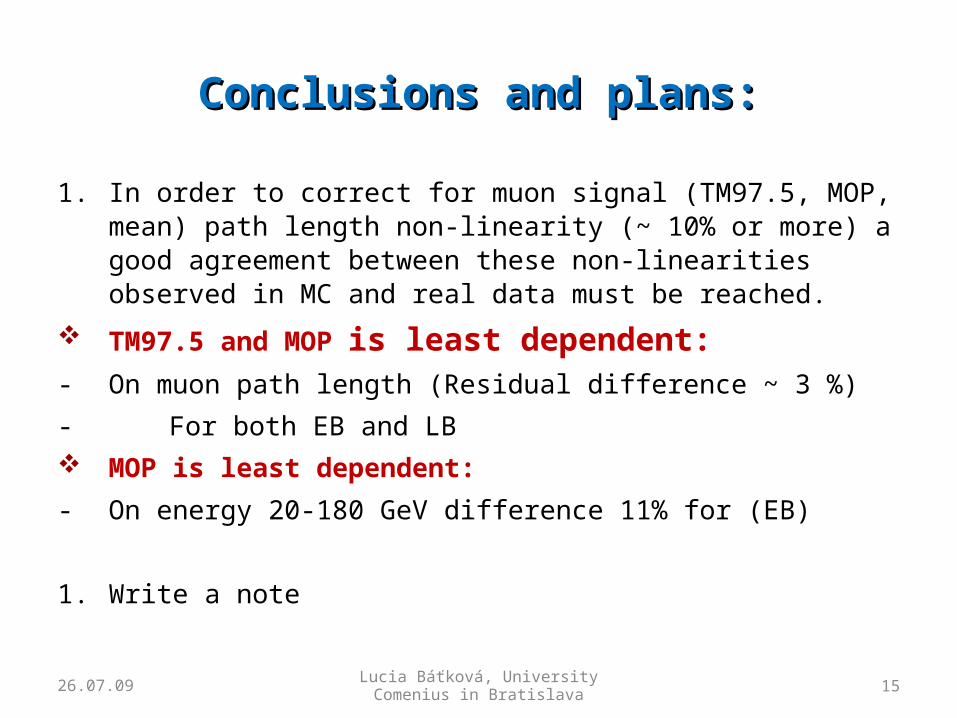
Conclusions and plans:Conclusions and plans:
1. In order to correct for muon signal (TM97.5, MOP, mean) path length non-linearity (~ 10% or more) a good agreement between these non-linearities observed in MC and real data must be reached.
TM97.5 and MOP is least dependent:- On muon path length (Residual difference ~ 3 %)
- For both EB and LB
MOP is least dependent:
- On energy 20-180 GeV difference 11% for (EB)
1. Write a note
26.07.09 Lucia Báťková, University Comenius in Bratislava 15

26.07.09 Lucia Báťková, University Comenius in Bratislava 16

Muon signal MopMuon signal Mop

Muon signal TM97.5 Muon signal TM97.5

Muon signal meanMuon signal mean

Muon signal / muon path length Muon signal / muon path length
Lucia Báťková, University Comenius in Bratislava 20