Embed Size (px)
Citation preview


Dissertation for the Degree of Doctor of Philosophy (Faculty of Pharmacy) inAnalytical Pharmaceutical Chemistry presented at Uppsala University in 2002.
ABSTRACT
Stubberud, K. 2002. Studies of Micellar Electrokinetic Chromatography as anAnalytical Technique in Pharmaceutical Analysis – an Industrial Perspective.Acta Universitas Upsaliensis. Comprehensive Summaries of UppsalaDissertations from the Faculty of Pharmacy 271. 40 p. Uppsala. ISBN 91-554-5281-7.
Studies have been performed to evaluate the use of micellar electrokineticchromatography (MEKC), one mode of capillary electrophoresis (CE), as ananalytical technique in industrial pharmaceutical analysis. The potential for usingchemometrics for the optimisation of MEKC methods has also been studied aswell as the possibilities of coupling MEKC with mass spectrometry (MS).Two methods were developed, one for the determination of ibuprofen andcodeine and another for pilocarpine, together with their degradation productsand impurities in both cases. MEKC was found to be the most suitable mode ofCE for the methods. Both methods were optimised by means of experimentaldesign. Valuable information was gathered and optimum conditions weredefined which resulted in fast systems with baseline-separated peaks. Theibuprofen-codeine method was validated according to the recommendedvalidation procedures of the International Conference of Harmonisation. Thevalidation was performed on a commercially available tablet formulation to verifythe suitability of the method, i.e. for quantification of the two main compoundsand to determine the degradation products and impurities in area% of each mainpeak. The following parameters were determined: selectivity, linearity, accuracy,precision, detection limit, quantitation limit, robustness and range. The resultsconfirm that the method is highly suitable for its intended purpose, i.e. as aroutine method for assay and impurity determination. The MEKC method foribuprofen-codeine was coupled to a mass spectrometer in order to evaluate thepotential of partial filling (PF)-MEKC-MS for identification of impurities inpharmaceutical substances and products. The so-called partial-filling techniquewas used to prevent the non-volatile micelles from entering the MS and wasshown to fulfil its purpose of providing detection limits of about 10 pg.The study clearly shows that micellar electrokinetic chromatography is well-suited as an analytical technique in industrial pharmaceutical analysis.
Karin Stubberud, Analytical Development, AstraZeneca R&D Södertälje, SE-15185 Södertälje, Sweden
Karin Stubberud 2002
ISSN 0282-7484ISBN 91-554-5281-7
Printed in Sweden by Uppsala University, Tryck och Medier, Uppsala 2002

3
CONTENTS
Papers discussed 4
1 INTRODUCTION 51.1 Product quality – pharmaceutical aspects 51.2 Pharmaceutical analysis – analytical methods 51.3 Capillary electrophoresis 6
1.3.1 Theory 61.3.2 Modes of capillary electrophoresis 71.3.3 Micellar electrokinetic chromatography 81.3.4 Capillary electrophoresis in pharmaceutical analysis 8
1.4 Chemometrics 91.4.1 Theory 91.4.2 Chemometrics in pharmaceutical analysis 10
1.5 Mass spectrometry 101.6 MEKC-MS 11
1.6.1 Partial-filling technique 121.7 Validation in pharmaceutical analysis 131.8 Pilocarpine, ibuprofen and codeine in pharmaceutical analysis 14
2 AIM OF STUDY 173 EXPERIMENTAL 18
3.1 Equipment 183.2 Chemicals 183.3 General procedures 19
4 RESULTS AND DISCUSSION 204.1 Method development 20
4.1.1 The ibuprofen-codeine method development (paper II) 204.2 Screening and optimisation with fractional factorial design 21
4.2.1 Screening processes (papers I and II) 214.2.2 Optimisation processes (papers I and II) 23
4.3 Validation of the ibuprofen-codeine method (paper III) 274.4 Coupling the MEKC method for ibuprofen-codeine to massspectrometry (paper IV and V) 284.5 Industrial considerations 31
5 CONCLUSIONS 346 ACKNOWLEDGEMENTS 357 REFERENCES 36

4
Papers discussed
This thesis is based on the following papers, which are referred to by theirRoman numerals in the text.
Paper I K. Persson, O. ÅströmFractional Factorial Design Optimization of the Separation of Pilocarpine and its Degradation Products by Capillary ElectrophoresisJ. Chromatogr. B, 697 (1997) 207-215.
Paper II K. Persson Stubberud, O. ÅströmSeparation of Ibuprofen, Codeine Phosphate, theirDegradation Products and Impurities by CapillaryElectrophoresis. I. Method Development and Optimizationwith Fractional Factorial DesignJ. Chromatogr. A, 798 (1998) 307-314.
Paper III K. Persson Stubberud, O. Åström Separation of Ibuprofen, Codeine Phosphate, theirDegradation Products and Impurities by CapillaryElectrophoresis. II. ValidationJ. Chromatogr. A, 826 (1998) 95-102.
Paper IV K. Stubberud, A. Forsberg, K. Callmer, D. WesterlundPartial filling micellar electrokinetic chromatographyoptimisation studies of ibuprofen, codeine and degradationproducts, and coupling to mass spectrometry. Part I.Electrophoresis, 23 (2002) 572-577.
Paper V K. Stubberud, K. Callmer, D. WesterlundPartial filling micellar electrokinetic chromatographyoptimisation studies of ibuprofen, codeine and degradationproducts, and coupling to mass spectrometry. Part II.Electrophoresis. Submitted.
Reprints were made by kind permission of the journals.

5
1 INTRODUCTION
1.1 Product quality – pharmaceutical aspects
Drug regulatory authorities (e.g. the US Food and Drug Administration(FDA) or the Medical Products Agency (MPA) in Sweden) requiremanufacturers of pharmaceutical products to comply with the regulationsof Good Manufacturing Practice (GMP). GMP is an important part ofquality assurance, its aim being to guarantee that the product ismanufactured and controlled according to a quality standard which issuitable for its intended use.
According to Banker et al. [1], the term quality requires a pharmaceuticalproduct:- to contain the quantity of each active ingredient claimed on its label, i.e.within the applicable limits of its specifications- to contain the same quantity of active ingredient from one dosage unit tothe next- to be free from extraneous substances- to maintain its potency, therapeutic availability and appearance untilused- upon administration, to release the active ingredient for full bioavailability
By adopting analytical test methods, it is possible to check that the abovecriteria are satisfied.
1.2 Pharmaceutical analysis – analytical methods
The development of analytical methods is an important aspect ofpharmaceutical analysis. Through the application of different techniques,quantitative and qualitative determinations are performed, by which ismeant determination of the active compound, excipients, degradationproducts and impurities separately as well as in pharmaceuticalformulations. Moreover, when developing new products, it is important tostudy the stability profile of the active pharmaceutical ingredient itself, thefinal formulation and also the homogeneity of the formulation.
Most of the analytical techniques used in pharmaceutical analysis can bedivided into three main areas, namely spectroscopy, chromatography andelectrochemistry. Other techniques such as titrimetry and thermalanalyses are also used. Spectroscopy and chromatography, especiallyhigh-performance liquid chromatography (HPLC), are the predominanttechniques used. HPLC is characterised by its particular ability to

6
separate molecules, which differ only slightly in their physichochemicalproperties.The Swedish chemist Arne Tiselius was awarded the Nobel Prize in 1948for his work on chromatography and also for establishing electrophoresisas a separation technique [2]. In the 1960s S. Hjertén laid the groundworkfor capillary electrophoresis separations (CE) [3] and in 1981 Jorgensonand Lukacs [4] showed that CE was a viable analytical technique. Interestin CE has increased in the last few years, as evidenced by the increase inthe number of published articles. While HPLC is a mature technique, CEis still the subject for development. The main advantages of CE are highresolution, high efficiency and often fast method development.Furthermore, since CE is a capillary technique, the volumes of samples,buffers and organic solvents are very small compared to HPLC, whichgives both financial and environmental advantages. Its main weaknessesare sensitivity, reproducibility and quantification, which need to beimproved.
1.3 Capillary electrophoresis
1.3.1 Theory
CE as a separation technique utilises the differences in migration rates ofcharged species in an electric field in a narrow bore capillary [5]. A fused-silica capillary, (1) in Fig. 1, is negatively charged at the capillary wallwhen pH > 2. The capillary is filled with a buffer (3) and the cationicspecies from the buffer is attracted to the capillary wall, whereupon a so-called double layer of ions is created at the wall. The sample (4) isintroduced into the capillary by one of several injection techniques, e.g.hydrodynamic injection, where a homogeneous sample plug is introducedinto the capillary by pressure or vacuum. When a voltage (2) is applied tothe capillary, a cathode and an anode develop at the electrodes (5). Thebuffer moves relative to the charged wall and an electroosmotic flow(EOF), with mobility µeof, will occur. The size and direction of the EOFdepend on the material of the capillary wall and the composition of thebuffer. There are different possibilities of modifying the buffer, e.g. byadjusting the pH and ionic strength or through the addition of organicsolvents or modifiers such as cyclodextrins, bile salts, micelles andcelluloses.

7
Figure 1. A capillary electrophoresis instrument.
In the most common CE technique, capillary zone electrophoresis (CZE),the species in the sample migrate with different velocities, µep, due to theircharge/mass ratio. A small, positively charged molecule will migraterapidly towards the cathode and reach the detector (6) window before anegatively charged molecule, for example.The linear velocity (v) of a migrating ion is given by:
v = µep ⋅ E
where µep is the electrophoretic mobility of the ion and E is the appliedelectric field.In the presence of an EOF the measured mobility, called the apparentmobility, µapp, is given by:
µapp = µep + µeof or µapp = vapp/E = (Ld ⋅ Lt)/(V ⋅ t)
where µeof is the EOF mobility, vapp is the apparent velocity, Ld is thecapillary length to the detector, Lt is the total capillary length, V is theapplied voltage and t is the migration time. The unit of µapp is (cm2/Vs).
1.3.2 Modes of capillary electrophoresis
There are alternative modes of CE. One of them is capillary gelelectrophoresis, where gel-filled capillaries can be used for efficientseparations of macromolecules. Capillary isoelectric focusing is theseparation of ampholytes in a pH gradient. Based on their isoelectricpoints, pI, it is possible to separate peptides and proteins, for example. Incapillary isotachophoresis the sample is applied between a leading and aterminating electrolyte, resulting in an efficient concentration of thesample. Capillary electrochromatography, CEC, is a recent mode of CE,which is a hybrid of CE and HPLC [6, 7]. Silica-based solid-phase
1
2
3 3 5 5
6
7
(+ ) (-) 4

8
capillaries are generally used; the EOF transports the solvent and theanalytes will separate according to the combined principles ofelectrophoresis and chromatography. The advantages of using EOF forgenerating the flow is that the column efficiency increases and that itallows the use of smaller particles than those used in HPLC. Anothercombination of electrophoretic and chromatographic principles is micellarelectrokinetic chromatography (MEKC), as described below.
1.3.3 Micellar electrokinetic chromatography
Micellar electrokinetic chromatography (MEKC) is a combinationtechnique of electrophoresis and chromatography which was developedby S. Terabe et al. in 1984 [8, 9]. It is a useful CE technique due to itsability to separate both charged and neutral species. Micelles consist ofsurfactants that can form aggregates at concentrations above their criticalmicelle concentration (CMC). The aggregates are often spherical, withhydrophobic tails oriented towards the centre and hydrophilic headsoriented towards the surrounding aqueous buffer. The micelle surfactantsare either charged or neutral and migrate against or with the EOF. Thepossibility of neutral species to partition in and out of the micelle mayresult in separation, provided the surfactant is charged. Hydrophobicspecies interact more strongly with the micelle and so migrate latercompared to a more hydrophilic species, which are transported by theEOF. Charged compounds also interact with charged micelles throughelectrostatic forces. With this technique, the charge, size and polarity ofthe analytes affect the separation, resulting in the possibility of enhancedseparation. The mobility of the micelle, µmc, can be determined by using ahydrophobic compound, which will be totally incorporated into the micelle.
1.3.4 Capillary electrophoresis in pharmaceutical analysis
MEKC has been shown to be a useful tool in pharmaceutical analysis.The anionic micellar agent sodium dodecyl sulfate (SDS) is usedpredominantly for the separation of, for example, antibiotics, barbiturates,vitamins and drugs of abuse [10]. The interest in CE in pharmaceuticalanalysis stems from the high separation efficiencies and short analysistimes. Further, since CE separates compounds according to their size andcharge, it provides an alternative separation technique to HPLC with adifferent mechanism. Commercial instruments allowing the use of variousdetectors besides the common ultraviolet-visible detector, e.g. the massspectrometer, extend its applicability. The generally short duration ofmethod development, the simple instrumentation and the small sampleand electrolyte volumes are, of course, interesting from financial andenvironmental perspectives [11–13].

9
1.4 Chemometrics
1.4.1 Theory
Chemometrics is the application of statistical and mathematical analysisto chemical problems. It is a compendium of methods for the design andanalysis of laboratory experiments [14]. Through the use ofchemometrics, large amounts of experimental data can be analysed togive the maximum of information. The traditional way of doing chemicalexperiments is to vary one parameter at a time, i.e. in a univariate design;however, this is time-consuming and will not give information aboutpossible interactions between parameters of interest.
In an experimental design the factors are varied in a pre-designed wayand the results (the responses) are connected by means of amathematical model [15, 16]. Several experiments are performed in orderto determine the relationship between the responses and the factors. In afull factorial design all combinations of k factors at a high and a low levelare studied. A full factorial design will therefore contain 2k experiments,and it is possible to determine all the main effects and all the interactioneffects. With an increasing number of factors, the number of experimentswill increase exponentially, and it can be assumed that the interactioneffects between three or more factors are negligible. With fractionalfactorial design, it is possible to reduce the number of experiments andstill get valuable information by focusing on the main effects. A fractionalfactorial design will have different so-called resolutions, depending on thenumber of runs. For instance, for resolution III, the main effects areconfounded with two factor interactions, for resolution IV, the two-factorinteractions are confounded with each other, and for resolution V, themain effects and all two-factor interactions are separated from each other.Replicating center points are added to check for curvature (quadraticeffects) and interactions (cross-product terms) in the model, to obtain anindependent estimate of error and to illustrate the reproducibility of themethod.
The multivariate method of partial least squares (PLS) [17] or multiplelinear regression (MLR) can be used to find quantitative relations betweenthe responses and the factors. The model explains the variations in theresponses in the terms R2 and Q2, where R2 denotes the fraction of thevariation explained by the model and Q2 denotes the fraction of thevariation that can be predicted by the model. The possible values are inthe range 0–1.0, with 1.0 revealing the existence of a model with excellentpredictive power.The model can be used for interpretation, prediction and optimisation.

10
1.4.2 Chemometrics in pharmaceutical analysis
Chemometrics has been successfully used in pharmaceutical analysis inthe optimisation and validation of analytical methods. Several papersdescribe the optimisation and robustness testing of HPLC [18–20] and CEmethods [21–23]. It was concluded from these studies that an increasedunderstanding of the systems was achieved and that the correct use ofappropriate experimental design is of considerable benefit in evaluatingthe robustness of HPLC and CE methods.
Chemometrics can also be used for stability testing of pharmaceuticalsubstances and products. Stability studies normally require largeresources in terms of time, personnel and equipment. Various forms offactorial designs such as matrix design and bracketing [24–26] make itpossible to reduce these parameters. The International Conference ofHarmonisation (ICH) also describes the use of matrixing and bracketing[27].
1.5 Mass spectrometry
Mass spectrometry provides quantitative and qualitative information aboutcompositions of inorganic and organic materials. The mass spectrometerproduces charged particles that consist of the parent ion and ionicfragments of the original molecule. These ions are sorted according totheir mass/charge ratio. The selectivity and sensitivity are the mainadvantages of mass spectrometry for its ability to identify unknowns orconfirming a suspected compound. Different ionisation techniques andmass analysers are available, which enhances the possibilities ofdesigning suitable methods for different kinds of problem. Electrosprayionisation (ESI) and the quadrupole mass analyser are common tools andhave been used in this study.
Electrospray is a gentle form of ionisation, which allows analytes in liquidsolutions to form gaseous ions. In the presence of a strong electric field afine spray containing highly charged droplets is created. The droplet sizeis reduced by vaporization, the ions finally leaving the droplet and enteringthe mass analyser.
In a quadrupole mass analyser a field is formed by four electricallyconducting, parallel rods in which the opposite pairs of electrodes areconnected. One pair is held at +Udc volts and the other at –Udc volts. The

11
ions proceed in cycles through the quadrupole and the lighter the mass,the lower number of cycles before it is collected by the electrode.Interfacing with separation techniques is most often necessary and MShas been successfully coupled to gas chromatography (GC) and HPLCfor many years. In the last few years there has been increased interest inand acceptance of the coupling CE-MS, which is due to the possibilities ofseparating hydrophobic and charged compounds and to obtainingmolecular information [28]. Since CE does not suffer from longitudinaldiffusion and mass transfer restrictions encountered in HPLC, theefficiency and sensitivity of CE are often better than with HPLC.
Different interfaces are available to connect CE with ESI-MS. The coaxialliquid sheath flow is used in this study and is the most commonly usedinterface due to its reproducible performance. A sheath liquid is mixedwith the buffer at the tip of the capillary. The purpose of the sheath liquidis to ionise the sample and, together with the nebuliser gas, create a finespray. The sheath liquid most commonly consists of approx. 50% organicsolvent and an electrolyte. The flow rate of the sheath liquid is often muchhigher than the flow in the capillary. This means that it may be possible touse buffers and additives in the CE separations that are nonvolatile andstill obtain acceptable results, since the sample is diluted by the sheathliquid. However, the dilution will impair the sensitivity.
1.6 MEKC-MS
The combination of the techniques MEKC and MS is of considerableinterest due to the selectivity and efficiency of MEKC and the capability ofMS to offer mass information. Because of these advantages MEKC-MS isvery useful in both the biomedical and pharmaceutical fields sinceinformation about separation as well as identification will be available.However, direct coupling of MEKC and MS is impossible since thenonvolatile micelle surfactants will contaminate the MS ion source anddrastically impair the sensitivity and the robustness. Different techniqueshave been published in recent years [29, 30] to overcome this problem,e.g. partial-filling MEKC-MS, high molecular mass surfactant MEKC-MSand atmospheric pressure chemical ionisation MEKC-MS.

12
1.6.1 Partial-filling technique
The partial-filling technique (PF) is one of the most promising ways tocombine MEKC with MS and was first introduced by Valtcheva et al. [31]in 1993 applying a cellulase as chiral selector. Tanaka et al. [32] alsoused proteins as chiral selectors, and later PF was used in combinationwith micelles and coupled to MS [33–36]. The PF technique is illustratedin Figure 2. The capillary is first filled with a background electrolyte (BGE)without micelles, after which the BGE with surfactant is introduced into thecapillary. This so-called plug is either introduced with pressure or byapplying a voltage. The length of the plug should be optimised in eachindividual case, depending on the aim of the work. The sample is thenintroduced and the voltage is applied over the capillary. The analytes willmigrate and separate through the selector zone. The electroosmotic flow(EOF), the hydrophobicity, charge and size of the analytes and themigration of themicelles are important parameters for the outcome of a separation.
Figure 2. The partial-filling technique.
Muijselaar et al. [37] used anionic SDS micelles in a basic system withhigh EOF in order to separate several pharmaceuticals. They concludethat a drawback of the PF technique is the discontinuous character of thesystem, which causes the micelles to gradually fall apart into monomersat the interface to the buffer zone. They also discuss some importantparameters such as the concentration of the surfactant and the length ofthe micelle zone. Their conclusion was that it should be preferable to useas low a surfactant concentration as possible to reduce the extent ofband-broadening. Comparison studies with MEKC confirm thesedisadvantages of PF, e.g. PF has a smaller separation volume caused bythe small micelle-zone, a smaller migration time window and increasedband-broadening.
BGE
Micellar zoneSample A+B+C
+
ABC
-+ABC
DAD
-

13
1.7 Validation in pharmaceutical analysis
The validation of analytical methods is an important aspect of thedevelopment and utilisation of analytical procedures and is required inproduct-registration applications. The United States Pharmacopeia (USP)[38] defines the validation of analytical methods as the process by which itis established, by laboratory studies, that the performance characteristicsof the method meet the requirements for the intended analyticalapplications. Both the USP [38] and the ICH [39, 40] have recommendedgeneral procedures for the validation of analytical methods. Alternativevalidation guidelines relate to analytical techniques, e.g. chromatography[41, 42]. Several papers describe the validation of quantitative CE andMEKC methods for the determination of degradation products andimpurities in pharmaceutical products [43–46]. These methods performwell, and it was concluded that the results were similar to those obtainedwith validated HPLC methods.
According to the ICH guidelines, the following parameters should bedetermined: selectivity, linearity, accuracy, precision, detection limit,quantitation limit, robustness and range. However, depending on thepurpose of the method, some parameters may be omitted, e.g. thedetection limit for an assay of the main compound in a pharmaceuticalpreparation.

14
1.8 Pilocarpine, ibuprofen and codeine in pharmaceutical analysis
Pilocarpine is used as a solution of the monohydrochloride to reduceintraocular tension in the treatment of open-angle glaucoma or to causemiosis. The reported pKa values for pilocarpine are 7.15 and 12.57 [47]. Itdegrades by epimerisation to the trans epimer, isopilocarpine, in alkalinesolutions. The diastereomers reversibly hydrolyse to their respective acidforms when subjected to heat and/or acid/base-catalysed hydrolysis, Fig.3. The preparation of pilocarpic acid and isopilocarpic acid was done bymeans of base-catalysed hydrolysis according to [48]. The separation ofpilocarpine and its degradation products by different modes of HPLC hasbeen described [49, 50] with unsatisfactory results regarding selectivity,symmetry and retention time. Baeyens et al. [51] used CE with theaddition of β-cyclodextrin (β-CD) to separate pilocarpine andisopilocarpine, while Charman et al. [52] used micellar electrokineticchromatography (MEKC) to separate pilocarpine from its degradationproducts.
ISOPILOCARPIC ACIDISOPILOCARPINE
PILOCARPIC ACIDPILOCARPINE
N
N
CH3
OHO
H CH2
OH
C2H5 H
N
N
CH3
OO
H CH2C2H5 H
N
N
CH3
OHOHO
C2H5 CH2H HN
N
CH3
OO
C2H5 CH2H H
Figure 3. Structure of pilocarpine and its degradation products.
15
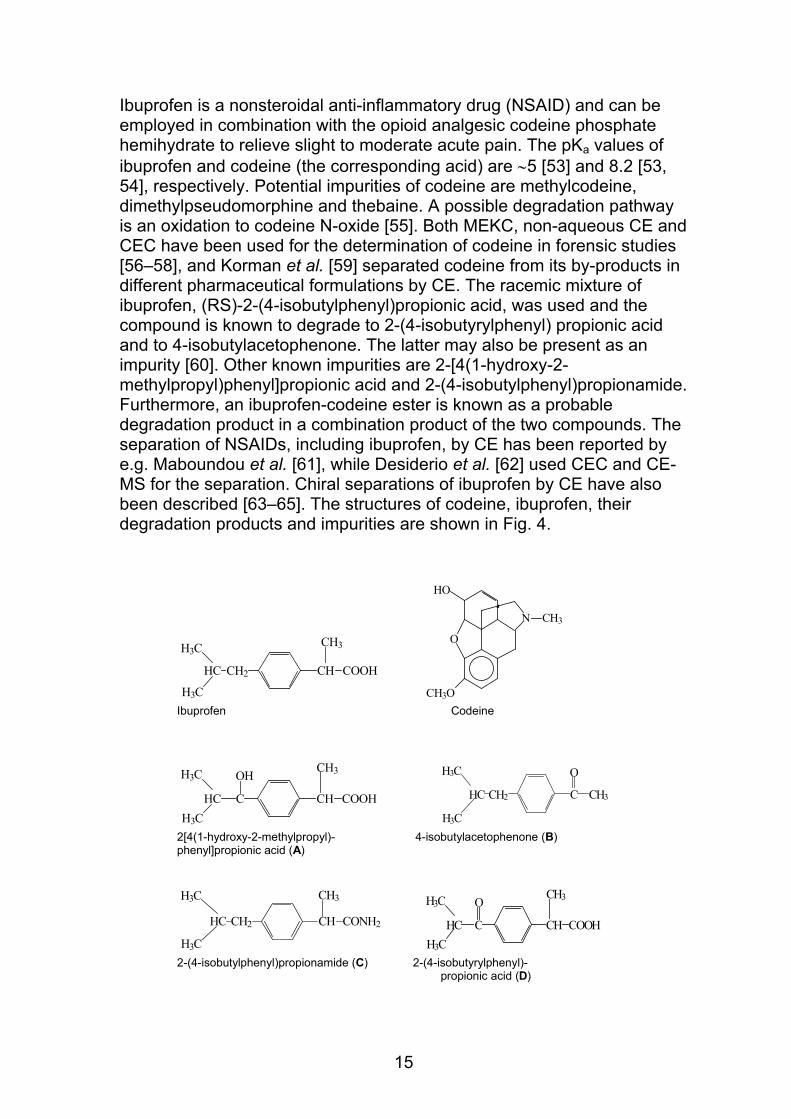
Ibuprofen is a nonsteroidal anti-inflammatory drug (NSAID) and can beemployed in combination with the opioid analgesic codeine phosphatehemihydrate to relieve slight to moderate acute pain. The pKa values ofibuprofen and codeine (the corresponding acid) are ∼5 [53] and 8.2 [53,54], respectively. Potential impurities of codeine are methylcodeine,dimethylpseudomorphine and thebaine. A possible degradation pathwayis an oxidation to codeine N-oxide [55]. Both MEKC, non-aqueous CE andCEC have been used for the determination of codeine in forensic studies[56–58], and Korman et al. [59] separated codeine from its by-products indifferent pharmaceutical formulations by CE. The racemic mixture ofibuprofen, (RS)-2-(4-isobutylphenyl)propionic acid, was used and thecompound is known to degrade to 2-(4-isobutyrylphenyl) propionic acidand to 4-isobutylacetophenone. The latter may also be present as animpurity [60]. Other known impurities are 2-[4(1-hydroxy-2-methylpropyl)phenyl]propionic acid and 2-(4-isobutylphenyl)propionamide.Furthermore, an ibuprofen-codeine ester is known as a probabledegradation product in a combination product of the two compounds. Theseparation of NSAIDs, including ibuprofen, by CE has been reported bye.g. Maboundou et al. [61], while Desiderio et al. [62] used CEC and CE-MS for the separation. Chiral separations of ibuprofen by CE have alsobeen described [63–65]. The structures of codeine, ibuprofen, theirdegradation products and impurities are shown in Fig. 4.
CH COOHCH2HC
H3C
CH3H3C
O
CH3N
HO
CH3O Ibuprofen Codeine
CH COOHCHCH3C
OH CH3H3C
CCH2HC
H3C
CH3
OH3C
2[4(1-hydroxy-2-methylpropyl)- 4-isobutylacetophenone (B) phenyl]propionic acid (A)
CH CONH2CH2HC
H3C
CH3H3C
CH COOHCHCH3C
OCH3H3C
2-(4-isobutylphenyl)propionamide (C) 2-(4-isobutyrylphenyl)- propionic acid (D)

16
Figure 4. Structure of ibuprofen, codeine and their degradation products and impurities.
O
CH3N
HO
CH3O
O
O
CH3N
CH3O
CH3O
Codeine N-oxide (E) Methylcodeine (F)
CH3O
HO
N CH3
O
CH3O
HO
N CH3
O
O
CH3N
CH3O
CH3O
Dimethylpseudomorphine (G) Thebaine (H)
CH3H3C
O
CH3N
CH3O
H3C
HC CH2 COOCH
Ibuprofen-codeine-ester (J)

17
2 AIM OF STUDY
The aim of the present work was to study micellar electrokineticchromatography (MEKC) as a technique for developing and optimisinganalytical methods for use in the pharmaceutical industry.
More specifically the aim included:
Developing and optimising the separation of pilocarpine,isopilocarpine and their hydrolysis products, pilocarpic acid andisopilocarpic acid (paper I).
Developing and optimising a method for the separation of ibuprofen
and codeine from their degradation products and impurities (paperII).
Validating the ibuprofen-codeine method and investigating its
suitability for its intended purpose, i.e. for quantification of the twomain compounds and determination of the degradation productsand impurities in a tablet formulation (paper III).
Developing and optimising a method to combine the MEKC method
for ibuprofen-codeine with mass spectrometry to identify thedegradation products (papers IV and V).

18
3 EXPERIMENTAL
3.1 Equipment
Capillary electrophoresis was performed on a Hewlett-Packard 3DCEinstrument (Walbronn, Germany), with a built-in diode-array detector. Thedata was recorded with the matching 3DCE ChemStation software. Themass spectrometry studies were performed on an 1100 MSD instrumentwith electrospray ionisation (ESI) (Agilent Technologies, Walbronn,Germany). An external microinjection pump (CMA/Microdialysis, NorthChelmsford, Mass., USA), was used in paper V.Fused-silica (FS) capillaries from either Polymicro (Phoenix, Ariz., USA)(papers I and III) or from Hewlett-Packard (papers II and III) were used.For the statistical analysis, the chemometric software Modde 3.0 (papersI, II and III) or 4.0 (paper IV) (Umetrics AB, Umeå, Sweden) was used.
3.2 Chemicals
The chemicals used in paper I were pilocarpine hydrochloride, Merck(Darmstadt, Germany), isopilocarpine nitrate, β-cyclodextrin (β-CD),sodium dodecyl sulfate (SDS), Sigma (St. Louis, Mo., USA), andhydroxypropylmethylcellulose (HPMC), Shin Etsu/Syntapharm (Naoetsu,Japan).The chemicals used in papers II and III were ibuprofen, Jeil Moolsan(Seoul, South Korea) (paper II) or Knoll Pharmaceuticals (Nottingham,UK) (paper III), codeine phosphate hemihydrate, Macfarlan Smith(Edinburgh, UK), 2-[4-(1-hydroxy-2-methylpropyl)phenyl] propionic acid(A), 4-isobutylacetophenone (B), 2-(4-isobutylphenyl) propionamide (C),2-(4-isobutyrylphenyl) propionic acid (D) and codeine N-oxide (E), KnollPharmaceuticals (Nottingham, UK), methylcodeine (F) anddimethylpseudomorphine (G), Tasmanian Alkaloids (Tasmania, Australia),thebaine (H), Apoteksbolaget AB (Gothenburg, Sweden), ibuprofen-codeine-ester (J), Astra Production Chemicals (Södertälje, Sweden),hexadecyltrimethylammonium bromide (HTAB), SDS and Triton X-100Sigma (St. Louis, Mo., USA), benzoic acid, Merck (Darmstadt, Germany).Ammonium acetate and formic acid, used in paper V, also came fromMerck (Darmstadt, Germany).The ibuprofen-codeine tablets were obtained from Astra ProductionTablets (Södertälje, Sweden).

19
3.3 General procedures
The capillary dimensions and the washing procedures, the preparation ofBGE as well as the standards and samples are described in detail in thepapers.For all experiments, the samples were injected hydrodynamically towardsthe cathode for 3 seconds at a pressure of 5 kPa, which corresponds to avolume of approximately 3 nl when a 48.5 cm long capillary is used.The UV detections were performed at 225 nm (paper I) and at 214 nm(papers II–V).During the mass spectrometry studies, the quadrupole was used inselected ion monitoring (SIM) mode at m/z ratios as described in papersIV and V.

20
4 RESULTS AND DISCUSSION
4.1 Method development
When developing CE methods, the nature of the compounds’ functionalgroups and their physicochemical properties such as pKa have to beconsidered to identify the correct combination of CE operatingparameters. The operating parameters include the capillary dimensions,the pH and the ionic strength of the buffer solution and the presence ofadditives. Solubilisation of the sample and sample matrices also has to beconsidered in order to obtain a method with high separation efficiency andhigh resolution. In addition, the detectability, the purity and the stability ofthe compounds are important. The choice of detection wavelength isbased upon the maximum absorbance for the compounds in conjunctionwith minimal absorbance of the background components. A methoddevelopment flowchart is described by Altria [66].
Quantitative methods normally include an internal standard in thestandard preparation. By using an internal standard, it is possible tocompensate for the injection error and variations of EOF, the major errorsources in CE besides detection and integration. The choice of an internalstandard depends on its solubility and stability in the standard solution. Itshould also have a suitable migration and preferably be commerciallyavailable.
4.1.1 The ibuprofen-codeine method development (paper II)
The aim was to develop a method capable of separating ibuprofen andcodeine and their degradation products and impurities. However, it wasnot within the scope of this study to investigate the chiral separation ofibuprofen and its chiral degradation products and impurities. Three bufferswith acidic, neutral and alkaline pH were studied. Micellar agents withdifferent kinds of charge, namely anionic SDS, neutral Triton X-100 andcationic hexadecyltrimethylammonium bromide (HTAB), were added tothe buffers. At an early stage it seemed that a high pH with the addition ofSDS gave the most promising results regarding migration times. Theaddition of a micellar agent, however, proved unable to separate all thedegradation products and impurities from each other without the additionof an organic modifier, which is known to reduce the EOF and in somecases also affect the selectivities. ACN was chosen for this purpose. Thecapillary dimensions were kept unchanged during the development work.

21
With regard to the standards, the compounds were dissolved in 50% ACN(v/v), since ibuprofen is soluble in organic solvents and codeinephosphate is soluble in water. Benzoic acid was found to be suitable asinternal standard. Both ibuprofen and benzoic acid have acidic properties.This is probably the reason for the better precision obtained for ibuprofenrelative to codeine. To further improve the validation results, it might bepossible to use two different internal standards with similarities to each ofthe main compounds to obtain comparable validation results. However,the validation results were found to be sufficient for codeine as well, andbenzoic acid was thus kept as the internal standard.
4.2 Screening and optimisation with fractional factorial design
A widely-accepted way of optimising analytical methods is to start with ascreening design, the purpose of which is to identify the critical factors forthe separation. To determine the optimum conditions, an optimisationdesign is chosen on the basis of the results of the screening. Theselection of the factors and the corresponding levels is important, andmore or fewer pre-experiments are needed, depending on the objectiveand our knowledge of the compounds and the system. A commonobjective for optimisations of analytical separation methods, e.g. CEmethods, is to arrive at fast methods with adequate resolutions. To definethe optimum, it may be necessary to compromise between responsessuch as resolution and migration time.
4.2.1 Screening processes (papers I and II)
In the pilocarpine screening design, six factors were varied at two levels ina 2(6-2) reduced design (resolution IV design) Table 1 (paper I). Thefactors and levels were based on a small number of pre-experiments andhence limited information about the system. The symmetry forisopilocarpine and pilocarpine, the resolution between them and theresolution between the two degradation products and the migration timefor the last peak, pilocarpine, were chosen as responses.
Level Temperature(°C)
Voltage(kV)
Ionicstrength
SDS(mM)
HPMC (%,w/v)
β-CD(mM)
High (+) 50 25 0.1 160 0.8 16Center point (0) 40 20 0.055 121 0.5 12.5Low (–) 30 15 0.01 82 0.2 9Table 1. Experimental design for the pilocarpine screening experiment. pH was kept stable at 7.0.

22
The evaluation of this design showed that two of the factors, i.e. theconcentrations of β-CD and HPMC, did not have any significant effect onthe responses. Consequently, they were not needed for the separation.The other factors (temperature, voltage, ionic strength and concentrationof SDS) had a significant effect on one or more of the responses at a 95%confidence level. Ionic strength and concentration of SDS gave the largesteffects. The importance of the concentration was previously noted byCharman et al. [52]. A low ionic strength resulted in fast migration timesand symmetrical peaks but incomplete resolution, whereas a high SDSconcentration resulted in resolution between the peaks and goodsymmetry but longer migration times due to stronger interaction of theanalytes with the micelles.
The screening design for the ibuprofen-codeine method was based uponthe method-development work, and consequently with some knowledgeof the system. Six factors were varied at two levels, Table 2, with a 2(6-2)
reduced design, resolution IV design (paper II). The responses chosenwere the migration time for the first and the last peaks and the resolutionbetween peaks H and C and between peaks G and J (for explanation, seeFigs. 4 and 8). The resolution responses chosen were based on the factthat these peaks were, on average, the most difficult to separate.
Level SDS(mM)
pH ACN(v/v%)
H3BO3(mM)
Field strength(V/cm)
Temperature(°C)
High (+) 80 10.5 11 70 515 25Center point (0) 60 9.75 9 45 412 20Low (–) 40 9.0 7 20 309 15Table 2. Experimental design for the ibuprofen-codeine screening experiment.
The evaluation of this design showed that all factors had a significanteffect on one or more of the responses at a 95% confidence level. Thus itwas not possible to reduce the number of factors or to further optimise theseparation without performing a new full factorial design. The modeladequately explained the results at this stage; however, since the designwas a resolution IV, it was not possible to draw conclusions aboutoptimisation of the method.
The aim of these two screenings was to identify the critical factors. Thenumber of significant factors was, however, found to vary. It may,therefore, be concluded that knowledge of the system (given, for example,by the number and variations of the pre-experiments) prior to thescreening procedure is critical for the results.

23
4.2.2 Optimisation processes (papers I and II)
The factors and levels chosen for the pilocarpine optimisation design(paper I) were based on the results of the screening design, whichshowed that MEKC should be used. According to [52], an increase in pHwas found to have a significant effect. In the optimisation design the pHwas therefore increased by using a borate buffer. The optimisation wasdesigned as a 2(5-1) design, Table 3, resolution V. The responses were thesame as for the screening.
Level Ionic strength SDS (mM) pH Temperature(°C)
Voltage(kV)
High (+) 0.03 170 10.5 30 30Center point (0) 0.02 135 10.0 25 25Low (–) 0.01 100 9.5 20 20Table 3. Experimental design for the pilocarpine optimisation experiment.
The evaluation showed that all the main factors and six interaction termswere significant at a 95% confidence level on one or more of theresponses, Fig. 5. The voltage and the concentration of SDS caused thelargest effects, resulting in good peak symmetries and completeresolution with a high SDS concentration. A short analysis time wasobtained with a high voltage. To define the optimum, a compromisebetween the responses was obviously needed, and it was important todetermine the critical responses. The symmetry of the main peak,pilocarpine, and the migration time were the most critical responses andhad the greatest influence on the choice of the optimum separationprocess, since the resolution was greater than 1.5 in all experiments. Theoptimum conditions chosen were a borate buffer of pH 10.5, ionic strength0.03, 170 mM SDS, voltage 30 kV and temperature 20 °C. Theseoptimum conditions were used for the prediction of the responses andverified experimentally. The predicted results corresponded well with theexperimental results. The optimisation resulted in a baseline separation ofthe peaks within 7 minutes, with good peak symmetry of pilocarpine (seethe electropherogram in Fig. 6).

24
Ion SDS pH Te Vo pHpH A B C D E F G H
-0.05
0.00
0.05
0.10
0.15
Symmetry, peak 3
Ion SDS pH Te Vo pHpH A B C D E F G H
0.00
0.05
Symmetry, peak 4
Ion SDS pH Te Vo pHpH A B C D E F G H
-0.15
-0.10
-0.05
0.00
0.05
0.10
0.15
0.20
0.25
Resolution between peaks 1 and 2
Ion SDS pH Te Vo pHpH A B C D E F G H
-0.2
0.0
0.2
0.4
0.6
0.8
Resolution between peaks 3 and 4
Ion SDS pH Te Vo pHpH A B C D E F G H
-3
-2
-1
0
1
2
3
4
min
Migration time for peak 4
Figure 5. The coefficient values in the optimisation design (pilocarpine method) for theresponses at a 95% confidence level. The coefficients are divided by the standard deviation oftheir respective response.Factors:Ion=ionic strength, SDS=concentration of SDS, pH=pH, Te=temperature, Vo=voltage,pHpH=pH*pH, A=ion*SDS, B=ion*pH, C=ion*Te, D=ion*Vo, E=SDS*pH, F=SDS*Te, G=pH*Voand H=Te*Vo.

25
Figure 6. The optimum separation of pilocarpine and its degradation products. Capillary, 47.5cm (Ld), 56 cm (Lt), 50 µm I.D., 363 µm O.D. FS; borate buffer pH 10.5 made from H3BO3/NaOHto ionic strength 0.03, 170 mM SDS; voltage 30 kV; temperature 20°C; wavelength 225 nm;injection: pressure (3 s: 5 kPa); sample concentration, pilocarpine (330 µg/ml), isopilocarpine(33 µg/ml), pilocarpic acid and isopilocarpic acid (60 µg/ml). The elution order of the peaks is,from the left, isopilocarpic acid, pilocarpic acid, isopilocarpine and pilocarpine.
The optimisation design for the ibuprofen-codeine method was also basedupon the results from the screening. Since all the factors had a significanteffect on the responses, the design was expanded to a 2(6-1) design,resolution V, by adding 16 more experiments. Fig. 7 shows the evaluationof the total of 35 experiments where the field strength and theconcentration of SDS had significant effects on the migration times for thefirst and the last peak, but not on the resolution of the other peaksinvestigated. A high field strength, which produces a fast EOF, and a lowconcentration of SDS, which results in weaker interaction of the analyteswith the micelles, will thus produce a fast migration time without affectingthe resolution. To find the optimum separation levels for the other factors,a compromise was necessary, resulting in optimum separation when thefactors were 40 mM H3BO3 at pH 10, an addition of 40 mM SDS and 9%ACN, a field strength of 515 V/cm and a temperature of 25 °C. Theexperimental and the predicted results were found to be very close. Theelectropherogram in Fig. 8 shows the optimum separation of ibuprofen,codeine and their degradation products and impurities, resulting in abaseline separation within 12 minutes.
The results confirm that optimisation by experimental design, starting witha screening and, based on those results, continuing with an optimisationdesign, is a suitable and efficient approach for developing separationmethods in industrial pharmaceutical analysis.
min0 1 2 3 4 5 6 7
mAU
0
2
4
6
8
10
12
14
6.9
6.5
3.9
3.8

26
SDS pH ACN BAc FSt Te ACN*Te
-0.8
-0.6
-0.4
-0.2
0.0
0.2
0.4
0.6
Log(MigTime1)
SDS pH ACN BAc FSt Te ACN*Te
-0.8-0.6-0.4-0.20.0
0.20.40.6
Log(MigTime11)
SDS pH ACN BAc FSt Te ACN*Te
-0.4
-0.2
0.0
0.2
0.4
0.6
0.8
Log(ResH/C)
SDS pH ACN BAc FSt Te ACN*Te
-0.4
-0.2
0.0
0.2
0.4
0.6
0.8
Log(ResG/J)
Figure 7. Coefficient values in the optimisation design (ibuprofen-codeine method) for theresponses at a 95% confidence level. The coefficients are divided by the standard deviation oftheir respective response.Factors:SDS=concentration of SDS, pH=pH, ACN=concentration of acetonitrile, BAc=concentration ofboric acid, FSt=field strength, Te=temperature and ACN*Te= concentration ofacetonitrile*temperature.

27
Figure 8. Optimum separation of ibuprofen, codeine phosphate hemihydrate and theirdegradation products and impurities.Capillary, 40.0 cm (Ld), 48.5 cm (Lt), 50 µm I.D., 365 µm O.D. FS; BGE, borate buffer made from40 mM H3BO3 and adjusted with NaOH to pH 10.0, 40 mM SDS, 9% ACN; field strength 515V/cm; temperature 25°C; wavelength 214nm; injection: pressure (3 s: 5 kPa);sample concentration, 0.33 mg/ml ibuprofen, 0.26 mg/ml codeine phosphate hemihydrate, thedegradation products and impurities varies between 33-75 µg/ml. The current is 44 µA.A = 2-[4-(1-hydroxy-2-methylpropyl)phenyl]propionic acid, B = 4-isobutylacetophenone, C = 2-(4-isobutylphenyl)propionamide, D = 2-(4-isobutyrylphenyl)propionic acid, E = codeine N-oxide,F = methylcodeine, G = dimethylpseudomorphine, H = thebaine and J = ibuprofen-codeine-ester.
4.3 Validation of the ibuprofen-codeine method (paper III)
The validation of the MEKC method for ibuprofen-codeine was carried outto investigate whether it was suitable for its intended use, i.e. forquantification of the two main compounds, and to determine thedegradation products and impurities in area% of each main peak in acommercially available tablet formulation consisting of 200 mg ibuprofenand 30 mg codeine phosphate hemihydrate. The validation wasperformed according to the ICH guidelines, and the parameter’s selectivity(the term “specificity” was replaced by “selectivity”), linearity, accuracy,precision, detection limit, quantitation limit, robustness and range werestudied. A system suitability test is recommended in order to check theperformance of the system prior to use of the method.
The results confirm that the method is selective, linear and highlyaccurate. The precision was determined with different instruments,equipment, laboratories and analysts and on different days, with
min0 2 4 6 8 10 12 14
mAU
0
5
10
15
20
25
30
2.91
3.89
4.09
4.45 5.77
6.31
8.059.55
10.29
11.03
11.92
E
D A
Ibuprofen
Codeine
F
H C
B
GJ

28
satisfactory results. The detection limit was 1–3 µg/ml for the maindegradation products and the quantitation limit was 3–10 µg/ml for thesame compounds. To evaluate the robustness of the method, thefractional factorial design model from the optimisation was applied tosmall but realistic variations around the defined optimum and predictedthe responses with reliable results. It was concluded that the method isrobust for small changes in the parameters, and the validation clearlyshows the usefulness and advantages of experimental design.
The results confirm that the method is well suited for its intended purpose.
4.4 Coupling the MEKC method for ibuprofen-codeine to massspectrometry (paper IV and V)
The MEKC-UV method for ibuprofen-codeine was primarily developed forroutine quantification of the active ingredients and impurities in marketedproducts. However, during the development phase of a pharmaceuticalproduct it would be desirable to be able to combine the MEKC-UV-methodwith mass spectrometry. The partial-filling technique was used since themethod consists of the nonvolatile SDS, which makes a direct coupling toMS impossible.
The micellar zone was optimised by factorial design by studying criticalparameters such as the zone length and the surfactant concentration. Theconcentration of ACN in the BGE was also included as it was expected tohave a large effect on the EOF and consequently the separation. Themodel was fairly good at explaining the data, but unable to predict results,probably because of robustness problems.
It was obvious that a compromise between the factors was necessary toobtain separation between the peaks as well as good peak performance,Fig. 9. Thus, an optimal partial-filling plug was determined to be 8 cm withborate buffer with 35 mM SDS and 9% ACN, while the BGE should havea higher amount of ACN (14.5%). An acidic sheath liquid was chosen toionise the uncharged codeine. In this way the negatively chargedibuprofen becomes partly protonated and thus detectable in the negativemode, though it is much less intense than codeine.

29
Figure 9. The response surfaces for the optimisation of the micellar plug for the PF-MEKC-MSmethod.
The robustness problems were reduced significantly when a small micellezone was injected directly after the sample. This could probably beexplained by a backward migration of the negatively charged ibuprofenout of the capillary, which was prevented with a micelle zone after thesample. The precision was improved and was close to the valuesobtained with the MEKC-UV detection (paper III).
It was feasible to use the nonvolatile borate buffer since it was stronglydiluted by the sheath liquid (paper IV). However, by using a volatile, MS-compatible buffer, i.e. ammonium acetate (paper V), the ion source wasfound to be much less contaminated. The CMC for SDS was determinedin the volatile buffer and the SDS concentration could be reduced to 17mM. The length of the micelle plug containing ammonium acetate bufferwas optimised. It was concluded that a long zone with a low SDSconcentration (80% of the distance to the UV window, 17 mM SDS)resulted in a fast, well-separating system, Fig. 10.
1213
1415
1617 25
30
3540
451
2
3
4
5. Resolution2-34. Resolution1-2
3. Symmetry32. Symmetry21. Symmetry1
Response Surfaces
PlugLength = 8.0 cm
Sym
met
ry1
SDSc
onc
ACNconc
1213
1415
1617 25
30
3540
45
1.0
1.5
2.0
2.5
3.0
3.5
4.0
4.5
Sym
met
ry2
SDSc
onc
ACNconc
1213
1415
1617 25
30
3540
452.0
2.5
3.0
3.5
4.0
Sym
met
ry3
SDSc
onc
ACNconc
1213
1415
1617 25
30
3540
45
0.0
0.2
0.4
0.6
0.8
1.0
Res
1-2
SDSc
onc
ACNconc
1213
1415
1617 25
30
3540
45
0.2
0.4
0.6
0.8
1.0
Res
2-3
SDSc
onc
ACNconc

30
Figure 10. The optimum PF-MEKC separation. Ammonium acetate buffer, plug: long zone/lowSDS concentration (80% of the distance to the UV window, 17 mM SDS).
The degradation products are expected at low amounts, which is whysome critical MS parameters needed to be optimised to increase thesensitivity. This was performed in an off-line mode by using amicroinjection pump to deliver the sample into the MS. Optimisation ofparameters in an off-line mode could both be simple and time saving andis usually an acceptable approach in the optimisation of combinedanalytical MS methods [67]. However, the study described in paper Vshowed that some of the conclusions from the off-line optimisation werenot applicable when the entire PF-MEKC-MS system was used.
Critical MS parameters, the so-called fragmentor voltage and thecomposition and flow of the sheath liquid, were optimised in off-line mode.It was concluded that a lower fragmentor voltage, 60 V, was suitable inthe MS negative mode to obtain high peak intensities and a highervoltage, 90 V, in the positive mode.
The composition of the sheath liquid was 50% MeOH with the addition ofeither formic acid or ammonium acetate in concentrations between 1 and3%. The intensities for codeine were highest with ammonium acetate (inthe off-line mode), although when the PF-MEKC-MS system was used itwas not possible to detect codeine. Accordingly, an acidic sheath liquid(1% formic acid) was necessary in order to ionise codeine and wastherefore chosen as the sheath liquid. The flow was varied in the range 2–10 µl/min, where 8 µl/min resulted in the most intense peaks.
The quantification limit for the degradation products was approx. 5 µg/mlwith the MEKC method for the ibuprofen-codeine method (paper III).Samples with this concentration for each degradation product wereinjected into the PF-MEKC-MS system. It was possible to detect alldegradation products at this low concentration, corresponding to 10 pg,either in the positive or in the negative mode, Fig. 11.
min1 2 3 4 5
mAU
0
5
10
15
20
25
2.911
4.423
Codeine
Ibuprofen

31
min2.5 5 7.5 10 12.5 15 17.5 20 22.5
250
500
750
1000
1250
1500
1750
2000
A
Ibuprofen
Negative mode, SIM, fragmentor voltage 70 V
A)
min2.5 5 7.5 10 12.5 15 17.5 20
0
2000
4000
6000
8000
10000
12000
14000 F
H
C
Codeine
G
Positive mode, SIM, fragmentor voltage 90 V
B)
Figure. 11. MS chromatogram in negative (A) and positive (B) mode. The BGE consists of 40mM ammonium acetate buffer (pH=10.0) with 14.5% ACN. The micelle zone consists of 40 mMammonium acetate buffer (pH=10.0) with 9% ACN and 17 mM SDS and is introduced with apressure of 50 mbar over 328 sec. A sheath liquid consisting of 1.0% formic acid in 50% MeOHis pumped with a flow of 8 µl/min. Approximately 2 nl of 5 µg/ml sample solutions are introducedinto the capillary, which corresponds to about 10 pg.
4.5 Industrial considerations
One of the main aims of pharmaceutical analysis is to develop highlyeffective and reproducible analytical methods. It is therefore necessary forthe industry to perform applied research in close cooperation withuniversities to develop the potential and suitability of new techniques.Analytical chromatographic methods for pharmaceutical products should,for example, be able to identify and quantify the active ingredients as wellas degradation products and impurities in the presence of excipients. Themethods ought to be useful for their intended purposes during earlydevelopment and during stability studies as well as for quality controlduring production at the manufacturing site. When considering a time-saving and economical aspect, it is highly advantageous if the same
32
analytical method can be used for determination of both assay anddegradation products (paper II).
During early-phase development work it is also of importance to considerthe future use of the method, e.g. to have a selective method and an MS-compatible buffer. A highly selective method is essential, since newdegradation products may be formed even at later stages. By using anMS-compatible mobile phase, it is possible to couple the separationmethod, GC, LC or CE, to MS for structure identification if necessary.However, the MEKC method for ibuprofen-codeine was based on a non-volatile buffer, i.e. conventionally called a non-MS compatible buffer. Thebuffer was used with satisfactory results in the PF-MEKC-MS system(paper IV), although the results improved considerably when the bufferwas changed to a MS-compatible one (paper V). Thus, the developmentof the PF-MEKC-MS method (paper V), for instance, would have beeneasier if the method had been based on ammonium acetate.
Thus, when the aim of a PF-MEKC-MS method is to identify analytes onrare occasions, the use of a nonvolatile buffer, such as borate, would besatisfactory since the buffer will be diluted by the sheath liquid and the ionsource will not be heavily contaminated. If the method is to be used morefrequently, a method including a volatile buffer is preferable.
It is also important to work with relevant sample concentrations of themain ingredients. As described in papers II and IV, the aim has been todevelop a systematic approach to drug purity studies. Therefore, relativelyhigh concentrations, e.g. around 0.1 mg/ml of the main active ingredients,had to be introduced even though better peak shapes could be obtainedwith lower concentrations. The supply of isolated degradation productsand impurities is often limited at early stages, which makes thedevelopment and validation work more challenging.
In paper V the optimisation of two MS parameters was performed in anoff-line mode, i.e. a microinjection pump delivered the sample to the MS.This is a time-saving and practical way to optimize e.g. CE-MS methods[67], although the verification experiments revealed that the optimumconditions obtained were unsuitable for the PF-MEKC-MS system. Areduced factorial design where PF, MEKC and MS parameters werevaried at the same time [68] might have been a more efficient way toreach the optimal conditions.
Paper V shows that PF-MEKC-MS is a suitable analytical technique ofutilizing the separation capabilities of MEKC together with the molecularinformation of MS. The PF technique is easy to use and the futureprospects of PF-MEKC-MS look promising. However, more scientific workon PF-MEKC-MS systems is needed to develop methods that give better

33
precision, higher sensitivity and convenient and reliable quantification inorder for the technique to be acceptable within the pharmaceuticalindustry in the future. The work should focus on high sensitivity in the totalion collection (TIC) mode in order to be able to detect unknown impuritiesfor further identification.
34
5 CONCLUSIONS
A MEKC method was developed for the separation of ibuprofen, codeineand their degradation products and impurities and was optimised usingfractional factorial design. The optimum method gives a baselineseparation of the compounds within twelve minutes. The ibuprofen-codeine method was validated according to the ICH guidelines todetermine the suitability of the method, with results confirming that themethod is highly suitable for its intended purpose. The MEKC method wascoupled to mass spectrometry using the partial-filling technique, whichavoids micelles to reach the MS. Degradation products corresponding to10 pg could be detected.
The separation of pilocarpine, isopilocarpine and their hydrolysisproducts, pilocarpic acid and isopilocarpic acid, was optimised by meansof a fractional factorial design, resulting in a well-separating system withinseven minutes, with good peak symmetry of pilocarpine.
The studies were performed to evaluate the use of MEKC as an analyticaltechnique in industrial pharmaceutical analysis. The results demonstratethat MEKC is highly suitable for quantitative drug analysis and impuritydeterminations. It is also a suitable technique in development work due toits advantages, such as high resolution, high efficiency, simpleinstrumentation and small sample and electrolyte volumes. It is alsoshown that chemometrics is a helpful and informative tool in optimisationand validation by CE. A validation was performed to verify the suitability ofa method, showing that it is highly suitable for use in pharmaceuticalanalyses, e.g. quality control analyses and stability studies. A MEKCmethod was coupled to mass spectrometry using the partial-fillingtechnique to receive molecular information to identify the degradationproducts. It can be concluded that MEKC-MS is a promising technique inthe process of identification of impurities in pharmaceutical products.
It was also concluded that an optimisation design could be used toevaluate the robustness of the method, which clearly shows theusefulness and advantages of experimental design.

35
6 ACKNOWLEDGEMENTS
This work was carried out at the Analytical and Pharmaceutical Research andDevelopment Laboratories at Astra Läkemedel AB, Astra Arcus AB andAstraZeneca R&D Södertälje, Sweden.
Sincere acknowledgements are due to:
My supervisor, Professor Douglas Westerlund, for his scientific guidance,support and help with the manuscripts and this thesis.
My supervisor at Astra during the first part of the work, Dr. Ove Åström, forscientific discussions and support.
My supervisor at AstraZeneca R&D Södertälje, Dr. Karin Callmer, for scientificdiscussions, a lot of support and for believing in me.
Dr. Astrid Arbin for giving me the time to finish my studies.
The former director of Pharmaceutical R&D, Astra Läkemedel AB, ProfessorChristina Graffner, for support and help with the first three manuscripts.
Colleagues at Astra, especially “ABU”, Analytical Development at Astra Arcusand AstraZeneca R&D Södertälje, for a lot of fun, the good atmosphere and helpduring my work.
Friends and colleagues at the Department of Analytical PharmaceuticalChemistry for interesting seminars.
Margareta Andersson, Åsa Andersson, Mats Borén, Doreen Büchler, Gerd Dall,Dr. Anna Maria Enlund, Anna Forsberg, Valérie Harang, Valérie Imbert, Dr. CariSänger-van de Griend, Dr. Ludmila Westermark and Christina Åkesson forenjoyable, instructive and stimulating collaboration.
Friends in Sweden and Norway for believing in me and supporting me and forgreat moments with all of you.
My dear, late mother, Hedvig. Her loss is deeply felt and the memories of herare so warm and such a strength.
My dear father, Gunnar, and my sister Sofia and family, for always supportingand believing in me. Marie for coming into our family with love and happiness.
and...... for all his love and wholehearted and sincere support, my lovely fantastic
husband Lars
… our dearest, loveliest son Anton , our own wonder of the world. I’m so proud to be your mother!

36
7 REFERENCES
[1] G.S Banker, C.T. Rhodes, Modern Pharmaceutics, Marcel Dekker,inc. 1996 p.11-13.
[2] A. Tiselius, Trans. Faraday Soc., 33 (1937) 524-531.
[3] S. Hjertén, Chromatogr. Rev., 9 (1967) 122-219.
[4] J.W. Jorgenson, K.D. Lukacs, Anal. Chem., 53 (1981) 1298-1302.
[5] S.F.Y. Li, Capillary Electrophoresis, Principles, Practice andApplications. Elsevier Science Publishers, 1993.
[6] K.D. Altria, N.W. Smith, C.H. Turnbull, Chromatographia, 46(1997) 664-674.
[7] L.A. Colón, K.J. Reynolds, R. Alicea-Maldonado, A.M. Fermier,Electrophoresis, 18 (1997) 2162-2174.
[8] S. Terabe, K. Otsuka, K. Ichikawa, A. Tsuchiya, T. Ando, Anal.Chem., 56 (1984) 111-113.
[9] S. Terabe, K. Otsuka, T. Ando, Anal. Chem., 57 (1985) 834-841.
[10] A. Chrambach, M.J. Dunn, B.J. Radola, Advances inElectrophoresis, Vol.7, p.134-141. VCH.
[11] H. Nishi, Electrophoresis, 20 (1999) 3237-3258.
[12] K.D. Altria, M.A. Kelly, B.J. Clark, TrAC, Trends Anal. Chem., 17(1998) 204-214.
[13] K.D. Altria, M.A. Kelly, B.J. Clark, TrAC, Trends Anal. Chem., 17(1998) 214-226.
[14] R. Nortvedt, F. Brakstad, O.M. Kvalheim, T. Lundstedt,Anvendelse av Kjemometri innen forskning og industri. TheSwedish Chemical Society, 1996.
[15] G.E.P Box, W.G. Hunter, J.S. Hunter, Statistics for Experimenters:An Introduction to Design, Data Analysis and Model Building,Wiley-Interscience, New York, 1978.
37
[16] E. Morgan, Chemometrics: Experimental Design, Wiley,Chichester, 1991.
[17] A. Höskuldsson, J. Chemometrics 2 (1988) 211-228.
[18] A.-M. Andersson, A. Karlsson, M. Josefsson, J. Gottfries,Chromatographia, 38 (1994) 715-722.
[19] M. Mulholland, Trends Anal. Chem., 7 (1988) 383-389.
[20] E. Hund, Y.V. Heyden, M. Haustein, D.L. Massart, J. Smeyers-Verbeke, J. Chromatogr. A, 874 (2000) 167-185.
[21] K.D. Altria, B.J. Clark, S.D. Filbey, M.A. Kelly, D.R. Rudd,Electrophoresis, 16 (1995) 2143-2148.
[22] V.M. Morris, C. Hargreaves, K. Overall, P.J. Marriott, J.G. Hughes,J. Chromatogr. A, 766 (1997) 245-254.
[23] S.D. Filbey, K.D. Altria, J. Cap. Elec., 1 (1994) 190-195.
[24] P. Helboe, Drug Inform. J., 26 (1992) 629-634.
[25] M.W.R. Fairweather, T-Y Daphne Lin, R. Kelly, J. Pharm. Sci., 84(11) (1995) 1322-1326.
[26] M.H. Golden, D.C. Cooper, M.T. Riebe, K.E. Carswell, J. Pharm.Sci., 85 (2) (1996) 240-245.
[27] ICH Topic Q1D, Stability: Bracketing and matrixing designs forstability testing of new drug substances and products.CPMP/ICH/4104/00.
[28] A. von Brocke, G. Nicholson, E. Bayer, Electrophoresis, 22 (2001)1251-1266.
[29] L. Yang, C.S. Lee, J. Chromatogr. A, 780 (1997) 207-218.
[30] K. Otsuka, S. Terabe, Analusis Magazine, 26 (1998) 44-47.
[31] L. Valtcheva, J. Mohammad, G. Pettersson, S. Hjertén, J.Chromatogr., 638 (1993) 263-267.
[32] Y. Tanaka, S. Terabe, J. Chromatogr. A, 694 (1995) 277-284.

38
[33] A. Amini, U. Paulsen-Sörman, D. Westerlund, Chromatographia,50 (1999) 497-506.
[34] W.M. Nelson, Q. Tang, K. Harrata, C.S. Lee, J. Chromatogr. A,749 (1996) 219-226.
[35] J. Suomi, S.K. Wiedmer, M. Jussila, M-L. Riekkola,Electrophoresis, 22 (2001) 2580-2587.
[36] S.K. Wiedmer, M. Jussila, M-L. Riekkola, Electrophoresis, 19(1998) 1711-1718.
[37] P.G. Muijselaar, K. Otsuba, S.Terabe, J. Chromatogr. A, 802(1998) 3-15.
[38] Validation of Compendial Methods, The United StatesPharmacopeia XXV, 2002, pp. 2256-2259.
[39] ICH Topic Q2A, Validation of Analytical Procedures: Text onValidations of Analytical Procedures. CPMP/ICH/381/95.
[40] ICH Topic Q2B, Validation of Analytical Procedures: Methodology.CPMP/ICH/281/95.
[41] D.R. Jenke, J. Liq. Chrom & Rel. Technol., 19(5) (1996) 719-736.
[42] D.R. Jenke, J. Liq. Chrom & Rel. Technol., 19(5) (1996) 737-757.
[43] K.D. Altria, S.D. Filbey, Chromatographia, 39 (1994) 306-310.
[44] C.E. Sänger-van de Griend, K. Gröningsson, J. Pharm. Biomed.Anal., 14 (1996) 295-304.
[45] J-w. Kang, A. Van Schepdael, E. Roets, J. Hoogmartens,Electrophoresis, 22 (2001) 2588-2592.
[46] H. Wätzig, M. Degenhardt, A. Kunkel, Electrophoresis, 19 (1998)2695-2752.
[47] A.A. Al-Badr, H.Y. Aboul-Enein, Analytical Profiles of DrugSubstances, 12 1981, p.385-432.
[48] A. Repta, T. Higuchi, J. Pharm. Sci., 60 (1971) 1465-1470.
[49] A. Noordam, L. Maat, H.C. Beyerman, J. Pharm. Sci., 70 (1981)96-97.

39
[50] M.V. Drake, J.J. O’Donnel, R. Sandman, J. Pharm. Sci., 71 (1982)358-359.
[51] W. Baeyens, G. Weiss, G. Van Der Weken, W. Van Den Bossche,C. Dewaele, J. Chromatogr., 638 (1993) 319-326.
[52] W.N. Charman, A.J. Humberstone, S.A. Charman, Pharm. Res., 9(1992) 1219-1223.
[53] A. Albert, E. Serjeant, The determination of ionization constants. Alaboratory manual. Chapman and Hall, London, 1984, p. 168-169.
[54] F.J. Muhtadi, M.M.A. Hassan, Analytical Profiles of DrugSubstances, 10, 1981, p. 93-138.
[55] P. Gundermann, R. Pohloudek-Fabini, Pharmazie, 35 (1980) 296-299.
[56] R. Weinberger, I.S. Lurie, Anal. Chem., 63 (1991) 823-827.
[57] I. Bjørnsdottir, S.H. Hansen, J. Biophys. Methods, 38 (1999) 155-161.
[58] J-T. Lim, R.N. Zare, C.G. Bailey, D.J. Rakestraw, C. Yan,Electrophoresis, 21 (200) 737-742.
[59] M. Korman, J. Vindevogel, P. Sandra, J. Chromatogr., 645 (1993)366-370.
[60] A. Dondoni, T. Dall’occo, G. Fantin, A. Medici, P. Pedrini, V.Rossetti, Il Farmaco-Ed. Pr., 41 (1986) 237-244.
[61] C.W. Maboundou, G. Paintaud, M. Bérard, P.R. Bechtel, J.Chromatogr. B, 657 (1994) 173-183.
[62] C. Desiderio, S. Fanali, J. Chromatogr. A, 895 (2000) 123-132.
[63] H. Soini, M. Stefansson, M-L. Riekkola, M.V. Novotny, Anal.Chem., 66 (1994) 3477-3484.
[64] C. Perrin, Y.V. Heyden, M. Maftouh, D.L. Massart,Electrophoresis, 22 (2001) 3203-3215.
[65] M. Fillet, P. Hubert, J. Crommen, Electrophoresis, 18 (1997) 1013-1018.

40
[66] K.D. Altria, Capillary Electrophoresis Guidebook, Methods inMolecular Biology, chapter 4, 1996.
[67] M. Molina, S.K. Wiedmer, M. Jussila, M. Silva, M-L. Riekkola, J.Chromatogr. A, 927 (2001) 191-202.
[68] S. Rudaz, S. Cherkaoui, J-Y. Gauvrit, P. Lantéri, J-L. Veuthey,Electrophoresis, 22 (2001) 3316-3326.


![Separation Principles · Chromatography Ute Pyell 1.1 Introduction Electrokinetic chromatography (EKC) is a term that was coined by Terabe and coworkers in 1985 [1,2]. EKC belongs](https://img.pdfslide.us/doc/110x75/5eccead294aed2204942c47d/separation-principles-chromatography-ute-pyell-11-introduction-electrokinetic-chromatography.jpg)