Embed Size (px)
Citation preview

ANALYSIS OF N-NITROSAMES IN WATER USING MICELLAR
ELECTROKINETIC CHROMATOGRAPHY (MEKC) AND DEVELOPMENT OF
ONLINE AND OFFLINE METHODS OF EXTRACTION AND ENRICHMENT
OF NEUTRAL POLAR ANALYTES
by
© Ali Modir-Rousta
A Thesis submitted to the
School of Graduate Studies
In partial fulfillment of the requirements for the degree of
Doctor of Philosophy (Ph.D.)
Department of Chemistry
Memorial University of Newfoundland
August 2015
St. John’s Newfoundland and Labrador
ii
ABSTRACT
Evaluation of the quality of the environment is essential for human wellness as pollutants
in trace amounts can cause serious health problem. Nitrosamines are a group of
compounds that are considered potential carcinogens and can be found in drinking water
(as disinfection byproducts), foods, beverages and cosmetics. To monitor the level of
these compounds to minimize daily intakes, fast and reliable analytical techniques are
required. As these compounds are relatively highly polar, extraction and enrichment from
environmental samples (aqueous) are challenging. Also, the trend of analytical techniques
toward the reduction of sample size and minimization of organic solvent use demands
new methods of analysis. In light of fulfilling these requirements, a new method of online
preconcentration tailored to an electrokinetic chromatography is introduced. In this
method, electroosmotic flow (EOF) was suppressed to increase the interaction time
between analyte and micellar phase, therefore the only force to mobilize the neutral
analytes is the interaction of analyte with moving micelles. In absence of EOF, polarity of
applied potential was switched (negative or positive) to force (anionic or cationic)
micelles to move toward the detector. To avoid the excessive band broadening due to
longer analysis time caused by slow moving micelles, auxiliary pressure was introduced
to boost the micelle movement toward the detector using an in house designed and built
apparatus. Applying the external auxiliary pressure significantly reduced the analysis
times without compromising separation efficiency. Parameters, such as type of

iii
surfactants, composition of background electrolyte (BGE), type of capillary, matrix
effect, organic modifiers, etc., were evaluated in optimization of the method. The
enrichment factors for targeted analytes were impressive, particularly; cationic surfactants
were shown to be suitable for analysis of nitrosamines due to their ability to act as
hydrogen bond donors. Ammonium perfluorooctanoate (APFO) also showed remarkable
results in term of peak shapes and number of theoretical plates. It was shown that the
separation results were best when a high conductivity sample was paired with a BGE of
lower conductivity. Using higher surfactant concentrations (up to 200 mM SDS) than
usual (50 mM SDS) for micellar electrokinetic chromatography (MEKC) improved the
sweeping.
A new method for micro-extraction and enrichment of highly polar neutral analytes (N-
Nitrosamines in particular) based on three-phase drop micro-extraction was introduced
and its performance studied. In this method, a new device using some easy-to-find
components was fabricated and its operation and application demonstrated. Compared to
conventional extraction methods (liquid-liquid extraction), consumption of organic
solvents and operation times were significantly lower.
iv
ACKNOWLEDGEMENTS
It is a pleasure to thank those who made this thesis possible. First, a special thank to my
supervisor, Dr. Christina Bottaro, who has been my guidance and mentor and a wonderful
friend.
I would like to thank my supervisory committee, Dr. Francesca Kerton and Dr. Erika
Merschrod for their advice and guiding comments and reviewing this thesis.
I also owe my deepest gratitude to faculty and staff in department of chemistry, C-CART
and the School of Graduate Studies of Memorial University and the National Sciences
Research Council of Canada (NSERC) for funding.

v
Dedication
I am honored to dedicate this work to my lovely wife, daughter, and son in appreciation to
their unconditional support.

vi
Table of Contents
ABSTRACT ........................................................................................................................ ii
ACKNOWLEDGEMENTS ............................................................................................... iv
Table of Contents ............................................................................................................... vi
List of Tables ................................................................................................................... xiii
List of Figures ................................................................................................................... xv
List of Symbols, Nomenclature or Abbreviations .......................................................... xxii
Co-authorship Statement ............................................................................................. xxvi
Chapter 1 Introduction and Overview ........................................................................... 1
1.1. Introduction ........................................................................................................... 2
1.2. Nitrosamines .......................................................................................................... 2
1.2.1. Physical and Chemical Characteristics .......................................................... 6
1.2.2. Current Methods of Analysis of Nitrosamines ............................................ 11
1.3. Capillary Electrophoresis .................................................................................... 12
1.3.1. History of Capillary Electrophoresis (CE) ................................................... 12
vii
1.3.2. Theory of CE ................................................................................................ 13
1.3.3. Micellar Electrokinetic Chromatography (MEKC) ..................................... 16
1.3.4. Solute Micelle Interaction ............................................................................ 19
1.3.5. Limitations of CE ......................................................................................... 21
1.3.6. Detection Methods in CE and MEKC.......................................................... 22
1.4. Online Analyte Enrichment Techniques in CE ................................................... 24
1.4.1. Stacking in CZE ........................................................................................... 28
1.4.2. Stacking in MEKC ....................................................................................... 37
1.4.3. Sweeping in MEKC ..................................................................................... 41
1.4.4. Analyte Focusing by Micelle Collapse ........................................................ 52
1.5. Offline Sample Enrichment ................................................................................. 54
1.5.1. Classification of Extraction Techniques ...................................................... 56
1.5.2. Micro-extraction .......................................................................................... 58
1.6. Summary of Thesis Objectives ........................................................................... 68
1.7. References: .......................................................................................................... 71

viii
Chapter 2 New Pressure Assisted Sweeping Online Preconcentration for Polar
Environmentally-Relevant Nitrosamines: Part 1. Sweeping for Polar Compounds and
Application of Auxiliary Pressure[1] ................................................................................ 86
2.1. Introduction ......................................................................................................... 87
2.2. Materials and Methods ........................................................................................ 89
2.2.1. Apparatus ..................................................................................................... 89
2.2.2. Materials ...................................................................................................... 90
2.2.3. Conductivity Measurements ........................................................................ 91
2.3. Results and Discussion ........................................................................................ 91
2.3.1. Application of Pressure ................................................................................ 93
2.3.2. Device for Application of Auxiliary Pressure.............................................. 97
2.3.3. Explanation of Analyte Behavior with Pressure Assisted Sweeping ........... 99
2.3.4. Effect of Conductivity of Sample Matrix .................................................. 102
2.3.5. Effect of Surfactant Concentration in BGE ............................................... 104
2.3.6. Evaluation of the Performance ................................................................... 105
2.4. Conclusions ....................................................................................................... 106

ix
2.5. References: ........................................................................................................ 108
Chapter 3 New Pressure Assisted Sweeping Online Preconcentration for Highly Polar
Environmentally-Relevant Nitrosamines: Part 2. Cationic and Anionic Surfactants with
Zero-Flow Capillaries [1]................................................................................................ 110
3.1. Introduction ....................................................................................................... 111
3.2. Material and Methods ........................................................................................ 116
3.2.1. Apparatus ................................................................................................... 116
3.2.2. Materials .................................................................................................... 116
3.3. Results and Discussion ...................................................................................... 117
3.3.1. Suppression of EOF ................................................................................... 117
3.3.2. Optimization of Conditions with Regards to Surfactants .......................... 121
3.3.3. Calculation of k′ and Separation Characteristics from Sweeping-RM-EKC
Experiments ............................................................................................................. 127
3.4. Concluding Remarks ......................................................................................... 133
3.5. References: ........................................................................................................ 134
Chapter 4 Analysis of Nitrosamines in Wastewater Samples Using SPE-MEKC .... 137

x
4.1. Introduction ....................................................................................................... 138
4.2. Materials and Methods ...................................................................................... 141
4.2.1. Instruments and Operating Conditions ...................................................... 141
4.2.2. Materials .................................................................................................... 142
4.2.3. Standards and Samples .............................................................................. 143
4.2.4. Background Electrolyte solutions (BGE) .................................................. 143
4.3. Procedures ......................................................................................................... 144
4.3.1. Capillary Conditioning ............................................................................... 144
4.4. Results and Discussion ...................................................................................... 145
4.4.1. Effect of Sample Matrix ............................................................................. 150
4.4.2. Effect of Temperature ................................................................................ 151
4.4.3. Solid Phase Extraction (SPE) ..................................................................... 151
4.4.4. Quantitative Analysis ................................................................................. 155
4.5. Conclusions ....................................................................................................... 160
4.6. References ......................................................................................................... 161

xi
Chapter 5 Multi-phase Single Drop Micro-Extraction (SDME) for Polar Neutral
Organic Compounds ....................................................................................................... 164
5.1. Introduction ....................................................................................................... 165
5.2. Material and Methods ........................................................................................ 169
5.2.1. Materials .................................................................................................... 169
5.2.2. Instruments ................................................................................................. 169
5.3. SDME of Polar Neutral Analytes ...................................................................... 170
5.3.1. Apparatus ................................................................................................... 171
5.4. Methods and discussion .................................................................................... 172
5.4.1. Results ........................................................................................................ 175
5.5. Continuous Flow Single Drop Micro-extraction (CFSDME) of Neutral Polar
Analytes ....................................................................................................................... 178
5.6. Quantitative Analysis ........................................................................................ 180
5.7. Conclusion ......................................................................................................... 181
5.8. References: ........................................................................................................ 183
Chapter 6 Summary and Future Work ....................................................................... 187
xii
6.1. References: ........................................................................................................ 195
xiii
List of Tables
Table 1.1. Physical properties of nitrosamines [40]............................................................ 9
Table 1.2 Sample levels of NDMA in food and drinksa .................................................... 11
Table 1.3. Summary of various online preconcentration techniques in capillary
electrophoresis [47] ............................................................................................................ 26
Table 2.1. Physical properties and structures of nitrosamines in watera ............................ 88
Table 2.2. Statistical data for analysis of nitrosamines .................................................... 106
Table 3.1. Assessment of suitability of various combinations of micellar phase, pH and
polarity for sweeping in fused silica capillary ................................................................. 118
Table 3.2. Effect of surfactants on EOF in capillaries with bonded phases. ................... 120
Table 3.3. Effect of ionic strength of solution on CMCa ................................................. 121
Table 3.4. MEKC-based estimation of k for nitrosamines with different PSPsa ............. 126
Table 3.5- Sweeping-RM-EKC estimation a of k' ............................................................ 130
Table 4.1-Buffer solutions (50 mM) for pH ranging from 2 to 12 .................................. 144
Table 4.2. The optimized MEKC conditions ................................................................... 149

xiv
Table 4.3 Performance of selected SPE sorbents for extraction of nitrosamines ............ 152
Table 4.4. Optimized conditions for SPE method (Resprep from RESTEK) .................. 154
Table 4.5. Analytical characteristic of MEKC and SPE-MEKC ..................................... 157
Table 4.6. Analytical data obtained from spiked reagent water (SPE-MEKC) ............... 158
Table 4.7. Analytical data obtained from fortified water samples (SPE-MEKC) ........... 159
Table 5.1. sleeve size based on calculated values for half drop for Hamilton needle blunt
point gauge 22s (.474 mm O.D.and .178 mm wall thickness .......................................... 174
Table 5.2 Analytical data obtained single drop micro-extraction .................................... 177
Table 5.3. Analytical data obtained using continuous flow single drop micro-extraction
.......................................................................................................................................... 180

xv
List of Figures
Figure 1.1- Configuration of N-nitroso functional group .................................................... 7
Figure 1.2- Nitrosamine geometric isomers, R1, R2 are different alkyl groups ................... 8
Figure 1.3- Structures of nitrosamines that have been identified in drinking water. ......... 10
Figure 1.4. Schematic view of EOF and electrophoretic mobility of charged particles .... 15
Figure 1.5. Diagram of a typical CE presented with positive applied potential. ............... 16
Figure 1.6. Mobility of micelles and neutral analytes in MEKC when anionic surfactants
are used. ............................................................................................................................. 17
Figure 1.7. Schematic diagrams of the FASS technique. (a) The capillary is conditioned
with a BGE (a high conductivity buffer), the sample, prepared in a low-conductivity
matrix, is then injected to a certain length, and a high positive voltage is applied; (b)
focusing of the analytes occurs near the boundaries between the sample zone and the
BGE because of its mobility changes; (c) stacked analytes migrate and are separated by
the CZE mode. ................................................................................................................... 31
Figure 1.8. Schematic diagrams of the LVSS technique for anionic analytes.(a) The
capillary is conditioned with a BGE (a high-conductivity buffer), the sample, prepared in
a low-conductivity matrix, is then injected to a certain length, and then a high negative

xvi
voltage is applied (EOF is toward the inlet); (b) the anionic analytes move toward the
detection end (outlet) and stack at one side of the boundary, whereas the cations and
neutral species move and exit the capillary at the injection end (inlet); (c) the
electrophoretic current is carefully monitored until it reaches approximately 95–99% of
its original value, and the polarity is then quickly returned to positive (EOF is reversed);
(d) the following separation occurs by CZE mode. ........... Error! Bookmark not defined.
Figure 1.9. Schematic diagrams of a pH-mediated stacking technique. (a) The capillary is
conditioned with a high conductivity BGE, the cationic analytes dissolved in a low-
conductivity buffer and a plug of strong acid are injected into the capillary. (b) a positive
separation potential is applied; (c) the strong acid titrates the sample solution to create a
neutral zone causing the ions to migrate faster and become stacked; (d) the subsequent
separation occurs by the CZE mode. ................................................................................. 36
Figure 1.10. Schematic diagrams of a normal-stacking MEKC technique. (a) The sample
is dissolved in a low-conductivity buffer, BGE, consisting of SDS to form the micelles;
after the background and sample solution are injected, respectively, a positive voltage is
applied; (b) the SDS micelles from the detector-side enter the sample zone and then
permit the analytes to migrate and become stacked; (c) then the SDS-analytes are
separated by the MEKC mode. .......................................................................................... 38
1.11. Schematic diagrams of a reversed-stacking MEKC technique. (a) The sample and
BGE are prepared as described in Figure 1.10(A) but a negative polarity is applied; (b)

xvii
the EOF moves toward the inlet, the anionic analytes move toward the outlet and stack at
one side of the boundary; (c) the electrophoretic current reaches approximately 95–99%
of its original value, the polarity is quickly returned to positive, reversing the EOF; (d)
then the SDS-analytes are separated by the MEKC mode. ................................................ 40
Figure 1.12. Schematic of a reversed-sweeping MEKC technique. The BGE consists of an
anionic surfactant (for example, SDS) and a low-pH buffer solution, but the samples are
dissolved in a micellar free buffer; (a) Capillary is conditioned and filled with the BGE
and then sample solution is injected, (b) a negative polarity is applied to power the CE
separation; (c) anionic SDS micelles are sweeping the analytes; the subsequent separation
occurs by MEKC ................................................................................................................ 43
1.13- Schematic diagrams of CSEI-sweeping-MEKC technique. (a) The capillary is
conditioned and filled with a non-micellar BGE, and then a high-conductivity buffer and
a short plug of water are injected; (b) the a low-conductivity cationic analytes is
electrokinetically injected. (c) Micellar BGEs are placed at both ends and the negative
polarity voltage is applied; (d) the micelles enter the capillary to sweep the stacked
analytes into narrow bands; (e) the following separation is achieved by the reversed
MEKC mode. ..................................................................................................................... 45
Figure 1.14. Schematic diagram of the ASEI-sweep-MEKC method: (a) PAA-coated
(low/zero EOF) capillary is conditioned with a non-micellar BGE, then a high
conductivity (HCB) buffer free of micelles is injected, followed by the injection of a short

xviii
water plug. (b) Electrokinetic injection with negative polarity (c) Anionic analytes focus
at the interface between the water and HCB zones. (d) Micellar BGEs are placed at both
ends of the capillary followed by the application of voltage with positive polarity. (e)
Separation by MEKC. ........................................................................................................ 47
Figure 1.15. Schematic diagrams of a dynamic pH junction technique. (a) The capillary is
filled with a high pH-BGE and a section of sample solution (prepared in a lower-pH
buffer); (b) a high positive voltage is applied, resulting in a discontinuous electrolyte
zone; (c) the anionic analytes are focused on the boundary of the pH junction; (d)
separation of the analytes occurs by the CZE. ................................................................... 49
Figure 1.16. Schematic diagrams of the dynamic pH junction- sweeping technique. (a)
The micellar (such as SDS) BGE and the sample solution (a non-micellar buffer) are
injected into the capillary, respectively; (b) when the injection is complete, a positive
polarity is applied (if a negatively charged SDS surfactant is used) to power the CE
separation; (c) the neutral analytes are converted to anions and are swept by the SDS
micelles; (d) separation occurs by MEKC. ........................................................................ 51
Figure 1.17. Analyte focusing by micelle collapse method.[119] ..................................... 53
Figure 1.18. Extraction method classification [136] .......................................................... 57
Figure 2.1. Effect of capillary length on analysis time in absence of auxiliary pressure .. 93
Figure 2.2. Effect of pressure on analysis time. Capillary: length 130 cm, ID 50 μm ...... 93
xix
Figure 2.3. Effect of using auxiliary pressure on migration time and peak shapes
Analytes: 1) NDBA, 2) NDPA, 3) NPIP, 4 during analysis: A 0 mbar, B 25 mbar, C 50
mbar, D 50 mbar applied after 15 min delay. ................................................................... 96
Figure 2.4. Diagram of portable device) for application of external pressure Components
are: C, nitrogen gas container; G1 and G2, regulator, S1 and S2, solenoid valves; T,
pressure sensor; P, pressure components in CE and V is vial. .......................................... 98
Figure 2.5 . Conceptual representation of analyte behavior with pressure assisted
sweeping. ......................................................................................................................... 100
Figure 2.6. The effect of conductivity of sample matrix and injection volume on peak
shapes. Analytes: 1) NPIP and 2) NPYR; BGE: 50 mM phosphate buffer pH 1.9 and 100
mM SDS, conductivity 7.2 mS; Capillary is 33.5 cm long (25 cm effective length) and 50
μm ID; voltage -7.7 kV; auxiliary pressure 25 mbar; injection at 50 mbar A) 100 sec, B)
50 sec; .............................................................................................................................. 103
Figure 3.1. Effect of concentration of SDS on peak shape in sweeping-RM-EKC. BGE:
50-300 mM of SDS in 25 mM phosphate buffer (pH 7.8), capillary: PSA coated 75μm ID
and 33.5 cm, potential: +180Vcm-1
, injection: 100 mbar.s. ............................................. 123
Figure 3.2. Effect of concentration of SDS on peak width in MEKC. CE condition: fused
silica capillary with 98.5 cm length and 50 μm diameter, ID, electric field 230 Vcm-1
,
hydrodynamic injection (50 s at 50 mbar), auxiliary pressure 70 mbar, BGE: 25 mM of

xx
phosphate buffer at pH 1.9 and 50-300 mM of SDS. Sample is a mixture of seven
nitrosamines in buffer solution with same conductivity as BGE. .................................... 124
Figure 3.3. Comparison of the selectivity and peak shapes in sweeping-RM-EKCSDS,
CTAC, bile salts and APFO, BGE: 200 mM surfactant in 25 mM phosphate buffer (pH
7.0) capillary: PSA coated 50 μm ID and 34 cm length, potential: 180 V/cm, injection:
250 mbar.s and 5 mbar external pressure. Sample: mixture of seven nitrosamines at
concentration of 10 mg L-1
............................................................................................... 128
Figure 3.4. Sweeping-RM-EKC of fortified samples Sweeping-RM-EKC using SDS
under optimized conditions with fortified samples a) seawater, b) tap water, and c)
wastewater. BGE: 125 mM SDS in 25 mM phosphate buffer (pH 7.8), capillary: PSA
coated 50 μm ID and 34 cm length, potential 180V/cm, injection 1000 mbar.s and 20
mbar external pressure after 5 min. Concentration of each nitrosamines in each sample is
0.5 mg L-1
......................................................................................................................... 131
Figure 4.1. Electrochromatograms MEKC of nitrosamines at different pH, 50 mM of SDS
in buffer solutions: a) pH 11, b) pH 10, c) pH 9, d) pH 8, and e) pH 6 capillary length
64.5cm, potential +25 kV, and injection volume 2.0 nL. Sample: 1) NDMA, 2) NMOR,
3) NPYR, 4) NDEA, 5) NPIP, 6) NDPA, 7) NDBA. ...................................................... 147
Figure 4.2. Effect of concentration of SDS on separation 50 mM of buffer solutions pH
10 and SDS concentration of: a) 150mM, b) 125 mM, c) 100 mM, d) 50 mM, and e) 25

xxi
mM capillary length 64.5cm, potential +25 kV, and injection volume 2.0 nL. Sample: 1)
NDMA, 2) NMOR, 3) NPYR, 4) NDEA, 5) NPIP, 6) NDPA, 7) NDBA. ...................... 148
Figure 4.3 Performance (% Recovery) of selected SPE sorbent for extraction of seven
nitrosamines. .................................................................................................................... 153
Figure 5.1. The schematic of formation of two-phase concentric droplets...................... 172
Figure 5.2. Schematic of using PTFE sleeve to increase the size of droplets .................. 175
Figure 5.3. Illustration of formation of concentric droplets inside and outside a solution.
a) formation of co-centric two phase drops inside the sample solution b) retracting drops
into the syringe, c) formation of two-phase droplets outside the solution d) evaporation of
outer layer using nitrogen flow, e) collecting enriched sample into the needle............... 176
Figure 5.4. Schematic of a device for formation of concentric droplets with continuous
flow. ................................................................................................................................. 179
Figure 6.1. Schematic an automated continuous flow single drop micro-extraction. Water,
sample, and solvent (eluent) can be pumped into a SPE cartridge accordingly and flow of
nitrogen gas is used for drying the sorbent in SPE and extractant in single drop micro-
extraction. Finally extractant is pumped to an analytical instrument. ............................. 194

xxii
List of Symbols, Nomenclature or Abbreviations
ACN acetonitrile
APFO ammonium perfluorooctanoate
BGE background electrolyte solution
CE capillary electrophoresis
CFME continuous-flow micro-extraction
CMC critical micelle concentration
CZE capillary zone electrophoresis
CTAB cetyltrimethylammoniumbrmide
CTAC cetyltrimethylammoniumchloride
DAD diode array detector
DLLME dispersive liquid-liquid micro-extraction
DMSO dimethyl sulfoxide
DBP disinfection by-product
DL detection limit

xxiii
EI electron ionization
EOF electroosmotic flow
ESI-MS electrospray ionization- mass spectrometry
FASS field amplified sample stacking
GC-MS gas chromatography- mass spectrometry
HBA hydrogen bonding acceptor
HBD hydrogen bonding donor
HF-LPME hollow-fibre liquid-phase micro-extraction
HPLC high performance liquid chromatography
HS-LPME Headspace liquid-phase micro-extraction
ID internal diameter
IEF isoelectric focusing
IPA isopropanol
LED high-emitting diode
LSER linear solvation energy relationship

xxiv
LVSS large volume sample stacking
MEKC micellar electrokinetic chromatography
MD micro-dialysis
MS mass spectrometry
MS-MS tandem mass spectrometry
NDBA N-nitrosodibutyl amine
NDEA N-nitrosodietyl amine
NDMA N-nitrosodimetyl amine
NDPA. N-nitrosodipropyl amine
NMOR N-nitrosomorpholine
NPIP N-nitrosopiperidine
NPYR N-nitrosopyrrolidine
OD outer diameter
PEG polyethylene glycol
PSP pseudostationary phase

xxv
RM-EKC reversed migration-electrokinetic chromatography
RSD relative standard deviation
S/N signal to noise ratio
SDS sodium dodecylsulfate
SLMs supported liquid membranes
SDME single drop micro-extraction
SFE supercritical fluid extraction
SPE solid phase extraction
SPME solid phase micro-extraction
VOC volatile organic compounds
U.S. EPA U.S. environmental protection agency
UV ultraviolet
UV-vis ultraviolet-visible

xxvi
Co-authorship Statement
Chapter 2 and 3 have already been published in a peer reviewed Journal by Ali Modir-
Rousta as first author and Dr. C. S. Bottaro as corresponding author. However, at that
time of thesis submission Chapter 4 and 5 were being prepared for publication and are in
publication format.
Dr. C. Bottaro proposed the idea of using capillary electrophoresis for analysis of the
disinfection byproducts in drinking water and wastewater. The first author proposed the
analysis of N-nitrosamines in environmental samples. The idea of new pressure assisted
sweeping RM-EKC and single-drop micro-extraction concepts were introduced by the
first author, with suggestions made during the research by Dr. C. S. Bottaro.
All experimental work was performed by the first author; interpretation and modification
of experiments were applied under Dr. C. S. Bottaro’s supervision.
All manuscripts were prepared by the first author and Dr. C. S. Bottaro edited the
manuscripts and responded to reviewers.

1
Chapter 1 Introduction and Overview

2
1.1. Introduction
A complete review of nitrosamine chemistry and methods of analysis for nitrosamines is
presented in this chapter. After introducing information about nitrosamines including
physical, chemical, and structural characteristics – which are key to understanding their
importance and executing research described in this thesis – an overview on the current
methods for chemical analysis of nitrosamines in the literature (including GC, HPLC, and
CE) is presented. This overview highlights the importance of CE as a reliable and
powerful tool in analytical chemistry. The theory of CE and related techniques are
explained, particular attention is given to the issue of the poor sensitivity in CE and the
ways of solving this problem, such as using better detection systems and sample
enrichment. A technical review of existing detection systems and a detailed discussion of
methods of sample enrichment (e.g. online and offline methods) is presented. Since
offline sample enrichment techniques are most common and are the main competition for
online preconcentration, theories and mechanism of these methods are reviewed. In
particular, micro-extraction as a new frontier in the green analytical chemistry in the
literature is investigated and latest advances in this field are reviewed.
1.2. Nitrosamines
N-Nitrosamines were reported for the first time in 1863 as synthetic intermediates in
rubber industries [1]. Toxicity in humans was not established until nearly a century later.
Barnes and Magee reported that when fed to rats N-Nitrosodimethylamine (NDMA)

3
induced cancer of the liver [2]. Later it was found that alkylation of cellular DNA by
NDMA was the main reason for induction of a variety of cancers [3-4]. Nitrosamines are
now widely recognized as potential carcinogens and as a serious threat to public
health.[5] Generally, nitrosamines are polar compounds that are found in food and
beverages [6], drinking water [7], and air [8]. They are often formed as disinfection by-
products (DBPs) [9], thus they can occur in drinking water. Since they have been
identified as probable carcinogens [10], they are an important public health concern.
Nitrosamines are relatively stable compounds in environment [11]. They are formed by a
reaction between secondary or tertiary amines [12] and nitrous agents such as nitrous acid
or nitrogen oxides [13] and they don’t decompose easily. Nitrosamines have been found
widely in the daily diet (foods and beverages) [14-15], cosmetics [16-17],
pharmaceuticals [18], biological systems [19], air (e.g. tobacco smoke) [20],
contaminated ground water (e.g. from rocket fuel) [21], rubber [16], and in drinking water
and wastewater [10, 22-23]. The presence of secondary amines in food and nitrite as a
food preservative leads to the formation of nitrosamines in the digestion system due to the
acidic nature of stomach fluid.
Recently, The U.S. EPA announced a new regulation for water contaminants (Section
304(a) of the Clean Water Act (33 U.S.C. 1314(a)) [24]. It “requires EPA to publish and
periodically update water quality criteria. These criteria are to reflect the latest scientific
knowledge on the identifiable effects of pollutants on public health and welfare, aquatic
life, and recreation”. It presents 'safe' concentrations for humans, and in the case of

4
suspected or proven carcinogens, gives various levels of incremental cancer risk. The
Section 304(a) water quality criterion is a qualitative or quantitative estimate of the
concentration of a water constituent or pollutant in ambient waters which, when not
exceeded, will ensure a water quality sufficient to protect a specified water use. Under the
Act a criterion is based solely on data and scientific judgment (Document EPA#:
440580064). For the starting point, a group of contaminants including 16 carcinogen
volatile organic compounds (VOC) were introduced. It is important to know that
nitrosamines were a part of the first group. This highlights the degree of importance of the
presence of these compounds in the environment for human health risk. Currently, N-
nitrosodimethylamine (NDMA), N-nitrosomethylethylamine (NMEA), N-
nitrosodiethylamine (NDEA), N-nitrosopyrrolidine (NPYR), N-nitrosodipropylamine
(NDPA) and N-nitrosodibutylamine (NDBA), are included in the Unregulated
Contaminant Monitoring Regulation (UCMR 2), listed in the recently proposed
Contaminant Candidate List 3 (CCL 3) by the U.S. EPA. This organization has also
established ng L-1
control levels in drinking water. [25-26]
1.2.1. Nitrosamines formation during chlorination of water
In 2003 Choi and Valentine proposed a pathway for nitrosation during chlorination of
drinking water and waste water [27]. In this pathway, formation of ClNO2 is described by
transferring Cl+
from chlorine or chloramines to nitrite. Nitrosating agent (N2O4) is
generated by further reaction between ClNO2 and nitrite. In an experiment, 0.1 mM free
5
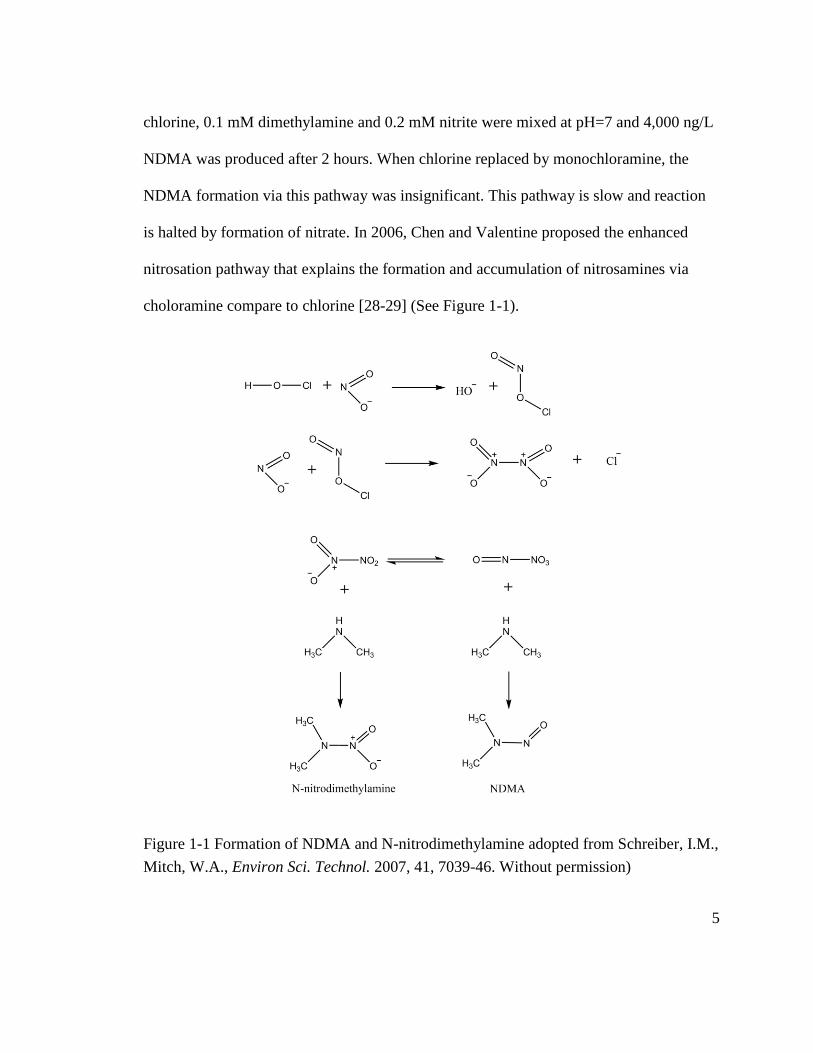
chlorine, 0.1 mM dimethylamine and 0.2 mM nitrite were mixed at pH=7 and 4,000 ng/L
NDMA was produced after 2 hours. When chlorine replaced by monochloramine, the
NDMA formation via this pathway was insignificant. This pathway is slow and reaction
is halted by formation of nitrate. In 2006, Chen and Valentine proposed the enhanced
nitrosation pathway that explains the formation and accumulation of nitrosamines via
choloramine compare to chlorine [28-29] (See Figure 1-1).
Figure 1-1 Formation of NDMA and N-nitrodimethylamine adopted from Schreiber, I.M.,
Mitch, W.A., Environ Sci. Technol. 2007, 41, 7039-46. Without permission)

6
According to the recent pathway, NDMA is formed from reaction between
monochloramine and natural organic matter (NOM) at lower pH[29].
1.2.2. Physical and Chemical Characteristics
The properties of the simplest members in the broader class of N-nitrosodialkylamines
(e.g., N-nitrosodimethyl- and N-nitrosodiethyl-amines) (figure 1-4) have been most fully
investigated [30-31]. The smaller N-nitrosodialkylamines are yellow or yellow-green,
non-hygroscopic liquids, which are fairly soluble in water and readily soluble in organic
solvents. N-Nitrosodialkylamines have relatively low melting points and their boiling
points lie in the range of 150-220 °C (Table1-1). The densities of nitrosamines are
typically in the range of 0.9-1.2 g cm-3
, increasing with molecular weight [32]. The dipole
moments of N-nitrosodialkylamines are evidence of considerable polarity of the
molecules. For example, the dipole moment of N-nitrosodimethylamine is 3.98 D [33-34]
( H2O is 1.8 D).
The dissociation energy of the N-N bond in N-nitrosodimethylamine was reported 134 kJ
mol-1
that is consistent with the hypothesis of presence of delocalized electrons or
conjugation system in the nitrosamine group [35]. This also confirmed by XRD results,
which showed that the molecules of aliphatic nitrosamines have planar structures in the
crystalline states (both nitrogen atoms are sp2 hybridized) (see Figure 1.2).

7
A summary of XRD data follows: the bond angles of NDMA in CuCl2 complexes are C1-
N-N: 120.3°, C2-N-N: 116.4° and N-N-O: 113.6°; and bond lengths are 1.235 Å for N-O,
1.344 Å for N-N, 1.461 Å for C-N, and 1.129 Å for C-H. It is interesting that the N-N
bond in N-nitrosodimethylamine is shorter by 0.04 A than in N-nitrodimethylamine,
which has been attributed to the greater electron-withdrawing activity of the nitroso-
group compared to nitro-group [36]. Considering above data (bonds angle and length) for
amino nitrogen, it can be concluded that this nitrogen has the characteristics of sp2
hybridization.
Figure 1-2- Configuration of N-nitroso functional group
In a number of studies the internal rotation about the N-N bond with partial double bond
character was investigated. The barrier to rotation about this bond was estimated to be
approximately 100 kJ mol-1
[37]. This rotation leads to the appearance of cis-trans
isomerism in nitrosamines (Figure 1.3). The presence of the isomers of a large number of
N-nitroso-derivatives has been demonstrated by NMR spectroscopy [38].
Optical study of nitrosamines functional group shows two absorption peaks in the UV
region; a broad peak in range of 350-400 nm, and a stronger and narrower peak in range
of 220-240). The band at 350-400 nm [39] is attributed to n-π* transition (n is for non-

8
bonding or lone pair electrons) and one at 220-240 nm to π-π* transitions [40] that is
considered nitroso-chromophores in aqueous solutions. The absorption wavelength
increases with the addition of an electron donating substitute and decreases with the
addition of an electron withdrawing substitute. In aqueous solution of N-
nitrosodimethylamine the π-π* transition has a λmax 228 nm and the n-π* transition at 332
nm [41].
Figure 1-3- Nitrosamine geometric isomers, R1, R2 are different alkyl groups
N-Nitrosamines act as potential Lewis bases. The conjugated system between nitrogen
atoms and oxygen with the withdrawal of the electron cloud towards the oxygen atom is
responsible for many interesting reactions of nitrosamines such as the formation of metal
complexes, reaction with inorganic acids, reduction to N,N-substituted hydrazines,
oxidation, nitration, cyclization, and photochemical reactions. These reactions could be
considered as potential methods of derivatization of nitrosamine, however in most
derivatization cases the first step is elimination of nitroso group to form amines which
limits selective derivatization.

9
Since identification of NDMA as a water disinfection by-product in 1989 [42], drinking
water in Ontario, Canada and California, USA has been monitored for NDMA, with
maximum allowable concentrations of 9 and 10 ngL-1
, respectively.
Table 1.1. Physical properties of nitrosamines [43]
Compound Abbreviation Molecular Formula
Molar mass (gmol
-1)
BP (°C)
LogP (octanol/water)
N-nitrosodimethylamine NDMA C2H6N2O 74.048 152 -0.57
N-nitrosomorpholine NMOR C4H8N2O2 116.059 224 -0.44
N-nitrosopyrrolidine NPYR C4H8N2O 100.064 214 -0.19
N-nitrosopiperidine NPIP C5H10N2O 114.145 219 0.36
N-nitrosodiethylamine NDEA C4H10N2O 102.079 176.9 0.48
N-nitrosodi-n-propylamine NDPA C6H14N2O 130.187 206 1.36 N-nitrosodi-n-butylamine NDBA C8H18N2O 158.241 116 2.63
In a study in the Netherlands, the average daily intake of NDMA was estimated to be 0.38
μg per day. The main intake of NDMA came from beer, which is 71% of daily intake of
an average consumer [44]. In a similar study in Germany the total intake of NDMA was
estimated to be 1.1 μg /day in which 64% of daily intake came from beer [45]. However,
the latest study shows this portion has significantly decreased due to improvement in beer
processing [15].
10
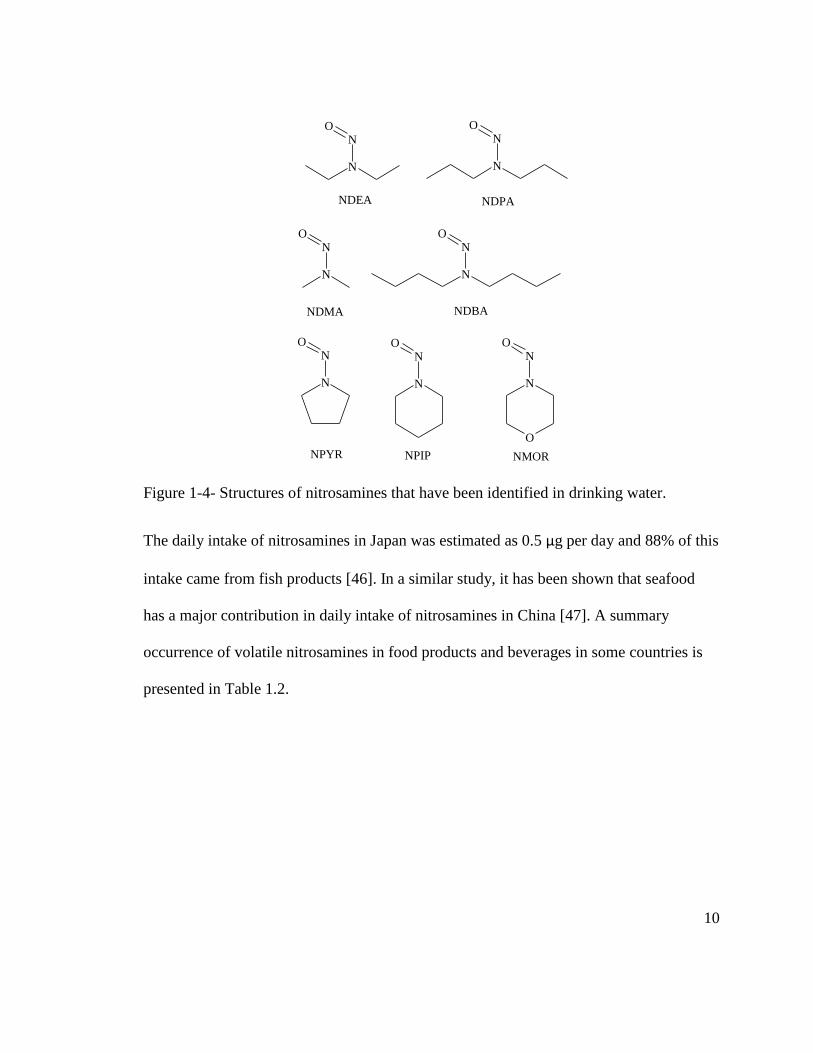
Figure 1-4- Structures of nitrosamines that have been identified in drinking water.
The daily intake of nitrosamines in Japan was estimated as 0.5 μg per day and 88% of this
intake came from fish products [46]. In a similar study, it has been shown that seafood
has a major contribution in daily intake of nitrosamines in China [47]. A summary
occurrence of volatile nitrosamines in food products and beverages in some countries is
presented in Table 1.2.
N
NO
N
NO
N
NO
N
NO
N
NO
N
NO
N
NO
O
NDMA
NDEA NDPA
NDBA
NPYR NPIP NMOR

11
Table 1.2 Sample levels of NDMA in food and drinksa
Source ng.g-1
Squid, dried broiled (Japan) 313
Dried Fish (Greenland) 38
Smoked meat (Canada) 2
Salted meat (USSR) 54
Cheese (Canada) 0.7
Cheese (Germany) 5
Beer (Canada) 3
Beer (US) 14
Beer (Germany) 68
a- Adapted from Leoppkey and Michejda, 1994, Nitrosamines and related N-Nitroso
compounds chemistry and biochemistry.
1.2.3. Current Methods of Analysis of Nitrosamines
A number of different separation and detection techniques have been used for the analysis
of nitrosamines. GC and HPLC with different methods of detection are mainly considered
as traditional approaches. GC-MS with electron ionization (EI) has been accepted as the
most common technique for the determination of nitrosamines [48-49]. However, since
environmental samples are mostly aqueous, tedious work is required for sample
preparation (solid phase extraction or liquid-liquid extraction) prior to CG analysis.
Nitrosamines are highly polar compounds which also makes them unsuitable for GC
12
techniques. Conventional HPLC methods using UV-Vis detector are not sensitive enough
to detect trace amounts of nitrosamines in environmental samples. Fluorescence detectors
have high sensitivity but require fluorescent substances. For nitrosamines that are not
fluorescent, an additional step (fluorescent label derivatization) is needed [50-51]. Similar
to HPLC, not many reports on application of capillary electrophoresis (CE) for analysis of
nitrosamines have been published due to the low detection limit in conventional CE
methods. Despite these limitations, application of online preconcentration methods can
make CE a powerful technique for analysis of environmental samples.
1.3. Capillary Electrophoresis
1.3.1. History of Capillary Electrophoresis (CE)
Tiselius was the first (1930s) to show utility of electrophoresis for separation of proteins
in solutions [52-54]. Hjerten introduced the zone electrophoresis in a horizontal, rotating
polyethylene tube (0.5 cm ID) in a homogeneous medium for separation of pigmented
proteins [55]. Later, Jorgenson and Lukacs performed a zone electrophoresis in open-
tubular capillaries (75 μm ID and a length of 100 cm) in combination with high applied
potential voltage (30 kV) and a special fluorescence detector to detect the fluorescent
derivatives of amino acids, peptides, and urinary amines [56].
Capillary electrophoresis separates ions based on their electrophoretic mobility under the
influence of an applied electric field. The electrophoretic mobility is dependent upon the
13
charge of the molecule, the hydrodynamic volume, the viscosity of solution, and presence
of additional solvent(s). The rate of the ion movement is directly proportional to the
magnitude of the applied electric field. If two ions are the same size, the one with greater
charge will move the fastest. For ions of the same charge, the smaller volume experiences
less friction and has overall faster migration. The greatest advantages of CE are speed of
analysis, separation resolution, wide range of available detection methods, low reagent
consumption; and running cost [57]. In light of these factors, along with a performance
for separations in aqueous phase, CE is considered as an environmentally-friendly
technique. Employing a capillary for electrophoresis has solved some common problems
in traditional electrophoresis. For example, the narrow dimensions of the capillaries
greatly increased the surface to volume ratio, which minimizes heating associated with
high applied voltages (Joule heating). The increased efficiency and remarkable separating
capabilities of CE has led to a growth of interest in the scientific community to further
develop the technique.
1.3.2. Theory of CE
Since a major theme of this thesis involves CE, it is useful to consider some fundamentals
of CE theory. As stated previously, electrophoresis is the process in which sample ions
move under the influence of an applied potential (Figure 1-6). The induced electrical
force is proportional to the net charge and the electric field strength (E). It is also affected
14
by the friction due to viscosity of the solution and the velocity of the ion. This leads to the
expression for electrophoretic mobility, µEP:
1-1
where f for a spherical particle is given by Stokes’ law; η is the viscosity of the solvent;
and r is the radius of the ion. The rate at which these ions migrate is dictated by the
charge to hydrodynamic volume. The actual velocity, v, of the ions is directly
proportional to E, the magnitude of the electrical field and can be determined by the
following equation:
1-2
This relationship shows that a greater voltage will quicken the migration of the ionic
species.
The movement of the bulk solution or EOF results when high-voltage is applied to an
electrolyte solution inside a glass capillary with a charged inner wall. For fused silica
capillary EOF occurs when the BGE has pH>4 so that the SiOH functional groups are at
least partially ionized to become negatively charged as SiO- (Figure 1.5). For a
negatively charged capillary wall, a double layer develops comprised of a stationary inner
cationic layer (Stern layer) and a diffuse layer with an excess of cations which is free to
move along the capillary.

15
Figure 1-5. Schematic view of EOF and electrophoretic mobility of charged particles
The applied electric field causes the solvated cations in the diffuse layer to move toward
the cathode creating a powerful bulk flow. The rate of the electroosmotic flow is defined
by the following equation:
1-3
where ε is the dielectric constant of the solution; η is the viscosity of the solution; E is the
field strength; and ζ is the zeta potential. EOF is strongest with a large zeta potential
between the cationic layers. A large diffuse layer of cations, a consequence of lower ionic
strength, drags more solute molecules towards the cathode. In low resistance from the
surrounding solution, and buffer with pH of 9 so that all the SiOH groups are ionized to
SiO-, all work together to give a strong EOF (Figure 1.5).

16
Figure 1-6. Diagram of a typical CE presented with positive applied potential.
1.3.3. Micellar Electrokinetic Chromatography (MEKC)
Conventional CE or capillary zone electrophoresis (CZE) works well for separation of
charged compound but is incapable of separation of uncharged analytes. To overcome
this weakness, a technique based on combination of electrophoresis and chromatography
was developed by Terabe. This technique is called electrokinetic chromatography (EKC).
When surfactants at concentrations higher than critical micelle concentration (CMC) are
used, micelles form and act as a pseudostationary phase (CMC of each surfactant may
vary based on conditions such as temperature, ionic strength of solution, etc). This
technique is called micellar electrokinetic chromatography (MEKC). In MEKC, analytes
are distributed between an aqueous electrophoretic phase and a micellar phase (Figure
1.7). MEKC is different than chromatography because the micellar phase is dynamic and
mobile, thus it is described as the pseudostationary phase (PSP). The separation principles

17
of MEKC have been described by Terabe et al. [58]. Since its invention, MEKC has seen
significant advancement in sensitivity and separation efficiency. Enhancements in
sensitivities have been achieved using advanced detection systems (e.g. MS, LIF,
electrochemical detectors, etc.) and online enrichment techniques (stacking, sweeping,
etc.). Separation efficiencies have been improved using different surfactants, buffers, and
other additives to the BGE.
Figure 1-7. Mobility of micelles and neutral analytes in MEKC when anionic surfactants
are used.
The anionic surfactant, sodium dodecyl sulfate (SDS) is the most commonly used anionic
surfactant for MEKC; thus it is convenient to use it in an explanation of the principles of
MEKC. When SDS is dissolved in the BGE at concentrations higher than CMC, micelles
are formed and experience anodic electrophoretic mobility upon application of potential
across the capillary anionic micelles in the solution. EOF causes the bulk solution to flow
toward the cathode (against the mobility of anionic micelles). The apparent mobility of
the micelles is sum of EOF and electrophoretic mobility of the micelle. In general, the
magnitude of the EOF is much higher than the electrophoretic mobility of micelles and
opposite in direction thus the net movement of micelles is toward the detector (cathode).
18
The micelles are dynamic, which means that they are continuously breaking down and
reforming [59]. Analyte molecules will partition between the aqueous and micellar phase
and they will migrate with different mobilities depending upon their partition coefficient,
where the maximum velocity would be the same as the EOF and minimum would be that
of the micelles [60]. The apparent velocities fall between these two extremes. Molecules
that do not interact with micelles migrate with EOF, t0, while highly hydrophobic
compounds spend most of their time in the micellar phase and migrate close to the
migration time of micelles, tmc. For the other analytes, the partitioning process dictates the
migration time, tR. The capacity factor (k) can be calculated based on above mentioned
migration times as [61] :
1-4
Although the original goal of MEKC was to perform CE separation for uncharged or
weakly anionic compounds, the scope of the method was expanded to the analysis of
ionic species, including a large variety of low-molecular-weight ions [62]. Equation 1.4 is
generally used for neutral analytes but a similar expression can be deriven for charged
species. The capacity factor has been used to quantify the analyte-stationary phase
interactions in chromatography and electrokinetic chromatography [63-64]. To study the
solute-micelle interaction, the value of k can be calculated and any change in k can be
attributed to the change in solute-micelle behavior.

19
1.3.4. Solute Micelle Interaction
Since the first introduction of MEKC [60], SDS has been the most widely used surfactant.
However, several reports have demonstrated the important role of surfactant type in
MEKC [65-66]. The variation of selectivity and migration behavior with surfactant type
is evidence of the selective nature of solute interactions with micelles. The hydrophobic
interaction is the main driving force of solute retention by the micelles in MEKC, yet the
influence of different forces such as hydrogen-bonding and dipole-dipole interactions
have significant effects on migration behavior and selectivity. The mechanisms of the
effects of these selective forces on migration behavior are not fully known, though theory
has been developed to provide insight. Linear salvation energy relationship (LSER)
modeling has been used to describe and quantify the relationships between solutes
structure, and retention behavior in RP-HPLC [63], and similarly for migration behavior
in MEKC [64]. LSER models are built to describe the influence of solute-solvent
interactions in terms of nonspecific and specific interactive forces. In this model, the
solubility-related property (SP) is described by three main terms:
1-5
In the case of MEKC migration, SP would be logarithm of the capacity factor, log k, and
the three terms show the net effects of solute interactions with the two interactive phases
(bulk aqueous solution and micellar phase). A multi-parameter equation can then be
20
written with four system coefficients (m, s, b, a) and four solute descriptors (VI, π* , β, α)
as:
1-6
where, mVI/100 is the cavity term and thermodynamically unfavorable; is the dipolar
term, a measure of dipole-dipole and dipole-induced dipole interactions and
thermodynamically favorable; both the and are hydrogen bonding terms and
thermodynamically favorable. The cavity term represents the energy that is required to
overcome solvent-solvent interactions in order to provide a suitably sized cavity for the
solute. This term is a measure of nonspecific interactions. Intrinsic molar volume (Van
der Waals volume), , describes the solute effect, and coefficient m shows the solvent
contributions. The other two terms (dipolar and hydrogen bonding) are used to account
for specific interactions, where is the polarizability value of solutes, while s is the
equivalent term to describe the solvent involvement. The hydrogen-bonding terms
represent the interactions involving sharing of a proton, term for solutes accepting and
solvent(s) donating as well as for solutes donating and solvent(s) accepting. Therefore, b
is to account for the strength of solvent hydrogen bond donating acidity, is solute
hydrogen bond accepting basicity, a is solvent hydrogen bond accepting basicity, and is
solute hydrogen bond donating acidity. The SP0 term includes information about the
chromatographic systems such as phase ratio [67].

21
The chemical composition of the hydrophobic moieties and ionic head groups in
surfactants significantly influences their interactions with solutes as well as the migration
velocity of micelles. In other words, type of surfactant has a major impact on at least three
of the four factors that influence resolution in MEKC, i.e., capacity factor (k), selectivity
(α), and size of the elution window (tmc/tm). In many cases, efficiency is also affected.
Consequently, the characterization of different surfactants is of great interest for a better
understanding of the separation process in MEKC.
Nitrosamines are generally known as (R1R2)-N-N=O, where R1 and R2 are usually small
alkyl groups. Therefore, specific terms in LSER equation such as the hydrogen bond
accepting (HBA) term is as important as the nonspecific term. In case of selecting
surfactants for MEKC separation of nitrosamines, a hydrogen bond donating (HBD) head
group seems to be enhancing nitrosamine-micelle interaction.
1.3.5. Limitations of CE
Unlike HPLC, CE requires very small sample volume. This advantage is accompanied by
poor sensitivity due to the small light path length (25 to 100 μm ID) and low sample
volume (nL). Consequently, detection sensitivity is significantly compromised compared
to other separation techniques such as HPLC [68]. This hinders the applicability of CE for
the analysis of dilute analyte mixtures. Thus, development of more sensitive methods is
indispensable to improve the detection limit (i.e., increasing concentration sensitivity and

22
solving the problems associated with low concentration sensitivity has been the emphasis
in various reports). These investigations include the installation of capillaries equipped
with extended detection path length [69] (e.g. Z-shaped, multi-reflection, and bubble
cell), the use of highly sensitive detection methods (i.e., laser-induced fluorescence [70],
electrochemical detection [71]), and sample enrichment methods (i.e., liquid-/liquid [72]
and/or solid phase extraction [73]). However, all these methods require rather expensive
and somewhat complex hardware or time consuming procedures.
1.3.6. Detection Methods in CE and MEKC
MEKC, as other types of CE, suffers from low detection sensitivity in comparison with
HPLC [74]. Capillaries with longer optical path length (e.g. Z-shape and bubble cell),
detectors with high sensitivity [75], and offline enrichment methods such as liquid–liquid
extraction or SPE prior to injection are also still applied [76]. However, the most applied
approach for improving sensitivity in CE is online sample preconcentration technique, for
which CE offers some unique opportunities.
UV-Vis detection is the conventional and cost-effective detection technique in CE, is
available in any commercial CE systems and can be used to detect large number of UV or
visible light absorbing molecules. The main drawback is the relatively poor concentration
sensitivity, which has been mentioned already.

23
MS offers several advantages over UV-Vis detection [77], for example, for analytes with
weak UV absorption, MS offers higher sensitivity [78], and provides information about
the molecular weight and structure [79]. However, the potential interferences from salts in
the BGE and non-volatile surfactants in MEKC affect the MS signal intensity. Non-
volatile surfactants reaching the interface deteriorate ionization efficiency, particularly for
electrospray ionization (ESI) where is most widely applied in MEKC-MS [80]. Different
approaches have been employed to overcome MEKC-MS incompatibility, including
partial filling-MEKC-ESI-MS [81], BGEs containing volatile surfactants and buffers [82-
83], novel interfaces that are tolerant to non-volatile salts and surfactants [84],
atmospheric pressure chemical ionization source [85], atmospheric pressure
photoionization source [86-87].
Laser-induced fluorescence (LIF) is an important detection technique for MEKC, as it
provides higher sensitivity compared to other detection techniques in MEKC. It has even
been effectively applied for non-fluorescent molecules via fluorescence labeling, though
derivatization adds extra preparation time. Interference from excess labeling reagent, as
well as impurities and structural similarities of some related solutes after derivatization
can also complicate analysis [88]. The application of light-emitting diodes (LEDs) in
MEKC detection attracted attention [89-90]. LEDs can operate with a battery and give a
better output stability than LIF even over a wide spectrum range (420–950 nm). However,
the sensitivity of LED detector is lower than that of LIF detection due to photo flux from
the LED light and the nature of fluorescence detection itself.

24
1.4. Online Analyte Enrichment Techniques in CE
Online preconcentration refers to a process where an analyte electromigrates in such a
way that the length of its zone is decreased compared with that of the original sample
zone. As a result, concentration increases and also detection sensitivity improves [91].
There is little consensus in the literature regarding the naming of some approaches,
particularly those involving stacking. Furthermore, improvements or slight variation in
one approach often results in generating a new name which can lead to confusion. Some
attempt has been made here to consolidate these approaches based on the principles
underlying the preconcentration mechanism.
To have a better understanding of various online enrichment techniques, their similarities
and differences, a complete review of existing techniques in the literature is presented. A
brief description of each of the online preconcentration techniques, their names,
abbreviations and typical sensitivity enhancements are listed in Table 1.3. To improve the
detection sensitivity in CE, online sample concentration techniques, such as sample
stacking and sweeping have been examined individually or in combination [92] as well as
the most recently introduced micelle collapse preconcentration technique [93-94]. Among
the significant number of online preconcentration techniques, only a limited number of
them can be used for neutral compounds in MEKC (those use surfactants, e.g. sweeping).
Stacking and sweeping are the two well known preconcentration techniques for CE and
many reviews for these online concentration techniques and different applications can be

25
found in the literature [95-97]. Despite many successful reports on preconcentration of
neutral analytes in MEKC, only a small number of research works have been focused on
highly polar compounds neutral compounds.
In stacking when conductivities of sample zone is less than BGE, the electrophoretic
velocities of the ions in sample zone are higher than BGE. As a result velocities of ions
reduce when they stack when rich the boundary between two zone. Different stacking
modes have been defined for MEKC such as normal stacking mode (NSM) [98], reversed
electrode polarity stacking mode (REPSM) [99], stacking with reversed migration
micelles (SRMM) [100], stacking using reversed migration micelles and a water plug
[101], field-enhanced sample injection [102], and field-enhanced sample injection with
reverse migration micelles [103]. Stacking continues to be an important preconcentration
technique for MEKC in many applications and was reviewed by Kim and Terabe [68].
Sweeping was first introduced by Terabe [99] and has been effectively used for
hydrophobic analytes that interact strongly with the PSP [100]. In sweeping BGE consist
of high concentration of surfactant while sample zone is micelle free. Under applied
electric field micelles pass though sample zone and sweep the analytes. Remarkable
improvements in detection sensitivity up to several thousand fold have been achieved by
sweeping [95, 102].

26
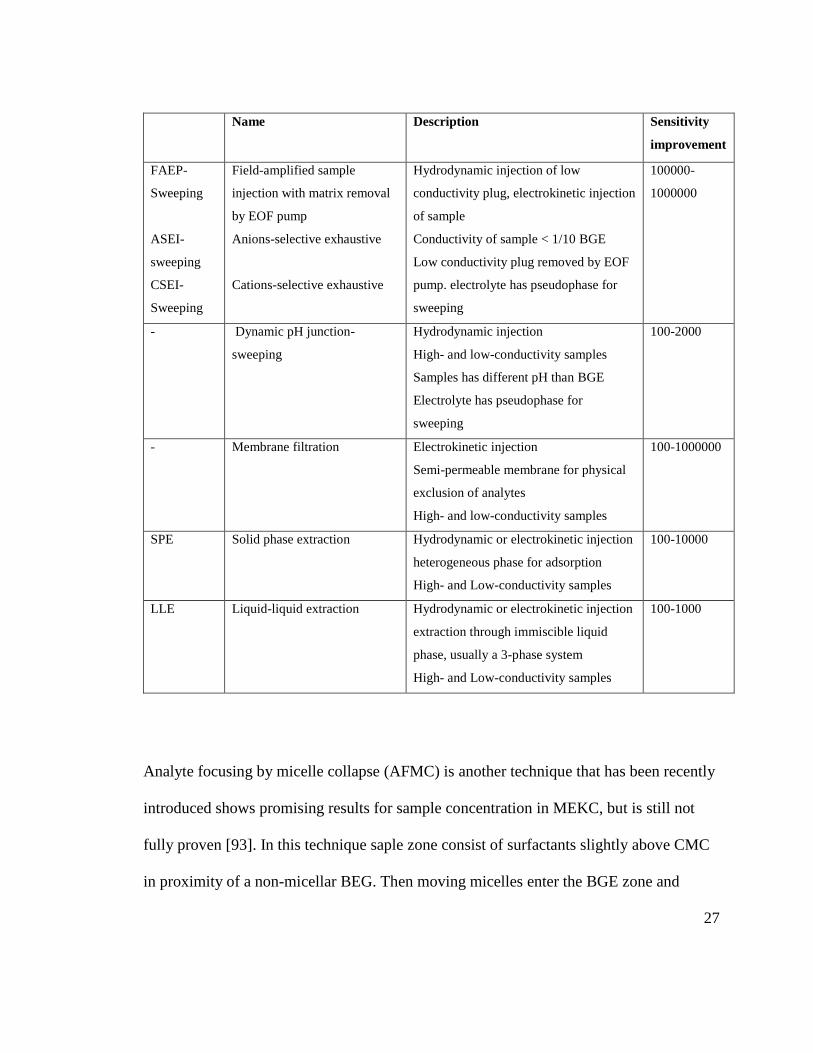
Table 1.3. Summary of various online and offline preconcentration techniques in capillary
electrophoresis [50]
Name Description Sensitivity
improvement
FASS
Field-amplified sample
stacking
Hydrodynamic injection<5% capillary
volume Conductivity of sample < 1/10
BGE
10- 20
FASI Field-amplified sample
injection
Electrokinetic injection <5% capillary
volume
Conductivity of sample < 1/10 BGE
100-1000
LVSS
LVSEP
Large volume sample stacking
Large volume stacking with
matrix removal with EOF
Hydrodynamic injection up to 100%
Conductivity of sample < 1/10 BGE
Matrix removal by polarity switching
100-500
FAEP
FESI
Field-amplified Sample
injection with matrix removal
Field-enhanced injection
Hydrodynamic injection of low-
conductivity plug, electrokinetic injection
Conductivity of sample < 1/10 BGE
1000-10000
SEI Selective exhaustive injection,
pH mediated FASS,
Base mediated stacking
Sample matrix removed by EOF pump
Electrokinetic injection of sample
High-conductivity sample
10-100
t-ITP
EKS
Transient ITP
Electrokinetic supercharging
Hydrodynamic injection<50%
Leading and terminating electrolytes
100-500000
- Counter-current electro-
capture (Electro-capture, or
Electrophoretic focusing)
Hydrodynamic injection with
counterbalancing electrophoretic velocity
Hi and low-conductivity samples
100-20000
MRB Moving reaction boundary
(Dynamic pH junction)
High- and low-conductivity samples
Sample has different pH than BGE
10-500
Sweeping Sweeping Hydrodynamic injection <50%
High- and low-conductivity samples
Sample has no pseudophase
100-5000
27
Name Description Sensitivity
improvement
FAEP-
Sweeping
ASEI-
sweeping
CSEI-
Sweeping
Field-amplified sample
injection with matrix removal
by EOF pump
Anions-selective exhaustive
Cations-selective exhaustive
Hydrodynamic injection of low
conductivity plug, electrokinetic injection
of sample
Conductivity of sample < 1/10 BGE
Low conductivity plug removed by EOF
pump. electrolyte has pseudophase for
sweeping
100000-
1000000
- Dynamic pH junction-
sweeping
Hydrodynamic injection
High- and low-conductivity samples
Samples has different pH than BGE
Electrolyte has pseudophase for
sweeping
100-2000
- Membrane filtration Electrokinetic injection
Semi-permeable membrane for physical
exclusion of analytes
High- and low-conductivity samples
100-1000000
SPE Solid phase extraction Hydrodynamic or electrokinetic injection
heterogeneous phase for adsorption
High- and Low-conductivity samples
100-10000
LLE Liquid-liquid extraction
Hydrodynamic or electrokinetic injection
extraction through immiscible liquid
phase, usually a 3-phase system
High- and Low-conductivity samples
100-1000
Analyte focusing by micelle collapse (AFMC) is another technique that has been recently
introduced shows promising results for sample concentration in MEKC, but is still not
fully proven [93]. In this technique saple zone consist of surfactants slightly above CMC
in proximity of a non-micellar BEG. Then moving micelles enter the BGE zone and

28
concentration of surfactant drops below CMC Therfore analytes relesen and since they
have no electrophoretic mobility they accumulate in this boundary. Dawood et al.
compared and reported the efficiencies of sweeping, AFMC, and simultaneous field
amplified sample stacking (FASS) and sweeping. When compared with a hydrodynamic
injection (5 s at 50 mbar, 0.51% of capillary volume to detection window) of drug
mixture prepared in the separation BGE, improvements of detection sensitivity of 60-, 83-
, and 80-fold were obtained with sweeping, AFMC and simultaneous FASS and
sweeping, respectively [104].
Online preconcentration of neutral analytes in MEKC techniques have been reported
widely but only for analytes with high affinity for PSP using anionic [68] and cationic
surfactants [105].
1.4.1. Stacking in CE
The purpose of stacking is to reduce the distribution of analytes within the sample zone
and its vicinity before separation is initiated. If the sample matrix does not affect
distribution of the analytes in the sample zone prior to separation, the analyte distribution
will be equal to the injected plug length, and this length will become the minimum peak
width at detection. There are many techniques available that share the principle of

29
stacking. A brief discussion about mechanism of each method is presented in following
paragraphs.
1.4.1.1. FASS
Chien and Burgi first introduced the field-amplified sample stacking (FASS) of charged
analytes for capillary zone electrophoresis (CZE) [106]. The FASS method is considered
to be the simplest technique for online sample pre-concentration. In this mode, charged
analytes are injected into the capillary in a low-conductivity matrix. After application of
separation voltage, the charged analytes experience enhanced velocity in the lower
conductivity (amplified field) sample zone and are stacked at the sample zone/BGE
interface. The electrophoretic velocity, vep, of analyte in free solution is described as:
1-7
where E is electric strength; L is capillary length; V is applied voltage; and μep is
electrophoretic mobility. It has been assumed the field strength through the capillary is
uniform. As mentioned, the sample and BGE zones in FASS have different
conductivities, the ratio of the electrophoretic velocities of the ions, ϒ, between the two
zones is given:
1-8

30
Where ρ is the resistivity of zone 1 and zone 2. Stacking is roughly proportional to the
ratio of ionic strength between the sample matrix and separation buffer [106].
If sample solution is prepared in high resistivity solution (or low ionic concentration) and
BGE is a low-resistivity solution (or high ionic concentration), the analyte in sample
solution will be concentrated at the boundary of two zones
1-9
In practice, sample is dissolved in diluted of BGE, resulting in a low-conductivity
solution. In the initial step, the capillary is conditioned and filled with a high-conductivity
BGE and an appropriate length of the sample solution is then injected into the capillary.
Then a high positive voltage is applied, a proportionally greater electric field develops
across the sample zone causing the ions to migrate faster (Figure 1-8). Once the ionic
analytes reach the boundaries between the sample zone and the BGE, the electric field
strength suddenly decreases and migration becomes slower, causing the sample analytes
to be focused near the boundaries. Since the mobility of EOF is greater than those of the
charged analytes, all analytes will finally move toward the detection window (the cations
migrate faster than the anions). The analytes are separated by the CZE mode. In this
method, the sample injection volume must be optimized because separation does not
begin until after focusing and there must be enough length of capillary left for separation,
otherwise analytes reach the detector unresolved.

31
Figure 1-8. Schematic diagrams of the FASS technique. (a) The capillary is conditioned
with a BGE (a high conductivity buffer), the sample, prepared in a low-conductivity
matrix, is then injected to a certain length, and a high positive voltage is applied; (b)
focusing of the analytes occurs near the boundaries between the sample zone and the
BGE because of its mobility changes; (c) stacked ionic analytes only migrate and are
separated by the CZE mode.

32
The optimal conditions for sample stacking is to prepare the sample in a buffer that
concentration is at least 10 times less than BGE and a sample plug length up to 10 times
the diffusion-limited peak width [107]. This technique has not been used for the neutral
compounds because it relies on mobility of charged compounds. Since neutral analytes
gain their electrophoretic mobility by forming complex with micelles, their velocities are
always less than the micelles. Therefore, even at the optimum condition it is expected that
the enrichment factor will be only a fraction of that is usually seen for charged
compounds (less than one order of magnitude).
1.4.1.2. Large Volume Sample Stacking (LVSS)
As it was explained before, injection of large volume of sample may result poor
separation due to lack of required capillary length for separation. Chien and Burgi
introduced a method in which larger volumes of sample could be injected into the
capillary without adverse effect on separation efficiency. In their proposed method, the
analytes would remain stacked while the sample matrix was removed.
This is essentially large-volume FASS with matrix removal, which is known within the
literature as large-volume sample stacking (LVSS) [108]. LVSS and FASS are different
in arrangement of voltage application and polarity. For example, in LVSS of anionic
analytes, the electrode polarity is negative at the beginning to acquire a reversed EOF
(Figure 1.9). The sample can be dissolved either in a low-conductivity buffer or water.
When the capillary is filled with a high-conductivity BGE, a large amount of the sample

33
solution is then injected into the capillary and a negative polarity is applied. The anionic
analytes move toward the detection end (outlet) and stack at one side of the boundary
between the sample zone and the BGE while the direction of the EOF is toward the inlet.
Only anions concentrated and the rest are lost, thus it is critical that the polarity of the
system is reversed before the stacked anionic analyte zone exits the inlet of the capillary.
The level of electrophoretic current is an indication of end of focusing process. In fact,
the current should be monitored carefully until it reaches approximately 95–99% of its
original value (current when capillary is filled just with BGE).
At this point the polarity is switched to positive to redirect the EOF toward the detector.
There is always risk of losing analytes and poor reproducibility if the current is not well-
monitored. Separation occurs by CZE. Compared to FASS, this method can provide a
much larger sample injection without any significant loss in separation efficiency.
Later, Burgi [109] introduced a method in which polarity switching was not necessary. In
this approach the direction of the EOF changes during the stacking and matrix removal
process using an EOF reversal agent. The BGE containing an EOF reversal agent enters
the capillary from the detection end of the capillary up to the point where the EOF in
BGE is greater than the sample matrix. This is simpler than the polarity switching
approach, because monitoring of the current is not necessary and no analytes are lost from
the inlet. By using the same concept of manipulating EOF in the sample matrix and BGE,

34
Figure 1-9. Schematic diagrams of the LVSS technique for anionic analytes.(a) The
capillary is conditioned with a BGE (a high-conductivity buffer), the sample, prepared in
a low-conductivity matrix, is then injected to a certain length, and then a high negative
voltage is applied (EOF is toward the inlet); (b) the anionic analytes move toward the
detection end (outlet) and stack at one side of the boundary, whereas the cations and

35
neutral species move and exit the capillary at the injection end (inlet); (c) the
electrophoretic current is carefully monitored until it reaches approximately 95–99% of
its original value, and the polarity is then quickly returned to positive (EOF is reversed);
(d) the following separation occurs by CZE mode.
He and Lee [110] used a low pH separation electrolyte in combination with a high-pH
sample zone to control matrix removal, Baryla and Lucy [111] used a zwitterionic
surfactant, Macia et al. [112] used a high concentration of methanol (70%) to suppress the
EOF, and Han et al. [113] used the phenomenon of pH hysteresis to control the EOF.
1.4.1.3. pH-mediated Stacking
As described above, in FASS and LVSS methods the sample is prepared in low
conductivity matrix, however; this is not always possible because some samples, such as
sea water, urine or blood analytes, which contain salts, are usually highly conductive
which limiting the application of above techniques. A pH-mediated stacking method has
been developed for the samples in a high-ionic strength medium. In this method sample is
injected into the capillary using electrokinetic injection (Figure 1.10) followed by a plug
of strong acid, then a positive separation potential is applied. The strong acid neutralizes
the sample solution to create a high-resistance zone (less ionic). As a result, a greater field
will develop across the neutral zone, causing the ions to migrate faster. The analytes
(positive charge ions) then are stacked at the boundary between the titrated zone and the
BGE, and separation is by CZE[114].

36
Figure 1-10. Schematic diagrams of a pH-mediated stacking technique. (a) The capillary
is conditioned with a high conductivity BGE, the cationic analytes dissolved in a low-
conductivity buffer and a plug of strong acid are injected into the capillary. (b) a positive
separation potential is applied; (c) the strong acid titrates the sample solution to create a
neutral zone causing the ions to migrate faster and become stacked; (d) the subsequent
separation occurs by the CZE mode.
37
1.4.2. Stacking in MEKC
Stacking techniques have also applied to MEKC and are categorized into two modes,
normal stacking method (NSM) and reversed electrode polarity stacking mode (REPSM).
In first method, injection and separation are carried out in same polarity, while the second
method requires switching of the polarity [115].
1.4.2.1. Normal-stacking in MEKC
The stacking techniques described above are performed based on the CZE mode.
Stacking in the MEKC mode is also possible when micelles are employed. Figure 1.11
shows schematic diagrams of the normal stacking-MEKC separation when SDS is used as
surfactant. The sample is dissolved in a low-conductivity buffer or water; the BGE
contains SDS (at concentration above the CMC) to form the micelles. After the BGE and
sample solutions are injected in sequence, a positive voltage is applied. The SDS micelles
enter the sample zone from the detector-side boundary, interact with analytes and the
micelle-analyte complex undergoes stacking in the sample zone. Since the mobility of
EOF is greater than that of the SDS micelles, the sample zone moves toward the detector.
Following this, the SDS-analytes are separated by MEKC. Based on this principle, a
cationic surfactant can also be used but the electrode polarity must be switched.

38
Figure 1-11. Schematic diagrams of a normal-stacking MEKC technique. (a) The sample
is dissolved in a low-conductivity buffer. BGE consisting of SDS to form the micelles,
after the background and sample solution are injected, respectively, a positive voltage is
applied; (b) the SDS micelles from the detector-side enter the sample zone and then
permit the analytes to migrate and become stacked; (c) then the SDS-analytes are
separated by the MEKC mode. (d) separation is based on interaction of charged and
uncharged analytes with micelles.

39
These methods can be used to separate either charged or neutral analyte molecules, and
several different modes have been proposed MEKC mode when SDS micelles are used.
Terabe et al. [116] published a comprehensive review of the conditions for various
stacking modes.
1.4.2.2. Reversed-stacking MEKC
The schematic diagrams for reversed-stacking MEKC, also called reversed electrode
polarity stacking mode (REPSM), are shown in Figure 1.12. The sample is dissolved in a
low-conductivity buffer, whereas a high-conductivity micellar buffer (such as SDS) is
used as BGE. When a negative polarity is applied, the EOF moves toward the inlet; the
anionic analytes move toward the outlet and stack at one side of the boundary, whereas
the cations and neutral species move and exit the capillary at the injection end (inlet).
When electrophoretic current reaches approximately 95–99% of its normal value, the
polarity is quickly returned to positive, leading to the reversal of EOF. The micelles from
the BGE will carry and stack the analytes at the stacking boundary and the analytes are
separated by MEKC. Instead switching the electrode polarity, an acidic BGE can be used
to reduce the EOF [103]. Thus, this method, the so-called stacking with reverse migrating
micelles (SRMM), needs only negative polarity needed. As a result, a better
reproducibility can be achieved, since a polarity-switching step is no longer necessary.

40
Figure 1-12 Schematic diagrams of a reversed-stacking MEKC technique. (a) The sample
and BGE are prepared as described in Figure 1.11(A) but a negative polarity is applied;
(b) the EOF moves toward the inlet, the anionic analytes move toward the outlet and stack
at one side of the boundary; (c) the electrophoretic current reaches approximately 95–
99% of its original value, the polarity is quickly returned to positive, reversing the EOF;
(d) then the SDS-analytes are separated by the MEKC mode.

41
A series of reversed-stacking modes have been reported by Terabe et al., including
stacking using reversed-migrating micelles and a water plug (SRW) [101], field-enhanced
sample injection (FESI) [102], and field-enhanced sample injection with reverse
migrating micelles (FESI-RMM) [103]. Each of these methods has unique advantages and
disadvantages with respect to sensitivity, precision, and simplicity of use.
1.4.3. Sweeping in MEKC
Sweeping is a simple and convenient on-line sample concentration method for either
charged or neutral analytes. The efficiency of the sample enrichment relies on how the
pseudostationary phase (PSP) interacts with the analytes when PSP enters the sample
solution zone. In this method, sample matrix is free of surfactant while the BGE consists
of relatively large amount of surfactant. A fused silica capillaries is normally filled with a
low-pH BGE (usually <2) to suppress the EOF. A sample plug is injected and then a
negative polarity is applied. As a result, anionic SDS micelles enter the capillary at the
inlet and migrate toward the detector and sweep the analytes. Once the analytes are
completely swept by micelles, the separation starts by MEKC (see Figure 1.13). In
sweeping, the length of the resulting zone after sweeping (lsweep) is given by [117]:
1-10

42
where linj is the length of the injected sample zone and k is the retention factor of the
analyte for the given PSP. The k value is assumed to be the same in the sample and the
separation zone.
Concentration enhancement factors of 2 to 3 orders of magnitude have been reported for
sweeping. In this method enhancement is highly depend on k value, therefore it works
better only if the analytes have a large k value. This thesis will present possible ways to
improve the k value.

43
Figure 1-13. Schematic of a reversed-sweeping MEKC technique. The BGE consists of
an anionic surfactant (for example, SDS) and a low-pH buffer solution, but the samples
are dissolved in a micellar free buffer; (a) Capillary is conditioned and filled with the
BGE and then sample solution is injected, (b) a negative polarity is applied to power the
CE separation; (c) anionic SDS micelles are sweeping the analytes; the subsequent
separation occurs by MEKC

44
1.4.3.1. Cation-selective exhaustive injection seeping (CSEI-sweeping)
The CSEI-sweeping-MEKC technique was first reported by Terabe et al. [118]. This
method provides for a more sensitive detection than sweeping for positively chargeable
analytes (an increase in the detection limit of more than 105-fold or more have been
reported). First, the capillary is conditioned with a non-micellar BGE, followed by the
injection of a high-conductivity buffer zone free of organic solvent, and finally the
injection of a short plug of water (Figure 1-14). The cationic analytes are prepared in a
low-conductivity matrix or water. Electrokinetic injection (a positive polarity) is used to
introduce sample into the capillary. The cationic analytes enter the capillary through the
water plug at high velocities, and are then focused (or stacked) at the interface between
the water zone and the high-conductivity buffer. The continuous electrokinetic injection
provides a high efficient sample concentration. Once an optimized injection time is
reached, the injection is then stopped and the micellar BGEs are replaced at both ends of
the capillary and the separation voltage is applied with a negative polarity. Therefore,
micelles enter from the cathodic vial into the capillary to sweep the stacked analytes.
Finally, the separation can be performed using MEKC in the reversed-migration mode.

45
Figure 1-14- Schematic diagrams of CSEI-sweeping-MEKC technique. (a) The capillary
is conditioned and filled with a non-micellar BGE, and then a high-conductivity buffer
and a short plug of water are injected; (b) the a low-conductivity cationic analytes is
electrokinetically injected. (c) Micellar BGEs are placed at both ends and the negative
polarity voltage is applied; (d) the micelles enter the capillary to sweep the stacked
analytes into narrow bands; (e) the following separation is achieved by the reversed
MEKC mode.

46
1.4.3.2. Anion-selective exhaustive injection sweeping (ASEI-
sweeping)
The principle of ASEI-sweeping-MEKC differs from CSEI-sweeping-MEKC in terms of
the type of surfactant; a cationic surfactant is used instead of anionic one. Also, a
polyacrylamide-coated (PAA) capillary is used to suppress the EOF. About 1000- to
6000-fold increases in detection sensitivity were obtained in terms of peak heights by
ASEI-sweep–MEKC [119]. Figure 1-15 shows the steps of this technique. Application of
cationic surfactant in PAA capillary is adapted from this method to be able to use cationic
surfactants under suppressed EOF. In this method, a PAA-coated (low/zero EOF)
capillary is conditioned with a non-micellar BGE, and then a plug of high conductivity
buffer solution and a short water plug are injected. Sample is dissolved in water of a low-
conductivity buffer solution and introduced by electrokinetic injection method under the
negative polarity. Anionic analytes enter the capillary and pass the water plug and
focused at the interface between the water and HCB zones. After completion of injection,
BGEs containing cationic surfactant are placed at both ends of the capillary and then the
voltage at the positive polarity is applied. Cationic micelles move toward the detector and
sweep the analytes then MEKC separation is performed

47
Figure 1-15. Schematic diagram of the ASEI-sweep-MEKC method: (a) PAA-coated
(low/zero EOF) capillary is conditioned with a non-micellar BGE, then a high
conductivity (HCB) buffer free of micelles is injected, followed by the injection of a short
water plug. (b) Electrokinetic injection with negative polarity (c) Anionic analytes focus
at the interface between the water and HCB zones. (d) Micellar BGEs are placed at both
ends of the capillary followed by the application of voltage with positive polarity. (e)
Separation by MEKC.

48
1.4.3.3. Dynamic pH junction
The main target analytes of this method are weak acidic or zwitterionic analytes by
altering the mobility of the analytes at the interface of two solutions with different pH
[120]. Figure 1.16 shows schematic diagrams of the dynamic pH junction method. The
BGE consists of a high pH buffer solution, while the sample is dissolved in low pH (pH<
pKa of analyte). First, the capillary is filled with the high pH BGE (borate buffer)
followed by injection of the sample solution (lower pH). At the interface of the two
solutions a pH junction forms. The analytes (weak acids) are neutral in acidic solution,
while they are ionized (negatively charged) in alkaline solution. When a high positive
voltage is applied, the non-uniform electrolyte zones form and and ions
from BGE, which move toward the sample zone and generate a reversed EOF. The
analytes are focused at the pH junction. Subsequently, the analytes are separated by the
CZE after focusing. The focusing effect is dependent on the pH, the concentrations (both
of the BGE and the sample matrix), and pKa values of zwitterionic analytes.

49
Figure 1-16. Schematic diagrams of a dynamic pH junction technique. (a) The capillary is
filled with a high pH-BGE and a section of sample solution (prepared in a lower-pH
buffer); (b) a high positive voltage is applied, resulting in a discontinuous electrolyte
zone; (c) the anionic analytes are focused on the boundary of the pH junction; (d)
separation of the analytes occurs by the CZE.
50
1.4.3.4. Dynamic pH junction and Dynamic pH junction sweeping
The dynamic pH junction- sweeping technique is very similar to the dynamic pH junction
technique (The main target analytes of this method are weak acidic or zwitterionic
analytes) except a surfactant is incorporated into the BGE. The sample is prepared in a
non-micellar buffer solution and injected into the capillary filled with micellar BGE. A
positive polarity for anionic surfactants or negative polarity for cationic surfactants are
used. The ions and anionic SDS micelles enter the capillary and sweep the sample
zone. The neutral analytes (weak acids) are converted to anions and are swept by the SDS
micelles followed by MEKC separation (Figure 1.17). Since the mobility of the EOF is
greater than that of the SDS micelles, MEKC separation proceeds after focusing. These
methods are potentially effective for conventional sweeping (using anionic micelles) and
the dynamic pH junction for hydrophilic and neutral analytes [121].

51
Figure 1-17. Schematic diagrams of the dynamic pH junction- sweeping technique. (a)
The micellar (such as SDS) BGE and the sample solution (a non-micellar buffer) are
injected into the capillary, respectively; (b) when the injection is complete, a positive
polarity is applied (if a negatively charged SDS surfactant is used) to power the CE
separation; (c) the neutral analytes are converted to anions and are swept by the SDS
micelles; (d) separation occurs by MEKC.

52
1.4.4. Analyte Focusing by Micelle Collapse
In addition to above mentioned on-line sample concentration strategies, other on-capillary
approaches has also been reported [122]. Micelle collapse focusing is based on the
transport by micelles followed by release and accumulation of analytes. The sample
molecules are carried first by micelles under an applied electric field in a micellar
electrolyte solution containing an anionic surfactant along with an additional anion with a
high electrophoretic mobility (small anion such as Cl-). In this technique the capillary is
filled by non-micellar BGE, and the sample is diluted in a micellar BGE. Micelles carry
the analyte(s) into the capillary. The surfactant micelles are continuously diluted and at
the boundary between micellar and non-micellar BEGs. When concentration of surfactant
is below the CMC, micelles start to collapse. Therefore, as it shown in Figure 1.18
analytes are released and accumulate at the boundary and then a micellar BGE with high
concentration of surfactant in placed at the inlet to introduce high concentration of
surfactant and increase the concentration of surfactants above the CMC and separation
begins. An enrichment of over two orders of magnitude has been reported in detection
sensitivity for steroidal compounds using SDS [121].
The influence of the parameters affecting the performance of this approach has been
evaluated by Quirino [123]. To maximize the volume of injected samples without
compromising the enhancement factors, the concentration of surfactant micelle in the
sample must be kept low and only slightly above the CMC, and the conductivity ratio

53
(BGE/sample) must be kept low. This method was employed in PF-MEKC (partially
filling) with UV and ESI-MS detection. The results suggest that this strategy could
provide better enhancement factors than sweeping for some less hydrophobic analytes
[93, 124].
Figure 1-18. Analyte focusing by micelle collapse method.[122]
While current electrophoretic separation methods can provide high resolution separation
for some analytes, the whole analytical process may be jeopardized if an inappropriate
method is chosen for sample preparation prior to CE analysis. It is widely accepted that in
case of complex matrices, sample preparation may be needed prior to CE or
chromatography. The aim of the sample treatment is to enhance the analytical signal in
order to improve the typically poor limits of detection (LODs) of CE-UV/Vis methods or
to minimize potential interferences from the sample matrix.

54
1.5. Offline Sample Enrichment
The health risks of environmental contaminants have raised public awareness and led to
intensive environmental research to monitor toxic contaminants in air, water, and soil.
Highly selective and sensitive instruments for quantification still require the sample
preparation step when the simple approach of “dilute and shoot” is not applicable for
trace quantitation in environmental samples. Although improvements of detection limits
may be accomplished by both detector improvement and in-capillary analyte focusing,
analyte enrichment during a sample preparation step normally is the most practical
concept to overcome the sensitivity problems of CE. Traditional sample-preparation
techniques are frequently used, even today. Conventional solvent extraction methods
often consume large amounts of solvents and creating more environmental and
occupational hazards. The volume reduction step used in most extraction procedures can
result in release of the solvents into the atmosphere. Chemists have responded by
increasing research on sorbent traps, solid-phase extraction (SPE), supercritical CO2 fluid
extraction (SFE), pressurized fluid extraction (PFE), and microwave-assisted extraction.
Micro-extraction techniques have earned their place in modern analytical laboratories,
and solid-phase micro-extraction (SPME) was the first of these [125]. Since then, several
other modern versions of solvent micro-extraction, including single solvent drop
approaches and other related techniques [124]. The two most popular are single-drop
micro-extraction (SDME) [126] and hollow-fibre liquid-phase micro-extraction (HF-
LPME) [127]. The invention and the development of dispersive liquid-liquid micro-

55
extraction (DLLME) in 2006 is one of the latest examples [128-129]. Combination of
offline sample enrichment techniques with CE, including solid phase extraction (SPE),
SPME, micro-dialysis, liquid- liquid extraction [130] and recently single drop micro-
extraction [131-132]have been reported.
Other areas of analytical science have been influenced by these developments in
extraction technologies. For example, development of polydimethylsiloxane (PDMS)-
coated SPME fibres led to the development of PDMS-based sensors [133].
Miniaturization of the extraction process (i.e. micro-SPE) is also attractive for use in on-
site analytical measurements [134].
Understanding the fundamental principles of extraction is very important in the
development of new and novel approaches in sample preparation. However, analytical
researchers must also pay close attention in new technologies developed by engineers to
find new and unique opportunities and applications [135-136]. For example, recent
advancements in micro-machining and micro-fabrication are expected to have a profound
impact on future analytical devices. The incorporation of sample preparation into
miniaturized devices can result in simple elegant and efficient sample preparation and
analysis systems. In next section, the theory common to the different extraction
techniques will be presented, and future research opportunities in integration and
miniaturization trends will be discussed.

56
1.5.1. Classification of Extraction Techniques
There is a fundamental similarity among the extraction techniques used in the sample
preparation process. In all techniques, the extraction phase is in contact with the sample
matrix and analytes are transported between the phases. There are three major extraction
regimes namely, flow through, batch, and steady state (Figure 1.19). Each category has
exhaustive and non-exhaustive methods. In principle, exhaustive extraction approaches
do not require calibration, because analytes are transferred quantitatively (i.e. high
recovery efficiencies) to the extraction phase by employing large volumes of receiving
phase or phase with a phase with a high affinity for the analyte. In practice, however, to
confirm the recovery, surrogate standards are usually used. In general, some exhaustive
batch extraction methods such as liquid-liquid extraction (LLE) consume more solvent
than any other methods, therefore to save solvent and time, they are frequently replaced
by flow-through techniques such as sorbent trap techniques, e.g. SPE. Large volumes of
sample can be passed through a small cartridge to increase the efficiency of mass transfer.
Only a small volume of solvent is required to elute analytes from sorbent. As a result
enrichment of analytes is achieved by using less solvent [137]. Similarly, solid samples
can be packed in the bed and the extraction phase (liquid or gas) can be used to convey
the analytes to the collection phase. In dynamic solvent extractions such as Soxhlet
apparatus, the fresh solvent continuously elutes the analytes from the solid matrix at the
boiling point of the solvent. Recently, smaller solvent volumes at higher temperatures and
high pressures have been used. In these conditions, the solvent capacity and elution

57
strength is increased therefore greater enrichment at the same time of extraction can be
achieved [138]. In SFE, compressed inert gas is used to extract the analytes from the
sample matrix function in purge-and-trap modes.
Figure 1-19. Extraction method classification [139]
Non-exhaustive methods mainly work based on the principles of equilibrium, pre-
equilibrium, and permeation [140]. The equilibrium non-exhaustive techniques are
similar to equilibrium-exhaustive techniques in principle, but due to the use of a small
volume of the extracting phase relative to the sample volume, the capacity of the
extraction phase is smaller. For example, in solvent micro-extraction and SPME
techniques [141-142] the capacity of the extraction phase is usually insufficient to remove
most of the analytes from the sample matrix.
Extraction Techniques
Flow Through Equilibrium
Exhaustive
Purge and Trap
Sorbent Trap
SPE,SFE,PFE
non-Exhaustive In Tube SPME
Batch Equilibrium
Exhaustive LLE, Soxhlet
Sorbents, MAE
non-Exhaustive Head Space
LLME, SPME
Steady State Exhaustive and non-
Exhaustive Membrane

58
1.5.2. Micro-extraction
Classical sample pre-treatment techniques (e.g., liquid-liquid extraction (LLE) and solid-
phase extraction (SPE)) are time consuming, labor intensive, and use substantial amounts
of hazardous organic solvents. Nevertheless liquid–liquid extraction (LLE), based on
transfer of analyte between two immiscible solvents, is widely employed for sample
preparation. The main disadvantage of LLE in ultra-trace analysis is the necessity of
using large volume of very clean solvents and the inevitable subsequent solvent
evaporation step needed to obtain significant preconcentration. Thus, this technique is
both expensive and environmentally unfriendly. Miniaturization of this extraction
technique can be achieved by a drastic reduction of the extracting phase volume. Based
on this premise, several micro-extraction techniques have been developed, the most
popular are single-drop micro-extraction (SDME) [126-127, 143], hollow-fibre liquid-
phase micro-extraction (HF-LPME) [127], dispersive liquid-liquid micro-extraction
(DLLME) [128-129], solid-phase micro-extraction (SPME) and liquid-phase micro-
extraction (LPME). New LPME techniques based on SDME have been introduced in
combination with GC, HPLC, and CE analysis. The high enrichment factor, low running
cost, simple operation set-up, and trace-solvent consumption are part of LPME
advantages. All this has been done with a single micro-syringe of several μL volume,
which serves as both solvent holder and sample injector to perform the extraction
procedure and extract injection [143-144]. Headspace liquid-phase micro-extraction (HS-
LPME) [145], micro-dialysis (MD), supported liquid membranes (SLMs) were developed
59
to extend the scope of the applications in GC, HPLC, and CE analysis [146].
Nevertheless, all these extraction techniques have advantages and disadvantages. One of
the objectives of the work presented in this thesis is to introduce a new micro-extraction
technique for highly polar neutral compounds for application in modern analytical
instruments such as GC, HPLC, and CE.
1.5.2.1. Liquid Phase Micro-extraction (LPME)
Analytes extracted by LLE are dissolved in a water-immiscible organic phase which is of
poor compatibility with analysis using reversed phase chromatography, CE, ESI-MS, etc.
In CE, the use of aqueous electrophoretic buffers requires evaporating the most common
solvent from LLE and subsequently re-dissolving the analyte in an appropriate aqueous or
a miscible non-aqueous medium. One important goal in developing new sample
preparation techniques is to automate the entire analytical process. For analytical
extractions in miniaturization of conventional liquid–liquid extraction several systems
such as liquid droplets at the tip of a capillary [147-150], supported liquid films/droplets
[151] and continuous forming and falling drop systems [152-153], have been reported.
1.5.2.2. Single Drop Micro-extraction (SDME)
SDME is a simple, low-cost, fast and virtually solvent-free sample preparation technique
based on a great reduction of the extracting phase volume. SDME is not exhaustive, and
only a small fraction of analyte(s) is extracted and pre-concentrated for analysis. From the

60
first publication in 1997 [143], SDME has been used as an extraction technique for
numerous analytes, mostly organic compounds.
In SDME, a micro-drop of water-immiscible extracting phase suspended from the tip of a
micro-syringe needle to a stirred aqueous sample. The drop is retracted back into the
micro-syringe needle when extraction is done and finally injected into an analytical
instrument or a detector to obtain the corresponding analytical signal. Since two liquid
phases are in direct contact when one of the phases is mechanically stirred, the other will
also experience convective mixing. In fact, the momentum transfers from first phase to
the second phase as a result of frictional drag at the LL interface. Mass transfer of the
analytes between two phases continues until thermodynamic equilibrium is attained or
extraction is stopped. Jeannot and Cantwell introduced a theoretical model based on film
theory of convective-diffusive mass transfer for SDME [143]. In the film theory,
convective mixing exists in the bulk solution to some distance away from the liquid–
liquid interface. There are some limitations for SDME; for example, extracting phase
must be water-immiscible and analytes more soluble in the extracting phase than in the
sample donor solution [154]. The instability of the drop at high stirring rates or
temperatures, especially when samples are not perfectly clean is the main drawbacks of
this technique. The presence of large amounts of non-polar species can saturate the
organic phase.

61
Other modes of SDME have been reported, namely, headspace single drop micro-
extraction (HS-SDME), liquid–liquid–liquid micro-extraction (LLLME) and continuous-
flow micro-extraction (CFME) which will be discussed in more details.
1.5.2.3. Headspace Single Drop Micro-extraction (HS-SDME)
Theis et al. first introduced the HS-SDME [145]. In this technique a micro-drop exposed
to the headspace above the sample. Micro-extraction, preconcentration and derivatization
in a single drop can be performed by exposing a hanging drop containing the derivatizing
agent to the gaseous phase [155]. Mass transfer in the headspace is a fast process owing
to the large diffusion coefficients in the gas phase (~104
greater than corresponding
diffusion coefficients in condensed phases). Therefore, thermodynamic equilibrium
between the aqueous and vapor phases can be achieved rapidly. The overall rate of mass
transfer is limited by both the aqueous-phase stirring rate and the diffusion of analytes
within the extraction phase [145]. Since non-volatile compounds and high molecular
weight species are not extracted in the drop placed in the headspace, a high degree of
extract clean-up can be achieved. When this micro-extraction mode is employed in
conjunction with atomic detectors without prior GC separation, solvents do not need to
have high vapor pressure.
62
1.5.2.4. Liquid-Liquid-Liquid Micro-extraction (LLLME)
LLLME was developed by Ma and Cantwell in 1999 [156] under the name “solvent
micro-extraction with simultaneous back-extraction”. LLLME is based on the extraction
of analytes from the aqueous stirred sample into an organic layer or membrane with lower
density than water and simultaneous back-extraction into an aqueous micro-drop. It is
suitable for ionizable analytes. Direct convection (stirring) in one phase (aqueous sample)
results in indirectly induced convection in the other two phases (organic layer and
aqueous micro-drop) as a result of momentum transfer across both LL interfaces. First the
pH of the aqueous solution is adjusted to obtain the neutral form of analytes (e.g. acidic),
therefore analytes like carboxylic acids transfer to the organic phase. The pH of the
aqueous interior micro-drop can be adjusted to obtain the ionized form of the analyte,
extractable by the micro-drop aqueous phase. The concept can also be applied using
complexing agents, where one is added to the sample solution and the other dissolved in
the aqueous drop. In this way, the formation of a neutral complex allows its extraction
into the organic layer. If the aqueous micro-drop contains a complexing agent which
forms a stronger complex with the analyte, it can be back-extraction into the drop.
Although LLLME is more specific and so difficult to implement compared to other
SDME modes, it is very selective and can be combined with separation techniques such
as RP-HPLC or CE.

63
1.5.2.5. Continuous-Flow Micro-extraction (CFME)
Continuous-flow micro-extraction first was reported by Liu and Lee in 2000 [157]. The
extraction is carried out in a glass extraction chamber and sample is pumped continuously
at a constant flow rate; when the extraction chamber is full of sample, a drop is formed at
the tip of a micro-syringe needle. The rate of extraction increases with increasing flow
rate of the aqueous solution, consistent with a decrease in thickness of the Nernst
diffusion layer. Sample flow rate should be optimized to obtain an effective micro-
extraction of analytes without drop dislodgement or bubble formation. To insure the
stability of the drop at the tip of the needle samples should be perfectly clean. Cyclic-flow
micro-extraction is a modification of this technique [158]. In this technique sample is
pumped into the extraction chamber and after passing the chamber returns into the sample
reservoir. There is no waste container and sample flows in a closed loop.
1.5.2.6. Hollow Fibre Liquid-phase Micro-extraction (HF-LPME)
In HF-LPME a hydrophobic hollow fibre is used to protect and expose a certain volume
of extracting phase to the sample. The extraction process occurs in the pores of the hollow
fibre, where the solvent is immobilized [127]. Hollow fibre liquid-phase micro-extraction
is a simple and inexpensive technique which allows extraction and preconcentration of
analytes from complex samples. In the two-phase LPME mode (HF-LPME), a water-
immiscible extracting phase immobilized in the pores of a hollow fibre and in contact
64
with the analyte in an aqueous phase [159]. Hollow fibre typically made of polypropylene
and supported by a micro-syringe. In this technique, the liquid acceptor phase is
compatible with GC and HPLC to allow for coupling to chromatographic separation
techniques. In the three-phase sampling mode, the analytes are extracted into an organic
layer that fills the pores of the hollow fibre, and then are back-extracted into an aqueous
phase placed inside the fibre. The three-phase mode (HF-LLLME) is limited to analytes
with ionizable functionalities. As the acceptor phase is aqueous in this micro-extraction
mode, the technique should be compatible with hyphenated techniques involving HPLC
or CE. The pores of a porous hydrophobic polymer membrane are filled with an organic
liquid [124]. The extracting phase should have a polarity matching that of the hollow
fibre to be immobilized within its pores. In general, the extraction efficiency achieved
with HF-LPME is higher than with SDME, because hollow fibres allow the use of
vigorous stirring rates to accelerate the extraction kinetics. Moreover, the contact area
between the aqueous sample and the extracting phase is higher than the drop in SDME.
The use of the hollow fibre provides protection for the extracting phase, therefore;
extraction of analytes from complex and unclean samples( e.g. blood, urin) is feasible. In
fact, the small pore size of hollow fibre acts as micro-filters to clean the extracts. It should
be noted that the manipulation of the hollow fibre at the time of placement at the tip of the
needle could be a source of contamination.

65
1.5.2.7. Dispersive Liquid–Liquid Micro-extraction (DLLME)
DLLME was introduced by Rezaee et al. in 2006 [129]. In DLLME, solvent is quickly
injected into the aqueous sample to form a cloudy solution. The water-immiscible
extracting phase solvent usually has a density higher density than water. Organic solvents
with high density such as tetrachloromethane, chloroform, carbon disulfide, nitrobenzene,
bromobenzene, chlorobenzene or 1,2-dichlorobenzene can be used. The fine droplets of
extraction solvent are dispersed throughout the aqueous sample, creating high surface
area for the phase boundary which allows equilibrium to be achieved quickly. A disperser
solvent or emulsifier with high miscibility in both extracting phase and aqueous phase
(such as methanol, ethanol, acetonitrile or acetone) is mixed with extracting phase. When
rapidly injected into the sample, high turbulence is produced causing the formation of
small droplets dispersed throughout the aqueous sample. The disperser solvent influences
droplet size distribution, the mean droplet size, and emulsion viscosity. The cloudy
solution is centrifuged to separate the extract. This technique is limited to a small number
of extracting phases that efficiently extract the analytes of interest and have a higher
density rather than water. This micro-extraction technique has been reported as difficult
to automate.
In a new DLLME approach called “cold-induced aggregation micro-extraction” (CIAME)
[160] an ionic liquid (IL), a non-ionic surfactant and a derivatizing reagent, if necessary,
are added to an aqueous sample placed into a conical-bottom centrifuge tube. The

66
dissolution of the IL in the sample is achieved by heating the centrifuge tube in a
thermostated bath. The centrifuge tube is then placed in an ice bath, and like DLLME, a
cloudy solution forms. The subsequent procedure is similar to that for DLLME.
Compared to DLLME, CIAME avoids the use of a disperser solvent, but it is time
consuming because it introduces several steps before centrifugation [161].
1.5.2.8. Characteristic of Extracting Phase
In micro-extraction techniques, selecting a suitable extracting phase is very important.
For different solvents various properties should be considered. For example, a low phase
ratio between extracting phase and sample and high distribution ratio, K, produce highest
enrichment factors and extraction efficiencies. The K parameter depends on the type and
nature of the extracting phase and analytes. Physical properties of the extracting phase
such as boiling point, vapor pressure, water solubility, density, viscosity, surface tension,
dipole moment and dielectric constant must be compared to select the best option for each
method of extraction. Physical properties of some solvents are presented in Appendix A
[132].
The selection of the extracting phase should be based on a comparisons of selectivity,
extraction efficiency, incidence of drop loss, rate of drop dissolution (especially for faster
stirring rates and extended extraction times; and level of toxicity [154]. A high boiling
point reduces evaporative loses and bubble formation, which can take place inside the
drop when a solvent with a low boiling point such as benzene is used. A high surface

67
tension increases the cohesive forces at the interface, hence reducing solvent
solubilization.
In HS-SDME, in theory any extracting phase could be chosen to use as a micro-drop, but
in practice the extracting phase should have a high boiling point and low vapor pressure,
in addition to the ability to extract the analytes. In the case of HF-LPME, the extracting
phase should have a low solubility in water to avoid its dissolution; low volatility to
reduce evaporation of the solvent during extraction; a polarity matching that of the fibre
to be (typically polypropylene) strongly immobilized within the pores of the hollow fibre
to prevent leakage; and high extraction efficiency for the target analytes. In DLLME, the
extracting phase should have low solubility in water; higher density than water; high
affinity for the targeted compounds; and form a stable dispersion.
After learning from existing techniques and by focusing on advantages of individual
techniques, two new approaches namely multi-phase single drop micro-extraction (MP-
SDME) and continuous flow micro-extraction (CFME) are presented in this thesis. Since
single drop micro-extraction is based on liquid-liquid extraction, in addition to general
theory and some practical points of high importance are presented (Chapter 5). This
review has been limited to enrichment of neutral polar compounds from aqueous samples
prior to CE analysis.
Liquid-liquid extraction (LLE) is based on partitioning of solutes between two immiscible
liquid phases. Our main focus is based on aqueous environmental samples as CE is one of

68
the best suited to aqueous samples. First, analytes are extracted to an organic phase then a
second extraction that transfers analytes from organic phase to a fresh aqueous phase is
carried out. This sample treatment technique enables the concentration and purification of
analytes by aqueous to organic and back to aqueous phase with minimum solvent
consumption.
1.6. Summary of Thesis Objectives
The main theme of this work is based on application of CE as an analytical technique for
the analysis of highly polar contaminants, particularly N-nitrosamine, in aqueous
environmental samples. Application of CE to this group of compounds has had some
limitations.
First, due to the lack of intrinsic charge, an MEKC method must be developed and
optimized for separation of N-nitrosamine; poor interaction between the analytes and
micellar phase (due to high polarity of selected nitrosamines) demands an efficient
surfactant system; different types of surfactants can be selected and their effects on
separation efficiency compared.
Second, in general, CE suffers from poor sensitivity. This deficiency is highly-
problematic when concentrations of target analytes (N-nitrosamine) are low, typical of
environmental samples (ng L-1
). To overcome this limitation, online and offline
preconcentration of analytes were studied. CE is not only a good technique for analysis of

69
contaminants - like N-nitrosamines - in aqueous environmental matrices, but also offers
several online preconcentration methods. However, not all preconcentration techniques
are compatible with MEKC and the polar, uncharged N-nitrosamines. To choose an
existing online preconcentration technique or develop a new technique, the mechanism of
existing online techniques as along with their similarities and differences were reviewed.
Only those techniques that were compatible with the nature of our target analytes - neutral
polar nitrosamines - were selected in this study. Since the interaction between analytes
and micelles play the major rule in MEKC, understanding the mechanism of solute-
micelle interactions is important. Based on the structure of nitrosamine it can be assumed
that hydrogen bond interaction between analyte and PSP plays the major role. To develop
a new approach of online preconcentration in MEKC for highly polar neutral compounds,
a sweeping technique was selected as our foundation. After identifying the weakness of
this technique for enrichment of highly polar compounds, the effect of different factors on
the performance of this technique was studied. In sweeping of neutral compounds, the
enrichment was more efficient when EOF was suppressed. Since the micelles are the only
source of movement inside the capillary, stronger interactions between analytes and
micelles would be required to avoid a large analysis time and consequently, excessive
peak broadening for highly polar compounds. Since that is not easily attainable using
simple RM-EKC, the application of auxiliary pressure in sweeping RM-EKC is presented
in this research to overcome this problem and achieve a better enrichment.

70
Finally, since most of the environmental samples are not ready-to-inject samples, an extra
clean up is sometimes required. The sample clean up is usually performed by an
extraction method that is also considered as an offline preconcentration technique. Offline
preconcentration techniques can be considered as an alternative or complementary
technique for enrichment of N-nitrosamines. Many micro-extraction techniques have been
introduced for sample treatment and enrichment. After comparing advantages and
disadvantages of different micro-extraction techniques, single drop micro-extraction was
selected for further study. A new single-drop multiphase micro-extraction compatible
with MEKC is introduced and sustained by presenting a new technique called continuous
flow single drop micro-extraction.
After developing a combination of offline- and/or online-MEKC techniques, analysis of
seven nitrosamines in environmental samples (waste water) using the proposed method
was implemented and compared with a conventional sample preparation technique (SPE)
followed by MEKC.

71
1.7. References:
[1] A.L.Fridman, F. M. M., and S.S.Novikov, Russ. Chem. Rev. 1971, 40, 34.
[2] Mageep, N. M., P. N., ACTA UNIO INTERNATIONALIS CONTRA CANCRUM 1959,
15.
[3] Hadidian, Z., Fredrickson, T. N., Weisburger, E. K., Weisburger, J. H., Glass, R. M.,
Mantel, N., J Natl Cancer Inst 1968, 41, 985-1036.
[4] Drabløs, F., Feyzi, E., Aas, P. A., Vaagbø, C. B., Kavli, B., Bratlie, M. S., Peña-Diaz,
J., Otterlei, M., Slupphaug, G., Krokan, H. E., DNA Repair 2004, 3, 1389-1407.
[5] Wagner, E. D., Osiol, J., Mitch, W. A., Plewa, M. J., Environmental Science &
Technology 2014, 48, 8203-8211.
[6] Bhangare, R. C., Sahu, S. K., Pandit, G. G., Journal of Food Science and Technology
2015, 52, 507-513.
[7] Qian, Y., Wu, M., Wang, W., Chen, B., Zheng, H., Krasner, S. W., Hrudey, S. E., Li,
X.-F., Analytical Chemistry 2015, 87, 1330-1336.
[8] Simcox, N. J., Bracker, A., Ginsberg, G., Toal, B., Golembiewski, B., Kurland, T.,
Hedman, C., Journal of Toxicology and Environmental Health, Part A 2011, 74, 1133-
1149.
72
[9] Gan, X., Karanfil, T., Kaplan Bekaroglu, S. S., Shan, J., Water Research 2013, 47,
1344-1352.
[10] Taguchi, V. Y., Canadian Journal of Applied Spectrometry 1994, 39.
[11] Zhu, X. Q., He, J. Q., Li, Q., Xian, M., Lu, J., Cheng, J. P., J Org Chem 2000, 65,
6729-6735.
[12] Kemper, J. M., Walse, S. S., Mitch, W. A., Environ Sci Technol 2010, 44, 1224-
1231.
[13] Zolfigol, M. A., Zebarjadian, M. H., Chehardoli, G., Keypour, H., Salehzadeh, S.,
Shamsipur, M., J Org Chem 2001, 66, 3619-3620.
[14] Lijinsky, W., Mutat Res 1999, 443, 129-138.
[15] Tricker, A. R., Preussmann, R., Mutation Research/Genetic Toxicology 1991, 259,
277-289.
[16] Ikeda, K., Journal of the Society of Cosmetic Chemists 1990, 41.
[17] Burdock, G. A., International Journal of Toxicology (Taylor & Francis) 2007, 26,
51-55.
[18] Schuller, H. M., Life Sciences 2007, 80, 2274-2280.
[19] Bryan, N. S., Free Radical Bio Med 2006, 41, 691-701.

73
[20] Cui, M., Burton, H. R., Bush, L. P., Sutton, T. G., Crafts-Brandner, S. J., J Agr Food
Chem 1994, 42, 2912-2916.
[21] Lars Carlsen, B. N. K., Svetlana Ye. Batyrbekova, Environ Health Insights 2008, 1,
11-20.
[22] Dai, N., Shah, A. D., Hu, L., Plewa, M. J., McKague, B., Mitch, W. A., Environ Sci
Technol 2012, 46, 9793-9801.
[23] Shah, A. D., Mitch, W. A., Environ Sci Technol 2012, 46, 119-131.
[24] EPA, U., United State Environmental Protection Agency 2012.
[25] Kristiana, I., Tan, J., Joll, C. A., Heitz, A., von Gunten, U., Charrois, J. W. A., Water
Research 2013, 47, 535-546.
[26] Qian, Y., Wu, M., Wang, W., Chen, B.-B., Zheng, H., Krasner, S. W., Hrudey, S. E.,
Li, X.-F., Analytical Chemistry 2014.
[27] Choi, J., Valentine, R. L., Environmental Science & Technology 2003, 37, 4871-
4876.
[28] Chen, Z., Valentine, R. L., Environmental Science & Technology 2006, 40, 7290-
7297.

74
[29] Chen, Z., Valentine, R. L., Environmental Science & Technology 2007, 41, 6059-
6065.
[30] Dai, N., Mitch, W. A., Environmental Science & Technology 2013, 47, 3648-3656.
[31] Mestankova, H., Schirmer, K., Canonica, S., von Gunten, U., Water Research 2014,
66, 399-410.
[32] Fridman, A. L., Mukhametshin, F. M., Novikov, S. S., Usp. Khim. 1971, 40, 64-94.
[33] Cowley, E. G., Partington, J. R., J. Chem. Soc. 1933, 1255-1257.
[34] George, M. V., Wright, G. F., J. Am. Chem. Soc. 1958, 80, 1200-1204.
[35] Korsunskii, B. L., Pepekin, V. I., Lebedev, Y. A., Apin, A. Y., Izv. Akad. Nauk
SSSR, Ser. Khim. 1967, 525-528.
[36] Rademacher, P., Stoelevik, R., Luettke, W., Angew. Chem., Int. Ed. Engl. 1968, 7,
806.
[37] Looney, C. E., Phillips, W. D., Reilly, E. L., J. Am. Chem. Soc. 1957, 79, 6136-6142.
[38] Karabatsos, G. J., Taller, R. A., J. Am. Chem. Soc. 1964, 86, 4373-4378.
[39] Djerassi, C., Lund, E., Bunnenberg, E., Sjoberg, B., J. Am. Chem. Soc. 1961, 83,
2307-2312.
75
[40] Layne, W. S., Jaffe, H. H., Zimmer, H., J. Am. Chem. Soc. 1963, 85, 435-438.
[41] Layne, W. S., Jaffe, H. H., Zimmer, H., J. Am. Chem. Soc. 1963, 85, 1816-1820.
[42] Taguchi, V. Y., Canadian Journal of Applied Spectrometry 1994, 39.
[43] Weast, R. C., CRC Handbook of Chemistry and Physics - 66th Edition, CRC Press,
Boca Raton, Florida 1985.
[44] Stephany, R. W., Schuller, P.L., Oncology. 1980, 37, 203-210.
[45] Spiegelhalder, B., Eisenbrand, G., Preussmann, R., Oncology 1980, 37, 211-216.
[46] Yamamoto, M., Iwata, R., Ishiwata, H., Yamada, T., Tanimura, A., Food and
Chemical Toxicology 1984, 22, 61-64.
[47] Song, P. J., Hu, J. F., Food and Chemical Toxicology 1988, 26, 205-208.
[48] Ng, C. L., Ong, C. P., Lee, H. K., Li, S. F. Y., Journal of Chromatographic Science
1994, 32, 121-125.
[49] Bell, L. M., Murray, G. M., J Chromatogr B 2005, 826, 160-168.
[50] Breadmore, M. C., Electrophoresis 2007, 28, 254-281.
[51] Dabek-Zlotorzynska, E., Celo, V., Yassine, M. M., Electrophoresis 2008, 29, 310-
323.

76
[52] Tiselius, A., Kabat, E. A., Science 1938, 87, 416-417.
[53] Tiselius, A., Biochem J 1937, 31, 313-317.
[54] Tiselius, A., Transactions of the Faraday Society 1937, 33, 524-531.
[55] Hjerten, S., Arkiv foer Kemi 1958, 13, 2.
[56] Jorgenson, J. W., Lukacs, K. D., Clin Chem 1981, 27, 1551-1553.
[57] Kim, J. B., Terabe, S., J Pharm Biomed Anal 2003, 30, 1625-1643.
[58] Terabe, S., Otsuka, K., Ichikawa, K., Tsuchiya, A., Ando, T., Analytical Chemistry
1984, 56, 111-113.
[59] Cui, X., Mao, S., Liu, M., Yuan, H., Du, Y., Langmuir 2008, 24, 10771-10775.
[60] Terabe, S., Otsuka, K., Ando, T., Analytical Chemistry 1985, 57, 834-841.
[61] Jandik, P. B., Gunther; Drossman, Howard, Capillary Electrophoresis of Small
Molecules and Ions, VCH, New York, N. Y. 1993.
[62] Nishi, H., Tsumagari, N., Terabe, S., Analytical Chemistry 1989, 61, 2434-2439.
[63] Sadek, P. C., Carr, P. W., Doherty, R. M., Kamlet, M. J., Taft, R. W., Abraham, M.
H., Anal Chem 1985, 57, 2971-2978.
[64] Yang, S. Y., Khaledi, M. G., Journal of Chromatography A 1995, 692, 301-310.

77
[65] Bumgarner, J. G., Khaledi, M. G., Electrophoresis 1994, 15, 1260-1266.
[66] Nishi, H., Fukuyama, T., Matsuo, M., Terabe, S., J Pharm Sci 1990, 79, 519-523.
[67] Carr, P. W., Doherty, R. M., Kamlet, M. J., Taft, R. W., Melander, W., Horvath, C.,
Anal Chem 1986, 58, 2674-2680.
[68] Kim, J. B., Okamoto, Y., Terabe, S., J Chromatogr A 2003, 1018, 251-256.
[69] Threeprom, J., Som-aum, W., Lin, J.-M., Chinese Journal of Chemistry 2006, 24,
1747-1753.
[70] Zhang, X., Stuart, J., Sweedler, J., Analytical and Bioanalytical Chemistry 2002,
373, 332-343.
[71] Hilmi, A., Luong, J. H. T., Analytical Chemistry 2001, 73, 2536-2540.
[72] Sun, J., Xu, X., Wang, C., You, T., Electrophoresis 2008, 29, 3999-4007.
[73] Ramautar, R., de Jong, G. J., Somsen, G. W., Electrophoresis 2012, 33, 243-250.
[74] Heiger, D. N., Kaltenbach, P., Sievert, H. J., Electrophoresis 1994, 15, 1234-1247.
[75] Jing, P., Kaneta, T., Imasaka, T., Electrophoresis 2002, 23, 550-555.
[76] Jing, P., Kaneta, T., Imasaka, T., J Chromatogr A 2002, 959, 281-287.
[77] Stutz, H., Electrophoresis 2005, 26, 1254-1290.

78
[78] Akbay, C., Rizvi, S. A., Shamsi, S. A., Anal Chem 2005, 77, 1672-1683.
[79] Silva, M., Electrophoresis 2007, 28, 174-192.
[80] Molina, M., Wiedmer, S. K., Jussila, M., Silva, M., Riekkola, M. L., J Chromatogr A
2001, 927, 191-202.
[81] Stubberud, K., Forsberg, A., Callmer, K., Westerlund, D., Electrophoresis 2002, 23,
572-577.
[82] Petersson, P., Jornten-Karlsson, M., Stalebro, M., Electrophoresis 2003, 24, 999-
1007.
[83] Van Biesen, G., Bottaro, C. S., Electrophoresis 2006, 27, 4456-4468.
[84] Tseng, M. C., Chen, Y. R., Her, G. R., Anal Chem 2004, 76, 6306-6312.
[85] Isoo, K., Otsuka, K., Terabe, S., Electrophoresis 2001, 22, 3426-3432.
[86] Mol, R., de Jong, G. J., Somsen, G. W., Anal Chem 2005, 77, 5277-5282.
[87] Mol, R., de Jong, G. J., Somsen, G. W., Electrophoresis 2005, 26, 146-154.
[88] Serrano, J. M., Silva, M., Electrophoresis 2006, 27, 4703-4710.
[89] Tseng, W. L., Hsu, C. Y., Wu, T. H., Huang, S. W., Hsieh, M. M., Electrophoresis
2009, 30, 2558-2564.
79
[90] Tsai, C. C., Liu, J. T., Shu, Y. R., Chan, P. H., Lin, C. H., J Chromatogr A 2006,
1101, 319-323.
[91] Gebauer, P., Bocek, P., Electrophoresis 2009, 30 Suppl 1, S27-33.
[92] Kartsova, L. A., Bessonova, E. A., Journal of Analytical Chemistry 2009, 64, 326-
337.
[93] Quirino, J. P., Haddad, P. R., Electrophoresis 2009, 30, 1670-1674.
[94] Quirino, J. P., Electrophoresis 2009, 30, 875-882.
[95] Kazarian, A. A., Hilder, E. F., Breadmore, M. C., Journal of Separation Science
2011, 34, 2800-2821.
[96] Aranas, A. T., Guidote Jr, A. M., Quirino, J. P., Analytical & Bioanalytical
Chemistry 2009, 394, 175-185.
[97] Sentellas, S., Puignou, L., Galceran, M. T., Journal of Separation Science 2002, 25,
975-987.
[98] Quirino, J. P., Terabe, S., J Capillary Electrophor 1997, 4, 233-245.
[99] Quirino, J. P., Terabe, S., Journal of Chromatography A 1997, 791, 255-267.
[100] Quirino, J. P., Terabe, S., Analytical Chemistry 1998, 70, 149-157.
80
[101] Quirino, J. P., Otsuka, K., Terabe, S., J Chromatogr B Biomed Sci Appl 1998, 714,
29-38.
[102] Quirino, J. P., Terabe, S., Journal of Chromatography A 1998, 798, 251-257.
[103] Quirino, J. P., Terabe, S., Anal Chem 1998, 70, 1893-1901.
[104] Dawod, M., Breadmore, M. C., Guijt, R. M., Haddad, P. R., Journal of
Chromatography A 2010, 1217, 386-393.
[105] Kim, J.-B., Quirino, J. P., Otsuka, K., Terabe, S., Journal of Chromatography A
2001, 916, 123-130.
[106] Chien, R. L., Burgi, D. S., J. Chromatogr. 1991, 559, 153-161.
[107] Burgi, D. S., Chien, R. L., Anal. Chem. 1991, 63, 2042-2047.
[108] Chien, R. L., Burgi, D. S., Anal. Chem. 1992, 64, 1046-1050.
[109] Burgi, D. S., Anal. Chem. 1993, 65, 3726-3729.
[110] He, Y., Lee, H. K., Anal Chem 1999, 71, 995-1001.
[111] Baryla, N. E., Lucy, C. A., Electrophoresis 2001, 22, 52-58.
[112] Macia, A., Borrull, F., Aguilar, C., Calull, M., Electrophoresis 2004, 25, 428-436.
[113] Han, J. H., Chun, M. S., Riaz, A., Chung, D. S., Electrophoresis 2005, 26, 480-486.

81
[114] Osbourn, D. M., Weiss, D. J., Lunte, C. E., Electrophoresis 2000, 21, 2768-2779.
[115] Quirino, J. P., Terabe, S., Anal Chem 1998, 70, 149-157.
[116] Simpson, S. L., Jr., Quirino, J. P., Terabe, S., J Chromatogr A 2008, 1184, 504-541.
[117] Quirino, J. P., Terabe, S., Analytical Chemistry 1999, 71, 1638-1644.
[118] Quirino, J. P., Terabe, S., Analytical Chemistry 2000, 72, 1023-1030.
[119] Kim, J.-B., Otsuka, K., Terabe, S., Journal of Chromatography A 2001, 932, 129-
137.
[120] Kim, J. B., Britz-McKibbin, P., Hirokawa, T., Terabe, S., Anal Chem 2003, 75,
3986-3993.
[121] Britz-McKibbin, P., Markuszewski, M. J., Iyanagi, T., Matsuda, K., Nishioka, T.,
Terabe, S., Analytical Biochemistry 2003, 313, 89-96.
[122] Quirino, J. P., Haddad, P. R., Anal Chem 2008, 80, 6824-6829.
[123] Quirino, J. P., J Chromatogr A 2008, 1214, 171-177.
[124] Pawliszyn, J., Editor, Comprehensive Analytical Chemistry, Volume 37. (Sampling
and Sample Preparation for Field and Laboratory: Fundamentals and New Directions in
Sample Preparation.), Elsevier Science B.V. 2002.

82
[125] Risticevic, S., Lord, H., Gorecki, T., Arthur, C. L., Pawliszyn, J., Nat Protoc 2010,
5, 122-139.
[126] Jeannot, M. A., Cantwell, F. F., Anal Chem 1996, 68, 2236-2240.
[127] Pedersen-Bjergaard, S., Rasmussen, K. E., Anal Chem 1999, 71, 2650-2656.
[128] Berijani, S., Assadi, Y., Anbia, M., Milani Hosseini, M. R., Aghaee, E., J
Chromatogr A 2006, 1123, 1-9.
[129] Rezaee, M., Assadi, Y., Milani Hosseini, M. R., Aghaee, E., Ahmadi, F., Berijani,
S., J Chromatogr A 2006, 1116, 1-9.
[130] Boone, C. M., Waterval, J. C., Lingeman, H., Ensing, K., Underberg, W. J., J
Pharm Biomed Anal 1999, 20, 831-863.
[131] Pena-Pereira, F., Lavilla, I., Bendicho, C., Vidal, L., Canals, A., Talanta 2009, 78,
537-541.
[132] Pena-Pereira, F., Lavilla, I., Bendicho, C., Anal Chim Acta 2009, 631, 223-228.
[133] Stahl, D. C., Tilotta, D., Infrared Spectroscopic Detection for SPME, Royal Society
of Chemistry, U.K. 1999.
[134] Smith, W. D., Anal Chem 2002, 74, 462A-466A.
83
[135] Auroux, P. A., Iossifidis, D., Reyes, D. R., Manz, A., Anal Chem 2002, 74, 2637-
2652.
[136] Reyes, D. R., Iossifidis, D., Auroux, P. A., Manz, A., Anal Chem 2002, 74, 2623-
2636.
[137] Thurman, E. M., Mills, M. S., Solid-Phase Extraction: Principles and Practice.,
Wiley 1998.
[138] Dean, J., Extraction Methods for Environmental Analysis, John Wiley, New York
1998.
[139] Pawliszyn, J., Analytical Chemistry 2003, 75, 2543-2558.
[140] Handley, A., Extraction Methods in Organic Analysis, Sheffield Press, Sheffield,
UK 1999.
[141] Pawliszyn, J., Editor, Applications of Solid Phase Microextraction, Royal Soc.
Chem. 1999.
[142] Pawliszyn, J. b., Solid Phase Microextraction: Theory and Practice, VCH 1997.
[143] Jeannot, M. A., Cantwell, F. F., Anal Chem 1997, 69, 2935-2940.
[144] He, Y., Lee, H. K., Anal. Chem. 1997, 69, 4634-4640.
84
[145] Theis, A. L., Waldack, A. J., Hansen, S. M., Jeannot, M. A., Anal Chem 2001, 73,
5651-5654.
[146] Xie, H.-Y., He, Y.-Z., TrAC, Trends Anal. Chem. 2010, 29, 629-635.
[147] Cardoso, A. A., Liu, H., Dasgupta, P. K., Talanta 1997, 44, 1099-1106.
[148] Milani, M. R., Stradiotto, N. R., Cardoso, A. A., Electroanal 2003, 15, 827-830.
[149] Pretto, A., Milani, M. R., Cardoso, A. A., J Environ Monit 2000, 2, 566-570.
[150] Ugucione, C., Cardoso, A. A., Anal Bioanal Chem 2007, 389, 1647-1650.
[151] Cardoso, A. A., Dasgupta, P. K., Anal. Chem. 1995, 67, 2562-2566.
[152] Liu, H., Dasgupta, P. K., Anal. Chem. 1995, 67, 4221-4228.
[153] da Silva Borges, S., Reis, B. F., Anal Chim Acta 2007, 600, 66-71.
[154] Psillakis, E., Kalogerakis, N., TrAC, Trends Anal. Chem. 2002, 21, 53-63.
[155] Fiamegos, Y. C., Stalikas, C. D., Anal Chim Acta 2007, 599, 76-83.
[156] Ma, M., Cantwell, F. F., Anal. Chem. 1999, 71, 388-393.
[157] Liu, W., Lee, H. K., Anal Chem 2000, 72, 4462-4467.
[158] Xia, L., Hu, B., Jiang, Z., Wu, Y., Liang, Y., Anal Chem 2004, 76, 2910-2915.

85
[159] Psillakis, E., Kalogerakis, N., TrAC, Trends Anal. Chem. 2003, 22, 565-574.
[160] Baghdadi, M., Shemirani, F., Anal Chim Acta 2008, 613, 56-63.
[161] Baghdadi, M., Shemirani, F., Anal Chim Acta 2009, 634, 186-191.

86
Chapter 2 New Pressure Assisted Sweeping Online Preconcentration
for Highly Polar Environmentally-Relevant Nitrosamines: Part 1.
Sweeping for Polar Compounds and Application of Auxiliary
Pressure[1]
87
2.1. Introduction
Capillary electrophoresis employs electrophoretic, electroosmotic, and chromatographic
phenomena, and results in an unparalleled degree of flexibility in achieving separation,
which has lead to a wide range of applications for problems as simple targeted analysis of
pharmaceutical compounds to complex analytical problems such as the mapping of the
human genome [2-6]. Although CE can easily separate very complex mixtures, it suffers
from low sensitivity arising from small sample volumes (e.g., 2–10 nL) and short optical
path lengths (e.g., 25–100 μm). On-line focusing methods for enrichment in CE have been
developed based on chromatographic partitioning, sorption or electrophoretic effects for
neutral and charged analytes [7]. Sweeping can be employed with EKC for analysis of
neutral compounds, where enrichment mainly based on affinity for the micellar phase [7-
10]. In EKC neutral analytes are separated only due to partitioning, while charged analytes
benefit from both partitioning and electrophoretic effects [8-9]. Depending on the type of
surfactants, micelles can be charged or neutral lending flexibility to the approach, however
applications using neutral surfactants exclusively can only be used for charged analytes
[10-12].
N-nitrosamines are potentially-carcinogenic, neutral polar compounds [13], which makes
them important from a human health standpoint and challenging from the analytical
perspective. The seven nitrosamines used in this study are listed in Table 2.1 along with
data on their water solubility and log P values. The log P is defined by partitioning of
analytes between 1-octanol and water and gives an indication of polarity of analytes; it is

88
commonly used as a measure of lipophilicity and as a predictive tool for analytical
separations of all types including chromatography. The data indicates that the nitrosamines
should be very polar and highly soluble in water with a low affinity for micellar phases.
Since other online preconcentration methods can successfully enrich the nonpolar
compounds, the main focus of this study are the analytes with log P<1, for which traditional
sweeping is not a viable choice.
Table 2.1. Physical properties and structures of nitrosamines in watera
Name of compounds
Abbreviation Solubility in water (mgL-1) log P
N-nitrosodimethylamine NDMA 1x10⁶ -0.57
N-nitrosomorpholine NMOR 1x10⁶ -0.44
N-nitrosopyridine NPYR 1x10⁶ -0.19
N-nitrosodiethylamine NDEA 1.06x10⁵ 0.48
N-nitrosopipyridine NPIP 7.65x10⁴ 0.36
N-nitrosodipropylamine NDPA 1.3x10⁴ 1.36
N-nitrosodibuthylamine NDBA 1270 2.63
a- Data obtained from CRC Handbook of Chemistry and Physics 66th
edition
In general, sweeping is very similar to normal MEKC in terms of compositions of the BGE
and the sample matrix. The sample should be micelle-free, while the BGE should contain a
relatively large amount of surfactant, and conditions should be such that EOF is low or
absent. Movement of analytes is mainly due to their association with migrating micelles
[14]. For an injection zone containing a neutral analyte between two zones containing

89
charged pseudostationary phase, the length of the enriched analyte zone (the sweep-zone) is
narrowed to a fraction of the injection zone, which can be estimated from:
2-1
where linj is the length of the injected sample zone and k is the chromatographic retention
factor [15-16]. According to equation 2.1, sweeping is most effective for analytes with
large k, resulting in the narrowest sweep zones and therefore the highest concentration
factors. Although the injection zone can be increased in a particular capillary to improve
the detection limit, some fraction of the capillary must be left with the BGE where
separation occurs. This suggests that the capillary could be made infinitely long to
maximize sample loading and decrease limits of detection, however, the drive toward long
capillaries for sensitivity improvements must be balanced with other factors such as
analysis times and excessive band broadening for, polar compounds with low k values..
Rather than using a shorter capillary to speed up analysis times, the use of auxiliary
pressure with longer capillaries was described for the first time in this study.
2.2. Materials and Methods
2.2.1. Apparatus
All electropherograms were obtained using an Agilent 3D Capillary Electrophoresis 1600
with Agilent ChemStation software (Waldbronn, Germany) using fused silica polyimide
coated capillaries 50 µm ID and 375 µm OD and coated capillaries (Zero EOF), MicroSolv

90
(USA). Capillaries were loaded in a temperature controlled compartment held at 25°C. To
increase the capacity of cartridge (normal length is up to 64.5 cm), an adapter was designed
and fabricated that can be added to Agilent capillary cartridge to accommodate capillaries
up to 130 cm. Application of capillaries longer than this is limited by the maximum
applicable electric field. UV detection was performed at wavelengths 230 nm for
nitrosamines and 210 nm for DMSO, the EOF marker and for dodecanophenone, the
micelle marker. Absorbance maxima for all analytes fell between 225 and 235 nm. The
auxiliary pressure device made in our lab to control is described later in the chapter and
precise control of pressure between 0 and 200 mbar ± 0.5% was possible; all parts were
obtained from OMEGA Engineering (New Jersey, USA).
2.2.2. Materials
Individual nitrosamine (Table 2.1 and 1.1) standards at 2000 mgL-1
in methanol were
purchased from Supelco (Ontario, Canada), stock solutions of 1000 mgL-1
in methanol
were prepared and stored at 4°C and working solutions were made fresh daily. All solvents
were HPLC grade or higher, sodium dodecyl sulfate 99.0% (SDS) was purchased from
Fluka, DMSO (99.0%), dodecanophenone (98.0%) and ammonium phosphate (99.99%)
from Sigma-Aldrich (Oakville, Canada). Ultrapure water was obtained from Barnstead
NanoPure Diamond (18 MΩ), (Ontario, Canada). The micelle marker (dodecanophenone)
and the EOF marker (DMSO) were spiked as required. Stock solutions of 500 mM of SDS
and 1000 mM of phosphate buffer were made weekly and used in making the BGE

91
solutions as required. The pH and conductivity were adjusted after final dilution. Solutions
were filtered with 0.22 µm nylon filters and degassed prior to use.
2.2.3. Conductivity Measurements
Typically, the conductivities of BGE and sample solutions were measured with a VWR-
Symphony potentiometer/ pH meter model SB70C. For small volume samples,
conductivities were also determined by filling the capillary with the solution of interest and
applying a potential of 5 kV for a limited time and current at a fixed temperature (25 °C)
was recorded. The conductivity (δ) was calculated from:
2-2
where I is the measured current (A), L is the total length of the capillary (m), V is the
applied voltage, and A is the cross-sectional area (m2) [17].
2.3. Results and Discussion
Eq. 2-1 suggests that EOF has no effect on analyte focusing in sweeping, while in practice
elimination of the EOF is preferred as a strong EOF often leads to a reduced concentration
efficiency [16]. However, in the absence of EOF the analyses are typically lengthened by
the limited mobility of micelle, which is the only vector for migration of neutral analytes.
Thus, some of the advantage gained in sweeping-based focusing is lost when the analyte
has too much time for diffusion related band broadening. The analysis time can be reduced

92
by using shorter capillaries; this was attempted using 33.5 cm capillary, which is the
minimum length of capillary allowed by the Agilent CE. The total analysis time for the
analytes of interest (N-nitrosamines) was relatively long at nearly 30 min, and the
improvement in sensitivity was limited by a concomitant decrease in the injection volume.
The analysis time may also be improved by increasing the applied voltage, though there is a
practical limit, for example most commercial instruments operate at 30-40 kV.
If a method carried out at an instrument’s maximum voltage is transferred to a longer
capillary, the analytes must both migrate further and more slowly because of the diminished
micelle velocity under the reduced electric field strength. This effect was studied for
various capillary lengths with a fixed internal diameter (Figure 2.1). It was also found that
the relationship between pressure and total analysis time was not linear, and is likely related
to viscosity and the frictional force at the capillary walls (Figure 2.2).

93
Figure 2-1. Effect of capillary length on analysis time in absence of auxiliary pressure
Capillaries with larger internal diameter showed better migration time reproducibility and.
longer capillaries gave substantial increases in the total analysis time with broader and
flatter peaks. Despite the reduction in S/N and hard earned gains in sensitivity, especially
for analytes with small k, longer capillaries are necessary to accommodate the larger sample
volumes needed to improve detection limits. The application of auxiliary pressure to push
the analytes toward the detector was a workable solution to minimize the time analytes
spend in the capillary, which as will be shown, improves the key peak characteristics.
Figure 2-2. Effect of pressure on analysis time. Capillary: length 130 cm, ID 50 μm
2.3.1. Application of Pressure
The effect of pressure was assessed using the variable system pressure on our Agilent CE,
noting that the upper limit for this pressure was 50 mbar. Figure 2.3A shows normal

94
sweeping with RM-EKC under acidic conditions when no pressure was applied. The total
analysis time was about 60 minutes and significant band broadening for last two peaks was
observed. These peaks correspond to NDMA and NMOR; both have negative log P values
and so have low association with the micellar phase. The electropherograms B and C in
Figure 2.3 show that the application of external pressure shortens the analysis time and
peak shapes improve dramatically. An unexpected result of these experiments was the
noticeable decrease in peak height (see Figure 2.3) for first two compounds (NDBA and
NDPA) as the applied pressure was increased. With sweeping, compounds with higher log
P values should demonstrate better concentration efficiencies with taller and narrower
peaks; this was evident in the case of these early migrating peaks; however it does not
explain the loss in signal intensity with the applied pressure. A number of reasons for this
effect were examined. One factor that was considered was the relationship between the
application of auxiliary pressure and the time interval for interaction between the analyte
and the micellar phase. If the analytes were categorized into two sets, high interaction and
low interaction with micellar phase, then it can be predicted that for the analytes with high
interaction with the micelles, migration is fast, less time is spent in the bulk aqueous phase
and narrower peak can be achieved.
For small polar analytes with low interaction with the micellar phase, the time spent in the
capillary was long and diffusion was problematic; therefore, it was useful to apply pressure
to ensure these compounds reach the detector before excessive band broadening can occur.
From Figure 2.3A (no pressure applied), it can be seen that it takes about 15 minutes for the

95
most hydrophobic nitrosamines to reach the detector solely through migration when
associated with the micelle; whereas it took more than 50 min before the last analyte peak
appears and with poor peak characteristics.
If the pressure was applied early (Figures 2.3B and 2.3C), the problem with signal loss was
apparent for the faster migrating peaks. However, when the auxiliary pressure was applied
after 15 minutes (Figure 2.3D), there was no signal loss for first two analytes and good
peak shapes are achieved for the rest of the compounds, give optimal concentration
efficiencies. While pressure improved the separation from an analytical standpoint, the
reason for the loss in signal when the pressure was applied early is still not clear. It is
possible that in sweeping analytes with high interaction with micelles, very narrow bands
smaller than the height of the slit in the detection cell may result. When the focusing effect
of sweeping is very efficient, the analyte zone may be very concentrated and narrow, filling
only part of the detection window. In this case, absorbance of light by the analyte occurs in
only one part and in the other part the absorbance is essentially zero. If the analyte
concentration in that zone exceeds the upper limit of the linear range, the net signal
measured will be lower than expected for a similar mass loading but in a broader, shorter
peak. Some of these issues have been explained in more detail by Patrick Kaltenbach
(Hewlett-Packard Journal, June 1995, pp 20-24). A detection window with shorter height
from Agilent (Part G1600-60132) was employed and the same experiments repeated, but no
significant improvement was observed (results are not shown).

96
Figure 2-3. Effect of using auxiliary pressure on migration time and peak shapes in
sweeping RM-EKC. Analytes: 1) NDBA, 2) NDPA, 3) NPIP, 4) NEDA, 50 NPYR, 6)
NMOR, 7)NDMA. BGE 50 mM phosphate buffer pH 1.9 and 100mM SDS (conductivity
7.2 mS). Capillary length 64.5 cm and 50 µm id. Voltage -230V/cm; hydrodynamic
injection 50 s at 50 mbar pressure at inlet during analysis: A 0 mbar, B 25 mbar, C 50
mbar, D 50 mbar applied after 5 min delay.
-10
0
10
20
30
40
50
60
70
80
90
0 10 20 30 40 50 60 70
Time (min)
D
C
B
A
2
1
3
4 5 67
Abs
orba
nce
(mA
u)

97
2.3.2. Device for Application of Auxiliary Pressure
Experimentally, it was found that longer capillaries (>64.5 cm) require higher applied
pressure (>50 mbar) for the most effective separations. However, pressure controls are
limited in commercially available instruments like the Agilent CE-1600, which has
available pressure from -50 to +50 mbar. Even this pressure cannot be maintained at a
stable level for more than a few minutes, at which point there is a cyclic fluctuation in the
applied pressure. In some CE instruments application of external pressure is designed for
high pressures of 2 bar to 12 bar, and it cannot be precisely controlled. With the appropriate
equipment, it should be possible to accurately control the magnitude and direction of the
applied pressure for good reproducibility of linear flow. Out of necessity, a device was
developed that can easily be added to instruments to supply the required pressure. A
schematic of the device is shown in Figure 2.4. This device consists of a small nitrogen
cylinder (C), pressure regulators (G1 and G2), solenoid valves (S1, S2) and a pressure
transducer (T). The first regulator (G1) sets the upper limit of applied pressure and
regulator (G2) is responsible for fine tuning the pressure. Pressure was monitored and
recorded during the analysis using pressure transducer (T) which has a USB connection to
the computer. The device was placed between the instrument pressure source and vial in the
existing instrument. The pressure switch (S1) engages the device. The presence of a three-
way valve (S2) in this design facilitates the activation of pressure without interruption in

98
instrument function. When the device was inactive, the connection between the internal
pressure control system (P) and the inlet vial (v) was open and the instrument was able to
carry out its normal functions such as flushing and hydrodynamic injection. When the
device was activated the internal pressure control was shut down and the connection
between the external pressure and the vial was opened, allowing for pressure to be
delivered to the inlet vial (v). This device was triggered by the external relay which was
preinstalled in the CE instrument and it can be automatically controlled with the software.
Figure 2-4. Diagram of portable device) for application of external pressure Components
are: C, nitrogen gas container; G1 and G2, regulator, S1 and S2, solenoid valves; T,
pressure sensor; P, pressure components in CE and V is vial.
C
G1
PVS1
S2
G2
T
21 3
CE

99
2.3.3. Explanation of Analyte Behavior with Pressure Assisted
Sweeping
It is clear that the main advantage of sweeping is the high focusing efficiency for analytes
with large k values [18]. However, polar analytes with smaller k values show broader
peaks, poorer preconcentration efficiency, and have long migration times due to their low
affinity for the migrating micelles. This has meant that the use of sweeping is generally
avoided for polar compounds, and there are few effective alternatives for online
preconcentration in CE that are not limited by a low affinity for the micelles. Broad peaks
are attributable to inefficient focusing as the micelles move through the large injection
zone, which is made worse in the time after sweeping where low affinity for the micelles
leads to extra time for diffusion. [19-20]. Since sweeping is already hindered by small
injection volumes compared to other online focusing techniques (e.g. such as stacking), the
capillary needed to be as long as is practical to accommodate higher loading volumes, but
long columns mean more time for diffusion related peak broadening.
By using an auxiliary pressure, the compounds with the lower affinity for the micelles can
be pushed toward the detector, maintaining some of the advantage of the focusing while
minimizing the time for diffusion. Figure 2.5 illustrates the behavior of analytes in
sweeping-RM-EKC with the auxiliary pressure applied after the sweeping process has been
initiated. The capillary has been filled with BGE (contains micellar phase), then
hydrodynamically-injected sample (gray zone, linj, Figure 2.5A), and the ends of the
capillary are placed in sample vials containing BGE. Initially, sample solutions and BGE

100
conductivities were made nearly equal, to maintain uniform electric field across the
capillary; this is considered ideal for optimal peak shapes.
Figure 2-5 . Conceptual representation of analyte behavior with pressure assisted sweeping.
A) Capillary is filled with BGE consist of SDS (anionic surfactant) and sample in injected.
B) negative voltage applied, in absence of EOF, micelles are moving toward the detector
passing through the sample zone and sweep the analyte. C) auxiliary pressure applied to
move the bulk solution toward the detector.
In this study, the anionic surfactant SDS was used, therefore negative polarity was applied
(the anode is at the detector end). With both ends of the capillary in vials containing BGE,
the separation voltage was applied and external pressure applied, immediately or with a
delay. Negatively charged micelles migrate in the electric field from inlet vial and pass
through the sample zone (Figure 2.5B). Analytes are carried toward the detector based on
Analyte with less affinity to micelle
Analyte with more affinity to micelle
Micelle
B `
``
lsweep
dsweep ddiff
PC
linj leffDetector
A

101
their interaction with micelles. The first peak belongs to the micelle marker that defines the
leading edge of the plug of the swept micelles. Peaks are narrowest immediately after
sweeping, and though there must be space for the analytes to be resolved through the RM-
EKC mechanism, the distance (ddiff) between the end of the sweeping zone (dsweep) and
detector window should minimized to avoid band broadening. With normal sweeping, the
injection zone (linj) is essentially stationary with micelles migrating toward the detector.
Whereas with the application of pressure the flow of the bulk solution, including sample
zone, is in the same direction as the micelles, toward the detector (Figure 2.5C). Under
ideal conditions maximum focusing can be observed when dsweep = leff , (dsweep, sweeping
zone and leff , effective length of capillary). When dsweep< leff , there is more time for
diffusion after completion of sweeping. With no auxiliary pressure was applied, we call the
distance between dsweep and effective length of capillary, leff the diffusion zone ddiff. When
pressure was applied dsweep and effective length of capillary, leff are unchanged, but ddiff
decreases. Since analysis time was proportional to the distance that the micelles must
travel, the analysis time was the sum the sweeping time (tsweep) and the diffusion time (tdiff).
Typically, the tsweep and tdiff depend on the k value of each analyte and the length of their
respective zones. For analytes with high k values, tdiff will be relatively short, but more
time in ddiff be necessary for resolution of analytes with similar k values, meaning the
longest ddiff was achieved when no pressure was applied. However, for compounds with
relatively low k values, tdiff was longer than necessary to resolve peaks and led to
unnecessary band broadening. If simultaneous analysis of compounds with a wide range of
k values is desirable, then the capillary cannot be physically shortened without sacrificing

102
separation of the more lipophilic compounds. Only through the application of pressure, can
the conditions be varied for separation of such different analytes, where the ddiff was
effectively shortened when pressure was applied, reducing the tdiff and time for analytes to
diffuse. Ideally the applied pressure should be adjustable with respect to magnitude and
time of application, allowing the user to balance distance necessary for separation of certain
analytes with minimization of the ddiff as needed.
It is possible that EOF can continue to play a role in these separations, thus the magnitude
of the EOF was measured according to Williams method [21]. The relevant linear velocities
under different conditions were measured by injecting sample under constant pressure and
recording the time when the sample peak was detected. BGE composition, auxiliary
pressure, and capillary size (length and internal diameter) were varied. Our results showed
that for fused silica capillary and acidic conditions (pH 1.9) EOF was present, though it
very low and variable. When external pressure was applied, the presence of the small EOF
was insignificant compared to the net flow.
2.3.4. Effect of Conductivity of Sample Matrix
A difference in conductivities for sample and BGE can have a substantial effect on peak
quality. This effect was investigated for pressure assisted sweeping-RM-ECK. A series of
buffered samples containing two nitrosamines with very different log P values (NPIP,
NPYR) were prepared with conductivities of 0.5 to 16.9 mS. The BGE was similar to those
used in the other experiments (100 mM SDS, 25 mM phosphate buffer adjusted to pH 1.9,
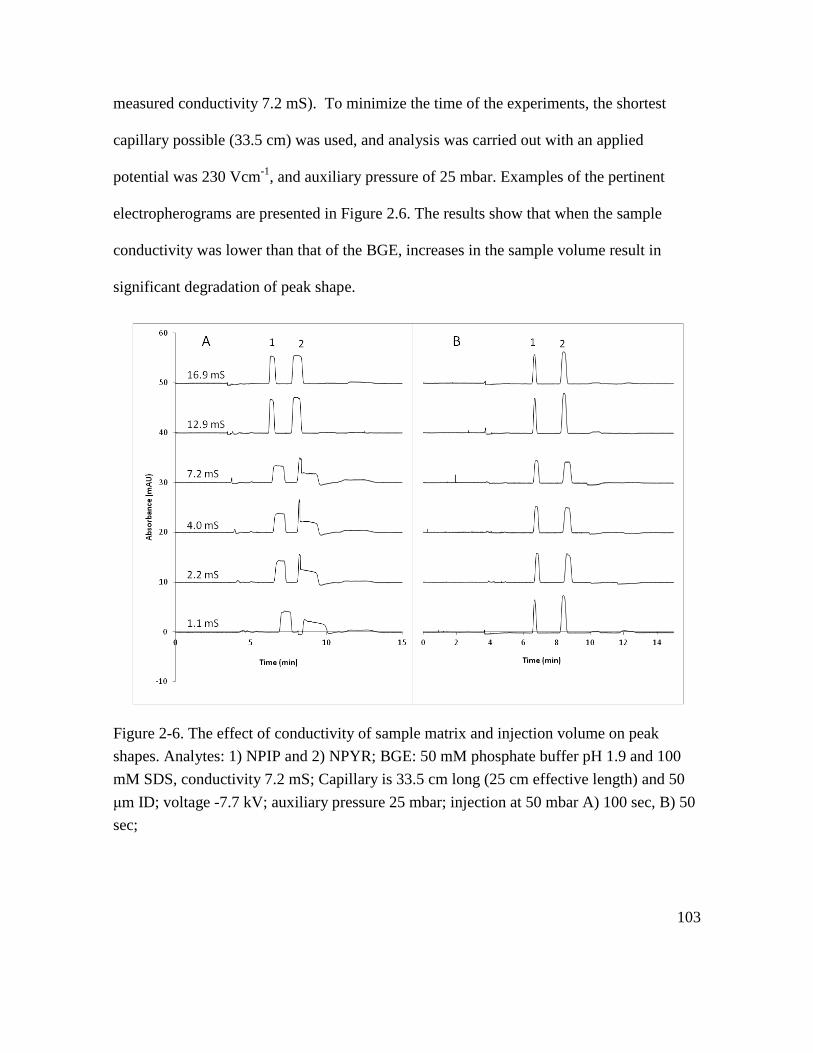
103
measured conductivity 7.2 mS). To minimize the time of the experiments, the shortest
capillary possible (33.5 cm) was used, and analysis was carried out with an applied
potential was 230 Vcm-1
, and auxiliary pressure of 25 mbar. Examples of the pertinent
electropherograms are presented in Figure 2.6. The results show that when the sample
conductivity was lower than that of the BGE, increases in the sample volume result in
significant degradation of peak shape.
Figure 2-6. The effect of conductivity of sample matrix and injection volume on peak
shapes. Analytes: 1) NPIP and 2) NPYR; BGE: 50 mM phosphate buffer pH 1.9 and 100
mM SDS, conductivity 7.2 mS; Capillary is 33.5 cm long (25 cm effective length) and 50
μm ID; voltage -7.7 kV; auxiliary pressure 25 mbar; injection at 50 mbar A) 100 sec, B) 50
sec;

104
This was contrary to what would be expected, where sharpening usually occurs for analytes
in matrices with lower conductivities than the BGE; usually due to the higher electric field
across the sample zone. Conversely, peak shapes improved when sample matrix
conductivity was the same or higher than BGE. The explanation for this has not been
investigated thoroughly, however higher conductivity is associated with higher ionic
strength, which can affect micelle dynamics (e.g. CMC) and the partition coefficients for
the analytes. When the injection volume was large (Figure 2.6A), the difference between
low conductivity and high conductivity matrix was profound, where much better focusing
was observed when the conductivity of sample matrix was higher than the BGE. This was
an interesting phenomenon and contrary to what is normally expected through the stacking
mechanism [22]. It can be very useful in instances when the sample matrix is highly saline,
e.g. sea water. This also implies that by increasing sample ionic strength, the injection
volume could be increased without losing good peak characteristics.
2.3.5. Effect of Surfactant Concentration in BGE
Experiments were performed to assess the effect of the BGE SDS concentration on peak
width and peak height using the same conditions as described in section 3.4 and a range of
concentrations of SDS (50 mM-300 mM).. Increasing the concentration of SDS up to 200
mM increased the peak height and decreased the peak width, while further increases in
surfactant concentrations had a negative impact on peak height and area for the analytes
with large k, such as NDBA.
105
2.3.6. Evaluation of the Performance
Calibration curves were generated for selected nitrosamines using pressure assisted
sweeping RM-EKC, and the performance of the method was evaluated for the traditional
analytical figures of merit and compared to results using MEKC. Points in the calibration
curves cover two orders of magnitude and are the average of peak areas from three
sequential injections. Samples were injected hydrodynamically, for MEKC 50 mbar for 2
s, and sweeping-RM-EKC, 50 mbar for 100 s. The LODs reported are based on three times
the standard deviation of the intercept-to-slope ratio, and LOQs are calculated as ten times
standard deviation of the same ratio. Key data from these analyses are shown in Table 2.2.
In all cases sweeping leads to lower detection limits, where improvements in concentration
efficiency result in more concentrated sample zones with larger signals. It was only when
the data from this large number of experiments was being processed. It was noticed that
analytes with higher log P, such as NDBA, showed lower signals when pressure was
applied at the same time as the potential (as discussed earlier in this chapter).
The decision was made not to repeat these experiments with the delayed pressure protocol,
as compounds like NDBA, and to a limited extent NDPA, do not usually suffer from the
problems in sweeping that have been tried to address in this work. No doubt, the LODs
would be improved by using the delayed pressure; in future work these will be reported
accordingly. As can be seen in Table 2.2, improvements of up to 34 times in LOD were
achieved. The R2 values of sweeping-MEKC show better linearity over concentration
range 0.05- 6.25 mg L-1
. This means that sub-mgL-1
detection was possible using online
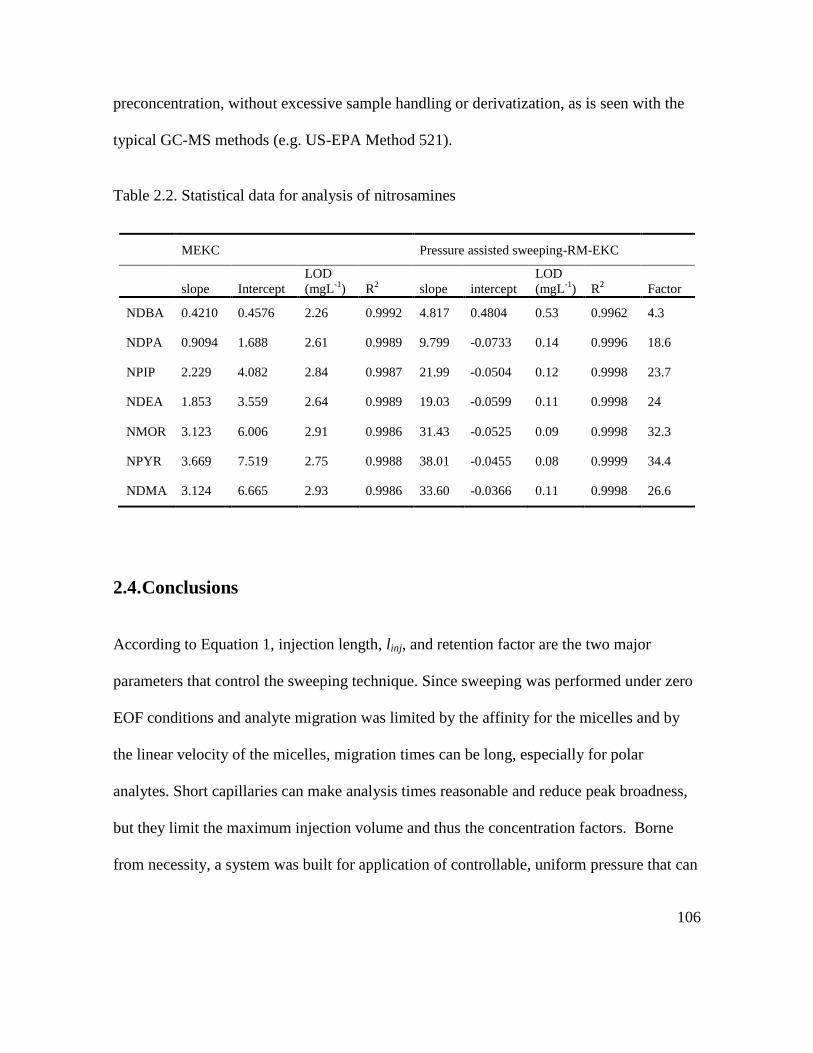
106
preconcentration, without excessive sample handling or derivatization, as is seen with the
typical GC-MS methods (e.g. US-EPA Method 521).
Table 2.2. Statistical data for analysis of nitrosamines
MEKC Pressure assisted sweeping-RM-EKC
slope Intercept
LOD
(mgL-1
) R2
slope intercept
LOD
(mgL-1
) R2
Factor
NDBA 0.4210 0.4576 2.26 0.9992 4.817 0.4804 0.53 0.9962 4.3
NDPA 0.9094 1.688 2.61 0.9989 9.799 -0.0733 0.14 0.9996 18.6
NPIP 2.229 4.082 2.84 0.9987 21.99 -0.0504 0.12 0.9998 23.7
NDEA 1.853 3.559 2.64 0.9989 19.03 -0.0599 0.11 0.9998 24
NMOR 3.123 6.006 2.91 0.9986 31.43 -0.0525 0.09 0.9998 32.3
NPYR 3.669 7.519 2.75 0.9988 38.01 -0.0455 0.08 0.9999 34.4
NDMA 3.124 6.665 2.93 0.9986 33.60 -0.0366 0.11 0.9998 26.6
2.4. Conclusions
According to Equation 1, injection length, linj, and retention factor are the two major
parameters that control the sweeping technique. Since sweeping was performed under zero
EOF conditions and analyte migration was limited by the affinity for the micelles and by
the linear velocity of the micelles, migration times can be long, especially for polar
analytes. Short capillaries can make analysis times reasonable and reduce peak broadness,
but they limit the maximum injection volume and thus the concentration factors. Borne
from necessity, a system was built for application of controllable, uniform pressure that can

107
be easily integrated into a commercial CE system. The upper limit for fine control regulator
used here was 100 mbar; different regulator configurations can allow for higher pressure
control. It has been demonstrated that by using an external auxiliary pressure device,
analysis times can be reduced without compromising separation efficiency allowing for use
of longer capillaries to accommodate larger sample volumes. It was also shown that there
was a significant effect on peak shapes and separation efficiency when the conductivity of
sample solution was different than BGE. Separation results were best when a high
conductivity sample was paired with a BGE of lower conductivity; e.g., if sample salinity
was high, large volumes of sample could be injected without compromising the separation.
Using higher surfactant concentrations (up to 200 mM SDS) than usual for MEKC (50 mM
SDS) improved the sweeping, but increasing beyond optimal values led to signal loss for
many analytes. It was shown that by optimizing all parameters that influence sweeping-
RM-EKC (e.g., surfactant loading and type, application of pressure, changes to composition
of sample, etc.), good online preconcentration methods can be developed for polar analytes
that are typically are poorly suited for normal sweeping.

108
2.5. References:
[1] Modir-Rousta, A., Bottaro, C. S., Electrophoresis 2013, 34, 2553-2560.
[2] Ban, E., Park, S. H., Kang, M. J., Lee, H. J., Song, E. J., Yoo, Y. S., Electrophoresis
2012, 33, 2-13.
[3] Britz-McKibbin, P., Methods Mol Biol 2011, 708, 229-246.
[4] Cortes, D. F., Kabulski, J. L., Lazar, A. C., Lazar, I. M., Electrophoresis 2011, 32, 14-
29.
[5] Rose, C. M., Hayes, M. J., Stettler, G. R., Hickey, S. F., Axelrod, T. M., Giustini, N. P.,
Suljak, S. W., Analyst 2010, 135, 2945-2951.
[6] Desiderio, C., Rossetti, D. V., Iavarone, F., Messana, I., Castagnola, M., J Pharm
Biomed Anal 2010, 53, 1161-1169.
[7] Knudsen, C. B., Beattie, J. H., J Chromatogr A 1997, 792, 463-473.
[8] Nishi, H., Tsumagari, N., Kakimoto, T., Terabe, S., J Chromatogr 1989, 477, 259-270.
[9] Nishi, H., Tsumagari, N., Kakimoto, T., Terabe, S., J Chromatogr 1989, 465, 331-343.
[10] Cao, J., Li, B., Chang, Y. X., Li, P., Electrophoresis 2009, 30, 1372-1379.
[11] Cao, J., Yi, L., Li, P., Chang, Y. X., J Chromatogr A 2009, 1216, 5608-5613.

109
[12] Monton, M. R., Quirino, J. P., Otsuka, K., Terabe, S., J Chromatogr A 2001, 939, 99-
108.
[13] Haidian, Z., Journal of the National Cancer Institute 1968, 41.
[14] Quirino, J. P., Terabe, S., J Chromatogr A 1999, 850, 339-344.
[15] Quirino, J. P., Otsuka, K., Terabe, S., J Chromatogr B Biomed Sci Appl 1998, 714, 29-
38.
[16] Quirino, J. P., Terabe, S., Analytical Chemistry 1999, 71, 1638-1644.
[17] Giordano, B. C., Horsman, K. M., Burgi, D. S., Ferrance, J. P., Landers, J. P.,
Electrophoresis 2006, 27, 1355-1362.
[18] Sera, Y., Matsubara, N., Otsuka, K., Terabe, S., Electrophoresis 2001, 22, 3509-3513.
[19] Musheev, M. U., Javaherian, S., Okhonin, V., Krylov, S. N., Analytical Chemistry
2008, 80, 6752-6757.
[20] Evenhuis, C. J., Musheev, M. U., Krylov, S. N., Analytical Chemistry 2011, 83, 1808-
1814.
[21] Williams, B. A., Vigh, G., Anal Chem 1996, 68, 1174-1180.
[22] Guillaume L. Erny, A. C., Analytical Chemistry 2006, 78.

110
Chapter 3 New Pressure Assisted Sweeping Online Preconcentration
for Highly Polar Environmentally-Relevant Nitrosamines: Part 2.
Cationic and Anionic Surfactants with Zero-Flow Capillaries [1].

111
3.1. Introduction
Capillary electrophoresis is a powerful separation method, offering applications for an
impressive array of compounds from small organic and inorganic ions [2] to more complex
systems like proteins [3] and DNA [4]. However, small sample volumes (e.g., 2–10 nL) and
short optical path lengths (e.g., 25–100 μm) limit trace level detection, particularly by UV-
Vis detection. Several on-line preconcentration methods have been developed to overcome
this drawback; for neutral compounds with no inherent electrokinetic mobility, this can be
accomplished using sweeping preconcentration with separation by electrokinetic
chromatography (EKC) [5],[6]. Such methods (e.g., sweeping-RM-EKC) rely on the
interaction between analyte and micellar phase for preconcentration and separation.
In sweeping preconcentration, a large volume of sample can be swept by migrating micelles
and analytes with a high affinity for the micellar phase will be concentrated in a narrow
segment at the leading edge of a zone rich in surfactant. Quirino and Terabe [7] have
introduced a mechanism for sweeping that has been defined by the following equation:
3-1
The minimum length of the capillary occupied by enriched analyte and micelles following
sweeping, lsweep, is related to the length of the injected sample zone (linj) and the retention
factor (k). Under fixed conditions, the peak width for any analyte is indirectly proportional
to k and sweeping is most effective for analytes with large k. Polar analytes with low k
show less focusing and consequently less improvement in signal-to-noise. Similarly, these

112
polar compounds also show poorer recoveries using offline methods like solid phase
extraction. Although sweeping is inherently less efficient for focusing of very polar
analytes like nitrosamines, it is superior to off-line preconcentration since sample handling
is minimized and outright loss of analytes is eliminated. Furthermore, the relatively weak
affinity of small polar neutral compounds (e.g. nitrosamines) for the micellar phase can be
in part mitigated by careful selection of the surfactant phase and by using high
concentrations of the surfactant to optimize sweeping preconcentration and separation. This
is illustrated in the following expression of the retention factor given in terms of the
partition coefficient (K) and the phase ratio (φ):
3-2
Where moles of the analyte in the aqueous phase is naq and in the micellar phase is nmc; cmc
is the concentration of the solute in the micellar phase and caq is the concentration of solute
in the aqueous phase [8-9].
Selection of the micellar phase is complicated by the lack of data (k or K) for nitrosamines
in any surfactant system. And although there are a number of ways to measure K or k (e.g.
two phase solvent-solvent extraction, chromatography) [10] including CE-based
techniques, it is not practical to test all surfactant systems amenable to MEKC. To ensure
that surfactants with a broad range of characteristics that influence k are chosen, one can
look to linear solvation energy relationships (LSER) studies, which express k as a sum of
interactions between the solute and micellar phase. Properties such as ability to act as a

113
hydrogen bond donor/acceptor (acidity/basicity), effort required form a cavity in the buffer
or micellar phase for the solute [11] and various factors that influence the descriptors, as
such, the effects of surfactant chain length [12], head-group [13], and counter ion [14] on
the intermolecular interactions controlling retention have been studied. Fuguet et al. [15]
used principle component analysis on published data for a large selection of micellar
systems (single and mixed surfactants) to determine which system parameters were the
most important in assessing the selectivity of the micellar phase. Fuguet’s results confirm
that hydrophobicity and ability to participate in hydrogen bond formation account for most
of the differences in selectivity of surfactants. This information has guided the choice of
surfactants for this work. The anionic surfactant SDS is an obvious candidate as it is the
most common surfactant used in MEKC [16-18] and provides the benchmark by which the
others are judged. The ammonium salt of perfluorooctanoic acid (APFO) was chosen
because fluorinated anionic surfactants have been shown to exhibit unique characteristics
when evaluated by LSER [15] and are compatible with ESI-MS [19]. The anionic
surfactant bile salts (cholic acid-deoxycholic acid sodium salt) was selected for the ability
to act as a good hydrogen bond donor [16, 18]. Cetyltrimethylammonium bromide (CTAB)
and cetyltrimethylammonium chloride (CTAC) are two salts of the same cationic surfactant
with a positively charged quaternary amine head and a relatively long hydrophobic chain
(C16). The influence of the counter ion makes CTAC more soluble than CTAB, but in both
cases the surfactant acts as a good hydrogen bond donor [18].
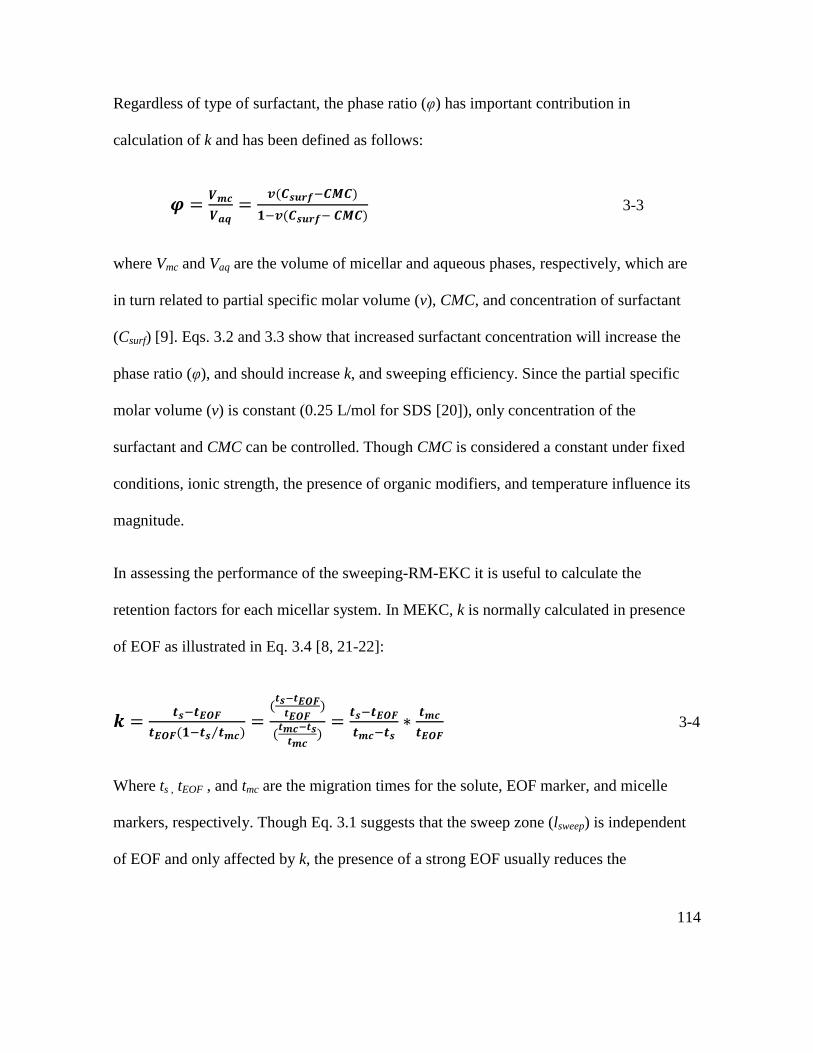
114
Regardless of type of surfactant, the phase ratio (φ) has important contribution in
calculation of k and has been defined as follows:
3-3
where Vmc and Vaq are the volume of micellar and aqueous phases, respectively, which are
in turn related to partial specific molar volume (v), CMC, and concentration of surfactant
(Csurf) [9]. Eqs. 3.2 and 3.3 show that increased surfactant concentration will increase the
phase ratio (φ), and should increase k, and sweeping efficiency. Since the partial specific
molar volume (v) is constant (0.25 L/mol for SDS [20]), only concentration of the
surfactant and CMC can be controlled. Though CMC is considered a constant under fixed
conditions, ionic strength, the presence of organic modifiers, and temperature influence its
magnitude.
In assessing the performance of the sweeping-RM-EKC it is useful to calculate the
retention factors for each micellar system. In MEKC, k is normally calculated in presence
of EOF as illustrated in Eq. 3.4 [8, 21-22]:
3-4
Where ts , tEOF , and tmc are the migration times for the solute, EOF marker, and micelle
markers, respectively. Though Eq. 3.1 suggests that the sweep zone (lsweep) is independent
of EOF and only affected by k, the presence of a strong EOF usually reduces the

115
enrichment efficiency [6]. Thus, sweeping of neutral compounds is usually carried out
under reduced or no EOF, and analyte migration toward the detector relies on association
with an electrophoretically mobile micellar phase to lend mobility to the analytes. In this
case, the system and calculations are simplified, and the system described is analogous to
normal phase chromatography with a polar pseudostationary phase and a more hydrophobic
micellar mobile phase (Eq. 3.5, where tR is the migration time of analyte and tmc is the
migration time of a marker with highest interaction with the micellar phase). A similar
observation was made in 1996 by Janini et al. [23-24].
3-5
Since, slow moving micelles and low affinity of the analyte for the micellar phase leads to
long analysis times and excessive band broadening of very polar compounds [8], a
sweeping preconcentration RM-EKC was modified to use auxiliary pressure to achieve
faster analyses without compromising the sweeping efficiency and resolution [25].This
chapter follows the previous chapter in a series of studies on the method, and is primarily
focused on the role of surfactants and their interactions with the target analytes. Seven N-
nitrosamines have been selected for this study (see Figure 1.1): N-nitrosodimethylamine
(NDMA), N-nitrosomorpholine (NMOR), N-nitrosopyrrolidine (NPYR), N-
nitrosodiethylamine (NDEA), N-nitrosopiperidine (NPIP), N-nitrosodipropylamine
(NDPA), N-nitrosodibutylamine (NDBA). These are of interest analytically as they are

116
relatively difficult to analyze at environmentally relevant concentrations, particularly by
CE, and are important contaminants due to their potential as human carcinogens [26].
3.2. Material and Methods
3.2.1. Apparatus
All electrochromatograms were obtained using an Agilent 3D 1600 CE system with Agilent
ChemStation software, (Waldbronn, Germany). Capillaries used in this work included
polyimide coated fused silica capillaries of 50 µm and 75 µm, and Zero-EOF and
Controlled-EOF capillaries of 50 and 75 100 µm ID obtained from MicroSolv (Eatontown,
USA). Zero-EOF capillaries were coated (bonded) with linear polyacrylamide (LPA),
which eliminates EOF. Polyethylene glycol (PEG) coated and polyacrylamide (PAAm)
coated capillaries of 75 µm were obtained from Sepax Technologies (Delaware USA).
Capillaries were conditioned as recommended by manufacturers before first use and
conditioned prior to use daily. All CE experiments were carried out at a constant 25°C.
Absorbance was measured at 230 nm to 240 nm for N-nitrosamines and at 210 nm for the
EOF marker (DMSO) and micelle marker, N-nitrosodiphenylamine (NDPhA).
3.2.2. Materials
Standard solutions of 2000 mg L-1
of NDMA, NPYR, NMOR, NDEA, NPIP, NDPA,
NDBA, and NDPhA were purchased from Supelco (Ontario, Canada). Stock solutions at
concentration of 1000 mg L-1
in methanol were prepared from standard solutions and stored
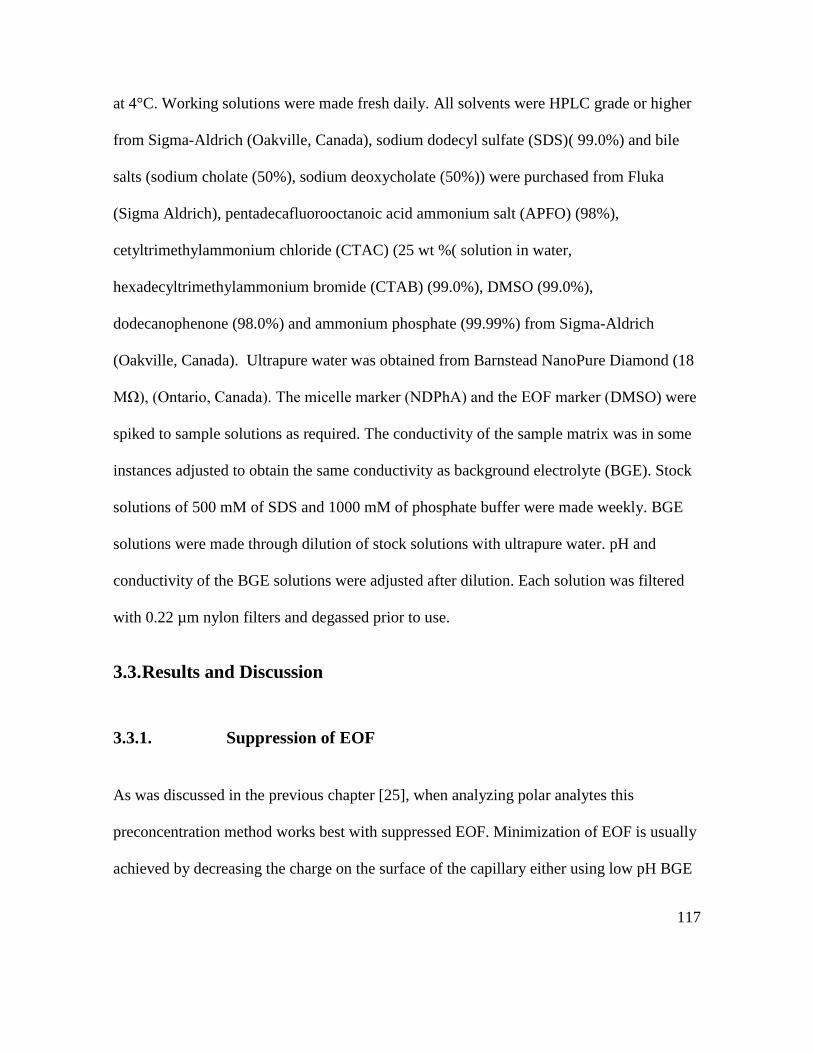
117
at 4°C. Working solutions were made fresh daily. All solvents were HPLC grade or higher
from Sigma-Aldrich (Oakville, Canada), sodium dodecyl sulfate (SDS)( 99.0%) and bile
salts (sodium cholate (50%), sodium deoxycholate (50%)) were purchased from Fluka
(Sigma Aldrich), pentadecafluorooctanoic acid ammonium salt (APFO) (98%),
cetyltrimethylammonium chloride (CTAC) (25 wt %( solution in water,
hexadecyltrimethylammonium bromide (CTAB) (99.0%), DMSO (99.0%),
dodecanophenone (98.0%) and ammonium phosphate (99.99%) from Sigma-Aldrich
(Oakville, Canada). Ultrapure water was obtained from Barnstead NanoPure Diamond (18
MΩ), (Ontario, Canada). The micelle marker (NDPhA) and the EOF marker (DMSO) were
spiked to sample solutions as required. The conductivity of the sample matrix was in some
instances adjusted to obtain the same conductivity as background electrolyte (BGE). Stock
solutions of 500 mM of SDS and 1000 mM of phosphate buffer were made weekly. BGE
solutions were made through dilution of stock solutions with ultrapure water. pH and
conductivity of the BGE solutions were adjusted after dilution. Each solution was filtered
with 0.22 µm nylon filters and degassed prior to use.
3.3. Results and Discussion
3.3.1. Suppression of EOF
As was discussed in the previous chapter [25], when analyzing polar analytes this
preconcentration method works best with suppressed EOF. Minimization of EOF is usually
achieved by decreasing the charge on the surface of the capillary either using low pH BGE

118
or coated controlled flow capillaries. To assess the efficacy of EOF suppression, a series of
MEKC experiments were conducted using various combinations of pH (acidic and neutral,
1.9 and 7.4) and polarity (+/-) for cationic (CTAC) and anionic (SDS) surfactants in fused
silica capillaries (Table 3.1). Given that analytes only reach the detector when the mobility
toward the detector exceeds opposing forces, there were only four combinations that
allowed for analyte detection and of these only the anionic surfactants in acidic buffer with
negative polarity met the requirements for efficient sweeping.
Table 3.1. Assessment of suitability of various combinations of micellar phase, pH and
polarity for sweeping in fused silica capillary
Surfactant type
a
pH of BGE
Polarityb EOF
Micelle
migration
Net migration
c Peak
Observed Suitable
for sweeping
Anionic 1.9 + no no
Anionic 1.9 - yes yes
Anionic 7.4 + yes no
Anionic 7.4 - no no
Cationic 1.9 + no no
Cationic 1.9 - yes no
Cationic 7.4 + no no
Cationic 7.4 - yes no
a- Anionic surfactant SDS and cationic surfactant CTAC
b- + polarity when detector side is at the cathode end
c- Right arrow is toward the detector, and the left arrow is toward the inlet (injector) and
length of each arrow indicates relative magnitude of mobility
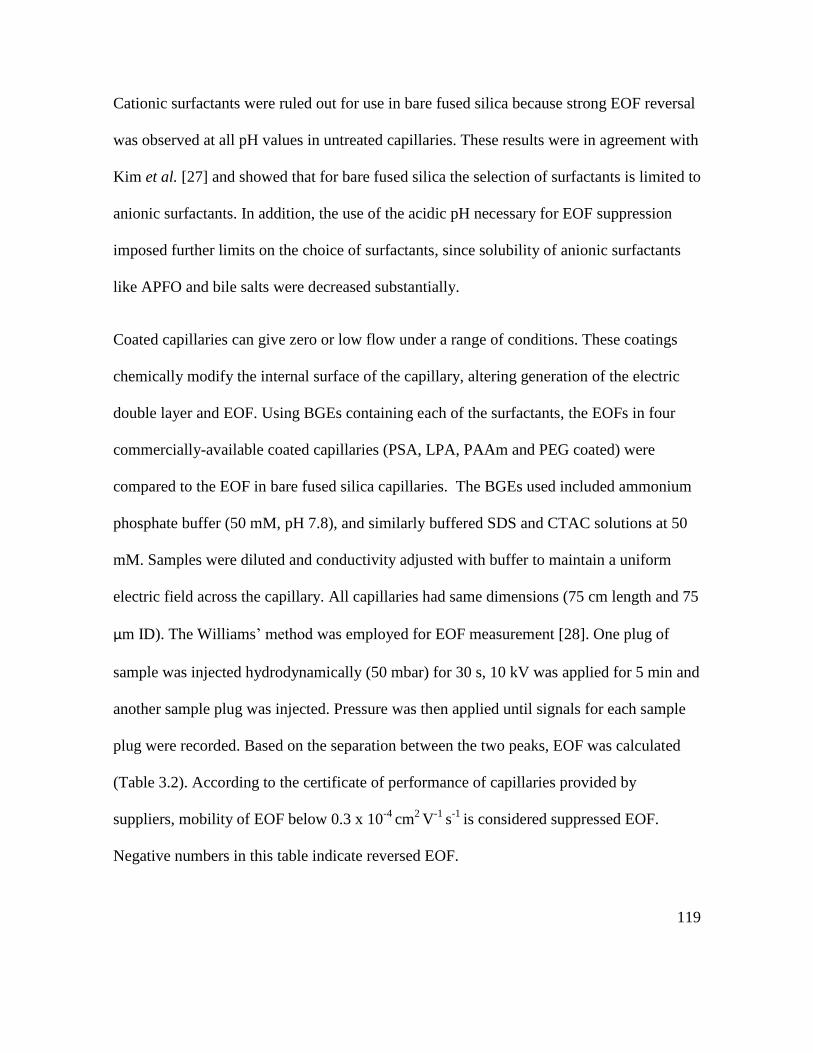
119
Cationic surfactants were ruled out for use in bare fused silica because strong EOF reversal
was observed at all pH values in untreated capillaries. These results were in agreement with
Kim et al. [27] and showed that for bare fused silica the selection of surfactants is limited to
anionic surfactants. In addition, the use of the acidic pH necessary for EOF suppression
imposed further limits on the choice of surfactants, since solubility of anionic surfactants
like APFO and bile salts were decreased substantially.
Coated capillaries can give zero or low flow under a range of conditions. These coatings
chemically modify the internal surface of the capillary, altering generation of the electric
double layer and EOF. Using BGEs containing each of the surfactants, the EOFs in four
commercially-available coated capillaries (PSA, LPA, PAAm and PEG coated) were
compared to the EOF in bare fused silica capillaries. The BGEs used included ammonium
phosphate buffer (50 mM, pH 7.8), and similarly buffered SDS and CTAC solutions at 50
mM. Samples were diluted and conductivity adjusted with buffer to maintain a uniform
electric field across the capillary. All capillaries had same dimensions (75 cm length and 75
μm ID). The Williams’ method was employed for EOF measurement [28]. One plug of
sample was injected hydrodynamically (50 mbar) for 30 s, 10 kV was applied for 5 min and
another sample plug was injected. Pressure was then applied until signals for each sample
plug were recorded. Based on the separation between the two peaks, EOF was calculated
(Table 3.2). According to the certificate of performance of capillaries provided by
suppliers, mobility of EOF below 0.3 x 10⁻⁴
cm2 V
-1 s
-1 is considered suppressed EOF.
Negative numbers in this table indicate reversed EOF.

120
In fused silica capillaries, the use of the cationic surfactant led to reversed EOF that was 4
times higher than seen with the buffer only. With SDS, the direction of the EOF was
unchanged, but the magnitude was increased substantially (>200%). Generally, coated
capillaries designed to reduce EOF were effective in the absence of surfactants, though only
PSA fully eliminated EOF. Both PSA and LPA were effective for use with the surfactants,
and worked especially well with SDS (no EOF detected). The LPA capillary was more
effective with SDS than with simple buffer solution. The PAAm and PEG coated
capillaries were unable to suppress the EOF when surfactants were used; furthermore EOF
was substantially higher than that measured in fused silica with buffer only. This was
evidence of significant interactions between the coatings and surfactants, which were
strongest for cationic surfactants. One other important conclusion can be drawn from these
results, and that was in general, modification of the capillary surface by surfactants
significantly improved the reproducibility of migration times in MEKC (see Table 3.2,
RSD in brackets).
Table 3.2. Effect of surfactants on EOF in capillaries with bonded phases.
Mobility of EOF μEOF x10
-4 cm
2 V
-1 s
-1 (RSD)
Capillary Buffer Buffer+SDS Buffer+CTAC
Fused silica 1.0 (21.6) 3.3 (1.4) -4.0 (0.1)
PSA ND ND -0.1 (5.7)
LPA -0.6 (14.8) ND -0.4 (66.1)
PAAm -0.2 (33.5) 2.8 (0.6) -1.5 (2.2)
PEG -0.1 (115) 2.6 (2.4) -1.3 (1.0)
ND – Not detected

121
3.3.2. Optimization of Conditions with Regards to Surfactants
3.3.2.1. Critical micelle concentration (CMC)
CMC contributes to the phase ratio component of the retention factor (Eq. 3.3) and there
are several factors influence the CMC of surfactants including ionic strength, organic
solvents, and temperature. To study the effect of ionic strength, CMCs of each surfactant in
buffer at a range of concentrations (phosphate buffer 0-50 mM at pH 7.4) were measured at
25 ⁰C using the conductivity method [29] (Table 3.3). Predictably, the CMC decreased as
ionic strength of solution increased for the anionic surfactants. For the cationic surfactants
CTAC and CTAB, CMCs were low even with no additional electrolyte. Increased
electrolyte concentration led to only minor decreases for CTAB, and a small increase in
CTAC.
Table 3.3. Effect of ionic strength of solution on CMCa
Surfactant
CMC (mM) ± %RSD
0 mM 12.5 mM 25 mM 50 mM
SDS 4.1 ± 0.2 3.4 ±0.2 2.6 ±0.2 1.8 ±0.1
APFO 25.1 ± 0.6 24.3 ±0.5 23.8 ±0.5 22.4 ±0.6
Bile salt 14.2 ± 0.5 13.3 ±0.4 12.9 ±0.2 12.3 ±0.2
CTAB 0.9 ± 0.1 0.9 ±0.1 0.8 ±0.1 0.6 ±0.1
CTAC 1.5 ± 0.1 2.2 ±0.1 2.0 ±0.1 1.9 ±0.1
a- experiments conditions: Phosphate buffer pH=7.4 at 25 ⁰C. each experiment
repeated three times

122
Since CTA compounds have longer hydrophobic tails than the other surfactants studied and
tend to have relatively strong associations with their counter anions (bromide and chloride)
in the solvation sphere, barriers to micelle formation are diminished, which can explain the
lower CMC. Since the fractional charge on these micelles is already low, the impact of
increased electrolyte concentration is not as significant.
3.3.2.2. Concentration of surfactants
To examine the effect of surfactant concentration on pressure assisted-sweeping, SDS as a
representative surfactant was used (50 mM to 300 mM in 25 mM phosphate buffer at pH
1.9 in fused silica capillary) and electrochromatograms are presented in Figure 3.1. Peak
width decreased with increasing SDS concentration, but for analytes with large logP the
change in peak width at concentrations above 200 mM was minimal (See Figure 3.2). For
these analytes (e.g. NDPA and NDBA), the peaks were already very narrow and retention
and sweeping was fairly efficient. The narrowing was most profound for compounds with
small log P, which are also the compounds for which sweeping tends to be least efficient. In
a previous chapter it has been shown that increase in concentration of surfactant results in
better separation and enrichment [25], however; the ionic strength of the BGE increased
with concentration of ionic surfactants, which led to undesirable Joule heating and put a
practical limitation on the concentration of surfactant that was lower than the limit of
solubility. In this study, concentrations of surfactants were increased while the conductivity
and current level were monitored to ensure the power never exceeded 1 W. By using longer

123
conditioning times for capillaries and employing lower temperature (20 ⁰C) the effect of
Joule heating was minimized. As a result, the reproducibility and peak characteristics were
acceptable. Results obtained using coated capillaries were better than those with bare fused
silica capillaries.
Figure 3-1. Effect of concentration of SDS on peak shape in sweeping-RM-EKC. BGE: 50-
300 mM of SDS in 25 mM phosphate buffer (pH 7.8), capillary: PSA coated 75μm ID and
33.5 cm, potential: +180Vcm-1
, injection: 100 mbar.s.
0 2 4 6 8 10 12 14 16 18 20
Time (min)
34
5 6 7
7
7
7
6,7
6
6
65
5
5
5
4
4
4
4
3
3
3
3
21
2
2
2
2
1
1
1
1
1) NDBA2) NDPA3) NPIP4) NDEA5) NPYR6) NMOR7) NDMA
SDS Concentration:a) 50mMb) 100 mMc) 200 mMd) 250 mMe) 300 mM
a
b
c
d
e

124
Figure 3-2. Effect of concentration of SDS on peak width in MEKC. CE condition: fused
silica capillary with 98.5 cm length and 50 μm diameter, ID, electric field 230 Vcm-1
,
hydrodynamic injection (50 s at 50 mbar), auxiliary pressure 70 mbar, BGE: 25 mM of
phosphate buffer at pH 1.9 and 50-300 mM of SDS. Sample is a mixture of seven
nitrosamines in buffer solution with same conductivity as BGE.
To ascertain the ideal surfactant concentrations for this work, a series of BGEs in a low
buffer concentration (25 mM phosphate buffer, pH 7.4) and a range of surfactant
concentrations (25 mM to 300 mM) were used in conventional MEKC experiments to
determine k according to Eq. 3.4. The results are presented in Table 3.4. Due to the lower
solubility of CTAB (less than 50 mM) no data were reported. For surfactants with high
CMCs, such as bile salts and APFO, analytes co-migrated at low concentrations of
surfactant and no data were reported. High retention factors demonstrate that the analyte

125
have a strong association with the micellar phase and should afford the best enrichment
factors. The k values from MEKC were also suitable for pre-determination of suitability to
resolve closely migrating pairs.
Although increasing the concentration (which increases phase ratio) of the surfactant
should increase retention and enhance differences in retention behavior, this effect is not
always predictable. The relationship between k and phase ratio was tends to be non-linear,
resulting from a change in the micelle (i.e. size, shape, fractional charge, etc.) and
consequently a change in the partitioning of the analyte between the bulk and stationary
phases (i.e., K). Using the migration of the NDEA and NPIP as an example, the k values
(Table 3.4) that these two compounds are baseline resolved or nearly baseline resolved in
all cases except when using APFO, regardless of concentration. With both SDS and CTAC,
increases in surfactant concentration result in significant improvements in retention and
resolution. Increases in the concentration of bile salts from 100 to 200 mM yielded only
incremental improvements for NPIP and no improvement for NDEA. As the concentration
of the bile salts was increased to 300 mM, all k values increase, but the effect for the cyclic
NPIP was more pronounced. The bile salts showed different trends than the other
surfactants for the five most polar nitrosamines, with little practical use at concentrations
below 100 mM and no improvement in retention behavior at higher concentrations for
NDMA, NMOR and NPYR.

126
Table 3.4. MEKC-based estimation of k for nitrosamines with different PSPsa
SDS
Bile salts
25 mM 50 mM 100 mM 200 mM 300 mM
25 mM 50 mM 100 mM 200
mM 300 mM
NDMA 0.05 0.23 0.26 0.41 0.62
0.14 0.05 0.07
NMOR 0.08 0.30 0.37 0.58 0.92
0.18 0.10 0.14
NPYR 0.11 0.43 0.60 0.92 1.54
0.21 0.15 0.21
NDEA 0.15 0.67 0.97 1.49 2.65
0.27 0.25 0.38
NPIP 0.24 1.03 1.61 2.38 4.63
0.12 0.32 0.35 0.53
NDPA 0.74 3.15 6.47 7.63 27.14
0.28 0.63 0.91 1.41
NDBA 6.15 36.83 46.41 82.99 122.76
1.42 3.39 6.15 9.19
APFO
CTAC
NDMA
0.08 0.19 0.33
0.09 0.09 0.15
NMOR
0.12 0.29 0.55
0.09 0.15 0.20 0.31
NPYR
0.28 0.47 1.28
0.08 0.12 0.19 0.27 0.42
NDEA
0.55 1.04 2.46
0.21 0.30 0.44 0.75 1.10
NPIP
0.55 1.06 2.48
0.24 0.40 0.68 1.18 1.73
NDPA
2.32 4.58 8.90
0.78 1.46 2.65 4.75 6.87
NDBA
30.81 43.07 57.25
5.25 10.89 20.54 32.41 46.00
a-MEKC conditions: BGE: phosphate buffer 25 mM, pH 7.8 and surfactants 25 mM-300 mM, potential: 230 Vcm-1
(in positive
mode, except for CTAC), injection: 100 mbar.sec, sample: mixture of seven nitrosamines (~20 µg mL-1
), EOF and micelle
markers, capillary: fused silica 50 μm ID, 56 cm effective length.
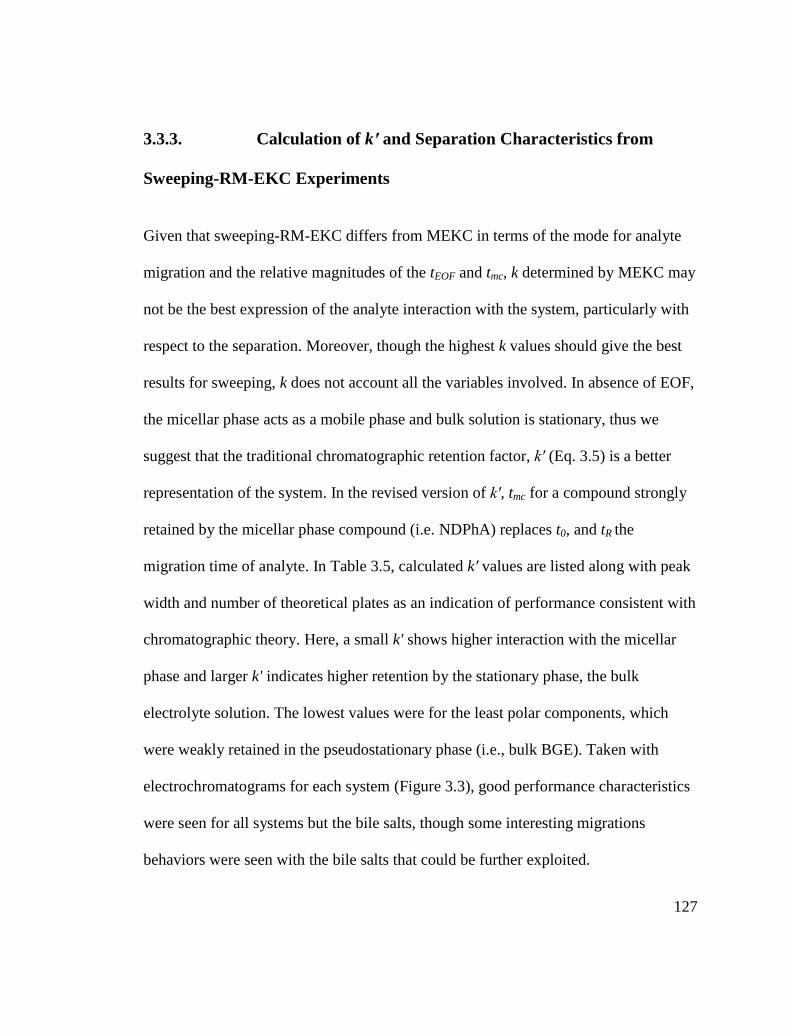
127
3.3.3. Calculation of k′ and Separation Characteristics from
Sweeping-RM-EKC Experiments
Given that sweeping-RM-EKC differs from MEKC in terms of the mode for analyte
migration and the relative magnitudes of the tEOF and tmc, k determined by MEKC may
not be the best expression of the analyte interaction with the system, particularly with
respect to the separation. Moreover, though the highest k values should give the best
results for sweeping, k does not account all the variables involved. In absence of EOF,
the micellar phase acts as a mobile phase and bulk solution is stationary, thus we
suggest that the traditional chromatographic retention factor, k′ (Eq. 3.5) is a better
representation of the system. In the revised version of k′, tmc for a compound strongly
retained by the micellar phase compound (i.e. NDPhA) replaces t0, and tR the
migration time of analyte. In Table 3.5, calculated k′ values are listed along with peak
width and number of theoretical plates as an indication of performance consistent with
chromatographic theory. Here, a small k' shows higher interaction with the micellar
phase and larger k' indicates higher retention by the stationary phase, the bulk
electrolyte solution. The lowest values were for the least polar components, which
were weakly retained in the pseudostationary phase (i.e., bulk BGE). Taken with
electrochromatograms for each system (Figure 3.3), good performance characteristics
were seen for all systems but the bile salts, though some interesting migrations
behaviors were seen with the bile salts that could be further exploited.

128
Figure 3-3. Comparison of the selectivity and peak shapes in sweeping-RM-EKCSDS,
CTAC, bile salts and APFO, BGE: 200 mM surfactant in 25 mM phosphate buffer
(pH 7.0) capillary: PSA coated 50 μm ID and 34 cm length, potential: 180 V/cm,
injection: 250 mbar.s and 5 mbar external pressure. Sample: mixture of seven
nitrosamines at concentration of 10 mg L-1
Peak widths and theoretical plate numbers for the four surfactant systems are
comparable, the exception being results for APFO, which were outstanding even
though NPIP and NDEA were not resolved - as was the case in the MEKC studies.
APFO is unique among the surfactant systems given that the perfluorinated tail is
neither hydrophilic nor lipophilic; here it can be concluded that the associations with
APFO * 1
2
3,4
5
6 7
CTAC*
1
23 4
56
7
*
12
36
5
74
Bile
0 5 10 15 20 25
* 12
3
45
6 7SDS
* Marker1) NDBA2) NDPA3) NPIP4) NDEA5) NPYR6) NMOR7) NDMA

129
the nitrosamines were primarily through hydrogen-bond type interactions with the
head-group.
If nonpolar interactions between the nitrosamines and the hydrophobic surfactant tail
(micelle core) were significant, nitrosamines would interact more weakly with the
aqueous BGE in the presence of CTAC (C16) than SDS (C12). This was contrary to
the data which shows lower k′ values for SDS. This confirms the idea that interactions
with the head group dominate with small polar compounds like nitrosamines under
these conditions, even for nitrosamines with significant hydrophobic character such as
NDBA.
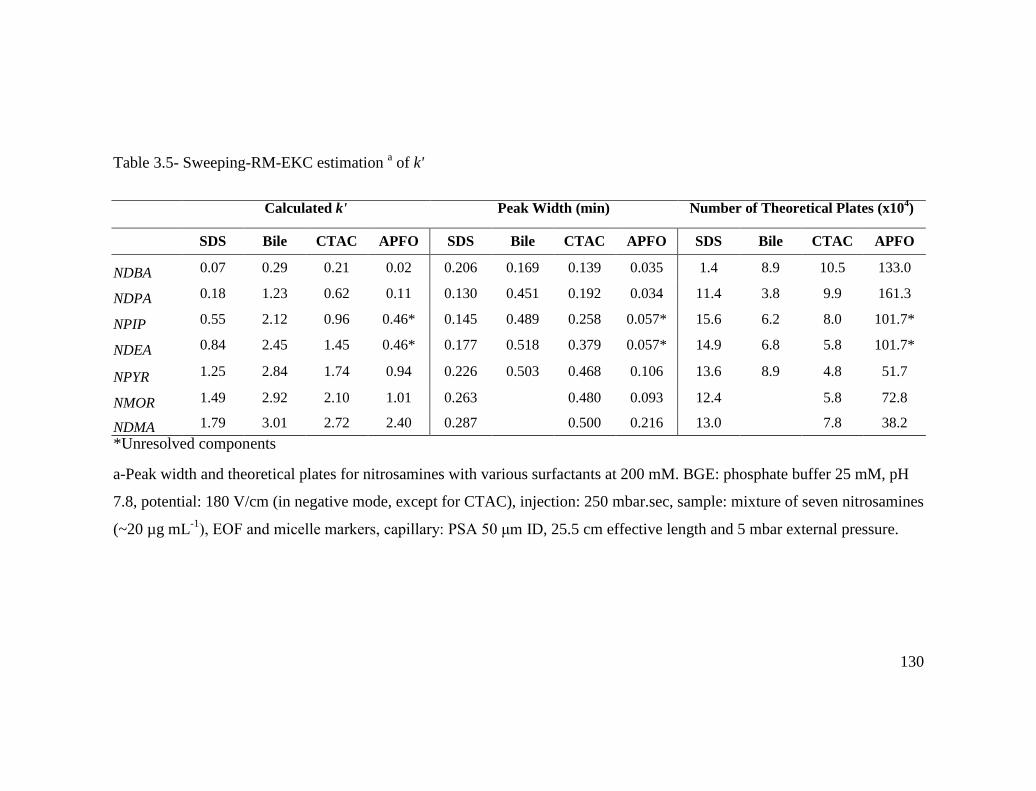
130
Table 3.5- Sweeping-RM-EKC estimation a of k'
Calculated k' Peak Width (min) Number of Theoretical Plates (x104)
SDS Bile CTAC APFO SDS Bile CTAC APFO SDS Bile CTAC APFO
NDBA 0.07 0.29 0.21 0.02 0.206 0.169 0.139 0.035 1.4 8.9 10.5 133.0
NDPA 0.18 1.23 0.62 0.11 0.130 0.451 0.192 0.034 11.4 3.8 9.9 161.3
NPIP 0.55 2.12 0.96 0.46* 0.145 0.489 0.258 0.057* 15.6 6.2 8.0 101.7*
NDEA 0.84 2.45 1.45 0.46* 0.177 0.518 0.379 0.057* 14.9 6.8 5.8 101.7*
NPYR 1.25 2.84 1.74 0.94 0.226 0.503 0.468 0.106 13.6 8.9 4.8 51.7
NMOR 1.49 2.92 2.10 1.01 0.263 0.480 0.093 12.4 5.8 72.8
NDMA 1.79 3.01 2.72 2.40 0.287 0.500 0.216 13.0 7.8 38.2
*Unresolved components
a-Peak width and theoretical plates for nitrosamines with various surfactants at 200 mM. BGE: phosphate buffer 25 mM, pH
7.8, potential: 180 V/cm (in negative mode, except for CTAC), injection: 250 mbar.sec, sample: mixture of seven nitrosamines
(~20 µg mL-1
), EOF and micelle markers, capillary: PSA 50 μm ID, 25.5 cm effective length and 5 mbar external pressure.
131
Figure 3-4. Sweeping-RM-EKC of fortified samples Sweeping-RM-EKC using SDS under optimized conditions with fortified
samples a) seawater, b) tap water, and c) wastewater. BGE: 125 mM SDS in 25 mM phosphate buffer (pH 7.8), capillary: PSA
coated 50 μm ID and 34 cm length, potential 180V/cm, injection 1000 mbar.s and 20 mbar external pressure after 5 min.
Concentration of each nitrosamines in each sample is 0.5 mg L-1
0 5 10 15 20 25
2
3
45
6 7
1
7
6
6
5
5
4
4
1
1
2
2
3
3
a) Seawater
b) Tap water
c) Wastewater
1) NDBA2) NDPA3) NPIP4) NDEA5) NPYR6) NMOR7) NDMA

132
To demonstrate the application of this method in different sample matrices, fortified
samples of nitrosamines in tap water, seawater and wastewater were prepared and
results are shown in Figure 3.4. The ionic strength of the matrices was not adjusted.
The Electrochromatogram a in Figure 3.4 clearly shows that peak shapes were
considerably better due to high concentration of salt in the seawater sample matrix.
Similarly, low ionic strength in tap water sample resulted in a decrease in the
efficiency of focusing and the peak for NDMA was not detected. For wastewater,
electrochromatogram c (Figure 3.4), which the ionic strength was higher than tap
water, and though significantly lower than seawater, it was possible to identify all
peaks. Since the proposed method is compatible with highly saline matrices, addition
of salt to the low conductivity samples is recommended.
The use of programmed auxiliary pressure to augment the slow migration of analytes
weakly retained by the mobile micellar phase was optimized; pressures ranging from 2
to 30 mbar were applied at various time intervals (1 to 15 min). Electrochromatograms
presented in Figure 3.4 were obtained using the optimal 20 mbar external pressure
applied at 5 min after sweeping was commenced. The time delay was used to allow
analytes with large k (e.g. NDPA and NDBA) have enough time to be resolved.
133
3.4. Concluding Remarks
A number of factors have been studied to improve the enrichment of polar neutral
nitrosamines by pressure-assisted sweeping-RM-ECK, including ways to suppress the
EOF (by pH and coated capillaries) and maximize the retention factor by changing
parameters that influence K and φ. In fused silica capillaries, the EOF can be
suppressed at pH<2 but this limits our selection of surfactants. Coated capillaries were
better alternative for suppression of the EOF. Among different coated capillaries
studied in this work, the sulfonic acid (PSA) coated capillaries were capable of
suppressing the EOF over the pertinent pH range (2-8) and with any type of
surfactant. In general, SDS showed reasonable performance however; application of
cationic surfactants was shown to be suitable for analysis of nitrosamines due to their
ability to act as a hydrogen bond donor. APFO, showed remarkable results in term of
peak shapes and number of theoretical plates, however, NDEA and NPIP remained
unresolved despite of increasing concentration of surfactant. Nevertheless, the
compatibility of APFO with mass spectrometry makes it attractive, and use of mixed
micelle systems can be exploited to improve resolution of these co-migrating species.

134
3.5. References:
[1] Modir-Rousta, A., Bottaro, C. S., Electrophoresis 2015, 36, 1016-1023.
[2] Chen, R., Cheng, H., Wu, W., Ai, X., Huang, W., Wang, Z., Cheng, J.,
Electrophoresis 2007, 28, 3347-3361.
[3] Glavač, N., Injac, R., Kreft, S., Chromatographia 2009, 70, 1473-1478.
[4] Falck, E., Groenhagen, A., Mühlisch, J., Hempel, G., Wünsch, B., Analytical
Biochemistry 2012, 421, 439-445.
[5] Quirino, J. P., Terabe, S., Anal Chem 1998, 70, 149-157.
[6] Quirino, J. P., Terabe, S., Analytical Chemistry 1999, 71, 1638-1644.
[7] Quirino, J. P., Terabe, S., Science 1998, 282, 465-468.
[8] Terabe, S., Chem Rec 2008, 8, 291-301.
[9] Kelly, K. A., Burns, S. T., Khaledi, M. G., Anal Chem 2001, 73, 6057-6062.
[10] Lambert, W. J., Journal of Chromatography A 1993, 656, 469-484.
[11] Poole, S. K., Poole, C. F., J Chromatogr A 2008, 1182, 1-24.

135
[12] Weckwerth, J. D., Carr, P. W., Vitha, M. F., Nasehzadeh, A., Anal Chem 1998,
70, 3712-3716.
[13] Trone, M. D., Khaledi, M. G., Electrophoresis 2000, 21, 2390-2396.
[14] Trone, M. D., Mack, J. P., Goodell, H. P., Khaledi, M. G., J Chromatogr A 2000,
888, 229-240.
[15] Fuguet, E., Rafols, C., Bosch, E., Abraham, M. H., Roses, M., Electrophoresis
2006, 27, 1900-1914.
[16] Yang, S. Y., Khaledi, M. G., Analytical Chemistry 1995, 67, 499-510.
[17] Yang, S. Y., Khaledi, M. G., Journal of Chromatography A 1995, 692, 301-310.
[18] Quina, F. H., Alonso, E. O., Farah, J. P. S., J Phys Chem-Us 1995, 99, 11708-
11714.
[19] Van Biesen, G., Bottaro, C. S., Electrophoresis 2006, 27, 4456-4468.
[20] Burns, S. T., Khaledi, M. G., Anal Chem 2004, 76, 5451-5458.
[21] Terabe, S., Otsuka, K., Ichikawa, K., Tsuchiya, A., Ando, T., Analytical
Chemistry 1984, 56, 111-113.
[22] Terabe, S., Otsuka, K., Ando, T., Analytical Chemistry 1985, 57, 834-841.

136
[23] Janini, G. M., Muschik, G. M., Issaq, H. J., Electrophoresis 1996, 17, 1575-1583.
[24] Janini, G. M., Muschik, G. M., Issaq, H. J., J Chromatogr B Biomed Appl 1996,
683, 29-35.
[25] Modir-Rousta, A., Bottaro, C. S., Electrophoresis 2013, 34, 2553-2560.
[26] Haidian, Z., Journal of the National Cancer Institute 1968, 41.
[27] Kim, J.-B., Otsuka, K., Terabe, S., Journal of Chromatography A 2001, 912, 343-
352.
[28] Williams, B. A., Vigh, G., Anal Chem 1996, 68, 1174-1180.
[29] Bakshi, M. S., J Chem Soc Faraday T 1993, 89, 4323-4326.

137
Chapter 4 Analysis of N-Nitrosamines in Wastewater Samples
Using SPE-MEKC

138
4.1. Introduction
N-Nitrosamines are relatively stable compounds found in the environment [1-2]
formed by reactions between amines, or their derivatives, and nitrous agents such as
nitrous acid or nitrogen oxides[3]. Nitrosamines, reported for the first time in 1863,
have been detected in a variety of matrices as byproducts of food and beverage
production and preservation, water and wastewater treatment and as intermediates in
industrial processes [2]. Toxicity in humans was not established until nearly a century
after their first discovery, Magee reported that when fed to rats N-
nitrosodimethylamine (NDMA) induced cancer of the liver [4]. Later it was found that
alkylation of cellular DNA by NDMA was the main reason for induction of a variety
of cancers [5]. Nitrosamines are now widely recognized as potential carcinogens and a
serious threat to public health.
N-Nitrosamines have been found widely in foodstuffs, beverages [6], cosmetics[7],
pharmaceuticals, biological material, air (e.g. tobacco smoke), contaminated ground
water (from rocket fuel), rubber [7], and recently in drinking water and wastewater[8].
Since identification of NDMA as a water disinfection byproduct in 1989, drinking
water in Ontario, Canada and California, USA has been monitored for NDMA, with
maximum allowable concentrations of 9 and 10 ng L-1
, respectively [8]. Discovery of
other nitrosamines in drinking water has been reported, and with the addition of N-
nitrosopyrrolidine and N-nitrosomorpholine by Charrois et al. [9].List of N-

139
nitrosamines detected in drinking water is listed in Table 1.1. Based on the boiling
points of the nitrosamines (Table 1.1), these compounds can be categorized as
volatile. GC/MS is known as the most reliable technique for analysis of volatile
nitrosamine and has been introduced as a routine technique by U.S. Environment
Protection Agency (EPA 521). In this method, SPE extraction is required, which is
tedious and uses a significant amount of solvents. At the end of extraction, analytes
are isolated in an organic solvent (CH2Cl2) and method requires that the range of
recovery must be 50% - 150%. The method tolerance for such an unimpressive range
of recoveries speaks to the limitations in efficiency of the extraction methods.
Furthermore, the absence of non-volatile nitrosamines on this method- list is notable,
and is most likely explained by limitations of the GC techniques used in
accommodating highly polar or high-mass compounds [8-9]. HPLC has also been
used as an alternative technique for relatively high molecular weight compounds and
wide range of contaminants in drinking water including nitrosamines [10-11].
While analysis of small molecules such as pharmaceuticals and agrochemicals using
HPLC is routine, CE has gradually become more widely-accepted as a complementary
technique for HPLC in the analysis of hydrophilic analytes. Advances in capillary
electrophoresis (CE) techniques, such as capillary electrochromatography (CEC) and
micellar electrokinetic chromatography (MEKC), have greatly extended the capability
and efficiency of CE [12]. The utility of MEKC for separation of small neutral polar
compounds, such as phenols, PCBs, PAHs, chairals, and pesticides has been

140
established [13-14]; however, only a few references are available on applications of
CE in analysis of nitrosamines [13-17].
The versatility of CE and related techniques, particularly EKC, has led to a growth in
interest in CE for environmental analysis, and several major reviews on the subject
have been published in past number of years [16, 18-19]. CE and EKC efforts in N-
nitrosamine analysis have been focused on improvement of detection methods and
sample enrichment techniques [18]. The most common detector in CE is on-column
UV-Vis absorbance with typical detection limits in the μmol L-1
range for a typical
analyte [19]. Fluorescence detection has been used to lower the detection limits for
nitrosamines , however, derivatization is required [16]. Electrochemical detection has
some advantages such as low cost, high sensitivity (sub-µg L-1
) and suitability to
miniaturization. Amperometric detection has been used for electrochemically active
compounds [20] and conductivity for charged analytes [21], though none of the
electrochemical detection methods have been used in the analysis of nitrosamines. The
application of MS for detection in CE has represented an area of ongoing interest and
led to improvements in selectivity and detection limits. However most interfaces rely
on ionization sources designed for LC-MS flow rates (>µL min-1
) that are much
higher than those of CE (nL min-1
) necessitating addition of sheath liquid that dilutes
the sample and reduces sensitivity [22-25]. Further complicating this marriage,
particularly with electrospray ionization, is the use of non-volatile compounds and
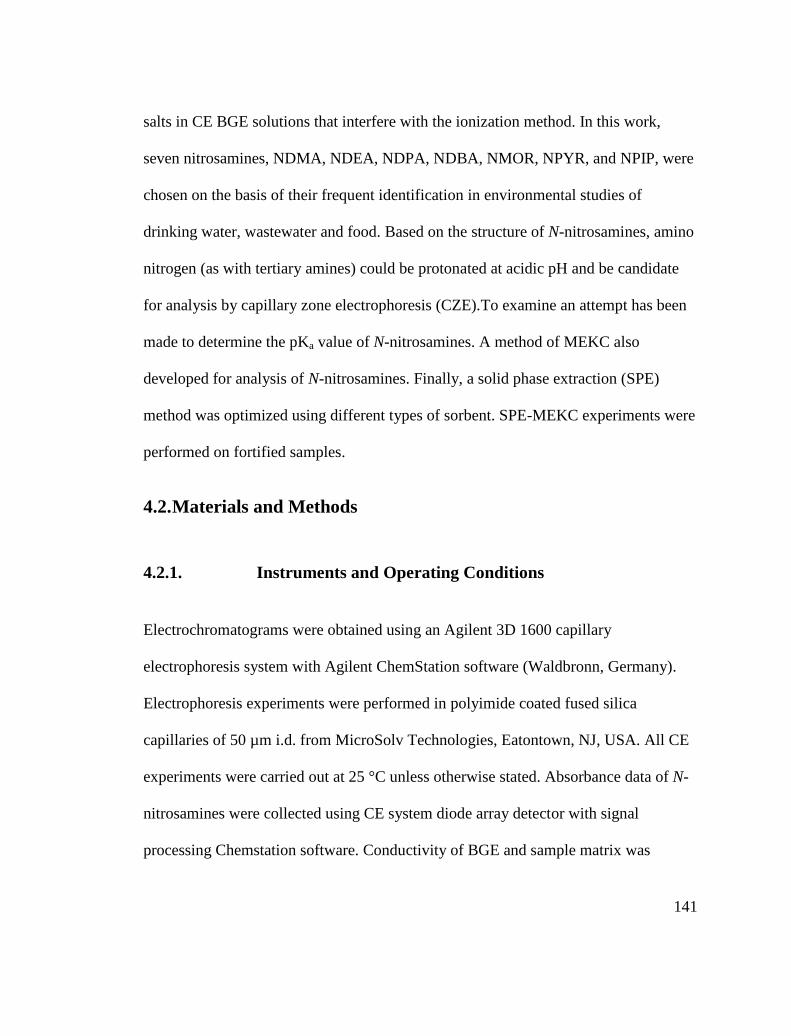
141
salts in CE BGE solutions that interfere with the ionization method. In this work,
seven nitrosamines, NDMA, NDEA, NDPA, NDBA, NMOR, NPYR, and NPIP, were
chosen on the basis of their frequent identification in environmental studies of
drinking water, wastewater and food. Based on the structure of N-nitrosamines, amino
nitrogen (as with tertiary amines) could be protonated at acidic pH and be candidate
for analysis by capillary zone electrophoresis (CZE).To examine an attempt has been
made to determine the pKa value of N-nitrosamines. A method of MEKC also
developed for analysis of N-nitrosamines. Finally, a solid phase extraction (SPE)
method was optimized using different types of sorbent. SPE-MEKC experiments were
performed on fortified samples.
4.2. Materials and Methods
4.2.1. Instruments and Operating Conditions
Electrochromatograms were obtained using an Agilent 3D 1600 capillary
electrophoresis system with Agilent ChemStation software (Waldbronn, Germany).
Electrophoresis experiments were performed in polyimide coated fused silica
capillaries of 50 µm i.d. from MicroSolv Technologies, Eatontown, NJ, USA. All CE
experiments were carried out at 25 °C unless otherwise stated. Absorbance data of N-
nitrosamines were collected using CE system diode array detector with signal
processing Chemstation software. Conductivity of BGE and sample matrix was

142
measured with a VWR conductivity meter when the volume of solution prepared was
sufficient, otherwise the conductivity measurements were carried as described in
previously [26].
4.2.2. Materials
All solvents (HPLC grade or higher) except water, sodium dodecyl sulfate (SDS)
(99.0%), dodecanophenone (98.0%) and ammonium acetate (99.9%), ammonium
formate (99.5%), ammonium hydrogen phosphate (99.9%), ammonium dihydrogen
phosphate (99.9%), sodium tetraborate (99 %) and ammonium hydroxide solution
(30%) were purchased from Sigma-Aldrich (Oakville, Canada). Formic acid (88%)
ACS grade was from Baker Analyzed and phosphoric acid (85%) ACS grade was
from EM Science. Ultrapure water was obtained from a Barnstead NanoPure Diamond
water purification system (18 MΩ), (Barnstead, Ontario, Canada). SPE cartridges: 200
mg/6 mL of Strata-X 33µm, Strata-XC, Strata-XCW, Strata-XAW were obtained from
phenomenex, California, USA; 150 mg/6 mL of Oasis MAX, Oasis AWX, Oasis
CWX from Waters, Milford, MA, USA and Resprep from Restek, Bellefonte, PA,
USA.
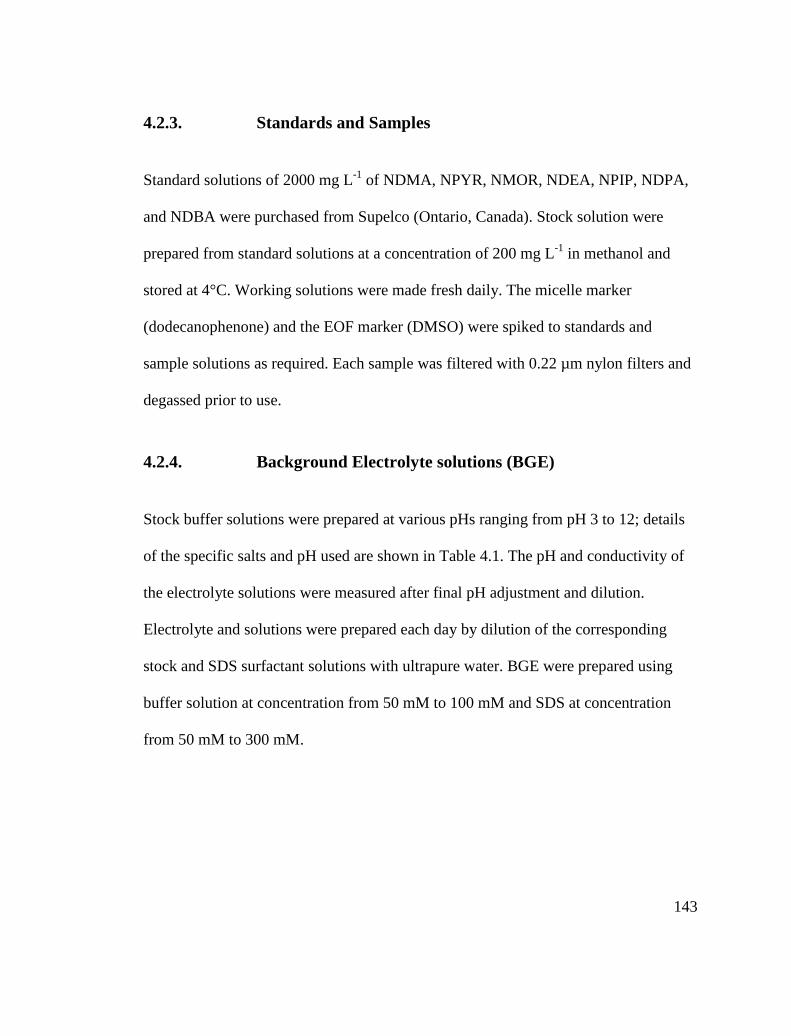
143
4.2.3. Standards and Samples
Standard solutions of 2000 mg L-1
of NDMA, NPYR, NMOR, NDEA, NPIP, NDPA,
and NDBA were purchased from Supelco (Ontario, Canada). Stock solution were
prepared from standard solutions at a concentration of 200 mg L-1
in methanol and
stored at 4°C. Working solutions were made fresh daily. The micelle marker
(dodecanophenone) and the EOF marker (DMSO) were spiked to standards and
sample solutions as required. Each sample was filtered with 0.22 µm nylon filters and
degassed prior to use.
4.2.4. Background Electrolyte solutions (BGE)
Stock buffer solutions were prepared at various pHs ranging from pH 3 to 12; details
of the specific salts and pH used are shown in Table 4.1. The pH and conductivity of
the electrolyte solutions were measured after final pH adjustment and dilution.
Electrolyte and solutions were prepared each day by dilution of the corresponding
stock and SDS surfactant solutions with ultrapure water. BGE were prepared using
buffer solution at concentration from 50 mM to 100 mM and SDS at concentration
from 50 mM to 300 mM.

144
Table 4.1-Buffer solutions (50 mM) for pH ranging from 2 to 12
4.3. Procedures
4.3.1. Capillary Conditioning
Prior to first use, each capillary was conditioned by flushing (1 bar) the following
sequence of solutions: methanol (15 min), ultrapure water (15 min), sodium hydroxide
1.0 M (15 min), ultrapure water (15 min), and finally BGE, (15 min). Conditioning
was performed at the beginning of each day by flushing with NaOH 0.1 M, ultrapure
water, and BGE for 5 min each. All sample injections were performed
pH Buffer solution pKa
2.0 Phosphate 2.12
3.0 Formate 3.72
4.0 Acetate 4.75
5.0 Acetate 4.75
6.5 Phosphate 7.20
7.0 Phosphate 7.20
8.5 Borate 9.14
9.5 Borate 9.14
10.0 Ammonium 9.15
11.5 Phosphate 12.35
12.0 Phosphate 12.35

145
hydrodynamically at the inlet end of the capillary. The capillary was conditioned
between each run by flushing with NaOH 0.1 N (1 min) and BGE (3 min). At the end
of each day, post-run conditioning of the capillary was carried out by rinsing
(flushing) with ultrapure water, methanol and air for 5 min each. For quantitative
analysis each experiment was repeated at least three times. In case of pressure assisted
sweeping RM-EKC, Zero-Flow coated capillaries were conditioned using ultrapure
water and BGE for two and five minutes respectively. Other operating conditions are
specified in the text or figure captions.
4.4. Results and Discussion
The structure of N-nitrosamines (Figure 1.3), suggests that it might be possible to
protonate the amino nitrogen (as with tertiary amines) at acidic pH and thereby make
them amenable to analysis by capillary zone electrophoresis (CZE). Since CE has
been used widely for determination of pKa [27-29] and no data has been reported for
the pKa of nitrosamines in the literature, a set of CZE experiment in a wide range of
pH was performed. A series of buffers with pH ranging from 2.0 to 12.0 (pH beyond
these ranges are rarely used in CE given their effects on the silica capillary) were
prepared (see Table 4.2). Conditions for CE were set as follow: separation voltage at
20 kV, hydrodynamic injection of approximately 2 nL (20 mbar for 5 seconds), and
wavelength 236 nm. A mixture of seven nitrosamines including: NDMA, NMOR,
NPYR, NDEA, NPIP, NDPA, and NDBA in water were injected. All of nitrosamines

146
co-migrated along with the EOF marker at all pH values, indicating that these
compounds remained uncharged in the range of pH studied.
Since CZE was not applicable for separation or determination of pKa of these
nitrosamines, micellar electrokinetic capillary electrophoresis was assessed as an
alternative separation technique in CE. LogP is a common measure of polarity and is
defined on the basis of the partitioning of a given compound from water to octanol.
The logP values for nitrosamines (see Table 1.1), are typically small or negative and
reflect the tendency of those compounds to stay in the aqueous phase. The small
differences of logP between NDMA, NMOR, NPYR and NMEA demand highly
selective separation conditions. MEKC can afford the needed selectivity.
Initial MEKC investigation involved addition of 50 mM SDS as a pseudostationary
phase to the BGE solutions used in the pKa study with the same conditions as used for
CZE were repeated.

147
Figure 4-1. Electrochromatograms MEKC of nitrosamines at different pH, 50 mM of
SDS in buffer solutions: a) pH 11, b) pH 10, c) pH 9, d) pH 8, and e) pH 6 capillary
length 64.5cm, potential +25 kV, and injection volume 2.0 nL. Sample: 1) NDMA, 2)
NMOR, 3) NPYR, 4) NDEA, 5) NPIP, 6) NDPA, 7) NDBA at concentration of 50 mg
L-1
.
Results shown in Figure 4.1 indicate that regardless of pH, the presence of SDS
facilitated separation. At pH 10, the peak characteristics such as peak height, area,
width and symmetry, resolution, capacity are best and the fastest analysis is achieved.
All MEKC parameters such as concentrations of buffer solution, SDS, and organic
modifiers; temperature, applied potential, injection volume, and capillary length were
then systematically optimized and the ranges studied and optimal conditions are
summarized in Table 4.2.
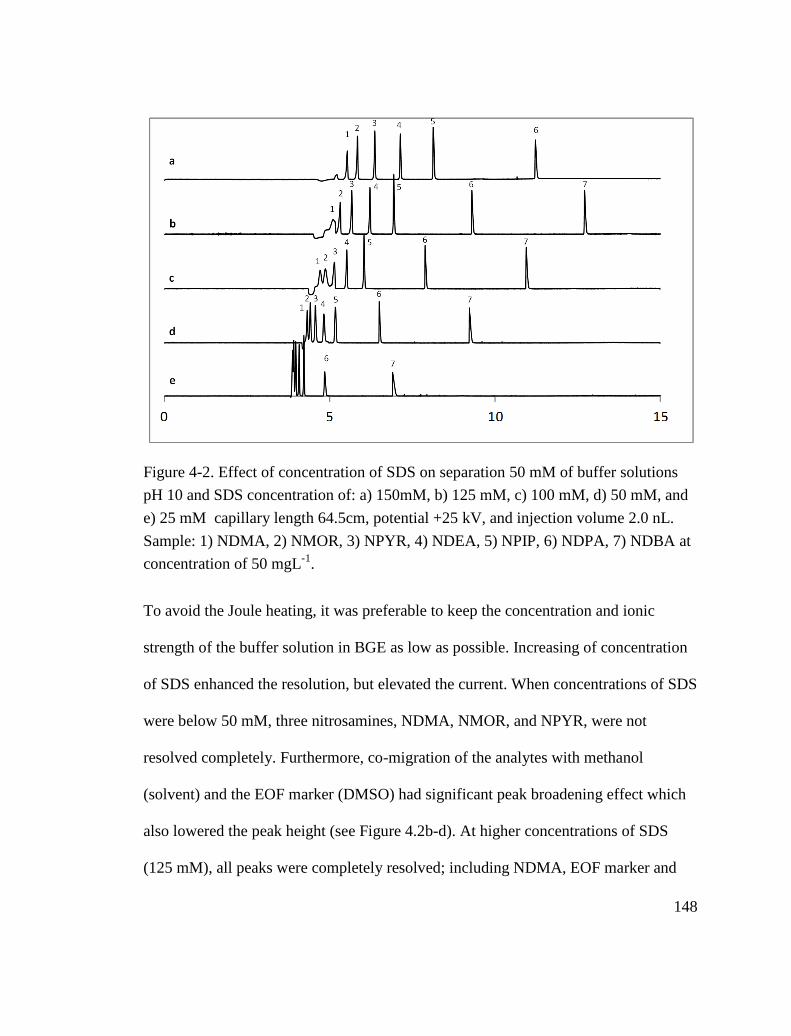
148
Figure 4-2. Effect of concentration of SDS on separation 50 mM of buffer solutions
pH 10 and SDS concentration of: a) 150mM, b) 125 mM, c) 100 mM, d) 50 mM, and
e) 25 mM capillary length 64.5cm, potential +25 kV, and injection volume 2.0 nL.
Sample: 1) NDMA, 2) NMOR, 3) NPYR, 4) NDEA, 5) NPIP, 6) NDPA, 7) NDBA at
concentration of 50 mgL-1
.
To avoid the Joule heating, it was preferable to keep the concentration and ionic
strength of the buffer solution in BGE as low as possible. Increasing of concentration
of SDS enhanced the resolution, but elevated the current. When concentrations of SDS
were below 50 mM, three nitrosamines, NDMA, NMOR, and NPYR, were not
resolved completely. Furthermore, co-migration of the analytes with methanol
(solvent) and the EOF marker (DMSO) had significant peak broadening effect which
also lowered the peak height (see Figure 4.2b-d). At higher concentrations of SDS
(125 mM), all peaks were completely resolved; including NDMA, EOF marker and

149
methanol (Figure 4.2a-b) and peak 7 (NDBA) migrates within the desired time
window. When concentration of SDS increased to 150 mM, peak shape of NDMA
improved but NDBA peak after 25 min appeared.
Table 4.2. The optimized MEKC conditions
Conditions Range Optimized
Voltage 0-30 kV 25 kV
Capillary length 33-100 cm 64.5
Temperature 10-40 ⁰C ≤ 25 ⁰C
Injection volume 1-80 nL 4 nL
BGE
Buffer pH 2-12 8-10
Buffer concentration 0-100 mM 25-50 mM
SDS concentration 0-300 mM 125 mM
Organic modifiers
Methanol 0-30% 0%
Ethanol 0-30% 0%
n-propanol 0-30% 0%
n-butanola 0-30% 0%
Acetonitril 0-30% 0%
Increasing concentration of buffer component of the BGE had no significant effect on
separation; however, ionic strength of BGE is elevated and peak broadening observed
due to the Joule heating problem. On the other hand reducing the concentration of
buffer below 25 mM has negative impact on reproducibility of migration times.
Therefore, the buffer was kept at 25-50 mM.
150
The effect of organic modifiers on the separation was also studied. Organic modifiers
used in this study were methanol, ethanol, n-propanol, n-butanol, and acetonitrile
(ACN). The organic modifiers had a number of effects on separation and EOF. First,
they change the partitioning behavior by changing the CMC of SDS. Second, they
change the viscosity of BGE and modify the magnitude of the EOF. Although, subtle
effects were noted in the electropherograms for separations using the various organic
modifiers, there was no evidence of any improvement in separation after using an
organic modifier. On the other hand, the negative effects were not substantial and
organic modifiers can be used as necessary.
4.4.1. Effect of Sample Matrix
The sample matrix had significant effect on separation especially on very polar
nitrosamines (such as NDMA, and NMOR). When methanol was used as a solvent for
elution of samples in SPE, it interfered with separation of EOF marker, NDMA, and
NMOR led to a poor base line resolution whereas, the use of water or BGE as dilution
solvents gave the best separations. Two methods were applied to overcome the
interferences those associated with methanol in particular. First, the effect of the
methanol in a sample can be eliminated by increasing the concentration of SDS above
100 mM in BGE. Second, addition of methanol up to 30% to BGE can also suppress
the interference of methanol in the sample matrix. It should be noted that addition of

151
methanol into BGE only improved the separation when methanol was present in
sample matrix. Combination of both remedies had a synergistic effect.
4.4.2. Effect of Temperature
Capillary temperature can have a significant effect on separation therefore the effect
of the capillary temperature was studied from 10 °C to 40 °C. At temperatures below
25 °C resolution improved, which was mostly attributable to the increased viscosity,
and decreased mobility and thermal diffusion. When shorter capillary (33.5 cm) was
used at 40 °C, the total analysis time was less than 4 min but NDMA and NPYR co-
migrated with the EOF marker. Under the same conditions at 20 °C, the EOF marker,
NDMA, and NPYR were completely resolved and total analysis time increased only
to 6 min and peak characteristic were improved (see Appendix C)
4.4.3. Solid Phase Extraction (SPE)
A number of different types of commercially available sorbents (solid phase) were
employed (cationic, weak cataionic, anaionic and weak anionic). Strata-X 33 µm,
Strata-XC, Strata-XCW, and Strata-XAW from Phenomenex; Oasis MAX, Oasis
AWX, and Oasis CWX from Waters; and Resprep from Restek (suggested by EPA
method 521) were selected. For SPE and preconcentration of nitrosamines from water,
conditions were systematically optimized. The percent absolute recoveries were
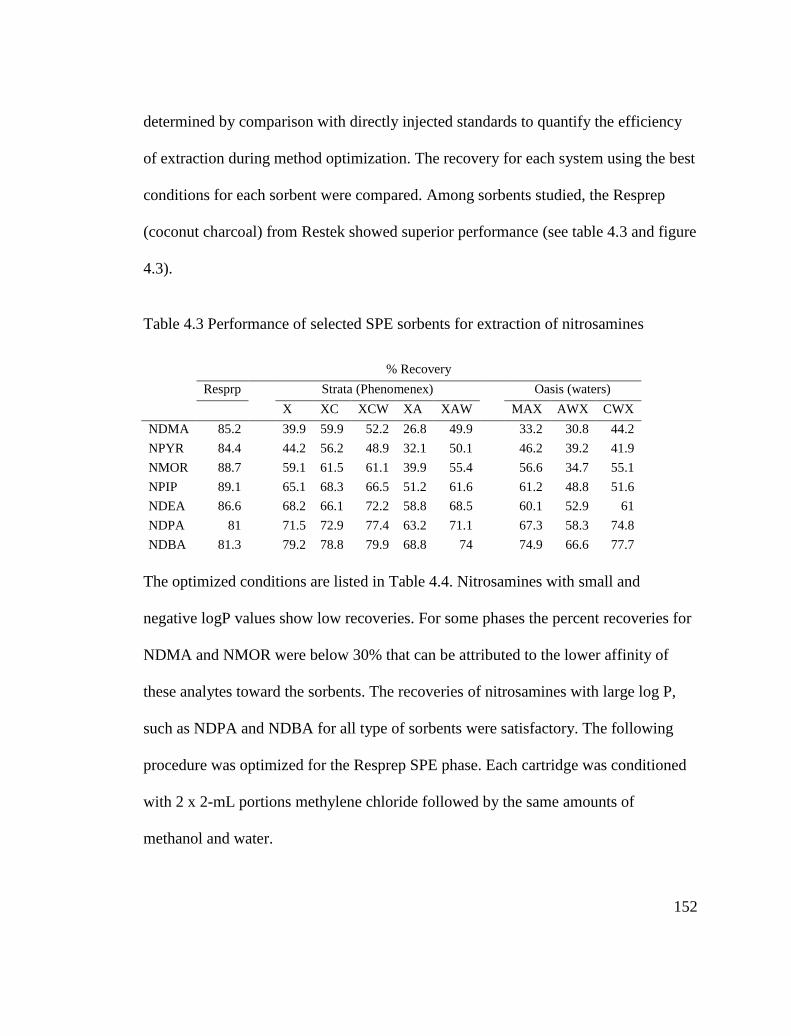
152
determined by comparison with directly injected standards to quantify the efficiency
of extraction during method optimization. The recovery for each system using the best
conditions for each sorbent were compared. Among sorbents studied, the Resprep
(coconut charcoal) from Restek showed superior performance (see table 4.3 and figure
4.3).
Table 4.3 Performance of selected SPE sorbents for extraction of nitrosamines
% Recovery
Resprp Strata (Phenomenex) Oasis (waters)
X XC XCW XA XAW MAX AWX CWX
NDMA 85.2 39.9 59.9 52.2 26.8 49.9 33.2 30.8 44.2
NPYR 84.4 44.2 56.2 48.9 32.1 50.1 46.2 39.2 41.9
NMOR 88.7 59.1 61.5 61.1 39.9 55.4 56.6 34.7 55.1
NPIP 89.1 65.1 68.3 66.5 51.2 61.6 61.2 48.8 51.6
NDEA 86.6 68.2 66.1 72.2 58.8 68.5 60.1 52.9 61
NDPA 81 71.5 72.9 77.4 63.2 71.1 67.3 58.3 74.8
NDBA 81.3 79.2 78.8 79.9 68.8 74 74.9 66.6 77.7
The optimized conditions are listed in Table 4.4. Nitrosamines with small and
negative logP values show low recoveries. For some phases the percent recoveries for
NDMA and NMOR were below 30% that can be attributed to the lower affinity of
these analytes toward the sorbents. The recoveries of nitrosamines with large log P,
such as NDPA and NDBA for all type of sorbents were satisfactory. The following
procedure was optimized for the Resprep SPE phase. Each cartridge was conditioned
with 2 x 2-mL portions methylene chloride followed by the same amounts of
methanol and water.

153
Figure 4-3 Performance (% Recovery) of selected SPE sorbent for extraction of seven
nitrosamines.
The analytes were then extracted onto the SPE phase by passing 500-mL of aqueous
sample through a SPE cartridge containing 2 g of 80-120 mesh coconut charcoal
(Resprep). The cartridge was dried under vacuum for 10 min and compounds are
eluted with a small volume of methylene chloride. Though this sample could be run
directly with GC-MS, methylene chloride is not compatible with CE, and the solvent
was exchanged to water by evaporation either vacuum drying or under nitrogen flow
and re-dissolution in water. At this stage extreme care was required to avoid poor
recovery for volatile nitrosamines like NDBA. In the solvent exchange step, when the
volume of eluent was large, more analyte loss occurred. To reduce this effect, the
NDMANPYR
NMORNPIP
NDEANDPANDBA
0
10
20
30
40
50
60
70
80
90
%R
eco
very

154
minimum amount of solvent was used (2 mL) and the eluent was dried in the ice bath
under gentle flow of nitrogen (≤5 psi). In general, SPE cartridges such as Strata-X
(from Phenomenex) and Oasis (from Waters) demonstrate clean extract (flat base line
in MEKC) with low matrix effects, but poorer recoveries.
Table 4.4. Optimized conditions for SPE method (Resprep from RESTEK)
Process Experimental range Optimized conditions
Conditioning
CH2Cl2 2-12 mL 4 mL
CH3OH 2-12 mL 4 mL
H2O 2-12 mL 4 mL
Equilibrium
CH3OH 0-10 mL 2 mL
H2O 0-30 mL 6 mL
Sample
Extraction Volume 100-1000 mL 500 mL
Flow rate 1-20 mL/min 10 mL/min
Drying
Method Vacuum, nitrogen flow Vacuum
Drying time 5-30 min 10 min
Elution
Solvent CH3OH, CH2Cl2 CH2Cl2
Flow rate 1-10 mL/min 1 mL/min
Volume 1-15 mL 2 mL

155
For both Waters and Phenomenex brands, the weak cation exchange and weak anion
exchange sorbents gave the best performance within each company. However, even
these suffered from poor recovery for NDMA, NMOR, and NPYR. On the other hand,
the coconut charcoal and activated carbon performed better in terms of recovery for
all nitrosamines, but they were non-selective and matrix effects were high resulting in
very noisy baselines in the electropherograms.
4.4.4. Quantitative Analysis
Calibration curves for the seven nitrosamines were constructed. Five calibration data
points were used over two orders of magnitude; each point was calculated as the
average peak area of three sequential injections. The limit of detection (LOD) was
considered as three times the standard deviation of the intercept-to-slope ratio, and
LOQ was calculated as a ten times the standard deviation of the same ratio. The LOD
and LOQ values for both MEKC without preconcentration and SPE-MEKC are shown
in Table 4.5. In MEKC case, the efficiency dictates the detection limits, as increased
separation efficiency will decrease peak width and increase peak height and improve
signal to noise. Based on calibration curves excellent R2
values for range of 2.5-50 mg
L-1
for MEKC method were achieved from 0.9986 to 0.9992. Similarly, offline
preconcentration, SPE, was performed using the Restek SPE sorbent followed by
MEKC. Calibration curves showed excellent R2
values for range of 0.25-10 mg L-1
obtained (from 0.9962 to 0.9999).

156
Percent recoveries (accuracy) and RSDs (precision) for each analyte at any given
point were calculated and listed in Table 4.6. According to the results in Table 4.6,
there was some loss in recoveries for all nitrosamines, this is partly related to solvent
exchange step. This effect was more profound for those nitrosamines with lower
boiling point (i.e. NDBA).
A number of fortified samples of nitrosamines in reagent water, drinking water,
wastewater, and seawater were prepared and extracted via optimized SPE method.
The extracts were analyzed with optimized MEKC method and results are listed in
Table 4.7. Concentration of analytes in each sample is approximately close to the
LOQ (0.5 mg L-1
). Recoveries for Reagent water are lower and for seawater are higher
than other samples. This can be explained due to the presence of salt in the samples
(drinking water, wastewater, and seawater) that enhances the affinity of analytes to
sorbent. Results showed that this effect was more profound when the concentration of
salt in the sample increased (i.e. seawater has highest concentration of salt).

157
Table 4.5. Analytical characteristic of MEKC and SPE-MEKC
MEKC SPE-MEKC Enrichment
LOD (mg L-1
) LOQ (mg L-1
) R2
LOD (mg L-1
) LOQ (mg L-1
) R2
Factor
NDBA 2.3 7.7 0.9992 0.15 0.50 0.9962 15
NDPA 2.6 8.7 0.9989 0.12 0.40 0.9996 22
NPIP 2.8 9.3 0.9987 0.97 0.32 0.9998 31
NDEA 2.6 8.7 0.9989 0.11 0.33 0.9998 24
NMOR 2.9 9.7 0.9986 0.13 0.43 0.9998 22
NPYR 2.8 9.3 0.9988 0.14 0.47 0.9999 20
NDMA 2.9 9.7 0.9986 0.13 0.43 0.9998 22

158
Table 4.6. Analytical data obtained from spiked reagent water (SPE-MEKC)
Analytes Fortified reagent water samples
0.25 mg L-1
(N=5) 0.50 mg L-1
(N=5) 1.0 mg L-1
(N=5) 5 mg L-1
(N=5) 10 mg L-1
(N=5)
%Recovery %RSDa %Recovery %RSD %Recovery %RSD %Recovery %RSD %Recovery %RSD
NDMA 36.2 15 66.0 10 79.1 8.1 81.6 7.8 85.2 8.0
NMOR 45.8 8.2 69.2 9.3 82.5 7.5 84.1 10 84.4 8.2
NPYR 58.3 12 72.5 8.1 85.6 8.2 87.7 8.3 88.7 7.3
NPIP 72.0 9.1 75.1 9.0 79.0 9.3 86.3 8.1 89.1 9.1
NDEA 68.8 8.6 68.3 11 78.1 11 86.0 9.6 86.6 8.6
NDPA 42.6 13 65.7 13 75.6 8.0 83.5 9.4 81.0 8.2
NDBA 38.1 15 62.4 11 72.3 12 80.1 11 81.3 12
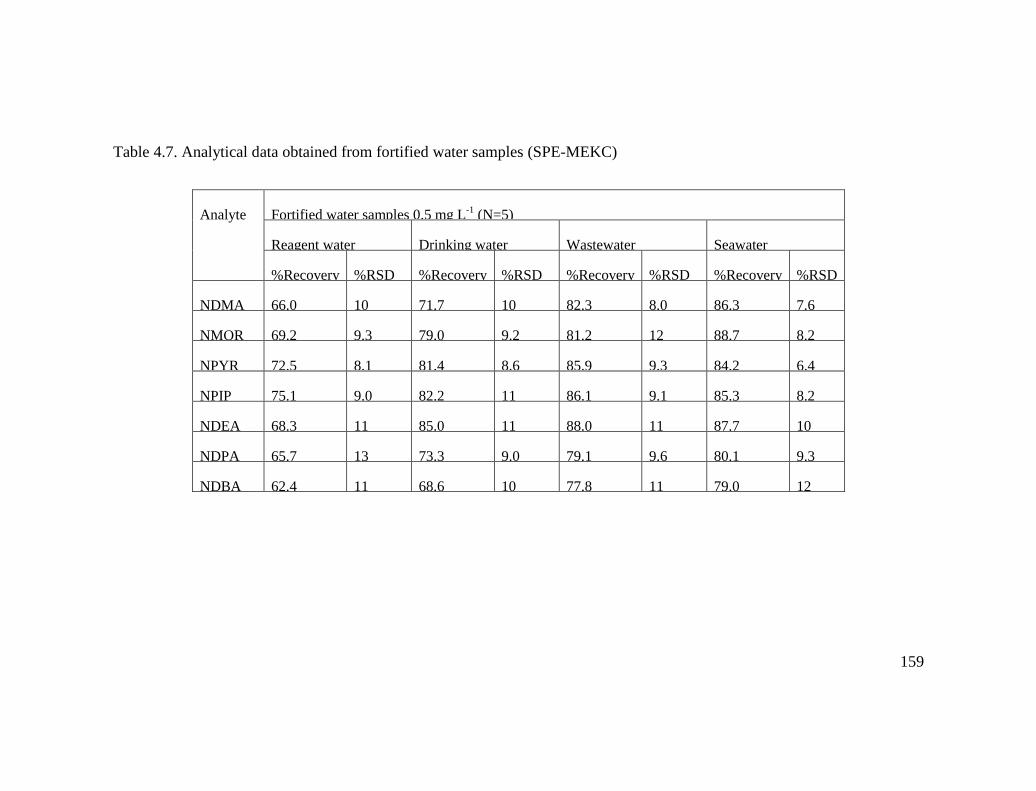
159
Table 4.7. Analytical data obtained from fortified water samples (SPE-MEKC)
Analyte Fortified water samples 0.5 mg L-1
(N=5)
Reagent water Drinking water Wastewater Seawater
%Recovery %RSD %Recovery %RSD %Recovery %RSD %Recovery %RSD
NDMA 66.0 10 71.7 10 82.3 8.0 86.3 7.6
NMOR 69.2 9.3 79.0 9.2 81.2 12 88.7 8.2
NPYR 72.5 8.1 81.4 8.6 85.9 9.3 84.2 6.4
NPIP 75.1 9.0 82.2 11 86.1 9.1 85.3 8.2
NDEA 68.3 11 85.0 11 88.0 11 87.7 10
NDPA 65.7 13 73.3 9.0 79.1 9.6 80.1 9.3
NDBA 62.4 11 68.6 10 77.8 11 79.0 12

160
4.5. Conclusions
Nitrosamines are neutral and polar compounds that are not capable of being separated
via CZE without modification. Thus, a MEKC method has been developed. For this
method, the effects of the key parameters in the BGE were studied and optimized. In
this method 125 mM of SDS in 25-50 mM of ammonia buffer at pH=10 were shown
to be optimal. The performance of this developed method was excellent over the range
of 0.25-10 mg L-1
(r2>0.99) studied. The LODs were significantly improved using a
pre-concentration method (SPE) with the MEKC method. After comparing a wide
range of commercially available sorbents, the best results were obtained by using
coconut charcoal as the sorbent (Resprep from Restek), though the poor retention by
the SPE sorbents for some of the nitrosamines compromised the method. The SPE
recoveries for the method were at 66%-75% for 0.5 mg L-1
of individual nitrosamines
in reagent water, and 68.2%-85.0% for wastewater, 79%-89% for seawater.

161
4.6. References
[1] Zhu, X. Q., He, J. Q., Li, Q., Xian, M., Lu, J., Cheng, J. P., J Org Chem 2000, 65,
6729-6735.
[2] A.L.Fridman, F. M. M., and S.S.Novikov, Russ. Chem. Rev. 1971, 40, 34.
[3] Zolfigol, M. A., Zebarjadian, M. H., Chehardoli, G., Keypour, H., Salehzadeh, S.,
Shamsipur, M., J Org Chem 2001, 66, 3619-3620.
[4] Magee, P. N., Food and Cosmetics Toxicology 1971, 9, 207-218.
[5] Hadidian, Z., Fredrickson, T. N., Weisburger, E. K., Weisburger, J. H., Glass, R. M.,
Mantel, N., J Natl Cancer Inst 1968, 41, 985-1036.
[6] Lijinsky, W., Mutat Res 1999, 443, 129-138.
[7] Ikeda, K., Journal of the Society of Cosmetic Chemists 1990, 41.
[8] Taguchi, V. Y., Canadian Journal of Applied Spectrometry 1994, 39.
[9] Charrois, J. W., Arend, M. W., Froese, K. L., Hrudey, S. E., Environ Sci Technol
2004, 38, 4835-4841.
[10] Haeberer, A. F., Scott, T. A., Abstr Pap Am Chem S 1980, 180, 85-Envr.
[11] Macmillan, W. D., Anal Lett Pt A 1983, 16, 957-968.
162
[12] Terabe, S., Otsuka, K., Ando, T., Analytical Chemistry 1985, 57, 834-841.
[13] Liu, X., Zhao, Y. Y., Chan, K., Hrudey, S. E., Li, X. F., Li, J., Electrophoresis 2007,
28, 1327-1334.
[14] Dabek-Zlotorzynska, E., Electrophoresis 1997, 18, 2453-2464.
[15] Ng, C. L., Ong, C. P., Lee, H. K., Li, S. F. Y., Journal of Chromatographic Science
1994, 32, 121-125.
[16] Bell, L. M., Murray, G. M., J Chromatogr B 2005, 826, 160-168.
[17] Zuccher, S., Luchini, P., Bottaro, A., J Fluid Mech 2004, 513, 135-160.
[18] Breadmore, M. C., Electrophoresis 2007, 28, 254-281.
[19] Dabek-Zlotorzynska, E., Celo, V., Yassine, M. M., Electrophoresis 2008, 29, 310-
323.
[20] Muna, G. W., Quaiserova-Mocko, V., Swain, G. M., Analytical Chemistry 2005, 77,
6542-6548.
[21] Masar, M., Wojcik, L., Kaniansky, D., Trojanowicz, M., Journal of Separation
Science 2005, 28, 1271-1277.
[22] Klampfl, C. W., Electrophoresis 2006, 27, 3-34.
[23] Richardson, S. D., Analytical Chemistry 2006, 78, 4021-4045.

163
[24] Lazar, I. M., Electrophoresis 2009, 30, 262-275.
[25] Van Biesen, G., Bottaro, C. S., Electrophoresis 2006, 27, 4456-4468.
[26] Modir-Rousta, A., Bottaro, C. S., Electrophoresis 2013, 34, 2553-2560.
[27] Caliaro, G. A., Herbots, C. A., J Pharm Biomed Anal 2001, 26, 427-434.
[28] Koval, D., Kasicka, V., Jiracek, J., Collinsova, M., Electrophoresis 2006, 27, 4648-
4657.
[29] Buckenmaier, S. M., McCalley, D. V., Euerby, M. R., J Chromatogr A 2003, 1004,
71-79.

164
Chapter 5 Three-phase Single Drop Micro-Extraction (SDME) and
Continuous Flow Micro-Extraction for N-Nitrosamines (Polar
Neutral Organic Compounds)

165
5.1. Introduction
Sample preparation is perhaps the most challenging and time consuming part of any
analytical technique when the sample matrix is complex and analytes are in trace
amounts. Elimination of interferences and enrichment of target analyte(s) are the two
main goals in sample preparation. Elimination of interferences can be achieved by
extracting analytes from the matrix. The liquid-liquid extraction (LLE) is one of the
oldest and widely used techniques for extraction of many different types of compounds
from liquid matrices; it can also act as an enrichment technique. The process is based on
transfer of analytes between two immiscible phases. The major drawback for
conventional LLE is high consumption of organic solvents that are not environment
friendly. Demands on sustainable techniques and miniaturization of analytical techniques
dictate the reduction of sample and solvent volumes. Development of micro-extraction
techniques is one of the new trends toward the greening and miniaturization of analytical
techniques. Within the past decade, a significant number of research works devoted to
development of micro-extraction techniques and several reviews on two of the major
micro-extraction techniques, solid-phase micro-extraction (SPME) [1-4] and liquid
micro-extraction (LPME), much like LLE have been published [5-10].
LPME is based on the solubility of a given analyte in two immiscible liquid phases,
which reaches equilibrium through partitioning phenomena. The target analyte(s) should
have superior solubility in extracting phase if extraction is to be efficient. The polarity,
166
molecular size of the analyte, and the physicochemical interactions between the analyte
and extracting liquid phase are major factors in solubility. In addition, depending on
chemistry of analytes, the solubility can be altered by liquid phase modification, e.g.
changing pH, or adding chelating agents.
Single drop micro-extraction using µL syringe (SDME) is one of the most commonly
used LPME techniques. This technique is used to extract analytes from a sample solution
into a drop of acceptor phase. After extraction, the drop is withdrawn from donor phase
and injected into an analytical instrument such as GC [11-12], LC [11], CE [7, 13-14],
atomic absorption Spectrometer (AAS) [15], etc. Depending on the number of phases
involved in extraction, the modes of SDME can be classified as two-phase and three-
phase techniques. Two-phase SDME is considered to be a miniaturized form of
traditional liquid-liquid extraction technique. This technique is inexpensive and easy to
operate. There is no need for any specific or complex equipment, and practically, any
solvent drop is enough for extraction. This method was first introduced by Liu and
Dasgupta [16-17], then the mass transfer mechanism was studied by Jeannot [18] and He
groups [19]. Notable development and applications of SDME over the past decade have
been reviewed [9-10, 20-22].
The organic solvents typically used as extracting phase in SDME-GC methods are water-
immiscible and compatible with GC [20]. This is considered a major limitation in
application of other analytical techniques such as RP-HPLC and CE. To overcome this
limitation, solvent exchange or back extraction is required. In addition, the small volume

167
of the sample (one drop) is not enough for conventional HPLC or increase in sample
volume is necessary resulting in dilution.
Liu and Lee introduced continuous-flow micro-extraction (CFME) for the first time in
2000 [23]. In this technique, the sample solution is continuously pumped into a chamber
and a drop of extracting phase is injected and held inside the chamber. Thus, the drop is
continuously in contact with a fresh sample solution. Therefore, this method should give a
higher concentration factor than static LPME method. The performance of CFME, is
directly related to parameters such as type of solvent, size of droplet, flowrate, volume of
sample solution, ionic strength [24] as well as characteristics of the solute (analyte).
However, extracting and enrichment of neutral polar organic compounds, such as
nitrosamines, from aqueous phase becomes more challenging as they tend to stay in the
aqueous phase. Since nitrosamines have polar characteristics and are relatively non-
volatile, even variation on the SDME theme that would help overcome solubility issues
such as headspace SDME, seem to be inefficient for these compounds.
Immersed SDME method shows better overall mass-transfer coefficient compared to
headspace SDME because the extracting phase is in direct contact with the solvated
analyte. Immersed SDME has been successfully employed for extraction of drugs [25]
vaccines [12], metals [15, 26], hormones [11, 27] proteins [28] in biological fluids [26,
29], pesticides [30-31]and environmental contaminants [9, 32] herbicides [33-35] in water
samples and in foods [36]. When an analyte is extracted from an aqueous donor phase of
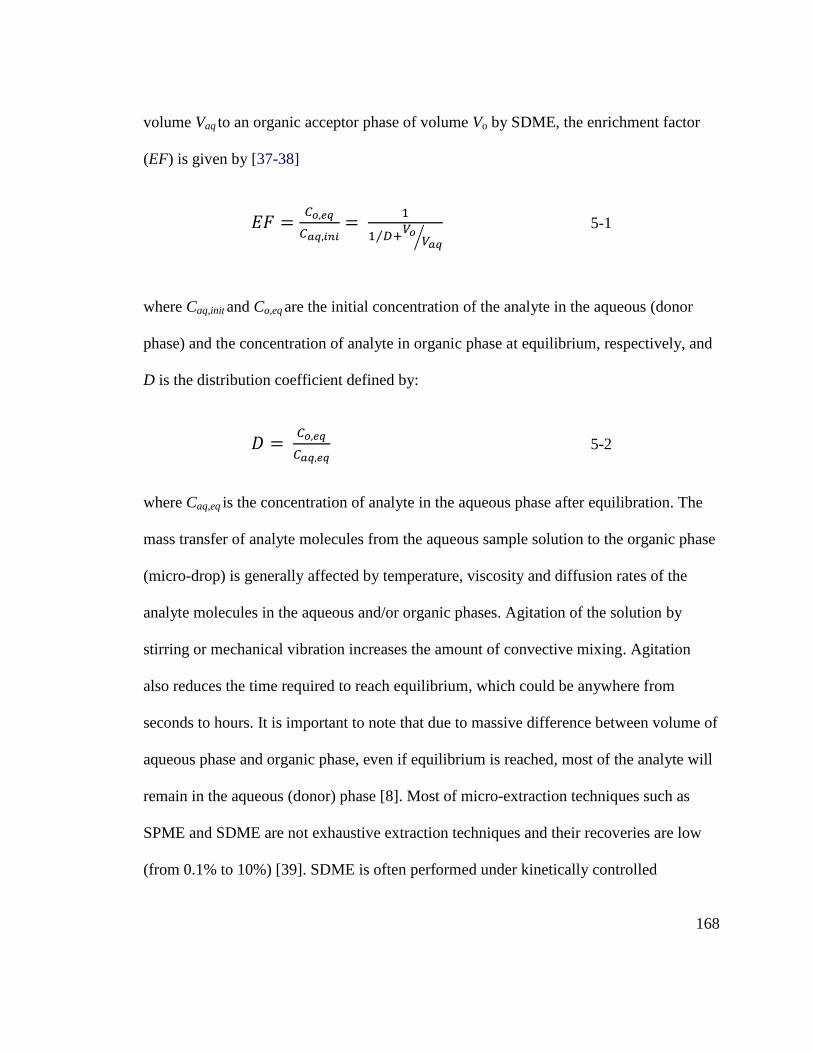
168
volume Vaq to an organic acceptor phase of volume Vo by SDME, the enrichment factor
(EF) is given by [37-38]
5-1
where Caq,init and Co,eq are the initial concentration of the analyte in the aqueous (donor
phase) and the concentration of analyte in organic phase at equilibrium, respectively, and
D is the distribution coefficient defined by:
5-2
where Caq,eq is the concentration of analyte in the aqueous phase after equilibration. The
mass transfer of analyte molecules from the aqueous sample solution to the organic phase
(micro-drop) is generally affected by temperature, viscosity and diffusion rates of the
analyte molecules in the aqueous and/or organic phases. Agitation of the solution by
stirring or mechanical vibration increases the amount of convective mixing. Agitation
also reduces the time required to reach equilibrium, which could be anywhere from
seconds to hours. It is important to note that due to massive difference between volume of
aqueous phase and organic phase, even if equilibrium is reached, most of the analyte will
remain in the aqueous (donor) phase [8]. Most of micro-extraction techniques such as
SPME and SDME are not exhaustive extraction techniques and their recoveries are low
(from 0.1% to 10%) [39]. SDME is often performed under kinetically controlled

169
conditions to avoid excessive analysis times. Calibration is based on aqueous phase
standards and extractions of standards and unknown are performed under same
conditions. Therefore, this technique is functional analytically even if only a trace amount
of analyte is recovered from the sample solution.
5.2. Material and Methods
5.2.1. Materials
Individual nitrosamines standards at 2000 mg L-1
in methanol were purchased from
Supelco (Ontario, Canada), stock solutions of 1000 mg L-1
in methanol were prepared and
stored at 4 °C and working solutions were made fresh daily. All solvents were HPLC
grade or higher from Sigma-Aldrich (Oakville, Canada), dichloromethane was purchased
from Sigma-Aldrich (Oakville, Canada). Ultrapure water was obtained from a Barnstead
Nano Pure Diamond (18 MΩ) system, (Ontario, Canada).
5.2.2. Instruments
A digital temperature and flow controlled gas heater was built using parts purchased from
Omega Canada (Ontario, Canada). Syringes and needles were purchased from Hamilton
Company (NV, USA). An Agilent GC 6850 system with FID and TCD detectors and an
HPLC 1100 system with diode array detector were used for analysis of samples.
170
5.3. SDME of Polar Neutral Analytes
In liquid-liquid extraction methods, normally two immiscible solvents are used. In such a
case, small neutral polar compounds in environmental samples have tendency toward the
aqueous phase rather than organic phase. In conventional liquid extraction large volume
of organic solvent is used to overcome this problem. Then, extra steps are necessary to
remove excessive solvent and enrich the analytes. As it was explained earlier, extraction
efficiency is directly related to the distribution coefficient (solute-solvent interaction) and
phase ratio (Equation 5-1). In case of highly polar compounds such as N-nitrosamines,
none of these terms are in favor of extraction from aqueous phase into organic phase. In
our proposed three-phase extraction method phases are aqueous-organic-aqueous
respectively (Figure 5-3). The phase ratio of first stage ( phase1/phase2 extraction, from
bulk aqueous sample solution into the organic phase outer droplet) is about 10-3
while for
second extraction (from organic phase outer droplet to aqueous inner droplet) phase ratio
is about 103 and distribution coefficient is in favor of extraction (highly polar N-
nitrosamine from organic phase into the aqueous phase). Moreover, evaporation of
organic solvent can be considered as an extra boost for final extraction. Since the trend in
new analytical methods is toward the use of less organic solvents, the method described
here can be used to reduce the volume of organic solvent from many mL to a few μL.
171
5.3.1. Apparatus
The steps involved in the execution of this method are presented schematically in figure
5.1. First, a syringe is filled with a plug of air; 1-2 μL of water; and about 5 μL
dichloromethane (a low boiling point organic solvent immiscible with water) respectively
(figure 5.1A). Then concentric droplets were formed using positive pressure (figure 5.1B,
C). This process was visually monitored using magnifying glass or digital camera
(microscope). The maximum size of each droplet was estimated by the volume of solvent
in the syringe. This size was directly related to the wall thickness, shape of the tip, and
material of the needle. In practice, the size of each droplet was kept smaller than the
maximum to avoid drop loss due to physical movement. To increase the stability, the
drops should have the maximum interface with the tip of needle. Therefore, needles with
thicker walls were used when larger drops were needed. Gravity is one the most
important cause of detachment of the large drops from the tip of needles. Formation and
stability of the droplet(s) inside the solution is easier due to the presence of hydrostatic
forces which oppose the gravity. Droplets must be retracted into the syringe prior to
entering or removing from a solution to avoid drop detachment from the syringe.

172
Figure 5-1. The schematic of formation of two-phase concentric droplets.
5.4. Methods and discussion
In this work different size of syringes and different type of needles were employed and
compared. Among different style of needles the blunt tip needles showed better drop
adhesion and needles with thicker walls were able to hold larger droplets. A 22s gauge
(0.5 mm O.D) needle with blunt point was chosen because it afforded a thicker wall
(large interface between drop and flat tip of needle) and less dead volume (less than 0.05

173
μL inch-1
). To generate larger drops, the wall thickness of the needle could be increased
by using a P-TFE sleeve. PTFE material gave better results in term of lower residual
contamination when retracting the droplets. Sleeves with different external diameters and
fixed internal diameter were made to fit the external diameter of the needle (0.5 mm). To
increase the stability of droplet, it was assumed that droplets with hemispherical shape
can form stronger binding forces between droplet and tip of needle (needle wall + sleeve)
due to a larger interface (diameter of droplet ≤ O.D. of needle wall thickness + sleeve).
Therefore, for any given syringe size, dimensions of a half-droplet (half of sphere) was
calculated and droplet volume were used accordingly. Then sleeves with corresponding
diameters to the closest 0.5 mm were made. In Table 5.1, the size of syringe with
suggested dimensions of sleeves and nominal droplet sizes are listed. This information
was used to select the right sizes of sleeves for corresponding syringe sizes (volume).
Based on the total volume of the syringe, the maximum size of droplet and dimension of
sleeve were determined. For example a 5 μL syringe needs a sleeve with 2.5 mm O.D to
hold a 5 μL droplet (see Table 5.1).
The volumes within the syringe dictate the volume of outer droplet (organic droplet) plus
inner aqueous drop and air plug. The size of air plug (see Figure 5.1) is slightly more than
the dead volume (volume inside the needle) as this is needed to push the water plug out
completely. Later this air plug is used to make sure all the aqueous droplet is injected to a
given analytical instrument.

174
Table 5.1. sleeve size based on calculated values for half drop for Hamilton needle blunt
point gauge 22s (0.474 mm O.D.and 0.178 mm wall thickness).
Size of syringe (μL)
External drop diameter (mm)
a Sleeve O.D.
(mm)b
½ External drop
volume(μL)c
Wall thickness (mm)
d
5 2.7 2.5 7.1 2.3
10 3.4 3.5 11.2 3.2
25 4.6 4.5 23.6 4.3
50 5.8 6 56.5 5.8
100 7.3 7.5 110.4 7.3
250 9.8 10 261.8 9.8
a-calculated diameter of half of a sphere (half drop) Corresponding to the volume of the syringe
b-PTFE sleeves external diameter.
c-The calculated volume of half a drop corresponding to the O.D. of sleeve.
d-Wall thickness= O.D. of sleeves- I.D. of needle.
The size of water plug is very important because it is considered as the extracting phase
volume. A larger air plug could form a third drop inside the inner drop, which can cause
an increase in the surface area of both drops and interface between the two co-centric
droplets, thereby increasing the mass transfer rate. But in practice, presence of large air
bubble inside the co-centric droplets caused distortion and instability of droplets.
Formation of an inner droplet during extraction was not necessary, but it was formed to
expedite the equilibrium. Any technique usually used with conventional LLE to improve
the extraction can be applied to this method. For example, since droplets were fairly
stable, vigorous stirring of solution was possible.
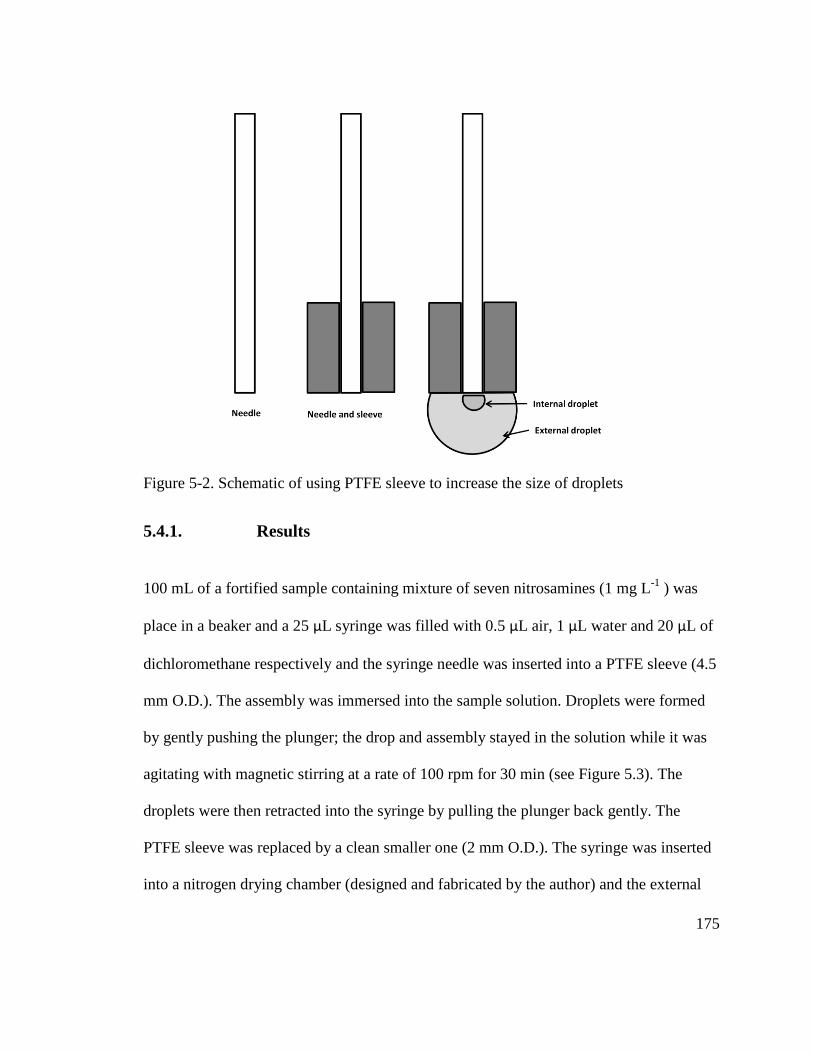
175
Figure 5-2. Schematic of using PTFE sleeve to increase the size of droplets
5.4.1. Results
100 mL of a fortified sample containing mixture of seven nitrosamines (1 mg L-1
) was
place in a beaker and a 25 μL syringe was filled with 0.5 μL air, 1 μL water and 20 μL of
dichloromethane respectively and the syringe needle was inserted into a PTFE sleeve (4.5
mm O.D.). The assembly was immersed into the sample solution. Droplets were formed
by gently pushing the plunger; the drop and assembly stayed in the solution while it was
agitating with magnetic stirring at a rate of 100 rpm for 30 min (see Figure 5.3). The
droplets were then retracted into the syringe by pulling the plunger back gently. The
PTFE sleeve was replaced by a clean smaller one (2 mm O.D.). The syringe was inserted
into a nitrogen drying chamber (designed and fabricated by the author) and the external

176
droplet was reformed gradually. Due to smaller size of the sleeve, the external droplet
was formed by pushing only 2 μL of the extract phase out each time and visually
inspected the drop as it evaporated to prevent complete dryness.
Figure 5-3. Illustration of formation of concentric droplets inside and outside a solution.
a) formation of co-centric two phase drops inside the sample solution b) retracting drops
into the syringe, c) formation of two-phase droplets outside the solution d) evaporation of
outer layer using nitrogen flow, e) collecting enriched sample into the needle.
In practice, using larger sleeve caused analyte(s) loss during evaporation step. The
evaporation rate was experimentally measured and set by changing flow rate and
temperature of the nitrogen gas using our device made in-house. For example, in this

177
experiment a flow rate 0.2 L min-1
at 35 ⁰C gave evaporation rates of about 3 μL min-1
. It
must be mentioned that drying gas temperature was kept below the boiling temperature of
organic solvent otherwise the solvent boiled and bubbles formed causing distortion and
loss of droplets (see Figure 5.3). When the last part of the outsise drop was formed (last 2
μL of organic phase + water), 30 sec was added to the drying time and aqueous droplet
was retracted into the syringe and injected into a GC. The enrichment for highly polar
compounds (NDMA, NPYR, NMOR, NPIP and NDEA) was significant but low (see
Table 5.2). This result was attributed to low portioning of these compounds into the
organic phase (outer drop) or some loss of analytes when drying the organic solvent. The
size could be increased; however the volume of organic phase is limited by the size of
syringe, needle, and sleeve.
Table 5.2 Analytical data obtained from three-phase single drop micro-extraction
Analytes BP (°C) Log(Po /Pw) Concentration (μg mL-1
) Enrichment %RSDa
Initial Final
NDMA 152 -0.57 0.1 0.25 2.5 9.2
NMOR 224 -0.44 0.1 0.28 2.8 7.5
NPYR 214 -0.19 0.1 0.33 3.3 6.9
NPIP 219 0.36 0.1 0.56 5.6 4.5
NDEA 176.9 0.48 0.1 0.45 4.5 6.8
NDPA 206 1.36 0.1 2.1 21 3.1
NDBA 116 2.63 0.1 1.8 18 5.3
a-(n=6)

178
When a larger syringe is used the size of aqueous phase must increase as well. For
example using a 5 mL syringe requires at least 0.1 mL of aqueous phase (water) to form a
separate layer inside the syringe otherwise formation of aqueous drop may not be
possible.
5.5. Continuous Flow Single Drop Micro-extraction (CFSDME) of
Neutral Polar Analytes
To increase the volume of organic phase, a device was designed to provide continuous
flow of organic phase in single drop micro-extraction (see Figure 5.4). The main
components of this device consist of a tee, PEEK tubing, needle, PTFE sleeve and
syringe. The needle was inserted from one port of tee and passed through PEEK tubing in
the other end of the tee (see Appendix B). The external diameter of needle was smaller
than I.D. of PEEK tubing thus a concentric system of tubing was formed to allow two
different solutions to run simultaneously and form two concentric droplets. From the 3rd
port of the tee which was perpendicular to other two ports, another piece of PEEK tubing
connected the device to a syringe pump. The inner drop (aqueous) was formed by syringe
needle. The organic phase was pumped through the PEEK tubing to form the external
drop. (see Figure 5.4).
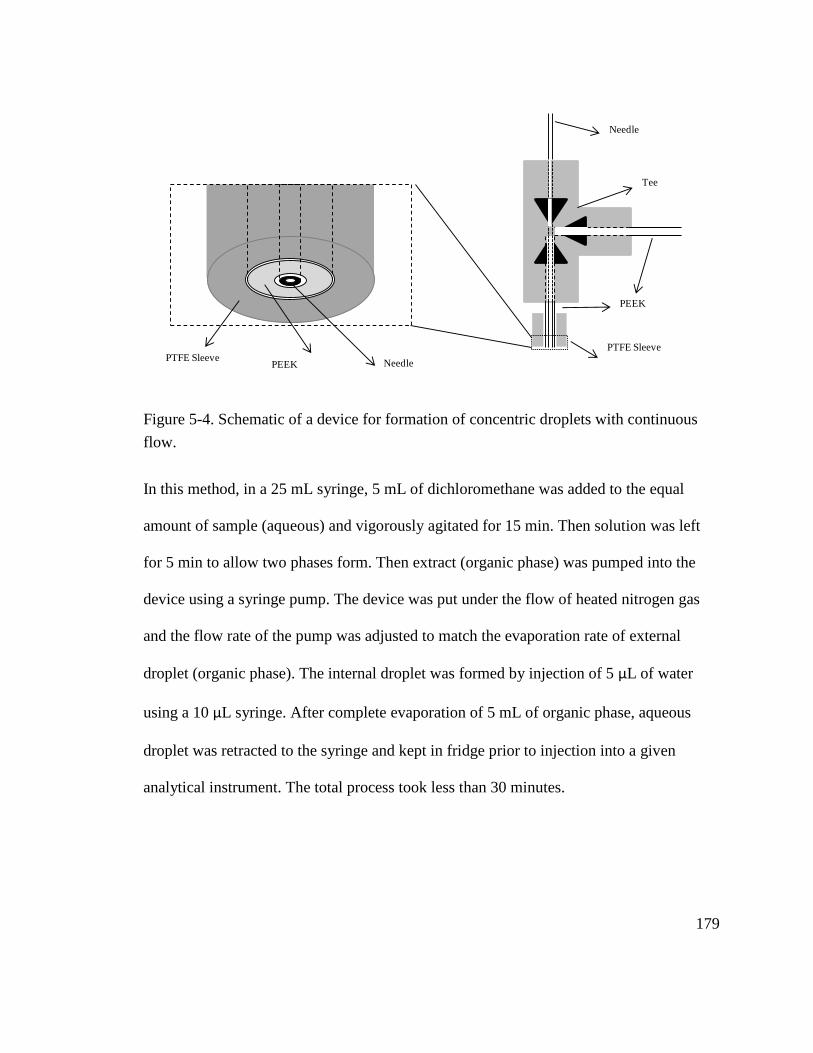
179
Figure 5-4. Schematic of a device for formation of concentric droplets with continuous
flow.
In this method, in a 25 mL syringe, 5 mL of dichloromethane was added to the equal
amount of sample (aqueous) and vigorously agitated for 15 min. Then solution was left
for 5 min to allow two phases form. Then extract (organic phase) was pumped into the
device using a syringe pump. The device was put under the flow of heated nitrogen gas
and the flow rate of the pump was adjusted to match the evaporation rate of external
droplet (organic phase). The internal droplet was formed by injection of 5 μL of water
using a 10 μL syringe. After complete evaporation of 5 mL of organic phase, aqueous
droplet was retracted to the syringe and kept in fridge prior to injection into a given
analytical instrument. The total process took less than 30 minutes.
NeedlePEEKPTFE Sleeve
PTFE Sleeve
PEEK
Needle
Tee

180
5.6. Quantitative Analysis
To evaluate the method quantitatively, calibration curves were constructed then two
blanks and two fortified samples were extracted simultaneously and analyzed using GC.
These experiments were repeated three times and results are listed in Table 5.3. The GC
conditions were as follow: temperature of injector was set to 250 ⁰C and 1:5 split,
injection volume was 1 μL and FID detector was employed at 300 ⁰C; oven temperature
program set to 50-250 ⁰C at a rate of 10 ⁰C min-1
, The GC and BD-225 column 30 m x
0.53 mm were from Agilent.
Table 5.3. Analytical data obtained using continuous flow single drop micro-extraction
Analytes Concentration (μg mL-1
) Enrichment %RSDa
Initial Final
NDMA 0.1 0.72 7.2 3.2
NMOR 0.1 1.3 13 4.5
NPYR 0.1 1.9 19 6.8
NPIP 0.1 3.4 34 3.9
NDEA 0.1 3.0 30 4.4
NDPA 0.1 4.4 44 5.1
NDBA 0.1 2.6 26 9.1 a-(n=6)
To evaluate the performance of the method in a real sample matrix, samples were
prepared by spiking a mixture of nitrosamine into tap water and seawater. Since
extraction and enrichment were combined, the enrichment factor may be a better
description of the performance. The enrichment factor is calculated based on the ratio

181
between final concentration (by GC) and initial concentration. Based on the results that
are listed in Table 5.2 and Table 5.3, SDME and CFSDME methods show enrichment
factor range 2.5-21 and 7.2-44 for CFSDME. The enrichment factors for NDMA, NMOR,
and NPYR are lower than others analytes due to their negative log P. Enrichment factor
trend is in agreement with log P values (see Table 5.2) except NDBA. Low boiling point
(or high vapor pressure) of NDBA is the main cause of loss during the drying step. In
general, the enrichment factor values obtained from SDME are smaller than those from
CFSDME, however, reproducibility of SDME method is better.
5.7. Conclusion
Efficient extraction and enrichment of neutral polar compounds from environmental
samples are challenging steps in any analytical method. Regardless of the type of
analytical technique, there has been a trend toward lower consumption of organic solvents
and smaller sample size. In this work, the main focus has been on developing a device for
enrichment of neutral polar compound in environmental samples. The methods proposed
are applicable to most of the analytical techniques for which small sample sizes are
preferred or easily accommodated including GC, UHPLC, CE, etc. three-phase single
drop microextraction was performed using syringe and dryer gas but due to small volume
of organic acceptor phase limited enrichments were achieved (upto 6 for highlypolar
nitrosamines and upto 20 for the rest). To increase the volume of organic phase) simple
and inexpensive components, such as syringes, PEEK tubing and fitting and syringe

182
pump were combined into devices that are easy to fabricate. PTFE sleeves were used to
increase the volume of extractant (drop size). To avoid the possibility of loss of drops, the
drop volume was kept low to maximize the ratio of contact area. This method was applied
to extract and enrich seven N-nitrosamines as a representative group of highly polar
neutral compounds and the results were promising. Enrichment factors up to 34 fold for
highly polar nitrosamines and 44 times for the rest were achieved in less than 30 min.

183
5.8. References:
[1] Spietelun, A., Kloskowski, A., Chrzanowski, W., Namieśnik, J., Chemical Reviews
2012, 113, 1667-1685.
[2] Souza Silva, E. A., Risticevic, S., Pawliszyn, J., TrAC Trends in Analytical Chemistry
2013, 43, 24-36.
[3] Bojko, B., Cudjoe, E., Gómez-Ríos, G. A., Gorynski, K., Jiang, R., Reyes-Garcés, N.,
Risticevic, S., Silva, É. A. S., Togunde, O., Vuckovic, D., Pawliszyn, J., Analytica
Chimica Acta 2012, 750, 132-151.
[4] Wardencki, W., Curyło, J., Namieśnik, J., J Biochem Bioph Meth 2007, 70, 275-288.
[5] Dehghani Mohammad Abadi, M., Ashraf, N., Chamsaz, M., Shemirani, F., Talanta
2012, 99, 1-12.
[6] Demeestere, K., Dewulf, J., De Witte, B., Van Langenhove, H., Journal of
Chromatography A 2007, 1153, 130-144.
[7] Jain, A., Verma, K. K., Analytica Chimica Acta 2011, 706, 37-65.
[8] Jeannot, M. A., Przyjazny, A., Kokosa, J. M., J Chromatogr A 2010, 1217, 2326-
2336.

184
[9] Lambropoulou, D. A., Konstantinou, I. K., Albanis, T. A., Journal of
Chromatography A 2007, 1152, 70-96.
[10] Psillakis, E., Kalogerakis, N., TrAC, Trends Anal. Chem. 2003, 22, 565-574.
[11] Jeannot, M. A., Cantwell, F. F., Anal Chem 1997, 69, 2935-2940.
[12] Bagheri, H., Ghambarian, M., Salemi, A., Es-Haghi, A., J Pharm Biomed Anal 2009,
50, 287-292.
[13] Choi, K., Kim, S. J., Jin, Y. G., Jang, Y. O., Kim, J. S., Chung, D. S., Anal Chem
2009, 81, 225-230.
[14] Choi, K., Kim, Y., Chung, D. S., Anal Chem 2004, 76, 855-858.
[15] Bagheri, H., Naderi, M., J Hazard Mater 2009, 165, 353-358.
[16] Liu, H., Dasgupta, P. K., Anal. Chem. 1995, 67, 4221-4228.
[17] Liu, H., Dasgupta, P. K., Anal Chem 1996, 68, 1817-1821.
[18] Jeannot, M. A., Cantwell, F. F., Anal Chem 1996, 68, 2236-2240.
[19] He, Y., Lee, H. K., Anal. Chem. 1997, 69, 4634-4640.
[20] Nerín, C., Salafranca, J., Aznar, M., Batlle, R., Analytical & Bioanalytical Chemistry
2009, 393, 809-833.

185
[21] Psillakis, E., Kalogerakis, N., TrAC Trends in Analytical Chemistry 2002, 21, 54-64.
[22] Xu, L., Basheer, C., Lee, H. K., Journal of Chromatography A 2007, 1152, 184-192.
[23] Liu, W., Lee, H. K., Anal Chem 2000, 72, 4462-4467.
[24] Li, Y., Zhang, T., Liang, P., Analytica Chimica Acta 2005, 536, 245-249.
[25] Pedersen-Bjergaard, S., Rasmussen, K. E., J Chromatogr B Analyt Technol Biomed
Life Sci 2005, 817, 3-12.
[26] Xia, L., Hu, B., Jiang, Z., Wu, Y., Liang, Y., Anal Chem 2004, 76, 2910-2915.
[27] Fiamegos, Y. C., Stalikas, C. D., Anal Chim Acta 2007, 597, 32-40.
[28] Ho, T. S., Pedersen-Bjergaard, S., Rasmussen, K. E., Analyst 2002, 127, 608-613.
[29] Pedersen-Bjergaard, S., Rasmussen, K. E., Anal Chem 1999, 71, 2650-2656.
[30] Berijani, S., Assadi, Y., Anbia, M., Milani Hosseini, M. R., Aghaee, E., J
Chromatogr A 2006, 1123, 1-9.
[31] Pakade, Y. B., Tewary, D. K., Journal of Separation Science 2010, 33, 3683-3691.
[32] Ridgway, K., Lalljie, S. P. D., Smith, R. M., Journal of Chromatography A 2007,
1153, 36-53.

186
[33] Psillakis, E., Ntelekos, A., Mantzavinos, D., Nikolopoulos, E., Kalogerakis, N., J
Environ Monit 2003, 5, 135-140.
[34] Rezaee, M., Assadi, Y., Milani Hosseini, M. R., Aghaee, E., Ahmadi, F., Berijani, S.,
J Chromatogr A 2006, 1116, 1-9.
[35] Shen, G., Lee, H. K., Anal Chem 2002, 74, 648-654.
[36] Asensio-Ramos, M., Ravelo-Pérez, L. M., González-Curbelo, M. Á., Hernández-
Borges, J., Journal of Chromatography A 2011, 1218, 7415-7437.
[37] Ho, T. S., Pedersen-Bjergaard, S., Rasmussen, K. E., J Chromatogr A 2002, 963, 3-
17.
[38] Choi, K., Jin, Y. G., Chung, D. S., J Chromatogr A 2009, 1216, 6466-6470.
[39] López-Blanco, M. C., Blanco-Cid, S., Cancho-Grande, B., Simal-Gándara, J.,
Journal of Chromatography A 2003, 984, 245-252.

187
Chapter 6 Summary and Future Work

188
MEKC is a powerful CE mode for analysis of charged and uncharged analytes. However,
MEKC suffers from the same limitation as CE with respect to detection limits,
particularly for detection with UV-vis (most common in commercial CE instruments).
Many solutions have been offered to overcome this problem either using more advanced
detectors or analyte enrichment. Application of different detection system can be costly
and, in some cases, are not applicable for all analytes. Online and offline sample
enrichment techniques are more popular ways to improve the sensitivity. There is no
general technique for analyte enrichment and techniques are often limited to use with a
group of compounds that share similar physical or chemical characteristics. Enrichment
of highly polar neutral compounds found in environmental samples such as drinking
water, wastewater, and seawater are more challenging. In light of finding a method of
enrichment for neutral polar analytes, N-nitrosamines were selected as a model due to
shortage of methods of analysis in the pertaining literature. CE rather than traditional GC
was selected as an analytical method because of the possibility of miniaturization (lab-on-
chip) and availability of several online preconcentration techniques.
First, an attempt was made to protonate the amino nitrogen using an acidic pH, but all
nitrosamines were not protonated based on CE results in the wide pH range (Chapter 4).
The lack of intrinsic electric charge eliminated many of the usual CE-based online
preconcentration techniques, including stacking. To compensate for the lack of mobility
of nitrosamines (uncharged) in an electric field, surfactants were used and methods based
on MEKC principles were developed. Application of surfactants in sweeping (a
189
preconcentration technique in CE) was a guide to designing a new sweeping technique for
preconcentration of highly polar neutral compounds, such as N-nitrosamines. Sweeping,
is one of the few techniques applicable to neutral compounds, here the surfactant imparts
mobility and enrichment for neutral compounds, but a strong interaction between analytes
and micelles is normally required. For highly polar compounds weak interactions with the
micelles means that these analyte spend more time in the capillary before reaching the
detector, thus diffusion causes excessive band broadening. In Chapter 2, a new method
was introduced to mediate this problem. In this method, which we call pressure assisted
sweeping RM-EKC, an auxiliary pressure was applied to boost the velocity of slow
moving analytes and minimize the band broadening.
To optimize the method, all the parameters that may improve the efficiency were
examined. The effect of different factors, such as concentration of surfactants, type of
surfactants and ionic strength of background electrolyte, on separation were studied and
results presented in Chapter 2 and 3. Different types of surfactants including SDS, CTAC,
CTAB, bile salts, and APFO (at various concentrations) were selected and their
associated k values were studied. Interactions between analytes and surfactants were
compared to find the best pseudostationary phase for nitrosamines (Chapter 3). This
technique was implemented for real samples and results were compared to an offline
enrichment technique (SPE) in Chapter 4. Considering the amount of time spent for
sample preparation, the SPE-MEKC method compared to the proposed online
preconcentration technique’s enrichment was not impressive.

190
Since sweeping was performed under zero, EOF conditions and analyte migration was
dictated only by the affinity for the micelles and the linear velocity of the micelles,
resulting in migration times can be long, especially for polar analytes. Short capillaries
can make analysis times more reasonable and reduce peak broadness, but they limit the
maximum injection volume and thus concentration factors. Born from necessity, a system
for application of controllable, uniform pressure that could be easily integrated into a
commercial CE system was designed and fabricated. The introduction of different
regulator configurations can allow for better pressure control; the upper limit for fine
control regulator used here was 100 mbar. It was demonstrated that by using an external
auxiliary pressure device, analysis times can be reduced without compromising separation
efficiency and allowing for use of longer capillaries to accommodate larger sample
volumes. Peak shape and separation efficiency was impacted when the conductivity of
sample solution was different than BGE. Separation results were best when a high
conductivity sample was paired to a BGE of lower conductivity; i.e., if sample salinity
was high, large volumes of sample could be injected without compromising the
separation. Using higher surfactant concentrations (up to 200 mM SDS) than usual for
MEKC (i.e. 50 mM SDS) improved the sweeping. By optimizing all parameters that
influence sweeping-RM-EKC (i.e., surfactant loading and type, application of pressure,
changes to composition of sample, etc.), good online preconcentration methods can be
developed for polar analytes that typically are poorly suited for normal sweeping.

191
A number of factors have been studied to improve the enrichment of polar neutral
nitrosamines by pressure-assisted sweeping-RM-ECK, including ways to suppress the
EOF (by pH and coated capillaries). In fused silica capillaries, the EOF can be suppressed
at pH<2 but this limits our selection of surfactants. Coated capillaries were better
alternatives for suppression of the EOF. Among different coated capillaries studied in this
work, the sulfonic acid (PSA) coated capillaries were capable of suppressing the EOF -
with any type of surfactant - over the pertinent pH range (2-8).
To maximize the retention factor, parameters such as type and concentration of
surfactants that influence K and φ were studied. In general, SDS showed reasonable
performance however; application of cationic surfactants were shown to be a useful
alternative surfactant for analysis of nitrosamines due to their ability to act as a hydrogen
bond donors. APFO, showed remarkable results in terms of peak shapes and number of
theoretical plates, however, NDEA and NPIP remained unresolved despite of the
increasing concentration of surfactant. Nevertheless, the compatibility of APFO with
mass spectrometry makes it attractive, and use of mixed micelle systems can be exploited
to improve resolution of these co-migrating species.
An MEKC method for N-nitrosamines has been developed and results are presented in
Chapter 4. For this method, the effects of concentration of surfactant, pH, concentration
of buffer solution, organic modifiers, capillary size, injection volume, and temperature
were systematically studied and optimized. In this method, 125 mM of SDS in 25-50 mM
of ammonia buffer at pH=10 were used. To improve the limit of detection and

192
quantitation, a pre-concentration method based on SPE was optimized and combined with
the MEKC method. After comparing a wide range of commercially-available sorbents,
the best results were obtained using coconut charcoal for sorbent. Inability of the SPE
sorbents to retain some of the nitrosamines such as NDMA, NMOR, and NPYR
compromised the method.
As mentioned before, during our literature survey, we noticed that there was a lack of
linear solvation energy relationship, LSER, study on N-nitrosamines, but to carry out
extensive LSER studies was out of the scope of research presented in this thesis. This can
be an interesting research topic for future work. This study can be used for prediction of
partitioning behavior of this group of compounds in different micellar systems. Also, it
can be useful for selecting novel and more efficient surfactant systems [1]. Our present
work was limited to using a small group consisting of different surfactants based on
information found from literature. However, using a limited number of surfactant
systems, has identified that the structure of surfactant can play a major role in the
interaction between analytes and micelles. To obtain a better understanding regarding the
interaction between solute and micellar system, a larger selection of surfactants would be
required. One approach is to extend the previous LSER studies by adding nitrosamines to
the list of model compounds. Application of ionic liquid for sweeping [2] can also be
considered.
In Chapter 5, the main focus was on developing a device for enrichment of neutral polar
compounds in environmental samples. A method was proposed that was applicable to
193
most of the analytical techniques for which sample sizes as low as few micro-litres, can
be accommodated, such as GC, UHPLC, and CE. Using a device that was easy and
inexpensive to construct, a continuous flow single-drop micro-extraction method was
developed. Dichloromethane was used as primary extractant due to its immiscibility with
aqueous solution and low boiling point. Later, the primary extractant was introduced into
the proposed device as the outer portion of a two-phase concentric droplet with a drop of
water as the inner droplet. To increase the volume of extractant, PTFE sleeves were used
to increase the area to which the drop can adhere. To avoid the possibility of loss of
droplets, the drop volume was kept at half the maximum volume of a sphere defined by
the outer diameter of PTFE sleeves. As the outer droplet evaporated, the analyte was
transferred to inner water droplet as acceptor phase, which was used for analysis. This
method was applied to extract and enrich N-nitrosamines as a group of highly polar
neutral compounds and gave enrichment factors range of 7.2-44 times.
In this present work, due to the small volume of extract, we were only able to evaluate the
performance using GC. Sample collection and transfer were the most important
limitations to our choice of analytical instrument. For example, using HPLC or CE at
least a few-hundred microlitres of sample volume must be collected into a vial. To
overcome this problem, an automated device tailored to a commercially available
analytical instruments is required. This device can provide and transfer the sample
directly to the injection port of a given instrument. For example, in Figure 6.1 a design for
automation of the above method is demonstrated. In this figure, the continuous single

194
drop micro-extraction is combined to a solid phase extraction cartridge and the final
extractant is pumped into an analytical instrument. In this device, a combination of two
multiport valves, a nitrogen tank, and pumps are used. Sample, water and solvent are
introduced into a SPE cartridge for sample clean up and enrichment and then the effluent
is directed toward our proposed device for further enrichment and phase transfer.
Figure 6-1. Schematic an automated continuous flow single drop micro-extraction.
Water, sample, and solvent (eluent) can be pumped into a SPE cartridge accordingly and
flow of nitrogen gas is used for drying the sorbent in SPE and extractant in single drop
micro-extraction. Finally extractant is pumped to an analytical instrument.
To enhance the selectivity, application of molecular imprinted solid phase extraction
(MISPE) [3]instead of SPE is also recommended. Finally following phase transfer and
final preconcentration the enriched extract is transported to a given analytical instrument.

195
This device can be used as an external module or added to an analytical instrument. Most
of the CE-enrichment techniques are applicable to the lab-on-chip technologies [4]
including the continuous flow single drop micro-extraction method. All tubing, tees,
syringes and needles can be replaced by chan8nels. In this case, the amount of solvent
will be reduced to a nanolitre scale. Using a three-phase system and stabilizing larger
volume drops using hollow fibre [5] in combination with MEKC [6] is another suggestion
for future research. In this instance, the organic phase can be formed inside the fibre
while aqueous drop can be formed and supported by hollow fibre.
In this work, the overarching theme is analysis of highly polar compounds, but only N-
nitrosamine was used as model compound. Based on physical and chemical properties of
selected N-nitrosamines (Table 1.1), the method performance by CE was impressive; the
use of these methods for enrichment and analysis of less polar neutral compounds may
show even better results. These methods are more suitable for analysis of
pharmaceuticals, pollutants, pesticides, etc.
6.1. References:
[1] Lu, J., Ni, X., Cao, Y., Ma, X., Cao, G., Electrophoresis 2015, 36, 312-318.

196
[2] Abd El-Hady, D., Albishri, H. M., Rengarajan, R., Wätzig, H., Electrophoresis 2014,
35, 1956-1964.
[3] Sun, H., Lai, J.-P., Fung, Y. S., Journal of Chromatography A 2014, 1358, 303-308.
[4] Proczek, G., Augustin, V., Descroix, S., Hennion, M.-C., Electrophoresis 2009, 30,
515-524.
[5] Tajabadi, F., Ghambarian, M., Yamini, Y., Analytical Methods 2015, 7, 2959-2967.
[6] Zhou, X., He, M., Chen, B., Hu, B., Analyst 2015, 140, 1662-1671.

197
Appendix A

198
Table A.1. Physical properties of most common used solvent as extracting phase for micro-extraction a
Organic solvents Boiling point
(°C)
Vapour pressure
(Torr)
Water solubility
(mgL-1
)
Density
(gcm-3
)
Viscosity
(cP)
Surface tension
(dyn cm−1
)
Dipole
moment (D)
Dielectric
constant
Cyclohexane 80.7 97.8 55 0.78 0.90 24.65 0.00 2.02(20⁰C)
n-Hexane 68.7 151.3 1.2 0.65 0.29 17.94 0.08 1.88
Octane 125.7 14.0 6.6x10⁻³
0.70 0.51 21.18 0.00 1.95(20⁰C)
Iso-octane 99.2 49 2.4 0.69 0.50(20⁰C) 18.8 0.00 1.94(20⁰C)
Decane 174.2 1.3 0.05 0.73 0.86 23.37 0.00 1.99(20⁰C)
Benzene 80.1 95.2 1791 0.87 0.60 28.2 0.00 2.27
Toluene 110.6 28.8 515 0.86 0.55 27.92 0.31 2.38
o-Xylene 144.4 6.6 175 0.88 0.76 29.49 0.45 2.57(20⁰C)
m-Xylene 139.1 8.3 146 0.86 0.58 28.10 0.30 2.37(20⁰C)
p-Xylene 138.4 8.7 156 0.86 0.60 27.76 0.02 2.27(20⁰C)
Ethylbenzene 136.2 9.6 152 0.86 0.64 28.48 0.37 2.40(20⁰C)
Methanol 64.5 127.0 0.79 0.55 22.30 2.87 32.66
Ethanol 78.3 59.0 0.79 1.08 22.32(20⁰C) 1.66 24.55
1-Octanol 195.2 0.08 538 0.82 7.36 26.92 1.76 10.34(20⁰C)
Benzyl alcohol 205.4 0.11 800 1.04 4.65(30⁰C) 39.44 1.66 13.1(20⁰C)
Ethylene glycol 197.5 0.09 1.11 13.76 48.49(20⁰C) 2.31 37.7
Acetone 56.1 231.1 0.78 0.30 22.68 2.69 20.56

199
Continued:
Organic solvents
Boiling
point
(°C)
Vapour pressure
(Torr)
Water
solubility
(mgL-1
)
Density
(gcm-3
)
Viscosity
(cP)
Surface tension
(dyn cm−1)
Dipole
moment (D)
Dielectric
constant
4-mthyl-2-pentanone 117.4 18.8 17000 0.80 0.55 23.64(20⁰C) - 13.11(20⁰C)
α,α,α-Trifuorotoluene 102.0 38.5 - 1.18 0.57(19.80⁰C) 23.41(20⁰C) 2.56 9.03
Chlorobenzene 131.7 11.7 327 1.10(20⁰C) 0.72(20⁰C) 31.98(20⁰C) 1.62 5.62
Dichlorometane 39.6 435.8 1980 1.32 0.39(30⁰C) 26.54(20⁰C) 1.14 8.93
Chloroform 61.2 194.8 8500 1.48 0.54 26.53 1.15 4.81(20⁰C)
Tetrachlorometane 76.6 115.2 770 1.58 0.90 26.13 0.00 2.23
1,2 dichloroethane 83.5 83.2(20⁰C) 8100(20⁰C) 1.25 0.73(30⁰C) 30.84(30⁰C) 1.83 10.37
1,2 dichlorobenzene 180.5 1.3 156 1.30 1.32 26.48(20⁰C) 2.14 9.93
Tetracholoroethylene 121.1 18.5 150 1.61 0.80(30⁰C) 31.30 0.00 2.28
Bromobenzen 155.9 4.2 424 1.48 1.01(30⁰C) 35.09(30⁰C) 1.55 5.40
Nitrobenzene 210.8 0.28 1900(20⁰C) 1.20 1.62(30⁰C) 42.17(30⁰C) 4.00 34.78
Acetonitrile 81.6 88.81 0.78 0.34 28.25 3.53 35.94
Pyridine 115.2 20 0.98 0.88 36.33 2.37 12.91
N΄Nˮ-dimethyl-formamide 153.0 3.7 0.94 0.80 36.42 3.24 36.71
Carbon disulfide 46.2 361.6 2100(20⁰C) 1.29 0.36(20⁰C) 32.25(20⁰C) 0.06 2.64
a- Data obtained from CRC Handbook of Chemistry and Physics 66th
edition

200
Appendix B
Single-drop microextraction apparatus

201
Figure B-1 Single-drop extraction assembly for making co-centric droplets using 10 µL
syringe and PEEK tubings and fittings.

202
Figure B-2 Configuration for continuous flow single-drop extraction using 10 µL syringe
and PEEK tubings ad fittings

203
Figure B-3 Configuration for continuous flow single-drop extraction using syringe pump.

204
Figure B-4 Configuration for contious flow single-drop extraction using pristaltic pump
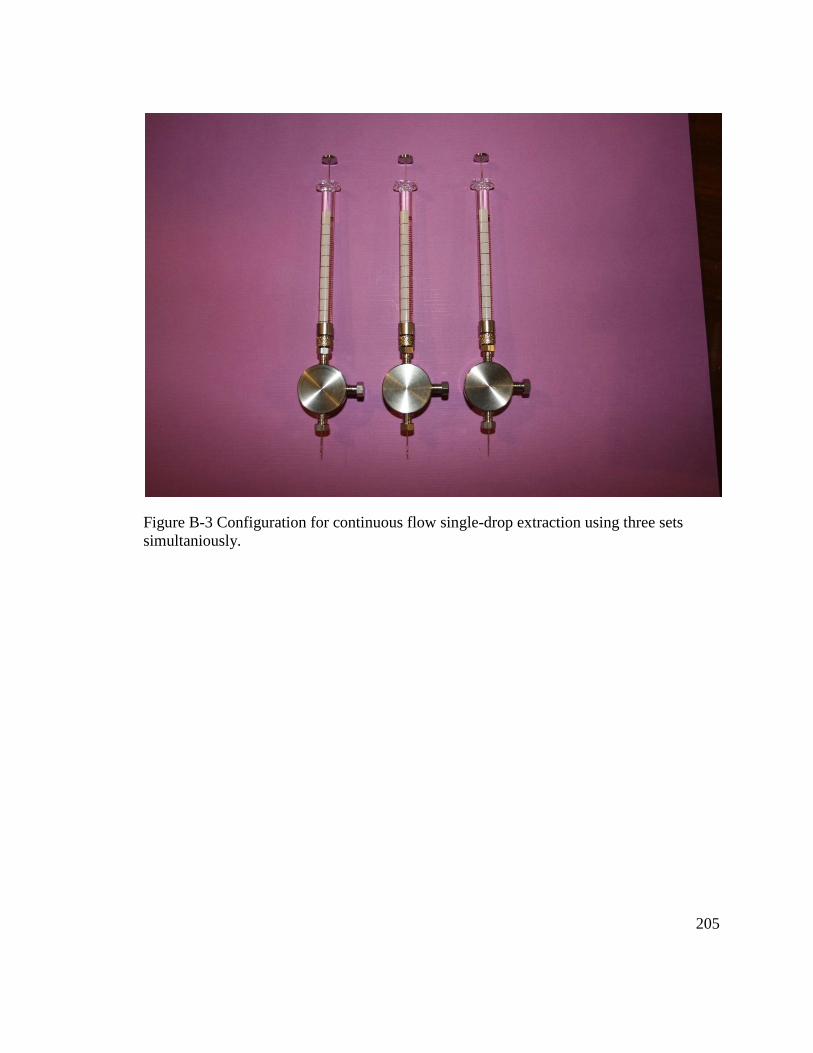
205
Figure B-3 Configuration for continuous flow single-drop extraction using three sets
simultaniously.


![High Performance Liquid Chromatography Incorporating to ...liquid chromatography [1-5, 7, 9, 15-20], gas chromatography [12, 21], micellar electrokinetic capillary chromatography [22],](https://img.pdfslide.us/doc/110x75/609dca3350c83715332046f7/high-performance-liquid-chromatography-incorporating-to-liquid-chromatography.jpg)