Embed Size (px)
Citation preview

Capillary electrophoresis of biomolecules : theory,instrumentation and applicationsCitation for published version (APA):vd Goor, A. A. A. M. (1992). Capillary electrophoresis of biomolecules : theory, instrumentation and applications.Eindhoven: Technische Universiteit Eindhoven. https://doi.org/10.6100/IR389555
DOI:10.6100/IR389555
Document status and date:Published: 01/01/1992
Document Version:Publisher’s PDF, also known as Version of Record (includes final page, issue and volume numbers)
Please check the document version of this publication:
• A submitted manuscript is the version of the article upon submission and before peer-review. There can beimportant differences between the submitted version and the official published version of record. Peopleinterested in the research are advised to contact the author for the final version of the publication, or visit theDOI to the publisher's website.• The final author version and the galley proof are versions of the publication after peer review.• The final published version features the final layout of the paper including the volume, issue and pagenumbers.Link to publication
General rightsCopyright and moral rights for the publications made accessible in the public portal are retained by the authors and/or other copyright ownersand it is a condition of accessing publications that users recognise and abide by the legal requirements associated with these rights.
• Users may download and print one copy of any publication from the public portal for the purpose of private study or research. • You may not further distribute the material or use it for any profit-making activity or commercial gain • You may freely distribute the URL identifying the publication in the public portal.
If the publication is distributed under the terms of Article 25fa of the Dutch Copyright Act, indicated by the “Taverne” license above, pleasefollow below link for the End User Agreement:
www.tue.nl/taverne
Take down policyIf you believe that this document breaches copyright please contact us at:
providing details and we will investigate your claim.
Download date: 01. Mar. 2020
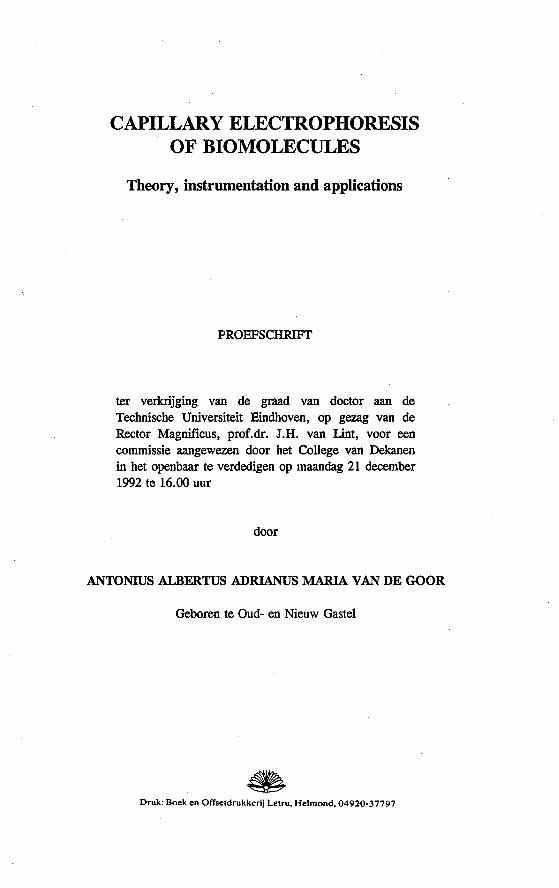
CAPILLARY ELECTROPHORESIS OF BlOMOLECULES
Theory, instrumentation and applications
10
-----------8
11 1358
8
7 1078
8 872
5
" 803
281
L 3 271
310 2
72j8_1jJ~~J 0
·1 11 12 13 14 15 18 17 18 19 20 21 22 23 24
tirr. (min)
ANTONIUS ALBERTUS ADRIANUS MARIA VAN DE GOOR
CAPILLARY ELECTROPHORESIS OF BlOMOLECULES
Theory, instrumentation and applications
PROEFSCHRIFT
ter verkrijging van de graad van doctor aan de Technische Universiteit Eindhoven, op gezag van de Rector Magnificus, prof.dr. J.H. van Lint, voor een commissie aangewezen door het College van Dekanen in het openbaar te verdedigen op maandag 21 december 1992 te 16.00 uur
door
ANTONIUS ALBERTUS ADRIANUS MARIAVAN DE GOOR
Geboren te Oud- en Nieuw Gastel
Druk: Boek en Offsetdrukkerij Letru, Helmond, 04920-37797

Dit proefschrift is goedgekeurd door de promotoren:
prof.dr.ir. F.M. Everaerts en
prof.dr.ir. C.A.M.G. Cramers

It is better to worry about things, one can change than to worry about those, one cannot alter

Aan Jana en Dennis
CONTENTS
CONTENTS
GENERAL INTRODUCTION Bistory of Capillary Electrophoresis . • . . . . . . . . . . . . . . . . . . . . . . 1 About this thesis • . • . • . . . . • . . . . . . • . . . . . . . . . . • . . . . . . . . 5 References . . . . . . . . . . . . . . . . . . . . . . . . . . . . . . . . . . . . . . . . . 6
1. PR1NCIPLES OF CAPILLARY ELECTROPHORESIS Abstract 7 1.1 Electrophoresis and electrophoretic mobllity ............. 7 1.2 Electroosmosis and electroosmotie mobility ............. 10 1.3 Modes of capillary electrophoresis . . . . . . . . . . • . . . . . . • . 12 1.4 Factors influencing performance .................... 14 1.5 Peak broadening .•.•...................... r ••• 15
1.5.1 Injection 16 1.5.2 Diffusion 16 1.5 .3 Joule Heating 17 1.5.4 Electroosmosis 17 1.5.5 Electrodispersion 18 1.5.6 Surface interaction 18 1.5.7 !deal separation conditions 19
1.6 Calculation of data from experimental parameters . . . . . . . . 20 1.6.1 Injection pluglengthand volume 20 1.6.2 Total heat generated and temperature profties 20 1.6.3 Electrophoretic and electroosmotie mobility 21 1.6.4 Plate numbers 21 1.6.5 Peak area and corrected peak area 21
1. 7 Conclusions . . . . . • . . . . . . . . . . . . . . . . . . . . . . . . . . . 22 References 22
2.INSTRUMENTATION FOR CAPILLARY ELECTROPHORESIS Abstract 23 2.1 Introduetion . . . . . . . . . . . . . . . . . ....•........... 23 2.2 Basic instrumentation for capillary electrophoresis . . . . . . . . 24 · 2.3 Instrument& using UV detection 27
2.3.1 Laboratory built instrument 27 2.3.2 Commercial instrument 28
2.4 Instrument& using LIF detection . . . . . . . . . . . . . . . . . . . . 28 . 2.4.1 Laboratory built instrument 28 2.4.2 Commercial instrument 29
2.5 Conclusions • . . . . . . . . • . . • . . . . . . . . . . . . . . . . . . . . 30 References 30
I
CONTENTS
3. MEASUREMENT AND CONTROL OF ELECTROOSMOTie FLOW Abstract 31 3.1 Introduetion ................................. 31 3.2 Theory of electrokinetic phenomena . . . . . . . . . . . . . . . . . . 33 3.3 Experimental . . . . . . . . . . . . . . . . . . . . . . . . . . . . . . . . 36
3.3.1 Streaming potentials 36 3.3.2 Weighing 38 3.3.3 Conductivity cell 39
3.4 Results and d.iscussion ........................... 40 3.5 Conclusions . . . . . . . . . . . . . . . . . . . . . . . . . . . . . . . .. 45 References 45
4. DERIV ATIZATION~ SEPARATION AND DETECTION OF AMINO ACIDS IN CAPILLARY ELECTROPHORESIS Abstract 47 4.1 Introduetion . . . . . . . . . . . . . . . . . . . . . . . . . . . . . . ... 47 4.2 Laser indoeed fluorescence . . . . . . . . . . . . . . . . . . . . .... 49 4.3 Experimental . . . . . . . . . . . . . . . . . . . . . . . • . . . ..... 52 4.4 Results and discussion . . . . . . . . . . . . . . . . . . . . . . . . . .. SS 4.5 Concluslons . . . . . . . . . . . . . . . . . . . . . . . . . . . . . . . . . 60 References 61
5. PREDICTION AND OPI'IMIZATION OF PEPTIDE SEPARATIONS IN CAPll..LARY ELECTROPHORESIS Abstract 63 5.1 Introduetion ................................. 63 5.2 Predietion of electrophoretic mobility . . . . . . . . . . . . . . . . . 64 5.3 Experimental . . . . . . . . . . . . . . . . . . . . . . . . . . . . . . . . 66 5.4 Results and diseussion . . . . . . . . . . . . . . . . . . . . . . . . . . . 68 5.5 Laser indoeed fluorescenee of a proteindigest ........... 76 5.6 Conclusions . . . . . . . . . . . . . . . . . . . . . . . . . . . . . . . . . 79 References 79
li

CONTENTS
6. OLIGONUCLEOTIDE AND DNA RESTRICTION FRAG:MENT SEPARATIONS USING CAPILLARY ELECTROPHORESIS Abstract 81 6.1 Introduetion . . . . . . . . . . . . . . . . . . . . . • . • . . . . . . . . . 81 6.2 Theory of migration of DNA in polymer networks . . . . . . . . . 83
6.2.1 The Ogston model 84 6.2.2 The reptation model 84 6.2.3 Estimation of mesh/pore size 86
6.3 Separation of oligonucleotides using crosslinked polyacrylamide filled capillaries . . . . . . . . . . . . . . . . . . . . 87 6.3.1 Introduetion 87 6.3.2 Experimental 87 6.3.3 Results and discussion 89 6.3.4 Conelusions 93
6.4 Separation of DNA restrietion fragments using linear polyacrylamide gel fllled capillaries • . • • • . . . . . . . .•••.. 94 6.4.1 Introduetion 94 6.4.2 Bxperimental 95 6.4.3 Results and discussion 95 6.4.4 Conclusions 101
6.5 Qualitative and quantitative analysis of PCR fragments using linear polyacrylamide gel rilled capillaries .........•... 101
6.6 Separation of DNA restrietion fragments using agarose gel fûled capillaries ...•.•.............•.....•..... ; .. 108
6. 7 Separation of DNA restrietion fragments using buffers containing hydroxymethylcellulose .....•......•............ 110 6.7.1 Introduetion 110 6.7.2 Bxperimental 111 6. 7.3 Results and discussion 111 6.7.4 Conclusions 115
6.8 Conclusions •...•...........•............... 115 References 116
Sl.J1\1l\fAR Y • • • . . • . . . • • • • • . • . . . . • • • • • • • . • . . . . . • • • • • . • 117 SAl\ffiNVATTING ...........•......................... 119 Symbols and abbreviations ................................ 121 Dankwoord en Curriculum Vitae . . . . . . . . . . . . . .. , . . . . . . . . . . . . 123 Authors publications on Capillary Electrophoresis ................. 124
m

CONTENTS
IV
This work bas been supported by a grant of tbe Dutcb Foundation for Scientific Research (NWO).
Bistory of CE
GENERAL INTRODUCTION
llistoey of Capillaey Electrophoresis
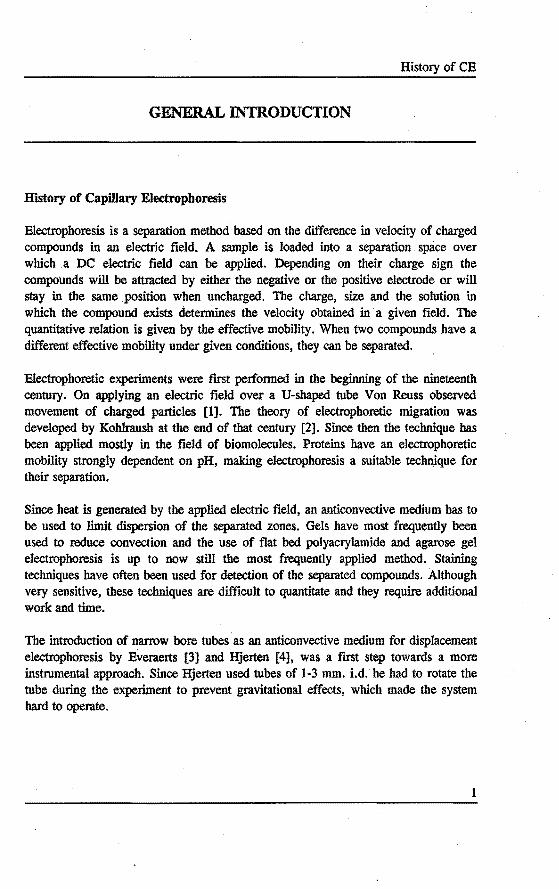
Electrophoresis is a separation metbod based on the difference in velocity of charged compounds in an electtic field. A sample is loaded into a separation spàce over which .a DC electric field can be applied. Depending on their charge sign the compounds will be attracted by either the negative or the positive electrode or will stay in the same position when uncbarged. Tbe charge, size and the solution in which the compound exists delermines the velocity obtained in· a given field. Tbe quantitative relation is given by the effective mobility. When two compounds have a different effective mobility under given conditions, they can be separated.
Electrophoretic experiments were frrst performed in the beginning of the nineteentb century. On applying an electtic field over a U-shaped tube Von Reuss observed movement of charged particles [1]. Tbe theory of electropboretic migration was developed by Kohlraush at the end of that century [2]. Since then the technique bas been applied mostly in the field of biomolecules. Proteins have an electrophoretic mobility strongly dependent on pH, making electrophoresis a suitable technique for their separation.
Since heat is generated by the applied electtic field, an anticonvective medium bas to be used to limit dispersion of the separated zones. Gels have most frequently been used to reduce convection and the use of flat bed polyacrylamide and agarose gel electrophoresis is up to now still the most frequently applied method. Staining techniques have often been used for detection of the separated compounds. Although very sensitive, these techniques are difficult to quantitate and they require additional work and time.
Tbe introduetion of narrow bore tubes as an anticonvective medium for displacement electrophoresis by Evernerts [3] and Hjerten [4], was a first step towards a more instromental approach. Since Hjerten used tubes of 1-3 mm. i.d. he had to rotale the tube during the experiment to prevent gravitational effects, which made· the system hard to operate.
1

GENERAL INTRODUCTION
Giddings [5] predicted that theoretically high efficient separations could be reached if ditfusion would be the only souree of dispersion in a well thermostatted system using high electrlc fields.
Reduction of the tube diameter was the clear solution to this problem as was shown by Everaerts using Teflon capillaries and thermocouple detector [6] and Virtanen using glass capillaries of 0.2*0.5 mm i.d. [7]. He described theoretically and experimentally the process of zone electrophoresis and electroosmosis in capillary systems. It became clear that reduction of diameter would put strong emphasis on both injection and detection. Improvement of suitable detectors limited further reduction of diameter.
In the early seventies, isotachophoresis was developed by Everaerts [8] as another approach to capillary electrophoretic separation. The use of a double electrolyte system which sandwiched the sample and created a system in which the separated zones would migrate with a concentration determined by the teading buffer, made it possible to show high resolution separations. Since the detector was not the limiting factor due to the self correcting properties, applications in a wide range were shown. Performed in Teflon capillaries of 0.2-0.5 mm i.d. and using a potential gradient detector the technique became more widespread. However, due to the instromental aspects and the rather complex buffer selection involved, it did not bring a breakthrough like liquid chromatography.
In 1979 Mikkers showed tbe experimental evaluation of the non-ditfusional model of concentration distributions in free zone electrophoresis [9, 1 0]. He used an isotachophoretic instrument using 0.2. mm i.d. Teflon tube. Although he bad to overload the system he could show zone electrophoretic separations of some organic acids reaching tbe theoreticallimits as predicted by Giddings.
The real breakthrough came in 1981 when Jorgenson showed zone electrophoretic separations using open glass capillaries of 75 J.tm i.d. and a fluorescence detector as an on-line detection metbod [11]. In these narrow bore capillaries, he showed that longitudinal ditfusion is practically the only souree of band broadening and the predicted efficiency could nearly be reached. Later he also used fused silica capillaries, which already had shown to be a breakthrough in gas chromatography, as tbe separation tube.
2

History of CE
Another approach bas been shown by Tembe wbo used an electrolyte system containing micelles to create a separation metbod based on electrophoresis and cbromatogmphy which he named Micellar Electrokinetic Capillary Chromatogmphy [12]. In this technique, neutral compounds can be separated due to their difference in affinity for the micellar phase which is migrating electrophoreticly in the capillary.
Por compounds which have similar effective mobility but a different size, as is often the case for biopolymers Iike DNA, gels as were previously used were reintroduced but now in the capillary tube. The use was not to serve as an anticonvective medium but to create a mesh to have size based separation. Karger showed that for DNA high resolution sepamtions based on · size could be performed in these systems [13].
Also, isoelectric focusing, which is one of the most used sepamtion modes in flat gel electrophoresis, bas been introduced in the capillary format by Hjerten [14]. The suppression of electroosmosis, which can disturb the formation of a stabie pH gmdient, and a means to move the gmdient undisturbed along the detection window, have been the major problem in the use of this mode.
Also, the use of isotachophoresis in open tubular fused silica capillaries bas been demonstmted by Evernerts [15]. The existing electrosmoosis, which can change during the run due to the cbanging buffer conditions, and the non-universa! choice of · a UV detector have made the applicability however difficult.
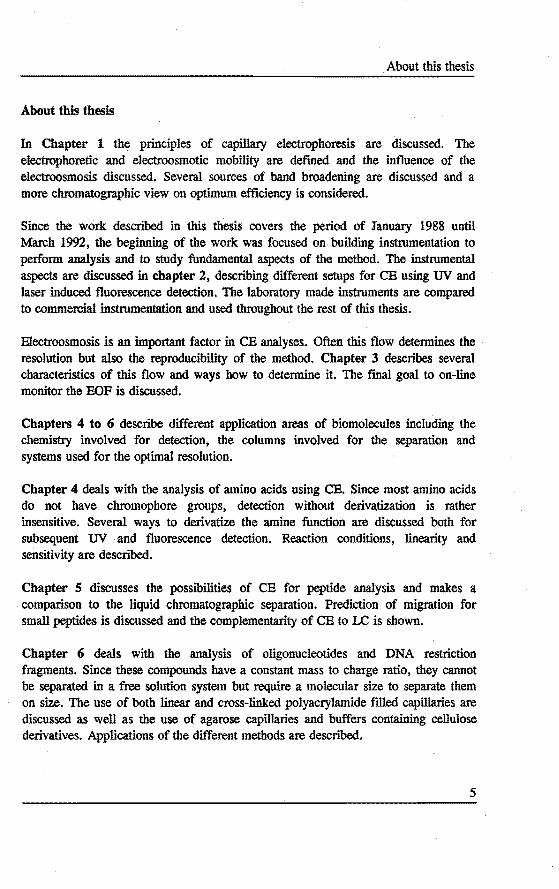
Since 1989, commercial instrumentation bas become available, giving the use and application of capillary electrophoresis an enormous impulse. Figure I shows the number of papers publisbed in the scientific literature on capillary electrophoretic techniques. Outside of the university labomtories, people had·the opportunity to see what this new technique can do for their separation problems and the expectation is that capillary electrophoresis will settie in the near future as one of the key separation methods available in the analytical labomtory.
3

GENERAL INTRODUeTION
I!! • i à c:
4
- CZE
210
180
150
120
80
80
80
0 1887 11171
- CEC
1967 1971
CJ iTP
11175 1979
year
CJ lEF
1975 1979
year
liiil!lil!ll!ll MECC
1$113 1987 1991
liiil!lil!ll!ll CGE
1983 19117 1991
Fig 1: Numbers of papers found in Chemical Abstracts, covering the different modes of CE over the last 25 years.
About tbis thesis
About this thesis
In Chapter 1 the principles of capillary electrophoresis are discussed. The electrophoretic and electroosmotie mobility are defmed and the influence of the electroosmosis discussed. Several sourees of band broadening are discussed and a more chromatographic view on optimum efficiency is considered.
Since the work described in tbis thesis covers the period of January 1988 until March 1992, the beginning of the work was focused on building instrumentation to perform analysis and to study fundamental aspects of the method. The instromental aspects are discussed in chapter 2, descrihing different setups for CB using UV and laser induced fluorescence detection. The laboratory made instruments are compared to commercial instrumentation and used throughout the rest of tbis thesis.
Blectroosmosis is an important factor in CB analyses. Often this flow determines the resolution but also the reproducibility of the method. Cbapter 3 describes several cbaracteristics of this flow and ways how to determine it. The fmal goal to on-line monitor tbe BOF is discussed.
Cbapters 4 to 6 describe different application areas of biomolecules including tbe chemistry involved for detection, tbe columns involved for the separation and systems used for the optimal resolution.
Chapter 4 deals with the analysis of amino acids using CB. Since most amino acids do not have chromophore groups, detection without derivatization is rather insensitive. Several ways to derivatize the amine function are discussed both for subsequent UV and fluorescence detection. Reaetion conditions, linearity and sensitivity are described.
Chapter 5 discusses the possibilities of CE for peptide analysis and makes a comparison to the liquid chromatographic separation. Preelietion of migration for small peptides is discussed and the complementarity of CB to LC is shown.
Chapter 6 deals with the analysis of oligonucleotides and DNA restrietion fragments. Since these compounds have a constant mass to charge ratio, they cannot be separated in a free solution system but require a molecular size to separate them on size. The use of both linear and cross-linked polyacrylamide filled capillaries are discussed as well as the use of agarose capillaries and buffers containing cellulose derivatives. Applications of the different metbods are described.
5

GENERAL INTRODUCTION
References
1. F. von Reuss, Comment. Soc. Phys. Univ. Mosquensem, 1 (1808) 14L 2. F. Kohlraush, Ann. Phys. (Leipzig), 62 (1897) 209. 3. A.J.P. Martin and P.M. Everaerts, Anal. Chim. Acta, 38 (1967) 233-237. 4. S. Hjerten, Chrom. Rev., 9 (1967) 122. 5. J.C. Giddings, Separ. Sci. 4 (1969) 181. 6. P.M. Everaerts and W.M.L. Hoving-Keulemans, Sci. Tools, 17 (1970) 25-28. 7. R. Virtanen, Acta Polytech. Scand., 123 (1974) 1. 8. P.M. Everaerts, J.L. Beekers and Th.P.E.M. Verheggen, Isotachophoresis, Theory,
Instrumentation and Applications (Journal of Chromatography Libraray, Vol 6) Elsevier, Amsterdam, 1976.
9. P.E.P. Mikkers, P.M. Everearts, Th.P.E.M. Verheggen, J.Chromatogr., 169 (1979) L
10. P.E.P. Mikkers, P.M. Everaerts, Th.P.E.M. Verheggen, J. Chromatogr. 169 (1979) 11.
11. J.W. Jorgenson and K.D. Lukacs, Anal. Chem. 53 (1981) 1298. 12. S. Terabe, K.Otsuka, K. Ichikawa, A.Tsuchiya and T.Ando, Anal. Chem. 56 (1984)
111. 13. A.S. Cohen and B.L. Karger, J. Chromatogr., 397 (1987) 409-417. 14. S. Hjerten and M.D. Zhu, J. Chromatogr. 346 (1985) 265-270. 15. J.L. Beckers, P.M. Everaerts and M.T. Ackermans, J. Chromatogr. 537 (1991) 429-
442.
6
Electrophoresis and electrophoretic mobility 1.1
CIIAPTER.l
PRINCIPLES OF CAPILLARY ELECTROPHORESIS
ABSTRACT
To be able to discuss in detail effects occurring in capillary electrophoretic separations, the concepts of electrophoresis and electroosnwsis are presented. The use of the effective electrophoretic nwbiUty and the electroosnwtic mobiUty allow identiftcation of compounds in an analysis and optimization by manipulating separation conditions. Different modes of separation are briefly discussed. Efficiency and resolution are.deftned andfactors ajJecting these are Usted.
1.1 ELECTROPHORESIS AND ELECTROPHORETIC MOBn..ITY
Electropboresis is the collective name for separation methods based on the different veloeities charged species obtain wben they are put in an electric field. Tbe yelocity, v, of eacb species is proportional to the field strength, B, by its electrophoretic mohility, m.
(1.1)
Tbe velocity and the field strength are hoth vectorial, whlle the mobility is scalar, being positive for cations and negative for anions. Sinee the mobility is .strongly dependent on the environment in which the species are present, we can distinguish two cases. The first one is the absolute mobility, the . mobility of the species at infmite dilution and complete ionization. In this case it is supposed that the species are unaffected by the environment. This is also the mobility which is often tabulated, since it can be applied at all times. The other being the effective mobility, the mobility of the species under experimental conditions. If there is a sufficient difference in effective mobility two species can be separated in an electrophoretic experiment.
To obtain an expression for the electrophoretic mobility, which can relate it to experimental parameters like charge, size and solvent environment, one can look to the different forces acting on the species. At infinite dilution, the electric field is exerting a force on tbe charge, q, of the partiele and this force is opposed by the frictional force, given hy the friction factor fc times the velocity.
7

1 PRINCIPLES OF CAPIU.ARY ELECTROPHORESIS
(1.2)
The friction factor for a spherical partiele can according to Stokes be given by:
(1.3)
In this equation 11 repcesent the viscosity of the solvent and r is the radius of the particle. Substituting of equation 1.2 in equation 1.1 and rearranging leads to an ex~ pression for the absolute mobility:
(1.4)
At ftnite dilution, the environment of the species alters, for instanee couriter ions surround the species. When an . electric field is applied this leads to a deformed surrounding environment giving extra forces to the species. A correction value 'Y is used to relate m0 to the mobility at fmite dilution as described in the Debye, Huckel and Onsager theory [1], which can be calculated if sufficient information is given about the species and the solvent.
In practice one doesn't always work in a pH range where the species ·is fully ionized. Therefore another correction for the dissociation of the compound has to be applied to obtain the effective mobility. According to Tiselius [2] the effective mobility is the summadon of all the products of dissociation constant, a, and mobility at fmite dilution
m= L"i*Y1*m~ i
(1.5)
The dissociation constant can be calculated from the pKa~value of a compound and the pH of the environment in which the compound is present.For simple monovalent ions this equation can be derived starting with the equilibrium:
(1.6)
The equilibrium constant for this equilibrium is defmed as:
(1.7)
8

Electrophoresis and electrophoretic mobility 1.1
assuming that the actlvities for the involved species is 1 and using:
and assuming:
[A")=~ [HA] 1-«
we obtain the Henderson-Hasselbalcb equation:
a: pK=pH-Iog[-] 1-«
(1.8)
(1.9)
(1.10)
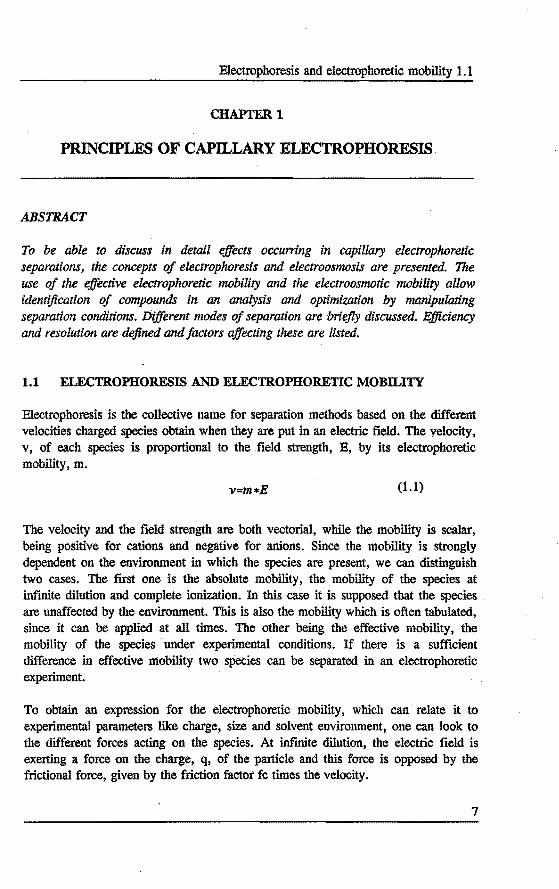
So by changing the pH, we can change the dissiociation degree of a species wbich will change its charge and effective mobility. If two compounds have a different absolute mobility they can be separatedincase they are both fully ionized (a=1). If they have a similar absolute mobility, a proper choice of pH can give them a different effective mobility and hence they can be separated. Clearly pH is a very important parameter in optimizing separation conditions as is sbown in figure 1.1.
+ pKa•S,4 <~ pKa•S.e
1.00
0.110
Î 0.80 I
0.70
I 0.60 c: 8 0.50 c: 0 0.40 i '8 0.30 .. :e 0.20
0.10
0.00 4 5 pKa1 pKal! 6 7
pH·····>
Ftg 1.1: lnjluence of buffer pH on the dissociation constant of two closely related species.
9
1 PRINCIPLES OF CAPILLARY ELECTROPHORESIS
1.2 ELECTROOSMOSIS AND ELECTROOSMOTie MOBILITY
When an isolator is brought in contact with a liquid an electtic double layer will be fonned due to chemica! equilibria at the surface [3]. In case of a fused silica capillary tube, the surface becomes usually negatively charged \\fith respect to the buffer solution due to ionization of e.g. silanol groups at thel silica surface or preferential adsorption of ions from the buffer. Ions with positive} charge will order opposite to this negative surface to fulfill the requirement of electroneutrality. It is important to understand that the negative charge, which is part of the surface, is fiXed, while the positive charge in the buffer is free to move. When in case of electrophoresis, an electtic field is applied over this capillary the positive charge starts to move towards the negative electrode, dragging the solvent along. This flow of electrolyteis called the electroosmotie flow (BOF). The direction of the flow is in this case towards the negative electrode.
This phenomenon can be compared to the electrophoretic migration consiclering the surface charge is comparable to the charge of a partiele only with a different geometry. A measure for this surface charge is the so-called i (zeta)-potenti.àl of the surface. Since in an electtic double layer no electroneutrality ex.ist a potential gradient is the result. The potendal at the plane of shear is called the r-potential.
Again the velocity of the electroosmotie flow is proportional to the applied electtic field by a constant the electroosmotie mobility p..
(1.11)
This constant is again dependent on charge of the surface and solvent properties like viscosity and dielectric constant given by Helmholtz-Smoluchovski. If the direction of the flow is towards the negative electrode the BOF is positive.
(1.12)
An interesting characteristic of the electroosmotie flow is that the flow profile is plug-like. This bas considerable advantages over the parabolic flow proftle in case of laminar flow, since it contributes much less to dispersion of the zones.
Similar to the electrophoretic mobility, the electroosmotie mobility can be influenced by pH. Since the surface charge will be detennined by pH, so will be the !-potential and so will be the electroosmotie velocity. Also ionic strength bas an impact on the flow, since it detennines the thickness ofthe double layer.
10

Electroosmosis and electroosmotie mobility.l.2
During an electrophoretic experiment both electrophoretic migration and electroosmotie transportation will act on the separated species. Since both are vectorlal the sum of both veloeities is the actual velocity with which the species is moving through the capillary tube.
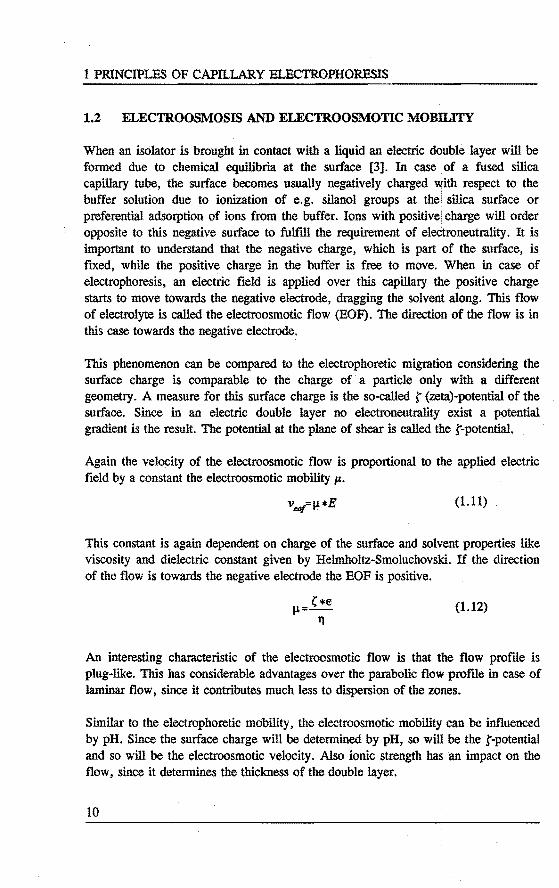
Figure 1.2 shows a schematic representation of the separation of three species, a cation, a neutral and an anion. The different veetors indicate the electrophoretie veloeities of the species and the electroosmotie velocity of the buffer system in the tube. Also the electrode signs are indicated. Assuming a negative surface charge, the osmotie flow is towards the negative electrode.
Fig.3: lnjluence of the electroosmotie flow on the separation in capillary electrophoresis
The cation has an electrophoretic movement towards the negative electrode. This movement is enforced by tbe movement of the electroosmotie flow. The neutral compound doesn't move electrophoretically but moves with the velocity of the BOF. The negative ion migrates opposite to the BOF but obtains a movement in the same direction as the other ions when the velocity of the BOF is bigger than the electrophoretic velocity. Therefore the result of the BOF is that, when sufficient high, all species move in the same direction, making detection of all of them possible at the end of the tube.
The compounds migrating with the BOF are termed downstream, those with the BOF midstream and those against the BOF upstream [4]. Note that negative ions are repelled from the surface, while postive ions are attracted, possibly resulting in surface interaction.
11

1 PRINCIPLBS OF CAPILLARY ELECTROPHORESIS
1.3 MODES OF CAPILLARY ELECTROPHORESIS
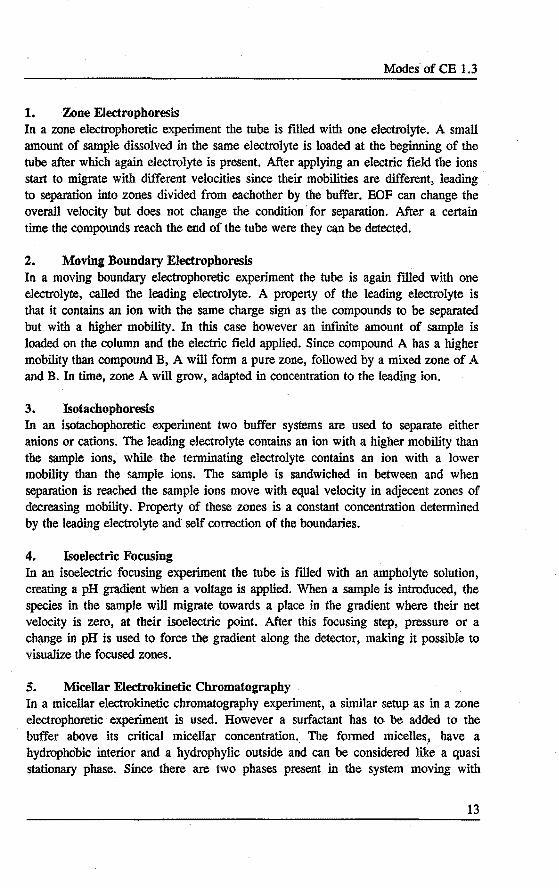
Depending on the choice of electrolyte system used we can distinguish 4 types of electrophoretic techniques: 1. Zone Electrophoresis 2. Moving Boundary Electrophoresis 3. Isotachophoresis 4. Isoelectric Focusing In case surfactauts in the electrolyte are used chromatographic principles can become involved resulting in: 5. Micellar Electrokinetic Chromatography When molecular sievingis involved due to gels one can term the technique: 6. Gel Electrophoresis It should however be stated that the last metbod is in its nature zone electrophoresis.
00 0 -------00 2
Fig.4: Modes of capülary electrophoresis (1 ,2,3 refer to different buffer systems, in technique 4 indicating a gradient)
These cases are depicted in figure 1.3. The different modes are described using an tube like separation chamber with injection of a sample containing .cations A and B on one end and detection of the sample at the otber. In the presented example the effective mobility of ion A is bigger than that of ion B.
12
Modes of CE 1.3
1. Zone Electrophoresis In a zone electrophoretic experiment the tube is filled with one electrolyte. A small amount of sample dissolved in the same electrolyte is loaded at the beginning of the tube after which again electrolyte is present. After applying an electric field the ions start to migrate with different veloeities since their mobilities are different, leading to separation into zones divided from eacbother by the buffer. BOF can change the overall velocity but does not change the condition · for separation. After a certain time the compounds reach the end of tbe tube were they can be detected.
2. Moving Boundary Electrophoresis In a moving boundary electrophoretic experiment the tube is again filled with one electrolyte, called the leading electrolyte. A property of the teading electrolyte is that it contains an ion with tbe same charge sign as the compounds to be separated but with a higher mobility. In this case however an infmite amount of sample is loaded on the column and the electric field applied. Since compound A bas a higher mobility tban compound B, A will form a pure zone, foliowed by a mixed zone of A and B. In time, zone A will grow, adapted in concentration to the teading ion.
3. Isotachophoresis In an isotacbophoretic experiment two buffer systems are used to separate either anions or cations. The teading electrolyte contains an ion with a higher mobility than the sample ions, while the terminating electrolyte contains an ion with a lower mobility than the sample ions. The sample is sandwiched in between and when separation is reached the sample ions move with equal velocity in adjecent zones of decreasing mobility. Property of these zones is a constant concentration determined by the leading electrolyte and self correction of the boundaries.
4. Isoelectric Focusing In an isoelecttic focusing experiment the tube is filled with an ampholyte solution, creating a pH gradient when a voltage is applied. When a sample is introduced, the species in the sample will migrate towards a place in the gradient where their net velocity is zero, at their isoelectric point. After tbis focusing step, pressure or a change in pH is used to force the gradient along the detector, making it possible to visualize the focused zones.
5. Micellar Electrokinetic Chromatography In a micellar electrokinetic chromatography experiment, a similar setup as in a zone electrophoretic experiment is used. However a surfactant bas to be added to the buffer above its critical micellar concentration.. The formed micelles? have a bydropbobic interlor and a hydrophylic outside and can be considered like a quasi stationary phase. Since there are two phases present in the system moving with
13

1 PRINCIPLES OF CAPILLARY ELECTROPHORESIS
different velocity, chromatography is achievecl. The aqueous phase is moving with the velocity of the BOF and the micellar phase with the velocity of the vector summation of BOF and electrophoretic migration of the micelle. Neutral compounds can have a different affmity for the micellar phase and therefore be separated.
6 Gel Electrophoresis In a gel electrophoretic experiment again a similar situation like in a zone electrophoretic experiment is present. Only now a gel like polymer bas formed in the buffer salution creating a sieving like medium. Compounds migrate zone electrophoreticly through this mesh. Due to the pores, large size compounds will have more difficulty to migrate through the system than small size compounds, making a separation based on size possible.
1.4 FACTORS INFLUENCING PERFORMANCE
The efficiency of the electrophoretic separation can be expressed in terms of plate numbers similar to those used for chromatograpby. Giddings [5] proposed the following relation between column length 1 and varianee of the zone:
(1.13)
In other words it describes how much the zone gets dispersed by moving througb a eertaio length of tube. Of course there can be a number of causes for dispersion acting on the system, which will be discussed in the next paragraph.
Resolution is defmed as the ratio of the peak maxima distance and tbe mean peak width at the baseline.
i/x R=-4o
This can be related to mobility by the equation:
1 flm {N R=-*-* N 4 ;n
(1.14)
(1.15)
In case of a system without osmotic flow m represents the effective electrophoreric mobility. In case of a system with osmotic flow it represents the vector summation m.ff + p.. It is clear from this point that the highest resolution will be obtained when
14
Factors influencing perfonnance 1.4
electrophoresis and electroosmosis are equal but opposite of sign. In that case however the transport through the tube would take an infmite amount of time.
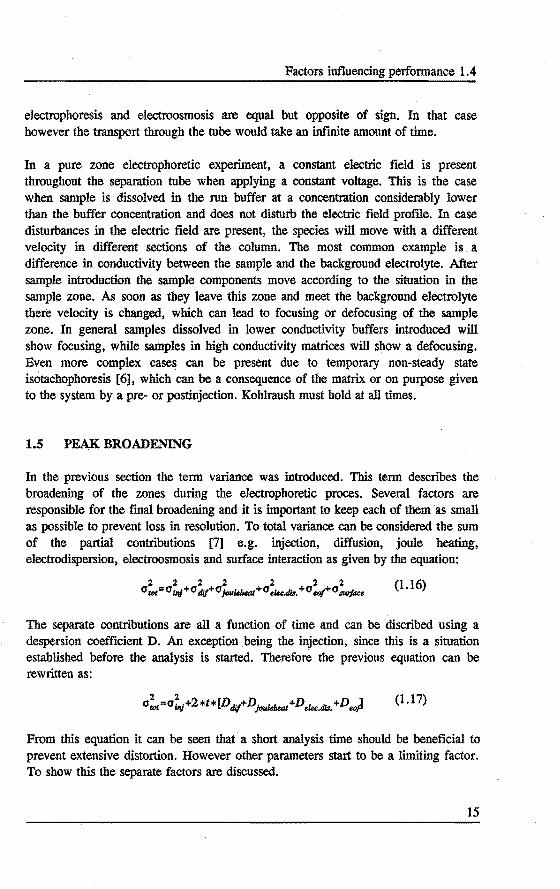
In a pure zone electrophoretic experiment, a constant electric field is present throughout the separation tube wben applying a constant voltage. This is the case wben sample is dissolved in the run buffer at a concentration considerably lower than the buffer concentration and does not disturb the electric field profile. In case disturbances in the electric field are present, the species will move with a different velocity in different sections of the column. The most common example is a difference in conductivity between the sample and tbe background electrolyte. After sample introduetion the sample components move according to the situation in the sample zone. As soort as they leave this zone and meet the background electrolyte there velocity is changed, which can lead to focusing or defocusing of the sample zone. In general samples dissolved in lower conductivity buffers introduced will show focusing, while samples in high conductivity matrices will show a defocusing. Even more complex cases can be present due to temporary non-steady state isótachophoresis [6], which can be a consequence of the matrix or on purpose given to the system by a pre- or postinjection. Kohlraush must hold at all times.
1.5 PEAK BROADENING
In the previous section the tenn varianee was introduced. This tenn describes the broadening of the zones during the electrophoretic proces. Several factors are responsible for the fmal broadening and it is· important to keep each of them as small as possible to prevent loss in resolution. To total varianee can be considered the sum of the partial contributions [7] e.g. injection, diffusion, joule heating, electrodispersion, electroosmosis and surface interaction as given by the equation:
(1.16)
The separate contributions are all a function of time and can be discribed · using a despersion coefficient D. An exception being the injection, since this is a situation established before the analysis is started. Therefore the previous equation can be rewritten as:
(1.17)
From this equation it can be seen that a short analysis time should be beneficia! to prevent extensive distortion. However other parameters start to be a limiting factor. To show this the separate factors are discussed.
15
1 PRINCIPLES OF CAPILLARY ELECTROPHORESIS
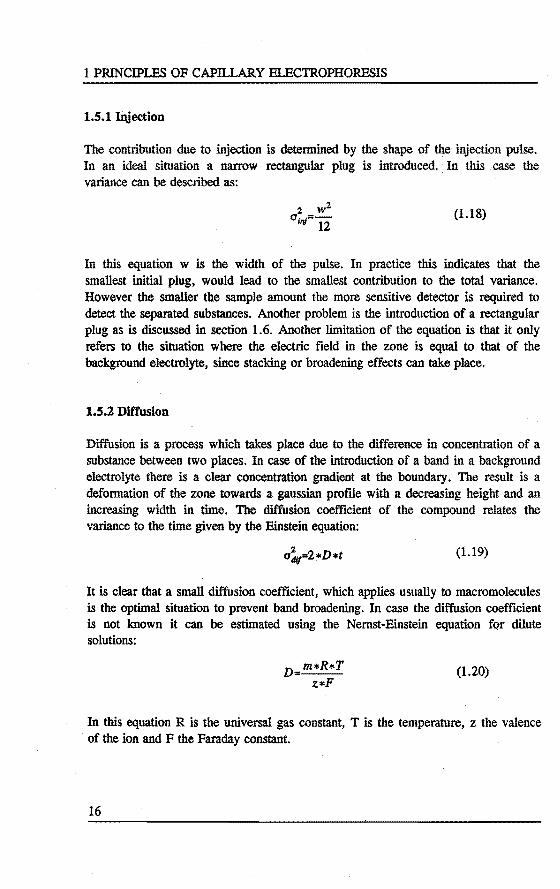
l.S.llnjection
The contribution due to injection is detennined by the shape of the injection pulse. In an ideal situation a narrow reetangolar plug is introduced. In this case the varianee can be described as:
(1.18)
In this equation w is the width of the putse. In practice this indicates that the smallest initial plug, would lead to the smallest contribution to the total varianee. However the smaller the sample amount the more sensitive detector is required to detect the separated substanees. Another problem is the introduetion of a rectangular plug as is discussed in section 1.6. Another limitation of the equation is that it only refers to the situation where the electrie field in the zone is equal to that of the background electrolyte, sinee staeking or broadening effects can take place.
1.5.2 Dilfusion
Diffusion is a process whieh takes place due to the difference in coneentration of a substance between two places. In case of the introduetion of a band in a background electrolyte there is a clear concentranon gradient at the boundary. The result is a deformation of the zone towards a gaussian profile with a decreasing height and an increasing width in time. The dirfusion eoefficient · of the compound relates the varianee to the time given by the Einstein equation:
(1.19)
It is elear that a small dirfusion coefficient, which applies usually to macromolecules is the optimal situation to prevent band broadening. In case the diffusion eoefficient is not known it can be estimated using the Nernst-Einstein equation for dilute solutions:
(1.20)
In this equation R is the universal gas constant, T is the temperature, z the valenee of the ion and F the Faraday constant.
16

Peak broadening 1.5
1.5.3 Joule heating
Since in an electrophoretic experiment an electric field is applled, heat is generated during the experiment dependent on the conductivity of the electrolyte inside the capillary. This heat is called Joule heat. The production of heat is unifonn over the whole capillary resulting in a temperature increase. Since heat can only be dissipated at the wall of the capillary, a radial temperature gradient occurs approximated by a parabolle function. Since mobility is a function of temperature, this temperature is causing species in the center of the tube to migrate faster than species at the wall, resulting in an extra dispersion. Virtanen [8] derived an equation to quantify this dispersion as a function of several experimental parameters as given by:
ö2a2m2E6r6 Djouleheat- 2 3012DJ.T
(1.21)
where o is the thennal coefficient of the mobility, u is the conductivity of the background, ris the capillary radius and ÀT is thennal conductivity of the buffer.
To minimize Joule heating it is clear that, a low field would be beneficia!, however an increase in separation time would be the result. A decrease in capillary diameter would have a significant effect. First of all, less heat would be generated, since the e1ectrical resistivity would increase. Secondly the distance to the wall would be shorter resulting in a faster transfer of heat. A additional advantage would be that due to diffusion the parabolle concentration gradient as a result of temperature would be faster compensated for. The drawback of it all is the instromental problems involved with reduction of capillary diameter as will be discussed later.
1.5.4 Electroosmosis
One of the characteristics of electroosmotie flow is its plug flow like profile. Since, in contrast to a laminar flow it is not caused by a pressure difference but by the electric double layer at the wall, it doesn't cause any pressure drop over the system. In case of open tubular systems the contribution to dispersion is considered to be zero. However situations can occur that the double layer is not the same along the whole capillary, leading to a mismatch of the osmotic flows, causing a dispersion [9]. Virtanen [7] described the dispersion for a closed system as :
1 r"lv;of Deo/= 48*D
(1.22)
17

1 PRINCIPLES OF CAPILLARY ELECTROPHOR.ESIS
1.5.5 Electrodispersion
Electrodispersion is a process occurring wben the mobility of the background ion and the sample ion are not the same [10]. On a microscale a moving boundary effect takes place without selfcorrection. The result of this process is an assymmetrlc zone, having either a teading front or tailing back dependent on the mobility of the ions and tbe direction of the osmotic flow. In case the concentration of the background electrolyte is more than two orders of magnitude higher than the concentration of the sample ions this effect is minimized and the peak broadening due to electrodispersion can be neglected.
1.5.6 Surface interaction
Under ideal circumstances, separated compounds do not have any interaction with tbe capillary materlaL This is however a hypothetical situation. In case there is an interaction with the wall, the situation can be described as a chromatographic process defmed by a capacity factor, k', for wall interaction. A term often used in chromatography is plate height. Since this does not depend on the column length it can be considered to be a more independent parameter. It is defmed as the column length 1 devided by the plate number N.
l h=N
(1.23)
McManigill et al. [11] described an equation for open tubular electrophoresis as:
H=..!i:_+ 2*D + k'*V eoj T2*k' +_! (1.24) 12*1 veof (l+k1f 4*D k4
In this equation the flrst term represents the injection dispersion as was mentioned before. The rest of the phenomena are now described into three terms. One descrihing the axial dispersion and the other the radial dispersion including the capacity factor k', descrihing the interaction with the capillary wall. The last term is a kinetic term for wall adsorption but can be neglected in most cases. For a number of k' values, given typical values for the other parameters (w=l mm, 1=1 m, D=2E"10 m2/s, vcof=l mm/s, r=37.5 ~tm), the resulting plate heigbt and consequent plate number are calculated.
18

Peak broadening .1.5
Table 1: Impact of the capacity fact(Jr on the plate height and plate number in capillary electrophoresis for a common macromolecule
k' inj. axial radial total N (flm) (flm) (flm) (flm)
0.001 0.08 0.40 0.10 0.58 1.7E6 0.005 0.08 0.40 0.52 1.00 l.OE6 0.010 0.08 0.40 1.06 1.54 6.5E5 0.050 0.08 0.40 6.30 6.78 1.5E5 0.100 0.08 0.40 15.20 15.68 6.4E4
It is clear . that a small chromatographic interaction bas a large impact on the platenumbers. This is often the case for e.g. proteins were both electrostatic or bydrophobic interactions can take place. A way to minimize these effects is to separate the compounds in the upstream mode. In this case sample ions and capillary wall have the same charge sign resulting in a repulsion of the ions from the wall. Therefore from this point of view better separation are to be expected in the upstream mode as compared to the downstream mode.
1.5. 7 Ideal separation conditions
When ideal separation conditloos are chosen, diffusion is tbe main souree of band broadening. In many cases these conditions are difficult to obtain but the following can be · used as an estimate of wbat is possible to achleve under pure zone electrophoretic conditions. Jorgenson [12] substituted equation 1.21 into equation 1.13 and obtained after rearranging:
(1.25)
In this equation m corresponds to the total mobility, being the sum of the electrophoretic and electroosmotie part. High voltages and low diffusion coefficients result in high plate numbers. When even higher plate numbers are measured tban would be theoretically considered possible, usually on-column sample stacking, due to injection, or temporary isotachopboretic processes are present in tbe analysis. Knowing these phenomena, can help to flirther optimizing resolution [13].
19
1 PRINCIPLES OF CAPILLARY ELECTROPHORESIS
1.6 CALCULATION OF DATA FROM EXPERIMENT AL PARAMETERS
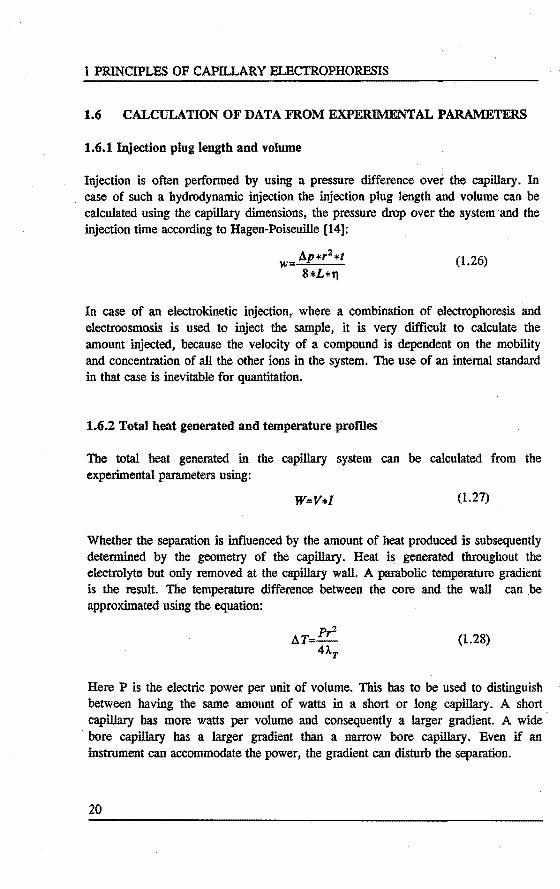
1.6.1 Injection plug length and volume
Injection is often perfonned by using a pressure difference over the capillary. In case of such a hydrodynamic injection the injection plug length and volume can be calculated using the capillary dimensions, the. pressure drop over the system and the injection time according to Hagen-Poiseuille [14]:
(1.26)
In case of an electrokinetic injection, where a combination of electrophoresis and electroosmosis is used to inject the sample, it is very difficult to calculate the amount injected, because the velocity of a compound is dependent on the mobility and concentration of all the other ions in the system. The use of an internat standard in that case is inevitable for quantitation.
1.6.2 Total heat generateel and temperature promes
The total heat generated in the capillary system can be calculated from the experimental parameters using:
(1.27)
Whether the separation is influenced by the amount of heat produced is subsequently determined by the geometry of the capillary. Heat is generated tbrooghout the electrolyte but only removed at the capillary wall. A parabolle temperature gradient is the result. The temperature difference between the core and the wall can be approximated using the equation:
(1.28)
Here P is the electric power per unit of volume. This bas to be used to distinguish between ha ving the same amount of watts in a short or long .capillary. A short capillary bas more watts per volume and consequently a larger gradient. A wide bore capillary bas a larger gradient thim a narrow bore capillary. Even if an instrument can accommodate the power, the gradient can disturb the separation.
20
Calculation of data from experimental parameters 1.6
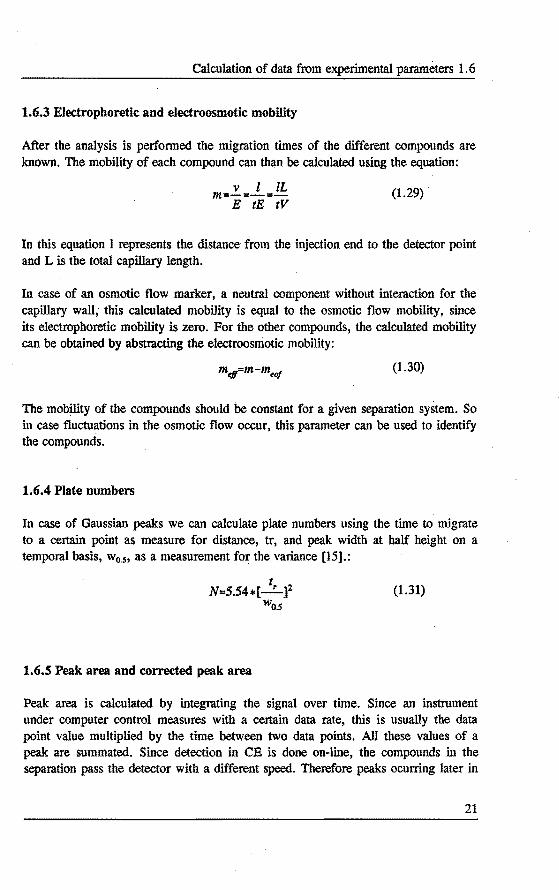
1.6.3 Electrophoretic and electroosmotie mobility
After the analysis is performed the migration times of the different compounds are known. The mobility of each compound can than be calculated using the equation:
v l lL m=-=-=-E tE tV
(1.29)
In this equation 1 represents the distance from the injection end to the detector point and L is the total capillary length.
In case of an osmotic flow marker, a neutral component without interaction for the capillary wall, this calculated mobility is equal to tbe osmotic flow mobility, since its electrophoretic mobility is zero. For tbe other compounds, the calculated mobility can be obtained by abstracting the electroosmotie mobility:
(1.30)
The mobility of the compounds should be constant for a given separation system. So in case fluctuations in tbe osmotic flow occur, this parameter can be used to identify the compounds.
1.6.4 Plate numbers
In case of Gaussian peaks we can calculate plate numbers using tbe time to migrate to a certain point as measure for distance, tr, and peak width at half height on a temporal basis, w0,5, as a measurement for the varianee [15].:
t N=S.S4*[-r l~
Wo.s
1.6.5 Peak area and corrected peak area
(1.31)
Peak area is caleulated by integrating the signal over time. Since an instrument under computer control measures witb a certain data rate, this is usually the data point value multiplied by the time between two data points. All these values of a peak are summated. Since detection in CE is done on-line, the compounds in the separation pass tbe detector with a different speed. Therefore peaks oeurring later in
21

1 PRINCIPLES OF CAPILLARY ELECTROPHORESIS
the electropherogram appear to have a larger peak area than early migrating peaks. Correction can be made by deviding the area of all peaks by its migration time. These peak areas will be named corrected peak areas. More accurate however would be to do this for each of the integration steps. This however would involve changes in the integration algorithms in the software.
1. 7 CONCLUSIONS
In capillary electrophoretic separations both electrophoresis and electroosmosis play an important role. Both can be expressed in terms of mobilities and their magnitude and sign determine resolution and speed of the analysis together with the electric field applied. Manipulation of these mobilities using varles parameters is the art of this science. When proper conditions are chosen, diffusion is the main souree of band broadening and very high separation efficiencies are the result.
REFERENCES
l. H. Falkenhagen, Electro1yte, Verlag von S. Hirze1, Leipzig, 1932. 2. Tiselius, Nova Acta Reg. Soc. Sve. Sci. Upsal., 4, 7 no. 4 (1930). 3. R.J. Hunter, Zeta potential in colloid science; Principles and applications, Academie
Press, London, 1988. 4. F.M. Everaerts, A.A.A.M. van de Goor, Th.P.E.M. Verheggen and J.L. Beckers, J.
HRC 12 (1989) 28·31. 5. J.C. Giddings, Sep. Sci. 4 (1969) 181. 6. J.L. Beekers and F.M. Everaerts, J. Chromatogr. 508 (1990) 19-26 7. F. Foret, M. Demi and P. Bocek, J. Chromatogr. 452 (1988) 601. 8. R. Virtanen, Acta Po1ytech. Scand. 123 (1974) 11. 9. D.S. Burgi and R.L. Chien, Anal. Chem. 63 (1991) 2042. 10. F.E.P. Mikkers, F.M. Everaerts and Th.P.E.M. Verheggen, J. Chromatogr. 169
(1979) l. 11. D. McManigill and S.A. Swedberg, Tech. Protein Chem., Academie Press, San
Diego, 1989, 468478. 12. J.W. Jorgenson and K.D. Lukacs, Anal. Chem. 53 (1981) 1298. 13. Th.P.E.M. Verheggen, A.C. Schoots and F.M. Everaerts, J. Chromatogr. 503 (1990)
245-255 14. R.H. Sabersky, A.J. Acosta and E.G. Hauptmann in Fluid flow 2nd ed., Macmillan
Publishing Co., New York, 1971 15. C.F. Poo1e and S.K. Poole, Chromatography today, Elsevier, Amsterdam, 1991.
22

Introduetion 2.1
CHAPTER2
INSTRUMENTATION FOR CAPILLARY ELECTROPHORESIS
ABSTRACT
Since commercial instnonentation ho.s · been available for Capillary Electrophoresis only since 3 years, all of the earlier work had to be peiformed on laboratory-made equipment. Also for a number of experiments, commercial instrumentation is not possible to use since it requires constant modijication. This chapter describes some instrumentation, which can be used for CE analysis. A simple setup using a UV detector and an automated system with laser induced jluorescence dereetion are described and compared to presently available commercial instruments. The characteristics of the instruments as well as some key-problems in the design are discussed.
2.1 INTRODUCTION
Electrophoresis has always been a rather manual technique. For most of the separations a gel is poored onto a glass plate, polymerized and subsequently submersed in a bath with an electrolyte solution. Using slots in the gel the samples can be loaded and when voltage is applied the components will run through the separation medium. After a certain period of time the voltage is removed and the compounds visualized using e.g. a staining technique. The distance migrated is measured and the intensity of the band is a measure for the amount of the compound applied. To quantify, the band can be removed and measured in a speetrop hotometer, a densitometer can be used or in case of a radio-actively labeled compound the counts can be registered using a counter. For later use a photo can be made of the stained gel or a photosensitive plate can be used to register the radioactive signa!. All together this procedure is labor intensive, results will strongly depend on the skilis of the user, it is time consuming and the data are quantitatively inaccurate and difficult to oompare to other experiments. Often standard samples have to be run parallel to have the possibility to relate the results to these known standards.
A number of recent improvements in the instrumentation and consumables for flat gel electrophoresis have made this a little easier. The use of precast gels, semi automated gel electrophoretic equipment and gel scanners have been a step forward towards automation.
23
2.INSTRUMENTATION FOR CAPILLARY ELECTROPHORESIS
The use of a capillary fonnat as a separation compartment is a step towards automation of instrumentation. Since the capillary functions as an anticonvective medium, free solution separation are possible. Due to the fact tbat these solutions can be refreshed after every analysis, the same tube can be used numerous times. This makes it possible to add ways to automatically inject something into the tube and to use part of the tube as a cel to spectroscopically detect compounds while they are passing this cel. The capillary format with a high electrical resistance, also allows the use of higher electric fields for the separation without excessive heat production resulting in increased resolution and reduced analysis time.
The small dimensions however make the construction of such instruments difficult. Only since a few years commercial instrumentation bas been available, most of the instruments equipped with a UV detector. Laboratory made instromentalion is described as well as the features of tbe commercial instruments used. Another more sensitive detection option, laser induced fluorecence, is described and compared to a recently available commerciallaser fluorecence detector.
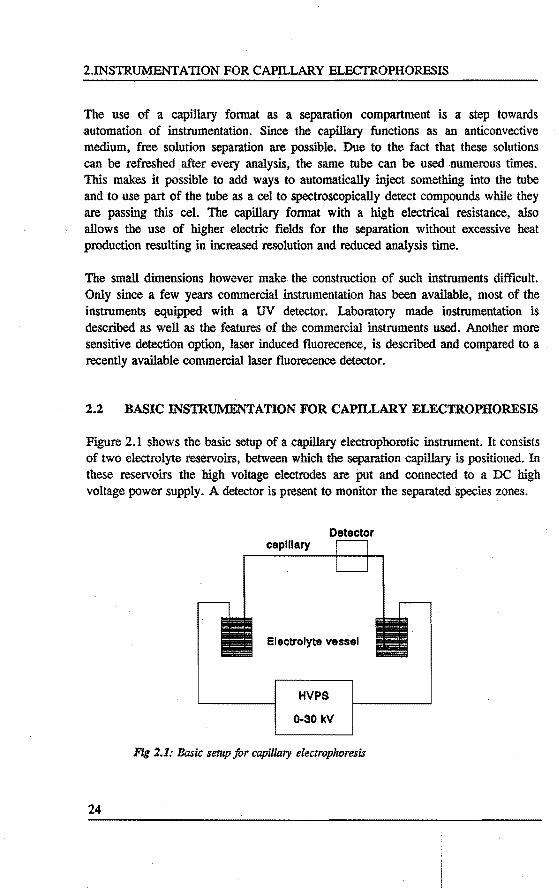
2.2 BASIC INSTRUMENTATION FOR CAPILLARY ELECTROPHORESIS
Figure 2.1 shows the basic setup of a capillary electrophoretic instrument. It consists of two electrolyte reservoirs, between which the separation capillary is positioned. In these reservoirs the high voltage electrodes are put and connected to a DC high voltage power supply. A detector is present to monitor the separated species zones.
24
Detector caplllary
Electrolyte vessel
HVPS
0-30 kV
Fig 2.1: Basic setup for capillary electrophoresis

Basic instromentalion for capillary electrophoresis 2.2
An analysis would consist of the following steps. The capillary is flrst preconditioned using several rinse solutions. Th en the capillary is· filled with the separation buffer or buffers. Subsequently the sample is introduced into the capillary on one side and the electtic field applied cesuiting in an electropboretic separation. The detector is monitoring in time a flxed position of the capillary and registrates tbe compounds as they are passing the detector position. After the analysis is done the capillary is regenerated and another analysis can be made. The different steps are described in more detail below. Some typical dimensions of these different parts are listed in table 2.2.
Tlible 2: Typical parameter values jor CE separations
System:
Injection:
Separation:
High Voltage Power Supply: (Switchable polarity) Detector: UV:
LIF: exitation: emission:
Capillary: i.d.: lengtb:
Pressure/vacuum/electrokinetic: Injection volume: Constant voltage/current: separation time:
Conditioning of the capillary
0-35 kV 0-250 p.A 190-360 nm 350-520 nm 450-560 nm 25-100 p.m 20-100 cm selectable 5-100 nl selectable 2-120 min
The surface of the capillary detennines both the magnitude of tbe electroosmotie flow as well as the interaction of the capillary wall with the sample components. To be able to control these factors precondition is often required. In many cases a rinse of several column volumes with a O.lM NaOH solution is performed to regenerate the surface from unwanted adso:rption and to obtain suffJCient surface charge to generate a certain osmotic flow.
Filling of the capillary with the buffer system After the preconditioning, the run buffer is applied. Again several column volumes are used to adapt the capillary surface to the new conditions. Properties of the run buffer to create separation conditions are sufficient buffering capacity at the required pH, to keep the conditions during the run constant, preferably a low electric conductivity to prevent excessive heat production, suitable conditions as a detection background and suitable additives to create a separation. Equilibration time of the surface is strongly dependent on the buffer type.
25
2.INSTRUMENTATION FOR CAPILLARY ELECTROPHORESIS
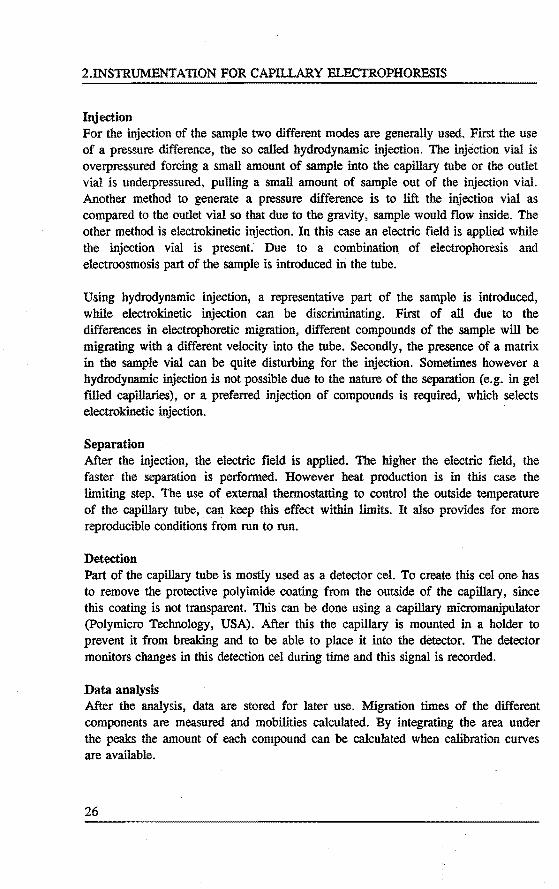
Injection For the injection of the sample two different modes are generally used. First tbe use of a pressure difference, the so called hydrodynamic injection. The injection vial is overpressured forcing a small amount of sample into tbe capillary tube or the outlet vial is underpressured, pulling a small amount of sample out of the injection vial. Another metbod to generate a pressure difference is to lift the injection vial as compared to tbe outlet vial so that due to the gravity, sample would flow inside. The otber metbod is electrokinetic injection. In this case an electric field is applied while the injection vial is present. Due to a combination of electrophoresis and electroosmosis part of the sample is introduced in tbe tube.
Using hydrodynamic injection, a representative part of the sample is introduced, while electrokinetic injection can be discriminating. First of all due to the differences in electrophoretic migration, different compounds of the sample will be migrating witb a different velocity into the tube. Secondly, the presence of a matrix in the sample vial can be · quite disturbing for the injection. Sometimes bowever a hydrodynamic injection is not possible due to the nature of the separation (e.g. in gel rtlled capillaries), or a preferred injection of compounds is required, whicb selects electrokinetic injection.
Separation After the injection, tbe electric field is applied. The higher tbe electric field, the faster the separation is performed. However heat production is in this case the limiting step. The use of external thermostatting to control the outside temperature of the capillary tube, can keep this effect within limits. It also provides for more reproducible conditions from run to run.
Detection Part of the capillary tube is mostly used as a detector cel. To create this cel one bas to remove tbe protective polyimide coating from the outside of the capillary, since this coating is not transparent. This can be done using a capillary micromanipulator (Polymicro Teclmology, USA). After this the capillary is mounted in a holder to prevent it from breaking and to be able to place it into the detector. The detector monitors changes in this detection cel during time and this signal is recorded.
Data analysis After the analysis, data are stored for later use. Migration times of the different components are measured and mobilities calculated. By integrating the area under the peaks the amount of each compound can be calculated wben calibration curves are available.
26

Instruments using UV detection 2.3
2.3 INSTRUMENTS USING UV DETECTION
2.3.1 Laboratory built instrument
Figure 2.2 shows tbe schematic setup of a laboratory made CE instrument using a commercial UV detector similar to Lux et al. [1]. Again tbe capillary is mounted between two electrolyte reservoirs. These are positioned under a. plateau on wbich tbe UV detector is positioned. The outlet reservoir can be sealed and a . vacuum pump (Verder, Vleuten, The Netherlands) is connected. In tbis way an underpressure can be generated in tbe oulet reservoir causing liquid to flow from tbe inlet to the outlet. This function is used to rinse tbe capillary between analysis. By cbanging the rinse solutions on the inlet side several rinsing steps can be performed. For an injection using vacoum, the system was too inaccurate, so· an electrokinetic injection procedure was used on tbis instrument. A high voltage power supply (Fug HCN 35-35000) is connected to tbe electrodesin tbe electrolyte reservoirs. ne UV detector was a Spectra 100 (Spectra Physics, San Jose, USA) equipped with an oncolumn capillary detector cel. This cel consists of a photodiode and a ball type lens focusing the light into the inner diameter of the capillary, tbus preventing stray light. The detector bas a refemce cell compensating for drift and fluctuations in the signal. Botb the UV detector and the high voltage power supply are connected to a Multilab TS computer interface (TU Eindhoven, The Netherlands), allowing control of botb tbe set and read parameters. In tbis way tbe voltage and current settings can be controlled and tbe UV data can be stored and analyzed. Both for control and data analysis Caesar computer software (B*Wise, Geleen, The Netherlands) was used.
Fig 2.2: Setup jor CE using a commercial UV detector
27

2.INSTRUMENTATION FOR CAPILLARY ELECTROPHORESIS
2.3.2 Commercial instrument
The commercial instrument with a UV detector was a P/ ACE 2000 capillary electrophoresis system (Beckman Instruments, Palo Alto, CA, USA) [2]. This instrument has the capillary installed in a cartrige, through which a thennostatting liquid is circulated, keeping the capillary at a constant temperature. Both the inlet and the outlet vial can be cbanged using two vial trays, so sequenèes of analysescan be programmed. The system bas a pressure option for rinsing of tbe capillary and both the hydrodynamic and electrokinetic injection procedure can be used. Analysis using constant voltage or current are possible. The detector is a selectable wavelength, single beam UV detector, using fUters to select the desired wavelength. The instrument is controlled using a Windows based software program which is also used for data aquisition. Subsequently the data were transferred to the Caesar computer software for data analysis.
2.4 INSTRUMENTS USING LIF DETECTION
2.4.1 Laboratory buUt instrument
The laboratory built CB-UF instrument is depicted in Figure 2.3. Again two electrolyte reservoirs are used with a capillary tube and the high voltage power supply (Fug, HCN 35-35000). In this instrument however the inlet vial or injection vial can automatically be cbanged using a 10 position autosampler. The autosampler is constructed in such a way that the whole tray moves up and down while the capillary stays in a ftxed position, while changing the vials. This is to prevent that the inlet and outlet of the capillary to be at different heights causing a gravity flow, which can disturb the injection and separation. The outlet vial is connected to a vacuum system containing two vacuum tanks which can be set at a desired underpressure. These reservoirs are used to generate the injection and rinsing pressure respectively. Pressure sensors are present to monitor the actual pressure in the reservoirs and in the outlet vial, to have the possibility of an accurate injection. The capillary is mounted on the detection table. Again part of the polyimide is removed to create a detector cel. Figure 2.4 (left) shows schematically the setup.
A water cooled argon ion laser, capable of selective light emission both in the visible and near UV region is used as the light source. The light is focussed onto the capillary using a focusing lens. The generated fluorescence light is collected at 90 degree angle, to prevent stray light entering the detection opties [3] as shown in figure 2.4 (right). Using filters the emission window is selected and the light detected using a photomultiplier tube, ho~sed at -20 degree C to reduce noise.
28

Instruments using UF detection 2.4
I I
~--------------------_! ! l :
______ j I !
• ! i r--------------7oc--l _____ ~ INTERFACil U----~~!~----~
FILTERS ~
~ TO INTERFACE
Fig 2.3: Schematic setup for CE-UF (left) and detail ofthe dereetion system (right).
The detected signal is amplified and converted to an analog signal. All the mentioned features are controlled and data collected using a multilab TS computer interface connected to a personal computer all controlled by the Caesar software.
2.4.2 Commercial LIF detector
As a commercial instrument with laser induced fluorescence a P/ ACE 2050 with UF detector was used (Beckman Instruments, Palo Alto, CA, USA). The instrument is similar to the P/ ACE 2000 except for the detection module. An externallasec souree can be connected to the detection unit. In all experiments an air cooled Argon ion laser (Coherent, Palo Alto, CA, USA) was use at a flxed power of 3 mW. Fiber opties guide the light to the capillary tube. Fluorescence light is collected at the same angle using a parabolle mirror and focused onto the photomultiplier tube. In this way a very large percentage of the emission light can be collected. A bar was present in the cel to prevent stray light entering the detector. Again a filter selection determines the emission window. The highly sensitive opties of the commercial detector allows operation at much lower light levels, thus reducing background light. The fact that excitation and detection are done under the same angle makes positioning of the capillary much easier. The capillary was mounted in a capillary cartridge, selfalligning in the instrument.
The instrument was controlled and data were collected using the P/ACE-UF software. For subsequent analysis Caesar NT (B*Wise, Geleen, The Netherlands) was used in an adapted form to be able to read fluorescence signals.
29
2.INSTRUMENTATION FOR CAPILLARY ELECTROPHORESIS
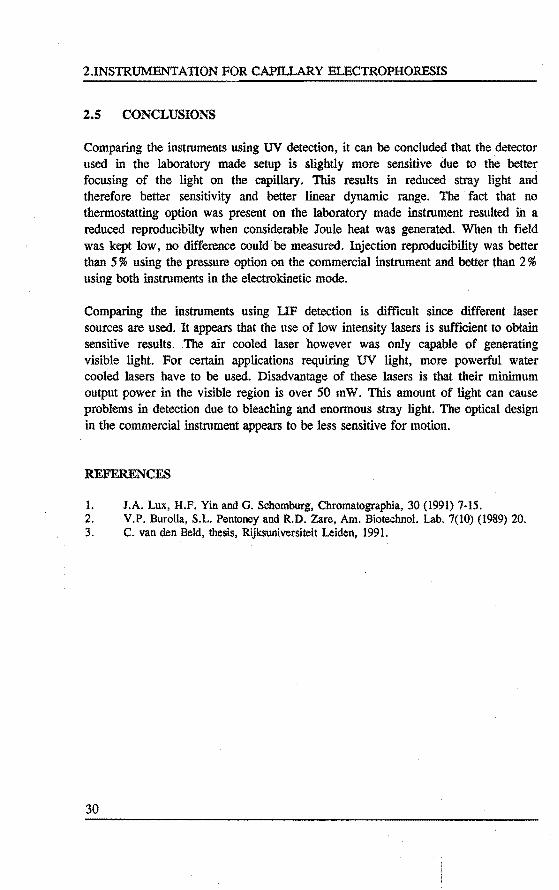
2.5 CONCLUSIONS
Comparing the instroments using UV detection, it can be concluded that the detector used in the laboratory made setup is slightly more sensitive due to the better focusing of the light on the capillary. This results in reduced stray light and therefore better sensitivity and better linear dynamic range. The fact that no thermostatting option was present on the laboratory made instrument resulted in a reduced reproducibilty when considerable Joule heat was generated. When th field was kept low, no difference could be measured. Injection reproducibility was better than 5% using the pressure option on the commercial instrument and better than 2% using both instruments in the electrokinetic mode.
Comparing the instroments using LIF detection is difficult since different laser sourees are used. lt appears that tbe use of low intensity lasers is sufficient to obtain sensitive results. .The air cooled laser however was only capable of generating visible light. For certain applications requiring UV light, more powerfut water cooled lasers have to be used. Disadvantage of these lasers is that their minimum output power in the visible region is over 50 mW. Thls amount of light can cause problems in detection due to bleaching and enormons stray light. The optical design in the commercial instrument appears to be less sensitive for motion.
REFERENCES
1. J.A. Lux, H.F. Yin and G. Schomburg, Chromatographia, 30 (1991) 7-15. 2. V.P. Burolla, S.L. Pentoney and R.D. Zare, Am. Biotechnol. Lab. 7(10) (1989) 20. 3. C. van den Beid, thesis, Rijksuniversiteit Leiden, 1991.
30

ABSTRACT
CHAPTER3
MEASUREMENT AND CONTROL OF ELECTROOSMOTie FLOW
Introduetion 3.1
Electroosmosis is an imponant phenomenon in Capillary Electrophoresis. lt often delennines rhe resolurion and speed of the analysis. lt however can also lead to the loss of some components when the flow is clu:mging. Therefore it is eminent to laww the flow in every separarion. Three methods for measuring the zeta potenrial and the electroosmode flow in capillaries for electrophoreric or electrochromatographic separarions are discussed. Streaming potenrial measurements with computer control and data aquisirion can be used o.ff-line for a jast screening of the capillaries behaviour. To test the equipment the varlarion of the zeta potenrial with pH was peifonned and characteristics of the system are discussed. Weighing measurements are peifonned on-line in the separarion instrumentarion. The varlarion of measurement with increased electric field strengril is shown. A conducrivity cel used as one of the electrolyte reservoirs can also monitor the flow. Of all methods the characterisrics and the accuracy are discussed.
3.1 INTRODUCTION
In the last frfteen years electroosmosis bas been introduced as a way of transporting the mobile pbase in capillary ebromatography (1) and the electrolyte salution in capillary electrophoresis (2). The benefit for chromatography is the flat velocity profile of electroosmotie flow as compared to the parabolle flow profile arising from mechanieal pumping. This often leads to a decrease in band broadening and therefore to higher plate numbers (3,4). The advantage for electrophoresis is the streaming electrolyte whieh can be used to sweep all ions towards the detector independent of there charge sign. In this case the absolute value of the electroosmotie velocity is higher then the absolute value of any of the electrophoretic veloeities. If the electroosmosis is orientated oppositely to the ion electrophoretic direction, but bas a lower absolute value then a counter current situation occurs which leads to an increase in separation time to obtain full resolution (5,6).
31
3 MEASUREMENT AND CONTROL OF BLECTROOSMOTIC FLOW
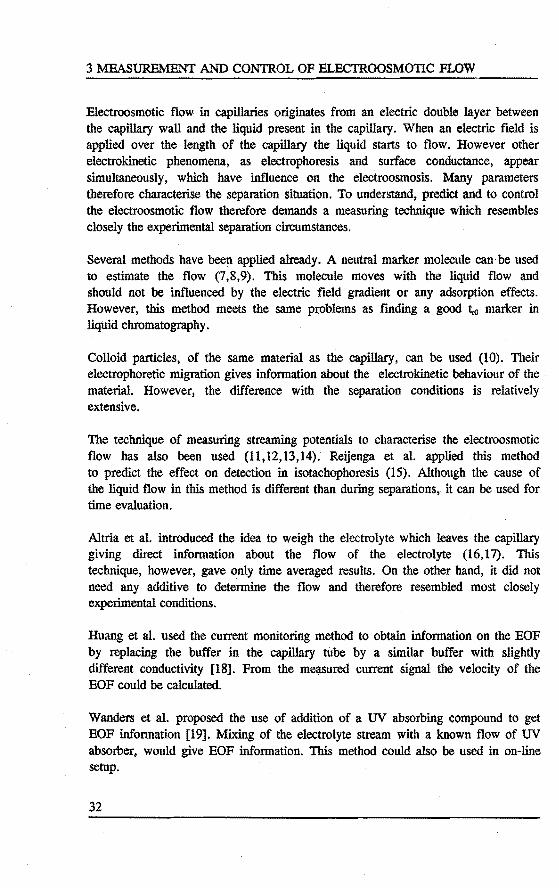
Electroosmotie flow in capillaries originates from an electtic double layer between the capillary wall and the liquid present in the capillary. When an electtic field is applied over the length of the capillary the liquid starts to flow. However other electrokinetic phenomena, as electrophoresis and surface conductance, appear simultaneously, which have influence on the electroosmosis. Many parameters therefore characterise the separation situation. To onderstand, predict and to control the electroosmotie flow therefore demands a measuring technique which resembles closely tbe experimental separation circumstances.
Several methods have been applied already. A neutral marker molecule can · be used to estimate the flow (7,8,9). This molecule moves with the liquid flow and should not be influenced by the electtic field gradient or any adsorption effects. However, this metbod roeets the same probieros as finding a good t.o marker in liquid chromatography.
Colloid particles, of the same material as the capillary, can be used (10). Their electrophoretic migration gives information about the electrokinetic behaviour of the material. However, the difference with the separation conditions is relatively extensive.
The technique of measuring streaming potentials to characterise the electroosmotie flow bas also been used (11,12,13,14). Reijenga et al. applied this metbod to predict the effect on detection in isotachophoresis (15). Although tbe cause of the liquid flow in this metbod is different than during separations, it can be used for time evaluation.
Altria et al. introduced the idea to weigh the electrolyte which leaves the capillary giving direct information about the flow of the electrolyte (16,17). This technique, however, gave only time averaged results. On the other hand, it did not need any additive to determine the flow and therefore resembied most closely experimental conditions.
Huang et al. used the current monitoring metbod to obtain information on the EOF by replacing the buffer in the capillary tube by a similar buffer with slightly different conductivity [18]. From the measured current signal the velocity of the EOF could be calculated.
Wanders et al. proposed the use of addition of a UV absorbing compound to get EOF information [19]. Mixing of the electrolyte stream with a known flow of UV absorber, would give EOF information. This metbod could also be used in on-line setup.
32

Introduetion 3.1
The use of measuri.ng the EOF is always to control whether the desired flow bas been acbieved. Several ways to change the flow can be used, such as capillary coating, static or dynamic, the use of surfactants [20], viscosity changes in the buffer [21] or the addition of an extemal radial field to influence the zeta potential and in tbis way the EOF [22,23,24]. The idea of a direct coupling of an EOF flow detector to an EOF flow modification metbod would ultimately be the most promosing way to go [25].
In tbis chapter a number of methods to measure the EOF are discussed and compared in tenns of their accuracy and possibility to use as an on-line eof detector [26]. The streaming potential measurement is used to study the effect of buffer composition on the capillary surface. The weighing metbod bas been modified and implemented as an on-line metbod and a new approach using an on-line conductivity cell is discussed.
3.2 THEORY OF ELECTROKINETIC PHENOMENA
The theory of the electrokinetic phenomena as electroosmosis, electrophoresis, surface conductance · and streaming potentlal is extensively discussed elsewhere (11,12,27,28). Aspects necessary fora clear explanation are pointed out.
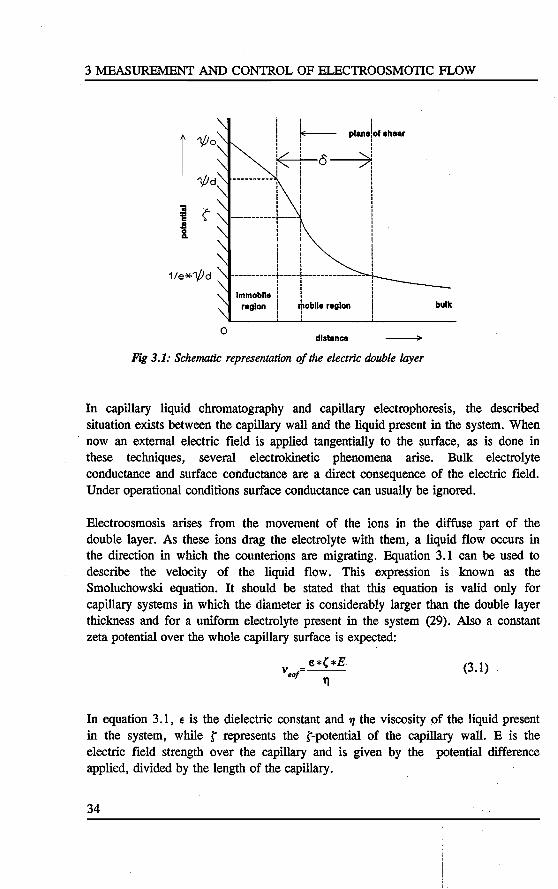
When an insuiator is immersed in a liquid an electric double layer results between them at the interface. This is caused by the fact that the surface gets charged because ionic substances can be adsorbed or charged groups are introduced by dehydration. As a result of tbis charged surface, ionic species with similar charge sign (coions) are repelled from the surface while species with opposite charge (counterions) sign are attrackted, resulting in the double layer. Part of these ions are bound tightly to the wall and fonn tbe immobile part, while others reach further in the liquid fonning the mobile, diffuse part. Because there is no electroneutrality witbin the double layer, a potential gradient appears as described in the Gouy-Chapman theory.
Figure 3.1 shows a representation of the potential gradient appeari.ng at the solidliquid interface. In tbis tigure l/10 is the electric potential at the surface. The potentlal then deercases while entering the liquid because the space charge diminishes. The potentials at certain places are used to cbaracterise the double layer. l/14 is the potential at the interface between the immobile and mobile part of the double layer. The tbickness of the double layer o is defmed the length between the planes wbere the potential has a value of (1/e) * 1/14 and where it is l/14 (11). A third characteristic potential is de ç-potential. This is the potential at tbe distance from the surface where the liquid starts to move when an extemal force is applied.
33
3 MEASUREMENT AND CONTROL OF ELECTROOSMOTie FLOW
1 '1/Jo
'1/Jd
'iii ç-'i§
~ Q.
1/e*'l/Jd
0
i i i
! ~ plane!of ahear I I
k o-->~! l I I I
i I
-----------~----! I
I i I
! -----------~----+---------------
l ! I I
lmmoblle l : region ! +oblie region
I I
dlstanca
Fig 3.1: Schematic representation of the electric double layer
bulk
In capillary liquid chromatography and capillary electrophoresis, the described situation exists between the capillary wall and the liquid present in the system. When now an extemal electric field is applied tangentially to the surface, as is done in these techniques, several electrokinetic phenomena arise. Bulk electrolyte conductance and surface conductance are a direct consequence of the electric field. Under operational conditions surface conductance can usually be ignored.
Electroosmosis arises from the movement of the ions in the diffuse part of the double layer. As these ions drag the electrolyte with them, a liquid flow occurs in the direction in which the counterions are migrating. Equation 3.1 can be used to describe the velocity of the liquid flow. This expression is known as the Smoluchowski equation. 1t should be stated that this equation is valid only for capillary systems in which the diameter is considerably larger than the double layer thickness and for a uniform electrolyte present in the system (29). Also a constant zeta potential over the whole capillary surface is expected:
(3.1)
In equation 3 .1, e is the dielectric constant and 1J the viscosity of the liquid present in the system, while t represents the t-potential of the capillary wall. E is the electtic field strength over the capillary and is given by the potential difference applied, divided by the length of the capillary.
34

Theory of electrokinetic phenomena 3.2
Another electrokinetic phenomenum is the so-called streaming potentlat When instead of an electric field a pressure · gradient is applied tangentlal to the solid-Iiquid interface a potentlal difference is the result. This is in fact the reversed situatlon of electroosmosis. The streaming potentlal Est can also be correlated to the zeta potential of the surface by equatlon 2:
(3.2)
Here P is the pressure drop over the system and " is the specific conductance of the electrolyte in the system. Again this estimatlon can only be used in case surface conductance can be neglected in respect to the specific conductance of the electrolyte. Another requirement is that the flow within the capillary needs to have a laminar character. Measurement of streaming potentials gives access to the tpotential and in this way to a characterisation of the double layer. When the j"potential is known prediction of the electroosmosis is possible.
The mass of Iiquid teaving the capillary can also be used to estimate the flow. In this case the density of the buffer should · ofcourse be known. Using equation 3.3 the osmotic flow can be calculated.
(3.3)
In this equation 1::. W /l::.t is the weight difference measured in a given time interval. p
Is the density of the electrolyte used and A is the cross-sectionat area of the capillary. Weighing of the electrolyte can in this way lead to estimation of the BOF.
When the outlet vial, in which due to the BOF electrolyte is transported, is replaced by a conductivity cel filled with water, the increase in conductivity can be related to the flow. Since it is hard to know the contribution to the conductivity of all the different ions in the buffer, it is easier to calibrate the flow using a gravity flow. A gravity flow can easily be calculated using the sanie equation as presented for a hydrodynamic injection. A height difference of 1 cm, using aqeous buffers equals a pressure drop of 1 mbar. Using this calibration, a value can be given to tbe buffer for increase in conductlvity in tbe cel per unit of volume.
35

3 MEASUREMENT AND CONTROL OF ELECTROOSMOTIC FLOW
3.3 EXPERIMENTAL
Conditions of the experiments perfonned in the different setups were as follows. PfFE Capillaries were purchased from HABIA, Breda, The Netherlands (I.D. 0.3 mm). The length of the capillaries were 15 and 20 cm for measuring streaming potentials and 48 cm for measuring the electroosmotie flow by weight or conductivity. Fused silica capillaries were from Siemens (Gennany), having an intemal diameter of 75 l'm and a total length of 50 cm. Water for preparing electrolytes was taken from a Milli-Q purification system (Millipore, Bedford, MA, USA). All reagents used were of analytica! grade and purchased from Merck (Dannstadt, FRG). The electrolyte solutions were: 0.01 M chloride buffers of several pH valnes (Table 3.1). The viscosity of these buffers was 0.001 kg/m s; the dielectric constant was 695 10·12 F/m; the density was 1000 kg/m3. The specific conductance, "• of the buffers is also listed in Table 3.1.
Table 3.1: lOmM Hydrochloric acid electrolyte solutions
pH Buffer ion Specific conductance
3.0 6-Alanine 0.1219 3.5 6-Alanine 0.1000 4.8 Creatinine 0.0908 6.0 Histidine 0.0893 8.2 Tris 0.0853 9.0 Ammediol 0.0863
3.3.1 Streaming potentials
The experimental setup used was similar to the metbod of Reijenga et al. (15). The situation is depicted in figure 3.2. A capillary is placed between two electrolyte vessels through plastic plugs. In the vessels silver/silverchloride electcodes with dimensions 40 * 1 mm. are placed, made according to the metbod of Thomson (30). The vessels contain connections to allow nitrogen gas to enter without leakage. Care should be taken with chosing proper capillary dimensions. From equation 3.2 it is clear that high streaming potentials and therefore high resolution can be obtained by using high pressure drops. Using PfFE capillaries this pressure is limited to 1 atm. because of losses through the material wall at higher pressures. This pressure drop on the other hand limits the maximum length of the capillary because of the capillaries resistance against liquid flow.. A minimum length of 20
36
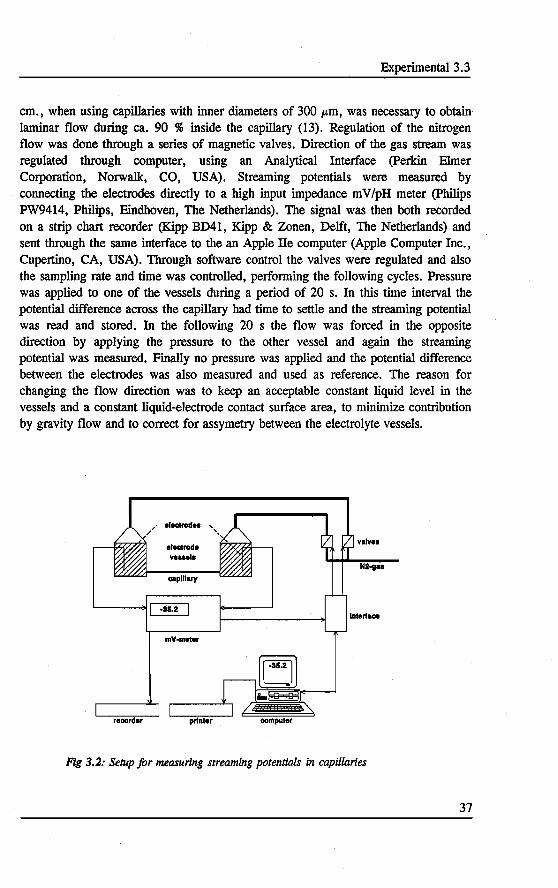
Experimental 3.3
cm., when using capillaries with inner diameters of 300 J.tm, was necessary to obtain laminar flow during ca. 90 % inside the capillary (13). Regulation of the nitrogen flow was done through a series of magnetic valves. Direction of the gas stream was regulated through computer, using an Analytica! Interface (Perkin Elmer Corporation, Norwalk, CO, USA). Streaming potentials were measured by connecting the electrodes directly to a high input impedance m V /pH meter (Philips PW9414, Philips, Eindhoven, The Netherlands). The signa! was then both recorded on a strip chart recorder (Kipp BD41, Kipp & Zonen, Delft, The Netherlands) and sent through the same interface to the an Apple !Ie computer (Apple Computer Inc., Cupertino, CA, USA). Through software control the valves were regulated and also the sampling rate and time was controlled, performing the following cycles. Pressure was applied to one of the vessels during a period of 20 s. In this time interval the potential difference across the capillary had time to settie and the streaming potentlal was read and stored. In the following 20 s the flow was forced in the opposite direction by applying the pressure to the other vessel and again the streaming potential was measured. Finally no pressure was applied and the potential difference between the electrodes was also measured and used as reference. The reason for changing the flow direction was to keep an acceptable constant liquid level in the vessels and a constant liquid-electrode contact surface area, to minimize contribution by gravity flow and to correct for assymetry between the electrolyte vessels.
electrodel
electrode ve ... ra
capiHary
mV-meter
Fig 3.2: Setup for measuring streaming potentials in capillaries
37

3 MEASUREMENT AND CONfROL OF ELECTROOSMOTie FLOW
The streaming potential was calculated by adding both potential differences, compared to the reference value and dividing by two. For calculation of the rpotential the specific conductivity of the solution ( equation 2) was measured off-line using a digital conductivity meter (CDM83, Radiometer, Copenhagen, Denmark).
3.3.2 Weighing
A schematic representation of tbe weighing setup is represented in ftgUre 3.3. Again the capillary was mounted in a similar way between the electrode vessels. The electrodes in those measurements were made of Pt-wire (0.2 mm. 0). The grounded electrolyte vessel was placed directly to a Sartorlus microbalance MPS-1 (Sartorius GmBh, Gottingen, FRG). High voltage was applied over the capillary using a Heinzinger high voltage power supply model HN 30000-1 (Heinzinger, Rosenheim, FRG), using the constant voltage mode. Special care had to be taken to prevent interaction of the electrode or the capillary in the electrolyte vessel with the weighing. Therefore the electrodes had no contact with the vessel and even a spring was used to avoid any disturbances. Also the capillary was isolated from the balance to prevent current leakage to occur and to suppress influence of contraction of the capillary, when an electrlc field was applied. The change in weight could be read directly from the display, referring to the electroosmotie flow as follows:
b4IMoed eliletrode
\ \
\ capUiary
electrode vesaelll
electrode
,.///
.I +-sow
power aupply
Fig 3.3: Setup jor measuring electroosmosis using a balance
First the liquid levels in both electrode vessels were brought to the same height. Then gravity flow compensated for the small differences still present. The position reached was used as startlog position for the next experiments. Next voltage was
38

Bxperimental 3.3
applied to the system, causing a liquid flow in the proper direction. lncrease or decrease of the weight in the vessel on the balance was registered every five minutes. This was sufficient to suppress errors occurring from instability in the readout. Next the flow was foteed in the opposite direction until the starting point was reached again. Now the same procedure was repeated but with changed polarity to compensate for any assymetry in the system. Finally a run was performed without applying any current to correct for the gravity flow. Final electroosmotie flow was calculated by averaging the values of the flows obtained, correcting for gravity flow. The weighing experiments were performed in electrolyte system (pH=8.2) listed in Table 3.1.
3.3.3 Conductivity cel
The conductivity cel used was home made in the following way. In a perspex cylindrical rod of the given length, a hole of 1 cm was drilled. In this hole a stainless steel rod was positioned in the center. Around this rod two platina wires were rapped and the ends were put througb a hole in the side •. The empty space was filled with Insulcast 510 (Permagil Industries Inc., Plainview, NY, USA) and polymerized consequently. After hardeDing tbe stainless steel rod was removed, leaving a cylindrical space witb platina wires mounted in the wall. This cel was mounted on a stirring mechanism, either consisting of a small magnetic stirrer, or an air driven rotor.
HVPS
Fig 3.4: U se of a conductivity cel in a CE setup jor on-line measurement of electrooSITWSÎS
39
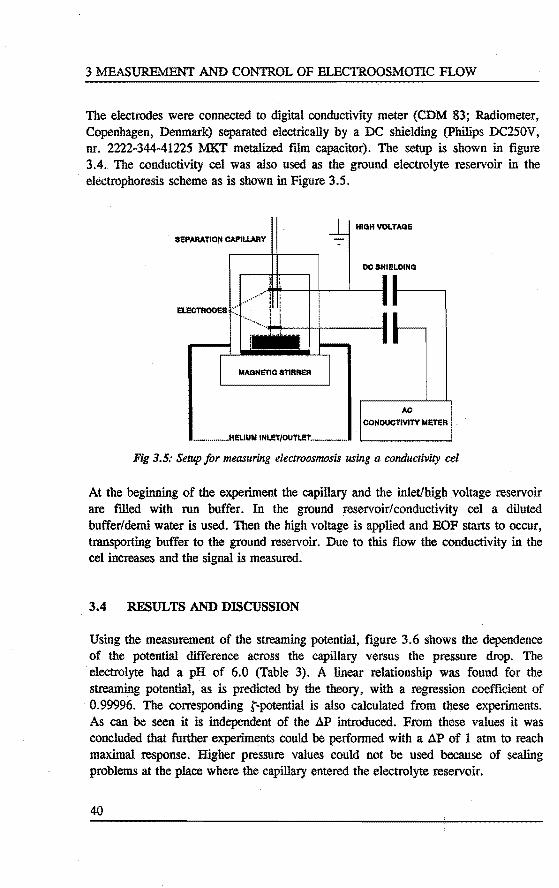
3 MBASURFMENT AND CONTROL OF ELECTROOSMOTie FLOW
The electcodes were connected to digital conductivity meter (CDM 83; Radiometer, Copenhagen, Denmark) separated electrically by a DC shielding (Philips DC250V, nr. 2222-344-41225 l\1KT metalized film capacitor). The setup is shown in flgure 3.4. The conductivity cel was a1so used as the ground electrolyte reservoir in the electrophoresis scheme as is shown in Figure 3.5.
SI!PARATION CAPII.LAIIY
HIGH VOLTAGE
DO SHII!LDING
AC CONDUCTIVITY MI!TI!R
Fig 3.5: Setup for measuring electroosmosis using a conductlvity cel
At the beginning of the experiment the capillary and the inlet/high voltage reservoir are filled with run buffer. In the ground reservoir/conductivity cel a diluted buffer/demi water is used. Then the high voltage is applied and BOF starts to occur, transporting buffer to the ground reservoir. Due to this flow the conductivity in the cel increases and the signal is measured.
3.4 RESULTS AND DISCUSSION
Using the measurement of the streaming potential, flgure 3.6 shows the dependenee of the potential difference across the capillary versus the pressure drop. The electrolyte had a pH of 6.0 (Table 3). A linear relationship was found for the streaming potential, as is predicted by the theory, with a regression coefficient of 0.99996. The corresponding r-potential is also calculated from these experiments. As can be seen it is independent of the äP introduced. From these values it was concluded that further experiments could be performed with a äP of l atm to reach maximal response. Higher pressure values could not be used because of sealing problems at the place where the capillary entered the electrolyte reservoir.
40
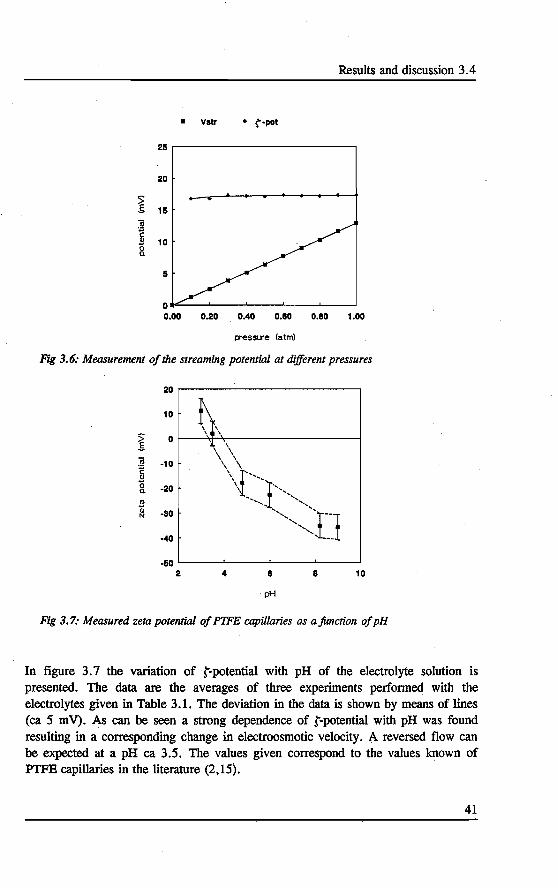
Results and discussion 3.4
• Vatr • {"·pot
25
20
> s 15 iii
l 10
5
0.20 0.40 0.80 0.80 1.00
presSLre (a tml
Fig 3. 6: Measurement of the streaming potenrial at different pressures
20r-----------------------·
·50 '---------'---------'---------'-------' 2 4 8 8 10
pH
Fig 3. 7: Measured zeta potenrial of PTFE capillaries as a jimction of pH
In tigure 3. 7 the varlation of t-potential with pH of the electrolyte solution is presented. The data are the averages of three experiments perfonned with the electrolytes given in Table 3.1. The deviation in the data is shown by means of lines (ca 5 mV). As can be seen a strong dependenee of t-potential with pH was found resulting in a corresponding change in electroosmotie velocity. A reversed flow can be expected at a pH ca 3.5. The values given correspond to the values known of PTFB capillaries in the literature (2,15).
41
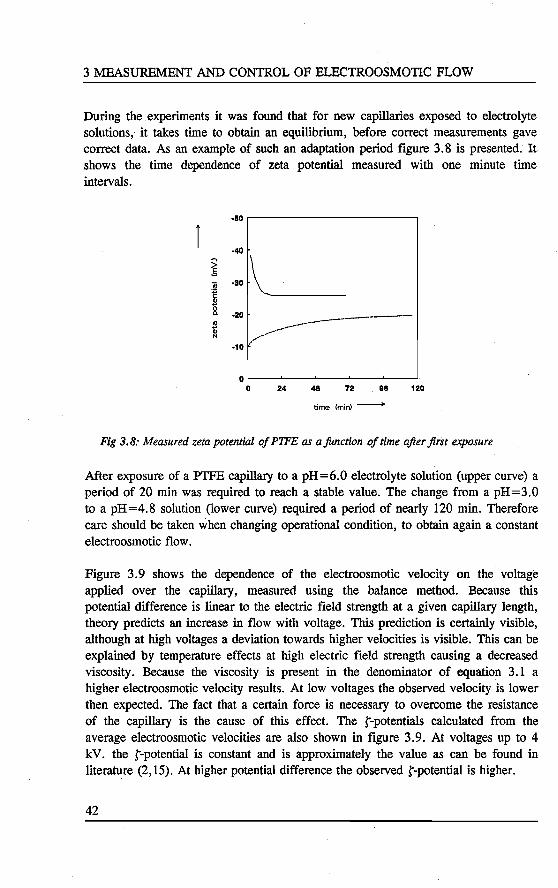
3 MEASUREMENT AND CONTROL OF ELECTROOSMOTIC FLOW
During the experiments it was found that for new capillaries exposed to electrolyte solutions, it takes time to obtain an equilibrium, before correct measurements gave correct data. As an example of such an adaptation period figure 3.8 is presented. It shows the time dependenee of zeta potentlal measured with one minute time intervals.
·50 ,...--------------.,
~ ·40 \
'ii ·30 \_ i ~-------·20 --------------___.... ·10
0 L__ _ _,__ _ _,_ _ __. __ _,__ _ _J
0 24 48 72 as 120
time (min) ------+
Fig 3.8: Measured zeta potential of PTFE as ajunetion of time after jirst exposure
After exposure of a PTFE capillary toa pH=6.0 electrolyte solution (upper curve) a period of 20 min was required to reach a stabie value. The change from a pH=3.0 to a pH=4.8 solution (lower curve) required a period of nearly 120 min. Therefore care should betaken when changing operational condition, to obtain again a constant electroosmotie flow.
Figure 3.9 shows the dependenee of the electroosmotie velocity on the voltage applied over the capillary, measured using the balance method. Because this potentlal difference is linear to the electtic field strength at a given capillary length, theory prediets an increase in flow with voltage. This prediction is certainly visible, although at high voltages a deviation towards higher veloeities is visible. This can be explained by temperature effects at high electtic field strength causing a decreased viscosity. Because the viscosity is present in the denominator of equation 3.1 a higher electroosmotie velocity results. At low voltages the observed velocity is lower then expected. The fact that a certain force is necessary to overcome the resistance of the capillary is the cause of this effect. The r-potentials calculated from the average electroosmotie veloeities are also shown in figure 3.9. At voltages up to 4 kV. the f-potential is constant and is approximately the value as can be found in literature (2, 15). At higher potentlal difference the observed f-potential is higher.
42

Results and discussion 3.4
100
l A
I 80
----"__. .. -~ _." .......
i ----:10
I I B I
·20 : I I
I
i I
~ I ·80 ~~ 1
I : :
·100 0 2 4 a 10
VoH- M (Thousandt)
Fig 3.9: Measured EOF as a jûnction of applied voltage using the on-line balance
The deviation in tbe experiments perfonned at e.g. 6 kV is mainly a result of temperature difference in the experlments. When an experiment is perfonned at a constant electric field strength, the current density increases (up to 10 %) in time because of heating effects. After the experiment was over it took several hours to obtain the starting current density value again.
When we compare the value of -35 mV. obtained with the streaming potenrial metbod at pH=8.2 with the value Of -45 mV. resulting from the weighing measurements, it can be seen that the latter results in a higher potential. It is, however, difficult to compare these two values because data on temperature inside the capillary and therefore its influence on viscosity and mobilities is not known.
Table 3.2: Measured conductivity as a jûnction of voltage using the conductivlty cel
Voltage (kV) 0 5 10 15 20 25
Conduetivity (uS/sec) 0 0.019 0.034 0.049 0.082 0.161
EOF (nL/see) 0 3.4 6.1 8.8 14.7 23.2
43
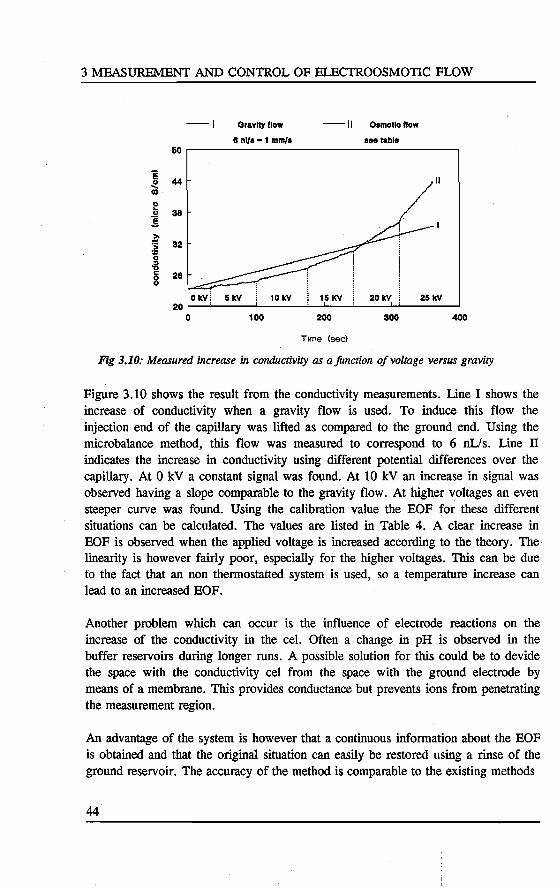
3 MEASUREMENT AND CONTROL OF ELECTROOSMOTie FLOW
-I Gravltyllow --11 Oamotlcllow
8 nl/s • 1 mm/a ••• table 60
~ 44 11 ..... 0)
0 b 38 §
~ 32 .. 0
-ä c 28 8
20 OkVJ &kV 10kV 15 KV 20 kV 25kV
0 100 200 300 400
Time (sec}
Fig 3.10: Measured increase in conductivity as a jimction of voltage versus gravity
Figure 3.10 shows the result from the conductivity measurements. Line I shows the increase of conductivity when a gravity flow is used. To induce this flow the injection end of the capillary was lifted as compared to the ground end. Using the microbalance method, this flow was measured to correspond to 6 nL/s. Line n indicates the increase in conductivity using different potentlal differences over the capillary. At 0 kV a constant signal was found. At 10 kV an increase in signal was observed ha ving a slope comparable to the gravity flow. At higher voltages an even steeper curve was found. Using the calibration value the EOF for these different situations can be calculated. The values are listed in Table 4. A clear increase in BOF is observed when the applied voltage is increased according to the theory. The linearity is however fairly poor, especially for the higher voltages. This can be due to the fact that an non thermostatted system is used, so a temperature increase can lead to an increased BOF.
Another problem which can occur is the influence of electrode reactions on the increase of the conductivity in the cel. Often a change in pH is observed in the buffer reservoirs during longer runs. A possible solution for this could be to devide the space with the conductivity cel from the space with the ground electrode by means of a membrane. This provides conductance but prevents ions from penetrating the measurement region.
An advantage of the system is however that a continuous information about the BOF is obtained and that the original situation can easily be restored using a rinse of the ground reservoir. The accuracy of the metbod is comparable to the existing methods
44
Conclusions 3.5
3.5 CONCLUSIONS
It can be concluded that data, obtained with streaming potential measurements, give better information on the materials behaviour, because temperature effects are hardly present. More stabie electrodes need to be made, to measure the streaming potential better than the present inaccuracy of 5 mV.
The measurements of weighing the electroosmotie flow approaches ciosest the experimental conditions of electrophoresis and electrochromatography. For these experiments the calculated r-potentials are of minor interest, because the electroosmotie flow is directly accessable. Because the measurement is on-line, it opens possibilities for regulation of electrendosmotic flow, through a feed back to the power supply. Increase in electroosmotie velocity is compensated by means of a decrease in electric field strength. On-line computer data aquisition is in this case of course necessary. The metbod however gives a value only ones in several minutes due to the accuracy of the balance.
The use of a conductivity cel can also lead to an on-line setup. More frequent data are available from this teclmique. Further investigation sbould be done on the effect of electrode reactions on the conductivity or a membrane can be used to sepàrate the electrode oompartment from the conductivity cel.
REFERENCES
1. V. Pretorius, B.J. Hopkins and J.O. Schieke, J. Chrom., 99 (1974) 23 2. J.W. Jorgenson, K.O. Lukacs, Anal. Chem., 53 (1981) 1298. 3. M.M. Martin and G. Guiochon, Anal. Chem., 56 (1984) 614. 4. M. Martin, G. Guiochon, Y. Walbroehl and J.W. Jorgenson, Anal. Chem., 57 (1985)
559. 5. F.M. Everaerts, Th.P.E.M. Verheggen and J.L.M. van de Venne, J. Chrom., 123
(1976) 139. 6. J. Vacik and J. Zuska, J. Chrom., 91 (1974) 795. 7. T.S. Stevens and H.J. Cortes, Anal. Chem., 55 (1983) 1365. 8. K.O. Lukacs and J.W. Jorgenson, J. HRC & CC, 8 (1985) 407. 9. H.H. Lauer and 0. McManigill, Anal. Chem., 58 (1986) 166. 10. B.J. Herren, S.G Shafer, J. van Alstine, J.M. harris and R.S. Snyder, J. Coll. Interf.
Sci., 115 (1987) 46. 11. A.J. Rutgers, M. de Smet and W. Rigole inH. van Olphen and K.J. Mysels, Physical
Chemistry: Enriching topics from Colloid and Surface Science, Theorex, La Jolla, CA, USA.
12. R.J. Hunter, Zeta potentlal in Colloid Science, Academie Press, London, 1981.
45

3 MEASUREMENT AND CONTROL OF ELECTROOSMOTie FLOW
13. R.A. van Wagenen, J.D. Andrade and J.B. Hibbs jr., J. Electrochem. Soc., 123 (1976) 1438.
14. R.A. van Wagenen and J.D. Andrade, J. Coll. Interf. Sci., 76 (1980) 305. 15. J.C. Reijenga, G.V.A. Aben, Th.P.E.M. Verheggen and P.M. Everaerts, J. Chrom.,
260 (1983) 241. 16. K.D. Altria and C.P. Simpson, Anal. Proc., 23 (1986) 453. 17. K.D. Altria and C.P. Simpson, Chromatographia, 24 (1987) 527. 18. X. Huang, M.J. Gordon and R.N. Zare, Anal. Chem. 60 (1988) 1837-1838. 19. B.l. Wanders, A.A.A.M. van de Goor and P.M. Everaerts, J. Chromatogr. 470
(1989) 89-93. 20. T. Tsuda, J. Liq. Chromatogr. 12 (1989) 2501-2514. 21. C. Schwer and E. Kenndler, Anal. Cbem. 63 (1991) 1801-1807. 22. C.S. Lee, W.C. Blancbard and C.T. Wu, Anal. Chem. 62 (1990) 1550-1552. 23. C.S. Lee, D. McManigill, C.T. Wu and B. Patel, Anal. Chem. 63 (1991) 1519-1523. 24. M.A. Hayes and A.G. Ewing, Anal. Cbem. 64 (1992) 512-516. 25. B.J. Wanders, A.A.A.M. van de Goor, P.M. Everaerts and C.A.M. Cramers, Neth.
Pat. Appl., 1990. 26. A.A.A.M. van de Goor, B.l. Wanders and F.M. Everaerts, J. Chromatogr. 470
(1989) 95-104. 27. J. T. Davies and E.K. Rideal, lnterfacial Phenomena 2nd edition, Academie Press,
New York, 1963. 28. A.W. Adamson, Pbysical Chemistry 2nd edition, Interscience, New York, 1967. 29. C.L. Rice and R. Whitehead, J. Phys. Cbem., 69 (1965) 4017. 30. G.J. Janz in D.J.G. Ives and G.J. Janz, Reference Electrodes: Tbeory and Practice,
Chapter 4, Academie Press, New York, 1961.
46
Introduetion 4.1
CHAPTER4
DERIV ATIZATION, SEPARATION AND DETECTION OF AMINO ACIDS IN CAPILLARY ELECTROPHORESIS
ABSTRACT
The analysis of amino acids is normally peifonned using a liquid chromatographic metlwd. The use of Capillary Electroplwresis might simplify this procedure or can reduce the time required. Amino acids do not have very suitable characteristics for optical detection, so derivatization is required for either UV or jluorescence. Several dyes are investigated and considered for their sensitivity, linearity, speed of reaction and injluence on electroplwretic mobility. Highly sensitive laser induced jluorescence is described for the dereetion of these species. The limit of dereetion lwwever seems to be determined by the chemica/ part more than by the sensitivity of the dereetion method.
4.1 INTRODUCTION
Amino acids are the building blocks of many biomolecules like proteins and peptides. Combination of these building blocks create an incredible variety of molecules, having important functions like enzymes, honnones or pharmaceuticals [l]. To obtain infonnation about these peptides and proteins, one of the most used procedures is to look at their amino acid composition. Thls can be done by hydrolysing under acidic conditions and to do an amino acid analysis [2]. The most commonly used technique for this is liquid chromatography, using a pre-column derivatization of the amino acids to give them suitable spectroscopie charateristics foliowed by UV detection or fluorescence detection [3].
Capillary electrophoresis is a fairly new technique suitable for the separation of ionic species. Since amino acids have well characterized physical properties, pred.ietion of their electrophoretic mobilty is fairly simple. Detection complicates this optimization however due to the fact that the derivatization changes tbe mobility. Some methods have been developed to detect tbe amino acids in tbeir native fonn such as indirect detection [4], tbennooptical detection [5] or post-colurn detection [6]. All these methods bowever are not very common and require special laboratory made equipment or are not very sensitive.
47
4 DERIVATIZATION, SEPARATION, DETECTION OF AMINO ACIDSIN CE
To test the sensinvity and separanon of derivatized amino acids for UV detection a standard chromatographic metbod of derivatization with phenylthiohydantoin was foliowed and [7] separanon performed using capillary electrophoresis [8]. The condinons for labeling are listed in table 4.1.
Table 4.1: Reaction conditions for the reaenen of amino acids with phenylisothiocyanate
Solution 1:
Solution 2:
Procedure:
4 m1 ethanol 4 m1 water 2 m1 triethylamine 7 m1 Ethanol 1 m1 water 1 m1 triethylamineTEA 1 m1 Pbenylisothiocyanate
Add to 1 ~~ 10 mM amino. acid in water, 10 ~~ of solution 1. Vacuum centrifuge until dry and add 20 ~I of solution 2. React at room temp. for 20 min, centrifuge dry and reconstitute in water.
The separation was carried out on a P/ ACE 2000 HPCE system using a buffer of pH 8.3, containing SDS and a complexing agent triethylamine as shown in figure 4.1. The top figure shows the complete separation. The SDS and complexing agent were necessary to obtain some resolunon for the more neutral species through micellar partinoning and complexanon as shown in the bottorn part.
It is quite clear thát the derivatizanon step bas a large impact on the mobility. Compounds tend to comigrate and addition of SOS could not resolve this problem. The sensinvity of the system is also fairly poor. 0.1 mM of each compound is a high concentranon as compared to LC systems were a 100 fold lower concentranon can be detected using UV absorbance and even better detection limits can be reached for fluorescence.
The use of fluorescence [9] and laser induced fluorescence [10,11,12] háve proved to be suitable detecnon technique for capillary electrophoresis of amino acids. In this chápter the detection using laser induced fluorescence in capillary electrophoresis is invesngated. Several dyes for fluorescent labeling of amine groups are used. Derivatization . condinons are discussed and the impact on the separation using capillary electrophoresis is described. The different derivatives are compared in terms of sènsinvity, linearity, reacnvity and ease of use. A general comparison is made between liquid · chromatography and capillary electrophoresis for amino acid analysis.
48
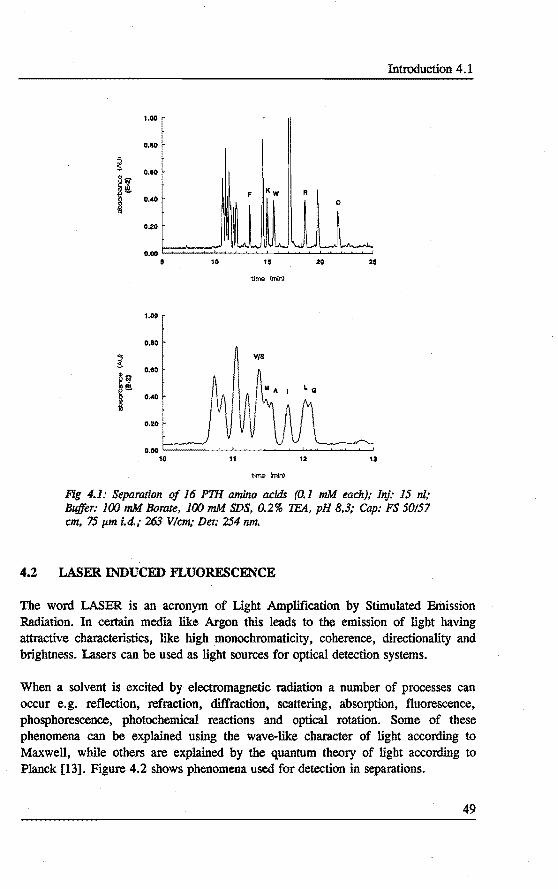
Introduetion 4.1
1.00
0.80
~ 0.80 ~Q
_!!i!.
i 0.40
o.~o
o.oo a 10 15 20 25
time (mïn)
1.00
0.80
~ o.eo ~111 1!1!!!.
VIS
i 0.40
o.u
0.00 10 11 12 13
time imin>
Fig 4.1: Separation of 16 PTH amino acids (0.1 mM each); lnj: 15 nl; Buffer: UXJ mM Borate, lfXJ mM SDS, 0.2% 1E4, pH 8,3; Cap: FS 50157 cm, 75 p.m. i.d.; 263 V/cm; Det: 254 nm.
4.2 LASER INDUCED FLUORESCENCE
The word LASER is an acronym of Light Amplification by Stimulated Brilission Radiation. In certain media 1ike Argon this leads to the emission of light having attractive characteristics, like high monochromaticity, coherence, directionality and brightness. Lasers can be used as light sourees for optical detection systems.
When a solvent is excited by electromagnetic :radiation a number of processes can occur e.g. reflection, refraction, diffraction, scattering, absorption, fluorescence, phosphorescence, photocbemical reacrions and optical rotation. Some of these phenomena can be explained using the wave-like cbaracter of light according to Maxwell, while others are explained by the quanturn theory of light according to Planck [13]. Figure 4.2 shows phenomena used for detection in separations.
49

4 DERIV ATIZATION, SEPARATION, DETECTION OF AMINO ACIDSIN CE
2 '·VR 1 : ~ S2 0
! VR 3
2 : : 1 se S1 0 - 3
! VA i i 2 1
' ~ ~ ~ 0 T1 ! A i
tsd ! A F ' ' ' l !
liC i p ~ ' !
3 !
2 1 so 0
Fig 4.2: Energy diagram showing radiative (solid line) and non-radialive (dotted line) processes in an organic molecule. A: ahsorbance, F: fluorescence, P: plwsphorescence, VR: vibrational relaxation, !SC: inter system crossing, IC: intemal conversion.
In organic molecules, tbe electrous occupy molecular orbitals, with a specific energy and angular momentum. In the ground state (SO) the angular momenturn is 0, two electrous occupy an orbital with opposite spin. In case an energy quanturn is absorbed, the electron jumps to a higher energy level. In case the spin does not change Sl, S2 etc, otberwise Tl, T2 etc ..
In case the electron falls back to the ground state it emmits an energy quant and we speak a bout fluorescence in case the momenturn does not change (S- > S) and about phosphorescence in case it does change (T- > S).
Also steps in which non-radiative energy is emitted is possible e.g. vibration relaxation or chemica! modification (photodegradation, pbotobleaching). In any case, due to the allowed energy transfers, the emitted light quanturn bas always less energy than the absorbed light quantum. Therefore the wavelength of the fluorescence emission is always higher as of the fluorescence excitation as can be seen from:
(4.1)
This shift in wavelengtb is called the Stokes shift. Cboice of proper f:tlters can therefore distinguisb between the excitation and the emission wavelength. The fluorescent radiation, the total number of photons emitted per second, is described
50
Laser induced fluorescènce 4.2
by tbe following equation for low absorbing soluions, which holds under most analytica! separation conditions.
(4.2)
Clearly the fluorescence is dependent on the optica! pathlength 1. It also includes a number of analyte parameters as the extinction coefficient e, the total number of photons absorbed and the analyte concentradon C0• In choosing proper solvents and excitation wavelength, E and fi can be optimized. Furthennore . the signa! is linear with respect to the excitation power, P. Therefore the use of laser based excitation systems can greatly enhance detection, especially due to their highly monochromatic properties. There are however limitations to the increase of P. When the excitation rate exceeds the emission rate, the ground state becomes depopulated and the absorbdon rate 4> is reduced resulting in a logaritmie relation to the power. As a limit, no molecules are in the ground state and the fluorescence reaches a plateau value. At high light intensities also photodegradation can occur resulting in a decreasing signa! when excitation power is increased. Optima! signa! for analytical purposes is to stay within the linear region to have a linear concentration dependent detection metbod without getting photodegradation.
If molecules react with radiation with a frequency which does not match their resonance frequency, radiation of the same freequency occurs, tenned Rayleigb scattering. This occurs for solvent molecules present and increases with polarization of the molecule. Aqueous systems therefore show strong Rayleigh scattering, which can be blocked by optica! fllters.
Radiation may also he modffied related the vibrational frequency of atomie honds in the molecule resulting in Raman scattering, having either a Jonger wavelength (Stokes-Raman scattering) or a shorter wavelength (anti-Stokes-Raman scattering). Especially the Stokes-Raman scattering can interfere with the emission wavelength. Selection of fluorescent molecules having a bigger Stokes shift, than the StokesRaman shift of the solvent, is therefore important. Another way to minimize scattering, is to collect fluorescence parallel to the polarization of the excitation light. This is another advantage of the use of lasers, since they have perfectly polarizad light.
To completely eliminate scattering time resolved resolved fluorescence can be applied. Since the scattering processes occur in the picosecond range and fluorescence in the nanosecond range, they can be separated from each other in the time domain using pulsed laser sources.
51

4 DERIV ATIZATION, SEPARATION, DETECTION OF .MflNO ACIDS IN CE
4.3 EXPERIMENTAL
Standard amino acids were labelect with different dyes and injected in the home built system with UF detector or analyzed using the P/ACE 2050 with UF detector. For each of the analysis reaction conditions are listed in the tables and the reaction illustrated in figure 4.3.
4
5
Fig 4.3: Reaction of the different dyes with primary amines; l=FITC, 2=DTAF, 3=NBD-Cl, 4=CBQCA, 5=0PA
The standard amino acids used were Arginine, Phenylalanine, Proline, Glycine and glutamate. These five amino acids represent different properties. Arginine is a basic amino acid, while glutamate is an acidic one. Phenylalanine is aromatic, while glycine is aliphatic. Proline is a secundary amine while the others were primary.
52
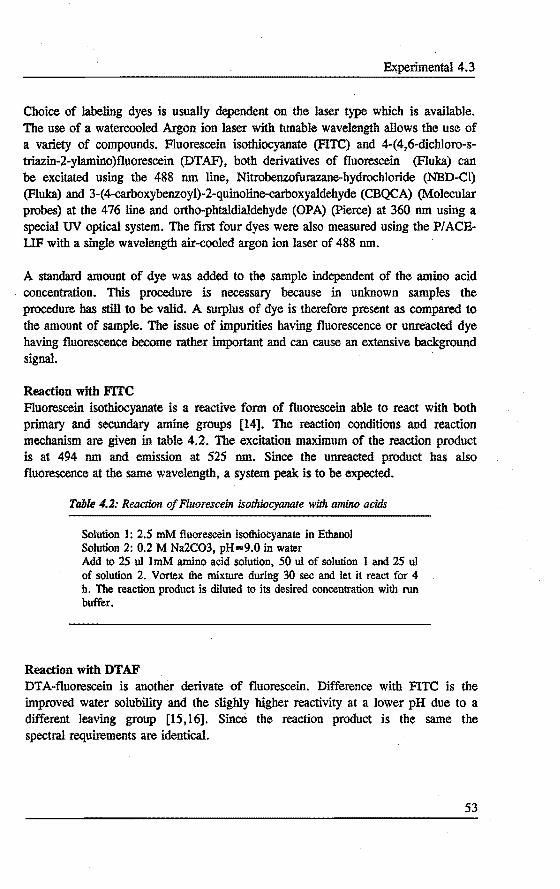
Experimental4.3
Cboice of labeling dyes is usually dependent on the laser type which is available. The use of a watercooled Argon ion laser with tunable wavelength allows tbe use of a variety of compounds. Fluorescein isothiocyanate (FITC) and 4-(4,6-dichloro-striazin-2-ylamino)fluorescein (DTAF), both derivatives of fluorescein (Fluka) can be excitated using the 488 nm line, Nitrobenzofurazane-hydrochloride (NBD-Cl) (Fluka) and 3-(4-carboxybenzoyl)-2-quinoline-carboxyaldehyde (CBQCA) (Molecular probes) at the 476 line and ortho-phtaldialdebyde (OPA) (Pierce) at 360 nm using a special UV optical system. The ÏtrSt four dyes were also measured using the P/ACEUF with a single wavelength air-cooled argon ion laser of 488 nm.
A standard amount of dye was added to the sample independent of the amino acid concentration. This procedure is necessary because in unknown samples the procedure bas still to be valid. A surplus of dye is therefore present as ooropared to the amount of sample. The issue of impurities having fluorescence or unreacted dye having fluorescence beoome rather important and can cause an extensive background signal.
Reaction with FITC Fluorescein isothiocyanate is a reactive fonn of fluorescein able to react with both primary and secundary amine groups [14]. The reaction conditions and reaction mechanism are given in table 4.2. The excitation maximum of the reaction product is at 494 nm and emission at 525 nm. Since the unreacted product bas also fluorescence at the same wavelength, a system peak is to be expected.
Ttibk 4.2: Reaction of Fluorescein isothiocyanate with amino acids
Solution 1: 2.5 mM fluorescein isothiocyanate in Ethanol Solution 2: 0.2 M Na2C03, pH=9.0 in water Add to 25 ul lmM amino acid solution, 50 ul of salution I and 25 ul of solution 2. Vortex the mixture during 30 sec and let it react for 4 h. The reaction product is diluted to its desired concentratien with run buffer.
Reaction with DTAF DTA-fluorescein is another derivate of fluorescein. Difference with FITC is the improved water solubility and the slighly higher reactivity at a lower pH due to a different teaving group [15,16]. Sincè the reaction product is the same the speetral requirements are identical.
53

4 DERIV ATIZATION, SEPARATION, DETECTION OF AMINO ACIDS IN CE
Tabel 4.3: Reaction of DTAF with Amino acids
Salution 1: 10mM DTAF in water Salution 2: 0.1M Borate buffer, pH 8.5 To 25 ui 1 mM salution amino acid was added, 25 u1 of salution and 50 ui of salution 2. The mixture was vortex for 30 sec and Reaction during 1 h at room temperature allowed. The mixtîJre was diluted to desired concentratien with buffer.
Reaction with CBQCA CBQCA is a molecule designed to be reactive only with primary amines. Since it involves an intramolecular reaction in which a ring ciosure is involved, the unreacted compound does not possess fluorescence. Due to the side ebains the excitation maximum is shifted to 468 nm [17]. The emission maximum is at 560 nm., having a nice large speetral shift, making it easier to select filters.
Table 4.4;• Reaction of CBQCA with amino acids
Salution 1: 10mM CBQCA in Methanol Salution 2: 20mM KCN in water Add to 25 J'l Amino acid solution, 50 J'l of salution 2 and 25 J'l salution 1. Vortex for 1 min and React at room temperature for 1 h. Dilute to the final concentratien with run buffer.
Reaction with NBD-Cl NBD-Cl is an example of a low-fluorescing compound, obtaing high fluorescence after reaction due to a ring addition [18, 19,20]. The background in this case is fairly low. Excitation is at 475 and emission at 540 nm.
54
Table 4.5: Reaction of NBD-Cl with amino acids
salution 1: 6mM NBD-Cl in Ethanol salution 2: saturated NaAc in Ethanol salution 3: Ethanol To 25 u1 amino acid salution was added, 25 ul of salution 1, 25 u1 of salution 2 and 500 ul salution 3. The mixture was vortexed for 30 sec and reacted at 75 C for 20 min. solvent was evaporated and the compound reconstituted to the desired concentratien using run buffer.
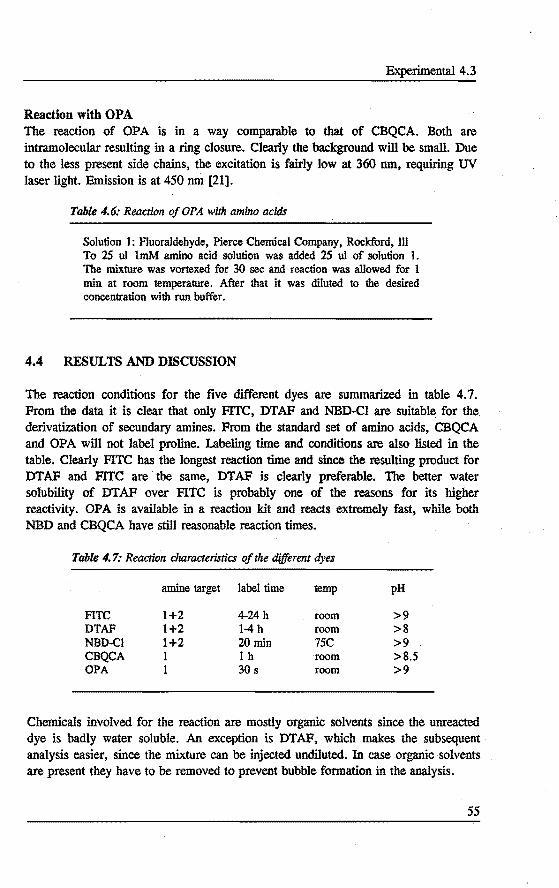
Experimental 4.3
Rea:ction with OPA The reaction of OPA IS m a way comparable to tbat of CBQCA. Both are intramolecular resulting in a ring closure. Clearly the background will be small. Due to tbe less present side chains, the excitation is fairly low at 360 nm, requiring UV laser light. Emission is at 450 nm [21].
Table 4.6: Reaction of OPA with amino acids
Solution 1: Fluoraldehyde, Pierce Chemical Company, Rockford, lil To 25 ui lmM amino acid solution was added 25 ui of solution I. The mixture was vortexed for 30 sec and reaction was allowed for 1 min at room temperature. After that it was diluted to the desired concentradon with run buffer.
4.4 RESULTS AND DISCUSSION
The reaction conditions for the five different dyes are summarized in table 4. 7. From tbe data it is clear that only FITC, DTAF and NBD-Cl are suitable for tbe derivatization of secundary amines. From tbe standard set of amino acids, CBQCA and OPA will not label proline. Labeling time and conditions are also listed in tbe table. Clearly FITC bas the longest reaction time and since tbe resulting product for DTAF and FITC are tbe same, DTAF is clearly preferable. The better water solubility of DTAF over FITC is probably one of tbe reasons for its higher reactivity. OPA is available in a reaction kit and reacts extremely fast, while botb NBD and CBQCA have still reasonable reaction times. ·
Table 4. 7: Reaction characteristics of the different dyes
amine target label time temp pH
FITC 1+2 4-24 h room >9 DTAF 1+2 1-4 h room >8 NBD-CI 1+2 20 min 75C >9 CBQCA I lh room >8.5 OPA 1 30 s room >9
Chemieals involved for the reaction are mostly organic solvents since tbe unreacted dye is badly water soluble. An exception is DTAF, which makes the subsequent analysis easier, since tbe mixture can be injected undiluted. In case organic solvents are present they have to be removed to prevent bubble fonnation in tbe analysis.
55

4 DERIVATIZATION, SEPARATION, DETECTION OF AMINO ACIDSIN CE
When comparing the different derivatization methods a number of things should be taken into account. Detection sensitivity is always dependent on the system on which the measurement is performed. Tbis includes choice of the las~r and filters for selecting detection wavelength. Also the electrolyte system in which the compounds are separated and which is the detection medium is important; Fluorescence is strongly a function of pH. Often protonation or deprotonation determines whether resonance structures can exist which determine the fluorescence. In case of fluorescein is it known that at a pH below 7, the fluorescence starts to d.ecrease strongly, while at a pH of 5 it is airoost absent.
Toble 4.8: Detection limits of derlvati.zed Glycine
Glycine Home built instrument Beekman P/ ACE-UF
FITC lQ-l'M Hr11M DTAF w·nM NBD-CI Ht'M 1()"~
CBQCA l<t'M OPA lo-*M
To be able to oompare the different dyes, 1 mM solutions of glycine were labeled with the different dyes and measured using a run buffer at pH 8.5. In the home built instrument a tunable Argon ion laser was used. Optimization of wavelength for the different dyes could therefore be performed. A comparison was made using glycine labeled with OPA, FITC and NBD-Cl. In case of the commercial instrument a ftxed wavelength Argon ion laser was used at 488 nm. Therefore optimal detection condition could not be reached for each dye. In this case a comparison is made between glycine labeled with FITC, DTAF, NBD-Cl, CBQCA and OPA. Detection limits are given in table 4.8. Realalizing that only 10 nl of sample is injected, the mass detection limit is lOS times lower. For FITC and DTAF this results in subattomolar amounts.
In reality these detection limits have to be verified since they were determined using labeling conditions of 1 mM amino acid and I 0 mM of dye. When an unknown sample has to be analyzed, the amino acid concentration is not known. Therefore a standard procedure bas to be used tolabel samples. This means that 10 mM of dye is added to any sample independent of its amino acid concentration. Purity of the dye and kinetics of the reaction are therefore very important.
56
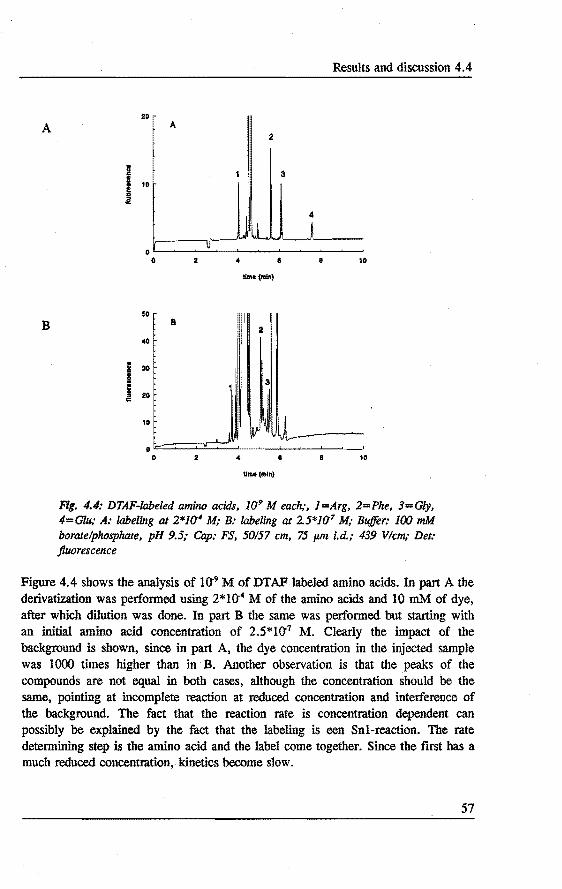
A
B
Results and discussion 4.4
20 A
2
3 10
4
~ 0
0 I " 8 8 10
llmo(mln)
$0 B
2 -40
11 10 " ! i 20 ..
10
0 0 8 10
llme(mln)
Fig. 4.4: DTAF-labeled amino acids, J0·9 M each;, l=Arg, 2=Phe, 3=Gly, 4=Glu,· A: labeling at 2*1fr M,· B: labeling at 2.5*]()7 M,· Buffer: J(X) mM boratelphosphate, pH 9.5,· Cap: FS, 50157 cm, 75 p.m i.d.,· 439 V/cm,· Det: jluorescence
Figure 4.4 shows tbe analysis of 10·9 M of DTAF labeled amino acids. In part A the derivatization was perfonned using 2*1(14 Mof tbe amino acids and 10 mM of dye, after wbich dilution was done. In part B the same was perfonned but starting with an initial amino acid concentration of 2.5*10·7 M. Clearly tbe impact of tbe background is shown, since in part A, tbe dye concentradon in tbe injected sample was 1000 times bigher than in B. Another observation is that the peaks of the compounds are not equal in both cases, although the concentration should be the same, pointing at incomplete reaction at reduced concentration and interference of the background. The fact tbat tbe reaction rate is concentration dependent can possibly be explained by tbe fact that the labeling is een Snl-reaction. The rate determining step is the amino acid and the label come together. Since the frrst bas a much reduced concentration, kinetics beoome slow.
57
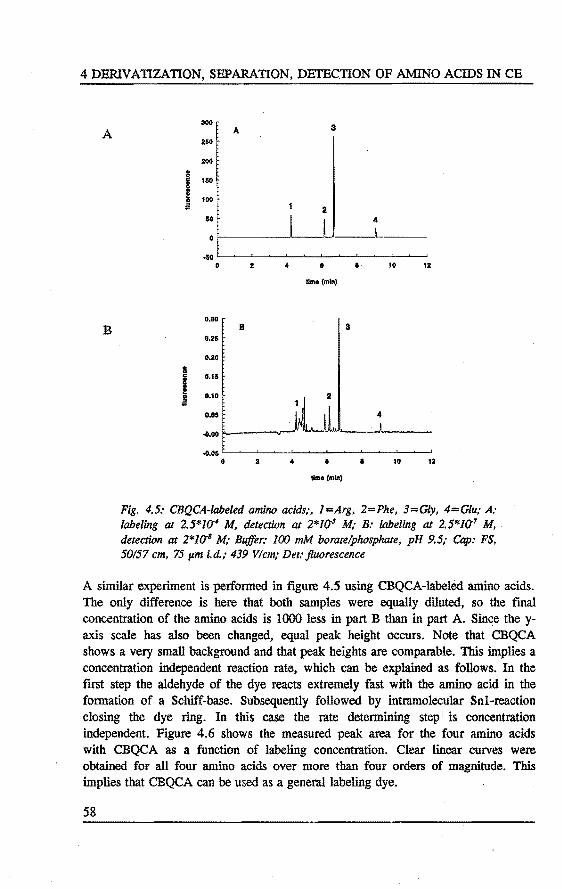
4 DERIVATIZATION, SEPARATION, DBTECTION OF AMINO ACIDSIN CE
A
B
300 A 3
2$0
.200 .. :! 150 ! ; 100 .i! c
t 2 50 ~
0
-sa 0 2 I 8 10 12
~ ... (mln)
0.30 B 3
0.25
0.20
I
i D.11
i o.to
"' 0.05
.o.oo
.0.06 0 2 8 10 12
tme (mln)
Fig. 4.5: CBQCA-labeled amituJ acids;, 1=Arg, 2=Phe, 3==Gly, 4=Giu; A: labeling at 2.5*10"' M, detection at 2*HJ' M; B: labeling at 2.5*1&7 M, detection at 2*1(18 M,· Buffer: J(XJ mM boratelphosphate, pH 9.5; Cap: FS, 50157 cm, 75 pm i.d.; 439 V/cm; Det: jluorescence
A similar experiment is perfonned in figure 4.5 using CBQCA-labeled amino acids. The only difference is here that both samples were equally diluted, so the fmal concentration of the amino acids is 1000 less in part B than in part A. Since the yaxis scale bas also been changed, equal peak height occurs. Note that CBQCA shows a very small background and that peak heights are comparable. This implies a concentration independent reaction rate, which can be explained as follows. In the first step the aldehyde of the dye reacts extremely fast with the amino acid in the fonnation of a Schiff-base. Subsequently followed by intramolecular Snl-reaction closing the dye ring. In this case the rate detennining step is concentration independent. Figure 4.6 shows the measured peak area for the four amino acids with CBQCA as a function of labeling concentration. Clear linear curves were obtained for all four amino acids over more than four orders of magnitude. This implies that CBQCA can be used as a generallabeling dye.
58
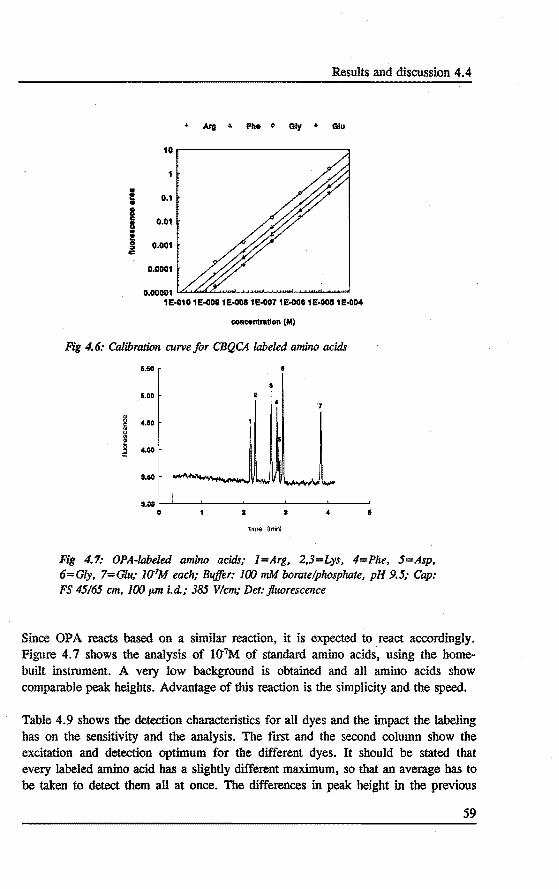
Results and discussion 4. 4
+ Ar11 " Pil• o GIJ • Glu
I 0.1
I c 0.01
I 0 0.001 "' c
0.0001
0.00001 LL....."""""CLi...........t.~........._~......_~ ......................
1&·010 1E.OOII1E.008 1E.007 1&.0011.1&·008 1&..004
concentratlon (M)
Fig 4.6: Calwration curvefor CBQC4 labeled amino acids
5.50
&.00
~ 4.60
-~ .:1 4.00
3.60
3.00 '--'---'-----'----'----'-----' 0 a 3 •
Fig 4.7: OPA-labeled amino acids; l=Arg, 2,3=Lys, 4=Phe, 5=Asp, 6=Gly, 7=Glu,· J(J7M each; Buffer: 100 mM borate/phosphate, pH 9.5,· Cap: FS 45/65 cm, 100 p.m t.d.; 385 V/cm,· Det: jluorescence
Since OP A reacts based on a similar reaction, it is expected to react accordingly. Figure 4. 7 shows the analysis of Ht'M of standard amino acids, using the homebuilt instrument. A very low background is obtained and all amino acids show comparable peak heigbts. Advantage of this reaction is the simplicity and the speed.
Table 4.9 shows the detection characteristics for all dyes and the impact the labeling bas on the sensitivity and the analysis. Tbe frrst and the second column show tbe excitation and doteetion optimum for the different dyes. It should be stated that every labeled amino acid bas a sligbtly different maximum, so that an average bas to be taken to detect them all at once. Tbe differences in peak height in the previous
59

4 DERIVATIZATION, SEPARATION, DETECTION OF AMINO ACIDSIN CE
analyses are partly a result of this effect. However excitation maxima and detection maxima are rather broad bands and a few nanometers off the top doesn't have a big impact. Especially at the excitation site compensation by increasing laser power acn be easUy made. The third and fourth column state the detection limits. Sensitivity I refers to the previously tabled values. Labeling was performed at the 1 mM amino acid level, using 10 mM dye and the reaction mixture was subsequently dUuted to the given detection concentration. Sensitivity II however refers to the concentradon of the amino acid in the original sample, which was then derivatized using 10 mM dye and analysed. Clearly the latter reflects the reality of analysis. As can be seen FITC and DTAF show a tremendous difference of 4 orders of magnitude between both values. It is clear from tigure 4.4, that the high dye backgound and the multiple background peaks are the cause for that. The other three dyes have values which are much closer to eachother as can a1so beseen from tigure 4.5.
Table 4.9: Detection characterlstis of different jluorescence dyes
Label ex em sens I sens U purity mob. linear. signal
FITC 494 525 -11 -7 DTAF 494 525 -11 -7 NBD 415 540 -8 -7 0 + 0 0 CBQCA 468 560 -9 -8 + 0 + + OPA 360 450 -8 -8 + 0 + +
The background and appearance of multiple peaks is listed in tbe column termed purity. Both CBQCA and OPA sbowed nice and clean electropherograms. The linearity of the reaction performed as sbown in table 4.8, is qualitatively summarized in the column linear. Due to the reaction mechanism again CBQCA and OPA show the best results. The last column states the difference in peak height when using different amino acids. The impact of the labeling reaction on the mobillty and therefore the ease of separation is listed in the column termed mob ..
4.5 CONCLUSIONS
It can be concluded that derivatization of amino acids for fluorescence detection can clearly enhance the detectabillty as compared to UV detection. Impressive detection limits can be obtained, when the dye used for the labeling is at comparable and high concentration as the amino acids. In this case clearly the dye having the highest
60
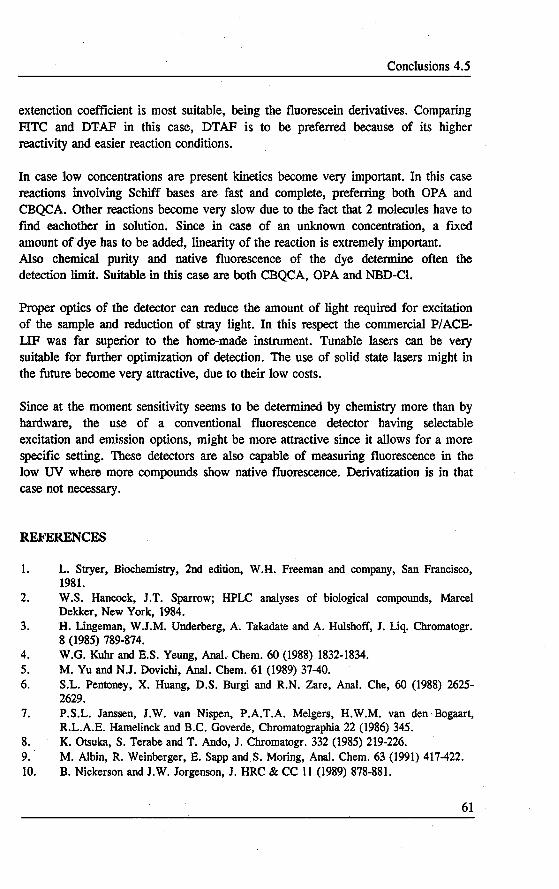
Conclusions 4.5
extenction coefficient is most suitable, being the fluorescein derivatives. Comparing FITC and DTAF in this case, DTAF is to be preferred because of its higher reactivity and easier reaction conditions.
In case low concentrations are present kinetics become very important. In this case reactions involving Schiff bases are fast and complete, preferring both OP A and CBQCA. Other reactions become very slow due to the fact that 2 molecules have to fmd eachother in solution. Since in case of an unknown concentration, a flxed amount of dye bas to be added, linearity of the reaction is extremely important. Also chemical purity and native fluorescence of the dye determine often the detection limit. Suitable in this case are both CBQCA, OPA and NBD-Cl.
Proper opties of the detector can reduce the amount of light required for excitation of the sample and reduction of stray light. In this respect the commercial P/ ACEUP was far superior to the home-made instrument. Tunable lasers can be very suitable for further optimization of detection. The use of solid state lasers might in the future become very attractive, due to their low costs.
Since at the moment sensitivity seems to be determined by chemistry more than by hardware, the use of a conventional fluorescence detector having selectable excitation and emission options, might be more attractive since it allows for a more specillc setting. These detectors are also capable of measuring fluorescence in the low UV where more compounds show native fluorescence. Derivatization is in that case not necessary.
REFERENCES
1. L. Stryer, Biochemistry, 2nd edition, W.H. Preeman and company, San Francisco, 1981.
2. W.S. Hancock, J.T. Sparrow; HPLC analyses of biologica! compounds, Marcel Dekker, New York, 1984.
3. H. Lingeman, W.J.M. Underberg, A. Takadate and A. Hulshoff, J. Liq. Chromatogr. 8 (1985) 789-874.
4. W.G. Kuhr and E.S. Yeung, Anal. Chem. 60 (1988) 1832-1834. 5. M. Yu and N.J. Dovichi, Anal. Chem. 61 (1989) 37-40. 6. S.L. Pentoney, X. Huang, D.S. Burgi and R.N. Zare, Anal. Che, 60 (1988) 2625-
2629. 7. P.S.L. Janssen, J.W. van Nispen, P.A.T.A. Melgers, H.W.M. van den· Bogaart,
R.L.A.E. Hamelinek and B.C. Goverde, Chromatographia 22 (1986) 345. 8. K. Otsuka, S. Terabe and T. Ando, J. Chromatogr. 332 (1985) 219-226. 9. M. Albin, R. Weinberger, E. Sappand S. Moring, Anal. Chem. 63 (1991) 417-422. 10. B. Nickerson and J.W. Jorgenson, J. HRC & CC 11 (1989) 878-881.
61
4 DERIV ATIZATION, SEPARATION, DETECTION OF AMINO ACIDS IN CE
ll. S. Wu and N.J. Dovichi, J. Chromatogr. 480 (1989) 141-155. 12. Y.F. Cheng and N.J. Dovichl, Sci. 242 (1988) 562-564. 13. Longair, M.S., Theoretica! concepts in physics, Cambridge Uoiversity Press (1984). 14. Reisher and Du, Anal. Biochem. 26 (1968) 178. 15. Blaksely et al., 1. Immunol. Meth., 13 (1976) 305. 16. Mahoney et al., J. Biochem, 243 (1987) 569. 17. J. Liu, Y.Z. Hsieh, D. Wiester and M. Novotny, Anal. Chem. 63 (1991) 408-412. 18. Ghosh and Whltehouse, J. Biochem. 108 (1968) 155. 19. Prager et al., Anal. Biochem. 53 (1973) 290. 20. W.W. Andrews, J. Biol. Chem. 259 (1984) 14378. 21. J. Liu, K.A. Cobb and M. Novotny, J. Chromatogr. 468 (1989) 55-65.
62

Introduetion 5.1
CHAPI'ERS
PREDICTION AND OPTIMIZATION OF PEPTIDE SEPARATIONS IN CAPIT.LARY ELECTROPHORESIS
ABSTRACT
Capillary Electrophoresis can be successfully used to analyze small peprides to give addirional information to High PeTformanee Liquid Chromatography. The separarion of a m.odijied ACTH-(4-9)-fragment (Org 2766) and several of its fragments is invesrigated using Capillary Zone Electroplwresis. Predierion ofmigrarion in aqueous systems using pKa related data and the migradon behaviour using SDS in the buffer are discussed, as is the choice of buffer systems. The electrophoreric pattems are compared with the HPLC separarion. The result of a surplus of a compound as compared to the others is shown using an endorphin pepride and related fragments as an example . . The use of laser induced jluorescence can enhance the sensirivity of pepride analysis as is shown by the analysis of derivatized fragments of the trypric digest of a-lactoglobulin. A comparison is made·to the UV anàlysis without derivarizarion.
5.1 INTRODUCTION
The adrenocorticotropic bonnone, AC1H, is long known for its stimulation of tbe adrenal cortex to produce and release steroid bonnones. In addition to extra-adrenal activities, e.g. lipolytic and melanotropic effects, ACTII also influences behaviour in animals and man (1). In recent years several studies have shown that ACTHand related peptides stimulate recovery of sensarimotor function after nerve damage (2). Org 2766, a modified AC1H-{4-9)-fragment, also active in thls respect, was found to prevent neuropathies induced by cystostatic drugs botb in animals and man (3). ·
Part of the development workof a compound is to fmd conditions to separate tbe parent compound from its fragments, eitber syntbetic products or metabolites. High Performance Liquid Chromatography (HPLC) is an establisbed technique for the separation of peptides. Capillary Electrophoresis is a fast growing separation metbod in which automation common in chromatography is combined with the separation power of electrophoresis(4,5). Capillary . Zone Electrophoresis (CZB) has shown to be an additional technique to HPLC in tbe analysis of small peptides (6-11). Small differences in charge and size can give separation witb different selectivity as compared to HPLC.
63
5 PRBDICTION AND OPTIMIZATION OF PEPTIDE ANALYSIS IN CE
In the development of an adequate separation of Org 2766 from five of its possible fragments, we investigated the use of CZE in aqueous systems and tried to predict optima! separation using a simple program for prediedon of peptide charge and mobility. Also performance in several buffers was investigated.
To obtain a better resolution for compounds with an overall charge of zero, sodium dodecyl sulphate (SDS) can be added to the buffer in a concentration above its critica! mieeDe concentration (CMC). This leads to the formation of an extra micellar phase in the system. Due to the fact that these micelles are charged and migrate with a different velocity as compared to the electroosmotie flow (BOF), separations arebasedon the difference in affmity for the micellar phase. This technique, known as Micellar Electrokinetic Capillary Chromatography (MECC) (12) can bring a different selectivity. The influence of the SDS concentration on the separation was investigated. For reasons of comparison we also looked at the separation of the peptides by HPLC.
When purity control is performed, often a surplus of one compound is present next to a number of impurities. Using endorphins, as an example, the effect of this surplus on the resolution is studied.
Sensitivity is another isue which can be of concern when going from a wide bore technique as RP-HPLC to a microbare technique as CE. In tbe previous chapter laser induced fluorescence bas been investigated as a possible detection method. Here we will show the application of LIF to the detection of the tryptic digest of 6-lactoglobulin. Peptide mapping is á frequently used technique to study composition of proteins.
5.2 PREDICTION OF ELECTROPHORETIC MOBILITY
Figure 5.1 shows the amino acid composition of the hexapeptide Org 2766 and its fragments. Part of the sequence of ACTH is also listed.
Using the amino acid composition of the peptide it is possible to calculate an imaginary titration curve for this compound using the pKa values of the various amino acids (13). The charge of the peptides under various pH conditions can then be easily calculated. In figure 5.2 the charge versus pH curves are given for tbe different peptide fragments calculated. For Met02 the same pKa-values are used as for Methionine.
Charge is of course one of the main parameters which determine electrophoretic migration behaviour of peptides in an aqueous buffer system. Several authors have tried to propose a model including other parameters e.g. molecular weight or number of amino acids for accurate estimation of the migration characteristics.
64
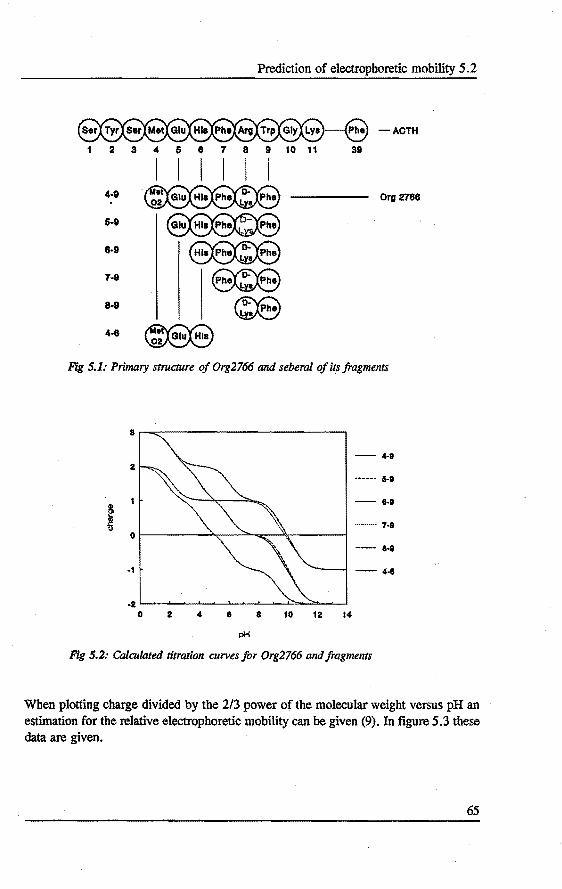
Prediction of electropboretic mobility 5.2
-AOTH
2 s 4 s a 1 a s 10
I I I I I I Org 2768
Fig 5.1: Primary structure of Org2766 and seberol of its fragments
8
-4-1 2
·--... -- 5-1
- 8·1
f ···-······ 7-8 0
- 8·1
·1 - 4-8
4~~~~~~~~~~~~~~
0 2 4 a 10 12 14
Fig 5.2: Calculated tilration curves for Org2766 and fragmmts
Wben plotting charge divided by tbe 2/3 power of tbe molecular weight versus pH an estimation for the relative electrophoretic mobility can be given (9). In tigure 5.3 these data are given.
65
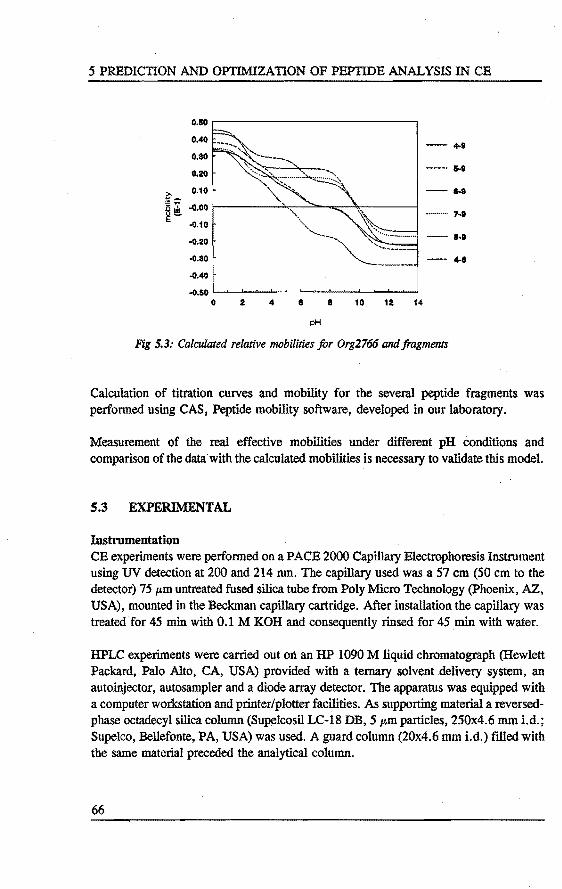
5 PREDICTION AND OPTIMIZATION OF PEPTIDE ANALYSIS IN CE
0.10 ,.---------------,
0.40
o.ao 0.20
-+9
------ s.o
>- 0.10 -- 8-8 I ~ .o.oo ~-----~-_"_--=__,.,._ __ --i ........... 7·8
.0.10
.0.20
.0.30
..0.40
..0.10 c.........__.~__,_~_,_~_.__~...__--.J'--'--l
0 2 4 8 8 10 12 14
pH
-- +11
Fig 5.3: Calculated relative mobilities for Org2766 and fragments
Calculation of titration curves and mobility for tbe several peptide fragments was perfonned using CAS, Peptide mobility software, developed in our laboratory.
Measurement of tbe real effective mobilities under different pH conditions and comparison of tbe data witb tbe calculated mobilities is necessary to validate tbis model.
5.3 EXPERIMENTAL
lnstrumentation CE experiments were perfonned on a PACE 2000 Capillary Electropboresis Instrument using UV detection at 200 and 214 nm. The capillary used was a 57 cm (50 cm to the detector) 75 14m untreated fused silica tube from Poly Micro Technology (Phoenix, AZ, USA), mounted in the Beekman capillary cartridge. After installation the capillary was treated for 45 min with 0.1 M KOH and consequently rinsed for 45 min with water.
HPLC experiments were carried out on an HP 1090 M liquid chromatograph (Hewlett Packard, Palo Alto, CA, USA) provided with a temary solvent delivery system, an autoinjector, autosamplerand a diode array detector. The apparatus was equipped with a computer workstation and printer/plotter facilities. As supporting material a reversedphase octadecyl silica column (Supelcosil LC-18 DB, 5 14m particles, 250x4.6 mm i.d.; Supelco, Bellefonte, PA, USA) was used. A guard column (20x4.6 mm i.d.) filled with the same material preceded the analytica! column.
66

Experimental5.3
Materia Is Org 2766 and their fragments were synthesized by the peptide chemistry group of Organon Endorphins was also a gift from Organon. All other chemieals used were P.A. grade and obtained from Merck, Darmstadt, West Germany, except for SDS which was from Polysciences Inc., Wanington, PA, USA and which was of electrophoresis grade. All buffers and samples were prepared using ultra purified water (Milli-Q, WatersMillipore, Bedford, MA, USA) with a resistance better than 10 MegaOhms/cm.
Methods CE analyses were performed in the following way. Priortoeach analysis the capillary was wasbed during 2 min with 0.1 M KOH, 2 min with water and 2 min with the buffer system successively, to obtain reproducible conditions in the separation system. Samples were dissolved in water unless stated otherwise and analyzed immediately. Injection was performed using pressure having a volume in the range of 5-25 nL. Temperature was preset at 25°C. All analyses were performed using a potential difference of 25 kV. Aqueous buffers used are listed in Table I.
The choice of electrolyte systems is a critical issue in CZE. To illustrate the effect of some essential parameters, characteristics of the used buffers are given in Table n.
Table 1: Buffer systems usedfor tlte analysi of0rg2766
l. pH 2.2: 25mM phosphate + KOH 2. pH 3.8: 20mM fermate + alanine 3. pH 4.4: 20mM epsilon amino caproate + acetic acid 4. pH 6.2: 20mM histidine+morpholinoethanesulfonic acid 5. pH 7.5: 40mM imidazole+morpholinopropanesulfonicacid 6. pH 8.3: IOOmM borate + KOH
Table 5.2: Characteristics the buffers used for the analysis of Org2766
pH conc conduc. i(25kV) EOF uv nr. (mM) (mS/cm) (uA) (min) (AU) 1 2.2 25 4.03 72 >60 0.000 2 3.8 20 0.95 17 11.6 0.002 3 4.4 20 0.84 15 6.4 0.007 4 6.0 20 0.39 7 3.6 0.059 5 7.5 40 0.73 13 3.3 0.057 6 8.3 100 1.90 34 2.8 0.000
67
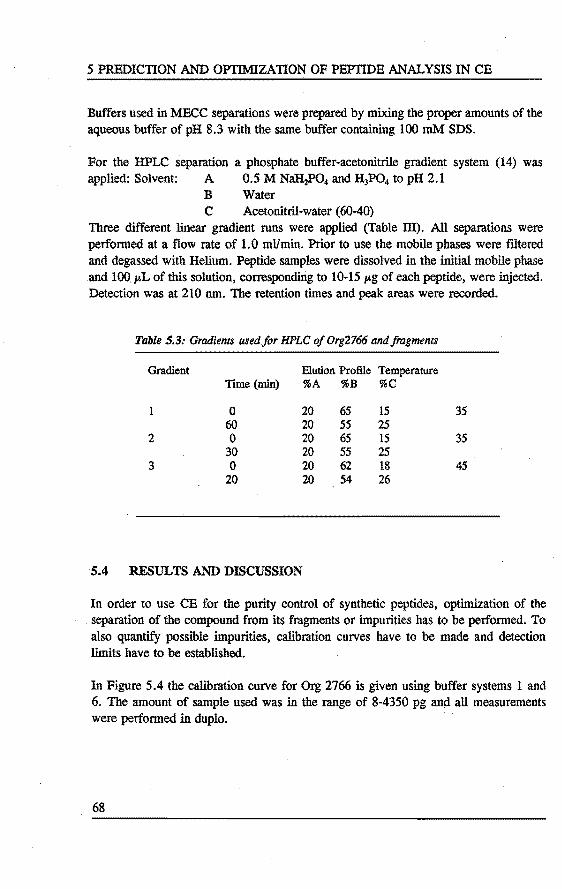
5 PREDICTION AND OPTIMIZATION OF PEPTIDE ANAL YSIS IN CE
Buffers used in MECC separations were prepared by mixing the proper amounts of the aqueous buffer of pH 8.3 with the same buffer containing 100 mM SDS.
For the HPLC separation a phosphate buffer-acetonitrile gradient system (14) was applied: Solvent: A 0.5 M NaH2P04 and H3P04 to pH 2.1
B Water C Acetonitril-water (60-40)
Three different linear gradient runs were applied (Table lll). All separations were performed at a flow rate of 1.0 mllmin. Prior to use the mobile phases were flltered and degassed with Helium. Peptide samples were dissolved in the initia! mobile phase and 100 J.'L of this solution, cortesponding to 1()..15 1-'g of each peptide, were injected. Detection was at 210 nm. The retention times and peak areas were recorded.
Table .5.3: Gradients usedfor HPLC of Org2766 andfragments
Gradient Blution Profile Temperature Time (min) %A %B %C
0 20 65 15 35 60 20 55 25
2 0 20 65 15 35 30 20 55 25
3 0 20 62 18 45 20 20 54 26
5.4 RESULTS AND DISCUSSION
In order to use CE for the purity control of synthetic peptides, optimization of the separation of the compound from its fragments or impurities has to be performed. To also quantify possible impurities, calibration curves have to be made and detection limits have to be established.
In Figure 5.4 the calibration curve for Org 2766 is given using buffer systems 1 and 6. The amount of sample used was in the range of 8-4350 pg and all measurements were performed in duplo.
68
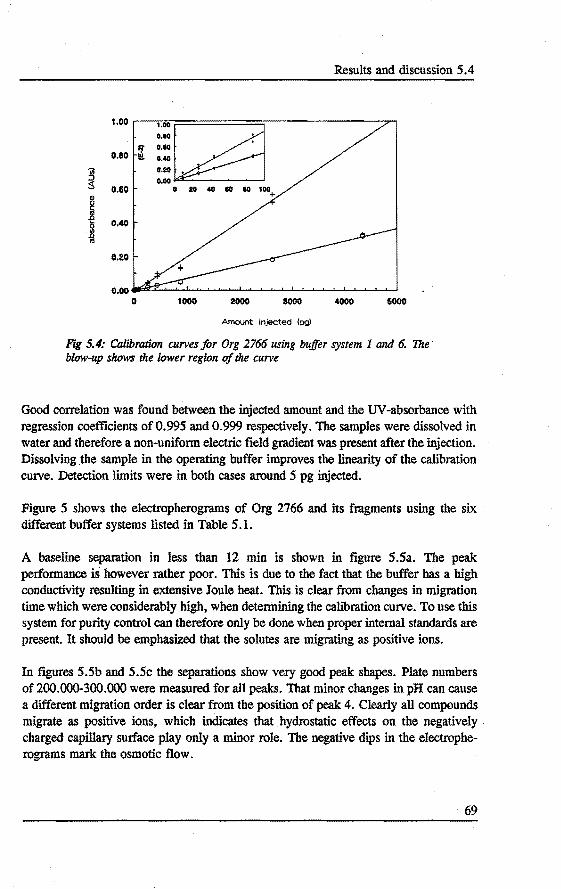
Results and discussion 5.4
1.00
·~~ 0.110 •
~ o.eo •
0.80 o.eo
~ :::· ~ 0.60 0 20 40 eo eo 100+
I OAO
0.20
o.oo _ru::.. .......... --L...-........._._...._.._,_..__.__,_.......__._.........._......_.._._...._.'--'
0 1000 2000 8000 4000 5000
Amount injected (pg)
Fig 5.4: Calwration curvesjor Org 2766 using buffer system 1 and 6. 1he · blow-up shows the lower region of the curve
Good correlation was found between the injected amount and tbe UV -absorbance witb regression coefficients of0.99S and 0.999 respectively. Tbe samples were dissolved in water and therefore a non-uniform electric field gradient was present after the injection. Dissolving .the sample in the operating buffer improves the Iinearity of the calibration curve. neteetion limits were in both cases around S pg injected.
Figure S shows the electropherograms of Org 2766 and its fragments using the six different buffer systems Iisted in Table 5.1.
A baseline separation in less than 12 min is sbown in figure S.Sa. The peak performance is however rather poor. This is due tothefact that the buffer bas a high conductivity resulting in extensive Joule heat. This is clear from changes in migration time whicb were considerably high, when detennining the calibration curve. To use this system for purity control can therefore only be done wben proper intemal standards are present. It should be emphasized that the solutes are migrating as positive ions.
In figures 5.Sb and 5.5c the separations show very good peak shapes. Plate numbers of 200.000-300.000 were measured for all peaks. Tbat minor changes in pH can cause a different migration order is clear from the position of peak 4. Clearly all compounds migrate as positive ions, which indicates that . hydrostatic effects on tbe negatively charged capillary surface play only a minor role. Tbe negative dips in the electropherograms mark the osmotic flow.
69
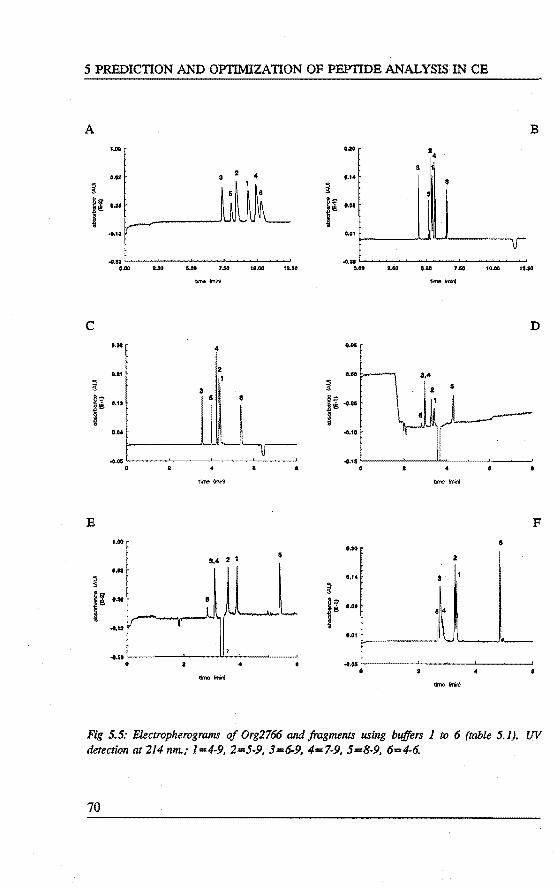
5 PREDICTION AND OPTIMIZATION OF PEPTIDE ANALYSISIN CE
A B 1.00 .... 2
4
s 0.(12 s 2 4 .....
u ~
~ !
~~ o . .tf i[ .... ... t 0.01
..... ..o.so .... .... .... .... ..... ,._ .. .... .... .... 1.110 ..... 12.10
.......... --c D
uo 4 .....
.... 2 3,4
~ 3 ~ l[ 5 e r400 O.t3
J,-!!.
.... ..... ..... ... ..
• 0 2
time ...... --E F
.... & 0.00
3,4 2 1 2 .... ~
o.t• a i
~~ .... 8
~~ .l .... ., 4
"" ~......",..
..... v •• 0.01 '-
~.$0
• .. .. ... 0 -- tilrefmin}
Fig 5.5: Electropherograms of Org2766 and jragments using buffers 1 to 6 (table 5.1). UV detection at 214 nm.; 1=4-9, 2=5·9, 3=6-9, 4=7-9, 5=8-9, 6=4-6.
70

Results and discussion 5. 4
Figure 5.5d and 5.5e show the influence of highly UV absorbing buffers. A clear negative peak marks the osmotic flow and the peak heights are considerably smaller. Detection limits in these systems are therefore higher than in the other systems. Mark that at this moderate pH, part of the compounds is positively charged and part negatively. Both electropherograms show a triplet of small negative dips, which was present in every analysis. Considering the migration time it can be that we are dealing with smáll metalions, detected through exclusion of the positive UV-absorbing buffer ions.
When we oompare the observed migration order of the compounds in the different systems with the calculated migration order presented in figure 5.3, we can conetude that the migration order can be predicted exactly. Also a group of three peaks as in figure 5f are found in the predicted migration·behaviour.
4
2 " .L • ~
i 0
I s
·2
·4 -4 ·2 0 2
Fig 5. 6: Comparison of calculated and measured mobüity
A correction factor should however be used to obtain the same absolute values. When we plot tbe corrected calculated mobility * 1 o-z versus the measured mobility * 1 0"8 we obtain figure 5.6. A good correlation was found although six different buffers systems were used. Comparing data obtained within one system we find even better correlation with regression coefficient around 0.98.
Figure 5. 7 shows Org 2766 in buffer system 6. No significant impurities can be observed. We have to keep in mind bowever, that compounds 4-9 and 5-9 elute very closely in this system. A large sutplus of 4-9 as <:ompared to 5-9 can easily mask its presence. Checking however in system 1, where these two components do not elute very closely did not show any extra peak.
71
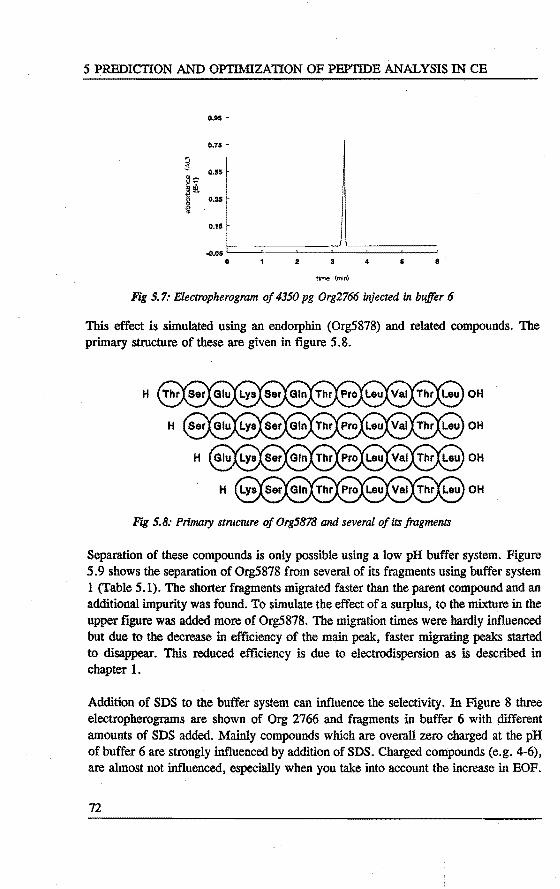
5 PREDICTION AND OPTIMIZATION OF PEPTIDE ANALYSIS IN CE
0.9$
0.75
5 $
0.55
~:::-.siS
i 0.35
0.15
.0.05 0 2 4 6
time lmm)
Fig 5. 7: Electropherogram of 4350 pg Org2766 injected in buffer 6
This effect is simulated using an endotphln (Org5878) and related compounds. The primary structure of these are given in figure 5.8.
H OH
OH
OH
OH
Fig 5. 8: Primu.ry stmcture of Org5878 and several of lts jragments
Separation of these compounds is only possible using a low pH buffer system. Figure 5.9 shows the separation of Org5878 from several of its fragments using buffer system 1 (Table 5.1). The shorter fragments migrated faster than the parent compound and an additional impurity was found. To simulate the effect of a sutplus, to the mixture in the upper figure was added more of Org5878. The migration times were hardly influenced but due to the decrease in efficiency of the main peak, faster migrating peaks started to disappear. This reduced efficiency is due to electrodispersion as is described in chapter 1.
Addition of SDS to the buffer system can influence the selectivity. In Figure 8 three electropherograms are shown of Org 2766 and fragments in buffer 6 with different amounts of SDS added. Mainly compounds which are overall zero charged at the pH of buffer 6 are strongly influenced by actdition of SDS. Charged compounds (e.g. 4-6), are almost not influenced, especially when you take into account the increase in EOF.
72

Results and discussion 5 .4
0.11
A 2
S" ~
0.10
!l-a ;'i; 4 ... -
LL I OM
o.oo e I 10 12 14 18
llme(mln)
0.11
B 2
i 0.10
!l-~~ fl 5 t 0.05
Q.OO 8 8 10 12 14 18
time (mln)
0.15
c 4
i 0.10
~~ i 0.05 5
0.00
• 8 10 12 14 18
Ume (mln)
Fi.g 5.9: Effect of addition of a surplus of the major compound as compared to i.ts fragments
73

5 PREDICTION AND OPTIMIZATION OF PEPTIDE ANALYSIS IN CE
10
A e
~ T
8 1
~ 3 .1l
a
i 4
2 i" s 1 ~ 0
0 10 15
time (min)
10
B e 3
12
~ T
I
I I
4
a 2 4
0 0 11 10 15
time {min)
10
c I
8 e
~ 7
e 3
I 5
4 2 ij a
s 4
! 0
0 5 10 15
time (min)
Fig 5.10: Electropherograms oj0rg2766 andfragments separated using buffer 6 with 0, 20 and 70 mM SDS added
74
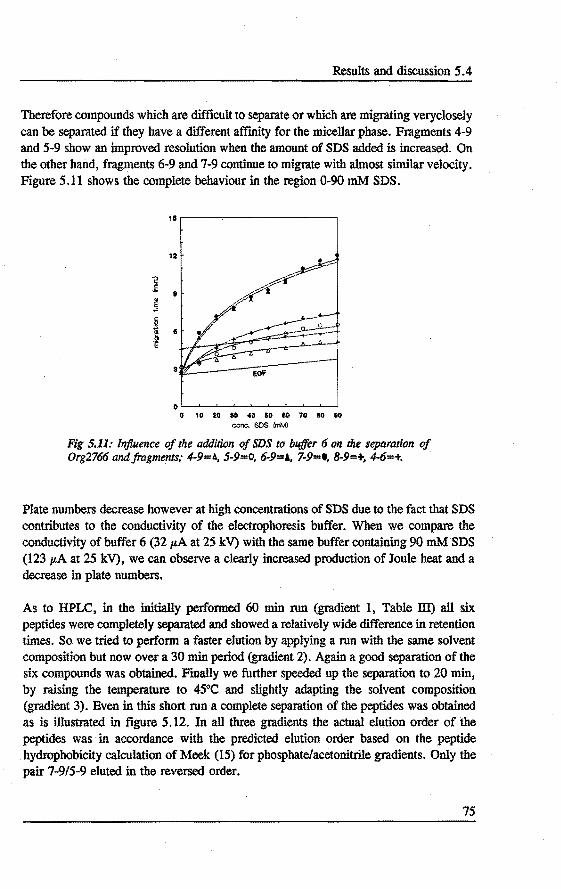
Results and discussion 5.4
Therefore compounds which are difficult to separate or which are migrating veryclosely can be separated if they have a different affmity for the micellar phase. Fragments 4-9 and 5-9 show an improved resolution when the amount of SDS added is increased. On the other ha.ild, fragments 6-9 and 7-9 continue to migrate with almost similar velocity. Figure 5.11 shows the complete behaviour in the region 0-90 mM SDS.
12
o~~~~~~~~~~
o 10 ao so 40 so ao 70 ao eo conc. SOS fmMl
Fig 5.11: lnjluence of the addition of SDS to buffer 6 on the separation of Org2766 and fragments,- 4-9=A, 5-9=0, fi-9=1, 7-9=1, 8-9=+, 4-6=+.
Plate numbers decrease however at high concentrations of SDS due to the fact that SDS contributes to the conductivity of the electrophoresis buffer. When we oompare the conductivity of buffer 6 (32 p.A at 25 kV) with the same buffer containing 90 mM SDS (123 p.A at 25 kV), we can abserve a clearly increased production of Joule heat and a decrease in plate numbers.
As to HPLC, in the initially performed 60 min run (gradient 1, Table lli) all six peptides were completely separated and showed a relatively wide difference in retention times. So we tried to perform a faster elution by applying a run with the same solvent composition but now over a 30 min period (gradient 2}. Again a good separation of the six compounds was obtained. Finally we fluther speeded up the separation to. 20 min, by raising the temperature to 45°C and slightly adapting the solvent composition (gradient 3). Even in this short run a complete separation of the peptides was obtained as is illustrated in tigure 5 .12. In all three gradients the actual elution order of the peptides was ·in accordance with the predicted elution order based on the peptide hydrophobicity calculation of Meek (15) for phosphate!acetonitrile gradients. Only the pair 7-9/5-9 eluted in tbe reversed order.
75

5 PREDICTION AND OPTIMIZATION OF PEPTIDE ANALYSIS IN CE
j a: E
5BB
480
390
~ 5 ~ ~ 200
tee
e \ '-- A l """---
2 .. s 8 10 12 14 IS 19 TltH (mln )
Fig 5.12: HPLC elution pattem of Org 2766 and fragments. 1: 4-9, 2: 5-9, 3: 6-9, 4: 7-9, 5: 8-9, 6: 4-6.
As is expected no correlation was found between the CZE analysis in the aqueous buffer systems and HPLC. This indicates tbat both methods can be used to complement eachother. For tbe given set of peptides, HPLC showed to have superior resolution. In case separation of compound 2 and 4 would be critica! CE would do a better job.
Using a two phase system in both MECC and HPLC, puts the question if these two methods can give comparable results. In reversed HPLC we have a moving polar mobile phase and an apolar stationary phase, while in MECC the "stationary phase" is also apolar but migrating. Comparison using these data however was difficult since the pH was different in both experiments and therefore the interaction.
5.5 LASER INDUCED FLUORESCENCE OF A PROTEIN DIGEST
The use of capillary electrophoresis for tryptic mapping bas been shown to be a complementary technique to liquid chromatography [10,16-18]. Most commonly used detection metbod is UV absorbance in the low UV region (190-214). CE bas bowever the disadvantage of pathlength as compared. to chromatography. Indirect fluorescence detection can enhance the sensitivity without the need of derivatization of the peptides [19]. For direct fluorescence the peptide mixture has to be derivatized. Since multiple sites are usually available, this can cause multiple peaks from a single component. 3-(4-
76

Laser induced fluorescence peptide mapping 5.5
Carboxybenzoyl)-2-quinolinecarboxaldehyde (CBQCA) was shown to react only with primary amines [20,21] and can therefore be succesfully used for derivatization of tryptic digests.
A tryptic digest of 6-lactoglubulin was kindly provided by W .J. Henzet (Genetech Inc., South San Francisco, CA, USA). The compound was tagged with CBQCA according the procedure listed in table 4.4. Figure 5.13 shows tbe separation of the tryptic digest and a blank run were tbe sample labeling was performed identical on a sample of pure water.
A
B
7
8
I : 2
tlmo(mln)
7
I : 3 5
Umo (mln)
Fig 5.13: Separation of CBQCA derivatiud tryptic digest of 6 lactoglobulin A; A: lf16M, 7 fowl injected,· B: blank,· bujjèr: JO mM phosphatelborate pH 9.5, Cap: 40147 cm, 75 1-'m i.d.; 532 V/cm, jluorescence ex: 488 nm, em: 560 nm.
As can be seen a very low backgound shows up indicating that all peak:s in tbe upper sections belong to labeled peptide compounds. A large number of the peaks bowever migrate very closely. This is due to the high BOF driving all species fast through the column, allowing little time for separation.
77

5 PREDICTION AND OPTIMIZATION OF PEPTIDE ANALYSIS IN CE
A
B
0.20
1 0.10
o.oo 0 2 4 • 8 10
llm•(mln)
0.20
I 0.10
lltnt(mln)
Fig 5.14: Reproducibility of a high resolution separation of CBQCA derivatized tryptic digest of 8 lactoglobulin A,- Sample: 10'7M, 700 amol injected,· buffer: JO mMphosphate!borate pH 9.5 + 0.1 mM diamino propane, Cap: 40147 cm, 75 ~m l.d.,- 532 V/cm, jluorescence ex: 488 nm, em: 560 nm.
Figure 5.14 shows the effect of the addition of a small amount of diamino propane to the buffer. The diamine attaches to the surface using the interaction between the positivel cbarged amines and the negative silanols, reducing the surface charge. Reduction of the BOF opens up the separation, due to the lower nett velocity of the compounds through the tube. Reproducibility ofthis procedure is shown in figure 5.14, were from four consequtive runs the ftrst and the last are shown. Variation of the amount of diamine could be used to select the osmotic velocity. When applying this compound to other buffer types one should reoptimize the concentration, since the amine competes with the other buffer molecules for sites in the double layer. In pure phosphate buffers for instance, the concentration had to be more than 10 times higher to obtain the same effect.
78

Conclusions 5.6
5.6 CONCLUSIONS
Small peptides are suitable for analysis with capillary electrophoretic methods. The mobility of these compounds can be predicted quite well using the pKa valnes of the separate amino acids. Both elution order and migration time were close to tbe predicted values.
Choice of buffer systems can therefore be made based on calculations, althougb some parameters have to be taken into account. The buffer components sbould preferably have a high buffering capacity in the given pH region and have a Iow conductivity. In this respect fairly high concentraled buffers can be used without probieros of Joule heating. A little UV absorbance of the buffer is recommended because it makes detennination of the BOF possible without actdition of a marker. This BOF dip can be used to check the reproducibility of the system and can be used as intemal standard for correction of migration times.
To identify fragments in purity control of peptides the migration behaviour of standards should be known. If not, one should use several systems to minimize possible overlapping of compounds. Por fairly apolar species the addition of SDS can cause extra selectivity which can be used to improve critical separations.
The different separation mechanism of CE, both CZE (based on chargelmass ratio) and MECC (based on the affmity for the micellar phase) as ooropared to HPLC (mainly based on bydrophobicity), will result in complementary infonnation. Therefore both techniques are most valuable in peptide analysis [22}.
The use of laser induced fluorescence can greatly enhance detectability of peptides. Care however bas to be taken not to obtain multiple tagged components since it can result in multiple peakes from a single component. Due to the fact that fluorescence occurs ussually at high pH, limitation in buffer choice can be a problem. Mod.ifying the BOF however can be a way to open up separation. It is clear that prediction of mobility after tagging is very difficult [23].
REFERENCES
l. D. de Wied and J. Jolles, Physiol. Revs., 62 (1982) 976-1059. 2. W.H. Gispen, P. de Koning, R.R.F. Kuiters, C.E.E.M. van der Zee and J. Verhaagen,
Progr. Bram Res., 72 (1987) 319. 3. R. Oerritsen van der Hoop, C.J. Vecht, M.E.L. van der Burg, A. Elderson, W.
Boogerd, J.J. Heimans, E.P. Vries, J.C. van Houwelingen, F.G.I. Jennekens, W.H. Gispen and J.P. Neijt, The New England Joumal ofMedicine, 322 (1990) 89-94.
79
5 PREDICTION AND OPTIMIZATION OF PEPTIDE ANALYSIS IN CE
4. F.E.P. Mikkers, F.M. Everaerts and Th.P.E.M. Verheggen, J. Chromatogr. 169 (1979) ll-20.
5. J.W. Jorgenson and.K.D. Lukacs, Anal. Chem. 53 (1981) 1298-1302. 6. R.M. McCormick, Anal. Chem. 60 (1988) 2322-2328. 7. H. Ludi, E. Gassmann, H. Grossenbergerand W. Marki, Anal. Chim. Acta, 213 (1988)
215-219. 8. P.D. Grossman, KJ. Wilson, G. Pettie and H.H. Lauer, Anal. Biochem. 173 (1988)
265-270. 9. J. Frenz, S.L. Wu and W.S. Hancock, J. Chromatogr. 480 (1989) 379-391. lO. R.G. Nielsen, R.M. Riggin and E.C. Rickard, J. Chromatogr. 480 (1989) 393-401. 11. P.D. Grossman, J.C. Colbum, H.H. Lauer, R.G. Nielsen, R.M. Nielsen, R.M. Riggin,
G.S. Sittampalam and E.C. Rickard, Anal. Chem. 61 (1989) ll86-:1194. 12. S. Terabe, K. Otsuka, K. Ichikawa, A. Tsuchiya and T. Ando, Anal. Chem. 56 (1984)
113-116. 13. R.M.C. Dawson, D.C. Elliot and K.M. Jones, Data for Biochemica! Research, Oxford
University Press, Oxfurd,l974. 14. P.S.L. Janssen, J.W. van Nispen, M.J.M. van Zeeland and P.A.T.A. Melgers, J.
Chromatogr., 470 (1989) 171-183. 15. J.L. Meek and Z.L. Rosetti, J. Chromatogr. 211 (1981) 15-28. 16. K.A. Cobb and M. Novotny, Anal. Chem. 61 (1989) 2226-2231. 17. G.L. Hortin, T. Griestand B.M. benutto, BioChromatogr. 5 (1990) 118-120. 18. M.M. Busbey and 1.W. Jorgenson, 1. Microcolumn Sep. 2 (1990) 293-299. 19. L. Gross and E.S. Yeung, Anal. Chem. 62 (1990) 427-431. 20 1. Liu, Y.Z. Hsieh, D. Wiesier and M. Novotny, Anal. Chem. 63 (1991) 408-412. 21 J. Liu, K.A. Cobb and M. Novotny, J. Chromatogr. 519 (1990) 189-197. 22. A.A.A.M. van de Goor, P.S.L. Janssen, J.W. van Nispen, M.J. van Zeeland and P.M.
Everaerts, J. Chromatogr. 545 (1991) 379-389. 23. A.A.A.M. van de Goor, B.l. Wanders and W.I. Henzel, Beekman TI/DS-824, 1992.
80
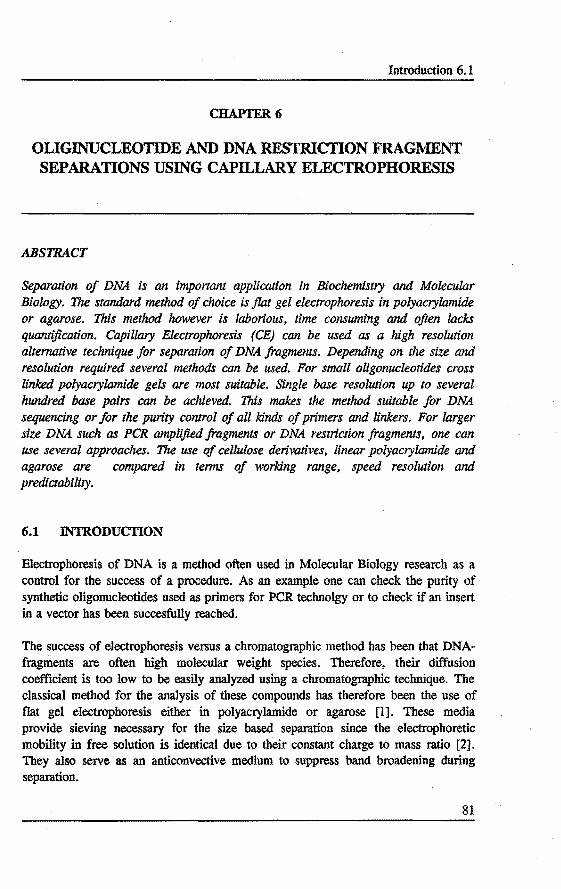
Introduetion 6.1
CHAPTER6
OLIGJNUCLEOTIDE AND DNA RESTRICTION FRAGMENT SEPARATIONS USING CAPILLARY ELECTROPHORESIS
ABSTRACT
Separation of DNA is an important application in Biochemistry and Molecular Biology. The stanào.rd methad of choice is flat gel electrophoresis in polyacrylamide or agarose. This methad however is laborious, time consuming and often lacks quantijlcation. Capillary Electrophoresis (CE) can be used as a high resolution alternative technique for separation of DNA jragments. Depending on the size and resolution required several methods can be used. For small oligonucleotides cross linked polyacrylamide gels are most suitable. Single base resolution up to several hunàred base pairs can be achieved. This makes the methad suitable for DNA sequencing or for the purity control of all lànds of primers and linkers. For larger size DNA such as PCR amplijled jragments or DNA restrietion jragments, one can use several approaches. The use of cellulose derivatives, linear polyacrylamide and agarose are compared in tenns of worlàng range, speed resolution and predictability.
6.1 INTRODUCTION
Blectrophoresis of DNA is a metbod often used in Molecular Biology research as a control for tbe success of a procedure. As an example one can check the purity of synthetic oligonucleotides used as primers for PCR technolgy or to check if an insert in a vector has been succesfully reached.
The success of electrophoresis versus a chromatographic metbod bas been tbat DNAfragments are often high molecular weight species. Therefore, their diffusion coefficient is too low to be easily analyzed using a chromatographic technique. The classical metbod for the analysis of these compounds bas therefore been tbe use of flat gel electrophoresis either in polyacrylamide or agarose [1]. These media provide sieving necessary for the size based separation since the electrophoretic mobility in free solution is identical due to their constant charge to mass ratio [2]. They also serve as an anticonvective medium to suppress band broadening during separation.
81
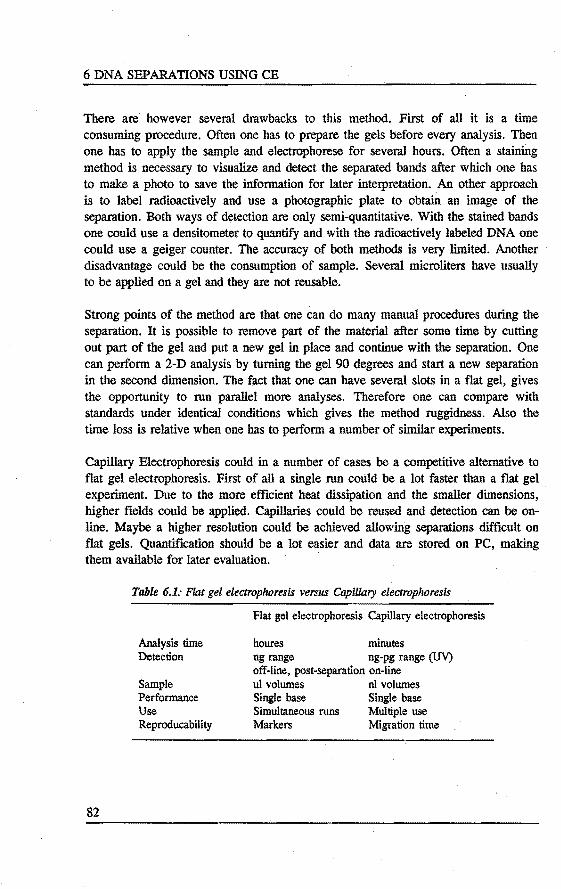
6 DNA SEPARATIONS USING CE
There are however several drawbacks to this method. First of all it is a time consuming procedure. Often one bas to prepare the gels before every analysis. Then one bas to apply the sample and electrophorese for several hours. Often a staining metbod is necessary to visualize and detect the separated bands after which one has to make a photo to save the information for later interpretation. An other approach is to label radioactively and use a photographic plate to obtain an image of the separation. Both ways of detection are only semi-quantitative. With the stained bands one could use a densitometer to quantify and with the radioactively labeled DNA one could use a geiger counter. The accuracy of both methods is very limited. Another disadvantage could be the consumption of sample. Several microliters have usually to be applied on a gel and they are not reusable.
Strong points of the metbod are that one can do many manual procedures during the separation. It is possible to remove part of the material after some time by cutting out part of the gel and put a new gel in place and continue with the separation. One can perform a 2-D analysis by tuming the gel 90 degrees and start a new separation in the second dimension. The (act that one can have several slots in a flat gel, gives the opportunity to run parallel more analyses. Therefore one can oompare with standards under identical conditions which gives tbe metbod ruggidness. Also the time loss is relative when one bas to perform a number of similar experiments.
Capillary Electrophoresis could in a number of cases be a competitive alteroative to flat gel electrophoresis. First of all a single run could be a lot faster than a flat gel experiment. Due to the more efficient heat dissipation and tbe smaller dimensions, higher fields could be applied. Capillaries could be reused and detection can be online. Maybe a higher resolution could be achieved allowing separations difficult on flat gels. Quantification should be a lot easier and data are stored on PC, making them available for later evaluation.
82
Table 6.1: Flat gel electrophoresis versus CapUlary electrophoresis
Analysis time Detection
Sample Performance U se Reproducability
Flat gel electrophoresis Capillary electrophoresis
houres minutes ng range ng-pg range (UV) off-Iine, post-separatien on-line ul volumes nl volumes Single base Single base Simultaneous runs Multiple use Markers Migration time

Introduetion 6.1
In CE gels are in principle not necessary since tbe capillary acts anticonvective but a sieving medium is still necessary to obtain separation altbougb tbe use of micelles have also been shown [3].
In tbis chapter a number of sieving media are investigated to separate DNA using CE. Por oligonucleotide separations, tbe use of crosslinked. polyacrylamide gels is described. Tbe small pore size of this gel makes it suitable for high resolution of these compounds. Por tbe analysis of larger size double stranded DNA, such as restrietion fragments, the use of linear polyacrylamide gels is studied and ooropared to agarose gels and the use of hydroxymethyl cellulose as an additive to the run buffer.Characteristics of these different sieving media are listed in table 6.2. Optimal working range for the systems are described as well as the manufacturing of the different types of capillaries.
Table 6.2: Comparison of different sieving media
Polymer
Hydroxypropylmethyl cellulose yes Acrylamide: Crosslinked no Acrylamide: Linear no Agarose yes
Gelling
no yes yes yes
Phase
viseaus liquid solid gel viseaus liquid solid <Tgel
A number of applications is discussed. Using the cross-linked gels purity control of primers and linkers can be done. Using the other systems, the qualitative and quantitative analysis of PCR amplified double stranded DNA is sbown.
6.2 THEORY OF MIGRATION OF DNA IN POLYMER NETWORKS
To describe the migration of DNA through a polymer network, two roodels are used. The Ogston model for relatively small molecules and the reptation model for larger size of DNA. Small and large in this case is however a function of the mesh size of the system. First both roodels will be treated and a relationsbip is derived for the migration mobility as a function of the number of base pairs in the DNA strand. Subsequently estimations of mesh size of the different used sieving media is described, giving an estimated comparison of the migration of different size ranges of DNA in the different media and providing an explanation for the choice of the samples to be run in the different sieving media in tbe results and discussion section in cbapter 6.4.
83

6 DNA SEPARATIONS USING CE
6.2.1 The Ogston model
The Ogston model [4,5], describes the polymer network as a molecular sieve, consisting of a random network of interconnected pores with an average pore size ~. At assumes the DNA to be an undeformable sphere with a radius Rg. According to the theory smaller molecules will migrate faster since they have a larger fraction of the pores available for their migration. The mobility of the DNA can be described as:
(6.1)
In this equation C is the concentration of the polymer and b is a constant depending on the units chosen for C. The equation can be rewritten as:
1 R +r m=m *exp[ --'lt(-1 -)2
0 4 ~ (6.2)
In this equation m is the mobility of the DNA in the network, mo is the mobility of the DNA in free solution, Rg is the gyration radius, the radius of the DNA sphere and r is the radius of the mesh forming polymer. Since the Ogston theory does not take into account the change of the sphere radius at increased field strength, data will have to be extrapolated to E=O V/cm. The term b * (Rg + r)2 is called the retardation coefficient. Given that the gyration radius can be related to the number of base pairs by:
R =aN°·6 g
(6.3)
it can be concluded that a plot of mobility versus log basepair number should give a straight line.
6.2.1 The reptation model
When the gyration radius is much larger than average pore size ~, the assumption of the undeformed partiele breaks down. In the reptation model the molecule is represented by a snake moving through · the network, head first. The network is assumed to consist of tubes. At low field strength, the migrating DNA can still be considered an unperturbed random coil and the reptation theory of De Gennes [6] can be used descrihing the relation between mobility and DNA size by [7]:
84

Tbeory of migartion of DNA through a polymer network 6.2
1 m---NDNA
(6.4)
where NDNA is the number of base pairs in the DNA fragment. In the regime of reptation a plot of mobility versus log basepairs should result in a straight line.
In case of high field strength the DNA coil will be defonned and the biased reptation model or reptation with stretch will occur [8]. Tbe mobility will fuclude a term for the electric field given by:
Q 1 E21
m=-(--+-) 3/ NDNA 3
(6.5)
In this equation Q is· the charge on the DNA, f is a friction coefficient and E' is a dimensionless electric field given by:
E'= ~qE 2kT
(6.6)
where q is the effective charge of the DNA actually present in the pore, k is tbe Boltzmann constant, B the actual electric field and T the absolute temperature .. This equation is only valid when B' is smaller than 1. It shows tbat when N or E' become large, m beoomes independent of N.
It bas been described that the DNA when it beoomes defonned can come in the situation that both ends of the strand migrate in a different tube of the polymer network. In this way the molecule can beoome trapped in the gel for a certain period of time. Since this trapp~g is a function of fragment length it can occur that DNA of a certain length migrates slower than both shorter and longer DNA. Tbe number of basepairs of this minimum migration bas been described as:
14 N.=mm E'
(6.7)
Plotting log mobility versus log basepair number would in general show like given in tigure 6.1. Tbe numbers on the x-axis are cbosen arbitrary, while the mobility on the y·axis is the mobility in tbe DNA over the mobUty in free solution.
85
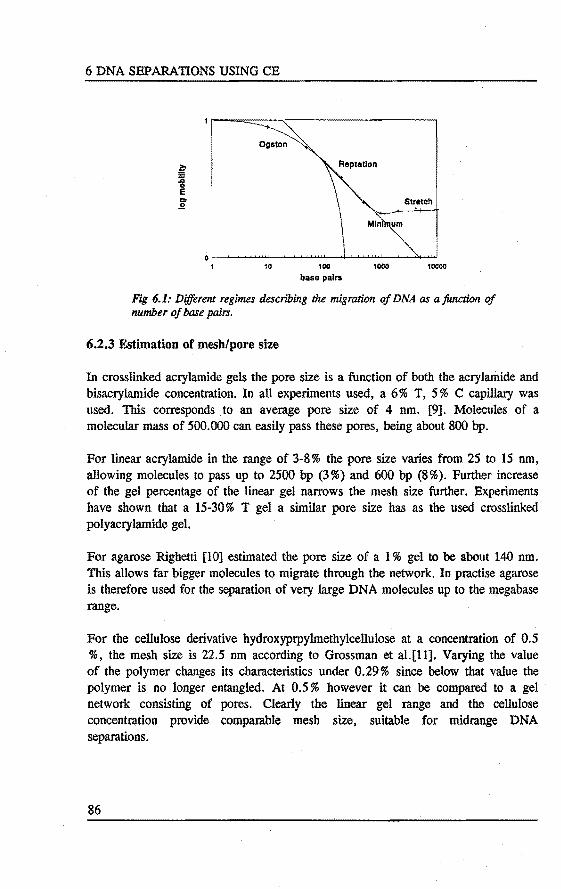
6 DNA SEPARATIONS USING CE
10 100
base pairs 1000 10000
Fig 6.1: Different regimes descrihing the migration of DNA as a fimction of number of base pairs.
6.2.3 Fstimation of mesb/pore size
In crosslinked acrylamide gels the pore size is a function of both the acrylamide and bisacrylamide concentration. In all experiments used, a 6% T, 5 % C capillary was used. This corresponds to an average pore size of 4 run. [9]. Molecules of a molecular mass of 500.000 can easily pass these pores, being about 800 bp.
For linear acrylamide in the range of 3-8% the pore size varles from 25 to 15 run, allowing molecules to pass up to 2500 bp (3%) and 600 bp (8%). Further increase of the gel percentage of the linear gel narrows the mesh size further. Experiments have shown that a 15-30% T gel a similar pore size has as the used crosslinked polyacrylamide gel.
For agarose Righetti [10] estimated the pore size of a 1% gel to be about 140 nm. This allows far bigger molecules to migrate through the network. In practise agarose is therefore used for the separation of very large DNA molecules up to the megabase range.
For the cellulose derivative hydroxyprpylmethylcellulose at a concentration of 0.5 %, the mesh size is 22.5 run according to Grossman et al.[ll]. Varying the value of the polymer changes its characteristics under 0.29% since below that value the polymer is no longer entangled. At 0.5% however it can be compared to a gel network consisting of pores. Clearly the linear gel range and the cellulose concentration provide comparable mesh size, suitable for midrange DNA separations.
86

Separation of oligonucleotides using cross-linked PAGE capillaries 6.3
6.3 SEPARATION. OF OLIGONUCLEOTIDES USING CROSSLINKED POLYACRYLAMIDE FILLED CAPU.LARIES
6.3.1 Introduetion
Oligonucleotides are relative small single stranded DNA molecules having up to 500 base pairs. The can be synthesized using a DNA synthesizer and are therefore a usefull tooi for all kinds of molecular biology experiments. When DNA sequencing is performed, a technique to determine the base composition and order of DNA strands, the DNA is also broken into oligonucleotides having different length and different end molecules. The analysis of oligonucleotides is therefore important and single base resolution in the separation is required.
Since oligonucleotides are so small a dense polymer network is required to separate them based on size. Using slab gels cross-linked polyacrylamide is mostly applied. In capillaries gels can also be polymerized by fill.ing the tube with the polymer solution and allowing the polymerization to take place inside the tube [12); A problem however is that the gel shrinks during this reaction, leaving space between the wall and the sieving medium. When an electtic field is applied, nothing holcts the gel inside the tube and electroosmosis will extrude it from the capillary.
In this section a metbod is described to covalently bind the gel to the capillary wall and to prevent shrinkage which can be the cause of bubble formation [13}. The capillary are tested on their ability to provide fast single base resolution separation of small oligonucleotides and to apply them to applications from tbe molecular biology field.
6.3.2 Experimental
Cross-linked polyacrylamide gel filled capillaries were prepared in tbe following manner. 3.5 m capillary (100 /Lm i.d.) was locally stripped from its palyimide coating, giving 5 detection windows for 5 different tubes. The stripped section was protected from breakage using teflon sleeves. Subsequently the capillary was coated with a layer of linear polyacrylamide as is described in table 6.3. The reasou for this surface treatment is to reduce surface charge causing BOF and to provide a chemica! surface which can be used in the polymerization reaction.
3-methacryloxypropyltrimethoxysilane is a bifunctional reagent which can react with silanol groups at the silica surface and with acrylamide to obtain a covalently bound monolayer.
87
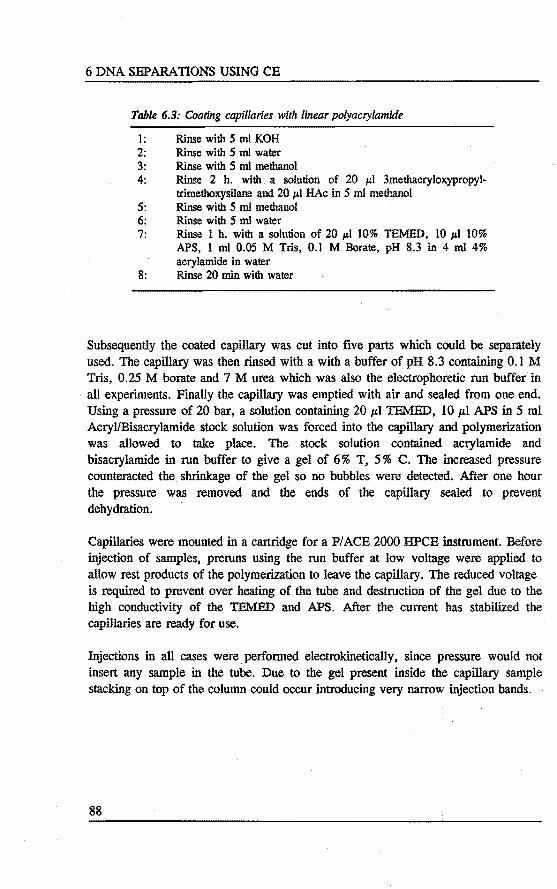
6 DNA SEPARATIONS USING CE
Table 6.3: Coating capillaries with linear polyacrylamide
1: Rinse with 5 mi KOH 2: Rinse with 5 mi water 3: Rinse with 5 mi methanol 4: Rinse 2 h. with a solution of 20 1'1 3methacryloxypropyl-
trimethoxysilane and 20 1'1 HAc in 5 mi methanol 5: Rinse with 5 mi methanol 6: Rinse with 5 mi water 7: Rinse 1 h. with a solution of 20 !'l 10% TEMED, 10 1'1 lO%
APS, 1 mi 0.05 M Tris, 0.1 M Borate, pH 8.3 in 4 mi 4% acrylamide in water
8: Rinse 20 min with water
Subsequently the coated capillary was cut into five parts which could be separately used. The capillary was then ri.nsed with a with a buffer of pH 8.3 containing 0.1 M Tris, 0.25 M borate and 7 M urea which was also the electrophoretic run buffer in all experiments. Finally tbe capillary was emptied with air and sealed from one end. Using a pressure of 20 bar, a solution containing 20 JÛ TEMED, 10 1'1 APS in 5 ml Acryl/Bisacrylamide stock solution was forced into the capillary and polymerization was allowed to take place. The stock solution contained acrylamide and bisacrylamide in run buffer to give a gel of 6% T, 5% C. The increased pressure counteracted the. shrinkage of the gel so no bubbles were detected. After one hour the pressure was removed and tbe ends of the capillary sealed to prevent dehydration.
Capillaries were mounted in a cartridge for a P/ ACE 2000 HPCE instrument. Before injection of samples, preruns using the run buffer at low voltage were applied to allow rest products of tbe polymerization to leave the capillary. The reduced voltage is required to prevent over heating of the tube and destruction of tbe gel due to tbe high conductivity of tbe TEMED and APS. After the current bas stabilized the capillaries are ready for use.
lnjections in all cases were performed electrokinetically, since pressure would not insert any sample in the tube. Due to the gel present inside the capillary sample stacking on top of the column could occur introducing very narrow injection bands.
88
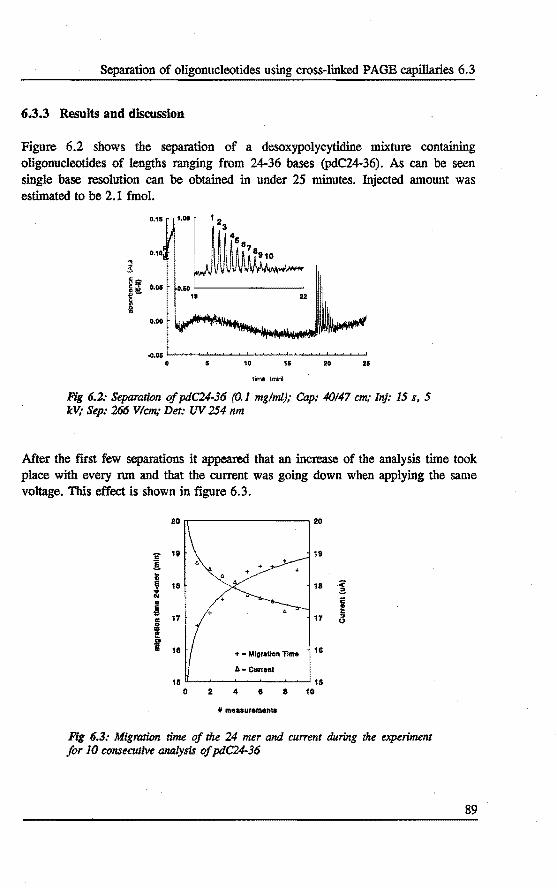
Separation of oligonucleotides using cross-linked PAGE capillarles 6.3
6.3.3 Results and discussion
Figure 6.2 shows the separation of a desoxypolycytidine mixture containing oligonucleotides of lengtbs ranging from 24-36 bases (pdC24-36). As can be seen single base resolution can be obtained in under 25 minutes. Injected amount was estimated to be 2.1 fmol.
0.15 1.00 12 3
! ~45 ~
~~ u ~ •0.08
0 10 15 20 25
tit'ne (mjn)
Fig 6.2: Separation ofpdC24-36 (0.1 mg!ml),o Cap: 40/47 cm; lnj: 15 s, 5 kV; Sep: 266 V/cm,- Det: UV 254 nm
After the fust few separations it appeared that an increase of the analysis time took place with every run and that the current was going down when applying the same voltage. Tbis effect is shown in figure 6.3.
20 20
:5 18 18
.5. ~
< ' 18 18 :.; ~
• ë J ~
17 " c: 1.'1
I 18 + • Migration Time 16
ll. • Current
15 15 0 2 4 8 a 10
1t .... uurernenta
Fig 6.3: Migration time of the 24 mer and current during the experiment jor JO consecutive analysis ofpdC24-36
89
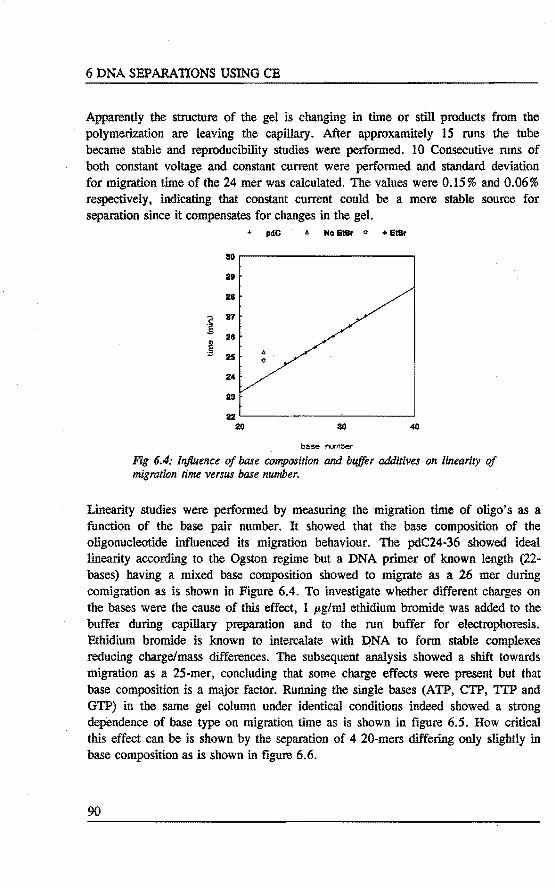
6 DNA SEPARATIONS USING CE
Apparently the structure of the gel is changing in time or still products from the polymerization are teaving the capillary. After approxamitely 15 runs the tube became stabie and reproducibility studies were performed. 10 Consecutive runs of both constant voltage and constant current were performed and standard deviation for migration time of the 24 merwas calculated. The valnes were 0.15% and 0.06% respectively, indicating that constant current could be a more stabie souree for separation since it compensates for changes in the gel.
+ pdO " No EtBr o + EtBr
30
29
28
~ 27
:s u ~ "" 25
.. 0
24
23
22 20 30 40
base nJmber
Fig 6.4: /njluence of base composition and buffer additives on linearity of migration time versus base number.
Linearity studies were performed by measuring the migration time of oligo's as a function of the base pair number. It showed that the base composition of the oligonucleotide influenced its migration behaviour. The pdC24-36 showed ideal linearity according to the Ogston regime but a DNA primer of known length (22· bases) having a mixed base composition showed to migrate as a 26 mer during comigration as is shown in Figure 6.4. To investigate whether different charges on the bases were the cause of this effect, 1 pg/ml ethidium bromide was added to the buffer during capillary preparation and to the run buffer for electrophoresis. Ethidium bromide is known to intercalate with DNA to form stabie complexes reducing chargelmass differences. The subsequent analysis showed a shift towards migration as a 25-mer, concluding that some charge effects were present but that base composition is a major factor. Running the single bases (ATP, CTP, TIP and GTP) in the same gel column under identical conditions indeed showed a strong dependenee of base type on migration time as is shown in figure 6.5. How critical this effect can be is shown by the separation of 4 20-mers differing only sligbtly in base composition as is sbown in figure 6.6.
90
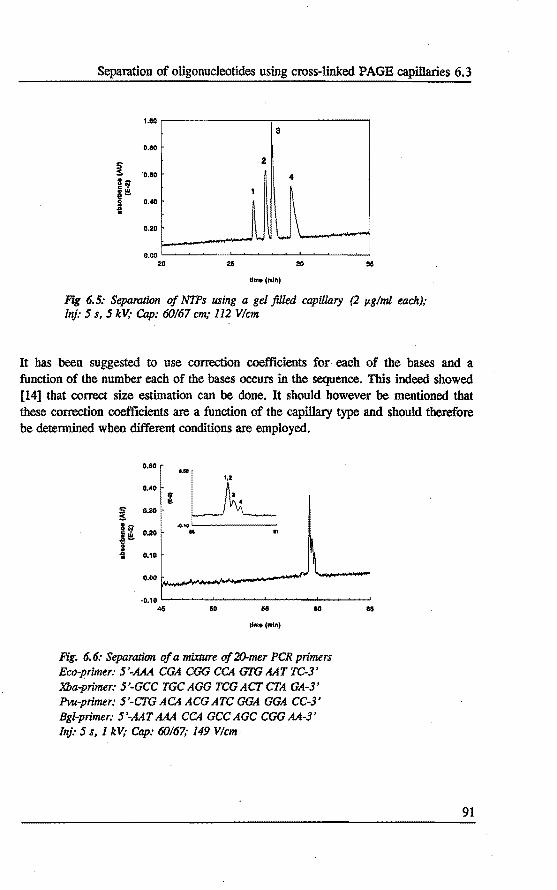
Separation of oligonucleotides using cross-linked PAGE capillaries 6.3
1.00 3
0.80
~ 2
0.60 4 ~Ijl ... -e-c 0.40
J i 0.20 ll
r-0.00
20 28 ao ss timo(mfn)
Fig 6.5: Separation of NTPs using a gelfitled capülary (2 p.g/ml each); lnj: 5 s, 5 kV; Cap: 60/67 cm,·112 V/cm
It bas been suggested to use correction coefficients for each of the bases and a function of the number each of the bases occurs in the sequence. 11ûs indeed. showed [14] that correct size estimation can be done. It should however be mentioned that these correction coefficients are a function of tbe capillary type and should therefore be detennined when different conditions are employed.
o.so
~~ 0.40 : 1,2a •
~ 0.30
~~ .....
0.20 .. .,
I 0.10
o.oo
·0.10 <41:1 60 68
-(mln)
Fig. 6.6: Separation of a mixture of 20-mer PCR primers Eco-prlmer: 5'-.MA. CGA CGG CCA GTG AAT TC-3' Xba-prlmer: 5'-GCC TGCAGG TCGACTCTA GA-3' Pvu-prlmer: 5'-CTG ACA ACG ATC GGA GGA CC-3' Bgl-prlmer: 5'-AAT AM CCA GCC AGC CGG AA-3' Inj: 5 s, I kV; Cap: 60/67,· 149 V/cm
91

6 DNA SBPARATIONS USING CE
Applications of the use of crossilinked polyacrylamide gel filled capillaries is the purity control of single stranded DNA. As an example a 28-mer PCR primer was analyzed using the described system. The primer was made using a DNA sequencer and old chemieals were used in the syntbesis. The result is shown ~ figure 6. 7.
0.50
0.45
MO 0.3/i
~ 0.30 ·-.,_ 0.25
~~ 0.20
0.15
0.10
0.05
0.00
..0.05 0 10 15 20 25
Ume(mln}
Fig 6.7: Purity control of a 20-mer PCR primer (.2.2 mglml),- In}: JO s, 5 kV,· Cap: 40147 cm; 266 V/cm
Clearly a number of impurities were found and only 61.1% of the peak area could be attributed to the main compound. Purity of primers is of main concern in a PCR experiment since in the subsequent amplification, contaminants can be amplified as well, when there sequence is similar.
Another applications involves the checking of a reaction such as a ligation. As an example a 10 mer polylinker was analyzed and the result shown in tigure 6.8. In this reaction a 10-mer single stranded oligonucleotide was polymerized to form 20, 30, 40 etc. mers to be used fora molecular weight marker. As can beseen from the separation not only multiples of 10 appeared but a number of otber compounds. It tumed out that the starting 1 0-mer sbowed already some impurity, resulting in a mixed polymerization.
Life time of the gel filled capillaries depended strongly on the sample involved. Using pdC24-36 dissolved in run buffer over 150 analyses could be performed on a single capillary, while after 3 runs of the polylinker the capillary was destroyed. In that case larger polymers could block the gel structure. Conductivity of the sample buffer tumed out to be also of major importance. When injecting from water, a field is present at the tip of the column, resulting in bubble formation at the end. Cutting of a section solved this problem. Also the use of lower fields ( < 300 V/cm) increased the life time of the column.
92

Separation of oligonucleotides using cross-linked PAGE capillaries 6.3
1.00
0.80
§: 0.80
jl o . ..o
(1.20
o.oo 0
10 20
I 10 15 20 21 80 311 oiO 4&
llmo (mlo}
Fig 6.8: Separation of a ligared EcoRI-linker: lnj: 20 s, 5 kV, Cap: 40147 cm: 319 V/cm
6.3.4 CONCLUSIONS
Cross-linked polyacrylamide gels can be polymerized in fused silica capillaries and covalently bound to the wall without bubble. fonnation. The capillaries can subsequently be used for the analysis of small oligonucleotides resulting in single base resolution. Preruns are however necessary to obtain stabie separation conditions and the use of constant current seems to be a bit more reproducible than constant voltage. In case of constant current however care bas to be taken that the voltage does not exceed the limits of the column.
Linearity studies of oligonucleotide base number and migration time showed a dependenee on both charge/mass and base composition. The addition of ethidium bromide to the run buffer could not solve this effect completely. To do accurate size determination calibration for the base composition is necessary but dependent on the system used.
The used capillaries can be succesfully applied to tbe purity control of . small oligonucleotides. The fact that a single sample bas to be analyzed enhances the advantage of short analysis time as compared to a flat gel analysis system. The fact that low samples volumes are needed (electrokinetic injection from the sample), opens the possibilty of easy checking before oligos are used.
93
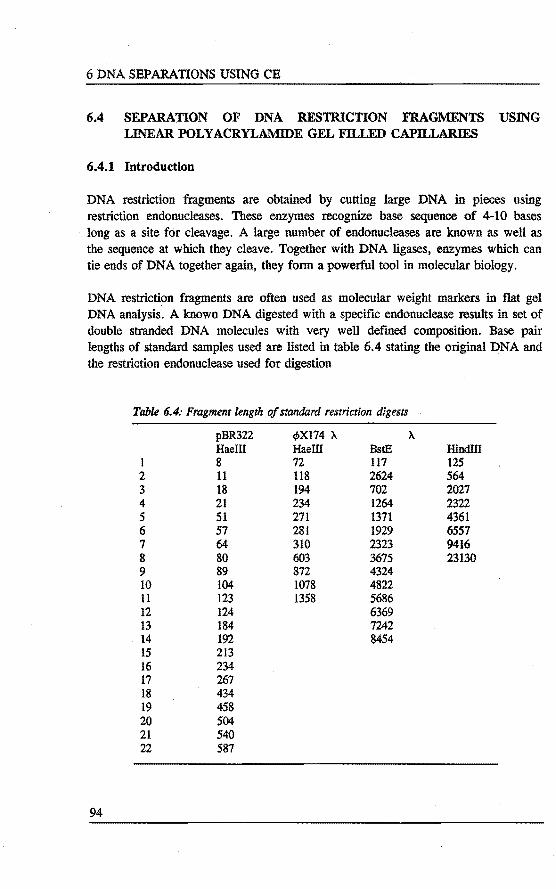
6 DNA SEPARATIONS USING CE
6.4 SEPARATION OF DNA RESTRICTION FRAGMENTS USING LINEAR POLYACRYLAMIDE GEL FILLED CAPILLARIES
6.4.1 Introduetion
DNA restrietion fragments are obtained by eutting large DNA in pieces using restrietion endonucleases. These enzymes recognize base sequenee of 4-10 bases long as a site for cleavage. A large number of endonucleases are known as well as the sequence at which they cleave. Together with DNA ligases, enzymes which can tie ends of DNA together again, they form a powerfut tool in molecular biology.
DNA restricti~n fragments are often used as molecular weight markers in flat gel DNA analysis. A known DNA digested with a specifi.c endonuelease results in set of double stranded DNA molecules with very well defmed composition. Base pair lengtbs of standard samples used are listed in table 6.4 stating the original DNA and the restrietion endonuclease used for digestion
94
Table 6.4: Fragment length of standard restrietion digests
1 2 3 4 5 6 7 8 9 10 11 12 13 14 15 16 17 18 19 20 21 22
pBR322 Haem 8 11 18 21 51 57 64 80 89 104 123 124 184 192 213 234 267 434 458 504 540 587
c[>Xl74 11. Haem 72 118 194 234 271 281 310 603 872 1078 1358
BstE 117 2624 702 1264 1371 1929 2323 3675 4324 4822 5686 6369 7242 8454
Hindill 125 564 2027 2322 4361 6557 9416 23130
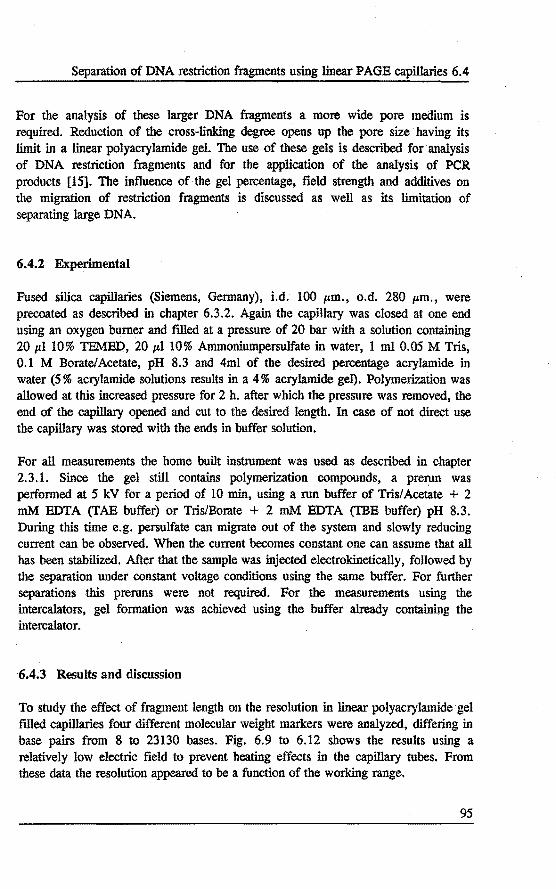
Separation of DNA restrietion fragments using linear PAGE capillaries 6.4
Por tbe analysis of these larger DNA fragments a more wide pore medium is required. Reduetion of tbe cross-linking degree opens up tbe pore size having its limit in a linear polyacrylamide gel. The use of these gels is described for analysis of DNA restrietion fragments and for tbe application of the · analysis of PCR products [15]. The influence of the gel percentage, field strengtb and additives on the migration of restrietion fragments is discussed as well as its limitation of separating large DNA.
6.4.2 Experimental
Fused silica capillaries (Siemens, Germany), i.d. 100 pm., o.d. 280 pm., were precoated as described in chapter 6.3.2. Again the capillary was closed at one end using an oxygen bumer and tilled at a pressure of 20 bar witb a solution containing 20 pl 10% TEMED, 20 pllO% Ammoniumpersulfate in water, 1 m1 0.05 M Tris, 0.1 M Boratel Acetate, pH 8.3 and 4ml of tbe desired percentage acrylamide in water (5% acrylamide solutions results in a 4% acrylamide gel). Polymerization was allowed at tbis increased pressure for 2 h. after which tbe pressure was removed, tbe end of tbe capillary opened and cut to the desired length. In case of not direct use the capillary was stored witb tbe ends in buffer solution.
Por all measurements tbe home built instrument was used as described in chapter 2.3.1. Since the gel still contains polymerization compounds, a prerun was performed at 5 kV for a period of 10 min, using a run buffer of Tris/ Acetate + 2 mM EDTA (TAB buffer) or Tris/Borate + 2 mM EDTA (TBE buffer) pH 8.3. During this time e.g. persulfate can migrate out of the system and slowly reducing current can be observed. Wben tbe current becomes constant one can assume that all bas been stabilized. After that the sample was injected electrokinetically, followed by tbe separation under constant voltage conditions using tbe same buffer. Por further separations tbis preruns were not required. For the measurements using the intercalators, gel formation was achieved using tbe buffer already containing the intercalator.
6.4.3 Results and discussion
To study the effect of fragment Iength on tbe resolution in linear polyacrylamide gel filled capillaries four different molecular weigbt markers were analyzed, differing in base pairs from 8 to 23130 bases. Fig. 6.9 to 6.12 shows the results using a relatively low electric field to prevent heating effects in the capillary tubes. From these data tbe resolution appeared to be a function of the working range.
95

6 DNA SEPARATIONS USING CE
96
0.40
540 504 587
0.30 458 s 434 ::5. 234 gt9' 213 ,!!!!. 0.20 123, 124 287
I 192
104 184
0.10 511~9 ,u, 51lilill 0.00
20 30 40 60 80 70
time(mln)
.fig 6.9: Separation of pBR322-Haelll-digest (100 p.g/ml): Cap: 45156 cm; lnj: 20 s, 1 kV,· 89 V/cm
0.30 1358
0.25 1078
872 0.20
603 s 281 5
0.15 271 11-li~ -e- 0.10
I o.os
0.00
·0,06 ...................................... ~~ ..................... ~ ............................... ~ .....................
~ H ~ ~ M H M H ro n M H ~
Umo(mln)
Fig 6.10: Separation of tfJX/74-Haelll digest (50 p.glml); 1nj: 5 s, 1 kV,· Cap: 24/38 cm; 132 V/cm
0.30
7242 ,;
638 5688 8454 s 0.20 4822
::5. 3875,4~ ~ ll-c'l .ë!!!. I 2323 ~ 0.10 192
100 110
tlme(mln)
Fig 6.11: Separation of À DNA-BstE /1 digest (100 p.glml); Inj: 20 s, 2 kV,· Cap: 45/56 cm; 89 V/cm
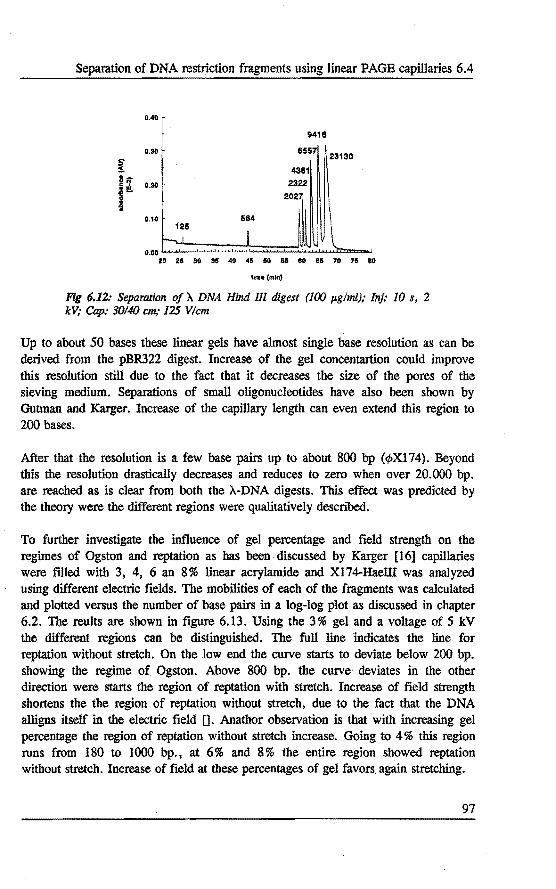
Separation of DNA restrietion fragments using linear PAGE capillaries 6.4
OAO
9418
0.30 6557
11'"~ ~ 4361
~~ 0.20 2322
2027
0.10
time(mln)
Fig 6.12: Separation of}.. DNA Hind lil digest (JOO p.glml); lnj: JO s, 2 kV,· Cap: 30140 cm; 125 V/cm
Up to about 50 bases these linear gels have alntost single base resolution as can be derived from the pBR322 digest. Increase of the gel concentartion could improve this resolution still due to the fact that it decreases the size of the pores of the sieving medium. Separations of small oligonucleotides have also been shown by Gutman and Karger. Increase of the capillary length can even extend this region to 200 bases.
After that the resolution is a few base pairs up to about 800 bp (<J.X174). Beyond this the resolution drastically decreases and reduces to zero when over 20.000 bp. are reached as is clear from both the À-DNA digests. This effect was predicted by tbe tbeory were tbe different regions were qualitatively described.
To furtber investigate the influence of gel percentage and field strength on the regimes of Ogston and reptation as bas been discussed by Karger [ 16] capillaries were filled witb 3, 4, 6 an 8% linear acrylamide and X174-Haelll was analyzed using different electric fields. The mobilities of each of tbe fragments was calculated and plotted versus the number of base pairs in a log-log plot as discussed in chapter 6.2. The reults are sbown in figure 6.13. Using tbe 3% gel and a voltage of 5 kV the different regions can be distinguished. The full line indicates tbe line for reptation without stretch. On the low end the curve starts to deviate below 200 bp. showing the regime of Ogston. Above 800 bp. tbe curve deviates in tbe other direction were starts the region of reptation witb stretch. Increase of field · strength shortens the the region of reptalion without stretch, due to tbe fact that tbe DNA alligns itself in the electric field 0. Anathor observalion is that witb increasing gel percentage the region of reptation without stretch increase. Going to 4% this region runs from 180 to 1000 bp., at 6% and 8% the entire region sbowed reptalion without stretch. lncrease of field at these percentages of gel favors again stretching.
97
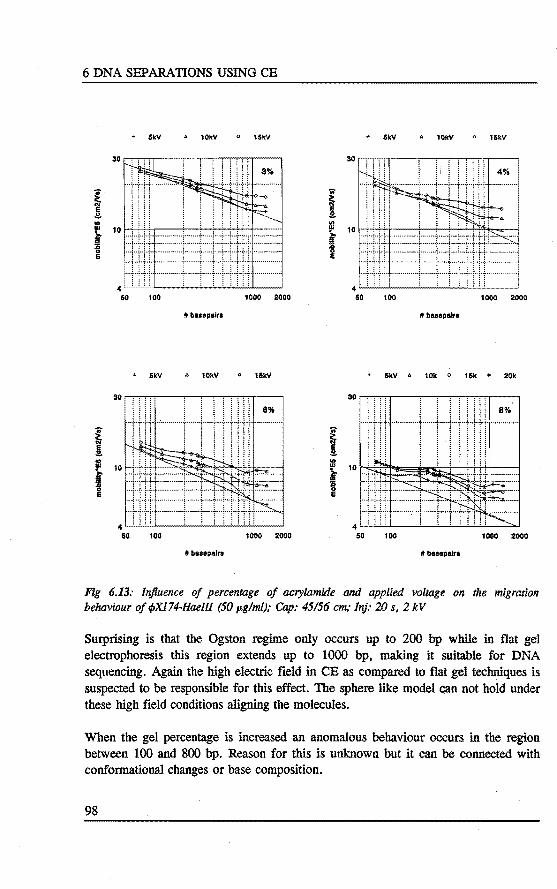
6 DNA SEPARATIONS USING CE
+ SkV . tOkV 0 tSkV + SkV • 10kV ó 1SkV
30 30
i ~ .2. ! "' .. 111 10 111 10 i:- i = :;; 0 0 E e
4 60 100 1000 2000 100 1000 2000
11 buepalra 11 buapalta
+ $kV • 10kV 0 15kV • $kV • 10k o 15k + 20k
30 30~n7r-~~~~~~--,
: :: l: 8%
~ !
l 10
"
i ---rTrl-Htlr ~ 10~~~~i~:~:t::~:rt::+-i~ ~
e e
100 1000 2000 50 100 1000 2000
t buepairs
Fig 6.13: lnjluence of percentage of acrylamide and applied voltage on the migration behaviour of ,PX174-Haelll (50 p.glml): Cap: 45156 cm; Inj: 20 s, 2 kV
Surprising is that the Ogston regime only occurs up to 200 bp while in flat gel electrophoresis this region extends up to 1000 bp, making it suitable for DNA sequencing. Again the high electtic field in CE as compared toflat gel techniques is suspeeteel to be responsible for this effect. The sphere like model can not hold under these high field conditions aligning the molecules.
When the gel percentage is increased an anomalous behaviour occurs in the region between 100 and 800 bp. Reason for this is unknown but it can be conneeteel with conformational changes or base composition.
98
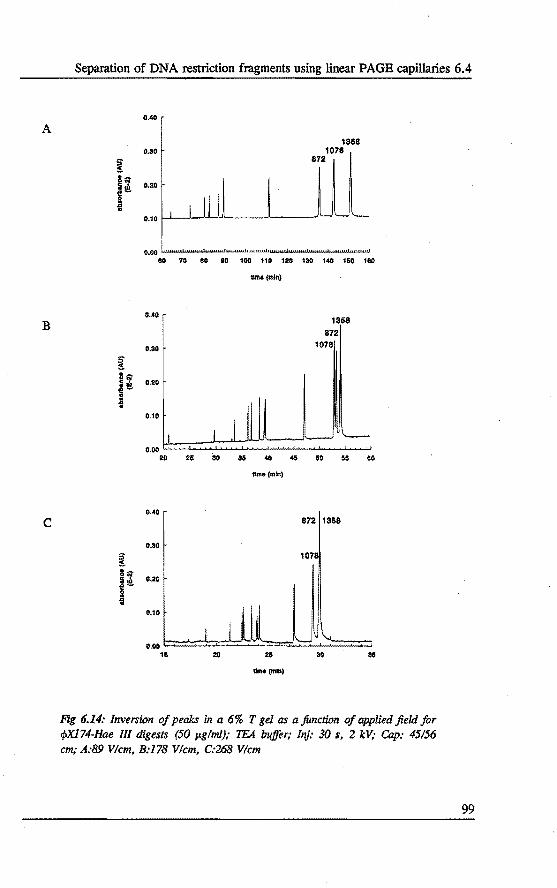
A
B
c
Separation of DNA restrietion fragments using linear PAGE capillaries 6.4
0.40
uo
! ~~ 0~ i I I lLl
0.10
1868 1078
872
~L o.oo ""'""""'~"""'...r.w~~uu.uu.~w"'""'"""""""'""'""~Ml=.u.wJ
liO 70 80 90 100 110 120 130 140 150 180
0-40
o.ao
! j ~ 0.20
0.10
0.40
0.80
! I~ 0-20
0.10
time (mln)
1358
872 1078
21) ~ ~ 40 40 50 50 liO
Ume{mln)
872 1358
107
20 ao 8&
11me(mln)
Fig 6.14: Inversion of peaks in a 6% T gel as a fonction of applied field for tf;IX174-Hae 111 digests (50 J.Lglml); 1E4 buffer,· Inj: 30 s, 2 kV,· Cap: 45/56 cm; A:89 V/cm, B:l78 V/cm, C:268 V/cm
99

6 DNA SEPARATIONS USING CE
Figure 6.14 shows the phenomenum of peak inversion as the applied field is increase for the longer fragments of ct>Xl74-Hae m. The data shown are from the 6% gel also plotted in figure 6.13. At lower gel percentages, the peaks move closer at higher field strength but do not inverse. The effect of peak • inversion is also mentioned in chapter 6.2. Theory however prediets the minimum mobility to be a function of gel concentration, while this did not show from the data. It was however in occardance with the movement to lower base numbers when the field strength was increased.
An interesting effect could be observed while using linear acrylamide capillaries. Oppositely to the crosslinked capillaries, the current slowly increased over time. The strange thing which showed is that this increase was enhanced when large DNA was injected, while it was reduced when only buffer was electrophoresed. Maybe some of the linear polymers are not very well retained in the tube and are forced out by the large DNA polymers. After long use the current went up so high that the gel was destroyed. Also extrusion of the gel from the tube was observed possibly caused by BOF due to surface charges. To test this, an experiment was performed in a closed system as described by Verheggen et al. 0.
0.20 1358 107
0.18 872
~ 0.18 281 803 234271
hr 194 10 u 0.14 118 ~- 72 ~ 0.12 .
llm• (mln)
Fig 6.15: Analysis of if.Xl74-Haelll digest i1l a closed system
A decrease in plate height was observed as compared to an open system pointing to the fact that convection must be occurring probably due to surface charges. It appears that the initial coating of acrylamide is the critical step in the stabie production of the linear acrylamide capillary tubes.
Another effect which can be seen is the difference in . the use of TAB buffers as compared TBB buffers. In the literature on slab gel electrophoretic separations Tris acetate buffers are most commonly used, although Tris borate buffers are also described. From experiments it turned out that the use of Tris/borate resultate in
100

Separation of DNA restrietion fragments using linear PAGE capillaries 6.4
heading peaks due to electrodispersion because of the low mobility of borate, while Tris/ Acetate let to tailing peaks. Matching of the bachground ion to the sample ion gives preferenee of borate for large DNA and to acetate for small DNA fragment&. The overall lower conductivity of borate is advantageous because less Joule heat is produced at equal fields than using acetate. Acetate however bas the advantage during an electrokinetic injection that it can serve as a temporary teading ion, allowing better focusing of the sample.
6.4.4 Conclusions
Linear polyacrylamide gel filled capillaries are a suitable medium for separation of DNA restrietion fragments. A wide range of fragments from 8 to 23130 bp can be separated in these system, although the resolution at the high end is greatly reduced.
The migration behaviour could be split up into three regions ·as prediered by the theory. Por low gel percentage and low field, the Ogston regime stops at 200 bp, the reptation model without stretch runs to 800 bp and above reptation with stretch is observed. Increasing. of gel percentage widens the range of reptation without stretch. Increase of field strength enhances reptation with stretch and reduces the Ogston regime.
In high percentage gels, using high fields, peak inversion is observed as predicted by theory. To obtain separation conditions were these pbenomena are reduced, low percentage gels and low field strength are advised.
6.5 QUALITATIVE AND QUANTITATIVE ANALYSIS OF PCR FRAGMENTS USING L1NEAR POLYACRYLAMIDE GEL FILLED CAPILLARIES
The polymerase chain reaction (PCR) bas become a popular tooi for specific amplification of DNA fargments [17]. Using a specially designed primer a specific target sequence can be amplified over several orders of magnitude in a background of thousands of otber sequences.
To be able to determine wbether the desired sequence indeed bas been amplified the PCR product is ran versus a DNA molecular weight marker and migration of the band compared. After staining, semi-quantitative results can be obtained from the intensity of the band but the accuracy of this procedure is fairly low. Since it is a single experiment, CE can be a usefull competitor of the slab gel analysis.
101

6 DNA SEPARATIONS USING CE
As was shown in chapter 6.4 low gel percentage and low field are suitable for this type of experiments. Important however is also that migration time versus base pair number shows a smooth curve, since otherwise accurate basepair determination is impossible.
o.~o
504 458540
0.30 434 587
! I! 0.20
~-t
0.10
o.oo 10 20 30 40 so 80 ro
ama(mln)
Ftg 6.16: Separation of mixture of pBR322-Haelll (100 1-'glml) and !/>Xl74- · Haelll (50 1-'glml) uslng a TAE buffer: Irif,· 15 s 1 kV,· Cap: 30/41 cm,· 122 V/cm
Figure 6.16 shows a separation of a mixture of cf>Xl74-Haeill and pBR322-Haeiii. In this case the restrietion endonuclease is of the same type and different migration caused by this was prevented. Moreover Haeiii cuts with blunt ends so extra effects from sticking were not to be expected. A number of observations can be made. It should be noted that for the ease of recognition the concentration of pBR was higher than that for cf>X so the origin can be derived from the peak height and area. As can be seen the overall peak order is a bit confused. The 234bp fragment of cf>X does not comigrate with the 234bp fragment of pBR. The 603bp fragment of q,X migrates faster than the 587bp fragment of pBR. The distance between peaks is often not in agreement with the difference in size. Note in this respect that the distance between 434 and 458 of pBR {difference of 24) is several times hlgger than the difference between 504 and 540 (difference of 36) while the space between 540 and 587 is again big (difference 47). Also in q,x the triplet 271, 281 and 310 doesn't show interdistances according to the size difference. Apparently the DNA does't migrate in the system as is expected from the digest fragment lengths. A reason for this could be that secundary structure folds the DNA in to an overall shape which is considerably different from the linear structure. In this respect the formation of "hairpins" could alter the mobility.
102
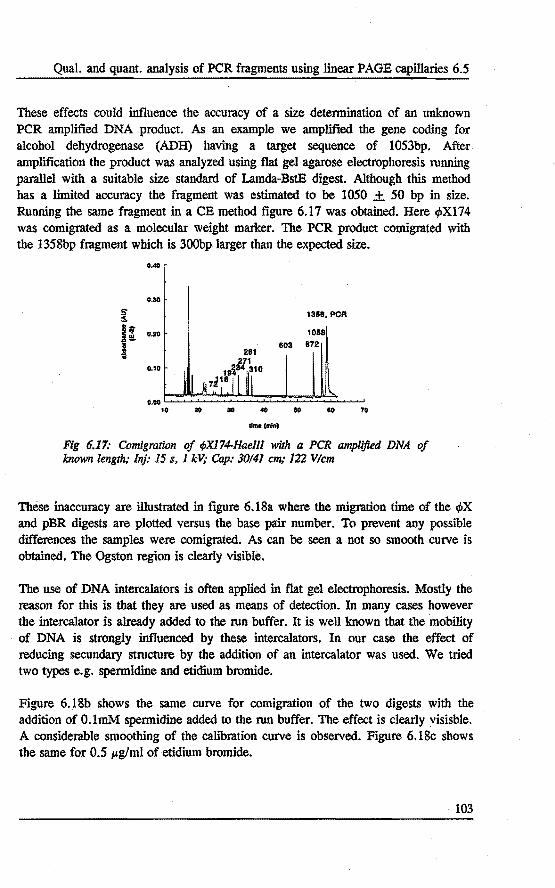
Qual. and quant. analysis of PCR fragments using linear PAGE capillaries 6.5
These effects could influence tbe accuracy of a size determination of an unknown PCR amplified DNA product. As an example we amplified the gene coding for alcohol debydrogenase (ADH) having a target sequence of 1053bp. After amplification tbe product was analyzed using flat gel agarose electrophoresis running parallel with a suitable size standard of Lamda-BstB digest. Although this metbod bas a limited accuracy the fragment was estimated to be 1050 ± 50 bp in size. Running the samefragment in a CE metbod figure 6.17 was obtained. Here I'/;Xl74 was comigrated as a molecular weight marker. The PCR product comigrated with the 1358bp fragment which is 300bp larger than the expected size.
OAO
0.10
S" 1358, POR $
J; o.ao 1058
: 603 87:! i
0.10
0.00 10 20 80 40 80 60 70
Umo(mln)
Fig 6.11: Comigration of ~PX174-Hael/l with a PCR ampUfied DNA of known length,· lnj: 15 s, 1 kV,. Cap: 30141 cm: 122 V/cm
Thèse inaccuracy are illustrated in figure 6.18a where the migration time of the 1'/;X and pBR digests are plotted versus the base pair number. To prevent any possible differences the samples were coniigrated. As can be seen a not so smooth curve is obtainèd. The Ogston region is clearly visible.
The use of DNA intercalators is often applied in flat gel electrophoresis. Mostly the reason for this is that tbey are used as means of detection. In many cases bowever the intercalator is already added to the run buffer. It is well known that tbe mobility of DNA is strongly influenced by these intercalators. In our case the effect of reducing secundary structure by the actdition of an intercalator was used. We tried two types e.g. spermidine and etidium bromide.
Figure 6.18b shows the same curve for comigration of the two digests with tbe actdition of O.lmM spermidine added to the run buffer. The effect is clearly visisble. A considerable smoothing of the calibration curve is observed. Figure 6.18c shows the same for 0.5 JLg/ml of etidium bromide.
103

6 DNA SEPARATIONS USING CE
A
B
c
104
GO
80
J 70 ...
!. eo . 50 ~
i 40
i!
' 311
211
10
0 lO lOO 1000 2000
• baHpalro
70
eo
1i' eo l i 40
I 311
20
10
0 10 100 1000 2000
tbuepolt•
100
110
eo
/ 1i' 70 !. eo i 50
= ! 40 _______../ JlP so ;I
10
10
0 10 100 1000 2000
tbuopolra
Fig 6.18: Migration time versus base pair number for a mixture of pBR322· Haelll and <f>Xl74-Hael/1 as ajimction of buffer additive. A: no additive, B: 0.1 mM spermidine, C: 0.6 p.glml ethidiumbromide

Qual. and quant. analysis of PCR fragments using linear PAGE capillaries 6.5
As is clear from the calibration curves the use of ethidium bromide is the best choice for the accurate size determination of restrietion fragments. The use of a concentration of 0.6 ~tglml showed to be better than the use of 0.4 ~tglml, while further additiion to 0.8 ~tglml did not show any further improvement. Figure 6.19 shows the size standard mixture, while in figure 6.20 the PCR fragment is again applied.
0.40 50~887
458 434
0.30
~ 3a; liV:. 0.20 e-s ~
0.10
0.00 10 20 30 40 60 80 70 80 SO
Ume (mln)
Fig 6.19: Separation of a mixture of pBR322-Haelll (100 JLglml) and r{JX174-Haelll (50 JLglml) using a TAE buffer + 0. 6 JLglml Ethidiumbromide; Inj: JO s, 1 kV,· Cap: 30/41 cm; 122 V/cm
0.40
0.30
~ hr !à 0.20 1078 PCR
I 0.10
0.00 L...-....--1.~--'--~-'---'---'~-'-~....___...._.~_, 10 ao ao •o 60 80 70 80 eo
llme(mln)
Fig 6.20: Comigration of r{JX174-Haelll with a PCR amplijied DNA of known length using the TAE buffer + 0.6 JLglml ethidiumbromide; Inj: JO s, 1 kV,· Cap 30/41 cm; 122 V/cm
The early eluting peaks are rests from the PCR reaction. Since this is all low molecular weight material, it could be unreacted primers and the different dNTP's which are in the mixture to form the DNA. Later in the electropherogram no extra peaks occur so interference with the measurement is neglectable.
105

6 DNA SEPARATIONS USING CE
Tbe structure of ethidiumbromide is shown in figure 6.21. It stades between the bases of the DNA strand and creates a more stiff sugar-phosphate backbone. Due its positive charge it reduces the mobilty of the DNA about 15%. Due to its multiple aromatic structure detectability using UV detection is enhanced. Tbe difference between the mobility of the DNA and the bachground ion is however further increased so that rednetion of plate numbers are visible. Another effect of the addition of ethidiumbromide is that peak inversion at higher field is not noticable anymore. Tbe U-state of the DNA strands teading to the inversion can not anymore occur when the intercalator is present.
H2N NH2
Fig 6.21: Structure of ethidiumbromlde
For quantitation of the PCR fragment an intemal standard procedure bas to be applied. First of all the PCR amplified DNA solution bas to be mixed with the DNA molecular weight standard, since electrokinetic injection is employed. Using two consecutive runs could lead to huge differences, since the amount injected is dependent on the matrix in which tbe sample is present. The fact that DNA in free salution bas a constant mobility independent of its length, is an advantage in this injection step that the marker and PCR are equally injected and the marker can be used as intemal standard.
Quantitative results can be derived from the data in the following way. From a plot of migration time versus fragment length, the length of the PCR product is estimated (6.22a). In a restrietion digest all the fragments are equimolar present. Tbe concentration of the digest however is usually expressed as the total concentration of DNA (J.tg/ml). To determine tbe DNA concentration in 1-'g/ml for tbe PCR fragment, this concentration bas frrst to be calculated based on the fragment lengtbs (6.22b). From the curve the value for the PCR fragment can be read. Plotting the corrected peak area of each of the fragments versus the concentration of eacb of the fragments results in a straight line for the molecular weight marker from which the corrected
106

Qual. and quant. analysis of PCR fragments using linear PAGE capillaries 6.5
area for the PCR fragment can be determined, when it would have the same concentration as such fragment in the marker (6.22c). Using tbis value a one point calibration graph of concentradon versus corrected area is made (6.22d). Using the measured corrected area, PCR fragment concentration is determined.
~ PCRIIIandonl
.; --f
....... ,..,
Fig 6.22: Size determination and quantitation of a PCR amplijied DNA fragment.
Using the above described procedure tbe PCR primer concentradon was determined and was found to be 103 p.g/ml. If premixing of the sample and the standard ·was · not done a value of 16.5 p.g/ml was found, sbowing the error introduced by the electrokinetic injection.
It can . be concluded that using linear polyacrylamide gels of low gel percentage (4%), using mild electrophoretic conditions (122 V/cm) and using a buffer with etbidiumbromide added (0.6 ~tg/ml), size estimation of PCR amplified DNA fragments is feasible. As a control the same estimation was performed · using a standard agarose gel electrophoretic procedure. The same results were obtained with a higher accuracy for the CE method.
When quantitative data are required premlX.lDg of the standard with the PCR fragment is necessary to overcome selectivity in electrokinetic injection. The marker can at the same time be used as internal standard using the procedure as described. A single experiment can intbis way provide all information.
107

6 DNA SEPARATIONS USING CE
6.6 SEPARATION OF DNA RESTRICTION FRAGMENTS USING AGAROSE FILLED CAPILLARIES
As was discussed in chapter 6.3, linear acrylamide bas a limited resolution for large size DNA fragments. A sieving matrix having larger pores, could help to improve this resolution. Agarose is a linear polumer built from sugar units, extracted from seawheat. The pore size can reach 500 nm. [10], making it suitable for large molecule separations. Several types of agaroses are available differlng in structure and gel temperature.
Agarose f:t.lled capillarles can be easily made by melting the agarose, f:t.lling the capillary while the agarose is liquid and cooling down. Surface charge can however cause BOF, resulting in extrusion of the gel from the tube. Polyacrylamide coated capillarles as described in chapter 6.3 can be used to f:t.ll in the gel. Since the surface charge is greatly reduced, more stabie columns· are obtained. Several types of agaroses were screened but only low melting agaroses gave suitable columns as is also indicated in the literature [18].
Using a 1% ultra low melting agarose (Sigma) having a gel temperature of l7°C, an analysis of <PX174-Hae1II was performeel using the standard TBB buffer. It is important to realize that tbe gel is actually a liquid at the temperature of the separation. This results in a dynamic gel structure, whlch is suitable for separation. The electropherogram is shown in figure 6.23.
0.20 1358
8721078
~ 603
~~ 0.10 !! 2
L 11
40 50 eo 70 80 80 100
tlme(mln)
Fig 6.23: Separation of <PX174-Hae lil (50 p.glml) digest using a 1% ultra low melting agarose; lnj: 5 s, 1 kV,· Cap: 40/51 cm; 98 V/cm
Improvements in resolution for the higher molecular weight region is observed as compared the linear · polyacrylamide gels. Platting log basepairs versus log mobillty as shown in figure 6.24, indeed indicates that the area for reptation is further
108

Separation of DNA restrietion fragments using agarose ftlled capillaries 6. 6
extended. An almost linear curve of the entire range was obtained. This implies that agarose is indeed a better medium for separartion of Jarge size DNA and further investigations are necessary.
+ 5kV
• ballepatra
Fig 6.24: Migration time versus log base pairs for 4>X174-Hae/II in a 1% UMP agaraose
Up to now the stability of tbe columns bas shown to be very limited. A small number of experiments can be performeel and insufficient surface deactivation is still a problem, since the agarose is extruded from the column. Procedures to bind the agarose chemically to the wall should be a step ahead, but suitable reagents have still to be researched. Also the use of higher melting agaroses is not yet succesfut as is shown in tigure 6.25.
0.40
0.80 1358
i 1078
u 0.20
~-~
0.10
o.oo 10 20 80
Urne (mln)
Fig 6.25: Separation of 4>X174-Hae lil digest (50 p.glml) on a 1% Nusieve agarose; 11'1}: 20 s, 1 kV; Cap: 40151 cm; 98 V/cm
109

6 DNA SEPARATIONS USING CE
Resolution in this separation is even better than in the other agarose column, but the efficiency for the different peaks is rather bad. A reason for this behaviour can be that the pores in a true solid agarose are not sufficiently dynamic to accommodate the DNA migration.
6.7 SEPARATION OF DNA RESTRICTION FRAGMENTS USING BUFFERS CONTAING HYDROXYMETHYLCELLULOSE
6.7.1 Introduetion
The use of hydrophylic polymerie additives to the buffer as a sieving mechanism to separate proteins and DNA fragments was flrst introduced by Hjerten et al. [19] and Zhu et al. [20]. Hydrophylic polymers are well water soluble and also. provide a sieving medium. Since the buffer with the additive can still be ftlled in the capillary, it can be handled like a free solution separation, where also the vials contain the buffer with the additive.
Since BOF can occur in these systems and is oppositely to the migration direction of the DNA, it is very important to control the BOF. Since the mobility of DNA restrietion fragments ranges widely, peaks can be easily be lost.
Chin et al. [21] enforced the BOF, to be sure that the electroosmotie mobility would be bigger than any of the electrophoretic ones. In this case a reversal of the peak order for the different fragments was obtained as compared to the linear gel system. The problem however is that the BOF is difficult to keep constant and long capillary preparation times were required.
Another approach is to reduce BOF and reverse polarity as described by Hjerten and Zhu using polyacrylamide coated capillaries and a cellulose additive. This again tums the separation to the normal migration order. This chapter describes the use of commercial Gas Chromatography capillaries with deactivated surfaces. The combination of these columns with a hydroxypropylmethylcellulose (HPMC) in the run buffer both reduced osmotic flow and prevented interaction of the DNA with surface [22].
110
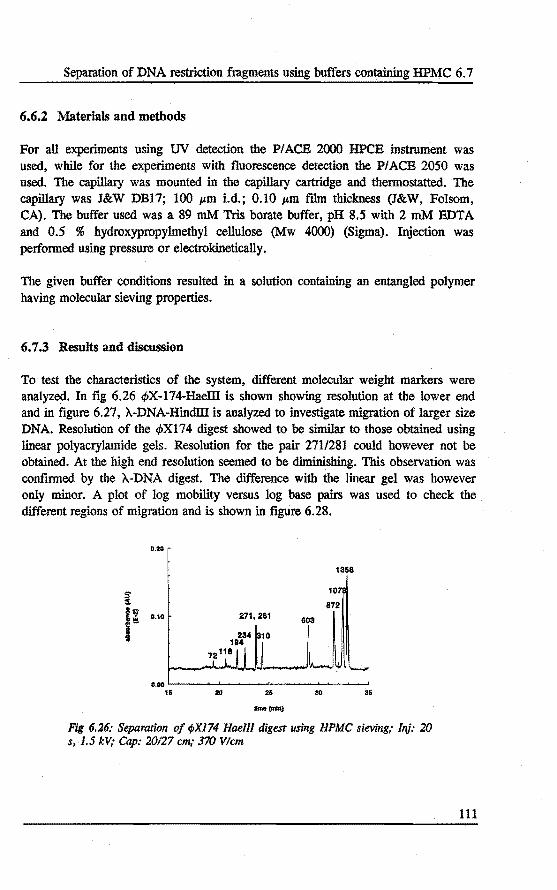
Separaûon of DNA restrietion fragments using buffers containing HPMC 6. 7
6.6.2 Materials and methods
For all experiments using UV detecûon the P/ ACE 2000 HPCE instrument was used, while for the experiments with fluorescence detecûon the P/ACE 2050 was used. The capillary was mounted in the capillary cartridge and thermostatted. The capillary was J&W DB17; 100 p,m i.d.; 0.10 p,m film tbickness (J&W, Folsom, CA). The buffer used was a 89 mM Tris borate buffer, pH 8.5 with 2 mM EDTA and 0.5 % hydroxypropylmethyl cellulose (Mw 4000) (Sigma). Injecûon was performed using pressure or electrokineûcally.
The given buffer conditions resulted in a soluûon containing an entangled polymer having molecular sieving properûes.
6. 7.3 Results and discussion
To test the cbaracteristics of the system, different molecular weight markers were analyzed. In fig 6.26 1/>X-174-Haeill is shown showing resoluûon at the lower end and in tigure 6.27, ;\-DNA-Hindiii is analyzed to investigate migration of larger size DNA. Resolution of the 4>X174 digest showed to be similar to those obtained using linear polyacrylamide gels. Resolution for the pair 271/281 could however not be obtained. At the high end resolution seemed to be diminishing. This observaûon was confmned by the ;\-DNA digest. The difference with the linear gel was however only minor. A plot of log mobility versus log base pairs was used to check tbe different regions of migration and is shown in tigure 6.28.
0.20
s ~
!:ï 0.10
1-. o.oo
1S
271, 281
25
time(l'llin)
1358
107
Fi.g 6.26: Separation of q,X174 Haell/ digest using HPMC sieving,- Inj: 20 s, 1.5 kV,· Cap: 20127 cm; 370 V/cm
111

6 DNA SEPARATIONS USING CE
0.25
&657
11.20 9418
! s;; h 0.15
i .
Umo(lnln)
Fig 6.27: Separation of>.. DNA Hindlll digest using HPMC sieving,· Inj: JO s, 2 kV,· Cap: 20127 cm,- 370 V/cm
As is shown from the figure, the Ogston regime extends to approximatel 200 bp. Tbe regime for reptation extends to almost 1200 bp. However, when the voltage is increased, stretching occurs earlier and starts around 600 bp. The peak efficiency shows to be very high, but this started to reduce after using the column for several days. Possible breakdown of the surface coating could be a reason for this effect. Also the reproducibility from column to column was rather poor. Reason for this can be in the application of the DB17 columns. Since they are basically GC columns, they are mostly used in much Jonger length. Coating precision is therefore not so critical and using only 50 cm could therefore show considerable differences.
112
+ 5kV " 10kV
ao , , i: i l i ~
lffil la 10 i ::! ;
r ::t:ln :::::::::::::::J::::::::t::::f:llnr :::::::::::::: 4 ~nn :~:::::::::::r::::::F:r::r:rlll·::::::::::::~.
110 1 00 1 000 2000
tbuepalrs
Fig 6.28: Log base pairs versus log mobility for .PX174-Haelll using hydroxypropylmethylcellaiose Mw 4IXJO at 0.5% concentration

Separation of DNA restrietion fragments using buffers containing HPMC 6. 7
Mobility of the compounds is oomparabie to a 3% linear polyacrylamide gel. To obtain a little more resolution at the lower end, could be achieved by increasing the polymer concentration. 0.7% However tumed out to be the maximum for solubilizing the polymer in water and the working range is tberefore kind of limited.
A
B
0.20
0.10
! o.oo
jst lil. ·D.1D
I .0.20
-ll.SO
.OAO H 30 u 40 50
timo(mln)
0.110
O.H
! DAO
u 0.30
i 287
0.20
0.10
0.00 H
limo (min)
Fig 6.29: Injluence of a presample injection of buffer on a separation of pBR322-Haeiii,· Inj: JO s pressure, Cap: 50157 cm: 263 V/cm
Analyzing pBR322~Haelll (635 p.g/ml) in tbe standard buffer system, as shown in figure 6.29 showed reduced resolution under 200 bp, when injection were made using pressure (part A). This effect was not sbown when an electrokinetic injection was performed and also not when the sample was further diluted. It must be concluded that the column was overloaded. The overloading effect could however be reduced by a presample injection of 100 mM borate buffer pH 8.3 as shown in part B. Temporary non~steady ITP sharps up the peaks at the lower end resulting in improved resolution. Note that tbe early migrating peaks show tailing, while the
113

6 DNA SEPARATIONS USING CE
later ones show heading. The boundary between these regions marks the mobility of the background ion and the skewed peaks are caused by electrodispersion showing up due to the high concentration of analytes.
It bas been shown in the literature that detection sensitivity can be improved by using DNA intercalators. Ethidium bromide used in the same system by Schwartz, showed a factor of 2 improved signal to noise when ethidium bromide was added to the sample. Also resolution of the 271/281 pair could be achieved by this actdition since the mobilty is changed due to intercalation.
A number of other intercalators are described in the literature, some of them having excellent fluorescent properties. To be able to use laser induced fluorescence a dye was selected, having an excitation maximum around 488 nm, so to be compatible with an Argon ion laser. Thiozole orange is known to intercalate with DNA and to show an improved signalas compared to the background of several hundred times. lt was added to the run buffer at a concentration of 0.1 ~-tg/mi. Figure 6.30 shows a separation of </>Xl74 digest at a concentration of only 10 ~-tg/ml in such a buffer system.
I :f 71
'::L_L I 5 o.o:J..$0 1:2.11 1UO 1UO 13.10 12.10
I 4 281 271
a .. 310
2
1358
1078
872
603
0~--~---~~~~·~~----~'~
.,~~~~~~~~-~~~~~~
11 12 13 14 15 16 17 1$ 19 20 21 22 23 24
time(mln)
Fig 6.30: Separation of ,PX174-Haelll (10 p.glml) in a buffer HPMC system containing 0.1 p.glml thiozole orange; 300 V/cm,· Detection using UF, ex: 488 nm, em: 530 nm.
As can be seen the thiozole orange improves both sensitivity and resolution. From the signal to noise ratio, it could be derived that the detection limit in this case would be around 1 ng/ml. Dilution of the sample however changes the ratio to the dye and experiments showed that sensitivity did not behave linear. Further studies should show the dilution ration of sample to dye to achleve a linear calibration curve.
114
Separation of DNA restrietion fragments using buffers containing HPMC 6. 7
6. 7.4 Conclusions
It can be concluded that hydroxypropylmethylcellulose in combination with a commercial coated capillary DB17, can also be used for the separation of DNA restrietion fragments. Resolution appears to be similar to that obtained using 3% linear polyacrylamide gel filled capillaries, whicb is in agreement witb the mesh size estimation of both systems.
Varlation of cellulose concentradon is however limited, resulting in a minor adaptation of the system to optimize resolution. Stability and reproducibility of the commercially purchased column is a limitation for the repeatability of the separation in this system.
The use of DNA intercalators can improve both resolution and sensitivity. Especially using laser induced fluorescence several orders of magnitude improvement in detectability can be obtained. Dye to sample ratio should however be obtimized to obtaine linear calibration curves.
6.8 CONCLUSIONS
CE is a high resolution tecbnique which can be used for the separation of oligonucleotides and DNA fragments. Dependent on the application, a choice of sieving media can be made. Mesh size and gel structure seem to be the major parameters in optimizing the separation. Mobility curves describe well the theory bebind migration of DNA through a polymer network.
Using cross-linked polyacrylamide gel filled capillaries, single base resolution can be obtained for small oligonucleotides. This technique was applied to the analysis of PCR primers. Purity control could be easily performed, however for size determination calibration has to · be taken into account.
Using linear gel filled capillaries a wide range of sizes can be analyzed. Care has to be taken in chosing the proper separation conditions to prevent peak inversîon and other secundary effects. Por tbe accurate size determination of PCR amplified restrietion fragments, suitable size standards are used for calibration. Without the addition of an intercalator accurate results are not obtained. Spermidine addition and even better etidium bromide addition stop these effects and a smooth curve for the migration time versus basepair number is obtained. In this system an accurate size determination is possible having an higher accuracy than the classical metbod of flat gel agarose electropboresis.
115
6 DNA SEPARATIONS USING CE
The use of agarose can improve resolution for large size DNA fragments. Stability of the columns is however still a limiting factor.
The use of hydroxypropylmethylcellulose in combination wit a coated capillary is an easy alternative the gel filled columns. Excellent separations can be obtained comparable to a 3% linear polyacrylamide gel. Stability of the surface coating is still a problem in long term reproducibility. The use of DNA intercalators as thiozole orange can enhance bothe resolution and deleetion when using laser · induced fluorescence.
REFERENCES
1. Sambrook, J., Fritsch, E.F., and Maniatis, T., Molecular cloning, Cold sprin harbor laboratory press, New York, 1989
2. Cohen, A.S., Najarian, D.R. and Karger, B.L., J. Chromatogr. 516 (1990) 49-60. 3. A.S. Cohen, D. Najarian, J.A. Smith and B.L. Karger, J. Chromatogr. 458 (1988)
323-333. 4. A.G. Ogston, Trans. Faraday Soc., 54 (1958) 1754. 5. G.W. Slater and J. Noolandi, Biopolymers, 28 (1989) 1781. 6. P.G. De Gennes, J. Chem. Phys., 55 (1971) 572. 7. L.S. Lerrnan and H.L. Fritsch, Biopolymers, 21 (1982) 995. 8. O.J. Lumpkin, P. Dejardin and B.H. Zimm, Biopolymers 21 (1985) 1573. 9. M.J. Dunn in New Directions in Electrophoretic Methods, American Chemica!
Society, Washington, 1987. 10. P.G. Righetti, B.C.W. Brostand R.S, Snyder, J. Biochem. Biophys. Meth., 4 (1981)
347. 11. P.D. Grossman and D.S. Soane, J. Chromatogr. 559 (1991) 257-266. 12. A. Guttman, A.S. Cohen, D.N. Heiger and B.L. Karger, Anal. Chem. 62 (1990)
137-141. 13. J. Lux, H.F. Yin and G. Schomburg, Kobe symp volume 1990. 14. T. Takao, Beekman Instruments, Poster presentation HPCE 91, San Diego 15. A. Guttman and N. Cooke, Anal. Chem. 63 (1991) 2038-2042. 16. Karger et al, Poster presentation, San Diego, HPCE 91. 17. Mullis, K.B. and Faloona, F., Meth. Enzymol. 155 (1987) 335. 18. P. Bocek and A. Chrambach, Electrophoresis, 12 (1991) 1059-1061. 19. S. Hjerten, L. Valtcheva, K. Elenbring and D. Baker, J. Liq. Chromatogr., 12 (1989)
2471. 20. M. Zhu, D.L. Hansen, S. Burd and F. Gannon, J. Chromatogr. 480 (1989) 311. 21. A. Chln and J. Colburn, Am. Biotech. Lab., 7(10A) (1989) 16. 22. K.J. Ulfelder, H.E. Schwartz, J.M. Hall and F.J. Sunzeri, Anal. Biochem. 200
(1992) 260.
116

SUMMARY
SUMMARY
In this thesis the use of capillary electrophoresis for the separation of biomolecules is described. The use of a narrow bore capillary tube allows the use of much higher electric fields to be applied without excessive Joule heating occurring. The combination of electrophoresis and electroosmosis acting on species moving through the capillary tube allows high resolution separations of both anions and cations in a single experiment.
Since commercial instrumentation for capillary electrophoresis bas only been available since a few years, laboratory made instromentalion was developed. The features are described and compared to commercial instrumentation. UV detection is the most common detection option and allows the detection of a wide variety of species. Laser induced fluorescence detection is a much more sensitive strategy but requires often derivatization of the analytes.
Electroosmosis often detennines resolution and reproducibility in a capillary electropboretic system. Several ways to measure the osmotic flow are described. The use of streaming potentials can monitor changes of the surface in time. An on-line · balance procedure is easy to imptement but results can only be obtained over a certain period of time. The u se of a conductivity cel is much faster but electrode reactions can govem the measurement.
The use of capillary electrophoresis for amino acid analysis, requires the use of laser induced fluorescence detection, since UV is not sensitive enough. Several derivatization strategies are compared in terms of sensitivity and impact on the separation. It is shown that kinetics of the derivatization reaction play an important role in the linearity of the cah"bration curves. High background signals is a severe limitation for semnsitivity and detection limits are more determined by chemistry than by the actual hardware sensitivity.
Peptide separations are commonly performed using liquid chromatography. Capillary electrophoresis is shown to give complementary information. Prediedon of migration of small peptide fragments is possible based on calculation of charge using the valnes for the different amino acids. The use of laser induced fluorescence detection can improve sensitivity in this area too, as is shown by the analysis of a tryptic digest of a recombinant protein.
117

SUMMARY
In the field of DNA analysis, electrophoresis on slab gels bas been the standard metbod of choice. This procedure is ho wever rather manual and slow. For applications were no high throughput of samples is required, capillary electrophoresis can be a powerful altemative. Using cross-linked polyacrylamide gel filled tubes, oligonucleotides can be separated with single base resolution. This metbod can be applied to the purity control of PCR primers. DNA restrietion fragments can be separated using linear polyacrylamide gel filled capillaries or by using hydroxypropylmethyl cellulose as a buffer additive. Several aspects as gel percentage, field strength and resolution are discussed and applied to the qualitative and quantitative analysis of PCR amplified DNA products. Agarose filled capillaries are probably most suitable for very large size DNA separations, but the production of capillaries containing agarose is still troublesome.
In general capillary electrophoresis bas been proved a real technique for the analysis of biomolecules and will certainly occupy a stabie position in the future bioanalytical laboratory.
118

SAMENVATTING
SAMENV A'ITING
In dit proefschrift is de toepassing beschreven van capillaire electroforese op de scheiding van biomoleculen. Veel grotere electrische velden kunnen worden gebruikt door toepassing van capillairen met een zeer kleine inwendige diameter zonder dat oververhitting plaats vindt. De invloed van electroforese en electroosmose op de deeltjes die door het capillair bewegen, maakt een scheiding van zowel cationen als anionen in een experiment mogelijk met een hoge resolutie.
Aangezien commercieel verkrijgbare instrumenten pas sinds enkele jaren voorhanden zijn, zijn eigenbouw apparaten ontwikkeld. Deze apparaten woredn beschreven en vergeleken met die van instrument fmna's. UV absorptie is de meest toegepaste detectie methode and maakt detectie van een groot aantal verbindingen mogelijk. Het toepassen van laser geindoceerde fluorescentie is echter veel gevoeliger maar derivatiseren van de te analyseren componenten is doorgaans noodzakelijk.
Electraosmose bepaalt vaak de resolutie en reproduceerbaarbeid van een capillaire electroforetische scheiding. Verschillende methoden om de electraosmose te meten worden beschreven. Het toepassen van stromings potentiaal metingen geeft informatie over het capillair oppervlak als functie van de tijd. Een microbalans in het scheidings systeem is eenvoudig toe te passen . maar geeft slechts informatie over een langere tijdsperiode, Het gebruik van een geleidbaarbeids cel is veel sneller maar electrode processen kunnen de metingen verstoren.
Het gebruik van capillaire electroforese voor aminozuur analyse maakt de toepasing van laser geïnduceerde fluorescentie noodzakelijk vanwege de geringe gevoeligheid van UV detectie. Versebillende derivatiserings metboden zijn vergeleken met betrekking tot gevoeligheid en invloed op de scheiding. De kinetiek van de labelings reactie blijkt een belangrijke rol te spelen in het lineair zijn van calibmtie curven. Een hoog achtergrond signaal is een ernstige beperking voor de gevoeligheid en de detectielimiet wordt dan ook meer bepaald door de chemie dan door gevoeligheid van het instrument.
Peptide scheidingen worden doorgaans uitgevoerd met behulp van vloeistof chromagrafie. Capillaire electroforese blijkt complementaire informatie te geven. Het voorspellen van het migratie gedrag van kleine peptiden blijkt mogelijk op grond van de berekening vanlading van de afzonderlijke aminozuren. Laser geïnduceerde fluorescentie verbetert ook hier de gevoeligheid bij de scheiding van een eiwit digest.
119

SAMENVATTING
Op het gebied van DNA analyse is vlakke gel electroforese de standaard methode. Deze methode is echter handmatig en traag. Wanneer slechts enkele monsters geanalyseerd moeten worden kan capillaire electroforese een alternatief zijn. Geerosslinkte polyacrylamide gel gevulde capillairen kunnen worden gebruikt voor de scheiding oligonucleotiden met een resolutie van een enkele base. De methode is toegepast op de zuiverheids bepaling van primers voor PCR analyse. DNA restrictie fragmenten kunnen worden gescheiden met behulp van lineaire polyacrylamide gel gevulde capill,airen of door toevoeging van hydroxypropylmethyl cellulose aan de buffer. Diverse aspecten zoals gel gehalte, veldsterkte en resolutie worden besproken en toegepast op de qualitatieve en quantitatieve bepaling van PCR geamplificeerd DNA. Agarose gevulde capillairen zijn waarschijnlijk het meest geschikt voor de scheiding van zeer grote DNA moleculen maar de bereiding van agarose gevulde capillairen is nog altijd problematisch.
Capillaire electroforese blijkt in het algemeen zeer geschikt voor de analyse van biomoleculen en zal in de toekomst daarom zeker een vaste plaats innemen in het bioanalytisch laboratorium.
120

SYMBOLS AND ABBREVIATIONS
LIST OF SYMBOLS AND ABBREVIATIONS
Symbols
A area (m~, peakarea (AUs) a constant b constant c concentra ti on (mol/m3
)
c speed of light (m/s) D dispersionldiffusion coefficient (m2/s) E electric field strength (V/m), energy (J) E' dimensionless electric field B.t streaming potential (V) F Faraday constant, fluorescence (arbitrary units) f. friction factor (kg/s) H plate height (m) h Planclcs constant I electric current (A) K dissociation constant k.s kinetic constant (1/m) k' capacity factor L total length (m) I length to detection (m~, detection path length (m) m mobility (m /Vs) mo absolute mobility (mZNs) 1l1eff effective electrophoretic mobili:l (m2/Vs) llleot electroosmotie mobility (m /Vs) N plate number NDNA number of basepairs
(Wim~, p electric power per volume unit excitation power (W) p pressure (bar) Q charge (C) q charge (C) R resolution, Universa! gas constant Rg gyration radius (m) r radius (m) T temperature (K) t time (s) V voltage (V) V velocity (m/s) Vcot electrophoretic velocity (mis) w Total power (W), weight (kg) w injection band width (m) Wo.s peak width at half heigbt (s) x distance (m) z charge number
121

SYMBOLS AND ABBREVIATIONS
dissociation constant activity coefficient thermal coefficient of mobility (liK), double layer thickness (m) dielectric constant (C2/Jm), extinction coefficient (m3/mol cm) zeta potentlal (V) viscosity (Ns/m2)
specific conductance (1/0m) wavelength (m) thermal conductivity (W/rr!K) electroosmotie mobility (m2Ns) average pore size (m) density (kg/m3
)
varianee (m), background conductivity (1/0m) total number of photons absorbed · potentlal (V)
Abbreviations
ACTII CBQCA CE CEC CGE CMC CZE DTAF BOF FITC GC HPLC HPMC HVPS i.d. IEF ITP LC LIF MBE MECC NBD-Cl OPA P/ACE PCR PTFE PTII SDS uv
122
Adrenocorticotropic hormone 3-( 4-carboxybenzoyl)-2-quinoline-carboxaldehyde capillary electrophoresis capillary electrochromatography capillary gel electrophoresis critical micellar concentration capillary zone electrophoresis 4-(4,6-dichloro-s-triazin-2-ylamino)fluorescein electroosmotie flow fluorescein isothiocyanate gas chromatography high performance liquid chromatography hydroxypropylmethylcellulose high voltage power supply intemal diameter isoelectric focusing isotachophoresis liquid chromatography laser induced fluorescence moving boundary electrophoresis micellar electrokinetic capillary chromatography nitrobenzofurazane-hydrochloride ortho-phtaldialdehyde preparative/analytical capillary electrophoresis polymerase chain reaction polytetrafluoroethene phenylthiohydantoin sodiumdodecylsulfate ultraviolet

DANKWOORD EN CURRICULUM VITAE
DANKWOORD
Op deze plaats wil ik alle medewerkers van de vakgroep Instrumentele Analyse bartelijk bedanken voor de hulp bij de totstandkoming van dit proefschrift. Speciale dank gaat uit naar mijn eerste promotor, Frans Everaerts, die zijn enthousiasme voor dit vakgebied op mij beeft overgedragen en voor alle mogelijkbeden die bij mij heeft geboden internationale contacten te leggen. Ook mijn collega, Bart Wanders, wil ik bedanken voor de vele projecten die we met elkaar hebben volbraebt en tevens Hetty van Berendonk en Marcel van der Schans voor de vele experimenten welke zij nauwgezet hebben uitgevoerd. Dank gaat uit naar Beekman Instruments voor het mogen gebruiken van resultaten van experimenten, welke ik in bun laboratoria heb uitgevoerd.
Curriculum Vitae
24 maart 196S Geboren te Oud- en Nieuw Gastel. juni 1983 Eindexamen VWO 6,
van der Putt lyceum, Eindhoven. Sep.1983-dec.l987 Studie Scheikundige Technologie,
Technische Universiteit Eindhoven. dec.1987-mrt.l992 Promotie onderzoek in de vakgroep Instrumentele Analyse,
Technische Universiteit Eindhoven. juli 1992- Staf medewerker bij Hewlett-Packard Laboratories, Palo Alto,
CA, USA.
123

PUBUCATIONS
AUTHORS PUBLICATIONS ON CA.Pll..LARY ELECTROPHORESIS
1. Capillary Electrophoresis; Graduation report, Eindhoven University ofTechnology, 1987; van de Goor, A.A.A.M ..
2. Electrophoresis versus Chromatography; Proc. 9th Int. Symp. on Capillary Chromatography 1988, Monterey, USA; Everaerts, F.M., van de Goor, A.A.A.M., Beckers, J.L. and Verheggen, Th.P.E.M ..
3. Methods for on-line determination and control of electroendosmosis in capillary electrochromatography and electrophoresis; J .. Chrom. 1989, 470 (1), 89-93; Wanders, B.J., van de Goor, A.A.A.M. and Everaerts, F.M ..
4. Modified methods for off- and on-line determination of electroosmosis in capillary electrophoretic separations; J. Chrom. 1989, 470 (1), 95-104; van de Goor, A.A.A.M., Wanders, B.J. and Everaerts, F.M ..
5. Electrophoresis versus Chromatography; J. HRC & CC, 1989, 12(1), 28-31; Everaerts, F.M., van de Goor, A.A.A.M., Beckers, J.L. and Verheggen, Th.P.E.M ..
6. Capillary separation methods using high electric fields; Proc. lOth Int. Symp. on Capillary Chromatography 1989, Riva del Garda, ltaly; van de Goor, A.A.A.M., Wanders, B.J. and Everaerts, F.M ..
7. Fully automated capillary electrophoresis - laser induced fluorescence; Proc. 11 th Int. Symp. on Capillary Chromatography 1990, Monterey, USA; Wanders, B.J., van de Goor A.A.A.M. and Everaerts, F.M ..
8. Analysis of Interleucin 2; Beekman P/ACE application note; van de Goor, A.A.A.M .. 9. Capillaire Electroforese, een nieuwe techniek met vele applicaties; LabABC 1991, 2, 14-
17; van de Goor, A.A.A.M .. 10. Capillary Electrophoresis of peptides, Analysis of adrenocorticotropic hormone
fragments; J. Chrom. 1991, 545(2), 379-389; van de Goor, A.A.A.M., Janssen, P.S.L., van Nispen, J.W., van Zeeland M.J.M. and Everaerts, F.M ..
11. Qualitative and quantitative analysis of PCR fragments using capillary electrophoresis; van de Goor, A.A.A.M., van de Goor-Kucerova, J., van der Schans, M. and Everaerts, F.M.; submitted for publication.
12. CapiUary Electrophoresis of proteins; van de Goor, A.A.A.M. in Pharmaceutical Biotechnology Volume 4: Structural Analysis of Proteins; Editors: Crommelin, D.J.A., Herron, J. and Jiskoot, W.; Plenum Publishing Corporation, New York, London, Washington and Boston; in preparation.
13. High sensitivity peptide mapping with capillary electrophoresis - laser induced fluorescence; Beekman P/ACE technical information DS 824; van de Goor, A.A.A.M., Wanders, B.J. and Henzel, W.J., also publisbed in Am. Lab.,
14. The use of a conductivity cel for on-line determination of electroosmotie flow in capillary electrophoresis; van de Goor, A.A.A.M., Wanden;, B.J. and Everaerts, F.M., submitted for publication.
15 Off- and on-line measuring and control system for the electroosmosis in electrophoresis and electrochromatography in open and/or packed tubes; Neth. Appl. 1990, 9 pp. (patent pending) (CA l13(10):90697m); Wanders, B.J., van de Goor, A.A.A.M., Everaerts, F.M. and Cramers, C.A.M.G ..
124
STEl IJ .IN GEN
behorende bij het proefschrift
CAPILLARY ELECTROPHORESIS OF BlOMOLECULES Theory, instrumentation and applications
van
Antonius Albertus Adrianus Maria van de Goor

1 De toepassing van capillaire gel electroforese in het biochemisch laboratorium is nog geen verbetering ten opzichte van het gebruik van vlakke gel electroforese vanwege de onmogelijkheid meerdere monsters gelijktijdig te analyseren en de beperkte mogelijkheden van manipulatie.
2 Het is vaak erg moeilijk scheidingen te reproduceren, welke in de literatuur zijn gepubliceerd, wanneer niet alle scbeidingscondities uitgebreid worden beschreven.
A.S. Cohen, D. Najarian, J.A. Smith en B.L. Karger, J. Chromatogr. 458 (1988) 323-333.
3 Het gebruik van PC's onder DOS geeft een vreemde klank aan het begrip geheugenuitbreiding. 8 Mb RAM geheugen klinkt indrukwekkend maar is vaak zinloos aangezien DOS werkt met 640 kb aan basis geheugen om een programma te laten werken.
4 De detectielimiet bij het gebruik van ultragevoelige detectie methoden, zoals laser geïnduceerde fluorescentie, wordt doorgaans niet bepaald door de hardware maar door de chemie, noodzakelijk voor de derivatisering van verbindingen.
Dit proefschrift, hoofdstuk 4.
5 De reproduceerbaarbeid van een capillaire zone electroforetische scheiding hangt vaak samen met de reproduceerbaarbeid van de electroosmotische flow. De reproduceerbaarbeid van laatstgenoemde kan slechts dan grondig worden bekeken, wanneer de chemie van de dubbellaag beter wordt begrepen.
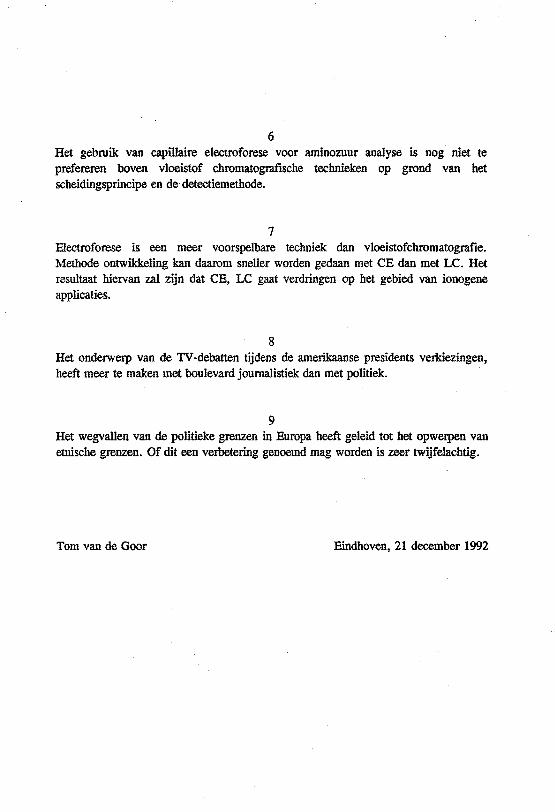
6 Het gebruik van capillaire electroforese voor aminozuur analyse is nog niet te prefereren boven vloeistof chromatogrnfische technieken op grond van het scheidingsprincipe en de detectiemethode.
7 Electroforese is een meer voorspelbare techniek dan vloeistofchromatografie. Methode ontwikkeling kan daarom sneller worden gedaan met CE dan met LC. Het resultaat hiervan zal zijn dat CE, LC gaat verdringen op het gebied van ionogene applicaties.
8 Het onderwerp van de TV·debatten tijdens de amerikaanse presidents verkiezingen, heeft meer te maken met boulevard journalistiek dan met politiek.
9 Het wegvallen van de politieke grenzen in Europa beeft geleid tot het opwerpen van etnische grenzen. Of dit een verbetering genoemd mag worden is zeer twijfelachtig.
Tom van de Goor Eindhoven, 21 december 1992