Embed Size (px)
Citation preview

Student: Nechita LauraCoordinator:Professor Moisă Altăr
A comparison of the exchange rate volatility between Central-Eastern
European Currencies and Euro

Objectives
To approach the volatility of CEE countries (Czech, Hungary, Poland, Slovakia and Romania) exchange rates from the perspective of the permanent and transitory dimensions using Component GARCH model
To explore the question regarding the convergence between CEE economies and Euro area by the comparison of long-run volatility trends in CEE currencies and the Euro

Literature reviewThe studies on exchange rate volatility in major currencies often have used conditional variance measures of volatility and have focused on the analysis of long-run trends in exchange rate volatility.
Pramor and Tamirisa (2006) - a lower degree of commonality within CEE area, which is less than what Black and McMillan(2004) found for major industrial countries in Europe before the introduction of the euro
Kobor and Szekely (2004) - research on a sample of four countries ( Poland, Hungary, Czech and Slovak) during a period of three years (2001-2003), revealing that volatilities were highly variable from one year to another
Horvath (2005) pointed out that excessive exchange rate volatility triggers macroeconomic instability, being perceived as a bad signal by investors
Fidrmuc and Korhonen (2006) reviewed the literature on business cycle correlation between the euro area suggesting that several new Member States have already achieved a comparably high degree of synchronization with the euro area business cycle

Literature review
Beveridge and Nelson (1981) showed that the permanent component is a random
walk with drift and the transitory component is a stationary process
Engle and Lee (1993) applied that decomposition on US and Japanese stock indices
developing a statistical component model (CGARCH) in order to investigate the long-
run and the short-run movement of volatility in the stock market

Data
EUR-CZK, EUR-HUF, EUR-PLN, EUR-RON, EUR-USD
the period January 1999 – June 2009 (except SKK – only the period January 1999-December 2008) with the following sub periods:
the full period: January 1999 – June 2009the late period: January 2004 – December 2008the last semester: January 2009 – June 2009

Data
0.8
0.9
1.0
1.1
1.2
1.3
1.4
1.5
1.6
1.7
99 00 01 02 03 04 05 06 07 08 09
USD
20
24
28
32
36
40
99 00 01 02 03 04 05 06 07 08 09
CZK
220
240
260
280
300
320
99 00 01 02 03 04 05 06 07 08 09
HUF
3.0
3.5
4.0
4.5
5.0
99 00 01 02 03 04 05 06 07 08 09
PLN
1.2
1.6
2.0
2.4
2.8
3.2
3.6
4.0
4.4
99 00 01 02 03 04 05 06 07 08 09
RON
28
32
36
40
44
48
99 00 01 02 03 04 05 06 07 08 09
SKK

Data
All series present unit root
log-differences:
ADF Test & PP Test– the absence of the unit root of the log-
differences
)ln()(ln(*100 1 ttt SSx
Null Hypothesis: D_L_CZK has a unit root Exogenous: Constant Lag Length: 0 (Automatic based on SIC, MAXLAG=27)
t-Statistic Prob.* Augmented Dickey-Fuller test statistic -51.18178 0.0001
Test critical values: 1% level -3.432607 5% level -2.862423 10% level -2.567285
*MacKinnon (1996) one-sided p-values.
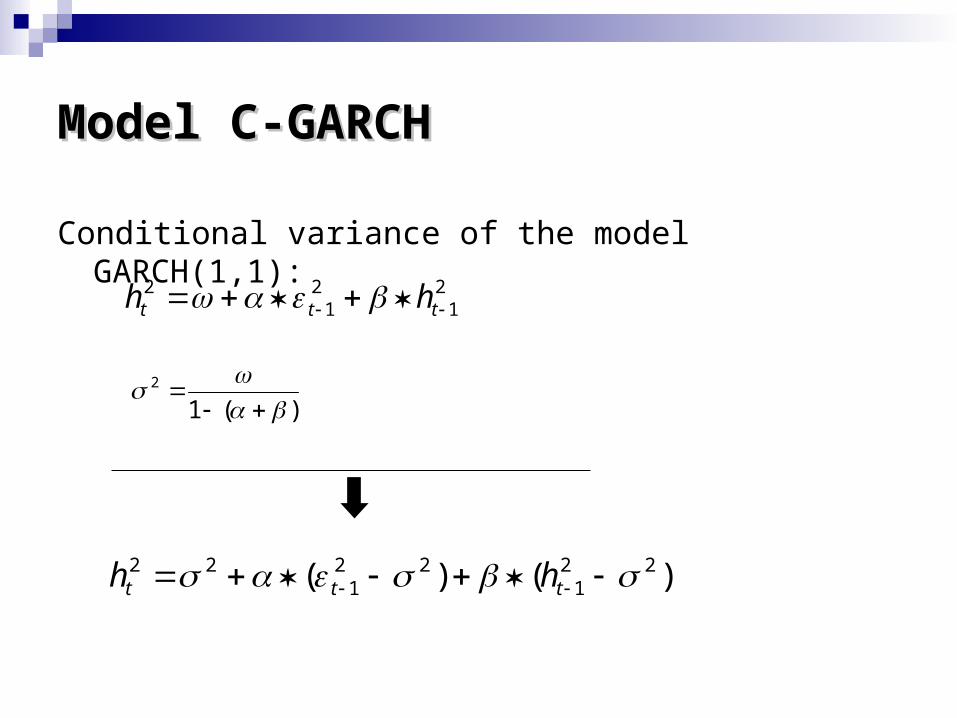
ModelModel C-GARCH C-GARCH
Conditional variance of the model GARCH(1,1):
21
21
2 ttt hh
)(12
)()( 221
221
22 ttt hh

ModelModel C-GARCH C-GARCH
Replacing with a time-varying trend Long run component:
Transitory component:
Constrains :
2 tq
)( 21
21
21
2 tttt hqq
112
112
112
12 )()()( ttttttttt Dqqhqqh
0,
0
10

CGARCH EstimatesCGARCH Estimates Jan99-Dec08
coefficients corresponding to the long-run component are significant at level 1% and higher than the ones associated with the transitory component
the AR coefficient of permanent volatility (ρ) is highly significant (almost 1) and its size exceeds the coefficients of the transitory component => model is stable and long run component tends to be a random walk with drift
PLN and SKK present shocks mostly of transitory nature (the coefficients almost 1)
RON – especially long nature (forrecast error is positive and significant)
Jan1999-Dec 2008 CZK HUF PLN RON SKK EUR
Trend Intercept 0.000015 0.000069 0.000044 0.000412 0.000017 0.000061 ω Trend AR Term 0.981705 0.998972 0.990685 0.999143 0.997584 0.998195 ρ Forrecast Error 0.057896 0.030877 0.062736 0.117011 0.034834 0.027709 φ ARCH Term 0.033464 0.131043 0.059544 0.139125 0.081904 0.023276 α Assymetric Term 0.047886 _ _ _ _ -0.08502 γ GARCH Term 0.693173 0.64983 0.758766 -0.13035 0.835732 0.444306 β
α+β 0.726637 0.780873 0.81831 0.008774 0.917636 0.467582
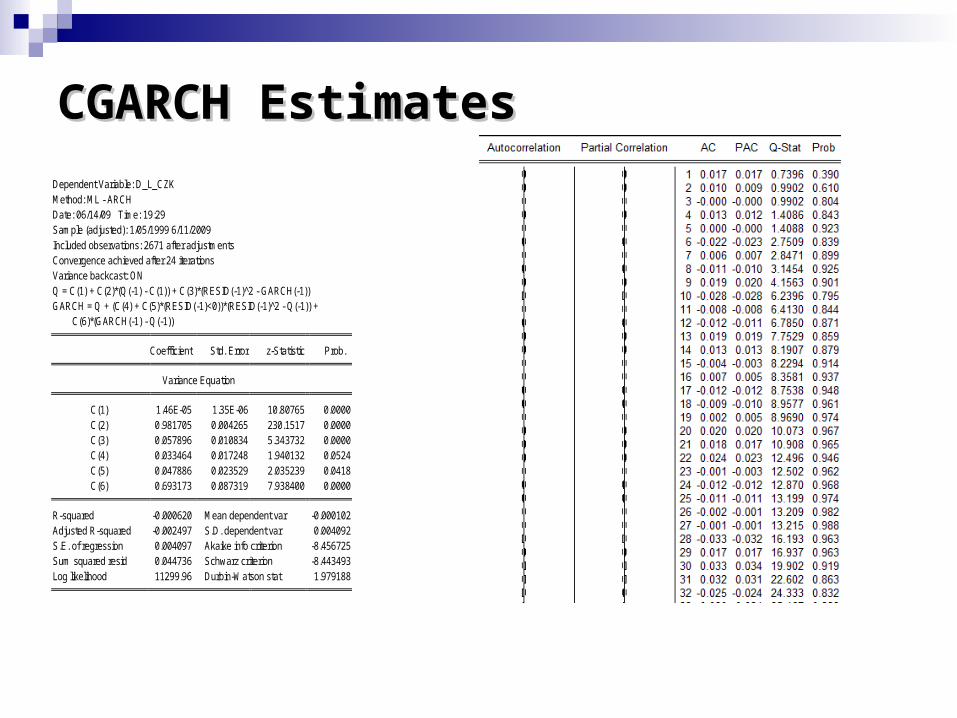
Dependent Variable: D_L_CZK Method: ML - ARCH Date: 06/14/09 Time: 19:29 Sample (adjusted): 1/05/1999 6/11/2009 Included observations: 2671 after adjustments Convergence achieved after 24 iterations Variance backcast: ON Q = C(1) + C(2)*(Q(-1) - C(1)) + C(3)*(RESID(-1)^2 - GARCH(-1)) GARCH = Q + (C(4) + C(5)*(RESID(-1)<0))*(RESID(-1)^2 - Q(-1)) + C(6)*(GARCH(-1) - Q(-1))
Coefficient Std. Error z-Statistic Prob. Variance Equation
C(1) 1.46E-05 1.35E-06 10.80765 0.0000 C(2) 0.981705 0.004265 230.1517 0.0000 C(3) 0.057896 0.010834 5.343732 0.0000 C(4) 0.033464 0.017248 1.940132 0.0524 C(5) 0.047886 0.023529 2.035239 0.0418 C(6) 0.693173 0.087319 7.938400 0.0000
R-squared -0.000620 Mean dependent var -0.000102
Adjusted R-squared -0.002497 S.D. dependent var 0.004092 S.E. of regression 0.004097 Akaike info criterion -8.456725 Sum squared resid 0.044736 Schwarz criterion -8.443493 Log likelihood 11299.96 Durbin-Watson stat 1.979188
CGARCH EstimatesCGARCH Estimates
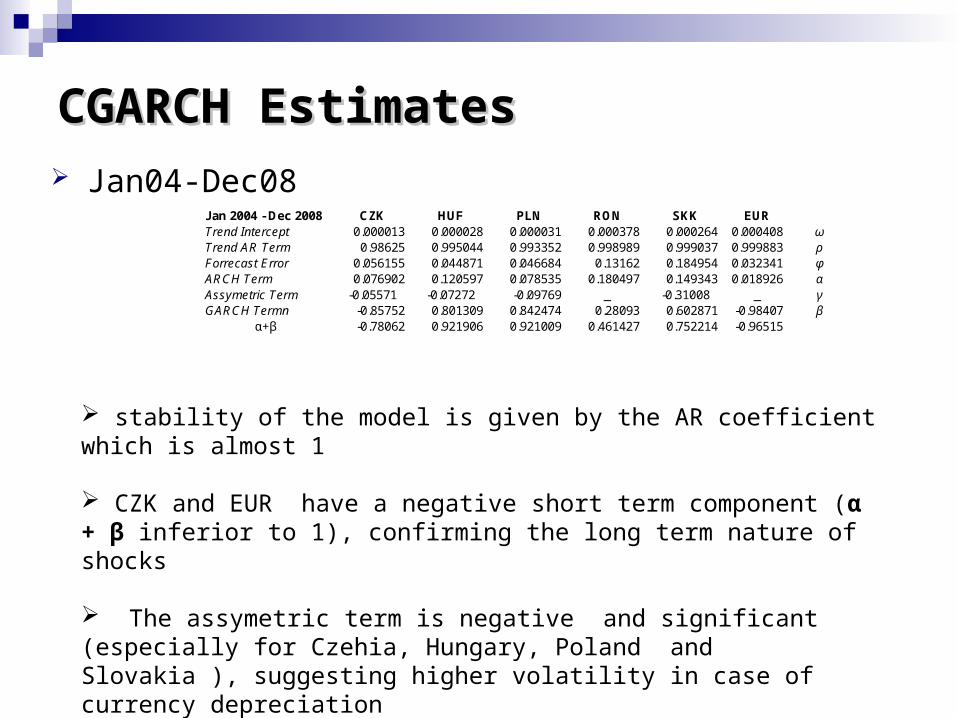
CGARCH EstimatesCGARCH Estimates Jan04-Dec08
Jan 2004 - Dec 2008 CZK HUF PLN RON SKK EUR Trend Intercept 0.000013 0.000028 0.000031 0.000378 0.000264 0.000408 ω Trend AR Term 0.98625 0.995044 0.993352 0.998989 0.999037 0.999883 ρ Forrecast Error 0.056155 0.044871 0.046684 0.13162 0.184954 0.032341 φ ARCH Term 0.076902 0.120597 0.078535 0.180497 0.149343 0.018926 α Assymetric Term -0.05571 -0.07272 -0.09769 _ -0.31008 _ γ GARCH Termn -0.85752 0.801309 0.842474 0.28093 0.602871 -0.98407 β
α+β -0.78062 0.921906 0.921009 0.461427 0.752214 -0.96515
stability of the model is given by the AR coefficient which is almost 1
CZK and EUR have a negative short term component (α + β inferior to 1), confirming the long term nature of shocks
The assymetric term is negative and significant (especially for Czehia, Hungary, Poland and Slovakia ), suggesting higher volatility in case of currency depreciation
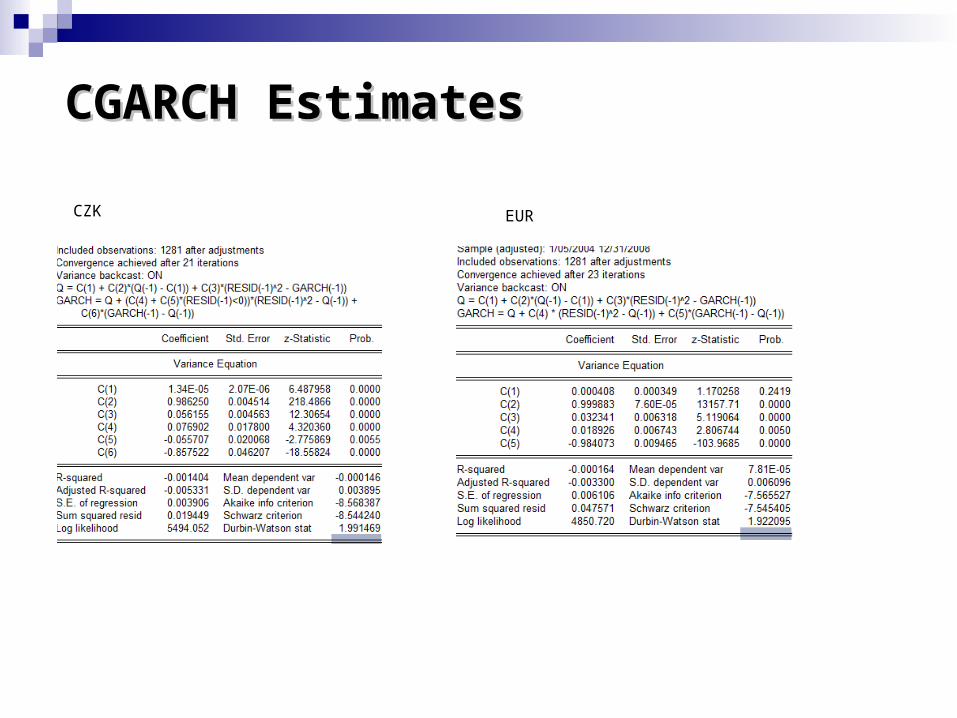
CGARCH EstimatesCGARCH Estimates
CZK EUR
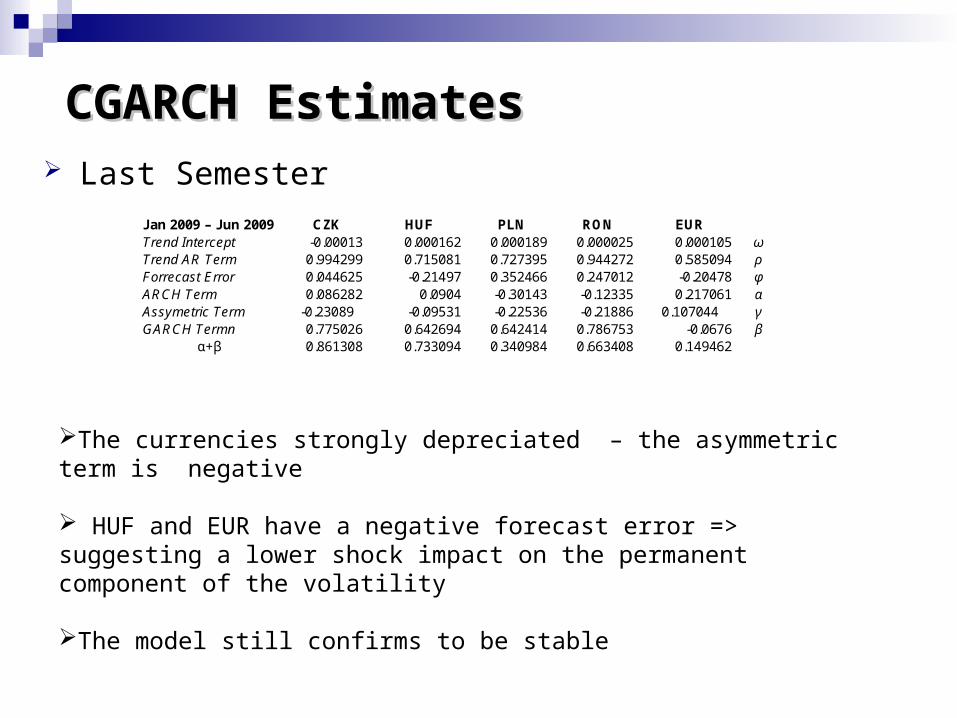
Last Semester
The currencies strongly depreciated – the asymmetric term is negative
HUF and EUR have a negative forecast error => suggesting a lower shock impact on the permanent component of the volatility
The model still confirms to be stable
CGARCH EstimatesCGARCH Estimates
Jan 2009 – Jun 2009 CZK HUF PLN RON EUR Trend Intercept -0.00013 0.000162 0.000189 0.000025 0.000105 ω Trend AR Term 0.994299 0.715081 0.727395 0.944272 0.585094 ρ Forrecast Error 0.044625 -0.21497 0.352466 0.247012 -0.20478 φ ARCH Term 0.086282 0.0904 -0.30143 -0.12335 0.217061 α Assymetric Term -0.23089 -0.09531 -0.22536 -0.21886 0.107044 γ GARCH Termn 0.775026 0.642694 0.642414 0.786753 -0.0676 β
α+β 0.861308 0.733094 0.340984 0.663408 0.149462

Permanent vs. transitory componentPermanent vs. transitory component
Hodrick Prescott Filter
-.00005
.00000
.00005
.00010
.00015
.00020
.00025
99 00 01 02 03 04 05 06 07 08
Cond_var_CZK Perm_CZK Trans_CZK
-.0001
.0000
.0001
.0002
.0003
.0004
.0005
.0006
99 00 01 02 03 04 05 06 07 08
Cond_var_HUF Perm_HUF Trans_HUF
-.0002
-.0001
.0000
.0001
.0002
.0003
.0004
.0005
99 00 01 02 03 04 05 06 07 08
cond_var_pln perm_pln trans_pln
-.001
.000
.001
.002
.003
.004
99 00 01 02 03 04 05 06 07 08
cond_var_ron perm_ron trans_ron
-.00002
.00000
.00002
.00004
.00006
.00008
.00010
.00012
.00014
99 00 01 02 03 04 05 06 07 08
cond_var_skk perm_skk trans_skk
-.00010
-.00005
.00000
.00005
.00010
.00015
.00020
.00025
99 00 01 02 03 04 05 06 07 08
cond_var_eur perm_eur trans_eur
Permanent vs. transitory componentPermanent vs. transitory component
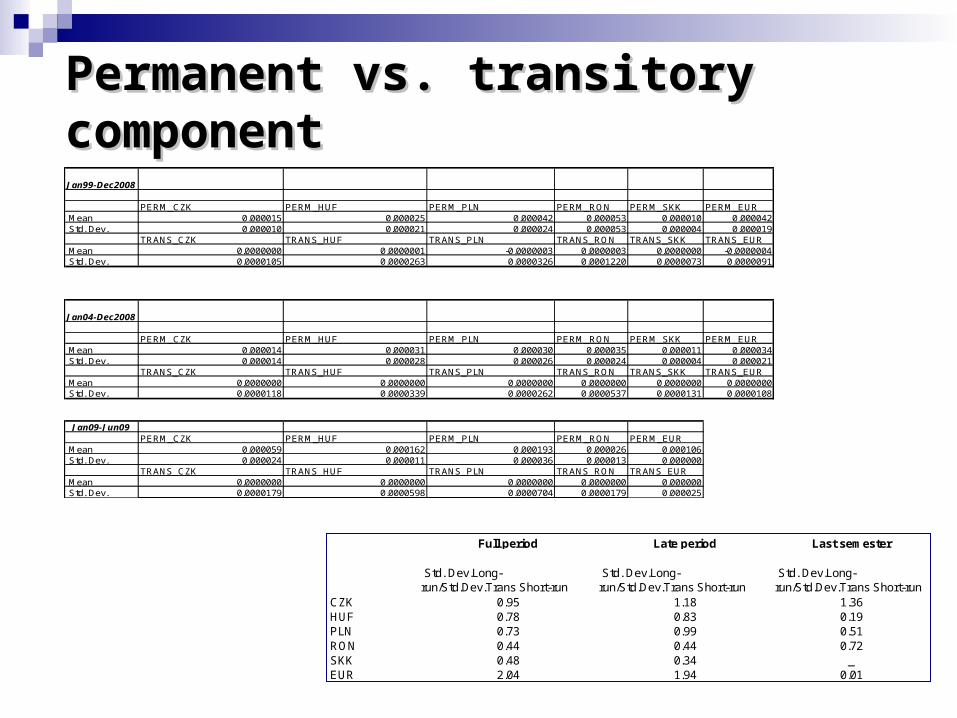
Jan99-Dec2008
PERM_CZK PERM_HUF PERM_PLN PERM_RON PERM_SKK PERM_EUR Mean 0.000015 0.000025 0.000042 0.000053 0.000010 0.000042 Std. Dev. 0.000010 0.000021 0.000024 0.000053 0.000004 0.000019
TRANS_CZK TRANS_HUF TRANS_PLN TRANS_RON TRANS_SKK TRANS_EUR Mean 0.0000000 0.0000001 -0.0000003 0.0000003 0.0000000 -0.0000004 Std. Dev. 0.0000105 0.0000263 0.0000326 0.0001220 0.0000073 0.0000091
Jan04-Dec2008
PERM_CZK PERM_HUF PERM_PLN PERM_RON PERM_SKK PERM_EUR Mean 0.000014 0.000031 0.000030 0.000035 0.000011 0.000034 Std. Dev. 0.000014 0.000028 0.000026 0.000024 0.000004 0.000021
TRANS_CZK TRANS_HUF TRANS_PLN TRANS_RON TRANS_SKK TRANS_EUR Mean 0.0000000 0.0000000 0.0000000 0.0000000 0.0000000 0.0000000 Std. Dev. 0.0000118 0.0000339 0.0000262 0.0000537 0.0000131 0.0000108
Jan09-Jun09PERM_CZK PERM_HUF PERM_PLN PERM_RON PERM_EUR
Mean 0.000059 0.000162 0.000193 0.000026 0.000106 Std. Dev. 0.000024 0.000011 0.000036 0.000013 0.000000
TRANS_CZK TRANS_HUF TRANS_PLN TRANS_RON TRANS_EUR Mean 0.0000000 0.0000000 0.0000000 0.0000000 0.000000 Std. Dev. 0.0000179 0.0000598 0.0000704 0.0000179 0.000025
Full period Late period Last semester
Std. Dev.Long-run/Std.Dev.Trans Short-run
Std. Dev.Long-run/Std.Dev.Trans Short-run
Std. Dev.Long-run/Std.Dev.Trans Short-run
CZK 0.95 1.18 1.36HUF 0.78 0.83 0.19PLN 0.73 0.99 0.51RON 0.44 0.44 0.72SKK 0.48 0.34 _EUR 2.04 1.94 0.01
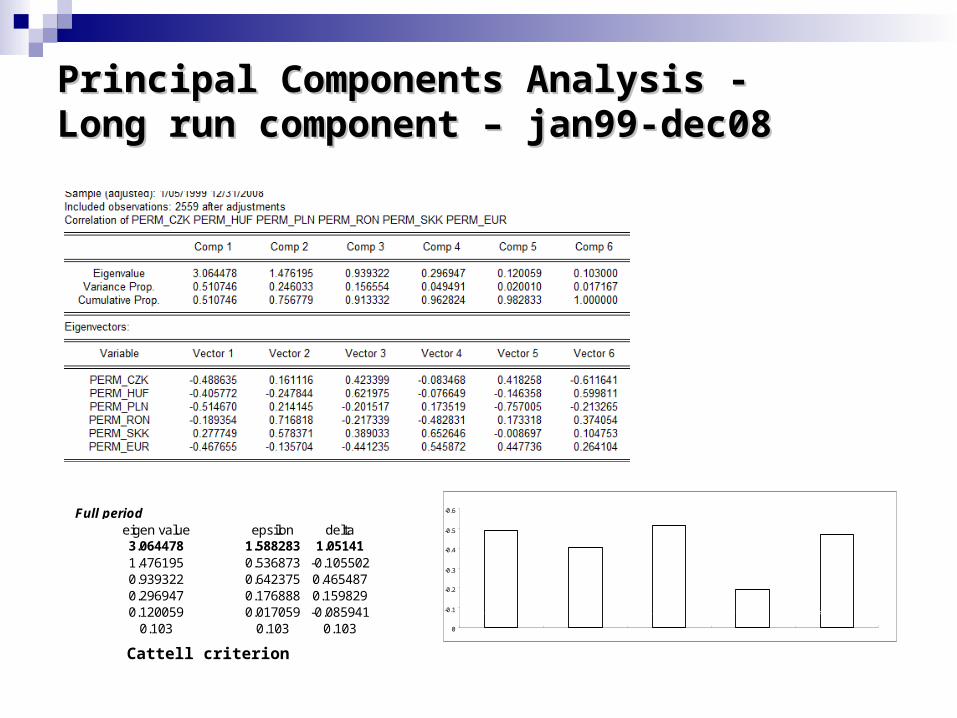
Principal Components Analysis - Long run Principal Components Analysis - Long run component – jan99-dec08component – jan99-dec08
Cattell criterion
-0.6
-0.5
-0.4
-0.3
-0.2
-0.1
0
PERM_CZK
PERM_HUF
PERM_PLN
PERM_RO
N
PERM_EUR
Full periodeigen value epsilon delta3.064478 1.588283 1.051411.476195 0.536873 -0.1055020.939322 0.642375 0.4654870.296947 0.176888 0.1598290.120059 0.017059 -0.085941
0.103 0.103 0.103

Pairwise Covariance Matrix - Long run Pairwise Covariance Matrix - Long run component –jan99-dec08component –jan99-dec08
the weights on the first component are similar in sigh and absolute value => the common trend for the currencies CZK, PLN and EUR
the covariance matrix underlines also the same couples : CZK, PLN and EUR
the same conclusion Fidrmuc&Korhonen(2006) si Kobor&Szekely(2004)
The model still confirms to be stable

Principal Components Analysis - Long run Principal Components Analysis - Long run component – jan04-dec08component – jan04-dec08
-0.5
-0.45
-0.4
-0.35
-0.3
-0.25
-0.2
-0.15
-0.1
-0.05
0
PERM_CZK
PERM_HUF
PERM_PLN
PERM_RON
PERM_EUR

Pairwise Covariance Matrix - Long run Pairwise Covariance Matrix - Long run component –jan04-dec08component –jan04-dec08
both methods confirm the same trend for the currencies:
CZK- HUF- PLN – EUR
the same correlation was found by: Horvath(2007): CZK-PLN
Kobor&Szekely(2006): PLN-HUF

Principal Components Analysis - Long run Principal Components Analysis - Long run component – jan09-jun09component – jan09-jun09
-0.6
-0.4
-0.2
0
0.2
0.4
0.6
PERM_CZK
PERM_HUF
PERM_PLN
PERM_RON
PERM_EUR
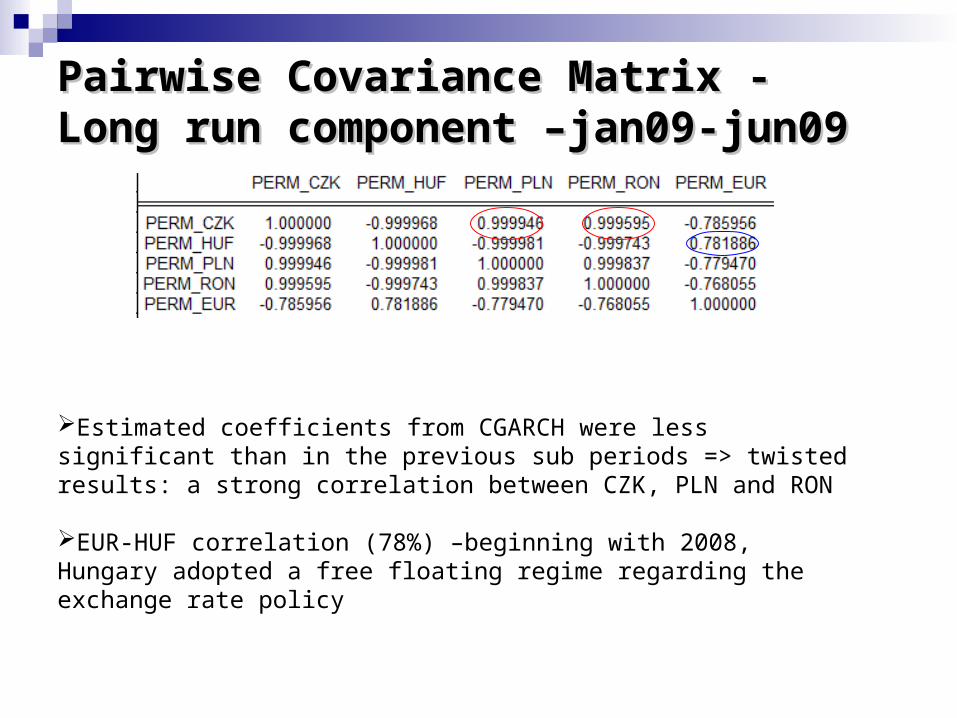
Pairwise Covariance Matrix - Long run Pairwise Covariance Matrix - Long run component –jan09-jun09component –jan09-jun09
Estimated coefficients from CGARCH were less significant than in the previous sub periods => twisted results: a strong correlation between CZK, PLN and RON
EUR-HUF correlation (78%) –beginning with 2008, Hungary adopted a free floating regime regarding the exchange rate policy
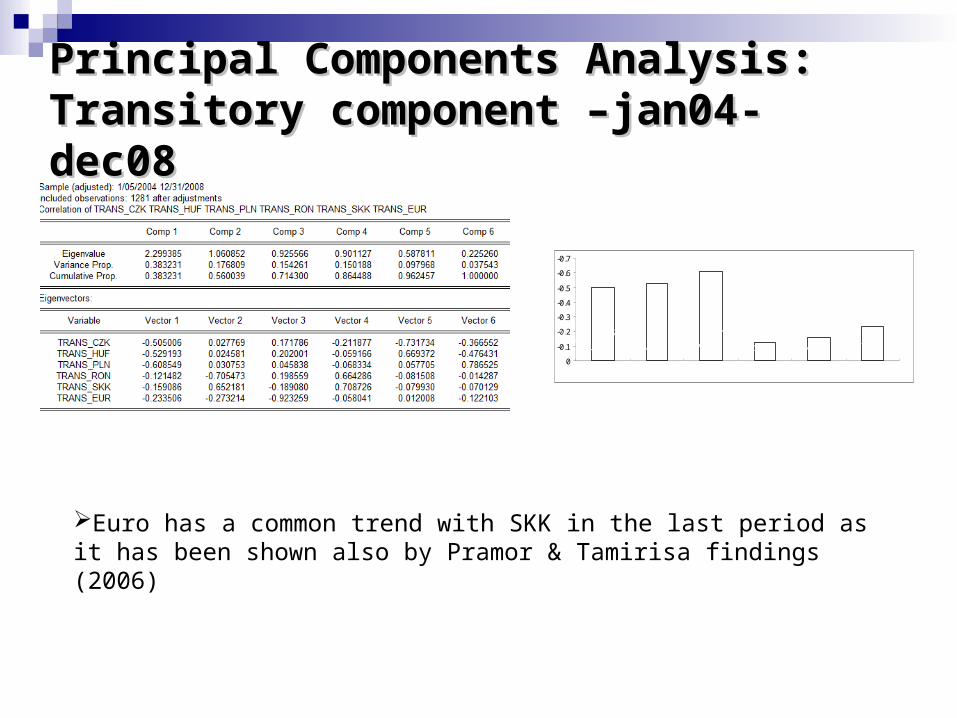
Principal Components Analysis: Transitory Principal Components Analysis: Transitory component –jan04-dec08component –jan04-dec08
-0.7
-0.6
-0.5
-0.4
-0.3
-0.2
-0.1
0
TRANS_CZK
TRANS_HUF
TRANS_PLN
TRANS_RON
TRANS_SKK
TRANS_EUR
Euro has a common trend with SKK in the last period as it has been shown also by Pramor & Tamirisa findings (2006)

-0.8
-0.6
-0.4
-0.2
0
0.2
0.4
0.6
0.8
Principal Components Analysis: Transitory Principal Components Analysis: Transitory component –jan09-jun09component –jan09-jun09
For the last semester, we can not conclude about the common trend between the currencies based on the transitory component
Permanent component coefficients were positive and higher than the ones corresponding to the transitory component, reflecting the fact that permanent volatility component is stronger than the short term one
The dispersion and overall variability of weights for the short-run component are significantly higher than for the long-run component – not surprisingas the short-run component of volatility reflects transitory and unsystematic disturbances
The most volatility components (both for the permanent component and transitory one) belong to Romania while the lowest one to Slovakia.
For the full period, the weights of the first component revealed that Czech koruna, Polish Zloty and Euro have similar long term volatility component
SKK seemed to have a common trend with euro in the last period
Romanian currency is slowly correlated not only with the other CEE currencies but also with euro .
Conclusions

References Beveridge, S. and C. R. Nelson (1981), “A New Approach to Decomposition of Economic Time Series into
Permanent and Transitory Components with Particular Attention to Measurement of the ‘Business Cycle’, Journal of Monetary Economics, Vol. 7, 151–74.
Black, Angela J. and D.G.McMillan (2004), “Long-Run Trends and Volatility Spillovers in Daily Exchange Rates”, Applied Financial Economics, Vol.14, 895-907
Bollerslev, T. (1986), “Generalized Autoregressive Conditional Heteroskedasticity,” Journal of Econometrics, Vol. 31, 307–27.
Engle, R.F. and G.G.J Lee (1993), “A Permanent and Transitory Component Model of Stock Return Volatility”, Discussion Paper 92-44R, University of California, San Diego
Engle, Robert F. (1982), “Autoregressive Conditional Heteroscedasticity with Estimates for the Variance of United Kingdom Inflation,” Econometrica, Vol. 50, No. 4, 987–1008.
Fidrmuc, J. and I. Korhonen (2006), “Meta-analysis of Business Cycle Correlation between the Euro Area and the CEECs,” Journal of Comparative Economics, 34, 518–537
Fidrmuc, J. and R. Horvath (2007), “Volatility of Exchanges Rates in Selected New EU Members: Evidence from Daily Data”, CESifo Working Paper No.2107, 10/2007
Horvath, R. (2005), “Exchange Rate Variability, Pressures and Optimum Currency Area Criteria: Implications for the Central and Eastern European Countries,” CNB Working Paper No. 8 (Czech Republic: Czech National Bank).
Kóbor, A. and I. P. Székely (2004), “Foreign Exchange Market Volatility in EU Accession Countries in the Run-Up to Euro Adoption: Weathering Uncharted Waters,” Economic Systems, 28(4), 337–352
Mundell, R. (1961), “A Theory of Optimum Currency Areas,” American Economic Review, Vol. 51, 657–65.
Pramor, M. and N.T. Tamirisa (2006), “Common Volatility Trends in the Central and Eastern European Currencies and the Euro”, IMF Working Paper, 06/2006
Schnabl, G. (2007), “Exchange rate Volatility and Growth in Small Open Economies at the EMU Periphery”, ECB Working Paper No. 773, 07/2007