Embed Size (px)
Citation preview
A COMPARISON OF TECHNOLOGY LITERACY BETWEEN SEVENTH AND
EIGHTH GRADE STUDENTS IN A MIDDLE SCHOOL TECHNOLOGY
EDUCATION PROGRAM
by
Alona S. Paydon
A Research Paper
Submitted in Partial Fulfillment of the Requirements for the
Master of Science Degree With a Major in
Technology Education
Approved: 2 Semester Credits
___________________________________ Investigation Advisor
The Graduate School University of Wisconsin-Stout
May, 2002
2
The Graduate School University of Wisconsin-Stout
Menomonie, WI 54751
ABSTRACT
Paydon Alona S. (Writer) (Last Name) (First) (Initial)
A Comparison Study of Technology Literacy between Seventh and Eighth Grade (Title)
Students in a Middle School Technology Program.
Technology Education Dr. Howard Lee May 2002 66 (Graduate Major) (Research Advisor) (Month/Year) (No. Of Pages)
American Psychological Association Style Manual 5th Edition (Style Manual Used)
Technology education has a task at hand that is crucial, to create individuals that
are technologically literate for the 21st century. Students involved in technology
education classes have the opportunity of very diverse experiences. They work as teams
to study problem–solving activities, learn about technological systems, use math, science,
language arts and many skills to resolve issues that occur in the real world. It is our
charge to be certain that all students gain the understanding necessary to thrive in the
human made world. As early and often as they are exposed to technological concepts the
better equipped they will be to live in our ever-changing society.
The purpose of this study was to determine the technological concepts of seventh
and eighth grade students at River Bluff Middle School. Those concepts were then
measured against the Wisconsin Model Academic Standards and analyzed by gender. The
3
students were a cluster grouping that took the class in both grades. All students used a
pretest/posttest as an evaluation tool for the technology education class.
By analyzing the results of this study the researcher realized the importance of
how it can be utilized in the future for further study. The findings led to conclusions and
recommendations for implementing ways to assess what our students should know and be
able to do to become technologically literate.
4
ACKNOWLEDGEMENTS
I would like to thank Dr. Lee for his wisdom and support and the ever-motivating
reminder that life is too short. It has been a journey that I must thank my family for riding
along with me on, the bumps and all, on more than one occasion.
Thank you to my husband Bob, my sons Evan and Coy who are my shining stars,
and my colleagues who kept me going at this endeavor with wit and patience.
5
TABLE OF CONTENTS
Page
Abstract……………………………………………………………. 2 Acknowledgements…………………..……………………………. 3 CHAPTER ONE…………………………………………………... 8
Introduction………………………………………………... 8 Background of the Problem….…………………………….. 8 The Community……………………………………………. 10 Statement of the Problem…………………………………... 11 Research Objectives.……………………………………….. 12
Limitations of the Study.…………………………………… 13 Significance of the Study.………………………………….. 14 Definitions of Terms……….………………………………. 14
CHAPTER TWO..…………………………………………………. 16
Review of Literature………………………………………… 16 Introduction..………………………………………………... 16 Technology Education………………………………………. 17 Standards…………………………………………………….. 19 Wisconsin Model Standards…………………………………. 21 Technology Literacy and Gender.……………………………. 21
CHAPTER THREE………………………………………………….. 24
Methods and Procedures..……………………………………. 24 Subjects………………………………………………………. 24 Research Design……………………………………………… 25 Instrument……………………………………………………. 25 Procedures……………………………………………………. 25 Methods of Analysis…………………………………………. 26 Limitations of Study…………………………………………. 26
CHAPTER FOUR……………………………………………………. 28 Results and Discussions………………………………………. 28 Introduction…………………………………………………… 28 Demography of Respondents…………………………………. 28
Data Analysis and Discussion ..………………………………. 29 T-test Analysis………………………………………………… 30 Summary…………………………………………………….... 36
6
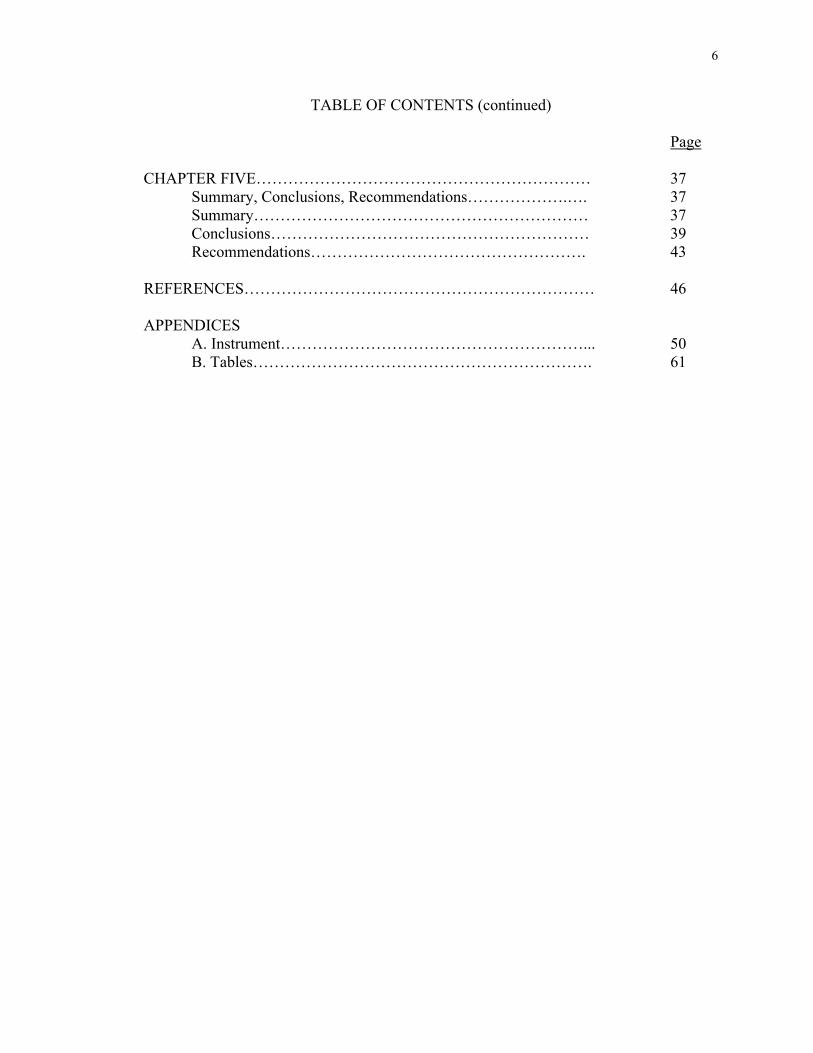
TABLE OF CONTENTS (continued) Page CHAPTER FIVE……………………………………………………… 37
Summary, Conclusions, Recommendations……………….…. 37 Summary……………………………………………………… 37 Conclusions…………………………………………………… 39 Recommendations……………………………………………. 43
REFERENCES………………………………………………………… 46 APPENDICES
A. Instrument…………………………………………………... 50 B. Tables………………………………………………………. 61
7
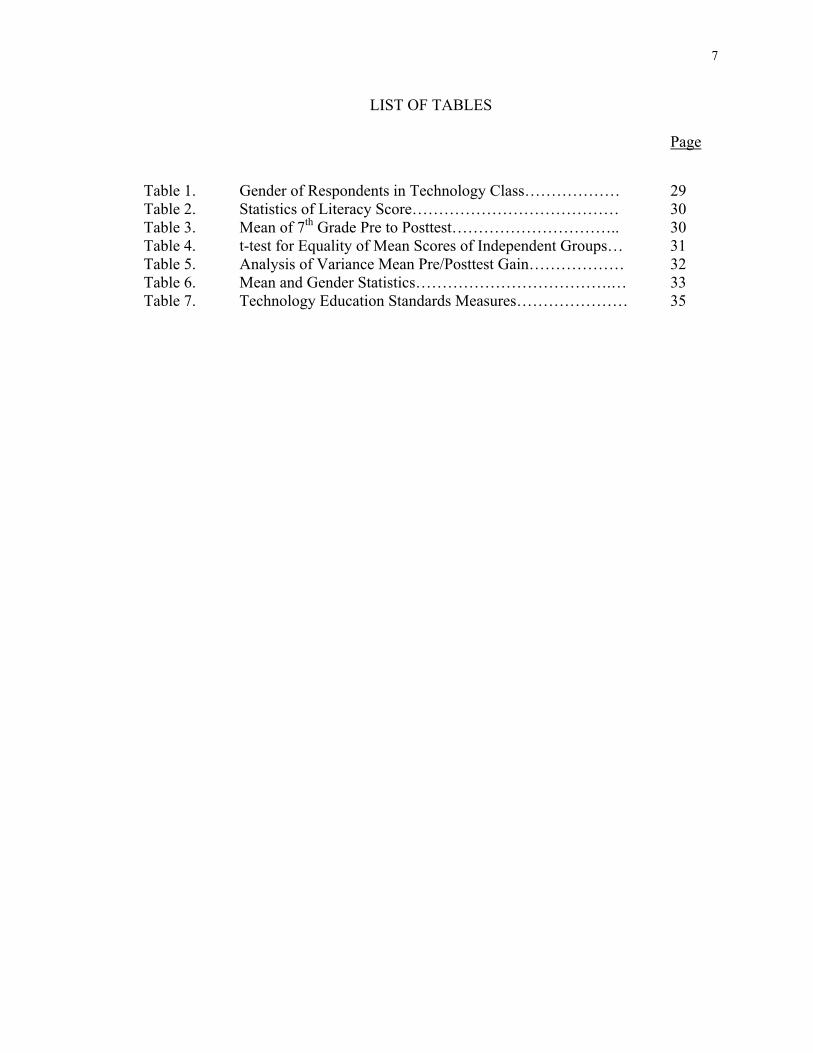
LIST OF TABLES Page Table 1. Gender of Respondents in Technology Class……………… 29 Table 2. Statistics of Literacy Score………………………………… 30 Table 3. Mean of 7th Grade Pre to Posttest………………………….. 30 Table 4. t-test for Equality of Mean Scores of Independent Groups… 31 Table 5. Analysis of Variance Mean Pre/Posttest Gain……………… 32 Table 6. Mean and Gender Statistics……………………………….… 33 Table 7. Technology Education Standards Measures………………… 35
8
CHAPTER ONE
Introduction
Background of the Problem
Today’s society and school systems are being changed by the rapid progress in
existing or new technologies. The impacts of this enormous advancement have directly
affected programs in Wisconsin School Districts. Many programs have changed their
focus of instruction from industrial arts to technology education. Industrial arts is a
subject of study aimed at developing the manual and technical skills required to work
with tools and machinery. Technology education provides an opportunity for students to
learn about the processes related to systems that are needed to solve problems and use the
outcomes of that knowledge in a productive means.
Society has moved into the information age and the workplace looks significantly
different today. Education and knowledge is key for today’s jobs as opposed to the
physicality that jobs required in the past (Stables, 1996). The National Science
Foundation and the National Aeronautics and Space Administration recently awarded
over $1 million for the establishment of the Technology For All Americans project,
Project 2061, whose members have developed standards for Kindergarten-12 technology
education in the U.S. These standards are predicated on the view that technology
education is a school subject with "quantifiable and universal" content (Dugger, Bame,
Pinder, & Miller, 1985). Those standards were developed as a guide for educating
students in developing technological literacy. Technological literacy means the ability to
use, manage, assess, and understand technology.
9
Considering that this knowledge is a necessity for all people in society and the
primary goal of today’s schools is to prepare youth for the world in which they will live
in after completing formal education. It becomes necessary that our schools give every
student an insight and understanding of the technological aspects of our culture. It is
particularly important that people are comfortable with the concepts of modern
technology. There is technology at home, the workplace and school.
One critical question arises. When should young learners be exposed to the study
of technology education? Instead of introducing it at the seventh grade level, one answer
is as early as possible in the school curriculum. Kindergarten-6 is where general
education literacy is nurtured about the world of work, society, environmental/ecological
issues, consumerism, global trends and concerns, futuristic and career choices, to name a
few.
There are many reasons for integrating the world of technology into the
elementary school setting. Foremost is the development of positive attitudes toward work
and its importance to family and society. Information dealing with career education, sex
equity, and the impact of modern industry and technology on our existing way of life
should also be stressed with children at this critical period in their formal education.
(DeVore, 1980). This is a path for technological literacy.
A review of the literature shows that technological literacy is important to society.
Studies have also shown that favorable attitudes toward a program can lead to a greater
understanding about that program. Attitudes are assumed to be precursors of behavior. If
a person is favorably predisposed toward a brand or service, that favorable predisposition
should lead to favorable behaviors with respect to the brand, service, or program (Hatzios
10
1996). Students who have had technology education curriculum integrated throughout
their elementary education will have a better developed technology education
understanding at the Middle School level and may elect to take more technology
education classes at the high school level.
The Community
The Stoughton school district is located in Stoughton Wisconsin. Stoughton,
Wisconsin, is a thriving community of 12,354 pleasant residents. The city is about 20
miles southeast of Madison, the capital of the State of Wisconsin. The city’s main
industries are Stoughton Trailers, Ortega and Nelson Industries Inc. It is a rural
community with Norwegian roots. Each year on May 17th – May 19th the town celebrates
Norwegian Constitution Day with a Syttende Mai Folk Festival.
The entire Stoughton school district has 3650 students enrolled in Early childhood
through grade twelve. As of April 1, 2001 the district, including Guidance Counselors,
employed two hundred eighty two teachers. Stoughton has eighteen fulltime
Administrators including the Superintendent and a halftime Administrator.
In the Stoughton School District in 1997-1998 school year two new schools were
built. Prior to that the district had three elementary schools, a 6-8 middle school and a 9-
12 high school. Now the configuration is three Kindergarten-4 schools; a new 5-6 school
was built, as well as a 7-8 middle school with updates at the high school. The new
arrangement directly affected the technology education program. Traditionally the
technology education program was a 6-12 curriculum. Now the configuration is 7-12 and
was changed in 1997 because the position at the sixth grade level became halftime and
Administration did not feel a halftime Technology Education teacher would emerge.
11
Instead Administration at the 5-6 school changed the name of the class to Problem
Solving with Technology and hired an elementary teacher who would not be required to
become certified in Technology Education. The official district 5-8 grade level objectives
as of 2002 list technology education concepts being taught at the sixth grade level. In the
future they will be called benchmarks in alignment with state standards instead of
objectives for less confusion to the parents and community due to current adoption and
discussion about state standards. The technological literacy of seventh and eighth grade
students at River Bluff Middle School has never been determined.
Statement of the Problem
The purpose of this study is to determine the technological literacy concepts of
seventh and eighth grade students in the Stoughton Area School District. The
technological literacy concepts will then be matched against the Wisconsin Model
standards and the differences based on gender.
Standards are a relatively new method of assessing what all children should know
and be able to do with technology. Technology educators are beginning to align their
objectives to those standards. Because the standards are addressing the needs of all
students Kindergarten-12, research needs to be done on programs and how they are
addressing the curriculum using standards. If our outcomes for our students are
represented in the standards then our programs need to have a consistent alignment with
the Wisconsin standards and be reflected in the ITEA standards.
The pretest/posttest will be based on the outcomes students must know and be
able to do with technology at the end of eighth grade and aligned with the Wisconsin’s
model of standards. For example, if an outcome is to know and be able to use a metric
12
ruler and an English scale ruler, yet only 8% of the incoming students have that
knowledge then that part of the curriculum needs to be integrated at least at the sixth
grade level because it is an expected seventh grade skill. The sixth grade students will not
be tested but the results of the seventh grade study will be collected and offered as a basis
for curriculum at the sixth grade level.
Though the Technology Education Department of River Bluff Middle School
does not presently seek to comprehensively overhaul the existing curriculum, it is clearly
apparent that some changes have to be made and gain a better understanding and
alignment of what all students should know and be able to do to become technologically
literate. Paniagua (1999) stated: The results of this study will allow teachers to identify if
their current teaching practices are in alignment with student perceptions of and interests
in technology. The study may also provide a basis from which Technology Education
teachers may extend the research to study a specific area of technology curriculum in
their school.
The Wisconsin Academy Staff Development Initiative developed the survey
instrument used in this study for technology education lead teachers in that program. It
has not been pilot tested but was developed by the expertise of lead teachers in the
WASDI program. The National Science Foundation and Wisconsin legislative monies
have funded the seven-year program. It is an integrated approach merging science, math
and technology education teachers and cutting edge concepts to educate and innovate
teachers and students throughout the state.
Research Objectives
This study will focus on the following objectives:
13
1. Identify the level of technology literacy of incoming seventh grade students in
technology education classes.
2. Identify the level of technology literacy of continuing 8th grade students in
technology education classes.
3. Identify the differences in technology literacy based on gender.
4. Determine the extent the technological literacy concepts identified are aligned
to the Wisconsin’s model of academic standards.
5. Determine if there is a difference of technology literacy gained at the end of
seventh and eighth grade.
Limitations of the Study
For this study several limitations will need to be considered when looking at the
overall results of the research. The limitations are listed below:
1. The study was limited to seventh and eighth grade students at River Bluff
Middle School.
2. The students selected were not randomly selected; they were selected by the
cluster method.
3. The students may not respond to every question.
4. The moods, attitudes, and physical condition of the students on the days of the
pretest/posttest.
5. The validity of the instrument.
6. The time of the day and the time of the year the pretest/posttest were
administered. Students taking the test at the end of the year may have an
advantage over first quarter students.
14
Significance of the Study
The rationale for the study is to identify if there is a difference in the achievement
level of technology literacy of students who have been taught the technological concepts
at the seventh grade level and eighth grade level and the extent of alignment at the
seventh eighth grade level of those concepts with the Wisconsin standards.
Definition of Terms
Curriculum: The composite array of learning experience provided by an
institution or department (Goetsch and Nelson, 1987).
Technology: The use of our knowledge, tools, and skills to solve practical
problems, and to extend human capabilities (Goetsch and Nelson, 1987).
Technology Education: A course of study with a content that focuses on the
knowledge, tools, processes, and systems of technology in society.
Project 2061: Project 2061 is the long-term initiative of the American Association
for the Advancement of Science working to reform K-12 science, mathematics, and
technology education nationwide.
Standards for Technological Literacy: Content for the Study of Technology
(Technology Content Standards) was published by the International Technology
Education Association (ITEA) and its Technology for All Americans Project (TfAAP) in
April 2000. It defines what students should know and be able to do in order to be
technologically literate and provides standards that prescribe what the outcomes of the
study of technology in grades K-12 should be.
Wisconsin Technology Education Standards: The state superintendent and
legislature must ensure that all children have equal access to high quality education

15
programs. At a minimum, this requires clear statements of what all children in the state
should know and be able to do as well as evidence that students are meeting these
expectations. Furthermore, academic standards form a sound basis on which to establish
the content of a statewide assessment system.
Wisconsin Academy Staff Development Initiative: The Wisconsin Academy Staff
Development Initiative is designed to shape and improve K-12 grade mathematics,
science and technology education throughout the state of Wisconsin with a five-year six
million dollar National Science Foundation grant. The mission of the program is to
advance mathematics, science and technology education and demonstrate the application
and integration of the disciplines as they are in the world outside of education.
16
CHAPTER TWO
Review of Literature
The following review of literature will deal briefly with the paradigm shift from
industrial arts to technology education. It will also look at the national and state standards
on technology education and how they enhance a Kindergarten -12 curriculum. Though
gender is not the focus of this paper it is relevant to take a look at women’s (girls’)
literacy in an overview context. Technology literacy initiatives will be researched as well.
Introduction
Industrial arts courses began being taught at the elementary school level during
the latter part of the 19th century (Miller, 1974). Industrial arts in the elementary schools
received a great deal of attention in the 1960s and 1970s. Miller (1974) called the rapid
changes in curriculum, instructional methodology, materials, and technology
"unprecedented." A plethora of curriculum initiatives were made in those two decades,
such as the Technological Exploratorium for Kindergarten - 6 in Ohio, the New Jersey
Technology For Children Project (T4CP), and Florida's Project Loom (Heasley, 1974). In
the earliest days industrial arts was mainly to develop vocational skills or "to provide for
constructive use of leisure time" (Gerbracht & Babcock, 1959, p. 6). Many states have
redefined that and renamed their programs, Wisconsin being one of them.
The concept of technology education is defined as an integrated, experience-based
instructional program designed to prepare students to be knowledgeable about
technology, its evolution, systems, technologies, utilization, and social and cultural
significance. It results in the application of mathematics and science concepts to
technological systems in areas such as, but not limited to: construction, manufacturing,
17
communications, transportation, biotechnology, and power and energy. Students are
challenged to discover, create, solve problems, and construct solutions by using a variety
of tools, machines, computer systems, materials, processes and technological systems.
Technology education programs are among the first to demonstrate an integrated
approach to learning. (National Academy of Engineering and National Research Council,
2002).
The establishment of the Technology For All Americans project developed
standards to build a sophisticated understanding and ability for students as they mature
during their educational experience. The creation of this framework for learning is to
guide student learning from kindergarten through grade 12. There is also a report and
website (<www.nae.edu/techlit>). Both were a part of a two-year study from a group of
experts of wide ranging fields that developed a vision for technology literacy. The
National Science Foundation and Battelle Memorial Institute funded their
recommendations. The reports’ voice is directed at all K-12 schools, engineering schools,
teacher organizations, developers of curriculum, industry and non-industry supporters,
and a wide berth of science and technology groups.
Technology Education
This begs the question that is a stumbling block to technology education. What is
technology? Technology is not just tools, electrical systems or computers. In a broad
sense it is using human knowledge to accomplish necessary human wants and needs.
There are many extrapolations of the definition of technology and the definition of
technological literacy that are being tossed around. For the purpose of this research
“technological literacy encompasses three interdependent dimensions-knowledge, ways
18
of thinking and acting, and capabilities. Like literacy in reading, mathematics, science, or
history, the goal of technology literacy is to provide people with the tools to participate
intelligently and thoughtfully in the world around them.”
(National Academy of Engineering and National Research Council, 2002). As technology
changes on exponential path technology literacy is vastly under researched. To
understand or evaluate what a technological person should know from an everyday
perspective into the 21st century needs comprehensive inspection.
Technology literacy is a vital skill to a global society. People at all levels of
society should be better equipped to make educated decisions about all aspects of
technology. Public education is a foundation for equipping our students with this
knowledge. Endowed with technology literacy all students can become life long learners.
Consider leaders in business and industry and the high stakes decisions that affect many
others, sometimes a nation. (National Academy of Engineering and National Research
Council, 2002). How can they know with any certainty the impacts of their choices are
intended or unintended? Innovation is where the rubber meets the road in technology. It
is the nature of technology. Without principles derived from education our society cannot
be literate. Unless our society from cradle to grave encourages technological literacy
there will be little momentum to pursue technical and scientific careers.
We have almost no reliable data about the level of technological literacy among
children (National Academy of Engineering and National Research Council, 2002). The
current measures of the Wisconsin Knowledge and Concepts Education standardized tests
in Stoughton, Wisconsin children generally score low in science and math. Given this
representation it may be concluded,” Because of the epistemic links among technology,
19
science, and mathematics, the Project 2061 (1989) recommended the three curricula be
integrated as much as possible. They especially believed that the instructional methods
and hands-on approach to technology education instruction makes it a key partner in
interdisciplinary arrangements” (Johnson, Project 2061 1989, 1993, p. 29).
Standards
A review of existing models of standards is imperative because there is not one
encompassing model but many depending on the state or national organization. A review
is also essential in measuring the outcomes of an adequate program for all students.
Wisconsin has a common theme, as do most. The standards give us guidance about
student outcomes at appropriate age and maturation levels. They are not meant to be a
focused curriculum, instead a benchmark for where students should be. Finally, they are a
new concept and there is some confusion within technology education pockets as to their
purpose. In Stoughton, Wisconsin the verbiage is being updated from objectives to
benchmarks to insure clarity and understanding of the adopted standards. They represent
a vehicle to look closer at what is taught to students and how well that expectation is met.
One method of assessment of the students in Stoughton, Wisconsin is in November 2002
taking the WKCE standardized test.
Other frameworks for standards that this study will explore are the International
Education Technology Education (ITEA), the Project 2061 of the American Association
for the Advancement of Science and the state of Wisconsin standards. The Project 2061:
Science for All Americans (SFFA) and the companion document Benchmarks for Science
Literacy, which identify what all students need to be able to know and do in science,
math and technology. The inclusive nature of the three disciplines is a merger of
20
significance. Technology education should become recognized as part of the core general
education curriculum.
The benchmark for technology is broken into three categories. For example, by
the end of the fifth grade, students should know that: “There is no perfect design. Designs
that are best in one respect (safety or ease of use, for example) may be inferior in other
ways (cost or appearance). Usually some features must be sacrificed to get others. How
such trade-offs are received depends upon which features are emphasized and which are
downplayed.”
By the end of eighth grade, according to Project 2061 standards students should
know are that: “Engineers, architects, and others who engage in design and technology
use scientific knowledge to solve practical problems. But they usually have to take
human values and limitations into account as well.” This points to the obvious
relationship between science and technology and is an essential concept for all students to
learn. Design technology extends the natural childhood processes of learning. It allows us
to reflect and to inquire about the origins and developments of our ideas as it challenges
us to critically examine the applicability of our ideas. Engineering with children offers an
integrated and balanced approach to inspire innovative thinking and creative perspectives
in science and technology. It also provides realistic contexts for language and
mathematics.
Three benchmark topics for the ITEA for 6-8 are, ”Iterative, brainstorming,
modeling, testing, evaluating and modifying.” To study the rapidly changing paradigm
shifts in science and technology require a corresponding paradigm shift in education. The
reluctance of districts to have a firm elementary foundation in technology education
21
concepts until middle school is a topic for investigation. “The school prepares youths for
the world in which they live. Because the American culture is distinctly characterized as
technological, it becomes the function of schools to give every student insight and
understanding of the technological nature of the culture” (Technology Education
Advisory Council, 1988).
ITEA is the largest and most visible organization dedicated to enhancing
education through experiences in schools, for all students Kindergarten-12. The executive
summary of (p. 1) TfAAP was funded to answer three important questions linked to this
study: “What does every student need to know about and be able to do technology? How
should the articulated program in technology K-12 be organized? Is there a structure for
teaching technology that can withstand the accelerating change in our technological
environment?”
Wisconsin Model State Standards
By law districts in Wisconsin must have standards in place by August 1, 1998, in
reading and writing, geography and history, mathematics, and science. Districts may
adopt the model state standards, or standards from other sources, or develop their own
standards. In the Stoughton school district using the state standards each department has
implemented the model for creating their version.
Technology Literacy and Gender
Many different theories exist on how male and females process information. For
the most part, technology education has been a male controlled subject matter defined by
males (Welty, 1996). Girls and boys start school with equal levels of interest and ability
in math and science, yet young girls view technology as a male subject. Some discussion
22
has focused on the “chilly” classroom effect known to exist in subjects not traditionally
studied by many women (Resnick & Sandler, 1982). Raat and de Vreis (1985)
investigated the attitudes of middle school students toward technology in order to develop
course materials that could apply technological concepts and practices in a physics
curriculum. The project titled Pupils’ Attitudes Toward Technology (PATT) sought to
determine students' attitudes toward technology and their understanding of technological
concepts. PATT research findings indicate there are differences in the perceptions of
technology attributed to gender. The premise of the research was that attitudinal changes
toward technology might be linked to enhanced technological literacy and that the PATT-
USA could measure that change (Boser, Palmer, & Daugherty, 1998).
The data did not support this idea. Some change was indicated but no significant
change in students’ concept of Technology pointed to increased levels of technological
literacy. In this study an attempt to identify the differences in technology literacy based
on gender from the population researched. Although there is no widely accepted
standardized instrument suitable for assessing the broader construct of technological
literacy, variations on the portfolio method are used to observe gains in students’
technological literacy. Daiber, Litherland and Thode (1991) described the following
techniques to assess the technological literacy level of students in a specific technology
education course or program: (a) analysis of taped one-on-one and group discussion that
have similar topics at the beginning and end of the course, (b) observation of students
involvement with problem solving activities, and the results of hand on activities,
(c) utilization of paper and pencil exercises in the format of a pretest/posttest design, and
23
(d) development of a technology achievement test that includes major objectives of the
course.
24
CHAPTER THREE
Methods and Procedures
The methods and procedures used in the development of this section of the
research provide information in the following areas: the subjects, research design, the
instrumentation, procedure, and limitations of study and data analysis. Each of the areas
is addressed to provide an overview of the key information in the methodology section.
Subjects
The subjects in this study were seventh and eighth grade students taking
Technology Education classes at River Bluff Middle during two nine-week sessions one
in the school year in 2000-2001 and again in 2001-2002. The same students were
surveyed both years. There were 68 students involved in the study. Of the approximately
68 students in the study thirty-three were female and thirty-five were male. The test is
routinely administered for evaluation to all seventh and eighth grade students as a pretest
the first day of quarter and a posttest at the last day of the quarter. Only the first quarter
students coming from Sandhill (a Fifth and Sixth grade middle school) were selected for
the first quarter 2000 study. They were randomly placed using a computer program in
sections of related arts classes that rotate each nine weeks. In the eighth grade the same
students were randomly placed via the same computer program again so they were not
necessarily first quarter students the second year of the study. Research was compiled
throughout the 2001-2002 school year. The study of data did not begin until fourth
quarter of 2002 to make sure all subjects had taken the technology education class for
second time as eighth grade students. It is mandated that all students (with CDS and
certain behavior disorder students excluded) must take technology education for both
25
years at River Bluff resulting in both genders being placed in a class randomly. The study
relied on the cluster method of subject availability.
Research Design
In an effort to identify if there was a difference of technology literacy gained
between seventh and eighth grade students a comparison study was conducted using the
respondents as independent variables. Contact with respondents was done through a
pretest posttest administered in the classroom for evaluation purposes. All students that
remained throughout the entire quarter were included in the study.
Instrument
The instrument used in this study is a broad based Technology Literacy test
developed by individuals in the Wisconsin Academy of Staff Development Initiative and
was recommended by Dr. Julie Stafford as an evaluation tool for this study. The
questions on the test are multiple choice questions about nine topics ending with a 32-
question measurement component asking subjects to read a metric and English ruler
correctly. A copy of the instrument is in the Appendix. The instrument used reflects the
State of Wisconsin’s Eighth grade standards and benchmarks in Math, Science,
Information Technology and Technology Education. They are also in line with Stoughton
Area School District standards for Technology Education classes at the seventh and
eighth grade middle school level.
Procedures
The seventh and eighth grade classes were already intact. The technology literacy
difference between genders was examined. The subjects comprised of a mixture of boys
26
and girls already assigned a technology education nine-week rotation. The research
process consisted of problem identification, literature review, survey administration,
analysis of data, and generation of recommendations. The researcher used independent
groups and a T test to measure the outcomes.
Method of Analysis
Two charts (depicting their pretest posttest scores) were created for 68 students
using Microsoft Excel; these illustrated the number of correct responses out of 82
possible points, as well as gender differences. This data was delivered to Christine Ness
at the University of Wisconsin-Stout for statistical analysis. Her first task was to
determine a frequency analysis based on gender statistics. A development of a mean
median analysis of statistics followed with a technology literacy score. The second
component of the analysis was a T test using Levene’s test for equality of variances to
determine if there was a significant difference in technology literacy comparatively
between grades seven and eight.
Limitations of Study
For this study several limitations need to be considered when looking at the
overall results of the research. The limitations are listed below:
1. The study was limited to the findings of only two quarters of students at the
seventh and eighth grade level.
2. The researcher did not randomly select the students; they were selected by the
cluster method.
27
3. The only instrument for technological literacy was by method of
pretest/posttest.
4. The time of the day and the time of the year the pretest/posttest were
administered. Students taking the test at the end of the year may have an
advantage over first quarter students.
5. The moods, attitudes, and physical condition of the students on the days of the
pretest/posttest.
6. The students may not respond to every question.
28
CHAPTER FOUR
Results and Discussion
Introduction
The purpose of this study was to determine the technological literacy concepts of
seventh and eighth grade students in the Stoughton Area School District. The
technological literacy concepts were then being matched against the Wisconsin Model
Standards and the differences noted based on gender. The rationale for the study was to
identify if there was a difference in the achievement level of technology literacy of
students who have been taught the technological concepts at the seventh grade level and
eighth grade level and the extent of alignment at the seventh eighth grade level of those
concepts with the Wisconsin standards.
An effort was made to identify the differences in technology literacy based on
gender as well. Statistically significant results might lead to a more clear answer to the
question, “When do we begin teaching students technological concepts so they are
prepared for the technologically oriented world we live in and do standards and gender
make a difference?” The research was meant to be specifically relevant to River Bluff
Middle School and its decisions regarding curriculum in the Technology Education
department.
Demographics of Respondents
The 68 respondents were seventh and eighth grade boys and girls in a Technology
Education class at River Bluff Middle School in Stoughton Wisconsin. This is a required
course for middle school students so the gender breakdown for Technology education
classes was expected to be about fifty – fifty. The subjects were a cluster grouping. The
29
boy – girl variable was considered for this study as well as the progression from seventh
to eighth grade. All subjects tested were evaluated by the same pretest – posttest
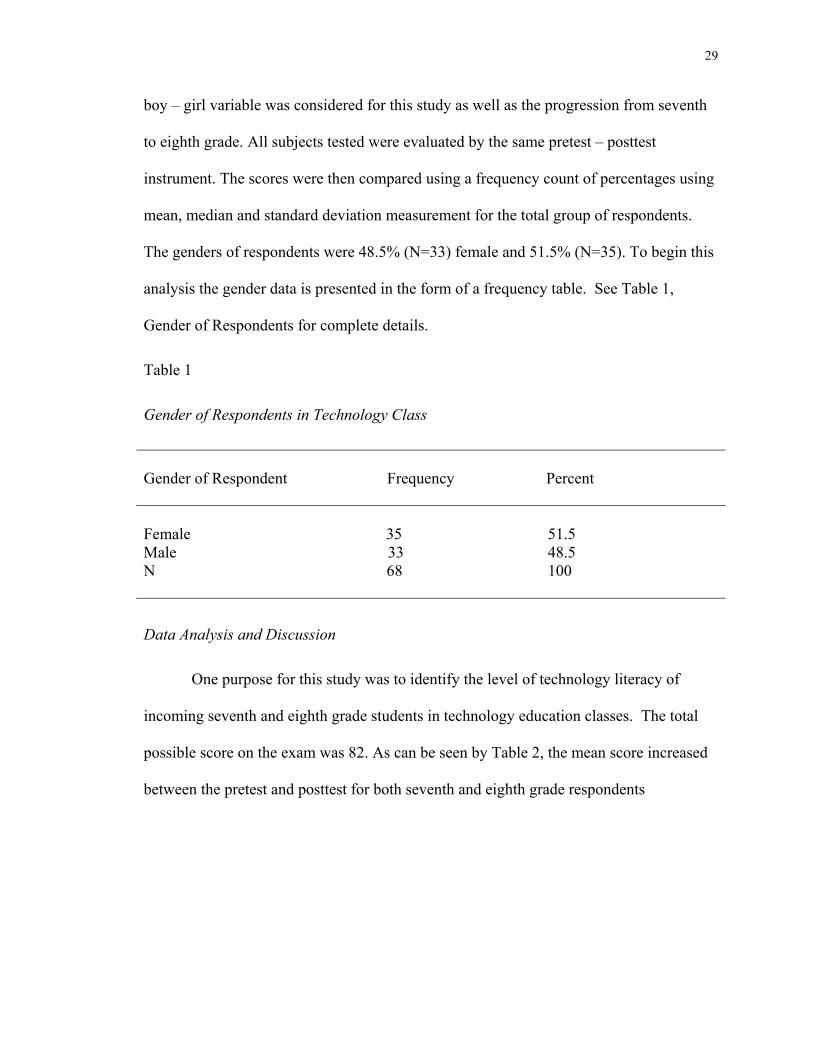
instrument. The scores were then compared using a frequency count of percentages using
mean, median and standard deviation measurement for the total group of respondents.
The genders of respondents were 48.5% (N=33) female and 51.5% (N=35). To begin this
analysis the gender data is presented in the form of a frequency table. See Table 1,
Gender of Respondents for complete details.
Table 1
Gender of Respondents in Technology Class
Gender of Respondent Frequency Percent Female 35 51.5 Male 33 48.5 N 68 100
Data Analysis and Discussion
One purpose for this study was to identify the level of technology literacy of
incoming seventh and eighth grade students in technology education classes. The total
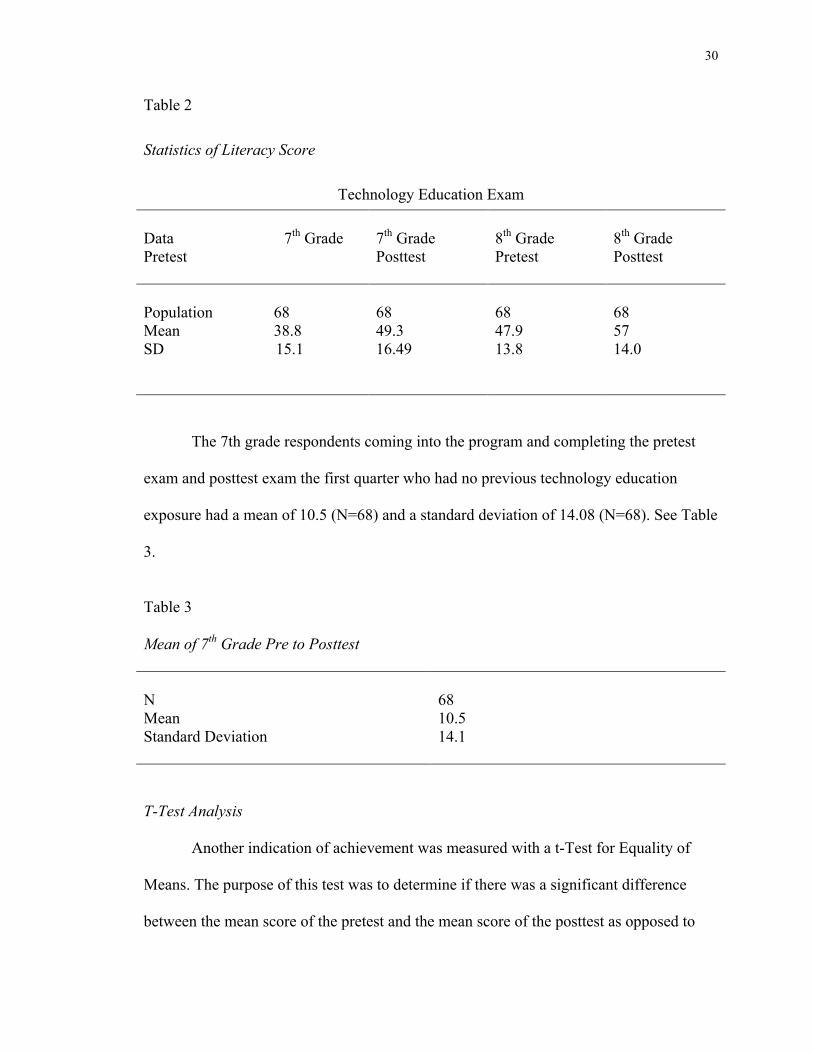
possible score on the exam was 82. As can be seen by Table 2, the mean score increased
between the pretest and posttest for both seventh and eighth grade respondents
30
Table 2
Statistics of Literacy Score
Technology Education Exam Data 7th Grade Pretest
7th Grade Posttest
8th Grade Pretest
8th Grade Posttest
Population 68 Mean 38.8 SD 15.1
68 49.3 16.49
68 47.9 13.8
68 57 14.0
The 7th grade respondents coming into the program and completing the pretest
exam and posttest exam the first quarter who had no previous technology education
exposure had a mean of 10.5 (N=68) and a standard deviation of 14.08 (N=68). See Table
3.
Table 3
Mean of 7th Grade Pre to Posttest
N Mean Standard Deviation
68 10.5 14.1
T-Test Analysis
Another indication of achievement was measured with a t-Test for Equality of
Means. The purpose of this test was to determine if there was a significant difference
between the mean score of the pretest and the mean score of the posttest as opposed to
31
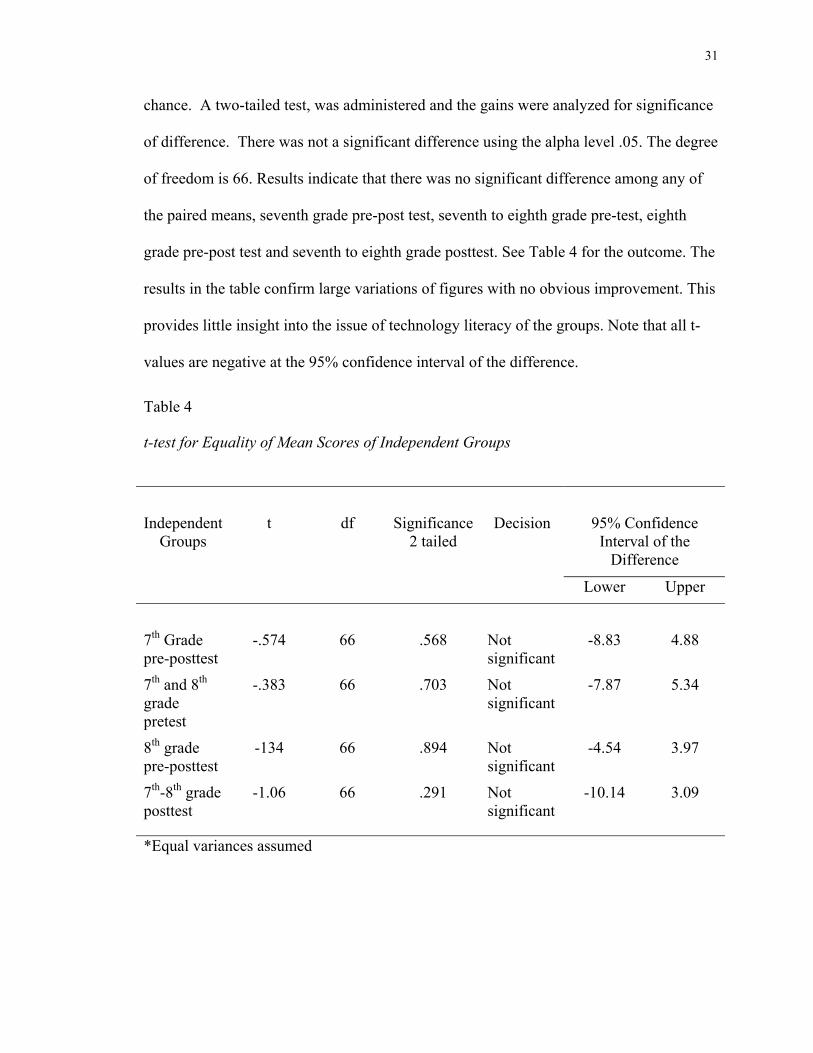
chance. A two-tailed test, was administered and the gains were analyzed for significance
of difference. There was not a significant difference using the alpha level .05. The degree
of freedom is 66. Results indicate that there was no significant difference among any of
the paired means, seventh grade pre-post test, seventh to eighth grade pre-test, eighth
grade pre-post test and seventh to eighth grade posttest. See Table 4 for the outcome. The
results in the table confirm large variations of figures with no obvious improvement. This
provides little insight into the issue of technology literacy of the groups. Note that all t-
values are negative at the 95% confidence interval of the difference.
Table 4
t-test for Equality of Mean Scores of Independent Groups
95% Confidence Interval of the
Difference
Independent Groups
t
df
Significance 2 tailed
Decision
Lower Upper
7th Grade pre-posttest
-.574
66
.568
Not significant
-8.83
4.88
7th and 8th grade pretest
-.383 66 .703 Not significant
-7.87 5.34
8th grade pre-posttest
-134 66 .894 Not significant
-4.54 3.97
7th-8th grade posttest
-1.06 66 .291 Not significant
-10.14 3.09
*Equal variances assumed
32
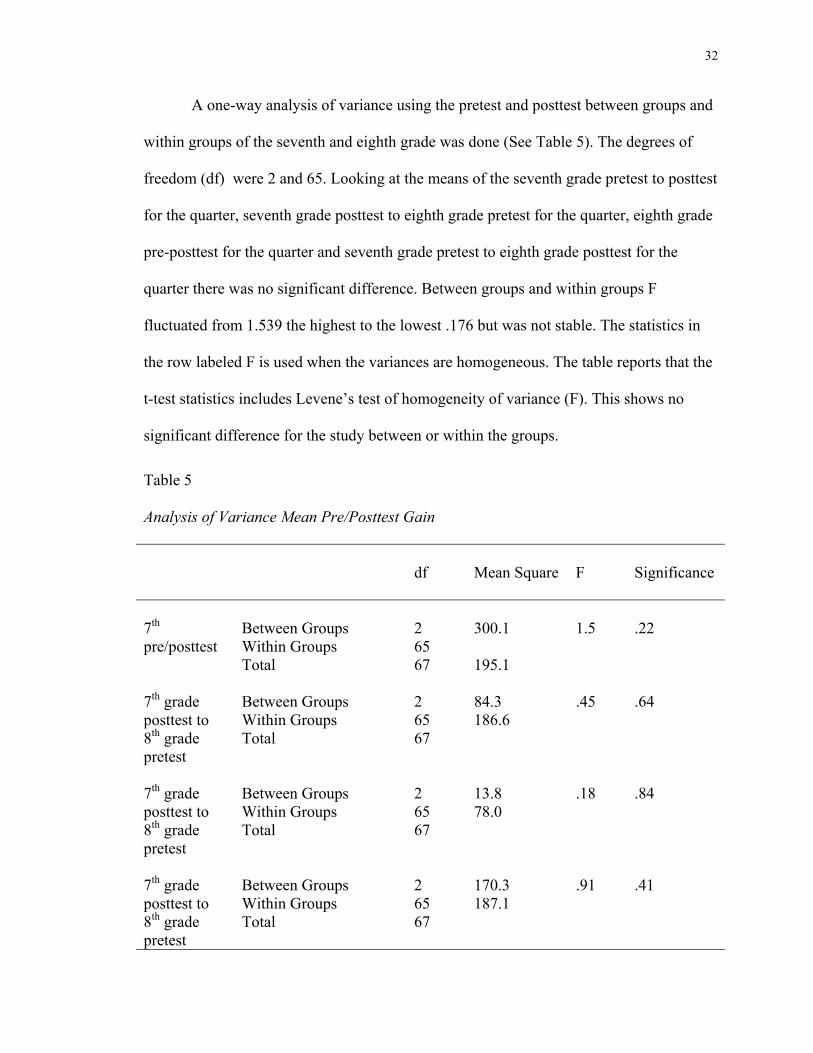
A one-way analysis of variance using the pretest and posttest between groups and
within groups of the seventh and eighth grade was done (See Table 5). The degrees of
freedom (df) were 2 and 65. Looking at the means of the seventh grade pretest to posttest
for the quarter, seventh grade posttest to eighth grade pretest for the quarter, eighth grade
pre-posttest for the quarter and seventh grade pretest to eighth grade posttest for the
quarter there was no significant difference. Between groups and within groups F
fluctuated from 1.539 the highest to the lowest .176 but was not stable. The statistics in
the row labeled F is used when the variances are homogeneous. The table reports that the
t-test statistics includes Levene’s test of homogeneity of variance (F). This shows no
significant difference for the study between or within the groups.
Table 5
Analysis of Variance Mean Pre/Posttest Gain
df
Mean Square
F
Significance
7th pre/posttest
Between Groups Within Groups Total
2 65 67
300.1 195.1
1.5
.22
7th grade posttest to 8th grade pretest
Between Groups Within Groups Total
2 65 67
84.3 186.6
.45 .64
7th grade posttest to 8th grade pretest
Between Groups Within Groups Total
2 65 67
13.8 78.0
.18 .84
7th grade posttest to 8th grade pretest
Between Groups Within Groups Total
2 65 67
170.3 187.1
.91 .41
33
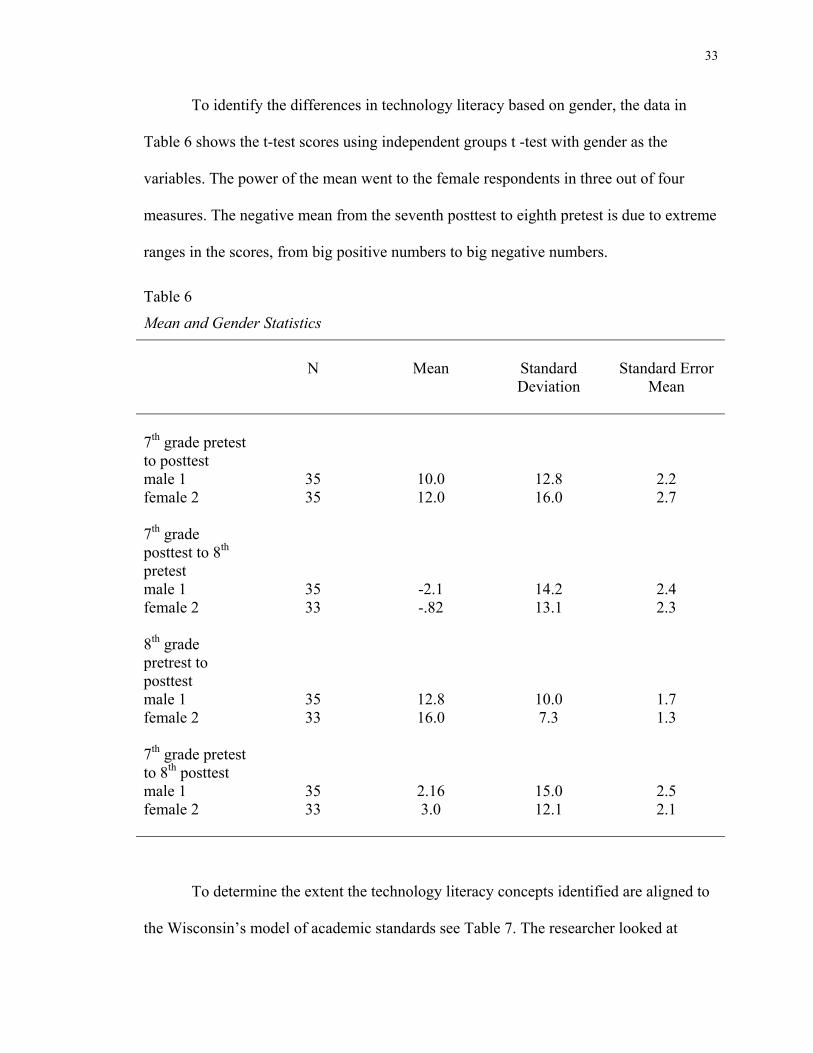
To identify the differences in technology literacy based on gender, the data in
Table 6 shows the t-test scores using independent groups t -test with gender as the
variables. The power of the mean went to the female respondents in three out of four
measures. The negative mean from the seventh posttest to eighth pretest is due to extreme
ranges in the scores, from big positive numbers to big negative numbers.
Table 6
Mean and Gender Statistics
N
Mean
Standard Deviation
Standard Error
Mean
7th grade pretest to posttest male 1 female 2
35 35
10.0 12.0
12.8 16.0
2.2 2.7
7th grade posttest to 8th pretest male 1 female 2
35 33
-2.1 -.82
14.2 13.1
2.4 2.3
8th grade pretrest to posttest male 1 female 2
35 33
12.8 16.0
10.0 7.3
1.7 1.3
7th grade pretest to 8th posttest male 1 female 2
35 33
2.16 3.0
15.0 12.1
2.5 2.1
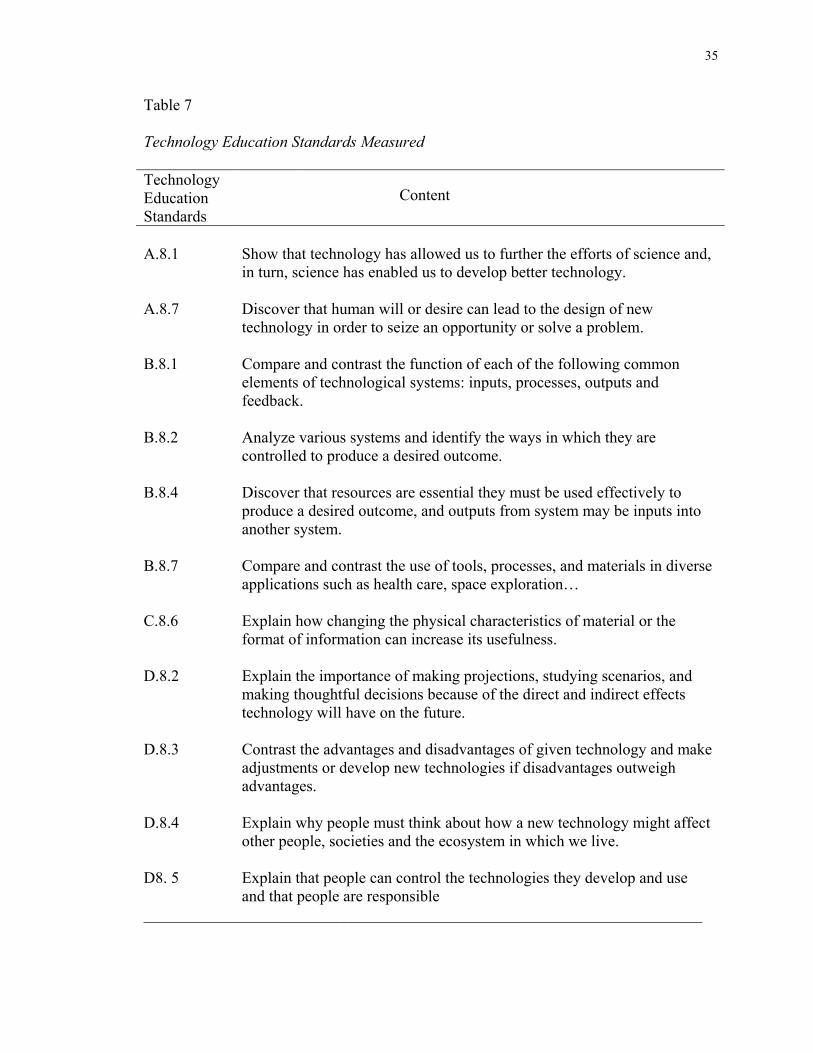
To determine the extent the technology literacy concepts identified are aligned to
the Wisconsin’s model of academic standards see Table 7. The researcher looked at
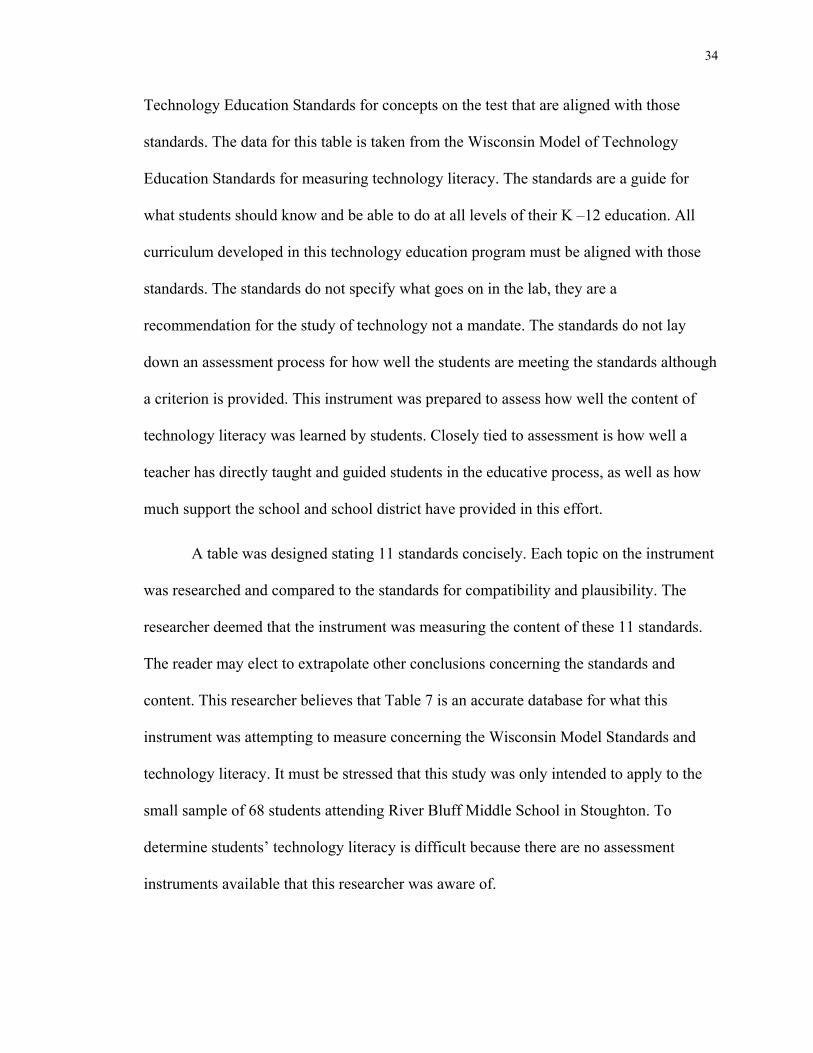
34
Technology Education Standards for concepts on the test that are aligned with those
standards. The data for this table is taken from the Wisconsin Model of Technology
Education Standards for measuring technology literacy. The standards are a guide for
what students should know and be able to do at all levels of their K –12 education. All
curriculum developed in this technology education program must be aligned with those
standards. The standards do not specify what goes on in the lab, they are a
recommendation for the study of technology not a mandate. The standards do not lay
down an assessment process for how well the students are meeting the standards although
a criterion is provided. This instrument was prepared to assess how well the content of
technology literacy was learned by students. Closely tied to assessment is how well a
teacher has directly taught and guided students in the educative process, as well as how
much support the school and school district have provided in this effort.
A table was designed stating 11 standards concisely. Each topic on the instrument
was researched and compared to the standards for compatibility and plausibility. The
researcher deemed that the instrument was measuring the content of these 11 standards.
The reader may elect to extrapolate other conclusions concerning the standards and
content. This researcher believes that Table 7 is an accurate database for what this
instrument was attempting to measure concerning the Wisconsin Model Standards and
technology literacy. It must be stressed that this study was only intended to apply to the
small sample of 68 students attending River Bluff Middle School in Stoughton. To
determine students’ technology literacy is difficult because there are no assessment
instruments available that this researcher was aware of.
35
Table 7
Technology Education Standards Measured
Technology Education Standards
Content
A.8.1
Show that technology has allowed us to further the efforts of science and, in turn, science has enabled us to develop better technology.
A.8.7 Discover that human will or desire can lead to the design of new technology in order to seize an opportunity or solve a problem.
B.8.1 Compare and contrast the function of each of the following common elements of technological systems: inputs, processes, outputs and feedback.
B.8.2 Analyze various systems and identify the ways in which they are controlled to produce a desired outcome.
B.8.4 Discover that resources are essential they must be used effectively to produce a desired outcome, and outputs from system may be inputs into another system.
B.8.7 Compare and contrast the use of tools, processes, and materials in diverse applications such as health care, space exploration…
C.8.6 Explain how changing the physical characteristics of material or the format of information can increase its usefulness.
D.8.2 Explain the importance of making projections, studying scenarios, and making thoughtful decisions because of the direct and indirect effects technology will have on the future.
D.8.3 Contrast the advantages and disadvantages of given technology and make adjustments or develop new technologies if disadvantages outweigh advantages.
D.8.4 Explain why people must think about how a new technology might affect other people, societies and the ecosystem in which we live.
D8. 5 Explain that people can control the technologies they develop and use and that people are responsible
______________________________________________________________________
36
Summary
The sample group for this study was 68 students and the conclusions are only
intended to apply to this small group. However, the study was designed to compare
technology literacy from the seventh and eighth grade years of this group. The reader is
free to decide if the results, though not significant, have a plausible relationship within a
context of technology literacy. This researcher believes there is relevance to this study
and future research may discover improved assessment strategies for technology literacy.
Standardized testing is measurable and used in the core subject areas. Technology
education courses traditionally use more performance-based assessments. Research
shows that there are no state or national technology literacy tests. It must be stressed that
this study makes no attempt to compare or correlate assessment practices in other
geographic areas or disciplines.
37
CHAPTER FIVE
Summary, Conclusions, and Recommendations
The summary of the research includes a brief description of the purpose of the
study. A description of the instrument and subjects that provided the data will also be
described. The summary continues with a brief review of the results. The conclusion
section provides an interpretation of the data, and also integrates the data collected to the
importance and necessary curriculum for the students. The recommendation section
provides a discussion of possible ideas in which the results of the research may or may
not be utilized. The recommendation section also gives an overview of ideas that provide
suggestions for further study.
Summary
The purpose of this study was to determine the technological literacy concepts of
seventh and eighth grade students in the Stoughton Area School District. The
technological literacy concepts will then be matched against the Wisconsin Model
standards and the differences based on gender. A review of current literature lead to the
selection of the instrument to meet the needs of the study. The study was conducted with
a pretest/posttest given to seventh and eighth grade students at the researchers’ middle
school as part of the program as an evaluation instrument. Sixty-eight students took the
test in seventh and eighth grade. Data was tallied from the instruments and presented to
UW-Stout for analysis.
A review of literature was conducted dealing briefly with the paradigm shift from
industrial arts to technology education. It also explored the national and state standards
on technology education and how they enhance a Kindergarten -12 curriculum. Though
38
gender is not the focus of this paper it is relevant to take a look at women’s (girls’)
literacy in an overview context. Technology literacy initiatives were researched as well
and aligned into the literacy instrument.
To gather information on technology literacy evaluation an 82-question
instrument was researched, recommended and selected by the researcher with support
from the director Dr. Julie Stafford of the Wisconsin Academy of Staff Development
Initiative. It was developed through the academy’s integrative work in math, science, and
technology education initiatives in step with state standards as well.
The study was designed to assess technology literacy of seventh and eighth grade
students for two years of an exploratory required program for all students. The sample
was a cluster grouping according to a random computer program used by the scheduling
office. Due to that circumstance the study lasted two years testing students at the first day
of the quarter and the last day of the quarter according to when their schedule for
technology education fell in their nine-week rotation of the related arts classes. Students
were followed up for two years. There were a total of 68 students who participated in the
study. Students took a pretest in the seventh grade, then a posttest. The same students
were followed up the next year and took the pretest and posttest during the eighth grade
year. All 68 instruments were sent to the University of Wisconsin-Stout Information and
Operations Systems Department where a research associate helped to compile and
statistically analyze the data. The goal was to be able to describe in mathematical terms
the relevance of specific assessment related activities currently being practiced at River
Bluff Middle School in Stoughton Wisconsin. The most commonly used mathematical
39
descriptors used were mean, standard deviation, percentage, and frequency. Several
tables were constructed to summarize the results obtained from the analysis of the data.
Conclusions
This study focused on five objectives. Each objective will now be restated and
answered.
1. Identify the level of technology literacy of incoming seventh grade students in
technology education classes.
This research has been deliberately confined to the analysis of Stoughton,
Wisconsin and the River Bluff Middle School seventh and eighth grade technology
education class. Clearly, additional sources of information such as those provided by a
larger study or an additional instrument would provide a more detailed study. By
accepting the data in Chapter Four it was determined the level of technology literacy of
incoming seventh grade students is low with no significant difference between males and
females. Thus it would be possible to create a more detailed analysis by researching the
technology concepts, if evident, at the fifth and sixth grade level. A pretest could be given
at the sixth grade level to be analyzed against a posttest at the end of the seventh grade
technology education class to create a clearer picture of what is taking place in the
technology education program, but using a different model of testing. A typical approach
to document change in a program is the pretest posttest measurement. Comparison results
may be an inaccurate assessment of instructional impact because students may have
limited knowledge at the beginning of a program, which inhibits a baseline for
technology literacy.
40
2. Identify the level of technology literacy of continuing 8th grade students in
technology education classes.
The mean score increased between the pretest and posttest for both seventh and
eighth grade classes. This reports achievement and learning. This measure leads to a
plausible conclusion that literacy was taking place. A paper and pencil test was designed
to address technology literacy although there are virtually no tests at the state or national
level that assess technology literacy. The standards were researched and the content of
the instrument measures the literacy of those concepts.
3. Identify the differences in technology literacy based on gender.
The population of the technology education classes was almost equal, 51.5%
female and 48.5% male. This was to be expected because this class is in a related arts
rotation that changes every nine weeks and all students are required to take the class. The
comparisons of measures at the seventh grade pretest to posttest for the quarter, seventh
grade posttest to eighth grade pretest for the quarter, eighth grade pre-posttest for the
quarter and seventh grade pretest to eighth grade posttest for the quarter using gender as
the variables demonstrate a mean that is slightly higher for females except for the seventh
posttest to eighth pretest for the quarter. This was not significant.
4. Determine the extent the technological literacy concepts identified are aligned to
the Wisconsin’s model of academic standards.
The technology literacy test was measured only for alignment with the technology
education standards for the State of Wisconsin. The technology literacy test also has a
two-part measurement component, (English and Metric) and science connections.
Technology education is a synergistic curriculum. A more detailed solution to the
41
alignment would be to inspect the instrument for cross-curricular connections to the
standards. The instrument was designed for technological literacy and standards
connections demonstrated by students on the topics selected for testing (space, computer
literacy, high tech medicine, environmental issues, transportation, energy issues, super
weapons and arms control and biotechnology). The students demonstrated what they
know about those topics at the seventh and eighth grade level by testing and hands on
activities. One threat to statistical validity of technology literacy is that no instruments
exist at state or national level and each program dictates the evaluation. This researcher
attempted to provide a designed instrument and comparison study of standards to answer
this objective. Although there is no statistical data reported in Table 7 the researcher
made 11connections to standards representing an alignment between the test and
concepts. The reader is invited to deduce if there is an existing alignment.
5. Determine if there is a difference of technology literacy gained at the end of
seventh and eighth grade.
It has been demonstrated that the difference is not significant for technology
literacy at the seventh and eighth grade. The data from a t-Test and ANOVA supported
those findings. There are extreme ranges in the gain in scores from the exams, from big
negative numbers to big positive numbers. Because the range is so large, the standard
deviations are also large. This interferes with statistical significance occurring, which is
what happened with this project. The researcher discovered no significant results from
the study.
42
Since the study was limited to the findings of only two quarters of students at the
seventh and eighth grade level it can be concluded that a small population was tested and
the results should not be generalizable. The researcher did not randomly select the
students; they were selected by the cluster method. The only instrument for testing
technological literacy was by method of pretest/posttest. A survey could have
accompanied the testing asking respondents prior background of contact with technology
literacy concepts. It was concluded due to the extreme ranges in gain scores that there
was no significant results from the data.
The time of the day, the time of the year and the brief 9 week or forty five day
approximately 45 minute class periods may not provide enough time to motivate the
respondents taking the pretest/posttest and may have impacted the results. Students taking
the test at the end of the year may have an advantage over first quarter students due to the
fact they have been exposed to many more technological concepts in other settings. The
moods, attitudes, and physical condition of the students on the days of the pretest/posttest
may result in extreme deviations simply because they are adolescents and going through
many physical and emotional changes. The students may not have responded to every
question or responded without reading the question thus creating large jumps in positive
and negative gain scores. If that occurred then the respondents may feel lacking in the
knowledge of technology literacy concepts or measurement skills and may have an
indifference to the testing process overall. The content of the test and the content of what
was instructed may not have matched for furthering technology literacy for students.
Education promotes the union of content knowledge and the application to of problem
solving and utilizing basic skills to extend human capabilities. Hence, a conclusion could
43
be made that the instrument is not valid for the seventh and eighth grade curriculum at
River Bluff Middle School. The technology literacy instrument could be redesigned to
reflect the districts’ current effort to restructure programs according to standards and
integration within the core curriculum that are relevant to this school and not necessarily
designed for another population. Technology education is an integrated part of the River
Bluff Middle School curriculum albeit not entirely accepted as one yet by all staff.
Interest and understanding in the outcomes of this study may be used for inservice
training and Academic Excellence days in the district.
Recommendations Related to This Study
In accordance with the objectives of this study the following recommendations
have been developed based upon the findings and conclusions of this study:
1. The researcher should share the results of this study with River Bluff staff to
help them better understand how as a group they can integrate curriculum to
better support the importance of core concepts and standards as well as
technology education standards and concepts to teach students an all around
grasp of technology and how it extends human capabilities in areas of life.
2. Technology education concepts may need to be introduced at the elementary
level due to the time constraints experienced at the seven/eight level. The
students only have technology education class for nine weeks at this level,
which creates uncertainty with the concepts. The students may confuse instead
of comprehend the harmony of math, science and technology education
concepts.
44
3. Development of a new instrument including all educators at the seven/eight
level concerned to educate the whole child with focus on the district standards
and benchmarks as opposed to an instrument that addresses objectives from
one source.
4. The district should offer Technology Education in-service opportunities for all
elementary, five six and seven eight staff to help them better integrate
opportunities for understanding of the discipline.
5. The researcher should identify and strengthen important areas of technology
education curriculum through integration and consistency from elementary
through high school. This may be accomplished by advocating a consistent
technology education curriculum from elementary through twelfth grade
curriculum.
A better effort should be made to ensure that the programs content aligns with the
Wisconsin Standards and that the evaluation is an accurate reflection of the program
content. All programs need a means by which to measure their success. This study was
designed to identify technology literacy at the seventh and eighth grade level. The study
can also be redesigned for use at other schools in the district, for example, the fifth and
sixth grade level. If the data from this study is to be utilized, more research may help to
implement changes within the Stoughton school district. Technology Education can
benefit from the coordination and consistency of activities between K-12 in the district.
Earlier exposure to technology education may positively impact student achievement
levels.
45
A future study could be undertaken to assess the demand for a consistent K-12
technology education curriculum that enhances technological literacy curriculum for all
students, not just as an enrichment program. This study could also determine whether this
program would be developed specifically for this district or utilize an existing program
from elsewhere. Additional study is needed to determine exactly what steps students and
faculty need for improving technology literacy at all levels in the district and recognizing
it as a component of technology education, which is easily definable.
46
References
Bame, E., Dugger, W., Jr., de Vries, M., & McBee, J. (1993). Pupils’ attitudes
toward technology - PATT-USA. Journal of Technology Studies, 19(1),40-48.
Bonser, F. G., & Mossman, L. C. (1923). Industrial arts for elementary schools.
New York, NY: MacMillan.
Boser, R., Palmer, J., & Daugherty, M. (1998). Students Attitudes Toward
Technology in Selected Technology Education Programs. Journal of Technology
Education, 10 (1), 2-3.
Claiborne, C. B., & Sirgy, M. J. (1990). Self-image congruence as a model of
consumer attitude formation and behavior: A conceptual review and guide for future
research. In Dunlap, B. J., & Cullowhee, A. (Eds.), Developments in Marketing Science:
v. 13 (pp. 3-7). North Carolina: Academy of Science.
Daiber, R., Litherland, L., & Thode, T. (1991). In M. Dyrenfurth & M. Kozak
(Eds.), Technological literacy. 40th Yearbook of the Council on Technology Teacher
Education (pp. 209-211). Peoria, IL: Glencoe.
DeVore, P.W. (1980). Technology: An introduction. Worcester, MA: Davis.
Dugger, W. E. (1995). Technology education: A global influence. In G. E. Martin
(Ed.), Foundations of technology education: The 44th yearbook of the Council on
Technology Teacher Education. (p. 479-501). Peoria, IL: Glencoe.
Dugger, W. E., Bame, A. E., Pinder, C. A., & Miller, D. C. (1985). Standards for
technology education programs. International Technology Education Association.
Goetsch, D.L. & Nelson, J. A. (1987). Technology and you. Albany, NY: Delmar.
47
Gerbracht, C., & Babcock, R. J. (1959). Industrial arts for grades K-6.
Milwaukee, WI: Bruce.
Hatzios, M., (1996). Effective models for measuring students’ attitudes toward the
marketing education program. Journal of Vocational and Technical Education, 13(1).
Heasley, N. (1974). Industrial arts and technology in the elementary school:
Designing a curriculum. In R. G. Thrower & R. D. Weber, (Eds.), Industrial arts for the
elementary school. The 23rd yearbook of the American Council on Industrial Arts
Teacher Education (pp. 88-154). Bloomington, IL: McKnight.
Hoots, W. R. (1971). Industrial arts in the elementary school: education for a
changing society. Greenville, NC: National Conference on Elementary School Industrial
Arts.
International Technology Education Association. (1996). Technology for all
Americans Reston, VA: Author.
Johnson, J. (1989). Technology: report of the project 2061 phase 1 technology
panel . American Association for the Advancement of Science. pp. 3, 5, p.29, 1993.
Miller, W. R. (1974). Contemporary programs. In R. G. Thrower & R. D. Weber
(Eds.), Industrial arts for the elementary school. The 23rd yearbook of the American
Council on Industrial Arts Teacher Education (pp. 155-170). Bloomington, IL:
McKnight.
National Academy of Engineering and National Research Council, (2002).
Technically Speaking, Why All Americans Need to Know More About Technology.
National Academy Press. Washington, D.C. p. 4-6.
48
Paniagua. D. A. (1999). Student perspectives on technology and technology
education. University of Wisconsin-Stout, Menomonie, WI.
Pierce, A., & Karwatka, D. (1993). Introduction to Technology. St. Paul, MN:
West.
Raat, J. H., & de Vries, M. (1985). "What do 13-year old students think about
technology? The conception of and the attitude towards technology of 13-year old girls
and boys." Eindhoven University of Technology, The Netherlands (ERIC Document
Reproduction Service No. ED 262-998).
Resnick B., & Sandler, B. (1982). The classroom climate: A chilly one for
women?
Stables, K. (1996). Critical issues to consider when introducing technology
education into the curriculum of young learners. Journal of Technology Education, 8(2),
p. 3.
Technology Education Advisory Council. (1988). Technology: A national
imperative. Reston, VA: International Technology Education Association.
Technology for All Americans Project (1990). Technology for all Americans: A
rational and structure for the study of technology. Reston, VA: International Technology
Education Association.
Thode, B., & Thode, T. (1994). Technology. New York: Delmar.
Wisconsin Department of Public Instruction (1998). Wisconsin’s model academic
standards for technology education. Journal of Technology Education, 3(2), 53-63.
49
Welty, K. (1996, April). Identifying women’s perspectives on technology. Paper
presented at the International Technology Education Association Conference in Phoenix,
AZ.
Wulf, W. A. (2000, March). The standards for technological literacy. The
Technology Teacher, 59 (6), 10-12.

50
APPENDIX A
INSTRUMENT
51
Instrument
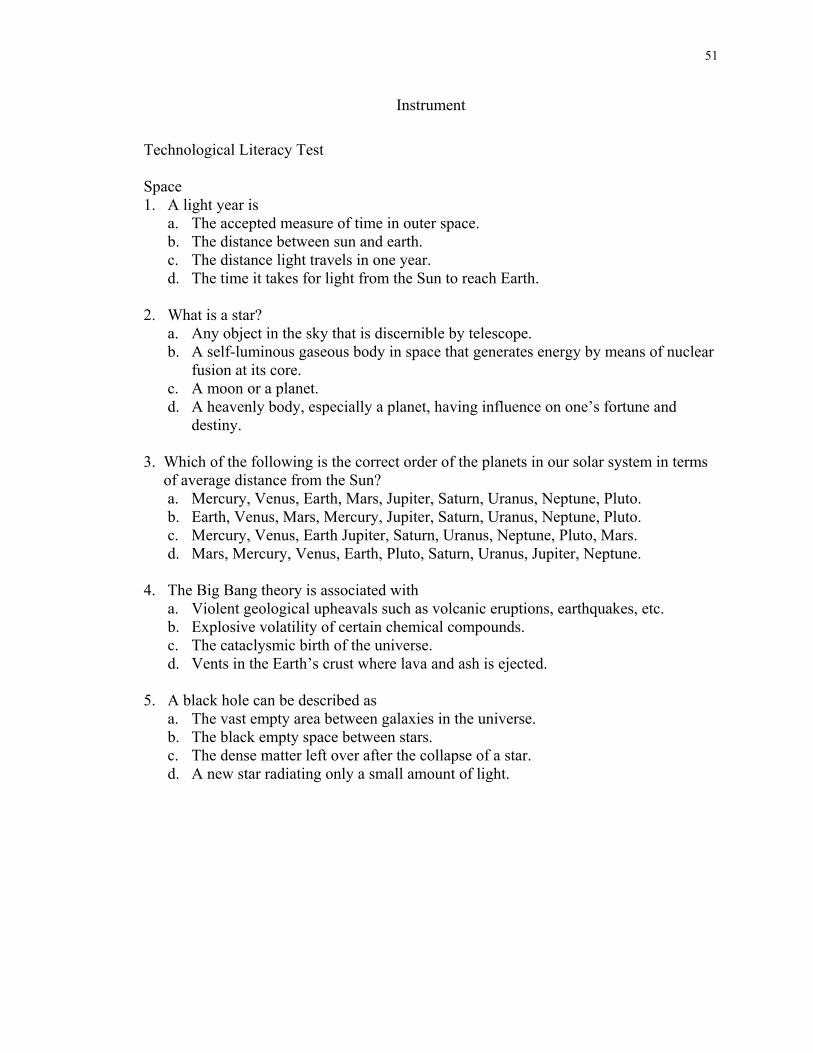
Technological Literacy Test
Space 1. A light year is
a. The accepted measure of time in outer space. b. The distance between sun and earth. c. The distance light travels in one year. d. The time it takes for light from the Sun to reach Earth.
2. What is a star?
a. Any object in the sky that is discernible by telescope. b. A self-luminous gaseous body in space that generates energy by means of nuclear
fusion at its core. c. A moon or a planet. d. A heavenly body, especially a planet, having influence on one’s fortune and
destiny. 3. Which of the following is the correct order of the planets in our solar system in terms of average distance from the Sun?
a. Mercury, Venus, Earth, Mars, Jupiter, Saturn, Uranus, Neptune, Pluto. b. Earth, Venus, Mars, Mercury, Jupiter, Saturn, Uranus, Neptune, Pluto. c. Mercury, Venus, Earth Jupiter, Saturn, Uranus, Neptune, Pluto, Mars. d. Mars, Mercury, Venus, Earth, Pluto, Saturn, Uranus, Jupiter, Neptune.
4. The Big Bang theory is associated with
a. Violent geological upheavals such as volcanic eruptions, earthquakes, etc. b. Explosive volatility of certain chemical compounds. c. The cataclysmic birth of the universe. d. Vents in the Earth’s crust where lava and ash is ejected.
5. A black hole can be described as
a. The vast empty area between galaxies in the universe. b. The black empty space between stars. c. The dense matter left over after the collapse of a star. d. A new star radiating only a small amount of light.
52
Biotechnology 1. DNA is
a. The main component of chromosomes and the materials that transfer genetic characteristics in all life forms.
b. Found only in complex, higher order life forms including Homo sapiens. c. The chemical substance found only in plants. d. Found only in mammals.
2. What are chromosomes?
a. One-celled organisms that are the most primitive form of life. b. Collections of genes. c. A chromium alloy. d. Multicolored algae
3. Genetic engineering is
a. The use of biological techniques to rearrange genes: to remove, add, or transform them from one organism or location to another.
b. The attempt to synthesize life from nonliving materials. c. The attempt to improve the human population by discouraging reproduction by
individuals with genetic defects. d. The process by which sex cells are formed.
4. Which of the following statements is true?
a. The government has given scientists permission to transfer foreign genes into humans.
b. Inserting foreign genes into humans is banned in the United States. c. There are scientific and technical reasons preventing foreign genes from being
transferred into human beings. d. Researchers have not requested permission to transfer foreign genes into humans.
5. What is the Human Genome Project?
a. A project to clone large numbers of identical farm animals. b. A project to transfer genes from humans into chickens, cattle, mice and fish. c. A project designed to determine the sequence of the entire human DNA makeup-
the entire genetic recipe for humans. d. A project designed to grow supercrops such as supertomatoes and gigantic
potatoes.
53
Computer Literacy 1. A computer is
a. A thinking machine. b. A machine that manipulates the symbols of information such as numbers and
letters. c. An all-purpose device that can distinguish the difference between true and false
information. d. Just a super fast adding machine.
2. In carrying out an information-processing task, the computer
a. Is controlled by a set of detailed, step-by-step instructions called a program. b. Can distinguish reliable and unreliable input data. c. Cannot maintain data files and retrieve items from that file on request. d. Can perform any task if we know what keys to hit.
3. What is the difference between hardware and software?
a. The two terms mean the same thing in computer jargon. b. Hardware consists of the machine itself where software consists of the programs
that direct the machine. c. Hardware includes those programs permanently installed in the machine that
cannot be changed during normal operations, whereas software are those programs needed for specific tasks such as work processing or data management.
d. Hardware is the keyboard and video screen, and software is all of the wiring and circuitry inside the computer.
4. The component that controls and coordinates all’ of the functions of a computer is called the a. Random access memory or RAM.
b. Read only memory or ROM. c. Central processing unit or CPU. d. Word processing unit.
5. Computers store, process, and manipulate information using just two symbols, 0 and 1. These symbols are known as
a. Bytes and words. b. Binary digits, or bits. c. The ASCII code. d. The bast-1 0 or decimal system.
6. On which of the following may computer data be stored?
a. A floppy disk. b. A hard disk c. A magnetic tape d. All of the above.
54
Environmental Issues 1. According to theories about the greenhouse effect the continued emissions of Carbon dioxide and other gases will
a. Limit the amount of infrared energy entering the Earth’s atmosphere. b. Trap heat within the atmosphere causing global warming. c. Balance the cooling effect caused by the ozone hole. d. Have little effect on the climate’ because the oceans can absorb all excess solar
radiation. 2. The belief that human activities can alter the amount of stratospheric ozone and thus lead to an increase in the amount of harmful ultraviolet radiation reaching the Earth’s surface is
a. A scientific theory that has yet to be proven or disproved. b. Accepted by the scientific community, largely because of the recent measured
losses of global ozone. c. A scientific theory based solely on computer modeling with little or not
Supporting empirical data. d. A phenomenon limited to the Arctic and Antarctic regions.
3. What is acid rain?
a. Rain with an acidic rating higher than pH 5.6 b. Rain with an acidic rating lower than pH c. Rain with an acidic rating higher than pH 7 d. None of the above
4. The most effective way to control pollutants that cause acid rain would be to
a. Burn only coal in our power generating plants. b. Use only electricity for all our power needs. c. Burn only petroleum in our power generating plants. d. Reduce emissions from all fossil fuel burning sources.
5. What is the only perfect method for the disposal of toxic waste?
a. Burning it b. Burying it c. Dumping it at sea d. There is no perfect way
6. The current plan for the disposal of nuclear waste is to
a. Deposit the waste in the Antarctic. b. Bury it under the ocean. c. Bury it in an underground depository located in Nevada. d. Deposit it on a remote island in the Pacific Ocean.
55
Energy Issues 1. The US obtains the largest percentage of its energy today from
a. Natural gas. b. Coal. c. Petroleum. d. Geothermal, hydro, and nuclear power.
2. A Btu (British thermal unit) is defined as
a. Equivalent to a barrel of crude oil. b. The mount of energy needed to raise 1 lb. of water 1 degree F. c. Equivalent to a gallon of gasoline. d. Equivalent to a kilowatt-hour.
3. Which of the following is not considered a viable alternative to our continued dependency on fossil fuels until at least 2020?
a. Nuclear power b. Solar power c. Hydrogen fuel d. Improved energy efficiency
4. What is the difference between nuclear fission and nuclear fusion?
a. Fission involves the splitting of atomic nuclei into smaller parts, whereas fusion involves the combining or joining of two atomic nuclei.
b. Fusion is the system used in today’s atomic power plants; fission is the process that makes the sun and the stars bum and powers the hydrogen bomb.
c. Fission requires very high temperatures to fuse together two nuclei, whereas fusion involves the splitting apart of a nucleus.
d. Fission reactors use plutonium; fusion reactors use uranium, which is considered more dangerous.
5. Most applications of solar power today
a. Are cost competitive with other sources of energy. b. Involve the conversion of solar energy to heat or to electricity c. Face only political hurdles and involve few technical or financial constraints. d. Can produce electrical energy at no cost.
56
Superconductivity 1. Electricity is the flow of electrons, and the material through which the electrons flow is called a
a. Resistor b. Capacitor c. Transformer d. Conductor
2. The phenomenon or superconductivity occurs when a material is
a. Heated to a very high temperature. b. Cooled to a very low temperature. c. Placed in a vacuum. d. In outer space.
3. A material is considered a superconductor when it
a. Becomes magnetized. b. Loses all resistance to electron flow. c. Becomes radioactive. d. Will no longer conduct electricity.
4. A breakthrough in superconductivity occurred when a material was discovered that would lose all resistance at
a. Temperatures above 77 degrees K. b. Temperatures below 77 degrees K. c. Room temperature. d. Absolute zero.
5. Superconductivity has great potential for improving
a. Power generation and distribution. b. Advanced electronic systems. c. Transportation systems including levitating trains. d. All of the above.
High-Technology Medicine 1. CAT scanners represent a major improvement over conventional X-ray technology because
a. They provide a cross-sectional view of the tissues within the human body. b. They are less expensive to use than X-ray machines. c. They take few pictures than X-ray machines. d. They preclude the need for surgery.
57
2. Sonography uses which of these technologies to look within the human body? a. Radar b. Sonar c. Lasers d. Sound waves
3. Digital subtraction angiographies (DSA) is an imaging technique that
a. Is not used in American hospitals. b. Is used to provide clear views of flowing blood or its blockage by narrowed
vessels. c. Does not involve the use of X-rays. d. Requires more dye to be injected into the patient than conventional angiograms.
4. PET scans
a. Are the same as CAT scans. b. Show an organ’s shape and structure but not how it is functioning. c. Offer functional perspectives of biochemistry in living tissue. d. Are never used in connection with brain or heart troubles.
5. Which of the following statements is true?
a. Hybrid organs that combine living tissue with synthetic parts are not possible. b. Artificial joints can be made out of stainless steel, plastic, or chromium. c. Results of mechanical heart transplants to date have been promising. d. The technology of artificial limbs for amputees has not changed in fifty years.
6. Which of the following is not true of medical laser technology?
a. It can be used in place of X-rays. b. It can be used for some types of surgery. c. It can be used to halt internal bleeding. d. It can be used to vaporize abnormal growths or tumors
Transportation Technology 1. How do the 1st and 2nd laws of Thermodynamics affect automobiles?
a. They do not affect modern engine technology. b. They set the theoretical limits of engine efficiency. c. They apply only to gasoline powered cars and not to diesel powered cars. d. They apply to both gasoline and diesel powered cars but not to electric cars.
2. The aerodynamic drag of an automobile
a. Increases in direct ratio to the speed of the car. b. Increases with the square of the vehicle speed. c. Is the same at any speed. d. Decreases at higher speeds.
58
3. An airplane flying at Mach 2 is traveling a. At over 2000 miles per hour. b. At about 1480 miles per hour. c. Twice the speed of light. d. At near the speed of sound.
4. The major advantage of antilock braking systems (ABS) is
a. Their ability to activate a car’s braking system even if the driver has fallen asleep. b. Their ability to permit a car to be steered even under heavy, emergency braking. c. Their low cost as compared with conventional braking systems. d. Their ability to detect obstacles on the road ahead and to activate the braking
system without the driver taking any action. 5. Which of the following statements is not true about automobile air bags?
a. Air bags are designed to inflate in a serious frontal crash that occurs at speeds over 12 mph.
b. Air bags often inadvertently inflate, causing accidents. c. Air bags have proven their ability to save lives in frontal crashes. d. Air bags inflate with 1/25 seconds faster than the blink of an eye.
6. The development of fly-by-wire systems means that future commercial aircraft will
a. Not require pilots. b. Facilitate quick pilot response to turbulence and other changing flying conditions c. Allow aircraft to be piloted from control stations on the ground. d. Eliminate the need for computers in the control system.
Super weapons and Arms Control 1. Which statement best describes the concept of mutually assured destruction?
a. The employment of nuclear weapons against an enemy’s missile sues and weapon control centers.
b. The ability to conduct a 1st strike so devastating that an enemy cannot strike back in retaliation
c. The situation in which either of two superpowers can absorb a nuclear first strike and still be capable of counterattacking, causing an unacceptable level of damage to the attacker.
d. The targeting of nuclear forces against an enemy leadership and command structure.
2. Under the triad concept, US strategic forces are divided into the following three components
a. Short-range, medium-range, and long-range missiles. b. Air-based, sea-based, and land-based systems. c. Mobile, fixed-based, and hidden systems. d. Nuclear forces, conventional forces and chemical warfare systems.
59
3. The original purpose of the Star Wars system was to a. Provide an assured capability to retaliate against a surprise attack. b. Defend the US against nuclear attack. c. Move all nuclear warfare to outer space. d. Limit nuclear attacks to military targets.
4. The lethality of modem warfare may make it necessary to
a. Increase the number of trained humans in battle. b. Reduce the costs of weapon systems. c. Increase the number of weapon systems in the arsenal. d. Remove the human from the system altogether.
5. Which of the following statements about antisubmarine is true?
a. Sound waves cannot penetrate seawater. b. Radar is used to detect and track submerged vehicles. c. Sonar detection equipment uses sound waves. d. Both active and passive sonars use infrared detection systems.
6. Which of the following statements is true?
a. Current seismic equipment is not sensitive enough to detect nuclear explosions anywhere in the world.
b. Nuclear detonations cannot be distinguished from earthquakes. c. New seismic technology can detect even small nuclear blasts from long distances. d. Seismic technology cannot estimate weapon yields with any degree of accuracy.
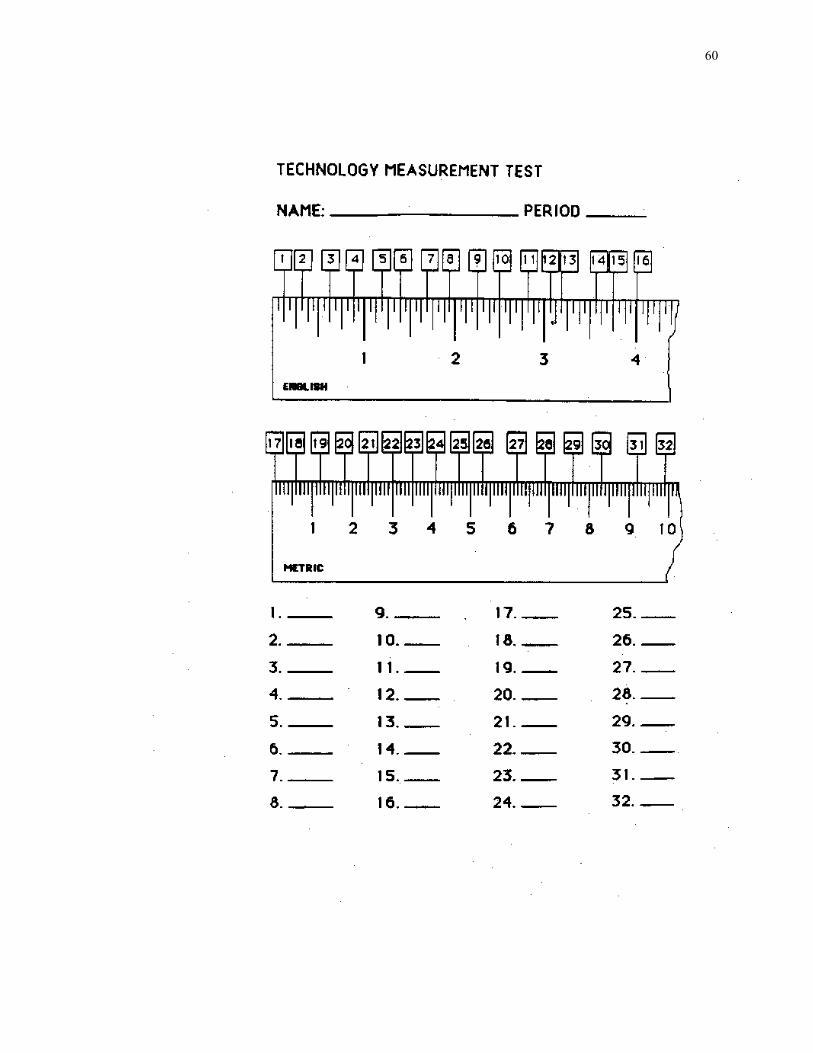
60

61
APPENDIX B
TABLES
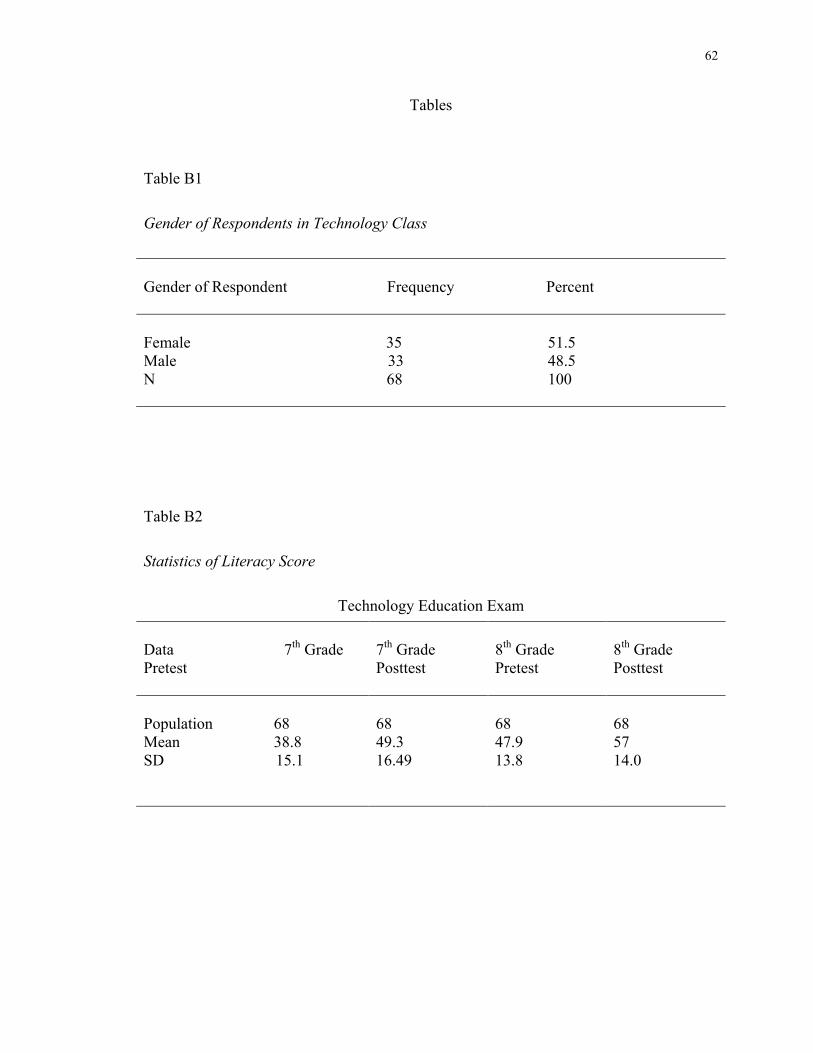
62
Tables
Table B1
Gender of Respondents in Technology Class
Gender of Respondent Frequency Percent Female 35 51.5 Male 33 48.5 N 68 100
Table B2
Statistics of Literacy Score
Technology Education Exam Data 7th Grade Pretest
7th Grade Posttest
8th Grade Pretest
8th Grade Posttest
Population 68 Mean 38.8 SD 15.1
68 49.3 16.49
68 47.9 13.8
68 57 14.0
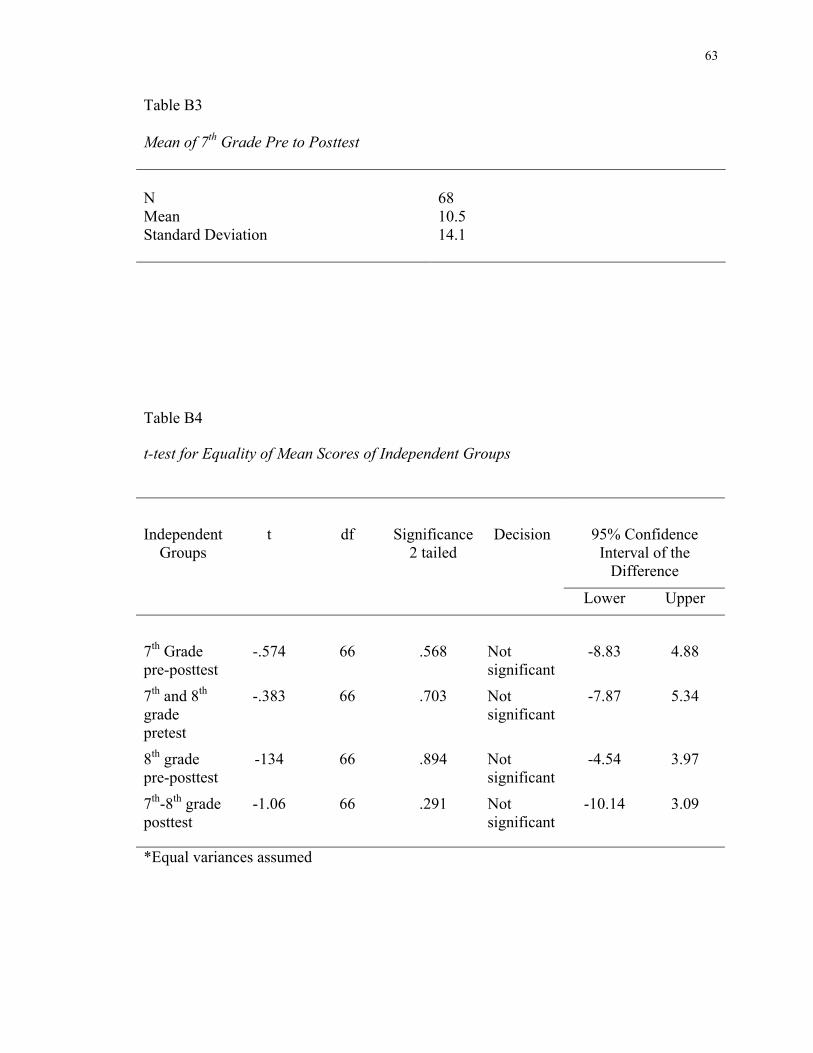
63
Table B3
Mean of 7th Grade Pre to Posttest
N Mean Standard Deviation
68 10.5 14.1
Table B4
t-test for Equality of Mean Scores of Independent Groups
95% Confidence Interval of the
Difference
Independent Groups
t
df
Significance 2 tailed
Decision
Lower Upper
7th Grade pre-posttest
-.574
66
.568
Not significant
-8.83
4.88
7th and 8th grade pretest
-.383 66 .703 Not significant
-7.87 5.34
8th grade pre-posttest
-134 66 .894 Not significant
-4.54 3.97
7th-8th grade posttest
-1.06 66 .291 Not significant
-10.14 3.09
*Equal variances assumed
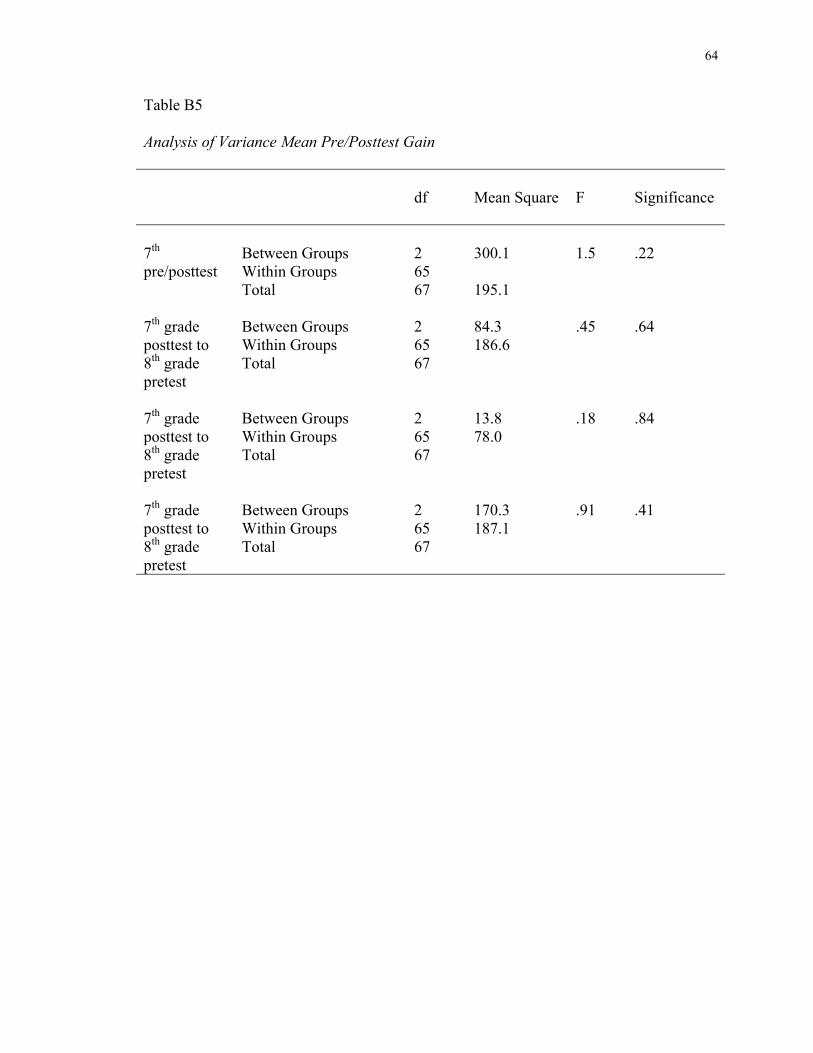
64
Table B5
Analysis of Variance Mean Pre/Posttest Gain
df
Mean Square
F
Significance
7th pre/posttest
Between Groups Within Groups Total
2 65 67
300.1 195.1
1.5
.22
7th grade posttest to 8th grade pretest
Between Groups Within Groups Total
2 65 67
84.3 186.6
.45 .64
7th grade posttest to 8th grade pretest
Between Groups Within Groups Total
2 65 67
13.8 78.0
.18 .84
7th grade posttest to 8th grade pretest
Between Groups Within Groups Total
2 65 67
170.3 187.1
.91 .41
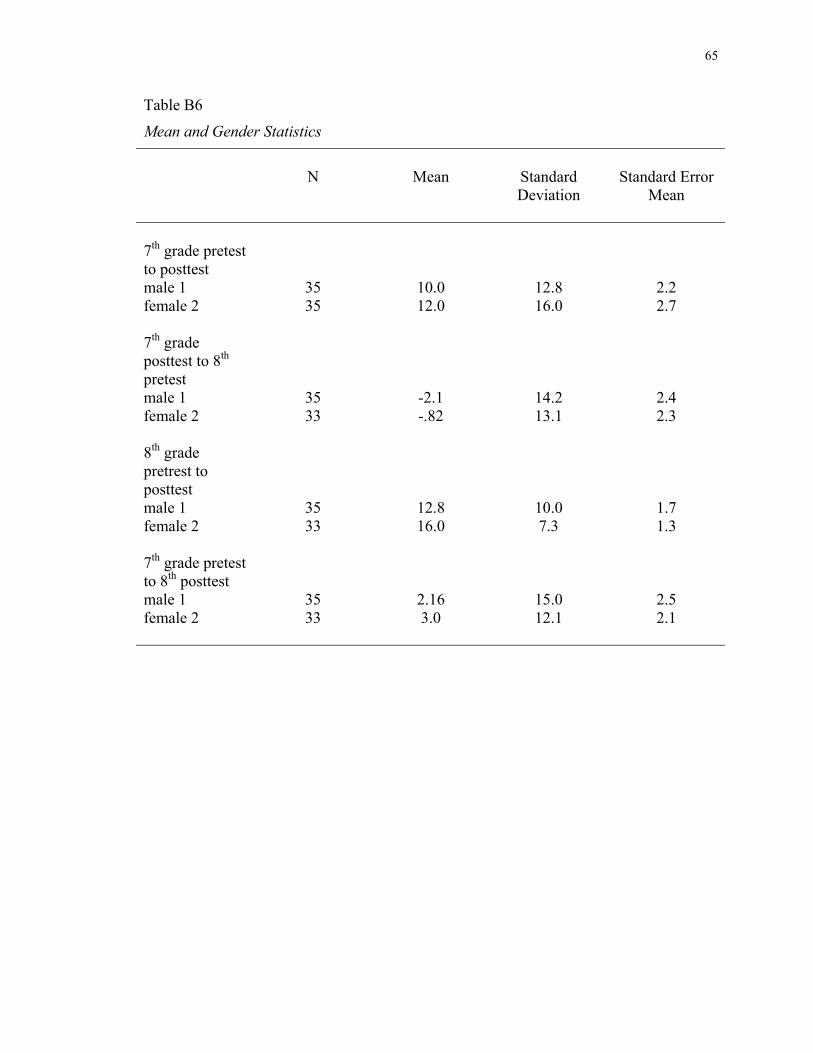
65
Table B6
Mean and Gender Statistics
N
Mean
Standard Deviation
Standard Error
Mean
7th grade pretest to posttest male 1 female 2
35 35
10.0 12.0
12.8 16.0
2.2 2.7
7th grade posttest to 8th pretest male 1 female 2
35 33
-2.1 -.82
14.2 13.1
2.4 2.3
8th grade pretrest to posttest male 1 female 2
35 33
12.8 16.0
10.0 7.3
1.7 1.3
7th grade pretest to 8th posttest male 1 female 2
35 33
2.16 3.0
15.0 12.1
2.5 2.1

66
Table B7
Technology Education Standards Measured
Technology Education Standards
Content
A.8.1
Show that technology has allowed us to further the efforts of science and, in turn, science has enabled us to develop better technology.
A.8.7 Discover that human will or desire can lead to the design of new technology in order to seize an opportunity or solve a problem.
B.8.1 Compare and contrast the function of each of the following common elements of technological systems: inputs, processes, outputs and feedback.
B.8.2 Analyze various systems and identify the ways in which they are controlled to produce a desired outcome.
B.8.4 Discover that resources are essential they must be used effectively to produce a desired outcome, and outputs from system may be inputs into another system.
B.8.7 Compare and contrast the use of tools, processes, and materials in diverse applications such as health care, space exploration…
C.8.6 Explain how changing the physical characteristics of material or the format of information can increase its usefulness.
D.8.2 Explain the importance of making projections, studying scenarios, and making thoughtful decisions because of the direct and indirect effects technology will have on the future.
D.8.3 Contrast the advantages and disadvantages of given technology and make adjustments or develop new technologies if disadvantages outweigh advantages.
D.8.4 Explain why people must think about how a new technology might affect other people, societies and the ecosystem in which we live.
D8. 5 Explain that people can control the technologies they develop and use and that people are responsible
______________________________________________________________________