Embed Size (px)
Citation preview
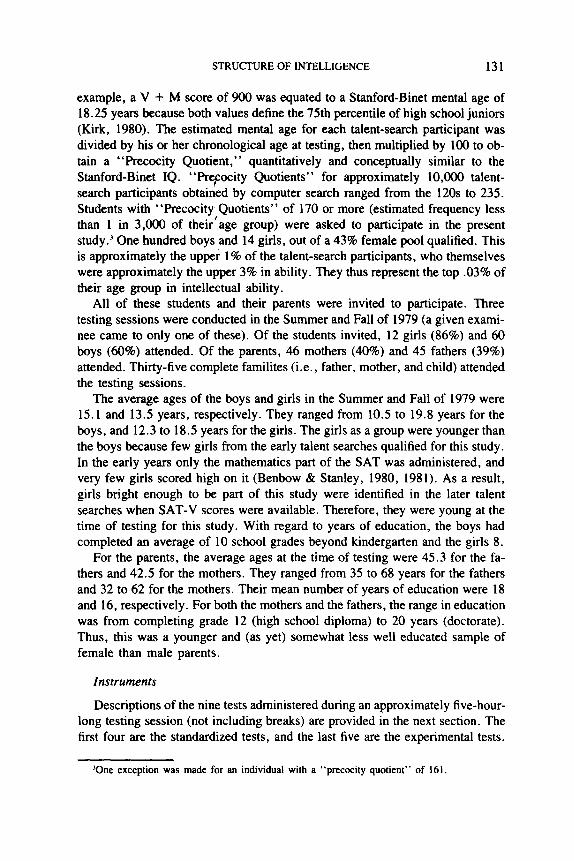
INTELLIGENCE 7, 129-152 (1983)
Structure of Intelligence in Intellectually Precocious Children and in Their
Parents*
CAMILLA PERSSON BENBOW
Study of Mathematically Precocious Youth (SMPY) The Johns Hopkins University
JULIAN C . STANLEY
Study of Mathematically Precocious Youth (SMPY) The Johns Hopkins University
MARSHALL K. KIRK Harvard University
ALAN B. ZONDERMAN
The Johns Hopkins University
Students representing the top 0.03% of their age group in intellectual ability, who were identified by the Study of Mathematically Precocious Youth (Benbow & Stanley, 1980), were tested along with their parents using a battery of specifically de- signed cognitive tests. These highly intelligent children had less intelligent, but yet quite bright parents. Vemon's (1961) model of intelligence best fits our results. His following two factors explained most of the variance in the performance of the stu- dents and parents: verbal-educational and practical-spatial-mechanical. Moreover, there was potential evidence for a general factor. Among the children, who were mostly past puberty, age related to development of verbal abilities, but not spatial or mechanical abilities. Sex differences favoring the males were found on the spatial abil- ity and mechanical comprehension tests.
F rom 1972 to 1979, the Study of Mathemat ica l ly Precocious Youth (SMPY)
identified approximate ly 10,000 jun ior high school students who reasoned quite
wel l mathemat ica l ly (Benbow & Stanley, 1980). As seventh and eighth graders,
several o f those students scored exceptionally high on the Col lege Board Scho-
*We thank Lynn M. Daggett, Lloyd G. Humphreys, Lola L. Minor, and Robert Plomin for their assistance. Correspondence and requests for reprints should be addressed to Camilla Persson Benbow, Department of Psychology, The Johns Hopkins University, Baltimore, MD 21218
129

130 BENBOW ET AL.
lastic Aptitude Test (SAT); mathematics (SAT-M) and verbal (SAT-V) portions (Angoff, 1971; Messick & Jungeblut, 1981). SMPY is interested in discovering the bases and associated characteristics of their extreme intellectual precocity.
Thus, in this study we tried to decipher how overall extreme intellectual pre- cocity relates to aptitude on difficult tests of certain specific mental abilities. Fur- thermore, we tried to learn which factor analytic model of intelligence could best account for their performance on these various tests? Is there strong evidence for a g or for specific factors? How do age and education relate to the development of various specific abilities? Finally, among the extremely precocious, are there sex differences in some specific abilities? Moreover, some of the students' parents were also tested with the same tests as the students. Their performance is dis- cussed and compared.
Aspects of assortative marriage and familiality of cognitive abilities in fami- lies of these extremely gifted students are discussed by Benbow, Zonderman, and Stanley (this issue). That study shows that the parents resembled one another to a higher degree than less able spouses did and that the children resembled their parents to a lesser extent than less able children resembled their parents.
Because the students in this investigation were so bright, some mental tests had to be designed specifically in order to provide an appropriate measure of these students' abilities. This circumvented the problem of "ceil ing" that most tests have when used with this type of population. As far as we are aware, a battery of tests of this kind for such a population has not yet been developed. Some piloting of the battery had already been done (Kirk, 1978b, 1979, 1980); this is the first fairly large-scale investigation validating those tests.
METHOD
Subjects
The student participants in this study were selected on the basis of their high scores on SAT-M and, when available, SAT-V, made at the time of their partici- pation in a talent search.-' These talent-search participants ranged in age, at that time, from 9 to 14. To control for the effects of age on performance, SAT-scaled scores were converted to age-adjusted scores. Stanford-Binet mental age equiva- lents were estimated for each SAT-M or SAT-V + SAT-M score from the 25th to the 99th percentile of a random sample of high school juniors taking the SAT, whose mean Stanford-Binet IQ is approximately 106 (Kirk, 1978a, 1980). For
JThe experimental tests are available upon request from Marshall K. Kirk, Department of Psy- chology, Harvard University, Cambridge, MA 02138.
2The six talent searches were conducted in March 1972, January-February 1973, January 1974, December 1976, January 1978, and January 1979. The SAT-M and SAT-V portions were adminis- tered every year except 1972 and 1974, when only the SAT-M was administered. The Test of Standard Written English was also taken by the students participating in 1978 and 1979.
STRUCTURE OF INTELLIGENCE 131
example, a V + M score of 900 was equated to a Stanford-Binet mental age of 18.25 years because both values define the 75th percentile of high school juniors (Kirk, 1980). The estimated mental age for each talent-search participant was divided by his or her chronological age at testing, then multiplied by 100 to ob- tain a "Precocity Quotient," quantitatively and conceptually similar to the Stanford-Binet IQ. "PreFocity Quotients" for approximately 10,000 talent- search participants obtained by computer search ranged from the 120s to 235. Students with "precocity Quotients" of 170 or more (estimated frequency less than 1 in 3,000 of their,age group) were asked to participate in the present study? One hundred boys and 14 girls, out of a 43% female pool qualified. This is approximately the upper 1% of the talent-search participants, who themselves were approximately the upper 3% in ability. They thus represent the top .03% of their age group in intellectual ability.
All of these students and their parents were invited to participate. Three testing sessions were conducted in the Summer and Fall of 1979 (a given exami- nee came to only one of these). Of the students invited, 12 girls (86%) and 60 boys (60%) attended. Of the parents, 46 mothers (40%) and 45 fathers (39%) attended. Thirty-five complete familites (i.e., father, mother, and child) attended the testing sessions.
The average ages of the boys and girls in the Summer and Fall of 1979 were 15.1 and 13.5 years, respectively. They ranged from 10.5 to 19.8 years for the boys, and 12.3 to 18.5 years for the girls. The girls as a group were younger than the boys because few girls from the early talent searches qualified for this study. In the early years only the mathematics part of the SAT was administered, and very few girls scored high on it (Benbow & Stanley, 1980, 1981). As a result, girls bright enough to be part of this study were identified in the later talent searches when SAT-V scores were available. Therefore, they were young at the time of testing for this study. With regard to years of education, the boys had completed an average of 10 school grades beyond kindergarten and the girls 8.
For the parents, the average ages at the time of testing were 45.3 for the fa- thers and 42.5 for the mothers. They ranged from 35 to 68 years for the fathers and 32 to 62 for the mothers. Their mean number of years of education were 18 and 16, respectively. For both the mothers and the fathers, the range in education was from completing grade 12 (high school diploma) to 20 years (doctorate). Thus, this was a younger and (as yet) somewhat less well educated sample of female than male parents.
Instruments
Descriptions of the nine tests administered during an approximately five-hour- long testing session (not including breaks) are provided in the next section. The first four are the standardized tests, and the last five are the experimental tests•
3One exception was made for an individual with a "precocity quotient" of 161.

132 BENBOW ET AL.
The experimental tests tended to be somewhat speeded for this group. Therefore, we could not calculate the internal consistency reliabilities of these tests. A lower bound estimate of the reliabilities could be obtained, however.
Lower bound estimates of the reliability coefficients for the experimental tests were estimated by using the well-known formula (Stanley, 1971, p. 400, For- mula 38) for correcting coefficients of correlation for attenuation due to errors of measurement. For the population of examinees the formula is:
Pxy ~,,,
°TxTy = %/ Pxx' N/' Oyy'
where PT~T, is the correlation coefficient between true scores on th~ two variables, Pxy is the correlation coefficient between obtained scores on the stand- ardized test X and the experimental test Y, V'~Pxx, is the reliability coefficient of the standardized test, and "~/lgyy i is the reliability coefficient of the experimental test.
l~I'xTy ~ 1,
the coefficient of correlation between true scores on parallel forms of the same test. The equation becomes
flxy
v px ' v/ ,y; '
Thus, multiplying both sides by W/pyy, one obtains
Pxy
3V/ Pyy' ~> ~ Pxx'
The lower bound estimate was figured for the actual r~ for every correlation between an experimental and a standardized test. The highest estimated reliabil- ity coefficient for each experimental test resulting from these computations was accepted as the lower-bound; of course, this capitalizes somewhat on chance.
For the spatial ability tests we could not get an accurate lower bound estimate of the reliability coefficients. Because a spatial ability measure with a known reliability coefficient was not administered, the correlation coefficients in the nu- merator of our formula for the lower bound estimate of the reliability coefficient of the experimental spatial ability test is the r between two tests of different abili- ties (i.e., spatial ability and ability on QED). The rs between the experimental spatial tests and the QED are undoubtedly considerably lower than would be ob- tained between experimental and standardized spatial ability measures.
The reliabilities of the standardized tests for the samples in this study were estimated by use of the following formula (see Stanley, 1971, p. 362):

STRUCTURE OF INTELLIGENCE 133
2 w h e r e % =
reliability = 1 - m
variance of errors of measurement as inferred from the test manual,
and SZx = obtained variance of group on test.
The Tests
The Quantitative Evaluative Device (QED), Form D, was designed to predict competence in the quantitative aspects of graduate research and study (Stake, 1962). Each of the 60 items has five choices, four of which share a common feature. The object is to select, by inductive reasoning, the one that does not share in the similarity. The score is corrected for guessing and is the number correct minus one-fourth the number incorrect (R - I/4W). The norm group (graduate education majors) yielded a matched-half reliability coefficient of .80. The best estimates for the reliabilities of the participants in our testing are. 84 for the boys, .88 for the girls and the mothers, and .92 for the fathers.
Form CC of the Owens and Bennett Mechanical Comprehension Test was de- signed " to measure the ability of an individual to understand various kinds of physical and mechanical relationships" (Owens & Bennett, 1949). This untimed test consisting of 60 problems, with five options each, is perhaps the most diffi- cult of its type. Each item is illustrated by a large, clear drawing on which the question and answer are based. Since the authors suggest that the test not be given to women, except when the individual would be entering a field in direct competition with men, the norms are based on men only. The reliability cor- rected by the Spearman-Brown formula was, long ago, . 80 for a combined group of male freshmen engineering majors and .75 for first-term engineering majors at Princeton. For the participants in our testing, the best estimates of reliability are .86 for the boys, .77 for the girls, and .91 for the fathers and the mothers.
The Concept Mastery Test, Form T was designed by the late Lewis M. Terman to test his gifted group' as adults. The test measures the ability to deal with abstract ideas at a high level? This untimed test consists of two parts: Part I (Synonyms and Antonyms) with 115 two-option items requiring the identifica- tion of pairs of words as the same or opposite in meaning, and Part II (Analogies) with 75 three-option items requiring the recognition of relationships in order to complete the analogies. Scoring for both parts is corrected for guessing: Part I, R - W; Part II, R - '/2W. Test-retest correlations reported in the test manual vary
'As children, most of the 1,528 members of this group scored at least 140 on the original (i.e., 1916) version of the Stanford-Binet Intelligence Scale (see (3den, 1968).
rrhis test is viewed by some as measuring chiefly vocabulary (Part I) and general information (Part II).

134 BENBOW ET AL.
from .86 (Air Force Captains) to .94 (undergraduate and graduate students and teaching assistants at Stanford University and the University of California). The Terman group's reliability coefficient was .87. Reliability estimates for the testing participants are .90 for the boys, .94 for the girls, and .93 for the fathers and mothers.
The three language subtests of the California Test of Mental Maturi~ (CTMM), Advanced Level, were designed to be used with adolescents and adult populations to obtain a measure of mental maturity. This test is not a specific ability test. It was used in order to study overall intellectual functioning of the children and their parents. The score used is the total correct for tests 14, 15, and 16. Test 14 consists of 15 arithmetic reasoning items in word-problem form; Test 15 consists of 15 items requiring logical reasoning; and Test 16 has 50 vocabu- lary definition items. The reliabilities on the complete CTMM are reported as .90 and above. If we can assume that these three subtests have about the same relia- bility as the complete test, then the reliability estimates for the testing partici- pants are about .92 for the girls and about .91 for the boys, fathers, and mothers. The reliability of the shorter version is probably smaller than the complete test, but not so different as to change these numbers radically.
Kirk's Synonym-Antonym Test, Form Cel, is a measure of the individual's knowledge of high-level vocabulary gained more from general reading (personal and educational) than from specific technical literature. The test consists of 100 two-option items similar to Part I of the Concept Mastery Test (see Figure 1), but more difficult.
Although the test is untimed, the directions state that 10 minutes should be sufficient for completion. Scoring is corrected for chance and is the number cor- rect minus the number wrong (R--W). The internal consistenc)~ reliability of a previous version (Form Be) was .93, based on Harvard-Radcliffe undergraduates and graduates (Kirk, 1978b, 1979). Our best estimated lower bound for the relia- bility coefficient of Form Cel is .79.
Kirk's General Information Test, Form Cel, is a measure of an individual's knowledge of facts, concepts, and terminology considered academically impor- tant. The 120 three-option items are divided equally among three content areas: mathematics and hard sciences, social sciences, and humanities (see Figure 1). Since no course of study could encompass the whole, scores are influenced more by general reading than by formal education, A bias against older adults, despite their lengthier education is probable since the test content contains relatively re- cent references (Kirk, personal communication). The test is untimed with a sug- gested completion time of 30 minutes. The score is based on the number correct minus one-half the number incorrect (R--V2W). The reliability of an earlier timed version (Form Be) was reported as .86 (Kirk, 1978b, 1979). Our estimate for Form Cel is a reliability coefficient of at least .71.
Kirk's Test of Semantic Comprehension, Form Cel, consists of Part I, 20 five- option sentence completion items, and Part II, 30 six-option proverb interpreta-

STRUCTURE OF INTELLIGENCE 135
tion items (see Figure 1). The test was designed to measure an individual's abil- ity to understand conceptually complex passages of written English in a high-school level vocabulary (Kirk, 1978b, 1979). Part I, with a 10-minute time limit, is scored on the number correct minus one-fourth the number incorrect (R--I/aWL Part II, also with a 10-minute time limit, is scored on the number correct minus one-fifth fthe number incorrect (R--1/5W). The total score is the sum of the scores for both Parts I and II. The reliability estimate is .66. We could perform an independent check on our lower bound estimate of the reliability co- efficient for this test. Using the correlation coefficient between the two subtests, we could estimate the reliability of the 20-item subtest. Then using the Spearman-Brown step-up formula, we estimated the reliability of the 50-item complete test. This came out to be .65, which agrees almost exactly with the first lower bound estimate. The correlation of the students' scores between Part I and Part II is .41, significant beyond the .001 level.
Kirk's Cubes Test, Form Be, is a spatial relationship scale that measures an individual's ability to form and manipulate mental images of objects (Kirk, 1978b, 1979). Each of the 30 two-option items shows three faces of each of the two members of a pair of cubes. A cube has a different figure on each of its six faces. The object is to determine whether or not the second cube could be any rotation of the first (see Figure 2).
There is a 5-minute time limit, and the score is the number of items marked correctly minus the number marked incorrectly (R--W). Our best minimum esti- mate is a reliability coefficient of at least .53, with Kirk estimating the reliability for his examinees at about. 80 (Kirk, personal communication). Our estimate is almost without a doubt considerably too small, since a standardized spatial abil- ity measure was not administered.
Kirk's Rotation-lnversion Test, Form Cel, is a test of spatial ability more complex than the Cubes Test; it also measures the ability to manipulate figures mentally (Kirk, 1978b, 1979). Each item consists of a lozenge with a heavy black line on one side and a figure in one comer. Answering the item correctly requires mentally inverting the lozenge and then rotating it until the heavy black line rests on the line provided (see Figure 2). The test consists of four separately timed pages (2 minutes each) containing 16 items each for a total of 64 items. The score is the number correct. Our best reliability estimate is at least .65, with Kirk estimating the reliability for his examinees at about .80 (Kirk, personal communication). As with the Cubes Test, our estimate of the reliability is proba- bly too small, since a standardized spatial ability measure was not administered.
Data Analysis
The nine tests described above were hand-scored, and the scoring was verified by a different scorer. Discrepancies in marking were checked by a third scorer. The statistical analyses were performed by computer, using the SPSS program

t~J
TE
ST
OF
SE
MA
NT
IC C
OM
PR
EH
EN
SIO
N A
ND
MA
NIP
UL
AT
ION
Par
t I:
Sen
tenc
e C
ompl
etio
n
Exa
mpl
e: I
. H
e w
as n
ot (
)
by h
is s
tupi
dity
; in
deed
, he
was
muc
h to
o (
) to
kno
w t
hat
he w
as s
tupi
d.
(a)
both
ered
-stu
pid
(b)
mad
e w
ealt
hy-p
oor
(c)
deli
ghte
d-ex
haus
ted
(d)
enli
ghte
ned-
inte
llig
ent
(e)
mad
e fa
mou
s-ob
scur
e
In t
he e
xam
ple
abov
e, o
nly
choi
ce (a
) re
nder
s th
e se
nten
ce m
eani
ngfu
l, c
oher
ent,
and
con
sist
ent.
The
oth
er c
hoic
es e
ithe
r do
not
"fo
llow
" fro
m
the
rest
of
the
sent
ence
, or
mak
e th
e se
nten
ce c
ontr
adic
tory
. Part
. II
: P
rove
rbs
Exa
mpl
e: I
. "S
trik
e w
hile
the
iro
n is
hot
."
(a)
Opp
ortu
nity
kno
cks
but
once
. (b
) F
ate
favo
rs t
hose
who
sei
ze t
he m
omen
t.
(c)
The
sho
emak
er's
chi
ldre
n go
bar
efoo
t.
(d)
A b
low
str
uck
in a
nger
is
repe
nted
at
leis
ure.
In t
he e
xam
ple
abov
e, (
a) a
nd (
b) c
lear
ly m
ean
that
you
sho
uld
take
adv
anta
ge o
f an
oppo
rtun
ity
whe
n th
e ti
me
is r
ipe.
Cho
ice
(d)
mea
ns t
he
oppo
site
. C
hoic
e (c
) ha
s no
thin
g to
do
wit
h th
e ot
her
prov
erbs
. Y
ou w
ould
mar
k a
and
b as
you
r an
swer
s.

TEST OF GENERAL INFORMATION
MA
TH
EM
AT
ICS
AN
D H
AR
D S
CIE
NC
ES
IT
EM
1-
-Ani
mal
lif
e in
clud
es _
_
alph
a-am
ino
and
-im
ino
acid
s, o
f w
hich
(a)
18-8
(b
) 22
-8
(c)
18-4
are
'ess
enti
al' t
o M
an.
HU
MA
NIT
IES
IT
EM
9
--In
An
ima
l F
arm
, S
now
ball
cor
resp
onds
sym
boli
call
y to
(a)
Len
in
(b)
Tro
tsky
(c
) S
tali
n
SO
CIA
L S
CIE
NC
ES
IT
EM
ll
--N
ort
h A
mer
ica
duri
ng t
he p
erio
d 17
00-1
800
was
mos
t po
liti
call
y li
ke
(a)
Afr
ica,
195
0-65
(b
) C
hina
, 18
50-6
5 (c
) In
dia,
194
8
SYNONYM
-ANTO
NYM
TEST
36
37
38
39
40
anti
pode
an ..
....
....
....
....
....
....
....
....
....
..
prop
inqu
itou
s m
alod
orou
s ..
....
....
....
....
....
....
....
....
....
. no
cent
de
mot
ic ..
....
....
....
....
....
....
....
....
....
....
. ul
tram
onta
ne
acum
inat
ed .
....
....
....
....
....
....
....
....
....
..
trun
cate
d ca
vali
er ..
....
....
....
....
....
....
....
....
....
....
. ob
sequ
ious
FIG
. 1.
Sam
ple
item
s fr
om
the
ver
bal
expe
rim
enta
l te
sts
L~

138
CUBES
BENBOW ET AL.
For each pair of Cubes, you are to determine whether the two Cubes could possibly be rotations of the same Cube.
ROTATION-INVERSION
Here is an example
charts ~-'-"'~~ ~ _ lozenge
For I mark 1 ) For - - mark 2
The little line will be in position b, and it will be vertical. So you should write bl as your answer.
FIG. 2. Sample items from the Cubes and Rotation-Inversion Tests Illustrating the Tests
(Nie, Hull, Jenkins, Skinbrenner, & Bent, 1975). Since age had a relationship with performance on the tests, as will be discussed later, we controlled for it statistically when analyzing relationships among the tests.
Results
Descriptive statistics from the testing sessions are shown by sex for the stu- dents and parents in Table 1. The mean "Precocity Quotients" were 186 for both boys and girls in the study. The analogous Stanford-Binet IQ would represent a frequency of less than l in 25,000 (Kirk, 1980). Clearly this group of students was highly precocious.
Quantitative Evaluative Device
On the QED both students and parents attained high scores (see Table 1). The children and parents scored at approximately the 97th and 86th percentiles, re- spectively, of potential University of Nebraska graduate students in education. Thus, both parents and students were well equipped to handle the quantitative aspects of research, even though some were only 12-years old at the time and one was 10.
QED appears to have a substantial verbal component for this group, as can be judged from its pattern of relationship with the other tests administered (Table 2). For the parents, QED ability correlated highly with all the other mental abilities

TA
BL
E
1 M
ean
Sco
res
by S
ex o
n th
e N
ine
Cog
niti
ve T
ests
Ad
min
iste
red
to
the
Exc
epti
onal
ly G
ifte
d S
tud
ents
and
Th
eir
Par
ents
and
th
e M
ean
Pre
coci
ty
Quo
tien
ts o
f th
e S
tud
ents
CT
MM
-Lan
gu
age
Mec
hani
cal
Men
tal
age
Sy
no
ny
m-
Pre
coci
ty Q
uoti
ent
Q.E
.D.
Co
mp
reh
ensi
on
C
MT
y
ears
A
nto
ny
m
SD
X
SD
X
SO
X
SD
X
SD
X
SO
Boy
s (6
0)
186
13
40
8 38
9
97
30
23.5
2.
1 18
15
G
irls
(12
) 18
6 18
37
9
28
7 98
40
22
.7
3.0
20
17
t of
t
= 4.
32
diff
eren
ce
ns
ns
p <
.001
n
s ns
n
s F
ath
ers
(43)
--
--
33
I1
40
11
11
8 38
24
.1
2.6
35
19
Mo
ther
s (4
5)
--
--
33
9 26
11
12
0 38
23
.5
2.6
35
17
tof
t=
5.5
diff
eren
ce
ns
p <
.001
ns
n
s n
s
Gen
eral
S
eman
tic
Rot
atio
n In
form
atio
n C
om
pre
hen
sio
n
Cu
bes
In
vers
ion
Boy
s (6
0)
32
13
17
6 21
8
28
15
Gir
ls (
12)
27
13
17
6 16
6
24
12
t of
t
= 2.
2 n
s di
ffer
ence
ns
ns
p
< .0
5 F
ath
ers
(43)
25
15
15
6
15
7 18
15
M
othe
rs (
4)
23
10
14
6 11
7
12
11
tof
t =
2.1
t
= 2.
3 di
ffer
ence
ns
n
s p
< .0
5 p
< .0
5

TA
BL
E 2
P
arti
al C
orre
lati
ons
of th
e P
erfo
rman
ces
on t
he V
ario
us M
enta
l A
bili
ty T
ests
for
Chi
ldre
n (N
=72
),
Fat
hers
(N
=43
),
and
Mot
hers
(N
=45
),
Con
trol
ling
for
Age
CT
MM
M
echa
nica
l L
angu
age
Syno
nym
- G
ener
al
Sem
anti
c R
otat
ion-
Q
ED
C
ompr
ehen
sion
C
MT
M
A
Ant
onym
In
form
atio
n C
ompr
ehen
sion
C
ubes
In
vers
ion
Pre
coci
ty
Quo
tient
Chi
ldre
n .4
0***
.2
3*
.42*
**
.55*
**
.32*
* .3
6***
.4
0***
.2
1"
.23*
QE
D
Chi
ldre
n .1
9 .3
0**
.39*
**
.34*
**
.34*
* .3
1"*
.40*
* .1
8 F
athe
rs
....
.7
1"**
.6
5***
.6
2***
.4
3**
.64*
**
.57*
**
.58*
**
.71"
**
Mot
hers
.6
7***
.6
4***
.7
9***
.5
6***
.5
2***
.4
7***
.4
4**
.54*
**
Mec
hani
cal
Com
preh
ensi
on
Chi
ldre
n .0
4 .2
6*
-.03
.3
5**
.21"
.3
3**
.47*
**
Fat
hers
.
..
..
.
.48*
**
.58*
**
.30*
* .6
7***
.5
0***
.5
8***
.6
9***
M
othe
rs
.46*
* .6
6***
.4
0**
.67*
**
.51"
**
.49*
**
.64*
**
CM
T
Chi
ldre
n .8
1"**
.7
1"**
.6
4***
.5
6***
.1
0 .0
7 F
athe
rs
..
..
..
..
..
..
.8
6***
.7
8***
.7
1"**
.7
2***
.3
5*
.46*
* M
othe
rs
.80*
**
.83*
**
.63*
**
.70*
**
.19
.40*
*
CT
MM
Lan
guag
e M
A
Chi
ldre
n .6
1"**
.7
4***
.6
0***
.2
0*
.24*
F
athe
rs
..
..
..
..
..
..
..
..
.6
7***
.7
1"**
.6
9***
.4
0**
.41"
M
othe
rs
.70*
**
.50*
**
.66*
**
.37*
* .5
8***

Syno
nym-
An
tony
m Children
Fathers
Moth
ers
.51"
**
.70*
**
.57*
**
,54"
**
.52*
**
.70*
**
.03
.08
.22
.05
.28*
.3
7**
General
Information
Children
Fathers
Moth
ers
.49*
**
.62*
**
.47*
**
.28*
* .3
6*
.33*
.31"
* .4
8***
.4
9***
Sem
anti
c C
ompr
ehen
sion
C
hild
ren
Fat
her
s M
othe
rs
.07
.51"
**
.27"
.22*
.4
6**
.61"
**
Sem
anti
c C
ompr
ehen
sion
C
hild
ren
Fat
her
s M
othe
rs
.55"
**
.68*
**
.60"
**
*p <
.05
**
p <
.0
1 **
*p <
.0
51

142 BENBOW ET AL.
tested (range of the 16 partial rs, .44--.80). For the children, these relationships were much less strong ( . 18 - . 40 ) , especially with ability on the mechanical comprehension test (. 19) and the Rotation-Inversion test (. 18). Particularly for the parents, the QED may serve as a reasoning test.
Mechanical-Comprehension Test
Males performed more than a standard deviation better than females (see Ta- ble 1), but within each sex the children did not perform significantly better or worse than the parents. Males performed at the 32nd percentile and females at about the 4th percentile of first-term Princeton University freshmen in engineer- ing. The norms, however, are old and probably demanding. Thus, these scores indicate relatively good performance for the males. For the females, the test was somewhat too difficult.
Concept Mastery Test
On the CMT (see Table 1) the students scored at about the 1 lth percentile and the parents at about the 23rd percentile of the Terrnan gifted group. The Terman gifted group is also an elite group against which to compare performance. As children, most of the 1,528 members of Terman's group had scored at least 140 on the Stanford-Binet Intelligence scale. The norms for CMT were based on the testing results for the group when its members were, on the average, 41 years old. The Terman cohort had been tested 10 years earlier, and their scores rose considerably during the 10-year time period. Taking this into account, and the fact that a rather select group of Air Force captains scored, on the average, only 60 points out of the possible 190, the performance of this group, especially that of the students, was extremely high (see Bayley & Oden, 1955). The students scored almost 40 points more than the Air Force captains, and the parents almost 60 points more. When these students become as old as their parents were when tested, undoubtedly they will score higher than them on CMT.
CTMM-Language Factor
The point scores on the sum of these three tests were translated into mental ages. 6 It is clear that verbally both the parents and students are extremely able (see Table 1). Since the students received approximately the same mental age score as the parents, they are abler relative to their age than the parents, as would be expected from regression to the mean (i.e., the students, but not their parents, were selected on the basis of ability). The boys, girls, fathers, and mothers aver- aged, respectively, the following verbal IQs: 164 (SD = 16), 171 (SD = 15),
6It should be noted that, when comparing mental ages, a usual convention is that all individuals 16 years or older are assigned a chronological age of 15.

STRUCTURE OF INTELLIGENCE 143
151 (SD = 17), and 148 (SD = 17). This test was probably too easy for the group, especially for some of the parents. We do not know how highly several of the parents could have scored on a more difficult test of this type.
Synonym-Antonym Test
Out of 100 possible questions corrected for chance, the children scored, on the average, 18 and the parents 35. Approximately two-thirds of the children's scores fell in the range 4 through 32. For the parents, this range was 12 through 54. For the examinees as a group, this test was too difficult at this time.
The strong partial rs, controlling for age, of Synonym-Antonym Test scores with performance on the CMT and CTMM Language (.71--.84) indicate that this test measures verbal ability (see Table 2). Scores on the Synonym-Antonym Test also correlated rather highly with those on the other experimental verbal tests.
General Information Test
The mean corrected-for-chance score on this test, out of a possible 120, was 31 for the students and 24 for the parents. The range in which two-thirds of the scores fell was 20 to 44 for the students and 13 to 36 for the parents. The higher student scores support Kirk's claim (Kirk, personal communication) that this test is probably biased against older adults. Also, it is too difficult for the group as a whole.
From the pattern of intercorrelations in Table 2, it does not appear that this test measures only verbal ability or information obtained through verbal means. Mechanical and spatial ability related substantially to performance on the Gen- eral Information Test, but less so than the verbal tests did. This provides some evidence for the validity of the test as a measure of knowledge of information in 35 different areas.
Semantic Comprehension Test
Out of a possible corrected-for-chance score of 50, the students' mean was 17 and the parents' 14. Thus, the children were somewhat abler verbally than the parents (p < .001), which was also found with the CTMM and the General In- formation Test, but not the CMT.
The Semantic Comprehension Test correlated rather strongly (.56-.76) with the CMT and the CTMM Language factor (Table 2), indicating that it does measure verbal ability.
Cubes Test
On this 5-minute 30-item spatial ability test there appeared a significant sex difference in favor of the males, even for this high ability group, for both children and parents (see Table 1), as is commonly found in the general population (see

144 BENBOW ET AL.
Bumett, Lane & Dratt, 1979; Wittig & Petersen, 1979). Furthermore, the boys scored considerably better than their fathers, and the girls better than their mothers on this appropriately difficult spatial ability test.
Unfortunately, standardized spatial ability tests were not administered to be used as markers to see what aspects of spatial ability the Cubes Test does indeed measure. It does, however, correlate rather highly (.56 --.68) with the other ex- perimental spatial ability test, Rotation-lnversion. The Cubes Test has face valid- ity for measuring rotational ability in three-dimensional space (see Figure 2).
Rotation-Inversion Test
This 64-item spatial ability test was far too difficult for the parents, but only slightly too difficult for the typical student in this study (Table 1). Again, a po- tential sex difference emerged in favor of males, but was statistically significant only for the parents.
Since standardized spatial ability tests were not administered as markers for spatial ability, we cannot be sure that the test performs its function. The test has face validity (see Figure 2). It may have measured, in part, especially for the parents, the examinees' ability to understand the instructions. The somewhat stronger verbal component in this test than in the Cubes Test would seem to sup- port this contention (see Table 2). 7 Better instructions than those that were supplied with the test were needed.
Sex Differences
The most striking sex difference was that so few females qualified to partici- pate in this study (i.e., 14 girls vs. 100 boys). This occurred because girls in SMPY's talent searches tended to score lower than boys on the test of mathemat- ical reasoning ability (Benbow & Stanley, 1980, 1981), especially in the earlier of the six searches. As in the Terman studies (Burks, Jensen, & Terman, 1947; Terman, 1925), we found many more highly able boys than girls.
Although no sex differences were seen in the precocity quotients and perform- ance on the verbal tests, a distinct sex difference favoring the males emerged on the spatial ability tests and the test of mechanical comprehension. Actually, the girls may have been slightly abler verbally than the boys. Because of sample size, these results are only suggestive of possible sex differences on difficult spa- tial and mechanical comprehension tests among extremely able students.
~Because the parents were tested separately from their children and, therefore, necessarily by different examiners, one cannot rule out the possibility that one examiner gave more effective instruc- tions for taking some of these unusual tests than the other did. This would probably affect scores on the Cubes Test and the Rotation-lnversion Test more than the others.
STRUCTURE OF INTELLIGENCE 145
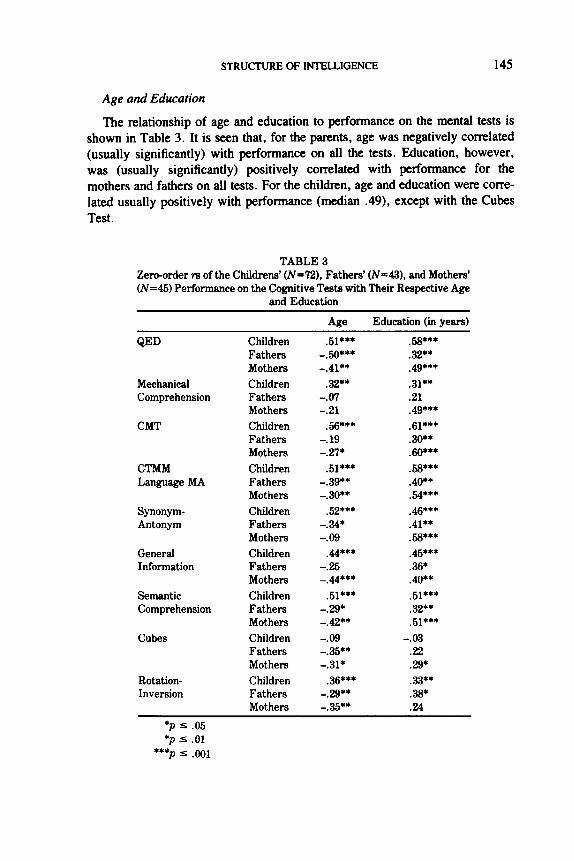
Age and Education
The relationship of age and education to performance on the mental tests is shown in Table 3. It is seen that, for the parents, age was negatively correlated (usually significantly) with performance on all the tests. Education, however, was (usually significantly) posit ively correlated with performance for the mothers and fathers on all tests. For the children, age and education were corre- lated usually posit ively with performance (median .49), except with the Cubes
Test.
TABLE 3 Zero-order rs of the Childrens' (Nffi72), Fathers' (N=43), and Mothers' (N=45) Performance on the Cognitive Tests with Their Respective Age
and Education
Age Education (in years)
QED Children .51"** .58*** Fathers -.50*** .32** Mothers -.41"* .49***
Mechanical Children .32** .31"* Comprehension Fathers -.07 .21
Mothers -.21 .49*** CMT Children .56*** .61"**
Fathers -. 19 .30"* Mothers -.27* .60***
CTMM Children .51"** .58*** Language MA Fathers -.39** .40**
Mothers -.30** .54*** Synonym- Children .52*** .46*** Antonym Fathers -.34* .41"*
Mothers -.09 .58*** General Children .44*** .45*** Information Fathers -.25 .36*
Mothers -.44*** .40** Semantic Children .51"** .51"** Comprehension Fathers -.29* .32**
Mothers -.42** .51"** Cubes Children -.09 -.03
Fathers -.35** .22 Mothers -.31" .29*
Rotation- Children .36*** .33** Inversion Fathers -.29** .38*
Mothers -.35** .24
*p -< .05 *p -< .01
***p "< .001

146 BENBOW ET AL.
Because of the negative correlation of age with ability for the parents, parents were grouped by age and then their performance was compared. There was a clear trend for the older parents to do more poorly on the tests. Thus, it was not some parents extremely outside the range in age who performed poorly and caused the negative correlations with age.
The relationship of age to test performance is different for these adults than for these children. For the latter, age and education were highly correlated (r = .86, p < .001), while negatively correlated for the mothers (r = - . 18) and the fa- thers (r = - .41, p < .01) Thus, understandably, for the students the age and education variables are measuring virtually the same thing, but not for adults. This occurs partly because many of these youths (age range 10 to 20 years) are still progressing educationally one school grade per year, whereas their parents are aging without completing another grade.
There is a large literature on correlations of abilities with age (e.g., Eisdorfer & Wilkie, 1973; Jarvik, Eisdorfer, & Blum, 1973; Matarazzo, 1972; Owens, 1966; Schaie & Strother, 1968; Wechsler, 1944). In longitudinal research there is little or no evidence of decreasing ability with age. Cross-sectional studies, however, found results similar to ours. Generational differences in nutrition, ed- ucation, and other opportunities can account for most of the differences found between age cohorts. That high verbal ability does not diminish with age was clearly demonstrated in the Terman group (Oden, 1968).
Our results suggest that during the adolescence of brilliant youths, verbal abil- ity improves with age. Development of spatial and mechanical comprehension abilities may be mostly complete by the time adolescence is reached.
lntercorrelation of the Performance on the Exams
The students', mothers', and fathers' performance on the exams were intercorrelated within themselves, with age partialled out (Table 2). Because of the small number of girls (12), their correlation coefficients are not presented separately from the boys. It appeared that the parents' high performance on one test meant an overall high level of performance on the other cognitive tests, which was also true, but to a lesser degree, for the students. This suggests that the general factor, g, of Spearman (1904) was operating, especially for the par- ents. Interestingly, the separate-by-sex partial correlations were indicative of a stronger influence of g among the girls than among the boys.
The above conclusions were supported by component analyses performed separately for the students, fathers, and mothers on age-adjusted scores on the specific mental ability tests? In Table 4 the factor matrix, using principal com- ponents having eigenvalues greater than one, and the communalities are
~The CTMM test is more similar to a general intelligence test than to a specific mental ability test. Thus, it was excluded from this analysis.

STRUCTURE OF INTELLIGENCE 147
repesented. For all three groups (children, mothers, and fathers) two components with eigenvalues greater than one emerged. For the children, they accounted for 63% of the variance in age-adjusted scores, for the fathers 76%, and for the mothers 73% (see Table 4).
The communality of each variable indicates the extent to which its variance can be accounted for on the basis of the common factors. Clearly for the children, some of the variables, especially the QED and the mechanical comprehension tests, do measure a great amount that is unique. For both the fathers and mothers, however, the communalities indicated that the tests appeared to be measuring something in common to all the tests, probably general intelligence.
The principal components were then rotated by the Kaiser normalization pro- cedure. The resulting factor matrix is shown in Table 5. The first factor for the children, which loaded on everything but the three spatial-mechanical tests, seems similar to Vernon's (1961) verbal-educational factor (V:ed). Their second factor, which loaded most highly on the spatial-mechanical tests, seems similar to Vernon's practical-spatial-mechanical factor (K:m). The correlation between factors was .25.
The rotated factor structure for the fathers and mothers was similar to, but not the same as, that obtained for the children (see Table 5). The first factor appears to be the verbal-educational factor, since it loads most highly on the verbal tests. The second factor may also be the practical-spatial-mechanical factor of Vernon, since it loads most highly on the spatial and mechanical tests and the QED. The two factors were correlated (approximately .40) which provides evidence that Spearman's g may be influencing the performance of the parents.
As a cautionary note, the presence of sex differences in means on the spatial- mechanical tests attenuates the correlations between the spatial-mechanical tests and the verbal tests. This increases the separation between the two factors for the children as compared to the separate factor analyses for fathers and mothers by sex. The separate-by-sex correlations for the students, however, indicate that perhaps the boys' factors would be less correlated than the girls' would be. Un- fortunately, our sample size is too small to test this hypothesis.
DISCUSSION
This study was conducted to further test the most brilliant students the Study of Mathematically Precocious Youth (SMPY) had identified over a 7-year period. Some of their parents were also tested. Difficult, high-level tests of several spe- cific mental abilities were used. Because of the extreme precocity of the group, some of the tests had to be designed specifically for use with such subjects.
As expected, it was found that selecting for highly able students also selects for parents who are highly able, though somewhat less so than their brilliant off- spring. Regression towards the mean predicts this. Previous studies have shown that selection of high-ability parents yields children who score closer to the mean

OO
TABLE 4
Fir
st T
wo
Prin
cipa
l C
ompo
nent
s fo
r Age
-Adj
uste
d S
core
s on
Eig
ht M
enta
l A
bili
ty T
ests
and
The
ir C
omm
unal
ities
Sep
arat
ely
for
Chi
ldre
n (N
=72
),
Fat
hers
(N
=43
), a
nd M
othe
rs (
N=
45)
Chi
ldre
n F
athe
rs
Mot
hers
Comp
onen
t Co
mmun
alit
y Co
mpon
ent
Comm
unal
ity
Comp
onen
t Co
mmun
alit
y 1
2 1
2 1
2
QE
D
.58
.i0
.35
.82
-.26
.7
4 .7
7 .1
2 .6
1 M
echa
nica
l C
ompr
ehen
sion
.4
8 .5
0 .4
8 .8
0 -.
27
.71
.81
.29
.74
Con
cept
M
aste
ry t
est
.74
-.53
.8
2 .7
9 -.
46
.83
.76
-.55
.8
8 Sy
nony
m-A
nton
ym
.73
-.44
.7
2 .6
3 .6
8 .8
6 .7
4 -.
54
.84
Gen
eral
In
form
atio
n .8
3 -.
09
.70
.80
.35
.77
.77
-.05
.5
9 Se
man
tic
Com
preh
ensi
on
.72
-.24
.5
7 .8
0 .1
3 .6
5 .7
8 -.
21
.66
Cub
es
.43
.71
.69
.64
-.59
.7
6 .5
4 .6
5 .7
1 R
otat
ion
Inve
rsio
n .4
9 .6
9 .7
2 .7
4 -.
50
.80
.74
.46
.76
Eig
enva
lue
3.3
1.8
4.6
1.6
4.4
1.4
Per
cent
of
Var
ianc
e E
xpla
ined
41
. 22
. 57
. 19
. 55
. 17
.
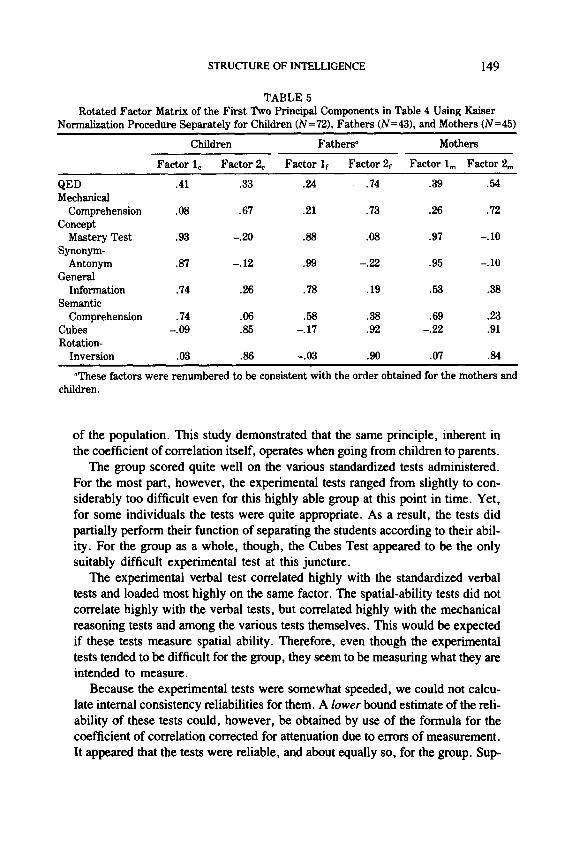
STRUCTURE OF INTELLIGENCE 149
TABLE 5 Rotated Factor Matrix of the First Two Principal Components in Table 4 Using Kaiser
Normalization Procedure Separately for Children (N=72), Fathers (N=43), and Mothers (N=45)
Children Fathers ° Mothers
Factor 1~ Factor 2~ Factor If Factor 2f Factor lm Factor 2m
QED .41 .33 .24 .74 .39 .54 Mechanical
Comprehension .08 .67 .21 .73 .26 .72 Concept
Mastery Test .93 -.20 .88 .08 .97 -. 10 Synonym-
Antonym .87 -. 12 .99 -.22 .95 -. 10 General
Inforrnation .74 .26 .78 .19 .53 .38 Semantic
Comprehension .74 .06 .58 .38 .69 .23 Cubes -.09 .85 -. 17 .92 -.22 .91 Rotation-
Inversion .03 .86 -.03 .90 .07 .84
aThese factors were renumbered to be consistent with the order obtained for the mothers and children.
of the population. This study demonstrated that the same principle, inherent in the coefficient of correlation itself, operates when going from children to parents.
The group scored quite well on the various standardized tests administered. For the most part, however, the experimental tests ranged from slightly to con- siderably too difficult even for this highly able group at this point in time. Yet, for some individuals the tests were quite appropriate. As a result, the tests did partially perform their function of separating the students according to their abil- ity. For the group as a whole, though, the Cubes Test appeared to be the only suitably difficult experimental test at this juncture.
The experimental verbal test correlated highly with the standardized verbal tests and loaded most highly on the same factor. The spatial-ability tests did not correlate highly with the verbal tests, but correlated highly with the mechanical reasoning tests and among the various tests themselves. This would be expected if these tests measure spatial ability. Therefore, even though the experimental tests tended to be difficult for the group, they seem to be measuring what they are intended to measure.
Because the experimental tests were somewhat speeded, we could not calcu- late internal consistency rcliabilities for them. A lower bound estimate of the reli- ability of these tests could, however, be obtained by use of the formula for the coefficient of correlation corrected for attenuation due to errors of measurement. It appeared that the tests were reliable, and about equally so, for the group. Sup-
150 BENBOW ET AL.
port was found for the caution in the Mechanical Comprehension Test (Form CC) Manual that it may be too difficult for women.
Performance on the tests was associated with age and education. Education related positively with performance on all the tests, but least with the spatial abil- ity and mechanical comprehension tests. For the parents, age related negatively to performance, a result previously found for cross-sectional studies on develop- ment of abilities, but not usually found in longitudinal studies. It is probably an artifact of differences in education and opportunities. For the children, however, performance on the verbal tests improved with age. This clearly indicates that the students' verbal abilities are still developing.
It is interesting to note that age and education related least, or not at all, to ability on the spatial and mechanical comprehension tests. Development of spa- tial ability has been studied extensively (e.g., Wittig & Petersen, 1979). Puberty seems to halt the development of spatial ability (Waber, 1976, 1977). Our behavioral data are consistent with this viewpoint.
Component analyses were performed on the age-adjusted partial rs separately for children, fathers, and mothers. The factor structure was similar for the three groups. Two principal factors were derived for each. For the parents, the first two principal factors correlated about .40. This is evidence that a general factor (Spearman, 1904) may be operating. Thus, for the parents, overall high ability on one test tended to relate to high ability on the other tests. Upon rotation of the parents' principal factors, the first factor appeared to be Vernon's verbal- educational (V:ed) and the second factor Vernon's practical-spatial-mechanical (K:m). They could explain 76% of the variance in the fathers' scores and 73% of the variance in the mothers' scores.
For the children, the evidence for Spearman's (1904) g was less compelling, although it seemed perhaps to be more so for the girls than the boys. The two factors, which accounted for 63% of the variance, correlated only .25. The first factor appeared to be Vernon's verbal-education and the second factor Vernon's practical-spatial-mechanical.
Thus, our data seem to fit the model of intelligence postulated by Vernon (1961). First, some evidence for g was found. Since the students were selected for high ability and the parents were also highly able, it would be expected that the effect of g would be somewhat reduced in this group. In samples not selected for intellectual ability, g can account for as much as 50% of the variance in the matrix. The parents were less able than the children. As would be expected by this reasoning, the evidence for g was stronger for the parents than for the chil- dren. We also found factors resembling Vernon's V:ed and K:m. In conclusion, Vernon's (1961) model of intelligence seems to best explain the performance of our high-ability subjects.
Even among such highly intelligent individuals, sex differences were appar- ent. The most conspicuous result was the number of girls qualifying for this study of children with "precocity quotients" of 170 or more. For every girl qual-

STRUCTURE OF INTELLIGENCE 151
ifying, seven boys qualified. This was most likely the result of the girls' lower mathematical reasoning scores (Benbow & Stanley, 1980, 1981), which were an important component in ascertaining the "precocity quotients." Other sex differ- ences in mental ability also occurred for the children and their parents. As has been found for populations unselected in ability (e.g., Burnett, Lane, & Dratt, 1979; Wittig & Petersen, 1979), high ability females do not perform as well as high ability males on mechanical comprehension or spatial ability tests. The girls tended to be younger than the boys, as few extremely precocious girls were found in the early talent searches. Age was positively related to performance on the tests, but much less so for the spatial ability and the mechanical comprehen- sion tests. Thus, the age difference cannot account for these sex differences.
Another problem that the data in this article help address is assessing the de- gree of familiality of cognitive abilities and also of assortative mating. Benbow, Zonderman, and Stanley (this issue) did such an analysis. They showed that the parents resembled one another to a higher degree than the parents of less able children, and that the children resembled their parents to a lesser extent than less able children resemble their parents. This indicated that the etiology of individual differences at the high end of the distribution of intellectual abilities may n o t be similar to that in the rest of the distribution.
In conclusion, this study demonstrated that highly able children tend to have highly able parents. Moreover, Vernon' s ( 1961) model of the structure of intelli- gence appears to best fit our data. Verbal ability continues to develop during ado- lescence, but mechanical comprehension and spatial ability seem not to increase much during this period.
REFERENCES
Angoff, W. (Ed.) The College Board admissions testing program. Princeton, NJ: College Entrance Examination Board, 1971.
Bayley, N., & Oden, M. H. The maintenance of intellectual ability in gifted adults. Journal oJ Gerontology, 1955, 10, 91-107.
Benbow, C. P., & Stanley, J. C. Sex differences in mathematical ability: Fact or artifact? Science, 1980, 210, 1262-1264.
Benbow, C. P., & Stanley, J. C. Mathematical ability: Is sex a factor? Science, 1981,212, 118-121. Burks, B. S., Jensen, D. W., & Terman, L. M. The promise of youth: Follow-up studies of a thou°
sand gifted children. Genetic studies of genius (Vol. 3). Stanford, CA: Stanford University Press, 1947.
Burnett, S. A., Lane, D. M., & Dratt, L. M. Spatial visualization and sex differences in quantitative ability. Intelligence, 1979, 3, 345-354.
Eisdorfer, C., & Wilkie, F. Intellectual changes with advancing age. In L. F. Jarvik, C. Eisdorfer, & J. E. Blum (Eds.), Intellectual functioning in adults. New York: Springer, 1973.
Jarvik, L. F., Eisdorfer, C., & Blum, J. E. Intellectual functioning in adults. New York: Springer, 1973.
Kirk, M. K. Personal Communication, Nov. 1979. Kirk, M. K. The form of the curve of distribution of intellectual superdeviance: An empirical study.
Unpublished manuscript, 1978. (a)

152 BENBOW ET AL.
Kirk, M. K. The standardization of the ASMT, Form AE: Technical report. Unpublished manuscript, 1978. (b)
Kirk, M. K. Field testing of the ASMT--BE: Preliminary results, interpretations, and revision. Un- published manuscript, 1979.
Kirk, M. K. Generic end-testing of the intellectually brilliant at early maturity. Unpublished bache- lor's thesis, Harvard University, 1980.
Matarazzo, J. D. Wechsler's measurement and appraisal of adult intelligence (Sth ed). Baltimore, MD: Williams & Wilkins, 1972.
Messick, S., & Jungeblut, A. Time and method in coaching for the SAT. Psychological Bulletin, 1981, 89, 191-216.
Nie, N. H., Hull, C. H., Jenkins, J. G., Skinbrenner, K., & Bent, D. H. SPSS: Statisticalpackage for the social sciences (2nd ed). New York, NY: McGraw-Hill Book Co., 1975.
Oden, M. H. The fulfillment of promise: 40-year follow-up of the Terman gifted group. Genetic Psychology Monographs, 1968, 77, 3-93.
Owens, W. A. Age and mental abilities: A second adult follow-up. Journal of Educational Psychol- ogy, 1966, 57, 311-325.
Owens, W. A., & Bennett, G. K. Manual for the Mechanical Comprehension Test--Form CC. New York, NY: The Psychological Corporation, 1949.
Schaie, K. E., & Strother, C. R. A cross-sectional study of age changes in cognitive behavior. Psy- chological Bulletin, 1968, 57, 326-336.
Spearman, C. General intelligence, objectively determined and measured. American Journal of Psy- chology, 1904, 15, 201-293.
Stake, R. E. A non-mathematical quantitative aptitude test for the graduate level: The QED. Journal of Experimental Education, 1962, 1, 81-83.
Stanley, J. C. Reliability. In R. L. Thorndike (Ed.), Educational measurement (2nd ed). Washington, DC: American Council on Education, 1971.
Terman, L. M. Mental and physical traits of a thousand gifted children. Genetic studies of genius (Vol. l). Stanford, CA: Stanford University Press, 1925.
Vernon, P. E. The structure of human abilities (2nd ed). London: Methuen, 1961. Waber, D. P. Sex differences in mental abilities: A function of maturation rate? Science, 1976, 192,
572-574. Waber, D. P. Sex differences in mental abilities, hemispheric lateralization, and rate of physical
growth at adolescence. Developmental Psychology, 1977, 13, 29-38. Wechsler, D. The measurement and appraisal of adult intelligence. Baltimore, MD: Williams &
Wilkins, 1958. Wittig, M. A., & Petersen, A. Sex-related differences in cognitive functioning: Developmental is-
sues. New York: Academic Press, 1979.