Embed Size (px)
Citation preview
Structure and Dynamics
Industry and Regional Development BranchMinistry of Economic Development
June 2002
1
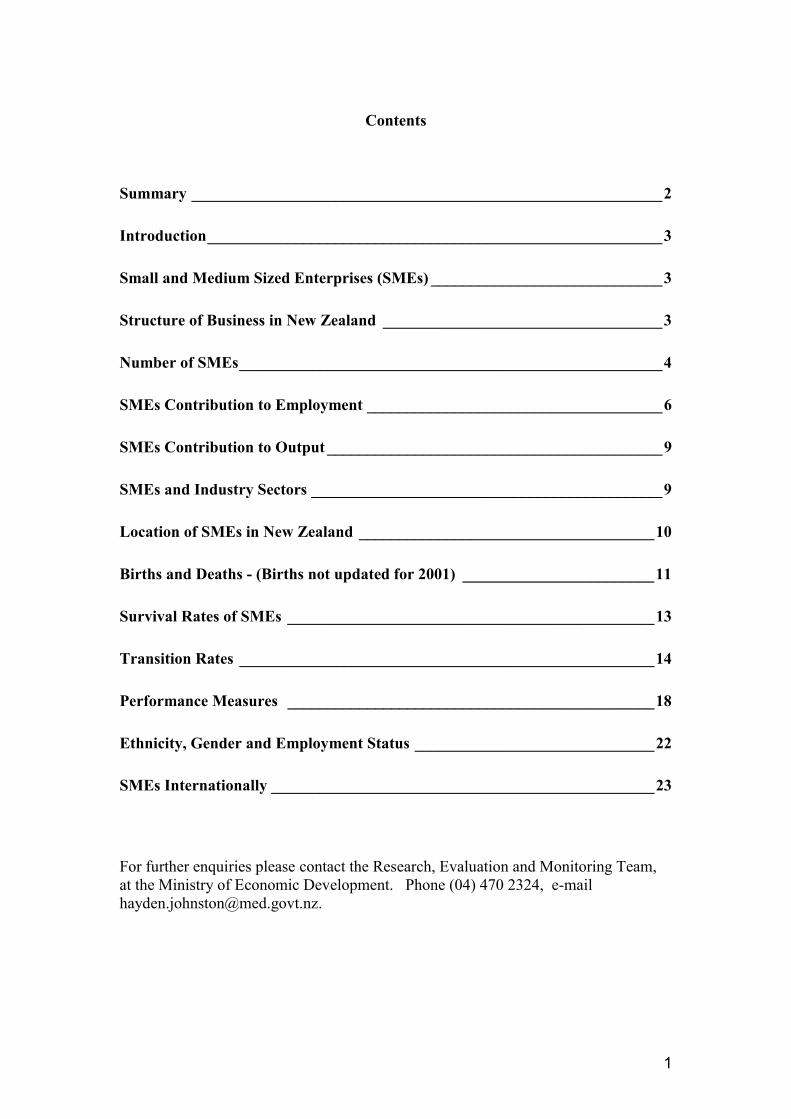
Contents
Summary ___________________________________________________________2
Introduction_________________________________________________________3
Small and Medium Sized Enterprises (SMEs) _____________________________3
Structure of Business in New Zealand ___________________________________3
Number of SMEs_____________________________________________________4
SMEs Contribution to Employment _____________________________________6
SMEs Contribution to Output __________________________________________9
SMEs and Industry Sectors ____________________________________________9
Location of SMEs in New Zealand _____________________________________10
Births and Deaths - (Births not updated for 2001) ________________________11
Survival Rates of SMEs ______________________________________________13
Transition Rates ____________________________________________________14
Performance Measures ______________________________________________18
Ethnicity, Gender and Employment Status ______________________________22
SMEs Internationally ________________________________________________23
For further enquiries please contact the Research, Evaluation and Monitoring Team,at the Ministry of Economic Development. Phone (04) 470 2324, [email protected].
2
Summary
Small and medium sizedenterprises constitute themajority of all enterprises inNew Zealand….
…and the number of SMEsis decreasing.
In line with this increasehas been a decline in theaverage enterprise size.
SMEs also account for asignificant proportion oftotal employment…
….and output.
SMEs have played a keypart in the increase inenterprise dynamic inNew Zealand.
By international comparison,SMEs form a significantcomponent of the NewZealand economy.
� 84.2% of enterprises employ 5 or less full time equivalents(FTEs).
� 96.4% of enterprises employ 19 or fewer FTEs.
� The number of SMEs (0-19 FTEs) decreased 3.7% in2001, following an increase of 15.4% between 1995 and1999 and a rise of 9.5% in 2000.
� Small firms (0-5 FTEs) have shown the largest movement,with the number of enterprises decreasing 4.3% between2000 and 2001. This follows a 10% increase in 2000, withan increase of 16.7% from 1995 to 1999.
� The average number of FTEs per enterprise has fallen from6.5 in 1995 to 5.9 in 2001.
� SMEs account for 42.4% of all FTEs.� Small firms account for 23.1% of all FTEs.
� Using sales and other income as a measure of output,SMES account for 39% of the economy.
� Small firms contribute 27% of total output.
� To 2000, births and deaths among small firms hadincreased 142% and 126% respectively over the lastdecade. (2001 births not available - see p11)
� In 2001, deaths for small firms account for 92.2% of totalenterprise dynamic in the economy.
� SMEs are more predominant in New Zealand than in manyother countries.
� SMEs account for a high proportion of employment inNew Zealand relative to other countries.
3
Introduction
Small and medium sized enterprises (SMEs) are viewed as a source offlexibility and innovation, and make a significant contribution toeconomies, both in terms of the number of SMEs and the proportion of thelabour force employed by these firms. The significance of the SME sectorin New Zealand is increasing, with further opportunities presented byglobalisation and technological development.
This report aims to provide a statistical summary of the nature of the SMEsector in New Zealand, examining its significance to the economy, itsfinancial performance, the dynamics of SMEs – births, deaths andtransition rates, and the significance of the SME sector internationally.
Small and Medium Sized Enterprises (SMEs)
There is no globallyrecognised definitionof an SME….
…althoughSMEs generallyshare some keycharacteristics
For the purposesof this report,SMEs employ 19or fewer staff
Definitions of SMEs differ across industry sectors and countries, and can bebased on a number of criteria, such as number of employees, invested capital andtotal value of sales. However, more important for policy consideration are thecharacteristics of these businesses, which typically include:
� Personal ownership and management� Few, if any, specialist managerial staff� Not being part of a larger business enterprise.1
These characteristics mean that the managers in small firms need to be multi-skilled rather than specialists, with expertise in a diverse range of areas such asmarketing, production and accountancy. They are also constrained in theamount of time and money they can invest in searching for and using assistance.These factors, together with a culture of self-help and independence prevalentamongst New Zealand firms, have implications for business development policy.
The above characteristics are typically exhibited by businesses with fewer than20 employees. Therefore, for the purposes of this report, SMEs will be definedas enterprises employing 19 or fewer full time equivalent employees2 (FTEs)unless otherwise stated. Within this, small enterprises will be defined as thoseemploying 0-5 FTEs and medium enterprises as those employing 6-19 FTEs.
Structure of Business in New Zealand
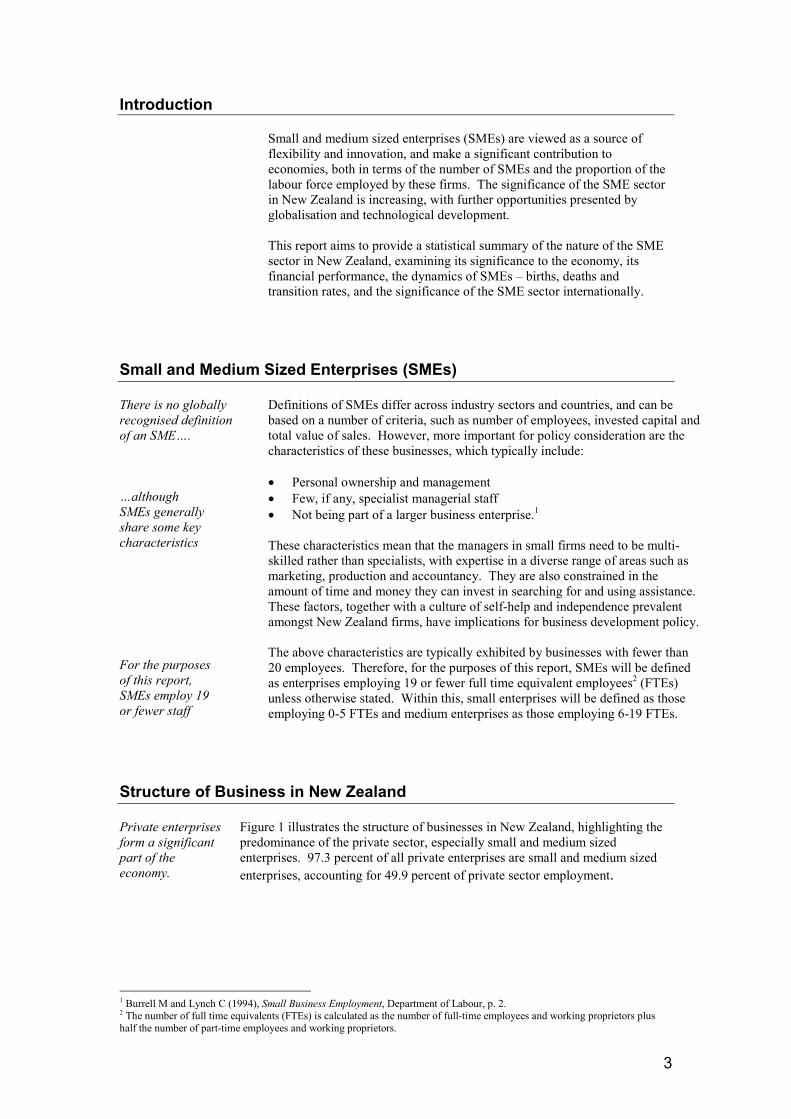
Private enterprisesform a significantpart of theeconomy.
Figure 1 illustrates the structure of businesses in New Zealand, highlighting thepredominance of the private sector, especially small and medium sizedenterprises. 97.3 percent of all private enterprises are small and medium sizedenterprises, accounting for 49.9 percent of private sector employment.
1 Burrell M and Lynch C (1994), Small Business Employment, Department of Labour, p. 2.2 The number of full time equivalents (FTEs) is calculated as the number of full-time employees and working proprietors plushalf the number of part-time employees and working proprietors.
4
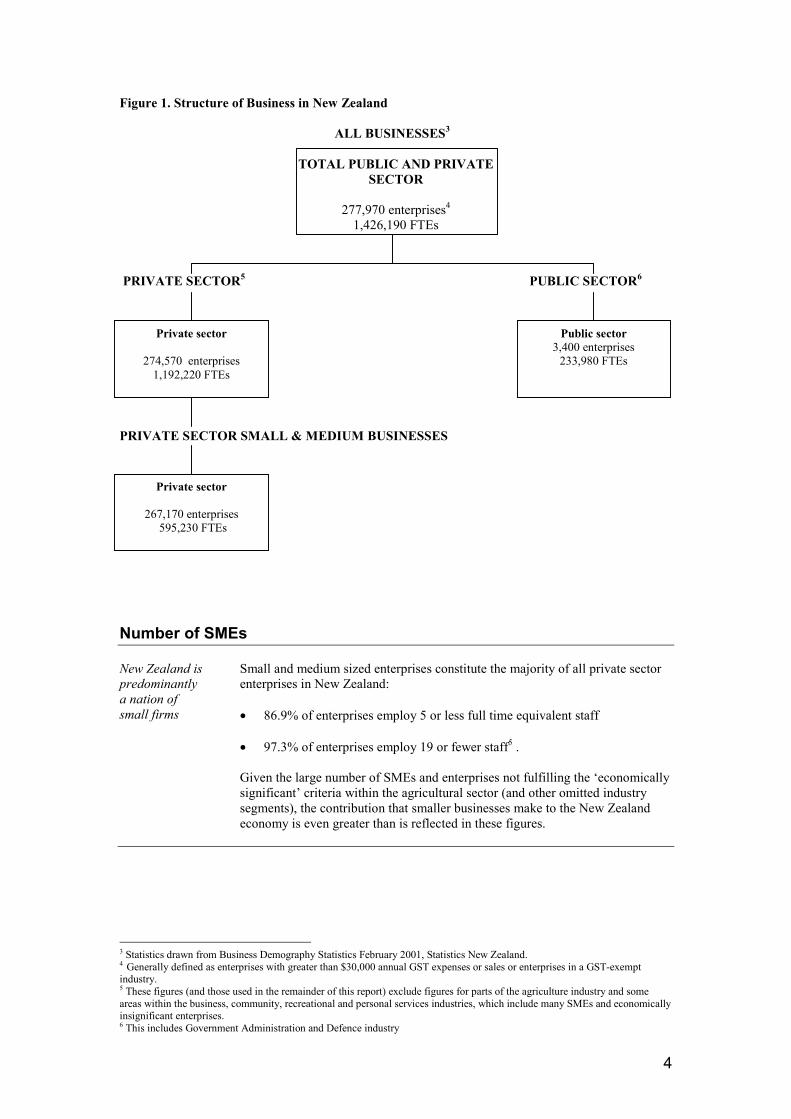
Figure 1. Structure of Business in New Zealand
ALL BUSINESSES3
TOTAL PUBLIC AND PRIVATESECTOR
277,970 enterprises4
1,426,190 FTEs
PRIVATE SECTOR5 PUBLIC SECTOR6
PRIVATE SECTOR SMALL & MEDIUM BUSINESSES
Number of SMEs
New Zealand ispredominantlya nation ofsmall firms
Small and medium sized enterprises constitute the majority of all private sectorenterprises in New Zealand:
� 86.9% of enterprises employ 5 or less full time equivalent staff
� 97.3% of enterprises employ 19 or fewer staff5 .
Given the large number of SMEs and enterprises not fulfilling the ‘economicallysignificant’ criteria within the agricultural sector (and other omitted industrysegments), the contribution that smaller businesses make to the New Zealandeconomy is even greater than is reflected in these figures.
3 Statistics drawn from Business Demography Statistics February 2001, Statistics New Zealand.4 Generally defined as enterprises with greater than $30,000 annual GST expenses or sales or enterprises in a GST-exemptindustry.5 These figures (and those used in the remainder of this report) exclude figures for parts of the agriculture industry and someareas within the business, community, recreational and personal services industries, which include many SMEs and economicallyinsignificant enterprises.6 This includes Government Administration and Defence industry
Private sector
274,570 enterprises1,192,220 FTEs
Public sector3,400 enterprises
233,980 FTEs
Private sector
267,170 enterprises 595,230 FTEs
5
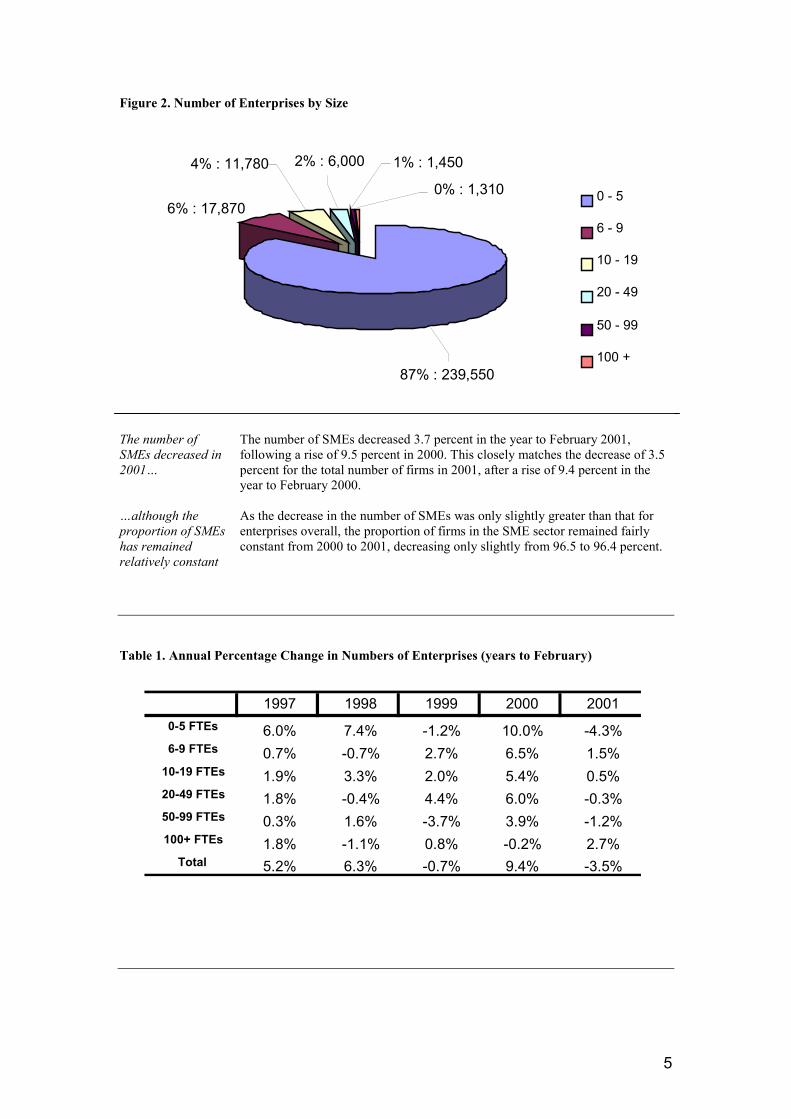
Figure 2. Number of Enterprises by Size
The number ofSMEs decreased in2001…
…although theproportion of SMEshas remainedrelatively constant
The number of SMEs decreased 3.7 percent in the year to February 2001,following a rise of 9.5 percent in 2000. This closely matches the decrease of 3.5percent for the total number of firms in 2001, after a rise of 9.4 percent in theyear to February 2000.
As the decrease in the number of SMEs was only slightly greater than that forenterprises overall, the proportion of firms in the SME sector remained fairlyconstant from 2000 to 2001, decreasing only slightly from 96.5 to 96.4 percent.
Table 1. Annual Percentage Change in Numbers of Enterprises (years to February)
1% : 1,450
0% : 1,310
2% : 6,0004% : 11,780
6% : 17,870
87% : 239,550
0 - 5
6 - 9
10 - 19
20 - 49
50 - 99
100 +
1997 1998 1999 2000 20010-5 FTEs 6.0% 7.4% -1.2% 10.0% -4.3%6-9 FTEs 0.7% -0.7% 2.7% 6.5% 1.5%
10-19 FTEs 1.9% 3.3% 2.0% 5.4% 0.5%20-49 FTEs 1.8% -0.4% 4.4% 6.0% -0.3%50-99 FTEs 0.3% 1.6% -3.7% 3.9% -1.2%100+ FTEs 1.8% -1.1% 0.8% -0.2% 2.7%
Total 5.2% 6.3% -0.7% 9.4% -3.5%
6
SMEs Contribution to Employment
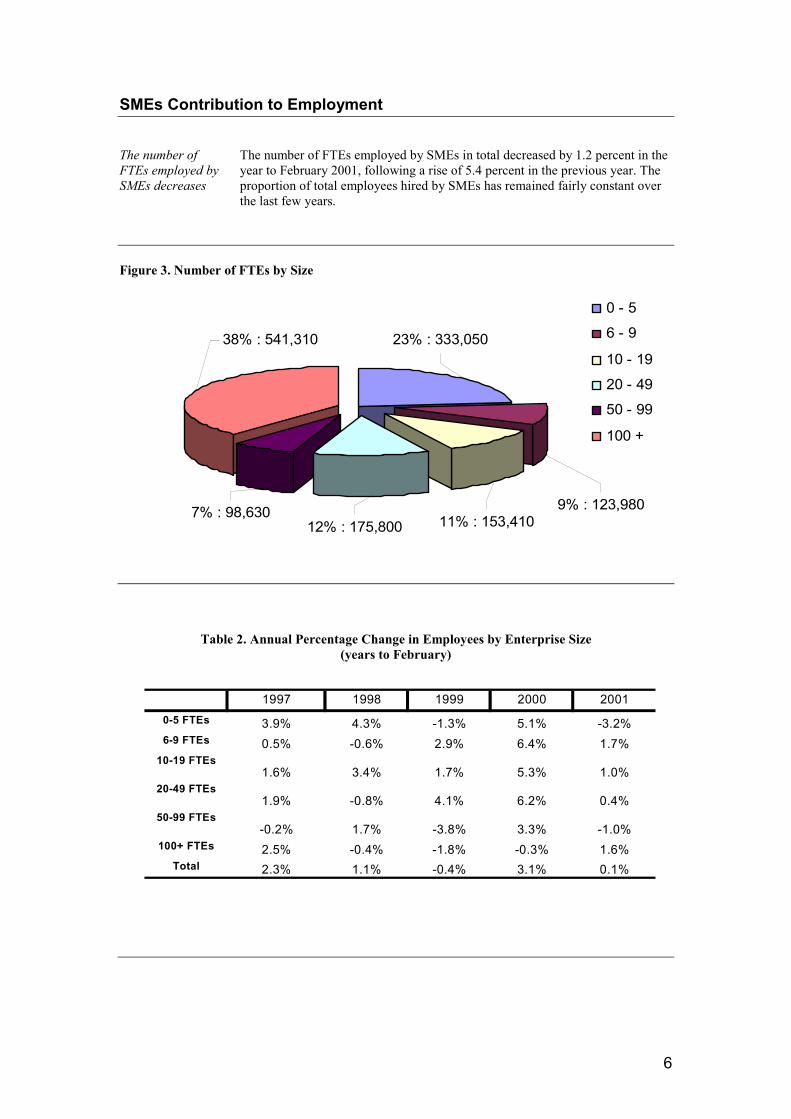
The number ofFTEs employed bySMEs decreases
The number of FTEs employed by SMEs in total decreased by 1.2 percent in theyear to February 2001, following a rise of 5.4 percent in the previous year. Theproportion of total employees hired by SMEs has remained fairly constant overthe last few years.
Figure 3. Number of FTEs by Size
Table 2. Annual Percentage Change in Employees by Enterprise Size(years to February)
9% : 123,98011% : 153,41012% : 175,800
7% : 98,630
23% : 333,05038% : 541,310
0 - 5
6 - 9
10 - 19
20 - 49
50 - 99
100 +
1997 1998 1999 2000 20010-5 FTEs 3.9% 4.3% -1.3% 5.1% -3.2%6-9 FTEs 0.5% -0.6% 2.9% 6.4% 1.7%
10-19 FTEs1.6% 3.4% 1.7% 5.3% 1.0%
20-49 FTEs1.9% -0.8% 4.1% 6.2% 0.4%
50-99 FTEs-0.2% 1.7% -3.8% 3.3% -1.0%
100+ FTEs 2.5% -0.4% -1.8% -0.3% 1.6%Total 2.3% 1.1% -0.4% 3.1% 0.1%
7
New smallbusinesses createthe greatestnumber of newjobs
Table 3 illustrates the contribution that SMEs made to job creation in the economybetween 1995 and 2001. The largest single contributor was new firms employing0-5 FTEs, which created 198,450 new jobs. Of continuing businesses, the greatestnumber of new jobs came equally from small and large (100+ FTEs) firms. Whilesmall businesses were also the cause of the greatest employment reduction, thiswas outweighed by the jobs they created, giving a net employment change for allsmall firms of 87,500 between 1995 and 2001.
Table 3. Employment Creation and Reduction by Enterprise SizeFebruary 1995 to February 2001
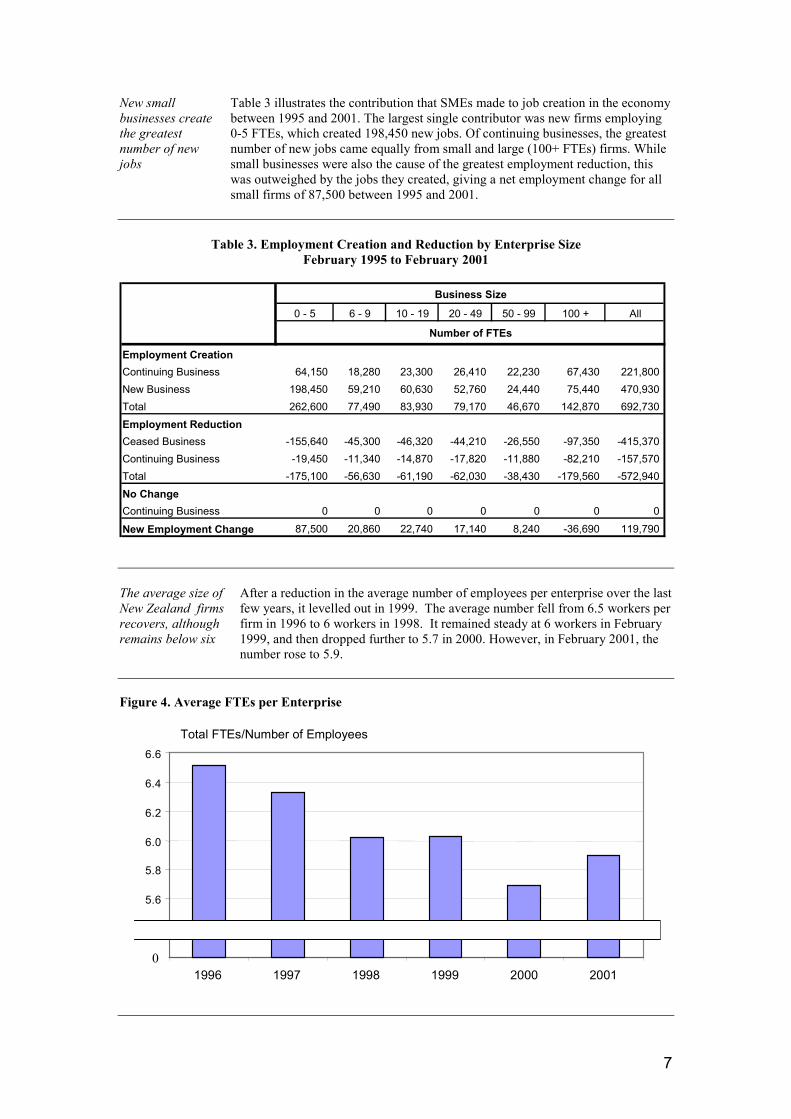
The average size ofNew Zealand firmsrecovers, althoughremains below six
After a reduction in the average number of employees per enterprise over the lastfew years, it levelled out in 1999. The average number fell from 6.5 workers perfirm in 1996 to 6 workers in 1998. It remained steady at 6 workers in February1999, and then dropped further to 5.7 in 2000. However, in February 2001, thenumber rose to 5.9.
Figure 4. Average FTEs per Enterprise
Total FTEs/Number of Employees
5.2
5.4
5.6
5.8
6.0
6.2
6.4
6.6
1996 1997 1998 1999 2000 20010
0 - 5 6 - 9 10 - 19 20 - 49 50 - 99 100 + All
Employment CreationContinuing Business 64,150 18,280 23,300 26,410 22,230 67,430 221,800New Business 198,450 59,210 60,630 52,760 24,440 75,440 470,930Total 262,600 77,490 83,930 79,170 46,670 142,870 692,730Employment ReductionCeased Business -155,640 -45,300 -46,320 -44,210 -26,550 -97,350 -415,370 Continuing Business -19,450 -11,340 -14,870 -17,820 -11,880 -82,210 -157,570 Total -175,100 -56,630 -61,190 -62,030 -38,430 -179,560 -572,940 No ChangeContinuing Business 0 0 0 0 0 0 0New Employment Change 87,500 20,860 22,740 17,140 8,240 -36,690 119,790
Business Size
Number of FTEs
8
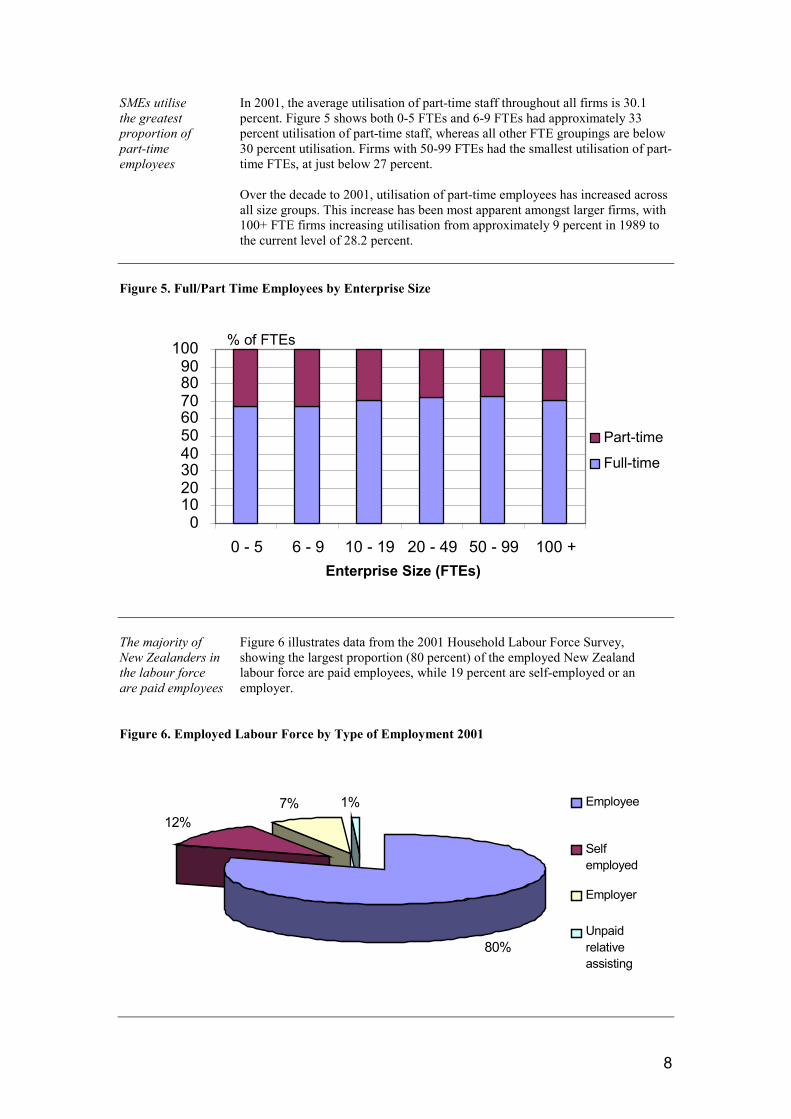
SMEs utilisethe greatestproportion ofpart-timeemployees
In 2001, the average utilisation of part-time staff throughout all firms is 30.1percent. Figure 5 shows both 0-5 FTEs and 6-9 FTEs had approximately 33percent utilisation of part-time staff, whereas all other FTE groupings are below30 percent utilisation. Firms with 50-99 FTEs had the smallest utilisation of part-time FTEs, at just below 27 percent.
Over the decade to 2001, utilisation of part-time employees has increased acrossall size groups. This increase has been most apparent amongst larger firms, with100+ FTE firms increasing utilisation from approximately 9 percent in 1989 tothe current level of 28.2 percent.
Figure 5. Full/Part Time Employees by Enterprise Size
The majority ofNew Zealanders inthe labour forceare paid employees
Figure 6 illustrates data from the 2001 Household Labour Force Survey,showing the largest proportion (80 percent) of the employed New Zealandlabour force are paid employees, while 19 percent are self-employed or anemployer.
Figure 6. Employed Labour Force by Type of Employment 2001
% of FTEs
0102030405060708090
100
0 - 5 6 - 9 10 - 19 20 - 49 50 - 99 100 +Enterprise Size (FTEs)
Part-time
Full-time
80%
12%7% 1% Employee
Selfemployed
Employer
Unpaidrelativeassisting
9
SMEs Contribution to Output
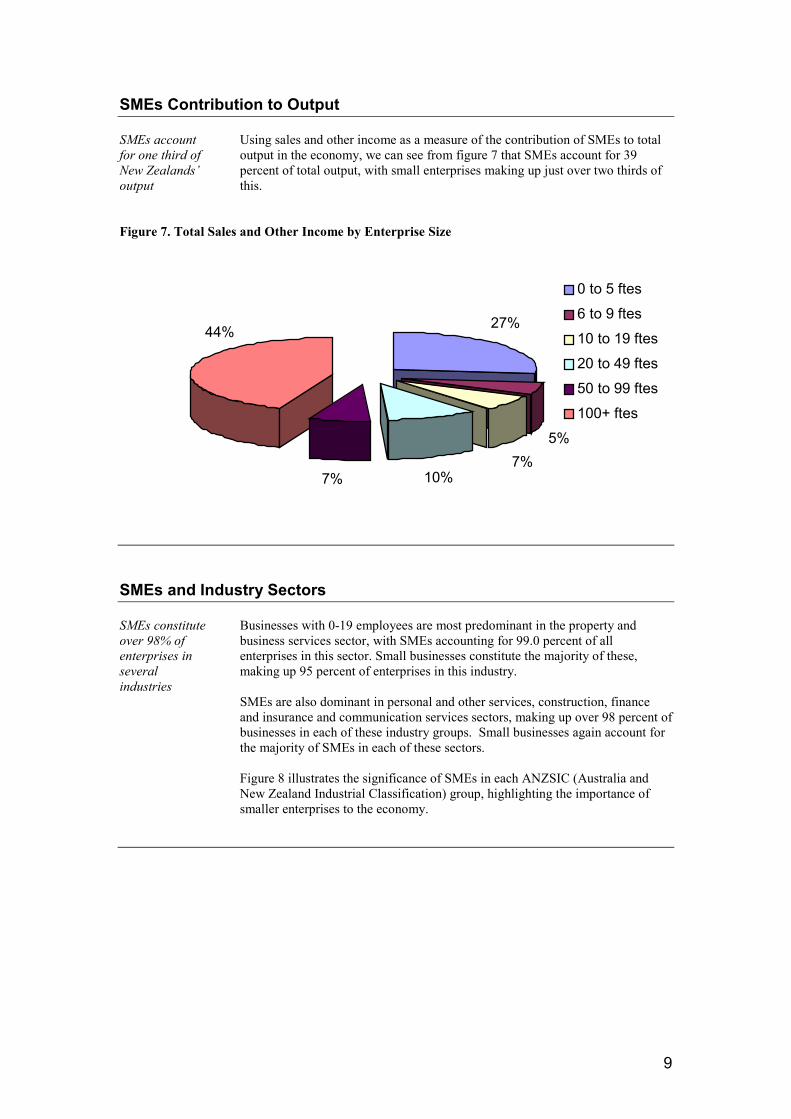
SMEs accountfor one third ofNew Zealands’output
Using sales and other income as a measure of the contribution of SMEs to totaloutput in the economy, we can see from figure 7 that SMEs account for 39percent of total output, with small enterprises making up just over two thirds ofthis.
Figure 7. Total Sales and Other Income by Enterprise Size
SMEs and Industry Sectors
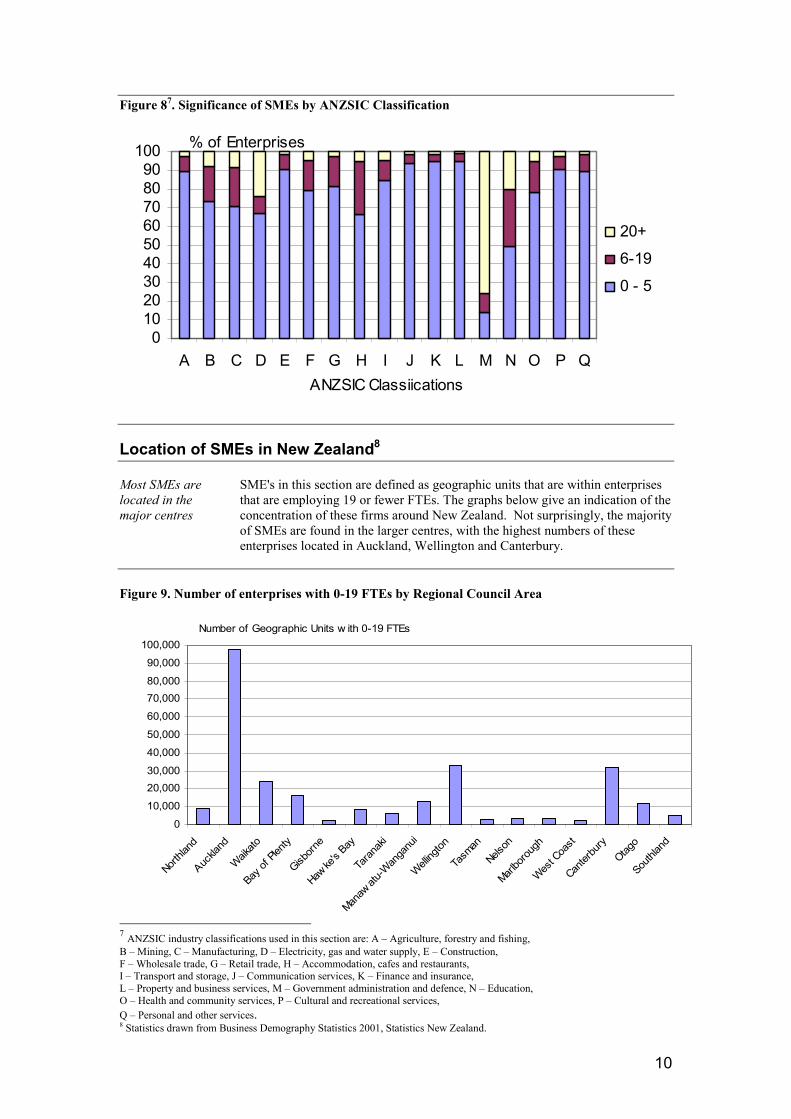
SMEs constituteover 98% ofenterprises inseveralindustries
Businesses with 0-19 employees are most predominant in the property andbusiness services sector, with SMEs accounting for 99.0 percent of allenterprises in this sector. Small businesses constitute the majority of these,making up 95 percent of enterprises in this industry.
SMEs are also dominant in personal and other services, construction, financeand insurance and communication services sectors, making up over 98 percent ofbusinesses in each of these industry groups. Small businesses again account forthe majority of SMEs in each of these sectors.
Figure 8 illustrates the significance of SMEs in each ANZSIC (Australia andNew Zealand Industrial Classification) group, highlighting the importance ofsmaller enterprises to the economy.
5%7%
10%7%
27%44%
0 to 5 ftes6 to 9 ftes10 to 19 ftes20 to 49 ftes50 to 99 ftes100+ ftes
10
Figure 87. Significance of SMEs by ANZSIC Classification
Location of SMEs in New Zealand8
Most SMEs arelocated in themajor centres
SME's in this section are defined as geographic units that are within enterprisesthat are employing 19 or fewer FTEs. The graphs below give an indication of theconcentration of these firms around New Zealand. Not surprisingly, the majorityof SMEs are found in the larger centres, with the highest numbers of theseenterprises located in Auckland, Wellington and Canterbury.
Figure 9. Number of enterprises with 0-19 FTEs by Regional Council Area
7 ANZSIC industry classifications used in this section are: A – Agriculture, forestry and fishing,B – Mining, C – Manufacturing, D – Electricity, gas and water supply, E – Construction,F – Wholesale trade, G – Retail trade, H – Accommodation, cafes and restaurants,I – Transport and storage, J – Communication services, K – Finance and insurance,L – Property and business services, M – Government administration and defence, N – Education,O – Health and community services, P – Cultural and recreational services,Q – Personal and other services.8 Statistics drawn from Business Demography Statistics 2001, Statistics New Zealand.
% of Enterprises
0102030405060708090
100
A B C D E F G H I J K L M N O P QANZSIC Classiications
20+
6-19
0 - 5
Number of Geographic Units w ith 0-19 FTEs
0
10,000
20,00030,000
40,000
50,000
60,000
70,00080,000
90,000
100,000
Northla
nd
Auckla
nd
Waikato
Bay of
Plen
ty
Gisborn
e
Hawke
's Bay
Taran
aki
Manaw
atu-W
anga
nui
Welling
ton
Tasm
an
Nelson
Marlbo
rough
West C
oast
Canter
bury
Otago
Southl
and
11
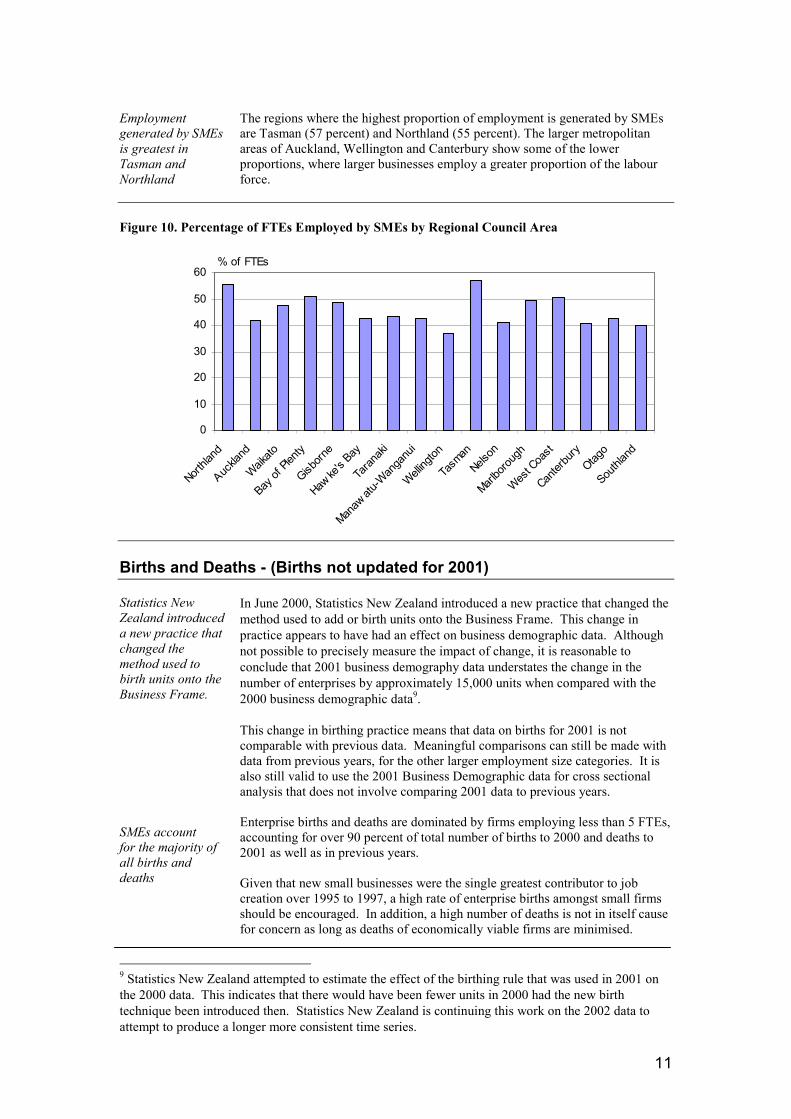
Employmentgenerated by SMEsis greatest inTasman andNorthland
The regions where the highest proportion of employment is generated by SMEsare Tasman (57 percent) and Northland (55 percent). The larger metropolitanareas of Auckland, Wellington and Canterbury show some of the lowerproportions, where larger businesses employ a greater proportion of the labourforce.
Figure 10. Percentage of FTEs Employed by SMEs by Regional Council Area
Births and Deaths - (Births not updated for 2001)
Statistics NewZealand introduceda new practice thatchanged themethod used tobirth units onto theBusiness Frame.
SMEs accountfor the majority ofall births anddeaths
In June 2000, Statistics New Zealand introduced a new practice that changed themethod used to add or birth units onto the Business Frame. This change inpractice appears to have had an effect on business demographic data. Althoughnot possible to precisely measure the impact of change, it is reasonable toconclude that 2001 business demography data understates the change in thenumber of enterprises by approximately 15,000 units when compared with the2000 business demographic data9.
This change in birthing practice means that data on births for 2001 is notcomparable with previous data. Meaningful comparisons can still be made withdata from previous years, for the other larger employment size categories. It isalso still valid to use the 2001 Business Demographic data for cross sectionalanalysis that does not involve comparing 2001 data to previous years.
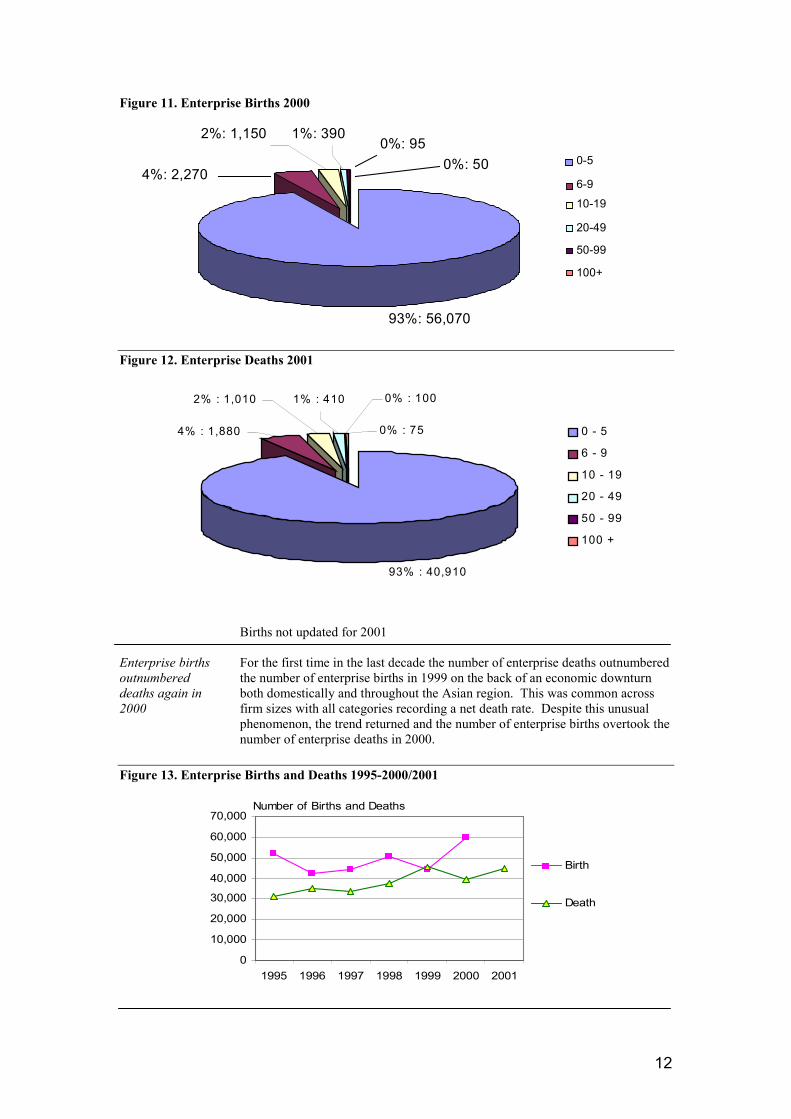
Enterprise births and deaths are dominated by firms employing less than 5 FTEs,accounting for over 90 percent of total number of births to 2000 and deaths to2001 as well as in previous years.
Given that new small businesses were the single greatest contributor to jobcreation over 1995 to 1997, a high rate of enterprise births amongst small firmsshould be encouraged. In addition, a high number of deaths is not in itself causefor concern as long as deaths of economically viable firms are minimised.
9 Statistics New Zealand attempted to estimate the effect of the birthing rule that was used in 2001 onthe 2000 data. This indicates that there would have been fewer units in 2000 had the new birthtechnique been introduced then. Statistics New Zealand is continuing this work on the 2002 data toattempt to produce a longer more consistent time series.
% of FTEs
0
10
20
30
40
50
60
Northla
nd
Auckla
nd
Waikato
Bay of
Plen
ty
Gisborn
e
Hawke
's Bay
Taran
aki
Manaw
atu-W
anga
nui
Welling
ton
Tasm
an
Nelson
Marlbo
rough
West C
oast
Canter
bury
Otago
Southl
and
12
Figure 11. Enterprise Births 2000
2%: 1,150
4%: 2,270
93%: 56,070
1%: 390 0%: 95
0%: 50 0-5
6-910-19
20-49
50-99
100+
Figure 12. Enterprise Deaths 2001
Enterprise birthsoutnumbereddeaths again in2000
Births not updated for 2001
For the first time in the last decade the number of enterprise deaths outnumberedthe number of enterprise births in 1999 on the back of an economic downturnboth domestically and throughout the Asian region. This was common acrossfirm sizes with all categories recording a net death rate. Despite this unusualphenomenon, the trend returned and the number of enterprise births overtook thenumber of enterprise deaths in 2000.
Figure 13. Enterprise Births and Deaths 1995-2000/2001
2% : 1,010 1% : 410
0% : 75
0% : 100
4% : 1,880
93% : 40,910
0 - 5
6 - 9
10 - 19
20 - 49
50 - 99
100 +
Number of Births and Deaths
0
10,000
20,000
30,000
40,000
50,000
60,000
70,000
1995 1996 1997 1998 1999 2000 2001
Birth
Death
13
Survival Rates of SMEs
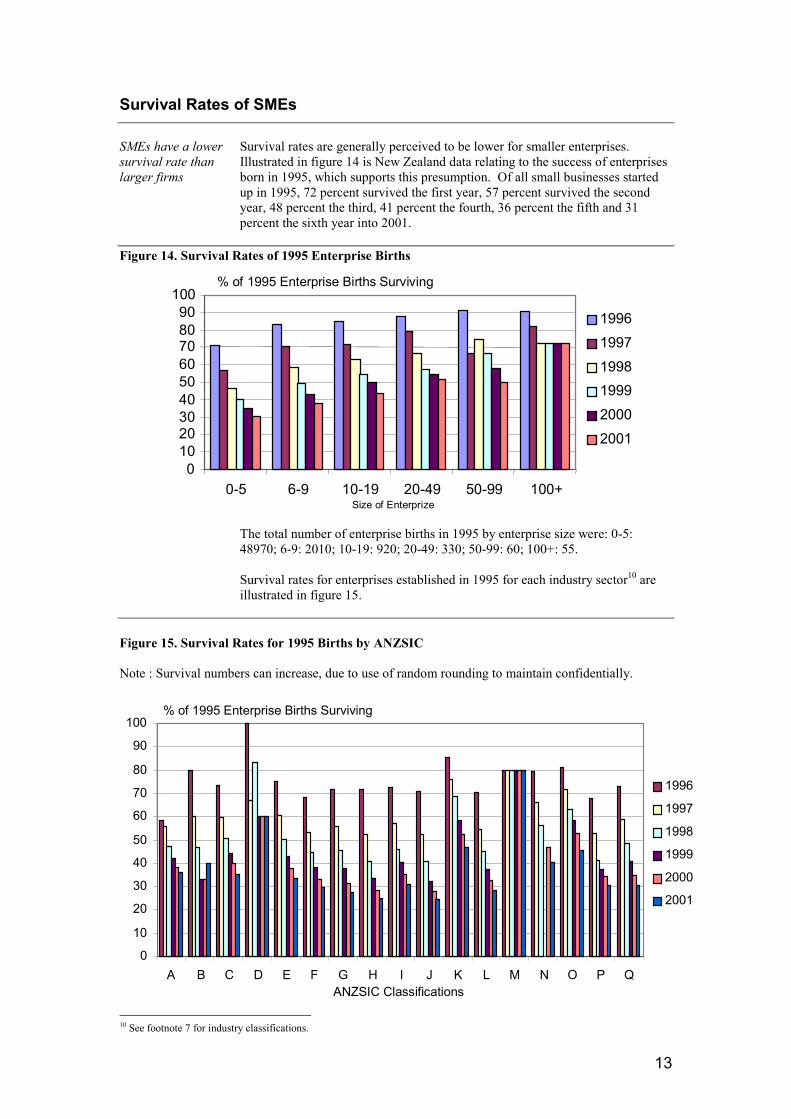
SMEs have a lowersurvival rate thanlarger firms
Survival rates are generally perceived to be lower for smaller enterprises.Illustrated in figure 14 is New Zealand data relating to the success of enterprisesborn in 1995, which supports this presumption. Of all small businesses startedup in 1995, 72 percent survived the first year, 57 percent survived the secondyear, 48 percent the third, 41 percent the fourth, 36 percent the fifth and 31percent the sixth year into 2001.
Figure 14. Survival Rates of 1995 Enterprise Births
The total number of enterprise births in 1995 by enterprise size were: 0-5:48970; 6-9: 2010; 10-19: 920; 20-49: 330; 50-99: 60; 100+: 55.
Survival rates for enterprises established in 1995 for each industry sector10 areillustrated in figure 15.
Figure 15. Survival Rates for 1995 Births by ANZSIC
Note : Survival numbers can increase, due to use of random rounding to maintain confidentially.
10 See footnote 7 for industry classifications.
% of 1995 Enterprise Births Surviving
0
10
20
30
40
50
60
70
80
90
100
A B C D E F G H I J K L M N O P QANZSIC Classifications
1996
1997
1998
1999
2000
2001
% of 1995 Enterprise Births Surviving
0102030405060708090
100
0-5 6-9 10-19 20-49 50-99 100+Size of Enterprize
199619971998199920002001
14
Industry survivalrates generallyappear relatedto theconcentrationof SMEs
In general, survivalrates likelyoverstate thenumber of firmdeaths
The industries with the highest survival rate into 2001 were governmentadministration and defence and electricity, gas and water supply. These sectorshave a proportion of SMEs significantly below the sector average. The lowestsurvival rates were seen by enterprises in the sectors of accommodation, cafesand restaurants, and communication services. Each of these sectors tendstowards having an average sized proportion of SMEs.
However, evidence suggests that these survival statistics present a situationsignificantly harsher than reality. The statistics are calculated on the basis that ifa firm ceases to exist under exactly the same name or structure then it is assumedto have collapsed, presumably due to financial difficulties. These ‘deaths’ cansignify other events, such as:
� Geographic transfers (location is changed but activity, means of productionand market are not)
� Changes of ownership (there is a new owner but no change in activity orlocation)
� Temporary closures (such as for seasonal activities)� Closure due to health or personal reasons.
Research suggests that actual failure rates may be two thirds of rates indicatedby statistics.11
Transition Rates
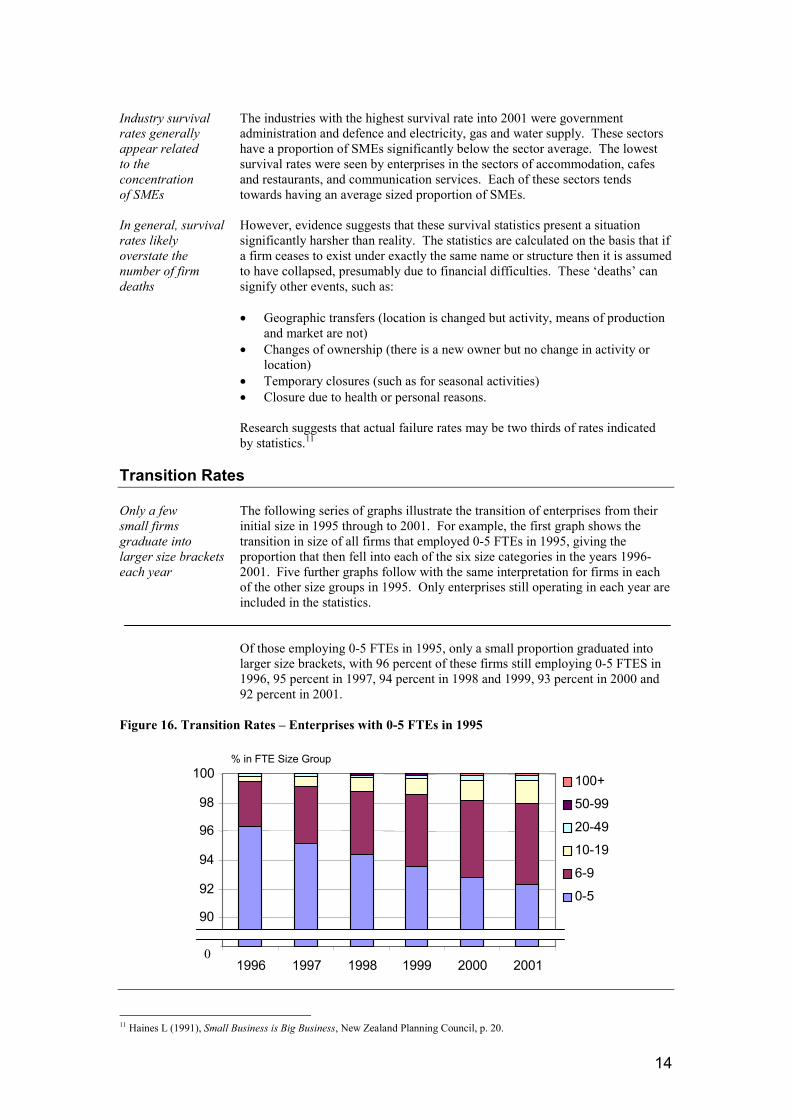
Only a fewsmall firmsgraduate intolarger size bracketseach year
The following series of graphs illustrate the transition of enterprises from theirinitial size in 1995 through to 2001. For example, the first graph shows thetransition in size of all firms that employed 0-5 FTEs in 1995, giving theproportion that then fell into each of the six size categories in the years 1996-2001. Five further graphs follow with the same interpretation for firms in eachof the other size groups in 1995. Only enterprises still operating in each year areincluded in the statistics.
Of those employing 0-5 FTEs in 1995, only a small proportion graduated intolarger size brackets, with 96 percent of these firms still employing 0-5 FTES in1996, 95 percent in 1997, 94 percent in 1998 and 1999, 93 percent in 2000 and92 percent in 2001.
Figure 16. Transition Rates – Enterprises with 0-5 FTEs in 1995
11 Haines L (1991), Small Business is Big Business, New Zealand Planning Council, p. 20.
% in FTE Size Group
90
92
94
96
98
100
1996 1997 1998 1999 2000 2001
100+
50-99
20-49
10-19
6-9
0-5
0
15
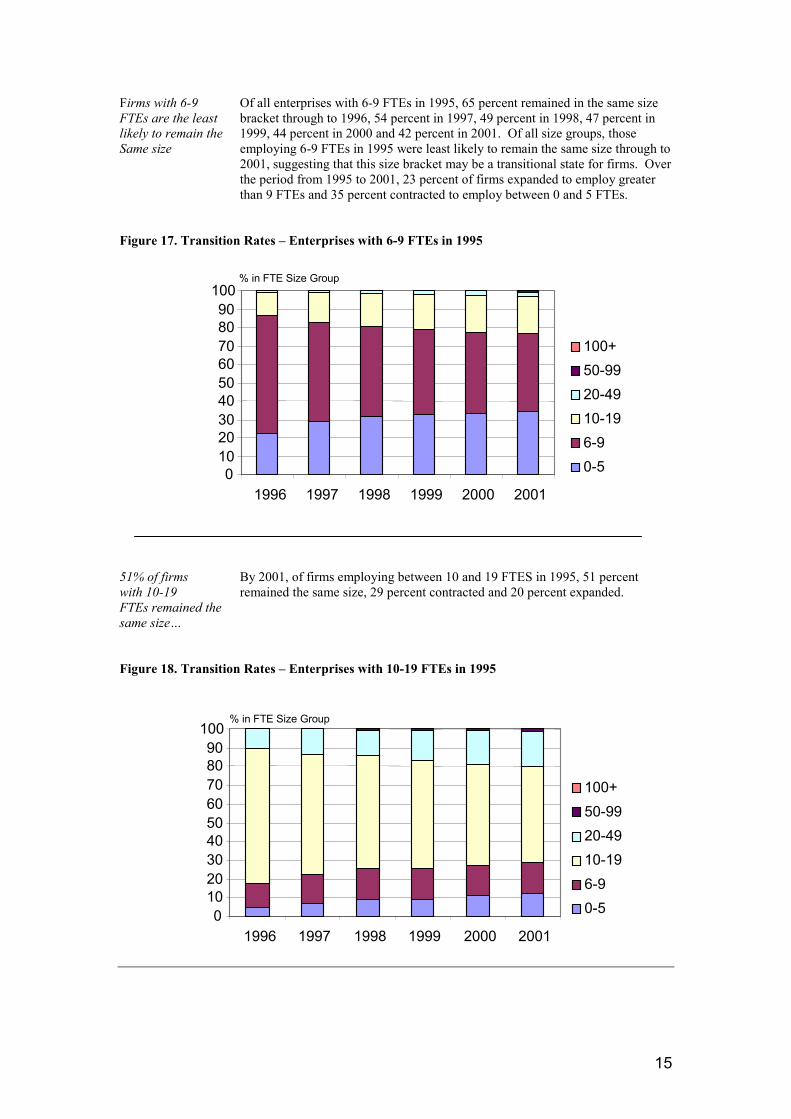
Firms with 6-9FTEs are the leastlikely to remain theSame size
Of all enterprises with 6-9 FTEs in 1995, 65 percent remained in the same sizebracket through to 1996, 54 percent in 1997, 49 percent in 1998, 47 percent in1999, 44 percent in 2000 and 42 percent in 2001. Of all size groups, thoseemploying 6-9 FTEs in 1995 were least likely to remain the same size through to2001, suggesting that this size bracket may be a transitional state for firms. Overthe period from 1995 to 2001, 23 percent of firms expanded to employ greaterthan 9 FTEs and 35 percent contracted to employ between 0 and 5 FTEs.
Figure 17. Transition Rates – Enterprises with 6-9 FTEs in 1995
51% of firmswith 10-19FTEs remained thesame size…
By 2001, of firms employing between 10 and 19 FTES in 1995, 51 percentremained the same size, 29 percent contracted and 20 percent expanded.
Figure 18. Transition Rates – Enterprises with 10-19 FTEs in 1995
% in FTE Size Group
0102030405060708090
100
1996 1997 1998 1999 2000 2001
100+50-9920-4910-196-90-5
% in FTE Size Group
0102030405060708090
100
1996 1997 1998 1999 2000 2001
100+50-9920-4910-196-90-5
16
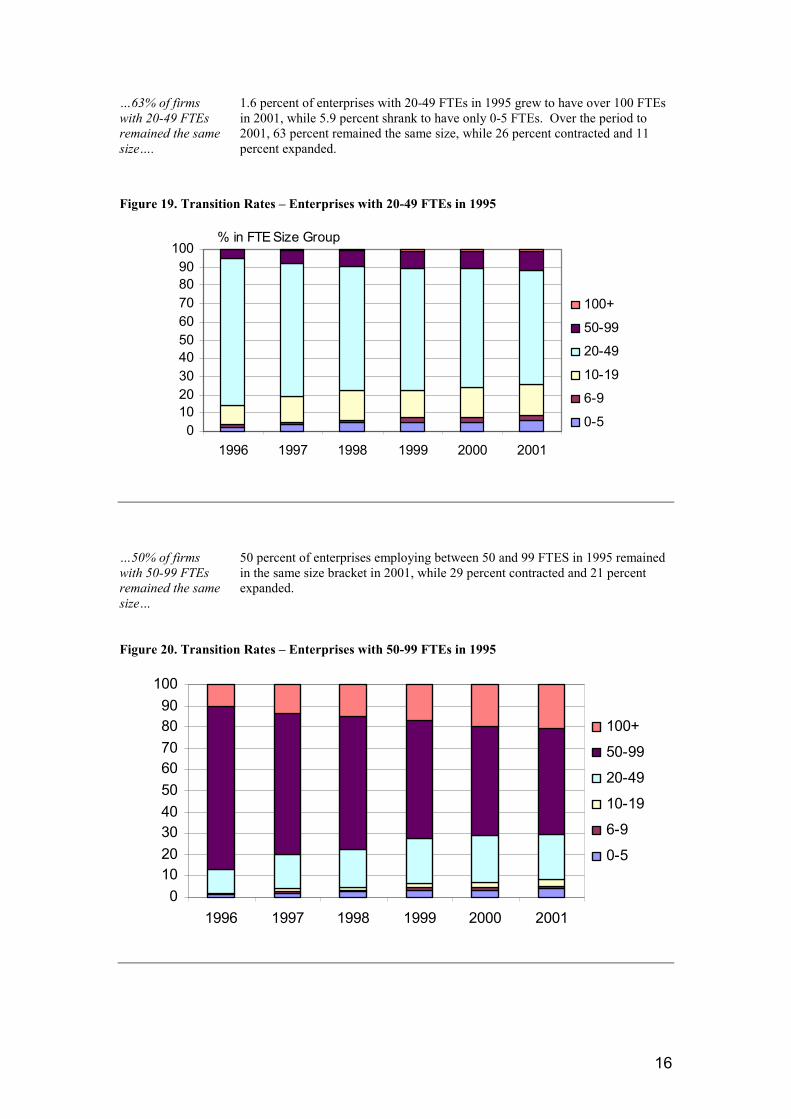
…63% of firmswith 20-49 FTEsremained the samesize….
1.6 percent of enterprises with 20-49 FTEs in 1995 grew to have over 100 FTEsin 2001, while 5.9 percent shrank to have only 0-5 FTEs. Over the period to2001, 63 percent remained the same size, while 26 percent contracted and 11percent expanded.
Figure 19. Transition Rates – Enterprises with 20-49 FTEs in 1995
…50% of firmswith 50-99 FTEsremained the samesize…
50 percent of enterprises employing between 50 and 99 FTES in 1995 remainedin the same size bracket in 2001, while 29 percent contracted and 21 percentexpanded.
Figure 20. Transition Rates – Enterprises with 50-99 FTEs in 1995
% in FTE Size Group
0102030405060708090
100
1996 1997 1998 1999 2000 2001
100+
50-99
20-49
10-19
6-9
0-5
0102030405060708090
100
1996 1997 1998 1999 2000 2001
100+
50-99
20-49
10-19
6-9
0-5
17
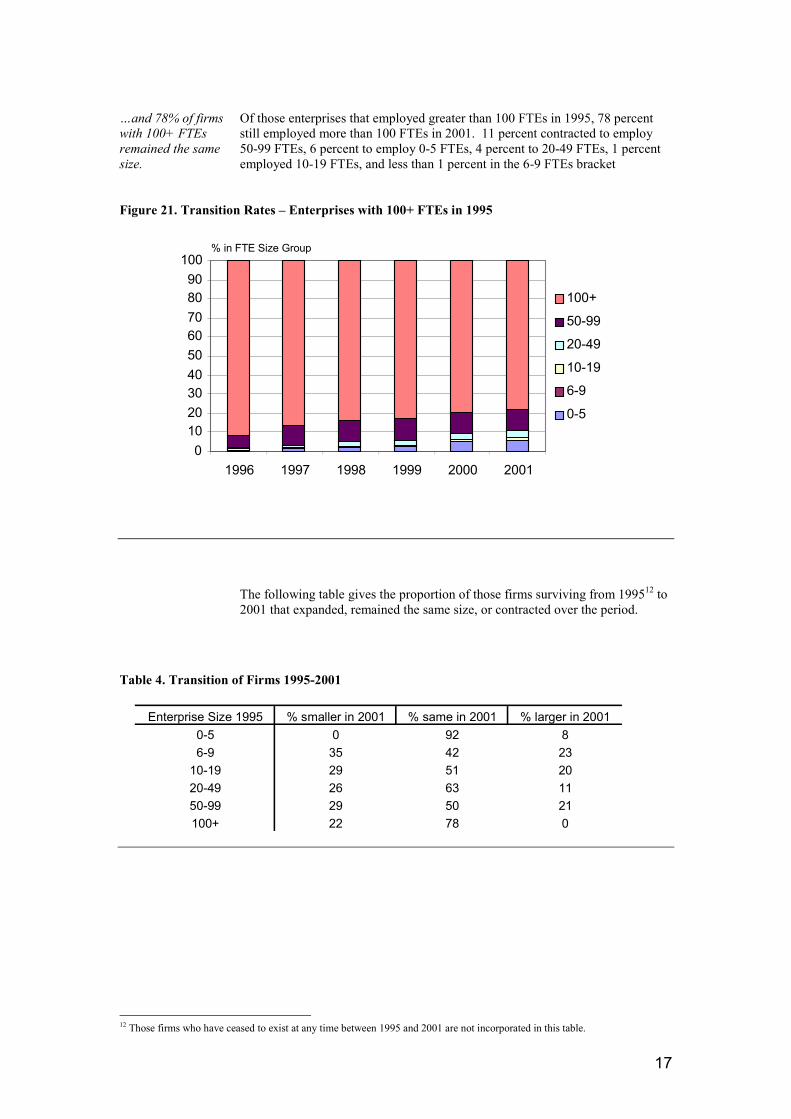
…and 78% of firmswith 100+ FTEsremained the samesize.
Of those enterprises that employed greater than 100 FTEs in 1995, 78 percentstill employed more than 100 FTEs in 2001. 11 percent contracted to employ50-99 FTEs, 6 percent to employ 0-5 FTEs, 4 percent to 20-49 FTEs, 1 percentemployed 10-19 FTEs, and less than 1 percent in the 6-9 FTEs bracket
Figure 21. Transition Rates – Enterprises with 100+ FTEs in 1995
The following table gives the proportion of those firms surviving from 199512 to2001 that expanded, remained the same size, or contracted over the period.
Table 4. Transition of Firms 1995-2001
12 Those firms who have ceased to exist at any time between 1995 and 2001 are not incorporated in this table.
Enterprise Size 1995 % smaller in 2001 % same in 2001 % larger in 20010-5 0 92 86-9 35 42 23
10-19 29 51 2020-49 26 63 1150-99 29 50 21100+ 22 78 0
0102030405060708090
100
1996 1997 1998 1999 2000 2001
100+
50-99
20-49
10-19
6-9
0-5
% in FTE Size Group
18
Performance Measures 13 14
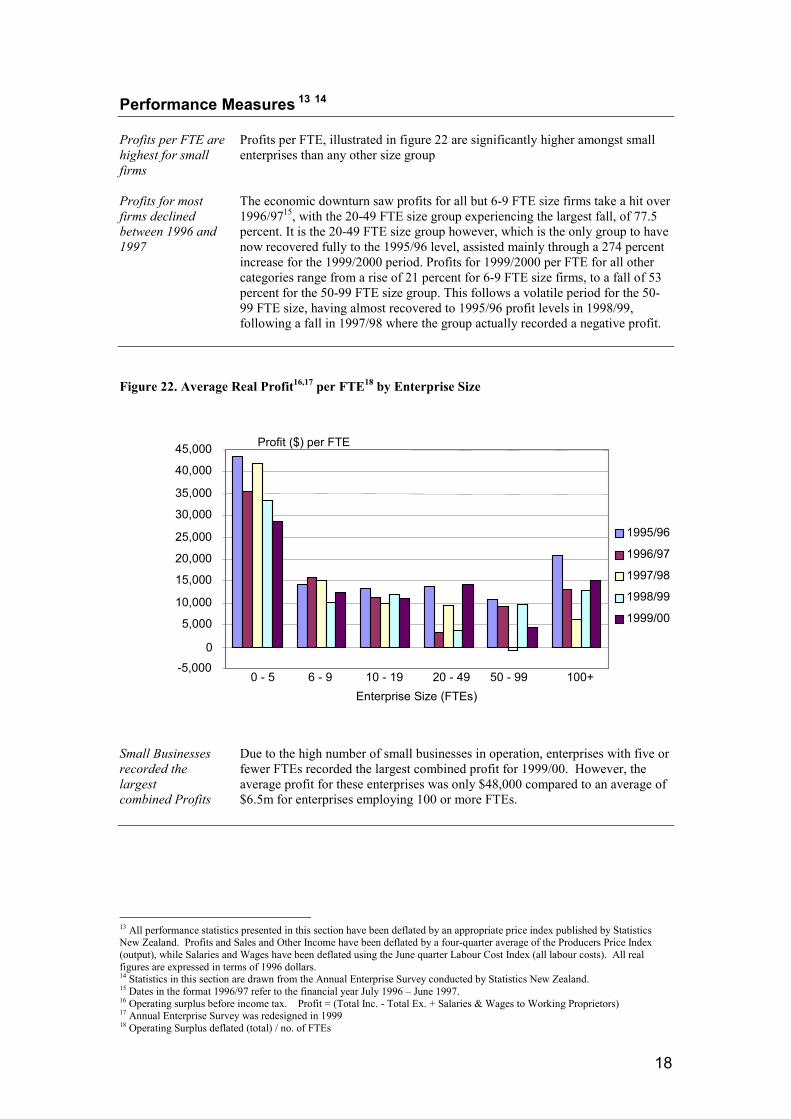
Profits per FTE arehighest for smallfirms
Profits for mostfirms declinedbetween 1996 and1997
Profits per FTE, illustrated in figure 22 are significantly higher amongst smallenterprises than any other size group
The economic downturn saw profits for all but 6-9 FTE size firms take a hit over1996/9715, with the 20-49 FTE size group experiencing the largest fall, of 77.5percent. It is the 20-49 FTE size group however, which is the only group to havenow recovered fully to the 1995/96 level, assisted mainly through a 274 percentincrease for the 1999/2000 period. Profits for 1999/2000 per FTE for all othercategories range from a rise of 21 percent for 6-9 FTE size firms, to a fall of 53percent for the 50-99 FTE size group. This follows a volatile period for the 50-99 FTE size, having almost recovered to 1995/96 profit levels in 1998/99,following a fall in 1997/98 where the group actually recorded a negative profit.
Figure 22. Average Real Profit16,17 per FTE18 by Enterprise Size
Small Businessesrecorded thelargestcombined Profits
Due to the high number of small businesses in operation, enterprises with five orfewer FTEs recorded the largest combined profit for 1999/00. However, theaverage profit for these enterprises was only $48,000 compared to an average of$6.5m for enterprises employing 100 or more FTEs.
13 All performance statistics presented in this section have been deflated by an appropriate price index published by StatisticsNew Zealand. Profits and Sales and Other Income have been deflated by a four-quarter average of the Producers Price Index(output), while Salaries and Wages have been deflated using the June quarter Labour Cost Index (all labour costs). All realfigures are expressed in terms of 1996 dollars.14 Statistics in this section are drawn from the Annual Enterprise Survey conducted by Statistics New Zealand.15 Dates in the format 1996/97 refer to the financial year July 1996 – June 1997.16 Operating surplus before income tax. Profit = (Total Inc. - Total Ex. + Salaries & Wages to Working Proprietors)17 Annual Enterprise Survey was redesigned in 199918 Operating Surplus deflated (total) / no. of FTEs
Profit ($) per FTE
-5,0000
5,000
10,000
15,000
20,000
25,000
30,000
35,000
40,000
45,000
0 - 5 6 - 9 10 - 19 20 - 49 50 - 99 100+Enterprise Size (FTEs)
1995/96
1996/97
1997/98
1998/99
1999/00
19
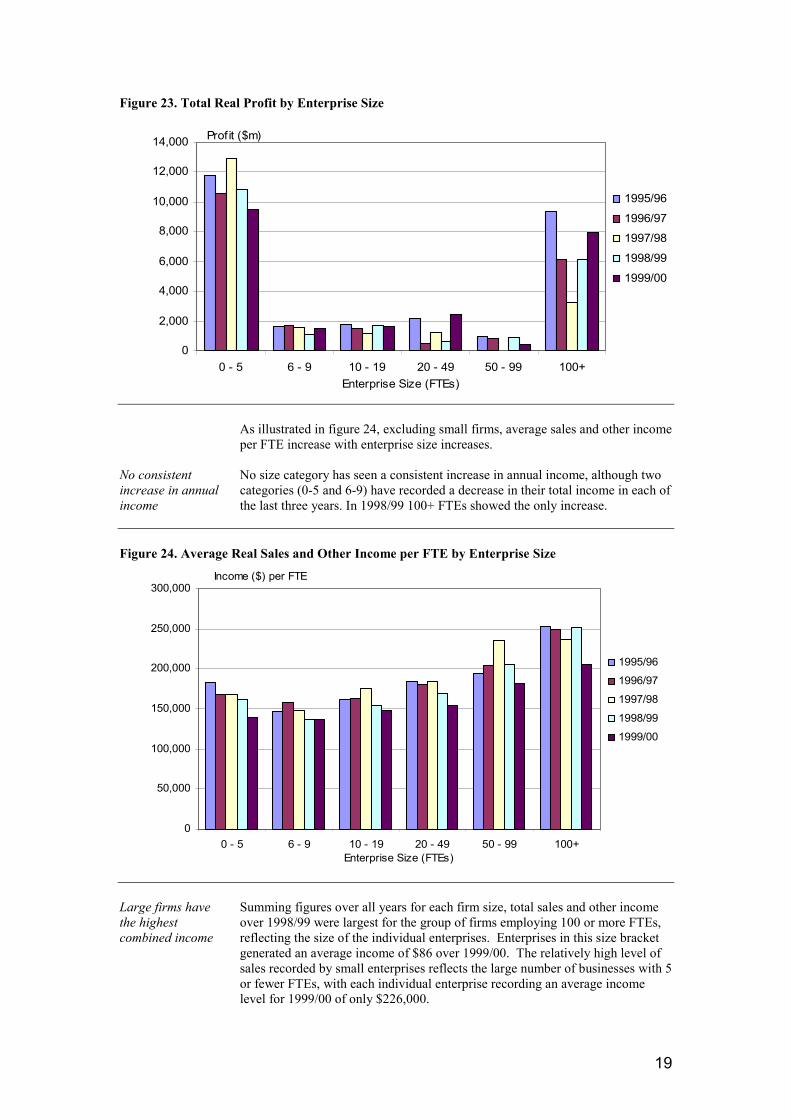
Figure 23. Total Real Profit by Enterprise Size
No consistentincrease in annualincome
As illustrated in figure 24, excluding small firms, average sales and other incomeper FTE increase with enterprise size increases.
No size category has seen a consistent increase in annual income, although twocategories (0-5 and 6-9) have recorded a decrease in their total income in each ofthe last three years. In 1998/99 100+ FTEs showed the only increase.
Figure 24. Average Real Sales and Other Income per FTE by Enterprise Size
Large firms havethe highestcombined income
Summing figures over all years for each firm size, total sales and other incomeover 1998/99 were largest for the group of firms employing 100 or more FTEs,reflecting the size of the individual enterprises. Enterprises in this size bracketgenerated an average income of $86 over 1999/00. The relatively high level ofsales recorded by small enterprises reflects the large number of businesses with 5or fewer FTEs, with each individual enterprise recording an average incomelevel for 1999/00 of only $226,000.
0
2,000
4,000
6,000
8,000
10,000
12,000
14,000
0 - 5 6 - 9 10 - 19 20 - 49 50 - 99 100+Enterprise Size (FTEs)
1995/96
1996/97
1997/98
1998/99
1999/00
Prof it ($m)
0
50,000
100,000
150,000
200,000
250,000
300,000
0 - 5 6 - 9 10 - 19 20 - 49 50 - 99 100+Enterprise Size (FTEs)
1995/96
1996/97
1997/98
1998/99
1999/00
Income ($) per FTE
20
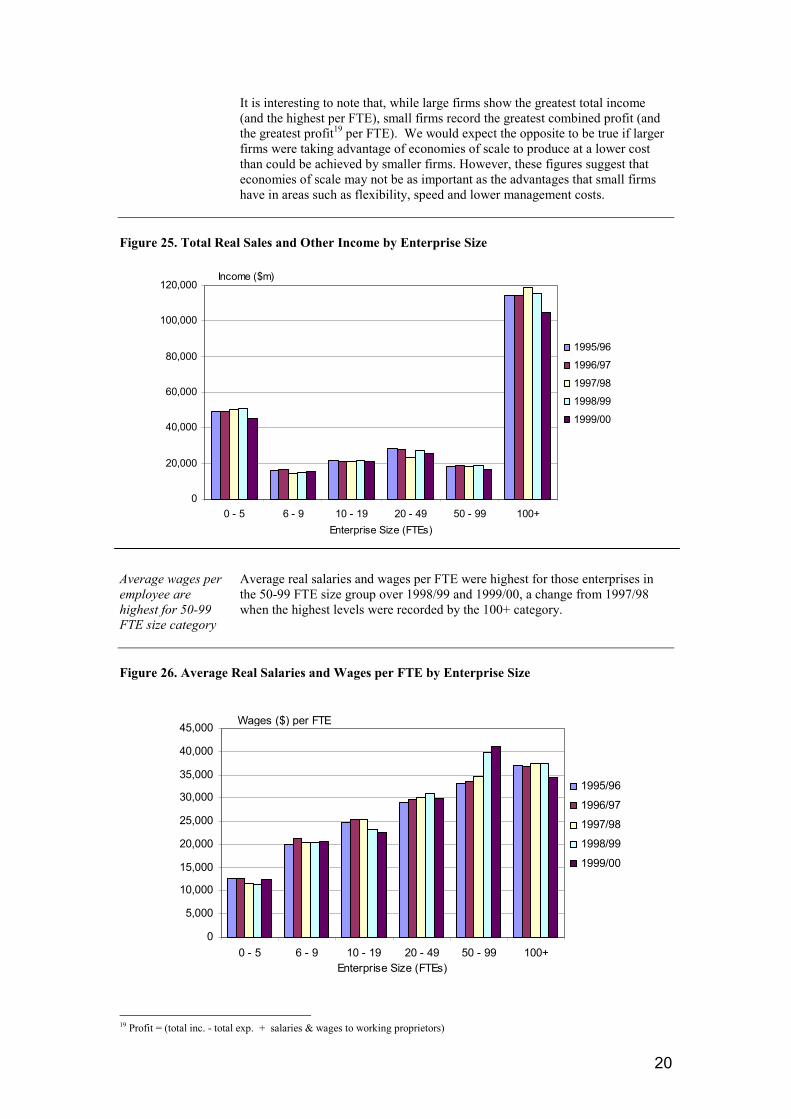
It is interesting to note that, while large firms show the greatest total income(and the highest per FTE), small firms record the greatest combined profit (andthe greatest profit19 per FTE). We would expect the opposite to be true if largerfirms were taking advantage of economies of scale to produce at a lower costthan could be achieved by smaller firms. However, these figures suggest thateconomies of scale may not be as important as the advantages that small firmshave in areas such as flexibility, speed and lower management costs.
Figure 25. Total Real Sales and Other Income by Enterprise Size
Average wages peremployee arehighest for 50-99FTE size category
Average real salaries and wages per FTE were highest for those enterprises inthe 50-99 FTE size group over 1998/99 and 1999/00, a change from 1997/98when the highest levels were recorded by the 100+ category.
Figure 26. Average Real Salaries and Wages per FTE by Enterprise Size
19 Profit = (total inc. - total exp. + salaries & wages to working proprietors)
0
20,000
40,000
60,000
80,000
100,000
120,000
0 - 5 6 - 9 10 - 19 20 - 49 50 - 99 100+Enterprise Size (FTEs)
1995/96
1996/97
1997/98
1998/99
1999/00
Income ($m)
0
5,000
10,000
15,000
20,000
25,000
30,000
35,000
40,000
45,000
0 - 5 6 - 9 10 - 19 20 - 49 50 - 99 100+Enterprise Size (FTEs)
1995/96
1996/97
1997/98
1998/99
1999/00
Wages ($) per FTE
21
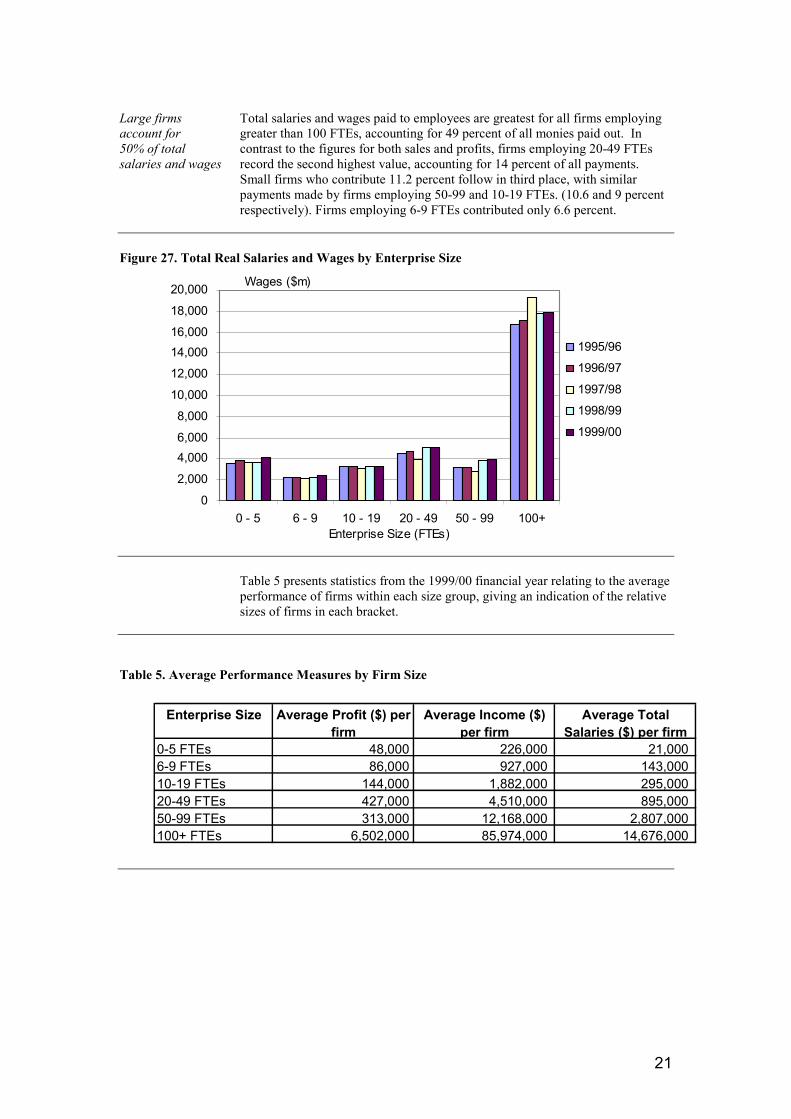
Large firmsaccount for50% of totalsalaries and wages
Total salaries and wages paid to employees are greatest for all firms employinggreater than 100 FTEs, accounting for 49 percent of all monies paid out. Incontrast to the figures for both sales and profits, firms employing 20-49 FTEsrecord the second highest value, accounting for 14 percent of all payments.Small firms who contribute 11.2 percent follow in third place, with similarpayments made by firms employing 50-99 and 10-19 FTEs. (10.6 and 9 percentrespectively). Firms employing 6-9 FTEs contributed only 6.6 percent.
Figure 27. Total Real Salaries and Wages by Enterprise Size
Table 5 presents statistics from the 1999/00 financial year relating to the averageperformance of firms within each size group, giving an indication of the relativesizes of firms in each bracket.
Table 5. Average Performance Measures by Firm Size
0
2,000
4,0006,000
8,000
10,000
12,000
14,00016,000
18,000
20,000
0 - 5 6 - 9 10 - 19 20 - 49 50 - 99 100+Enterprise Size (FTEs)
1995/96
1996/97
1997/98
1998/99
1999/00
Wages ($m)
Enterprise Size Average Profit ($) per firm
Average Income ($) per firm
Average Total Salaries ($) per firm
0-5 FTEs 48,000 226,000 21,000 6-9 FTEs 86,000 927,000 143,000 10-19 FTEs 144,000 1,882,000 295,000 20-49 FTEs 427,000 4,510,000 895,000 50-99 FTEs 313,000 12,168,000 2,807,000 100+ FTEs 6,502,000 85,974,000 14,676,000
22
Ethnicity, Gender and Employment Status
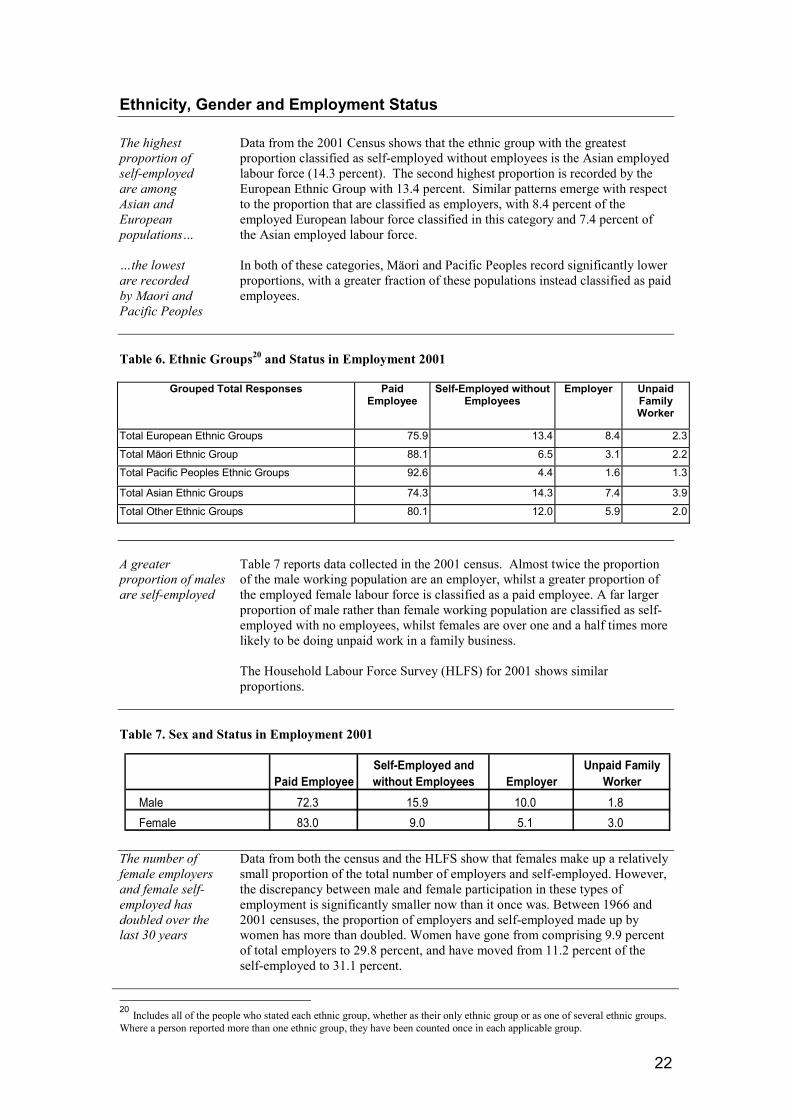
The highestproportion ofself-employedare amongAsian andEuropeanpopulations…
…the lowestare recordedby Maori andPacific Peoples
Data from the 2001 Census shows that the ethnic group with the greatestproportion classified as self-employed without employees is the Asian employedlabour force (14.3 percent). The second highest proportion is recorded by theEuropean Ethnic Group with 13.4 percent. Similar patterns emerge with respectto the proportion that are classified as employers, with 8.4 percent of theemployed European labour force classified in this category and 7.4 percent ofthe Asian employed labour force.
In both of these categories, Mäori and Pacific Peoples record significantly lowerproportions, with a greater fraction of these populations instead classified as paidemployees.
Table 6. Ethnic Groups20 and Status in Employment 2001
Grouped Total Responses PaidEmployee
Self-Employed withoutEmployees
Employer UnpaidFamilyWorker
Total European Ethnic Groups 75.9 13.4 8.4 2.3
Total Mäori Ethnic Group 88.1 6.5 3.1 2.2
Total Pacific Peoples Ethnic Groups 92.6 4.4 1.6 1.3
Total Asian Ethnic Groups 74.3 14.3 7.4 3.9
Total Other Ethnic Groups 80.1 12.0 5.9 2.0
A greaterproportion of malesare self-employed
Table 7 reports data collected in the 2001 census. Almost twice the proportionof the male working population are an employer, whilst a greater proportion ofthe employed female labour force is classified as a paid employee. A far largerproportion of male rather than female working population are classified as self-employed with no employees, whilst females are over one and a half times morelikely to be doing unpaid work in a family business.
The Household Labour Force Survey (HLFS) for 2001 shows similarproportions.
Table 7. Sex and Status in Employment 2001
The number offemale employersand female self-employed hasdoubled over thelast 30 years
Data from both the census and the HLFS show that females make up a relativelysmall proportion of the total number of employers and self-employed. However,the discrepancy between male and female participation in these types ofemployment is significantly smaller now than it once was. Between 1966 and2001 censuses, the proportion of employers and self-employed made up bywomen has more than doubled. Women have gone from comprising 9.9 percentof total employers to 29.8 percent, and have moved from 11.2 percent of theself-employed to 31.1 percent.
20 Includes all of the people who stated each ethnic group, whether as their only ethnic group or as one of several ethnic groups.Where a person reported more than one ethnic group, they have been counted once in each applicable group.
Paid EmployeeSelf-Employed and without Employees Employer
Unpaid Family Worker
Male 72.3 15.9 10.0 1.8Female 83.0 9.0 5.1 3.0
23
SMEs Internationally
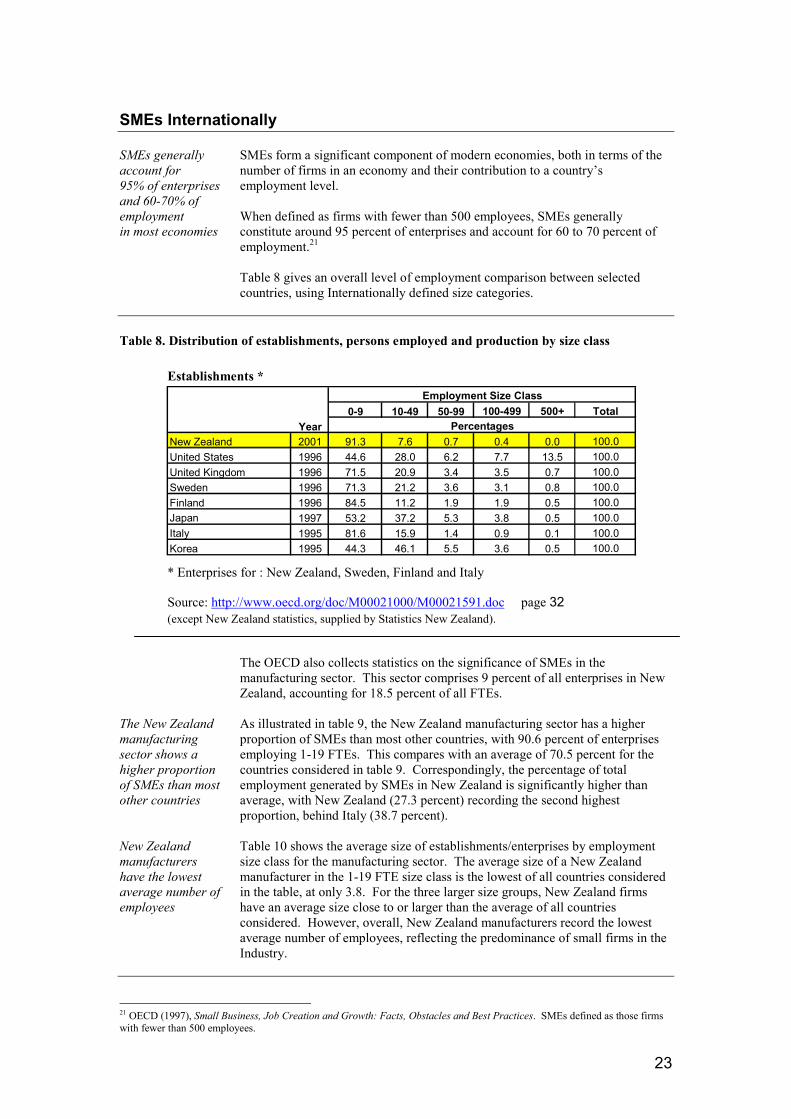
SMEs generallyaccount for95% of enterprisesand 60-70% ofemploymentin most economies
SMEs form a significant component of modern economies, both in terms of thenumber of firms in an economy and their contribution to a country’semployment level.
When defined as firms with fewer than 500 employees, SMEs generallyconstitute around 95 percent of enterprises and account for 60 to 70 percent ofemployment.21
Table 8 gives an overall level of employment comparison between selectedcountries, using Internationally defined size categories.
Table 8. Distribution of establishments, persons employed and production by size class
Establishments *
* Enterprises for : New Zealand, Sweden, Finland and Italy
Source: http://www.oecd.org/doc/M00021000/M00021591.doc page 32(except New Zealand statistics, supplied by Statistics New Zealand).
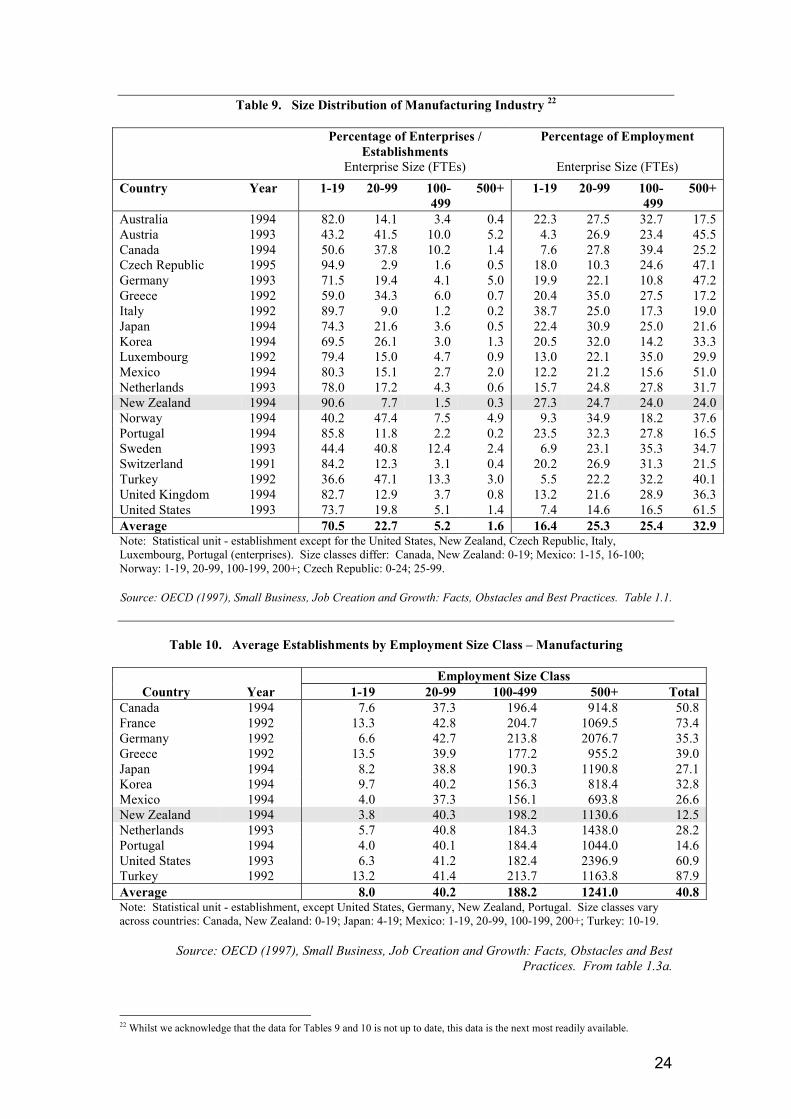
The New Zealandmanufacturingsector shows ahigher proportionof SMEs than mostother countries
The OECD also collects statistics on the significance of SMEs in themanufacturing sector. This sector comprises 9 percent of all enterprises in NewZealand, accounting for 18.5 percent of all FTEs.
As illustrated in table 9, the New Zealand manufacturing sector has a higherproportion of SMEs than most other countries, with 90.6 percent of enterprisesemploying 1-19 FTEs. This compares with an average of 70.5 percent for thecountries considered in table 9. Correspondingly, the percentage of totalemployment generated by SMEs in New Zealand is significantly higher thanaverage, with New Zealand (27.3 percent) recording the second highestproportion, behind Italy (38.7 percent).
New Zealandmanufacturershave the lowestaverage number ofemployees
Table 10 shows the average size of establishments/enterprises by employmentsize class for the manufacturing sector. The average size of a New Zealandmanufacturer in the 1-19 FTE size class is the lowest of all countries consideredin the table, at only 3.8. For the three larger size groups, New Zealand firmshave an average size close to or larger than the average of all countriesconsidered. However, overall, New Zealand manufacturers record the lowestaverage number of employees, reflecting the predominance of small firms in theIndustry.
21 OECD (1997), Small Business, Job Creation and Growth: Facts, Obstacles and Best Practices. SMEs defined as those firmswith fewer than 500 employees.
0-9 10-49 50-99 100-499 500+ TotalYear
New Zealand 2001 91.3 7.6 0.7 0.4 0.0 100.0United States 1996 44.6 28.0 6.2 7.7 13.5 100.0United Kingdom 1996 71.5 20.9 3.4 3.5 0.7 100.0Sweden 1996 71.3 21.2 3.6 3.1 0.8 100.0Finland 1996 84.5 11.2 1.9 1.9 0.5 100.0Japan 1997 53.2 37.2 5.3 3.8 0.5 100.0Italy 1995 81.6 15.9 1.4 0.9 0.1 100.0Korea 1995 44.3 46.1 5.5 3.6 0.5 100.0
Employment Size Class
Percentages
24
Table 9. Size Distribution of Manufacturing Industry 22
Percentage of Enterprises /Establishments
Enterprise Size (FTEs)
Percentage of Employment
Enterprise Size (FTEs)Country Year 1-19 20-99 100-
499500+ 1-19 20-99 100-
499500+
Australia 1994 82.0 14.1 3.4 0.4 22.3 27.5 32.7 17.5Austria 1993 43.2 41.5 10.0 5.2 4.3 26.9 23.4 45.5Canada 1994 50.6 37.8 10.2 1.4 7.6 27.8 39.4 25.2Czech Republic 1995 94.9 2.9 1.6 0.5 18.0 10.3 24.6 47.1Germany 1993 71.5 19.4 4.1 5.0 19.9 22.1 10.8 47.2Greece 1992 59.0 34.3 6.0 0.7 20.4 35.0 27.5 17.2Italy 1992 89.7 9.0 1.2 0.2 38.7 25.0 17.3 19.0Japan 1994 74.3 21.6 3.6 0.5 22.4 30.9 25.0 21.6Korea 1994 69.5 26.1 3.0 1.3 20.5 32.0 14.2 33.3Luxembourg 1992 79.4 15.0 4.7 0.9 13.0 22.1 35.0 29.9Mexico 1994 80.3 15.1 2.7 2.0 12.2 21.2 15.6 51.0Netherlands 1993 78.0 17.2 4.3 0.6 15.7 24.8 27.8 31.7New Zealand 1994 90.6 7.7 1.5 0.3 27.3 24.7 24.0 24.0Norway 1994 40.2 47.4 7.5 4.9 9.3 34.9 18.2 37.6Portugal 1994 85.8 11.8 2.2 0.2 23.5 32.3 27.8 16.5Sweden 1993 44.4 40.8 12.4 2.4 6.9 23.1 35.3 34.7Switzerland 1991 84.2 12.3 3.1 0.4 20.2 26.9 31.3 21.5Turkey 1992 36.6 47.1 13.3 3.0 5.5 22.2 32.2 40.1United Kingdom 1994 82.7 12.9 3.7 0.8 13.2 21.6 28.9 36.3United States 1993 73.7 19.8 5.1 1.4 7.4 14.6 16.5 61.5Average 70.5 22.7 5.2 1.6 16.4 25.3 25.4 32.9Note: Statistical unit - establishment except for the United States, New Zealand, Czech Republic, Italy,Luxembourg, Portugal (enterprises). Size classes differ: Canada, New Zealand: 0-19; Mexico: 1-15, 16-100;Norway: 1-19, 20-99, 100-199, 200+; Czech Republic: 0-24; 25-99.
Source: OECD (1997), Small Business, Job Creation and Growth: Facts, Obstacles and Best Practices. Table 1.1.
Table 10. Average Establishments by Employment Size Class – Manufacturing
Employment Size ClassCountry Year 1-19 20-99 100-499 500+ Total
Canada 1994 7.6 37.3 196.4 914.8 50.8France 1992 13.3 42.8 204.7 1069.5 73.4Germany 1992 6.6 42.7 213.8 2076.7 35.3Greece 1992 13.5 39.9 177.2 955.2 39.0Japan 1994 8.2 38.8 190.3 1190.8 27.1Korea 1994 9.7 40.2 156.3 818.4 32.8Mexico 1994 4.0 37.3 156.1 693.8 26.6New Zealand 1994 3.8 40.3 198.2 1130.6 12.5Netherlands 1993 5.7 40.8 184.3 1438.0 28.2Portugal 1994 4.0 40.1 184.4 1044.0 14.6United States 1993 6.3 41.2 182.4 2396.9 60.9Turkey 1992 13.2 41.4 213.7 1163.8 87.9Average 8.0 40.2 188.2 1241.0 40.8Note: Statistical unit - establishment, except United States, Germany, New Zealand, Portugal. Size classes varyacross countries: Canada, New Zealand: 0-19; Japan: 4-19; Mexico: 1-19, 20-99, 100-199, 200+; Turkey: 10-19.
Source: OECD (1997), Small Business, Job Creation and Growth: Facts, Obstacles and BestPractices. From table 1.3a.
22 Whilst we acknowledge that the data for Tables 9 and 10 is not up to date, this data is the next most readily available.
25
LiabilityStatistics New Zealand gives no warranty that the information or data suppliedcontains no errors. However, all care and diligence has been used in processing,analysing and extracting the information. Statistics New Zealand shall not be liablefor any loss or damage suffered by the customer consequent upon the use directly, orindirectly, of the information supplied in this product.