Embed Size (px)
Citation preview
HAL Id: halshs-00605653https://halshs.archives-ouvertes.fr/halshs-00605653
Submitted on 3 Jul 2011
HAL is a multi-disciplinary open accessarchive for the deposit and dissemination of sci-entific research documents, whether they are pub-lished or not. The documents may come fromteaching and research institutions in France orabroad, or from public or private research centers.
L’archive ouverte pluridisciplinaire HAL, estdestinée au dépôt et à la diffusion de documentsscientifiques de niveau recherche, publiés ou non,émanant des établissements d’enseignement et derecherche français ou étrangers, des laboratoirespublics ou privés.
Structure and dynamics of transportation networks:Models, methods and applications
César Ducruet, Igor Lugo
To cite this version:César Ducruet, Igor Lugo. Structure and dynamics of transportation networks: Models, methodsand applications. Rodrigue, J.P., Notteboom, T.E., and Shaw, J. The SAGE Handbook of TransportStudies, SAGE, pp.347-364, 2013. �halshs-00605653�
STRUCTURE AND DYNAMICS OF
TRANSPORTATION NETWORKS: MODELS,
METHODS, AND APPLICATIONS∗
Cesar DucruetCentre National de la Recherche Scientifique
UMR Geographie-CitesUniversity of Paris I, Pantheon Sorbonne
Paris, [email protected]
Igor LugoUMR Geographie-Cites
University of Paris I, Pantheon SorbonneParis, France
July 2, 2011
1 Introduction
The study of transport networks has long been at a crossroads between various
scientific disciplines. Traditionally, transport networks are studied from a graph
theory perspective, which is a branch of mathematics proposing concepts and
measures about the topology of networks considered as sets of nodes (vertices)
connected by links (edges). Limited computational power and the scarcity of rel-
evant datasets limited the analysis to relatively small networks, most of which
are planar networks (i.e. with no crossings between edges) and accessibility
problems based on pure topology. Decreasing interest for structural approaches
in social sciences partly caused the stagnation of transport network analysis
since the 1970s, notwithstanding progress brought in by Geographical Informa-
tion Systems (GIS) and and spatial economics from the 1980s onwards (Waters,
2006). Technology and information improvements as well as the wide popular-
ization of the “network” concept contributed to the emergence of new analysis
∗Submitted to SAGE Handbook of Transport Studies
1
methods in the late 1990s. The research field of complex networks, mostly led
by physicists eager to test their models and measures on real-world cases, pro-
vided many analyses of the structure and dynamics of large-scale networks of all
kinds. Among them, transport networks have received much attention, thereby
providing new ways of understanding their internal efficiencies and vulnerabili-
ties.
However, most social scientists interested in transport networks, such as ge-
ographers, economists, and regional scientists, have long relied on classic graph
theory and qualitative case studies. The integration of complex networks meth-
ods by transport specialists is very recent (Kuby et al., 2005) and comes as a
complement to other approaches such as circulation routing and flow optimiza-
tion which strongly focus on transport costs. So far, there remains little overlap
and interaction between the different approaches. This state of affairs as well
as the fast evolution of the field motivate this chapter, which proposes a review
of existing studies of transport networks from a methodological point of view.
We propose distinguishing amongst the structure and the dynamics of trans-
portation networks. The first section discusses the static dimension (struc-
ture) and reviews how transportation networks have been defined and analyzed
with regard to their topology, geometry, morphology, and spatial structure. It
presents a critical overview of main global (network level) and local (node level)
measures and examines their usefulness for understanding transportation net-
works. The second section explores the dynamics of transportation networks,
their evolution, and the properties underlying such evolutions. Each section
provides a brief background of the relevant literature, concrete applications,
and policy implications in various transport modes and industries, with an in-
terdisciplinary focus. A discussion is provided evaluating the legacy of reviewed
works and potential for further developments in transport studies in general.
2 Structure of Transportation Networks
Transport networks are mostly studied in a static fashion. Research in this
field is very voluminous and diverse, but one central goal is to highlight the
overall characteristics of the networks structure based on its topology, geometry,
morphology, and traffic flows. We divide the literature review between the global
level, which is interested in describing the entire network, and the sub-levels,
which look either at groups or individual nodes within the network.
2
2.1 Global Level
Transport networks belong to a wider category of spatial networks, because
their design and evolution are physically constrained (e.g. Euclidian distance)
as opposed to non-spatial networks such as the Internet, scientific collabora-
tions, multinational firms, social networks, and biological systems such as neu-
ronal networks (Boccaletti et al., 2006; Gastner and Newman, 2004; Blumenfeld-
Lieberthal, 2009). The physical grounding varies in relevance depending on the
transport mode considered. Urban streets, roads, and railways are composed of
track infrastructure, while maritime and air transports remain vaguely defined
due to their higher spatial flexibility except for the location of terminals them-
selves (Rodrigue et al., 2009). Maritime networks remain more constrained than
airline networks due to coastlines (Xu et al., 2007). River networks typically
form basins and can be classified as trees or dendrograms (Banavar et al., 1999).
Most research on transport networks has focused on planar networks (e.g.
roads, railways) due to easier access to infrastructure data allowing topolog-
ical measurements and because the planning and operation of such networks
concern everyday mobility at the urban (e.g. street, bus, subway) or regional
level (e.g. highway, interstate lanes). Other transport networks without track
infrastructure (e.g. air, sea) necessitate the use of traffic data to build a graph
of ephemeral links from either vehicle movements or scheduled service. Partly
due to the absence of comparable data for urban studies, airline networks have
become central in the analysis of systems of cities on various levels. Maritime
transport has recently received more interest due to the use of newly available
data on carrier services and vessel movements (Ducruet et al., 2010).
In their review of the measures synthesizing the structure of communication
networks, Beguin and Thomas (1997) introduce four different schools: graph
theory, matrices of the shortest paths, geomorphometry (quantitative land sur-
face analysis), and eigenvalues. Matrices of the shortest paths refer to the search
for specific configurations in the network, such as the minimum cost tree, which
is the part of the network in which all nodes remain connected by the lowest cost
path. This approach can be at the global level to extract the optimal route from
the network or at the local level to zoom to specific nodes using algorithms such
as Kruskal, Floyd, or Dijkstra, among others (Ducruet, 2011). Geomorphometry
mainly examines river networks based on several indicators such as the number
of bifurcations and the length of the river, its number of junctions. There are
two types of eigenvalues approaches: the application of multivariate statistical
methods to adjacency matrices and the use of blockmodeling and structural
equivalence to determine groups of nodes sharing similar connectivity patterns
in the network (Beauguitte, 2011). Based on the simplification of real-world
3
places and pathways into graphs, i.e. groups of nodes (vertices) connected by
some links (edges), a wide set of concepts and measures have been proposed by
graph theory since the seminal Seven Bridges of Koenigsberg problem proposed
by Leonhard Euler in 1735. The main questions addressed are whether different
transport networks share comparable properties and according to which criteria.
The integration of graph theoretical methods in geography and regional sci-
ence with related applications to transport networks dates back to the works
of Garrison (1960), Kansky (1963), Haggett and Chorley (1972), and Garri-
son and Marble (1974). The first set of studies was characterized by limited
data, low computational power, and few modeling techniques (Xie and Levin-
son, 2007) but is still used to analyze the structure of transport networks. Most
common measures include the number of nodes and links (i.e. network size),
the length and diameter of the network, its connexity (continuity of the network
in terms of the number of connected components), connectivity (more or less
optimal distribution of links among the nodes), and nodality. Notably, the three
main indices Alpha, Beta, and Gamma proposed by Kansky (1963) do not con-
sider the real length, quality, and weight of the links;1 networks of equal size
may exhibit contrasted topological forms (Beguin and Thomas, 1997; Kurant
and Thiran, 2006). However, they remain useful for describing the changing
structure of one given network (Scott et al., 2005; Xie and Levinson, 2009). Us-
ing such indicators, Wang et al. (2009) demonstrate the phased development of
the Chinese railway network from 1906 to 2000, highlighting its closeness with
overall economic development and the formation of urban systems.
More recently, robust macroscopic measures have been proposed to refine
those provided by graph theory (see the table in Appendix A: Complex Networks
Measures). Barabasi and Albert (1999) define scale-free networks using a high
exponent (over 1 and/or between 2 and 3) of the power-law slope drawn based on
plotting the frequency of nodes versus the degree centrality distribution (i.e. the
number of edges connecting direct neighbors). Many nodes have a poor number
of connections, while only a few nodes multiply them, thus making the network
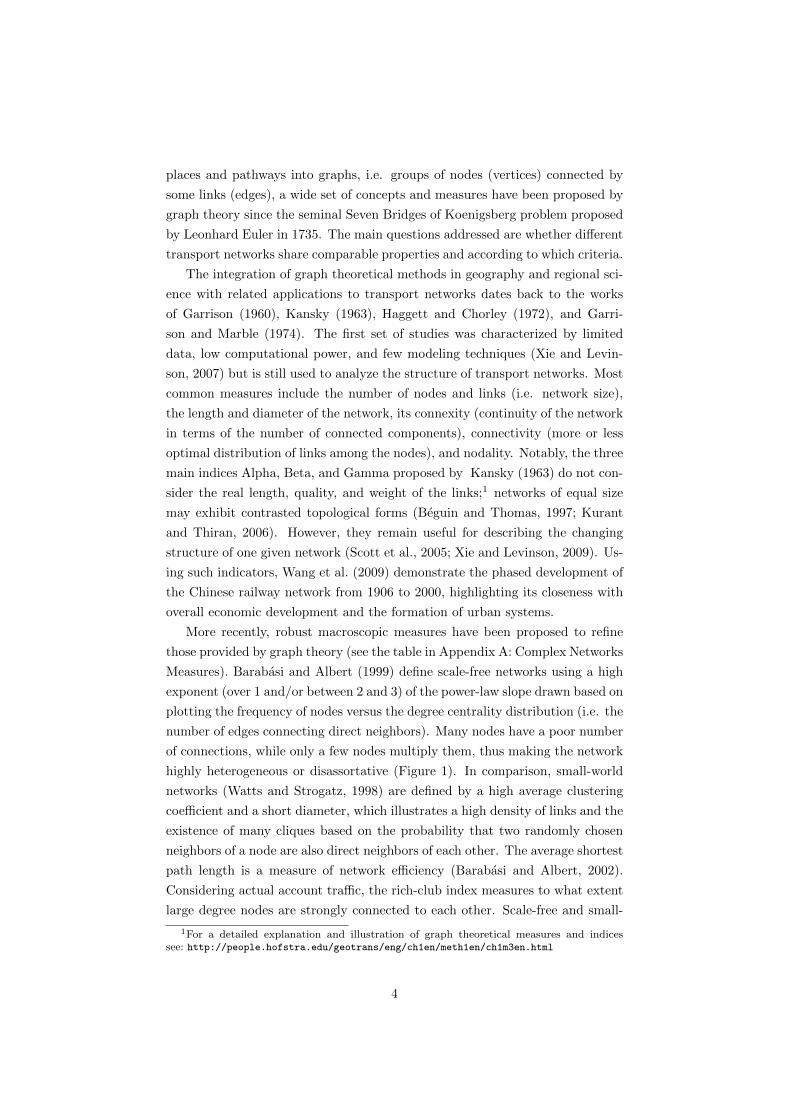
highly heterogeneous or disassortative (Figure 1). In comparison, small-world
networks (Watts and Strogatz, 1998) are defined by a high average clustering
coefficient and a short diameter, which illustrates a high density of links and the
existence of many cliques based on the probability that two randomly chosen
neighbors of a node are also direct neighbors of each other. The average shortest
path length is a measure of network efficiency (Barabasi and Albert, 2002).
Considering actual account traffic, the rich-club index measures to what extent
large degree nodes are strongly connected to each other. Scale-free and small-
1For a detailed explanation and illustration of graph theoretical measures and indicessee: http://people.hofstra.edu/geotrans/eng/ch1en/meth1en/ch1m3en.html
4
world networks tend to concentrate at a few high-order connections, whereas
road networks are characterized by a large diameter (i.e. maximum path length).
Other indices have been proposed, such as the assortativity coefficient, which
highlights to what extent nodes of comparable connectivity are connected to
each other in the network. Such properties imply dynamics and evolutionary
paths that are specific to transport networks.
Figure 1: Two main network configurations
Several applications of complex networks have revealed interesting speci-
ficities and common grounds of different transport networks. Studies of the
global maritime transport network (Hu and Zhu, 2009) and the global air trans-
port network (Guimera et al., 2005) confirm their overall scale-free properties
with regard to the existing literature on hub-and-spoke strategies of carriers
(see (Fleming and Hayuth, 1994; O’Kelly, 1998)). While a relatively high vul-
nerability of the network lays upon few large nodes, the truncated distribution
reveals the costs of creating new links at large nodes facing congestion problems,
as seen in other case studies of air transport networks (Li and Cai, 2004; Guida
and Maria, 2007), public transportation networks (Latora and Marchiori, 2002;
Sienkiewicz and Holyst, 2005; Ferber et al., 2005; Xu et al., 2007) and railway
networks (Sen et al., 2003).
Since most research focuses on one single network, there is a growing aware-
ness that transport networks may be interdependent through issues of intercon-
nectivity and the vulnerability of tightly coupled infrastructures regarding cas-
5
cading failures, breakdowns, and attacks (Geenhuizen, 2000; Vespignani, 2010;
Buldyrev et al., 2010). Notably, Zhang et al. (2005) argue that multi-layer
infrastructure networks should be analyzed at various geographic levels with
regard to the respective topology and function of individual networks and to po-
tential inter-modal shifts and mutual influence. Examining the co-evolution of
roads, canals, and ports during the English industrial revolution, Bogart (2009)
reveals noticeable interdependencies among different nodes and networks over
time based on spatial and functional proximity. This underlines that initial net-
work developments are often done to support and then compete with an existing
network by expanding geographically and topologically in ways unavailable to
the prior network. Ducruet et al. (2011) also highlights the complementarity be-
tween air and maritime networks in the formation of a global urban hierarchy.
This is also apparent in the work of Parshani et al. (2010) on the inter-similarity
between coupled maritime and air transport networks, which shows that well-
connected airports tend to couple with well-connected seaports in general, based
on their respective geographic locations and on their topological attributes. Fi-
nally, Jin et al. (2010) propose an indicator of transport dominance applied
simultaneously to freeway, railway and airline networks in China, stressing the
importance of large urban concentrations and the role of distant cities serving
as hubs for Western areas.
2.2 Local Level
Various local measures of networks have also been developed (Taaffe and Gau-
thier, 1973; Cliff et al., 1979; Dupuy and Stransky, 1996; West, 1996; Degenne
and Forse, 1999). The goal is to compare the relative position of nodes in the
network and to highlight groups of nodes in the network. While a full list of
measures would run beyond the scope of this chapter, it is possible to organize
them by those indicating the situation of the node in the entire network and
those focusing on the relations of the node with its adjacent neighbors.
The most common global measures of a given node include:
• betweenness centrality: number of possible positions on shortest paths;
• eccentricity (or associated number, Koenig number): number of links
needed to reach the most distant node in the graph;
• Shimbel index (or Shimbel distance, nodal accessibility, nodality): sum of
the length of all shortest paths connecting all other nodes in the graph.
The inverse measure is also called closeness centrality or distance central-
ity.
6
Other local measures are those looking at the neighborhood of a given node:
• degree (or degree centrality): number of adjacent neighbors. The weighted
degree is the sum of weights on adjacent links;
• hub dependence: share of the strongest traffic link in total traffic, a mea-
sure of vulnerability;
• average nearest neighbors degree: indicates to what extent the node is
surrounded by large or small nodes;
• clustering coefficient: proportion of observed closed triplets in the sum of
all possible closed triplets, a measure of tightness and density.
Plotting together some of the aforementioned measures may highlight spe-
cific features of transportation networks. For instance, nodes with low degree
centrality and high betweenness centrality reveal their role as bridges between
different subgroups, i.e. as a strategic position or intermediacy. Some hubs may
also act as a redistribution platform within their adjacent regions, thus multiply-
ing their links in addition to their bridge role (e.g. feeder links in liner shipping,
air or trucking). In maritime networks, Deng et al. (2009) underline the strong
relation between actual throughput and degree centrality for container ports.
The centrality of cities in air transport networks has received great attention
in recent years. The relation between local measures and other local/regional
indicators is also the focus of recent research on transportation networks. For
instance, Wang et al. (2011) demonstrate the close relationship between the
position of Chinese cities in airline networks (i.e. degree, closeness, and be-
tweenness centralities) and their local socio-economic characteristics (i.e. total
passenger traffic, urban population, and Gross Regional Product). Analyzing
communication networks in the UK, Eagle et al. (2010) find strong interde-
pendencies between the diversity of connections and the economic well-being of
localities.
Local measures may or may not take into account the valuation of the edges
concerned (i.e. weighted or non-weighted). This is of high relevance for trans-
port studies, since transport networks are better understood by the usage level
(e.g. number of passengers, tons, vehicles, capacity) than by their sole topology
based on a binary state (i.e. presence or absence of links). The weighted degree
centrality usually corresponds to the sum of edges traffic, sometimes called node
strength. The hub dependence index, which corresponds to the percentage of
the strongest traffic edge in the total traffic of each node, is a measure of vulner-
ability, notably highlighting the contrast for Shenzhen port between its traffic
growth and its maintained dependence upon the Hong Kong hub (Ducruet et al.,
7
2010). In their study of the worldwide air transport network, Barrat et al. (2004)
demonstrated that the formation of cliques among major airports (also called
rich-club phenomenon) is readable only using traffic weights. The inclusion of
edge weight in the analysis can indeed reveal hidden patterns beyond the sole
topology, such as the small-world structure of commuter flows in Italy (DeMon-
tis et al., 2010) and the identification of different city types through the relative
efficiency of their urban street patterns and length compared to optimal con-
figurations of greedy triangulation and minimum spanning tree (Cardillo et al.,
2006).
Motivated by practical and policy implications, transport networks analysis
has also benefited from further developments in accessibility studies. Various
algorithms, such as the Koenig number and the Shimbel index, have been used
to describe nodal accessibility in numerous empirical studies. The Shimbel in-
dex was used in several case studies to reveal nodal accessibility for European
regions in the context of integration (Gutierrez and Urbano, 1996) and Belgian
crossroads (Lannoy and Oudheusden, 1991); the impact of deregulation and
hub formation on air accessibility in China (Choua, 1993; Shaw, 1993) and in
Southeast Asia (Bowen, 2000, 2002); and the impact of railway development
on urban accessibility in Japan (Murayama, 1994). Examining the Indianapolis
city road network, (Gleyze, 2007) refines topological measures of centrality and
eccentricity by distinguishing between network and spatial effects. Chapelon
(2005) applies the widely used Floyd algorithm of the shortest path, taking into
account topological features and circulation constraints such as national regula-
tions (e.g. speed limits), highway tolls, the types and capacities of main roads,
and the travel time including loading /unloading delays at multimodal junctions
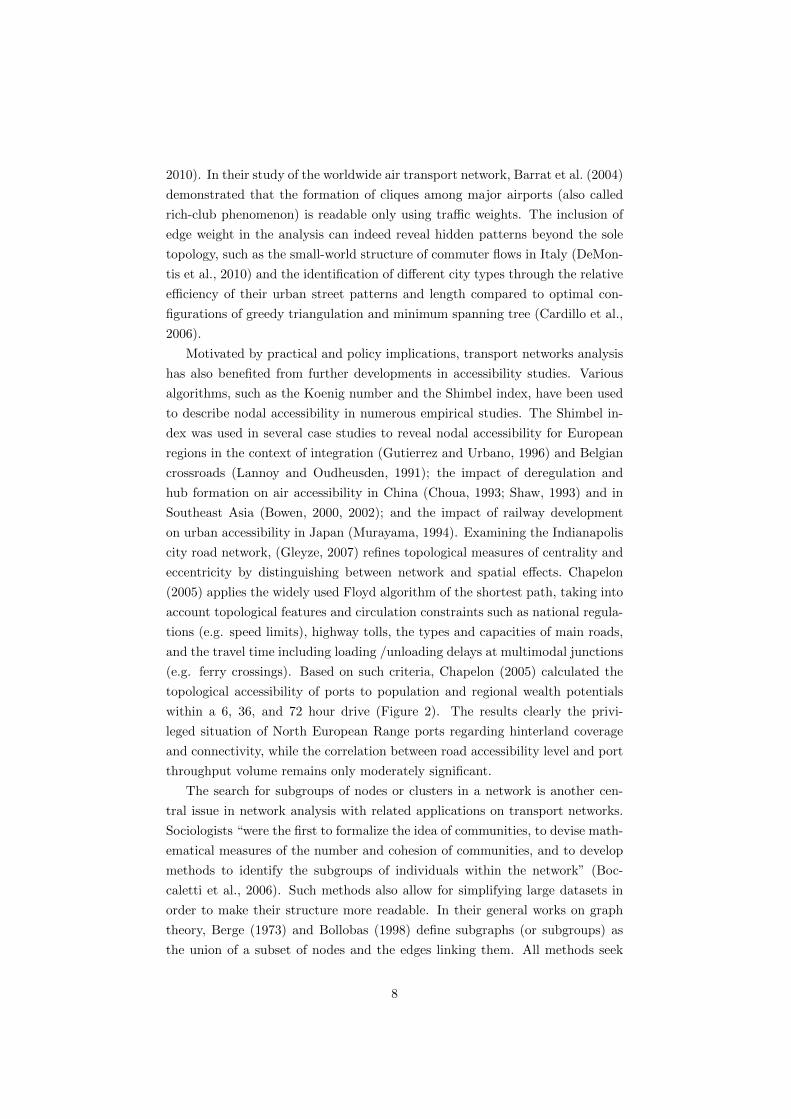
(e.g. ferry crossings). Based on such criteria, Chapelon (2005) calculated the
topological accessibility of ports to population and regional wealth potentials
within a 6, 36, and 72 hour drive (Figure 2). The results clearly the privi-
leged situation of North European Range ports regarding hinterland coverage
and connectivity, while the correlation between road accessibility level and port
throughput volume remains only moderately significant.
The search for subgroups of nodes or clusters in a network is another cen-
tral issue in network analysis with related applications on transport networks.
Sociologists “were the first to formalize the idea of communities, to devise math-
ematical measures of the number and cohesion of communities, and to develop
methods to identify the subgroups of individuals within the network” (Boc-
caletti et al., 2006). Such methods also allow for simplifying large datasets in
order to make their structure more readable. In their general works on graph
theory, Berge (1973) and Bollobas (1998) define subgraphs (or subgroups) as
the union of a subset of nodes and the edges linking them. All methods seek
8
Figure 2: Example of accessibility measures. European ports in the road net-work (Source: adapted from Chapelon (2005)
to find relevant measures in order to bisect a given graph based on closeness
within resulting groups (see (Wasserman and Faust, 1994; Moody and White,
2003)). Resulting subgroups exhibit various characteristics such as adhesion,
with a centralization upon a leader node, cohesion, with more harmonized ties
among nodes, cliquishness, exhaustiveness, reachability, and density (Gleyze,
2010). The identification of cut-sets allows the identification of the edges to be
removed between subgroups, focusing on connections existence, quality and ro-
bustness within and between subgroups, with reference to the concept of clique.
The notion of modularity refers to the optimization of intra-group cohesiveness
(measured by distance, structural similarity or dissimilarity among nodes) with
regard to inter-group linkages.
One of the first methods introduced for delimitating coherent sub-regions
was the Nystuen-Dacey or dominant flow algorithm (Nystuen and Dacey, 1961),
first applied to telecommunication flows among Oregon cities. Its numerous ap-
plications on weighted transport networks have revealed barrier effects in air
and rail transport flows (Cattan, 1995), which cities dominate the hierarchy
of air flows (Grubesic et al., 2008), and which ports act as pivots in maritime
systems (Ducruet and Notteboom, 2011). Retaining only the maximum flow
link between each node simplifies the networks architecture and highlights the
existence of so-called nodal regions. Independent nodes are those in which dom-
inant flow connects a smaller node in terms of individual traffic size; subordinate
9

nodes always connect a larger sized node. Notably, Cattan (2004) depicts the
lowering integration level of the worldwide airline system, observing its growing
polarization by fewer large hubs and the disappearance of sub-regional systems
formerly well connected internally. Figure 3 gives a more concrete illustration
with the evolution of the nodal region of Busan, South Korea based on inter-
port container traffic flows, showing how the hub strategy has resulted in an
extension of its tributary area from mostly Japanese satellites to a number of
Chinese secondary ports.
Figure 3: Example of a nodal region. The case of Busan, South Korea (Source:adapted from Ducruet et al. (2010).
Because the Nystuen-Dacey algorithm neglects a large number of secondary
links, other methods of graph clustering (or partitioning) have been preferred in
order to take into account the complexity of the network (Gleyze, 2010) and its
multi-level organization. For instance, the application of strength clustering on
commuter flows in France reveals the polycentrism, cohesion and fragmentation
of urban areas (Tissandier, 2011). It has also been applied to air passenger
flows among cities worldwide (Amiel et al., 2005), showing the importance of
geographic proximity in the formation of clusters and the multi-level relations
among them. For instance, Asian cities tend to form dense neighborhoods, while
some global hubs do not belong to a specific cluster due to their intermediate
role between regions. Other measures include the z-score (share of the cluster
in a nodes connections) and the participation coefficient (connections to other
clusters) applied to worldwide air traffic (Guimera et al., 2005). The availabil-
ity of air traffic data on city pairs has helped foster a vast number of studies
on the centrality of cities in such networks (see Shin and Timberlake (2000)).
The bisecting K-means algorithm applied on all weighted maritime links among
Atlantic ports verifies a strong interdependency within the Le Havre-Hamburg
10
or North European range as well as strong ties among Iberian Peninsula ports
and Brazilian ports. Other port groups are better defined by internal geographic
proximity and peripherality from the whole system (Ducruet et al., 2010). Over-
all, the only problem related to clustering methods is that there is no guarantee
to reach the best result as it depends on the edge weight selected (e.g. traf-
fic), and there is no indication about the right number of iterations needed
unless it verifies valid hypotheses about the number, quality, and size of ex-
pected groups.2 Simpler methods have been proposed, such as deleting edges
with high betweenness centrality (Newman and Girvan, 2004) or removing the
highest or lowest degree centrality nodes (Zaidi, 2011). Other approaches in-
clude clustering junctions on road networks (Mackechnie and Mackaness, 1999;
Gleyze, 2007); the use of structural equivalence, blockmodeling, and lambda-set
methods to study the regionalization of the US Internet backbone infrastructure
network (Gorman and Kulkarni, 2004); and measures of node vulnerability in
the Swedish road network (Jenelius, 2009).
3 Dynamics in Transportation Networks
Understanding transport development requires analyzing complex and dynamic
processes that produce temporal changes in the transport system. Two main
issues are addressed in the literature: how the spatial structure of transporta-
tion networks evolves over time and the mechanisms modifying this structure.
Several techniques have been developed to describe, compute, and simulate
large-scale features of transport networks. Geographers describe topological
transformations in the network based on intuitive mechanisms to replicate net-
work geometries (Kansky, 1963; Taaffe et al., 1963; Garrison and Marble, 1962;
Morrill, 1965); economists and urban planners compute and design statistical
models for choosing the best design of the network from an explicit set of avail-
able variables and alternatives (Schweitzer et al., 1998; Leblanc, 1975; Yang and
Bell, 1998; Gastner and Newman, 2004; Barthelemy and Flammini, 2006); and
engineers and physicists simulate emergent attributes of networks applying the
concept of self-organization and agent-based models (ABM) (Barabasi, 2002;
Newman, 2003; Lam and Pochy, 1993; Helbing et al., 1997; Yamins et al., 2003;
Yerra and Levinson, 2005; Fricker et al., 2009; Levinson and Yerra, 2006; Xie
and Levinson, 2009).3
In this section, we review briefly the application of Agent-Based Models
(ABMs) to analyze the dynamics in transport networks. Although such an ap-
plication is relatively new in the field of transportation networks, it provides
2See in-depth reviews of clustering methods by Fortunato (2010) and Schaeffer (2007).3For a complete review of literature see Xie and Levinson (2009).
11
important advantages over analytical models. For example, ABMs describe in-
dividual interrelationships and form emergent properties in the system. There-
fore, ABMs are a class of computational models for simulating systems of au-
tonomous components, called agents, and the relationships between them and
their environment. Based on a set of simple behavioral rules, agents interact and
produce unexpected collective behavior (Newman, 2003). From the perspective
of complex systems, the self-organization process shows how global patterns or
structures in a system appear without the influence of a central authority or
planning entity (Vicsek, 2000). Therefore, ABMs are a good option to study
the dynamics in transportation networks, because they are evolutive models and
allow for flexible application to diverse theoretical approaches.
For the purpose of analysis, we present two different methods to conduct
an ABM application: generative and degenerative processes. Then, we point
out some important factors that analyze the change and growth in the spatial
configuration of the network. Finally, we suggest some significant features to be
considered when designing ABMs for transport networks.
3.1 Generative vs Degenerative Methods
When the goal of the analysis is to design, create, and compare a simulation
model to empirical evidence in transportation networks, there are two general
procedures to analyze dynamics. The first is a generative method of network
formation, which explains how nodes connect by edges over time and which sit-
uations are considered rest-points in this process. Starting from an unconnected
graph, the process begins to connect each node based on different mechanisms
related to edges, for example, the cost of building or maintaining the link. An-
other process to connect nodes is based on their hierarchical attributes. For
example, a link is created between two nodes based on their degree of connec-
tivity. This process is known as “preferential attachment” and explains the
dynamics of networks that generate a power law degree distribution in a sys-
tem (Newman, 2003). Applying such a process to transportation systems may
reveal some emergent behaviors in planar and non-planar networks, such as
hub-and-spoke configurations (e.g. airlines and shipping lines) and the limi-
tations imposed by the spatial structure of transport networks (e.g. number
of connections per node for road and railway paths). Therefore, preferential
attachment not only explains the dynamics of a system based on nodes connec-
tivity but also highlights the consideration of hierarchical attributes of nodes
in order to explore the evolution of networks. The generative method has been
12

used in various scientific fields, for example, in economics (Goyal and Joshi,
2002; Yamins et al., 2003; Kirman, 2011), geography (Jiang and Yao, 2010),
and urban planning (Wilson and Nuzzolo, 2009).
On the other hand, the degenerative method proposes starting the analysis
from a complete network, where all nodes are connected to each other. All edges
represent possible paths that can be used in the system, but only the more
valuable ones reinforce its existence and modify its attributes. For example,
some local roads can reinforce their importance based on the number of users
and the cost of maintenance as well as the hierarchy of nodes to which they
are connected. Therefore, edges that are less valuable decrease in importance
and in their probability to be considered part of a representative path. Civil
engineering is the most common field of application for such a method (see Yerra
and Levinson (2005), Levinson and Yerra (2006), and Xie and Levinson (2009)).
Both methods have the same purpose: explaining an endogenous change
and growth that produces a particular network structure. For example, Fig-
ure 4 shows a planar network road system consisting of 150 nodes that are
uniformly and randomly distributed in an array of 400x400 cells, where the ini-
tial configuration of the system in the generative method is shown in 4a, and
the degenerative method is displayed in 4c. Phase 4b presents one possible out-
come in the final structure of the network; the process behind this structure is
a simple distance mechanism that connects shorter edges or deletes large edges
to nodes.
Even though both methods start from different initial conditions and ap-
ply inverse distance mechanisms, they converge to explain the final configura-
tion of the network. In other words, there are different stories to tell about
a process that creates particular network configurations. With this in mind,
pre-knowledge of the network structure, such as global/local measures, and its
contextualization, such as social and economic conditions, make it possible to
define a mechanism that well explains the dynamics behind such a configu-
ration. Then, the dynamics can be related to local mechanisms particularly
market areas, traffic flows, and socio-cultural characteristics (Christaller, 1933).
Therefore, the next step in the process to make a simulation model is selecting
those factors that guide the explanation of the evolution in the transportation
network and specify them as parameters in the model.
3.2 Mechanisms for Changing and Growing
The evolution of the transportation network is closely related to the change
and growth of central places. For example, Christaller (1933) explains the ex-
istence, characteristics, and evolution of such places. Transportation networks
13
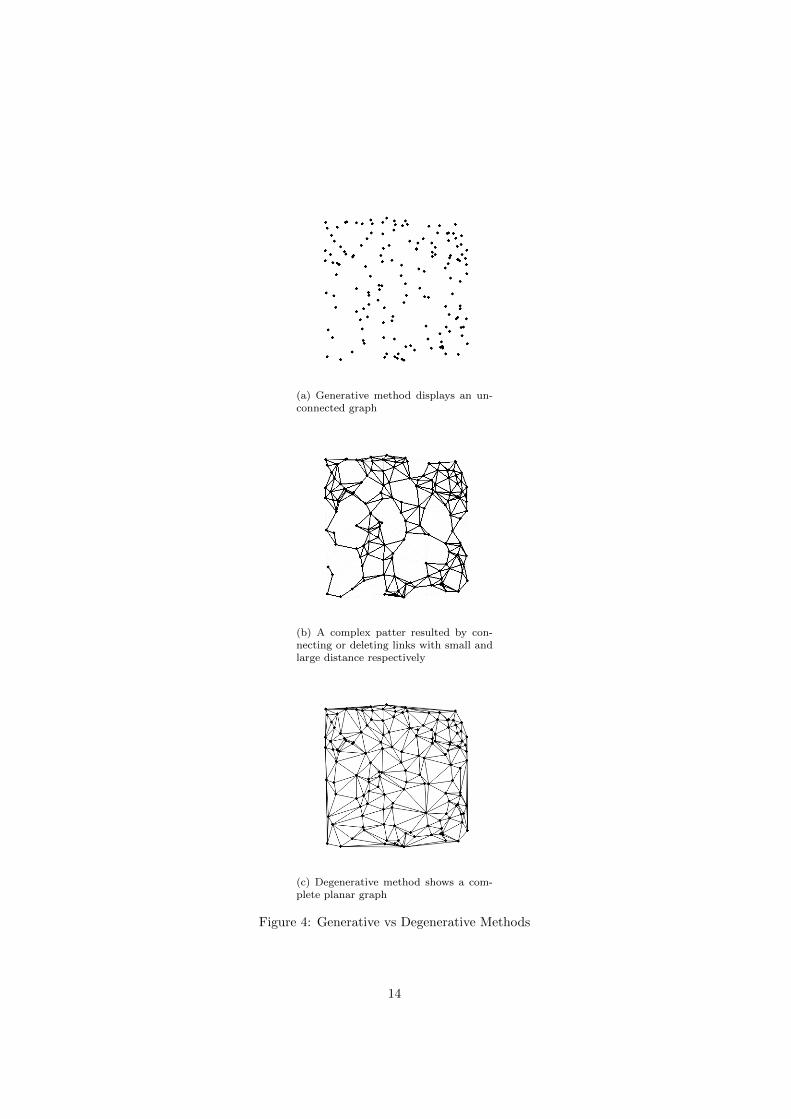
(a) Generative method displays an un-connected graph
(b) A complex patter resulted by con-necting or deleting links with small andlarge distance respectively
(c) Degenerative method shows a com-plete planar graph
Figure 4: Generative vs Degenerative Methods
14
are one of the principal factors to describe the number, size, and patter of spa-
tial distribution of these places. The co-evolution process of central places and
transport networks points out the strong connection between the dynamics of
urban and transport systems, as seen in the works of Batty (2005, 2008) and
Blumenfeld-Lieberthal and Portugali (2010).
The market factor applied to transport networks explains the importance
of the transportation cost between places in order to maximize the trade-off
between demand and supply of goods and services. The creation and mainte-
nance of transportation systems depend on the distance between central places;
the higher the distance between places, the more expensive it is to sustain the
transportation system. In other words, short links in transportation are prefer-
able. Therefore, the market area affects the transportation cost and shapes
some emergent patters in the structure of the network Fujita et al. (1999).
In addition to the market factor, traffic is another important element that
affects the structure of transportation systems. This explains the importance of
the flow of individuals, goods, and services between central places. Components
that describe this factor include the total travel time and speed on links (Xie and
Levinson, 2009). Large-scale properties of the network, such as the existence
and hierarchy of links in the system, are analyzed by the traffic factor (de Dios
and Willumsen, 2001; Levinson and Yerra, 2006).
The socio-cultural factor is a hierarchical order between central places show-
ing the level of embedded systems across a particular geographical area, for
example, an increased number of activities coordinated inside a city makes it
more important compared to other cities. Economic and demographic variables,
such as the Gross Domestic Product (GDP) and the urban population, valuate
and describe the rank of a place in a system. Consequently, transportation links
receive the effects of this factor, because more activities need to expand and dis-
tribute their influence to other places (Krugman, 1996; Pumain and Tannier,
2005; Batty, 2005).
As a result, depending on the spatial structure of the network, dynamics
can be studied through the above factors and translated into parameters. Con-
tinuing with our example of a random planar network, links are classified into
different levels according to the transportation cost. Each link has a specific
cost associated to the distance between a node pair; the closer the nodes are,
the easier it is to build and maintain their connection, and the less likely longer
pairs are to exist. Defining a parameter beta, which provides a threshold value
for selecting shorter links (distance of one link divided by the larger link), and
modifying its value provides the results shown in Figure 5.
In the figure, 5a shows a topological structure when beta is defined as 0.15,
meaning that links of bigger size (i.e. more than 15%), are not used to connect
15
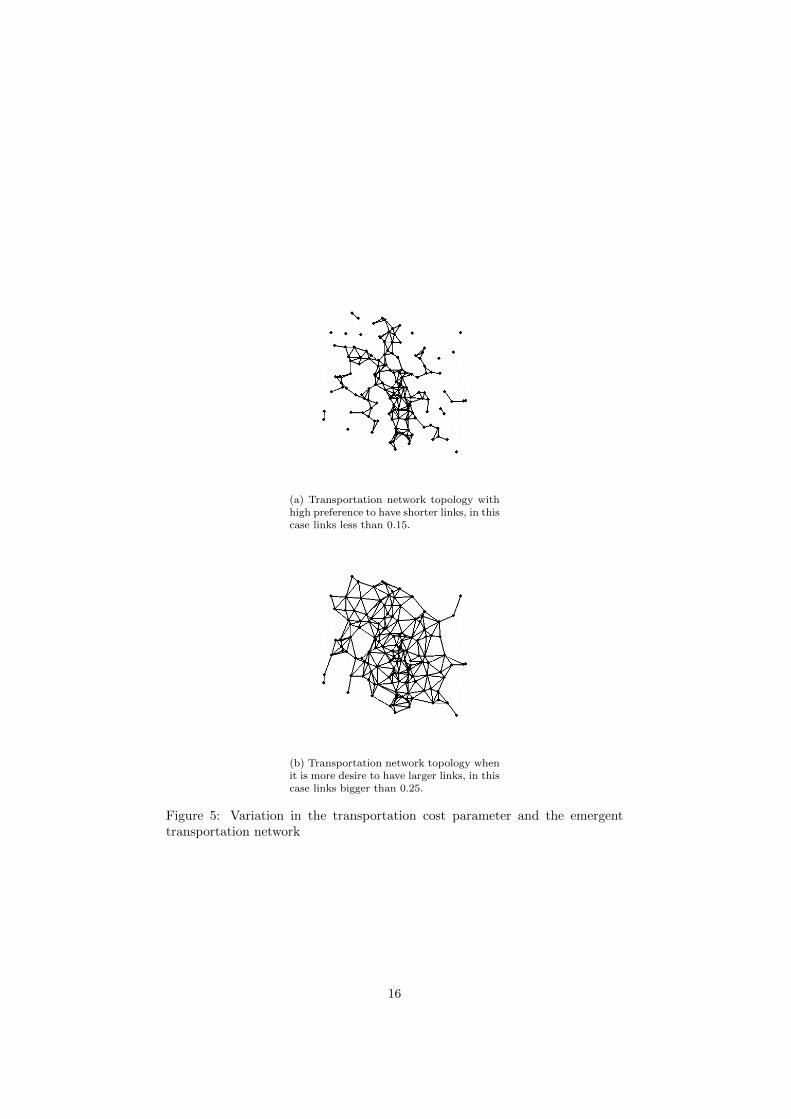
(a) Transportation network topology withhigh preference to have shorter links, in thiscase links less than 0.15.
(b) Transportation network topology whenit is more desire to have larger links, in thiscase links bigger than 0.25.
Figure 5: Variation in the transportation cost parameter and the emergenttransportation network
16
nodes or are deleted from the system. Conversely, 5b displays a dissimilar
structure, because it includes larger links, where the threshold value is set at
25%. Hence, depending on the value of the parameter, different structures
emerge in the system.
3.3 Applications
Almost any transportation network shows properties of complex systems, and
its structures can be explained by the self-organization process. Hence, ABMs
are a natural method to search explanations of the evolution of such systems,
because they provide flexible and novel applications. For instance, Martens
et al. (2010) simulate parking behaviors in a city, and Blumenfeld-Lieberthal
and Portugali (2010) develop an urban simulation model to study the dynamics
of a system of cities. After specifying the method and the relevant parameters of
the analysis, the next step is to design and implement simulation experiments.
At a glance, ABMs are computational methods conforming to a collection of
autonomous agents, each of which has specific attributes and behavioral rules;
their interrelationships produce large-scale structures in the system. In order
to apply ABMs to transportation networks, it is necessary to define the scale
of the analysis and the type of agents in the system. The scale can be related
to a region, a metropolitan area, or a city; the type of agents can be speci-
fied by nodes such as cities or terminals; and edges represent transportation
links among them. The key point is to define an autonomous agent who has
particular attributes and specific methods to interact with other agents and its
surroundings. Attributes are intrinsic characteristics of the agent, such as its
name, age, or location, and methods are mechanisms or behavioral rules that
make possible the interaction with others and modify its attributes, for example,
a method that changes the agent’s location.
Applying such methods to the Mexican road system specifies two types of
autonomous agents: cities as nodes and roads as edges. The former is defined
as a central place with the attributes of location and population. The latter
is defined as transportation links with the attributes of location and distance.
The first method compares the distance between links and returns a group of
the shortest ones; the second method compares the distance between links and
the number of habitants between nodes in order to return short links to connect
more populated cities. In Figure 6, 6a displays the road system of Mexico, 6b
shows the simulation result based on short roads, and 6c exhibits a simulation
output regard to short roads and large cities.
Although this example is very simple, note that the process behind emergent
patterns is an auto-organization between agents without a central authority
17
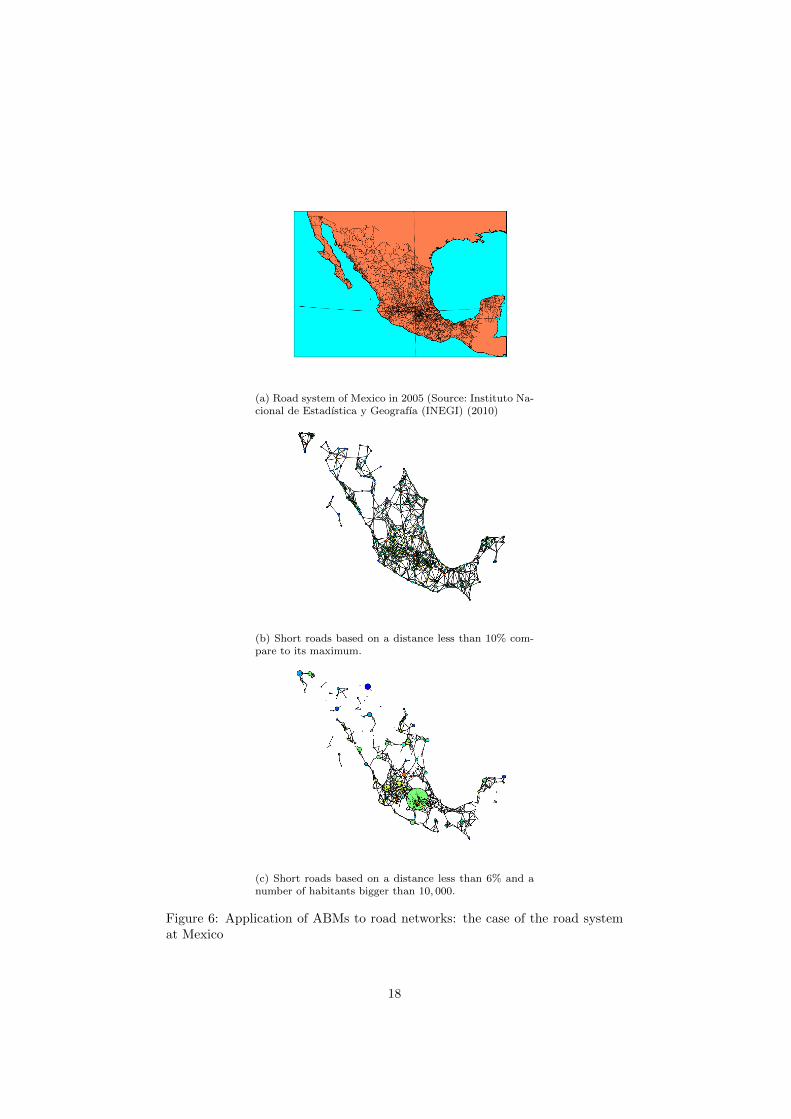
(a) Road system of Mexico in 2005 (Source: Instituto Na-cional de Estadıstica y Geografıa (INEGI) (2010)
(b) Short roads based on a distance less than 10% com-pare to its maximum.
(c) Short roads based on a distance less than 6% and anumber of habitants bigger than 10, 000.
Figure 6: Application of ABMs to road networks: the case of the road systemat Mexico
18
or planner that can be applied to the analysis of the existence, geometry, or
hierarchy in road networks.
In addition to the rigorous application of ABMs to transportation networks,
the results must be communicated in a straightforward, structured, and scientific
way. Simulation models are usually validated through comparison to empirical
data. The simulation also needs to achieve other requirements, such as analyzing
temporal changes in the topology of the network based on different network
paths, measuring structural properties of the network, and making a sensitivity
analysis where emergent patterns in the network are related to dissimilar initial
conditions (Xie and Levinson, 2009). Furthermore, there are some interesting
proposals to create a basic framework for communicating ABMs results, the
most useful of which is the ODD protocol (Overview, Design Concepts, and
Details). Based on the work of Grimm et al. (2006), this protocol is applied to
study large-scale system properties that emerge from the adaptive behavior of
agents.
4 Conclusion
Transportation networks are at the center of network analysis in natural and
social sciences. Recent trends show more interdisciplinary approaches and fast
developments of new analytical methods explored by physicists. While trans-
port network analysis still has a lot to gain from such advances, it maintains
its specificity by bridging abstract measures and theories with knowledge of the
transport industry and broader socio-economic and spatial issues. On another
hand, natural sciences give increasing importance to the spatial and social di-
mension of networks, thereby calling for further collaboration between natural
and social sciences. One interesting research path lies in the field of intermodal-
ism, which integrates local studies of planning and strategies with global-level
approaches to multiple network topologies and interdependencies. Additionally,
a closer look at meso-level measures would certainly foster understanding of how
transportation networks are structured and how they evolve with regard to the
combination of their local and global properties.
The study of dynamics in transport networks is improved through the appli-
cation of ABMs. Although such models are relatively new in the field of trans-
port networks, they help to understand endogenous mechanisms that produce
unexpected collective behavior in the system. In order to apply ABMs to the
analysis of network dynamics, it is important to define the method and mech-
anism of analysis based on theoretical and empirical evidence. In conclusion,
applying complex systems to transport networks is preferred to complement
theories and applications in different scientific fields.
19
References
M. Amiel, G. Melanon, and C. Rozenblat. Multi-level networks: The example
of worldwide air passenger flows. Mappemonde, 79(3):(accessed July 2010),
2005.
J.R. Banavar, A. Maritan, and A. Rinaldo. Size and form in efficient trans-
portation networks. Nature, 399:130–132, 1999.
A. Barabasi. Linked: The New Science of Networks. Perseus Publication, Cam-
bridge, MA, 2002.
A. Barabasi and R. Albert. Emergence of scaling in random networks. Science,
286:509–512, 1999.
A.L. Barabasi and R. Albert. Statistical mechanics of complex networks. Review
of Modern Physics, 74:47–97, 2002.
A. Barrat, M. Barthelemy, R. Pastor-Satorras, and A. Vespignani. The archi-
tecture of complex weighted networks. Proceedings of the National Academy
of Sciences, 2004. Vol. 101, No. 11.
M. Barthelemy and A. Flammini. Optimal traffic networks. Journal of Statistical
Mechanics, L07002, 2006.
M. Batty. Cities and Complexity. Understanding cities with cellular automata,
agent-based models, and fractals. MIT Press, Cambridge MA, 2005.
M. Batty. The size, scale, and shape of cities. Science, 319(5864):681–860, 2008.
L. Beauguitte. Blockmodeling and equivalence. FMR Working Paper, No.
5, 2011. http://halshs.archives-ouvertes.fr/docs/00/56/64/74/PDF/
fmr5_blockmodeling_equivalence.pdf.
H. Beguin and I. Thomas. The shape of the transportation network and the
optimal location of facilities. how to measure the shape of a network? 1997.
C. Berge. Graphes. Gauthier-Villars, Paris, 1973.
E. Blumenfeld-Lieberthal. The topology of transportation networks: a com-
parison between different economies. Networks and Spatial Economics, 9(3):
427–458, 2009.
E. Blumenfeld-Lieberthal and J. Portugali. Geospatial Analysis and Modelling
of Urban Structure and Dynamics, chapter Network Cities: A Complexity-
Network Approach to Urban Dynamics and Development, pages 77–90.
Springer Science + Business Media, b. jiang and x. yao (eds) edition, 2010.
20
S. Boccaletti, V. Latora, Y. Moreno, M. Chavez, and D.U. Hwang. Complex
networks: structure and dynamics. Physics Reports, 424:175–308, 2006.
D. Bogart. Inter-modal network externalities and transport development: Evi-
dence from roads, canals, and ports during the english industrial revolution.
Networks and Spatial Economics, 9(3):309–338, 2009.
B. Bollobas. Modern Graph Theory. Springer-Verlag, New York, 1998.
J. Bowen. Airline hubs in southeast asia: national economic development and
nodal accessibility. 2000.
J. Bowen. Network change, deregulation, and access in the global airline indus-
try. 2002.
S.V. Buldyrev, R. Parshani, G. Paul, H.E. Stanley, and S. Havlin. Catastrophic
cascade of failures in interdependent networks. Nature, 464:1025–1028, 2010.
A. Cardillo, S. Scellato, V. Larota, and S. Porta. Structural properties for planar
graphs of urban street patterns. Physical Review, E(73), 2006.
N. Cattan. Barrier effects: the case of air and rail flows. 1995.
N. Cattan. Le monde au prisme des reseaux aeriens. Flux, 58:32–43, 2004.
L. Chapelon. Accessibility as a marker of disparities of influence among port
cities in europe. Cybergeo: European Journal of Geography, (345), 2005.
Y.H. Choua. Airline deregulation and nodal accessibility. Journal of Transport
Geography, 1(1):36–46, 1993.
W. Christaller. Die Zentralen Orte in Suddeutschland. Gustav Fischer, Jena,
1933.
A. Cliff, P. Haggett, and K. Ord. Applications of Graph Theory, chapter Graph
Theory and Geography, pages 293–326. Academic Press, London, r. wilson
and l. beineke (eds) edition, 1979.
J. de Dios and L.G. Willumsen. Modeling Transport. John Wiley and Sons,
Chichester, 2001.
A. Degenne and M. Forse. Introducing Social Networks. Sage Publications,
London, 1999.
A. DeMontis, A. Chessa, S. Caschili, M. Campagna, and G. Deplano. Modeling
commuting systems through a complex network analysis: A study of the
italian islands of sardinia and sicily. Journal of Transport and Land Use, 2
(3–4):39–55, 2010.
21
W.B. Deng, G. Long, L. Wei, and C. Xu. Worldwide marine transportation
network: efficiency and container throughput. Chinese Physics Letters, 26
(11):118901, 2009.
C. Ducruet. Graph simplification and partitioning. FMR Working Pa-
per, 2011. http://halshs.archives-ouvertes.fr/docs/00/57/90/65/
PDF/fmr6_partitionnement.pdf.
C. Ducruet and T. Notteboom. The worldwide maritime network of container
shipping: spatial structure and regional dynamics. Global Networks, 2011.
forthcoming.
C. Ducruet, S.W. Lee, and K.Y.A. Ng. Centrality and vulnerability in liner
shipping networks: revisiting the northeast asian port hierarchy. Maritime
Policy and Management, 37(1):17–36, 2010.
C. Ducruet, D. Ietri, and C. Rozenblat. Cities in worldwide air and sea flows: A
multiple networks analysis. Cybergeo: European Journal of Geography, (528),
2011.
G. Dupuy and V. Stransky. Cities and highway networks in europe. Journal of
Transport Geography, 4(2):107–119, 1996.
N. Eagle, M. Macy, and R. Claxton. Network diversity and economic develop-
ment. Science, 328:1029–1031, 2010.
C. Von Ferber, Y. Holovatch, and V. Palchykov. Scaling in public transport
networks. Condensed Matter Physics, 8:225–234, 2005.
D.K. Fleming and Y. Hayuth. Spatial characteristics of transportation hubs:
centrality and intermediacy. Journal of Transport Geography, 2(1):3–18, 1994.
S. Fortunato. Community detection in graphs. Physics Reports, 486:75–174,
2010.
M.D. Fricker, L. Boddy, T. Nakagaki, and D. Bebber. Understanding Complex
Systems, chapter Adaptive Biological Networks, pages 51–70. Springer, 2009.
M. Fujita, P. Krugman, and A. Venables. The Spatial Economy: Cities, Regions,
and International Trade. Cambridge University Press, Cambridge, 1999.
W.L. Garrison. Connectivity of the interstate highway system. Papers of the
Regional Science Association, 6:121–137, 1960.
W.L. Garrison and D.F. Marble. The structure of transportation networks. U.S.
Army Transportation Command, 1962. Technical Report 62-II.
22
W.L Garrison and D.F. Marble. Transportation Geography: Comments and
Readings, chapter Graph theoretic concepts, pages 58–80. McGraw, New
York, m.e. eliot hurst (ed) edition, 1974.
M.T. Gastner and M.E.J. Newman. The spatial structure of networks. The
European Physical Journal B, 49:247–252, 2004.
M. Van Geenhuizen. Interconnectivity of transport networks: a conceptual and
empirical exploration. Transportation Planning and Technology, 23(3):199–
213, 2000.
J.F. Gleyze. Making allowances for spatial and network effects when assessing
indicators on infrastructure network nodes. Cybergeo: European Journal of
Geography, (370), 2007.
J.F. Gleyze. Multilevel Analysis and Visualization of Geographical Networks,
volume (forthcoming), chapter Topological Clustering Tools on Graphs:
Which Applications for Networks Geography? Springer Geography, 2010.
S.P. Gorman and R. Kulkarni. Spatial small worlds: new geographic patterns
for an information economy. Environment and Planning B, 31(2):273–296,
2004.
S. Goyal and S. Joshi. Network of collaboration in oligopoly. Games and Eco-
nomic Behavior, 43:57–85, 2002.
V. Grimm, U. Berger, F. Bastiansen, S. Eliassen, V. Ginot, J. Giske, J. Goss-
Custard, T. Grand, S.K. Heinz, G. Huse, A. Huth, J.U. Jepsen, C. Jrgensen,
W.M. Mooij, B. Mller, G. Pe’er, C. Piou, S.F. Railsback, A.M. Robbins,
M.M. Robbins, E. Rossmanith, N. Rger, E. Strand, S. Souissi, R.A. Stillman,
R. Vab, U. Visser, and D.L. DeAngelis. A standard protocol for describing
individual-based and agent-based models. Ecological Modelling, 198:115–126,
2006.
T.H. Grubesic, T.C. Matisziw, and M.A. Zook. Global airline networks and
nodal regions. Geojournal, 71(1):53–66, 2008.
M. Guida and F. Maria. Topology of the italian airport network: A scale-free
small-world network with a fractal structure? Chaos, 31(3):527–536, 2007.
R. Guimera, S. Mossa, A. Turtschi, and L.A.N. Amaral. The worldwide air
transportation network: anomalous centrality, community structure, and
cities global roles. Proceedings of the National Academy of Sciences, 2005.
23
J. Gutierrez and P. Urbano. Accessibility in the european union: the impact of
the trans-european road network. Journal of Transport Geography, 4:15–25,
1996.
P. Haggett and R. Chorley. Network Analysis in Geography. Arnold, London,
1972.
D. Helbing, J. Keltsch, and P. Molnr. Modeling the evolution of human trail
systems. Nature, 388:47, 1997.
Y. Hu and D. Zhu. Empirical analysis of the worldwide maritime transportation
network. Physica A, 388(10):2061–2071, 2009.
Instituto Nacional de Estadıstica y Geografıa (INEGI). Conjunto de datos vec-
toriales de la serie topografica y de recursos naturales, escala. 1:1000000.
http://mapserver.inegi.org.mx/data/inf_e1m/?s=geo&c=979, 2010.
E. Jenelius. Network structure and travel patterns: explaining the geographical
disparities of road network vulnerability. Journal of Transport Geography, 17
(3):234–244, 2009.
B. Jiang and X. Yao. Geospatial Analysis and Modelling of Urban Structure and
Dynamics. Springer Science + Business Media, 2010.
F. Jin, C. Wang, X. Li, and J. Wang. China’s regional transport dominance:
Density, proximity, and accessibility. Journal of Geographical Sciences, 20(2):
295–309, 2010.
K. Kansky. The structure of transportation networks: Relationships between
network geography and regional characteristics. Chicago: University of
Chicago, 1963. Research Paper No. 84.
A. Kirman. Complex Economics, Individual and Collective Rationality. Rout-
ledge, the graz schumpeter lectures edition, 2011.
P. Krugman. The Self-Organizing Economy. Blackwell Publisher, Oxford, 1996.
M. Kuby, S. Tierney, T. Roberts, and C. Upchurch. A comparison of geo-
graphic information systems, complex networks, and other models for ana-
lyzing transportation network topologies. NASA Center for AeroSpace Infor-
mation (CASI), 2005. Contractor Report No. 2005-213522.
M. Kurant and P. Thiran. Extraction and analysis of traffic and topologies of
transportation networks. Physical Review E, 74(3):36114, 2006.
L. Lam and R. Pochy. Active-walker models: Growth and form in nonequilib-
rium systems. Computation Simulation, 7:534, 1993.
24
W. De Lannoy and D. Van Oudheusden. The accessibility of nodes in the belgian
road network. Geojournal, 2(1):65–70, 1991.
V. Latora and M. Marchiori. Is the boston subway a small-world network? Phys-
ica A: Statistical Mechanics and its Applications, 314(1–4):109–113, 2002.
L.J. Leblanc. An algorithm for the discrete network design problem. 1975.
D. Levinson and B. Yerra. Self-organization of surface transportation networks.
Transportation Science, 40(2):179–188, 2006.
W. Li and X. Cai. Statistical analysis of airport network of china. Physical
Review E, 69(4):46106, 2004.
G. Mackechnie and W.A. Mackaness. Detection and simplification of road junc-
tions in automated map generalization. Geoinformatica, 3:185–200, 1999.
K. Martens, I. Benenson, and N. Levy. Geospatial Analysis and Modelling of
Urban Structure and Dynamics, chapter The Dilemma of On-Street Parking
Policy: Exploring Cruising for Parking Using an Agent-Based Model, pages
121–138. Springer Science + Business Media, b. jiang and x. yao (eds) edition,
2010.
J. Moody and D. White. Social cohesion and embeddedness: A hierarchical
conception of social groups. American Sociological Review, 68(1):103–127,
2003.
R.L. Morrill. Migration and the growth of urban settlement. Lund Studies in
Geography Series B Human Geography, 26:65–82, 1965.
Y. Murayama. The impact of railways on accessibility in the japanese urban
system. Journal of Transport Geography, 2(2):87–100, 1994.
M.E.J. Newman. The structure and function of complex networks. SIAM Re-
view, 45(2):167–256, 2003.
M.E.J. Newman and M. Girvan. Finding and evaluating community structures
in networks. Physical Review E, 69:026113, 2004.
J.D. Nystuen and M.F. Dacey. A graph theory interpretation of nodal regions.
Papers in Regional Science, 7(1):29–42, 1961.
M.E. O’Kelly. A geographer’s analysis of hub-and-spoke networks. Journal of
Transport Geography, 6(3):171–186, 1998.
R. Parshani, C. Rozenblat, D. Ietri, C. Ducruet C, and S. Havlin. Inter-similarity
between coupled networks. Europhysics Letters, 92:68002, 2010.
25
D. Pumain and C. Tannier. Fractals in urban geography: A theoretical outline
and an empirical example. Cybergeo: European Journal of Geography, (307),
2005.
J.P. Rodrigue, C. Comtois, and B. Slack. Geography of Transport Systems.
Routledge, New York, second edition edition, 2009.
S.E. Schaeffer. Graph clustering. Computer Science Review, 1(1):27–64, 2007.
F. Schweitzer, F. Ebeling, H. Rose, and O. Weiss. Optimization of road networks
using evolutionary strategies. Evolutionary Computation, 41:419–438, 1998.
D.W. Scott, D. Novak, M. Aultman-Hall, and F. Guo. Network robustness
index: a new method for identifying critical links and evaluating the perfor-
mance of transportation networks. Working Paper no. 9, 2005. Centre for
Spatial Analysis.
P. Sen, S. Dasgupta, A. Chatterjee, P.A. Sreeram, G. Mukherjee, and S.S.
Manna. Small-world properties of the indian railway network. Physical Review
E, 67(3):036106, 2003.
S.L. Shaw. Hub structures of major us passenger airlines. Journal of Transport
Geography, 1(1):47–58, 1993.
K.H. Shin and M. Timberlake. World cities in asia: cliques,centrality and con-
nectedness. Urban Studies, 37(12):2257–2285, 2000.
J. Sienkiewicz and J.A. Holyst. Statistical analysis of 22 public transport net-
works in poland. Physical Review E, 72(4):046127, 2005.
E.J. Taaffe and H.L. Gauthier. Geography of Transportation. Prentice-Hall,
New York, 1973.
E.J. Taaffe, R.L. Morrill, and P.R. Gould. Transportation expansion in un-
derdeveloped countries: A comparative analysis. Geographical Review, 53(4):
503–529, 1963.
P. Tissandier. Multilevel Analysis and Visualization of Geographical Networks,
chapter Defining Polycentric Urban Areas through Commuting Cohesion.
Springer Geography, forthcoming, c. rozenblat (ed) edition, 2011.
A. Vespignani. Complex networks: The fragility of interdependency. Nature,
464:984–985, 2010.
T. Vicsek. Complexity: The bigger picture. Nature, 418:131, 2000.
26
J. Wang, F. Jin, H. Mo, and F. Wang. Spatiotemporal evolution of china’s
railway network in the 20th century: An accessibility approach. 2009.
J. Wang, H. Mo, F. Wang, and F. Jin. Exploring the network structure and nodal
centrality of china’s air transport network: A complex network approach.
Journal of Transport Geography, (forthcoming), 2011.
S. Wasserman and K. Faust. Social Network Analysis: Methods and Applica-
tions. Cambridge University Press, Cambridge MA, 1994.
N.M. Waters. Spatial Dynamics, Networks and Modelling, chapter Network and
Nodal Indices. Measures of Complexity and Redundancy: A Review. Edward
Elgar Publishing Limited, New Horizons in Regional Science, a. reggiani and
p. nijkamp (eds) edition, 2006.
D.J. Watts and S.H. Strogatz. Collective dynamics of small-world networks.
Nature, 393:440–442, 1998.
D.B. West. Introduction to Graph Theory. Prentice Hall, Upper Saddle River
NJ, second edition edition, 1996.
N.H.M. Wilson and A. Nuzzolo. Schedule-Based Modeling of Transportation
Networks. Springer, New York, volume 46 edition, 2009.
F. Xie and D. Levinson. Measuring the structure of road networks. Geographical
Analysis, (39):291–307, 2007.
F. Xie and D. Levinson. Modeling the growth of transportation networks: A
comprehensive review. Networks and Spatial Economics, 9(3):291–307, 2009.
X. Xu, J. Hu, and F. Liu. Empirical analysis of the ship-transport network of
china. Chaos, 17(2):023129, 2007.
D. Yamins, S. Rasmussen, and D. Fogel. Growing urban roads. Networks and
Spatial Economics, 3:69–85, 2003.
H. Yang and M.G.H. Bell. Models and algorithms for road network design: A
review and some new developments. Transport Reviews, 18:257–278, 1998.
B. Yerra and D. Levinson. The emergence of hierarchy in transportation net-
works. Annals of Regional Science, 39(3):541–553, 2005.
F. Zaidi. Analysis, Structure and Organization of Complex Networks. Lambert
Academic Publishing, Saarbr’ucken, 2011.
P.C. Zhang, S. Peeta, and T. Friesz. Dynamic game theoretic model of multi-
layer infrastructure networks. Networks and Spatial Economics, 5:147–178,
2005.
27
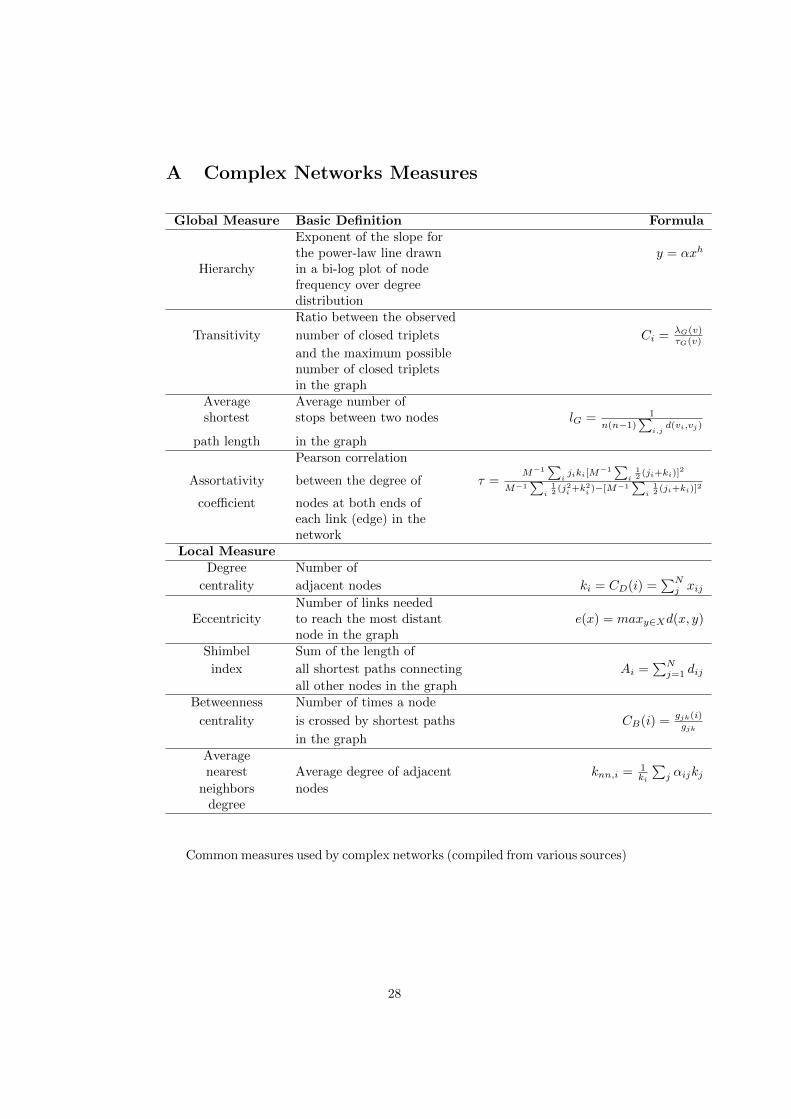
A Complex Networks Measures
Global Measure Basic Definition FormulaExponent of the slope forthe power-law line drawn y = αxh
Hierarchy in a bi-log plot of nodefrequency over degreedistributionRatio between the observed
Transitivity number of closed triplets Ci = λG(v)τG(v)
and the maximum possiblenumber of closed tripletsin the graph
Average Average number ofshortest stops between two nodes lG = 1
n(n−1)∑
i,jd(vi,vj)
path length in the graphPearson correlation
Assortativity between the degree of τ =M−1
∑ijiki[M
−1∑
i
12 (ji+ki)]
2
M−1∑
i
12 (j
2i+k2
i)−[M−1
∑i
12 (ji+ki)]
2
coefficient nodes at both ends ofeach link (edge) in thenetwork
Local MeasureDegree Number of
centrality adjacent nodes ki = CD(i) =∑Nj xij
Number of links neededEccentricity to reach the most distant e(x) = maxy∈Xd(x, y)
node in the graphShimbel Sum of the length of
index all shortest paths connecting Ai =∑Nj=1 dij
all other nodes in the graphBetweenness Number of times a node
centrality is crossed by shortest paths CB(i) =gjk(i)gjk
in the graphAveragenearest Average degree of adjacent knn,i = 1
ki
∑j αijkj
neighbors nodesdegree
Common measures used by complex networks (compiled from various sources)
28