Embed Size (px)
Citation preview

The Pennsylvania State University
The Graduate School
STRUCTURAL-ACOUSTIC OPTIMIZATION OF SHAPED CONCRETE FLOORS IN
BUILDINGS
A Thesis in
Architectural Engineering
by
Jonathan Michael Broyles
© 2020 Jonathan Michael Broyles
Submitted in Partial Fulfillment
of the Requirements
for the Degree of
Master of Science
August 2020

ii
The thesis of Jonathan M. Broyles was reviewed and approved by the following:
Nathan C. Brown
Assistant Professor in Architectural Engineering
Thesis Advisor
Gregory S. Pavlak
Assistant Professor in Architectural Engineering
Micah R. Shepherd
Assistant Research Professor at the Applied Research Laboratory
Ryan L. Solnosky
Associate Teaching Professor in Architectural Engineering
Michelle C. Vigeant
Associate Professor of Acoustics and Architectural Engineering
Sez H. Atamturktur
Harry and Arlene Schell Professor
Head of the Department of Architectural Engineering
iii
ABSTRACT
With advancements in design tools, architects and engineers have developed novel sustainable
solutions that reduce the amount of embodied carbon in structures while maintaining structural integrity.
A concrete structural system, though commonly used, contributes a large portion of a building’s overall
weight, emissions, and embodied carbon. Concrete systems are often overdesigned in terms of material
when using common construction and fabrication practices, resulting in a larger building embodied carbon
footprint than necessary. As advanced construction technology and fabrication methods have emerged
alongside performance-based design methods, new design possibilities can be found through computational
methods such as structural optimization. However, structural optimization procedures often neglect
secondary design objectives such as acoustics during the computational process. Acoustic-based
performance objectives are directly impacted by structural shaping due to the overlap of objectives such as
structural mass, which relates to sustainability. Sound phenomenon such as speech can be easily transmitted
through lighter, thinner elements compared to heavier, stiffer elements. The acoustic characteristic of
transmission loss, which describes the amount of sound transmitted through a structure, is a concern while
shaping concrete slabs, as geometry-based structural optimization may create an unsatisfactory acoustic
environment between building floors. The acoustic metric, sound transmission class (STC), is used to
provide a single number quantity to represent the transmission loss values in one-third octave bands.
This thesis performs an investigation of structural and acoustic behavior for shaped concrete slabs
with curved, non-standard geometry. Nine unique geometric variables were used to define and shape
concrete slabs. For this parametric geometry, structural and acoustic models were developed to
simultaneously evaluate each design as geometric variables changed. The design space was sampled using
Latin Hypercube Sampling (LHS) to determine broad relationships between structural mass and STC.
Structural mass is the objective that relates to embodied carbon; as structural mass decreases, the amount
of embodied carbon the slab has decreases. STC is a standard metric that quantifies acoustic performance
of speech and noise transmission through a structure. The structural model and acoustic model identify slab
designs that meet all the structural and acoustic checks. Following initial design space exploration, multi-
objective optimization (MOO) was used to improve upon the resolution of obtaining the best shaped slabs
in the design space while confirming the general structural-acoustic trends from LHS. Then constrained
optimization was used to find the best performing shaped slab designs at specific acoustic levels.
Constrained optimization further increased the resolution of obtaining the best shaped slabs from MOO.
The benefits of shaped concrete slabs were then compared to conventional layered floor constructions.

iv
TABLE OF CONTENTS
LIST OF FIGURES ................................................................................................................. vi
LIST OF TABLES ................................................................................................................... xii
LIST OF EQUATIONS ........................................................................................................... xiii
LIST OF SYMBOLS ............................................................................................................... xv
ACKNOWLEDGEMENTS ..................................................................................................... xviii
Chapter 1 Introduction ......................................................................................................... 1
1.1 Buildings’ environmental impact in a growing cityscape .......................................... 2 1.2 Acoustical considerations in buildings ....................................................................... 4 1.3 Structural and acoustic design trade-offs ................................................................... 6 1.4 The benefit of computation in building component design ........................................ 7 1.5 Thesis scope and structure ......................................................................................... 7
Chapter 2 Background: Optimizing Concrete Slabs in Building Design ......................... 9
2.1 Sustainable design in building ................................................................................... 9
2.2 Structural design in buildings ..................................................................................... 11 2.3 Acoustic design in buildings ...................................................................................... 13
2.4 Optimization ............................................................................................................... 19 2.4.1 Structural optimization of concrete elements .................................................. 21
2.4.2 Acoustic performance-based design ................................................................ 25
2.5 Multi-objective optimization in design ...................................................................... 27
2.6 Research questions ..................................................................................................... 29
Chapter 3 Research Methodology ....................................................................................... 31
3.1 Shaped slab geometric variables and model parameters ............................................ 32
3.2 The structural model .................................................................................................. 37
3.2.1 Structural strength checks ............................................................................... 40
3.2.2 Structural design checks .................................................................................. 45
3.3 The acoustic model .................................................................................................... 46
3.3.1 Low-resolution acoustic model ....................................................................... 49
3.3.2 Medium-resolution acoustic model ................................................................. 50
3.3.3 Sound transmission class ................................................................................. 50
3.4 Implementing optimization in the model ................................................................... 51
Chapter 4 Investigation into the Design Space of Curved Shaped Slabs ......................... 54
4.1 Initial sampling of the design space ........................................................................... 54
4.2 Assessment of structurally qualified designs ............................................................. 59
4.3 Objective space subdivided by STC........................................................................... 62

v
4.4 The fully qualified objective space ............................................................................ 67
4.5 Relationships between design variables and objectives ............................................. 68
4.6 Discussion .................................................................................................................. 76
Chapter 5 Structural-Acoustic Optimization of Curved Shaped Slabs ........................... 79
5.1 Multi-objective optimization ...................................................................................... 79
5.2 Constrained optimization ........................................................................................... 91
5.3 Comparison to layered floor constructions ................................................................ 94
5.4 Discussion .................................................................................................................. 101
Chapter 6 Conclusions .......................................................................................................... 103
6.1 Summary of research and contributions ..................................................................... 104
6.2 Research limitations ................................................................................................... 105
6.3 Future work ................................................................................................................ 107
6.3.1 Future structural work ..................................................................................... 108
6.3.2 Future acoustic work ....................................................................................... 108
6.3.3 High resolution, testing, and other future work ............................................... 110
6.4 Il Fine ......................................................................................................................... 111
Appendix A Geometrical, Structural, and Acoustical Result Validation ........................ 112
Appendix B Sound Transmission Class Sensitivity Analysis ............................................ 131
Appendix C Angle of Incidence Sensitivity Analysis ......................................................... 133
Bibliography ........................................................................................................................... 139

vi
LIST OF FIGURES
Figure 1-1: Percentage distribution of materials’ embodied energy in
multi-story buildings (Bardhan, 2011) .................................................................. 3
Figure 1-2: Average acoustic complaints in LEED-rated buildings (n=21), to building
database (n=160) (Abbaszadeh et al., 2006) ........................................................ 5
Figure 2-1: Percentage distribution of embodied energy in multi-story
concrete buildings (Huberman et al., 2015). ........................................................ 11
Figure 2-2: Architects and engineers utilize one-way slabs as a common
structural system in building design (Ching, 2015) ............................................. 12
Figure 2-3: Sound-structure interaction .................................................................................. 14
Figure 2-4: Images of a) the Notre Dame Cathedral and b) the Royal Chapel of
the Cathedral of Seville (Giron et al., 2017) ........................................................ 14
Figure 2-5: The frequency dependence of infinite panel transmission loss (Fahy, 1987) ...... 16
Figure 2-6: Flowchart to determine sound transmission class ................................................ 17
Figure 2-7: Explanation of sound transmission class .............................................................. 18
Figure 2-8: Schematic illustration of the fabrication of an elaborate concrete column,
incorporating; a) the concrete mix; b) additional admixtures; c) feedback system;
d) custom design program; and e) digital fabrication (Lloret et al., 2015). ......... 22
Figure 2-9: Illustration of a layered extrusion process with concrete out of ETH
Zurich. (Wangler et al., 2016) .............................................................................. 22
Figure 2-10: Complex geometric concrete structure constructed using digital
fabrication (Wangler et al., 2016) ...................................................................... 23
Figure 2-11: Ribbed slabs were found to have significant less embedded energy with
increase in depth in comparison to traditional concrete slabs (Ismail, 2019) .... 24

vii
Figure 2-12: Images of the Philharmonie de Paris and the Opera Hall of the
Fuzhou Strait Culture and Art Centre (Badino et al., 2020) ............................... 25
Figure 2-13: Dimensions of honeycomb geometry in research conducted by
Ng and Hui (2008) ............................................................................................. 27
Figure 2-14: An example of Pareto curve that explores the best solutions for the
objectives environmental impact and cost (Corriou & Azzaro-Pantel, 2015) .... 28
Figure 3-1: General methodology ........................................................................................... 31
Figure 3-2: Shaped concrete slab geometric variables ............................................................ 33
Figure 3-3: Geometric variable bounds .................................................................................. 34
Figure 3-4: Mirrored slab geometry ........................................................................................ 35
Figure 3-5: Partial floor and elevation plans incorporating a shaped concrete slab ............... 36
Figure 3-6: Structural model methodology ............................................................................. 38
Figure 3-7: Structural analysis of a concrete rib section (adapted from Ismail, 2019) ........... 39
Figure 3-8: Estimation of steel reinforcement methodology .................................................. 41
Figure 3-9: Visualization of a Whitney stress block to find the compression
and tension forces ................................................................................................. 43
Figure 3-10: General locations of the area of steel reinforcement and concrete
area acting in compression (adapted from Ismail, 2019) ..................................... 44
Figure 3-11: Clear cover check ............................................................................................... 46
Figure 3-12: Acoustic methodology ....................................................................................... 47
Figure 3-13: Acoustic analysis of a concrete rib section ........................................................ 48
Figure 3-14: Frequency range and resolution methodology ................................................... 49
Figure 3-15: Three approaches to determine optimal concrete slab geometries ..................... 51
Figure 4-1: Randomization within the shaped concrete slab design space. ............................ 55

viii
Figure 4-2: 3-Dimensional design space scatterplot of three geometric variables: rib
number, top slab thickness, and rib thickness colored by structural mass ........... 55
Figure 4-3: Comparison of the acoustic models in the objective space. ................................. 56
Figure 4-4: Case study designs’ performance for both acoustic models................................. 57
Figure 4-5: Mass law versus analytical transmission model case study slab designs ............. 57
Figure 4-6: Comparison of one-third octave band frequency TL values for the
acoustic models with a 45 degree angle of incidence .......................................... 58
Figure 4-7: The objective space using the analytical transmission model. ............................. 59
Figure 4-8: Comparison of the structurally qualified and unqualified designs
in the objective space ........................................................................................... 60
Figure 4-9: Structurally qualified designs categorized by steel reinforcement sizing. ........... 61
Figure 4-10: Acoustic evaluation of the objective space ........................................................ 62
Figure 4-11: The objective space clustered by coincidence frequency ................................... 63
Figure 4-12: Coincidence frequency case study designs’ objective performance in the
acoustically qualified objective space clustered by coincidence frequency ....... 64
Figure 4-13: Coincidence frequency case study slab designs. ................................................ 65
Figure 4-14: One-third octave center band TL versus frequency for three shaped
concrete slabs ..................................................................................................... 65
Figure 4-15: The fully qualified objective space. ................................................................... 67
Figure 4-16: Pair plot of the geometric variable distribution for the fully qualified
designs obtained by LHS ................................................................................... 69
Figure 4-17: Structural mass versus rib depth for the fully qualified designs
found by LHS ..................................................................................................... 71
Figure 4-18: Slab thickness vs objectives for the fully qualified designs found by LHS ....... 72

ix
Figure 4-19: Relationship between flexural rigidity and STC for the fully qualified
designs found by LHS ........................................................................................ 73
Figure 4-20: Comparison of the top slab’s and rib’s contributions to the flexural rigidity .... 74
Figure 4-21: Cubic relationship between top slab thickness and the top slab’s
contribution to stiffness ...................................................................................... 75
Figure 4-22: Cubic relationship between top slab thickness and flexural rigidity .................. 75
Figure 4-23: The LHS objective space estimate of the Pareto front ....................................... 78
Figure 5-1: Objective space of the MOO results with penalty functions ................................ 80
Figure 5-2: The fully qualified designs found by MOO ......................................................... 81
Figure 5-3: Investigation of the coincidence frequencies for the MOO designs .................... 82
Figure 5-4: Investigation of steel reinforcement sizing for the MOO designs ........................ 83
Figure 5-5: Identification of the best shaped concrete slab designs found by MOO
at each acoustic performance level ...................................................................... 84
Figure 5-6: 3-Dimensional models of the five shaped concrete slabs from Figure 5-5 .......... 84
Figure 5-7: Pair plot of the geometric variable distribution for the best performing
slab designs found by MOO .................................................................................. 85
Figure 5-8: Slab thickness versus objectives for the best performing slab designs
found by MOO. .................................................................................................... 87
Figure 5-9: Comparison of the best performing slab designs found by MOO to the
fully qualified designs found by LHS. ................................................................. 88
Figure 5-10: The best performing slab designs found by MOO clustered by
coincidence frequency for slab thickness versus STC ....................................... 89
Figure 5-11: The best performing slab designs found by MOO clustered by coincidence
frequency for structural mass versus STC and flexural rigidity versus STC ..... 90

x
Figure 5-12: Comparison of the best designs found from constrained optimization
and multi-objective optimization ....................................................................... 91
Figure 5-13: 3-Dimensional models of the best shaped concrete slabs obtained
by constrained optimization ............................................................................... 92
Figure 5-14: Investigation of structural mass of concrete and sound transmission class........ 95
Figure 5-15: Investigation of max depth of floor and sound transmission class ..................... 96
Figure 5-16: Investigation of the floor’s normalized material cost and sound
transmission class ............................................................................................... 97
Figure 5-17: Investigation of floor embodied carbon and sound transmission class .............. 98
Figure App. A-1: 3-dimensional view of case 1 slab .............................................................. 113
Figure App. A-2: Mass law TL validation for case 1 slab using Excel ................................... 114
Figure App. A-3: Mass law STC validation for case 1 slab using Excel ................................ 115
Figure App. A-4: Analytical Transmission Model STC validation for case 1
slab using Excel .......................................................................................... 116
Figure App. A-5: STC validation for case 1 slab using Soundflow ........................................ 116
Figure App. A-6: Shear and moment validation for case 1 slab using Excel .......................... 118
Figure App. A-7: Steel reinforcement ratio validation for case 1 slab using Excel ................ 119
Figure App. A-8: Flexural analysis validation for case 1 slab using Excel ............................. 120
Figure App. A-9: Shear analysis validation for case 1 slab using Excel ................................. 121
Figure App. A-10: 3-dimensional view of case 2 slab ............................................................ 122
Figure App. A-11: Mass law TL validation for case 2 slab using Excel ................................. 123
Figure App. A-12: Mass law STC validation for case 2 slab using Excel .............................. 124
Figure App. A-13: Analytical Transmission Model STC validation for case 2
slab using Excel ........................................................................................ 125
Figure App. A-14: Shear and moment validation for case 2 slab using Excel ........................ 127

xi
Figure App. A-15: Steel reinforcement ratio validation for case 2 slab using Excel .............. 128
Figure App. A-16: Flexural analysis validation for case 2 slab using Excel ........................... 129
Figure App. A-17: Shear analysis validation for case 2 slab using Excel ............................... 130
Figure App. B-1: The objective space obtained from LHS with the incorporation of
100 Hz into STC ......................................................................................... 131
Figure App. B-2: The objective space obtained from MOO with the incorporation of
100 Hz into STC ......................................................................................... 132
Figure App. C-1: Angle of incidence of an incoming sound wave ......................................... 133
Figure App. C-2: The qualified objective space at angle of incidence of 45° using LHS ...... 134
Figure App. C-3: The qualified objective space at angles of incidence of 0°, 30°,
60°, and 85° using LHS .............................................................................. 135
Figure App. C-4: The qualified objective space at a range of angles of incidence
from 0° to 85° using LHS ........................................................................... 136
Figure App. C-5: The qualified objective space at angles of incidence of 0°, 30°,
60°, and 85° using MOO. ............................................................................ 137
Figure App. C-6: The qualified objective space at a range of angles of incidence
from 0° to 85° using MOO .......................................................................... 138

xii
LIST OF TABLES
Table 3-1: Geometric variable information ............................................................................ 34
Table 3-2: Structural parameter and assumption values ......................................................... 36
Table 3-3: Acoustic parameter and assumption values ........................................................... 37
Table 3-4: Steel reinforcement sizes ....................................................................................... 42
Table 4-1: STC comparisons between mass law and analytical transmission model ............. 58
Table 4-2: Relationships between geometric variables and objectives ................................... 70
Table 5-1: Geometric variable tendencies in the Pareto front found by MOO ....................... 86
Table 5-2: Floor constructions with known acoustic performance (Long, 2014) ................... 94
Table 5-3: Summary of the floor types to different design objectives .................................... 99
Table App. A-1: Geometric variable values for validation case 1........................................... 112
Table App. A-2: Geometric variable values for validation case 2........................................... 121

xiii
LIST OF EQUATIONS
Equation 3-1: 𝜌𝑚𝑖𝑛 = 𝑙𝑎𝑟𝑔𝑒𝑟 𝑜𝑓 0.25√𝑓𝑐
′
𝑓𝑦,
1.4
𝑓𝑦 ....................................................................... 40
Equation 3-2: 𝜌𝑚𝑎𝑥 =0.319𝑓𝑐
′
𝑓𝑦 ................................................................................................. 40
Equation 3-3: 𝐴𝑠 ≅ 𝑀𝑢
4𝑑 ........................................................................................................... 43
Equation 3-4: 𝐴𝑠,𝑚𝑖𝑛 = 𝑙𝑎𝑟𝑔𝑒𝑟 𝑜𝑓 0.25√𝑓𝑐
′
𝑓𝑦 𝑏𝑤𝑑,
1.4
𝑓𝑦 𝑏𝑤𝑑 ................................................... 43
Equation 3-5: 𝐴𝑠,𝑚𝑎𝑥 = 0.319 (𝑓𝑐
′
𝑓𝑦) 𝑏𝑑 ................................................................................... 43
Equation 3-6: 𝑎 = 𝐴𝑠𝑓𝑦
0.85𝑓𝑐′𝑏
....................................................................................................... 43
Equation 3-7: 𝐴𝑠 =𝑀𝑢
𝛷𝐹𝑦(𝑑−𝑎
2) ................................................................................................. 43
Equation 3-8: 𝜌 = 𝐴𝑠
𝑏𝑤𝑑............................................................................................................ 43
Equation 3-9: 𝑀𝑛 = 𝐴𝑠𝑓𝑦 (𝑑 −𝑎
2) .......................................................................................... 44
Equation 3-10: 𝑉𝑛 = 𝑉𝑐 + 𝑉𝑠 = 0.167√𝑓𝑐′𝑏𝑤𝑑 +
𝐴𝑣𝑓𝑦𝑑
𝑠 ......................................................... 45
Equation 3-11: 𝑆𝑙𝑎𝑏 𝑇ℎ𝑖𝑐𝑘𝑛𝑒𝑠𝑠 ≥ 𝑙
21 ................................................................................... 45
Equation 3-12: 𝑇𝐿𝑀𝐿 = 20 log(𝑚𝑓) − 42 ............................................................................. 50
Equation 3-13: 𝐷 = 𝐸ℎ0
3
12(1−𝜈2)+
𝐸𝑠𝑡𝑖𝑓𝑓𝑒𝑛𝑒𝑟 𝐼𝑠𝑡𝑖𝑓𝑓𝑒𝑛𝑒𝑟
∆𝑠𝑡𝑖𝑓𝑓𝑒𝑛𝑒𝑟 .................................................................. 50
Equation 3-14: 𝜏(𝜑, 𝜔) = (
2𝜌0𝑐0𝑠𝑖𝑛𝜑
)2
(2𝜌0𝑐0𝑠𝑖𝑛𝜑
+𝜂(𝐷
𝜔)(𝑘0𝑠𝑖𝑛𝜑)4)2+(𝜔𝑚−(
𝐷
𝜔)(𝑘0𝑠𝑖𝑛𝜑)4)2
.................................... 50
Equation 3-15: 𝑇𝐿 = 10 log (1
𝜏) ............................................................................................. 50
Equation 4-1: 𝐷 = 𝐷𝑇𝑜𝑝 𝑆𝑙𝑎𝑏 + 𝐷𝑆𝑡𝑖𝑓𝑓𝑒𝑛𝑒𝑟 = 𝐸ℎ0
3
12(1−𝜈2)+
𝐸𝑠𝑡𝑖𝑓𝑓𝑒𝑛𝑒𝑟 𝐼𝑠𝑡𝑖𝑓𝑓𝑒𝑛𝑒𝑟
∆𝑠𝑡𝑖𝑓𝑓𝑒𝑛𝑒𝑟 ........................ 73
Equation 5-1: 𝐼𝑓 𝑑𝑒𝑠𝑖𝑔𝑛 𝑓𝑎𝑖𝑙𝑒𝑑 𝑠𝑡𝑟𝑢𝑐𝑡𝑢𝑟𝑎𝑙 𝑐ℎ𝑒𝑐𝑘: 𝑃𝑒𝑛𝑎𝑙𝑡𝑦 = (% 𝑒𝑟𝑟𝑜𝑟)3 .................... 81

xiv
Equation 5-2: 𝐼𝑓 𝑑𝑒𝑠𝑖𝑔𝑛 𝑓𝑎𝑖𝑙𝑒𝑑 𝑡𝑜𝑝 𝑠𝑙𝑎𝑏 𝑡ℎ𝑖𝑐𝑘𝑛𝑒𝑠𝑠 𝑐ℎ𝑒𝑐𝑘: 𝑃𝑒𝑛𝑎𝑙𝑡𝑦 = (1
𝑡ℎ𝑖𝑐𝑘𝑛𝑒𝑠𝑠)
3 ....... 81
Equation 5-3: 𝐼𝑓 𝑑𝑒𝑠𝑖𝑔𝑛 𝑓𝑎𝑖𝑙𝑒𝑑 𝑓𝑙𝑎𝑛𝑔𝑒 𝑤𝑖𝑑𝑡ℎ 𝑐ℎ𝑒𝑐𝑘: 𝑃𝑒𝑛𝑎𝑙𝑡𝑦 = (𝑡ℎ𝑖𝑐𝑘𝑛𝑒𝑠𝑠𝑟𝑒𝑞 −
𝑡ℎ𝑖𝑐𝑘𝑛𝑒𝑠𝑠𝑝𝑟𝑜𝑣)3 .............................................................................................................. 81
Equation 5-4: 𝐼𝑓 𝑑𝑒𝑠𝑖𝑔𝑛 𝑓𝑎𝑖𝑙𝑒𝑑 𝑐𝑙𝑒𝑎𝑟 𝑐𝑜𝑣𝑒𝑟 𝑐ℎ𝑒𝑐𝑘: 𝑃𝑒𝑛𝑎𝑙𝑡𝑦 = (𝐹𝑎𝑖𝑙𝑒𝑑 𝐶𝑟𝑜𝑠𝑠 𝑆𝑒𝑐𝑡𝑖𝑜𝑛𝑠 ∗1000) ............................................................................................................................... 81

xv
LIST OF SYMBOLS
𝑎
ACI
𝐴𝑠
𝐴𝑠,𝑚𝑎𝑥
𝐴𝑠,𝑚𝑖𝑛
ASCE
𝐴𝑣
𝑏
𝑏𝑤
𝑐0
COBYLA
𝑑
𝐷
𝐷𝑆𝑡𝑖𝑓𝑓𝑒𝑛𝑒𝑟
𝐷𝑇𝑜𝑝 𝑆𝑙𝑎𝑏
𝐸
𝐸𝑠𝑡𝑖𝑓𝑓𝑒𝑛𝑒𝑟
𝑓
𝑓𝑐′
𝑓𝑦
ℎ0
𝐼𝑠𝑡𝑖𝑓𝑓𝑒𝑛𝑒𝑟
Depth of equivalent rectangular stress block
American Concrete Institute
Provided area of non-prestressed longitudinal reinforcement
Maximum allowable area of non-prestressed longitudinal reinforcement
Minimum allowable area of non-prestressed longitudinal reinforcement
American Society of Civil Engineers
Provided area of shear reinforcement
Width of compression face of concrete member
Web width or diameter of circular concrete section
The speed of sound of air
Constrained optimization by linear approximation
Distance from extreme compression fiber to centroid of longitudinal reinforcement
Flexural rigidity
Flexural rigidity of the rib stiffener section
Flexural rigidity of the top slab section
Modulus of elasticity of top slab section
Modulus of elasticity of rib stiffener section
Frequency
Compressive strength of concrete
Yield strength for non-prestressed reinforcement
Thickness of top slab section
Moment of Inertia of rib stiffener section

xvi
IBC
𝑘0
𝑙
LHS
𝑚
𝑀𝑛
𝑀𝑢
MOO
NSGA-II
𝑠
STC
International Building Code
Wavenumber
Length of slab section
Latin Hypercube Sampling
Mass density of structure
Nominal flexural strength of cross section
Factored flexural strength of cross section
Multi-objective optimization
Non-dominated sorting genetic algorithm II
Center-to-center spacing of shear reinforcement
Sound transmission class
TL
𝑇𝐿𝑀𝐿
𝑉𝑐
𝑉𝑛
𝑉𝑠
𝛽
∆𝑠𝑡𝑖𝑓𝑓𝑒𝑛𝑒𝑟
𝜂
𝜈
𝜌
𝜌𝑚𝑎𝑥
𝜌𝑚𝑖𝑛
𝜌0
Transmission loss calculated from the analytical transmission model
Transmission loss calculated from mass law
Nominal shear strength provided by concrete of cross section
Nominal shear strength of cross section
Nominal shear strength provided by steel of cross section
Ratio of depth of rectangular stress block to depth of neutral axis
Spacing of rib stiffener sections
Damping coefficient of concrete
Poisson’s ratio of concrete
Provided longitudinal steel reinforcement ratio
Maximum allowable longitudinal steel reinforcement ratio
Minimum allowable longitudinal steel reinforcement ratio
The density of air

xvii
𝜏
𝜑
𝜔
Transmission coefficient
Angle of sound incidence
Angular frequency

xviii
ACKNOWLEDGEMENTS
First, and most importantly, I want to praise God for; guiding my path to the Pennsylvania State
University, guiding my decision to obtain a M.S. in Architectural Engineering with a concentration in
Structural Building Systems and a minor in Acoustic, leading me towards the community I have developed
here, and providing opportunities that have come along the way. I am very blessed to be able to conduct
research in two areas that I am passionate in: structural engineering and acoustics. For many years I did not
know what avenue the best would be to pursue this. However, Architectural Engineering is the perfect
avenue to combine my interests.
I would like to thank my advisor Dr. Nathan Brown for encouraging me to pursue my interests and
for motivating me to conduct exciting and innovating research. I would never have known about this
exciting research niche if we had not met on a snowy day in Boston. I would have never been exposed to
parametric design, the potential opportunities that parametric design create, and the application of design
space exploration techniques. I have learned so much, and it has only been one full year! I am excited to
see where our research interests take us as we continue down the path of structural and acoustic based
performance design. I am confident that the best is yet to come!
I also would like to thank Dr. Michelle Vigeant. Michelle, I would not have gone to Penn State
without your exciting research agenda, charming personality, and dedication to your research team. I am
grateful for the relationship I have with you and all SPRAL members. Despite the hardships I faced during
my first year in graduate school, you continued to encourage me and motivate me to be an excellent
researcher. I learned a lot from my acoustic research project on the “Investigation of Mach-Cutoff
Signatures Perceived Annoyance Compared to Common Transportation Sounds.” The opportunity quickly
sharpened my research skills and opened the door for great research opportunities. In addition, I appreciate
all of your help with my current research project. You continue to help sharpen me and motivate me as a
researcher and I am fortunate to be able to continue to learn from you.
In addition, I would like to thank Dr. Micah Shepherd. In our short time working together, I have
been pushed to dig deeper into my research while learning important structural-acoustic trade-offs. You
have sharpened my critical thinking skills, which is vital for any graduate student. I appreciate the time you
have taken to meet with me over the past several months as this research has continued to take shape. I am
excited as we continue to explore structural-acoustic trade-offs together.
There are several other faculty and staff at the Pennsylvania State University I need to thank as
well. Thank you, Dr. Ryan Solnosky and Dr. Gregory Pavlak, for your input and commitment to improving
this research. Thank you, Architectural Engineering structural faculty; Dr. Thomas Boothby, Dr. Linda

xix
Hanagan, Dr. Ali Memari, and Dr. Aly Said, for your love of teaching and your commitment to the students.
Thank you, Judy Heltman, and Jaymes Dunlap for your answers to all of my administrative questions and
concerns. Thank you, Scott Landes, for all of your help with my many technical troubles. Thank you,
Acoustic faculty and staff; Dr. Vic Sparrow, Dr. Daniel Russell, Mrs. Melissa Wandrisco, and Ms. Erin
Ammerman. Your support and encouragement are invaluable to me.
I would also like to thank Dr. Jeffrey Laman and Mr. Moses Ling for giving me opportunities as a
grader and teaching assistant. The experiences I obtained from those opportunities helped develop into an
enthusiasm for teaching and helping students learn.
A special thank you to Dr. Sez Atamturktur. You instilled a diligent work ethic in me ever since
we met at Clemson University. You were also the first person to expose me to engaging academic research,
which has since blossomed into a passion of mine. Thank you for continuing to be an excellent example of
the leader to all Architectural Engineering students.
I am also blessed by the community that surrounds me at Penn State. To my friends at Penn State
Christian Grads, the Architectural Engineering department, the Graduate Program in Acoustics, at Park
Forest Baptist Church, and beyond; I have cherished the past two years together. I would like to give special
recognition to several people, as I would not have been able to succeed without their help: Josh Kerr, Alex
Verseput, Jason Sammut, Jake Sorber, Keagan Downey, Lauren Trepanier, Zane Rusk, Josh Cetnar,
Mehrshad Amini, and Jenny Miller. To Lauren, your patience and support throughout these past couple
months has been truly a blessing to me. I would also like to thank Isabelle Hens and Laura Hinkle for their
help and support for this research.
Lastly, I would not be here without the love and support of my family. To my parents, I am blessed
to call you mom and dad and I feel your support no matter where I am. You have both motivated to become
the hard worker that I am today. You have listened with open ears whenever I need to talk or work through
situations. To my sister, Rachel, thank you for your support and silliness no matter how stressed out I am.
You do not fail to put a smile on my face! To my grandparents, you have continuously cared and encouraged
me throughout my collegiate journey. I cannot thank you enough for your support.
I cannot express in words how much you all mean to me. I am blessed to be on this journey with you.

Chapter 1
Introduction
In an urbanizing world, architects and engineers are tasked with discovering sustainable building
solutions that incorporate efficient energy systems, structural integrity, low building cost, and other goals.
In a rapidly growing world in which a predicted increase of 2.5 billion people will live in urbanized
locations by 2050 (UN, 2018), buildings have a major impact on the daily lives of people living in high
density locations, as it is estimated that people spend upwards of 90% of their lives in buildings (Aries et
al., 2010). These statistics emphasize the necessity that buildings have pleasing personal and professional
environments to its tenants. Yet buildings also have a major impact on the global environment.
It is estimated that urban areas consume over 70% of global energy and account for upwards of
76% of fossil fuel CO2 emissions, indicating the significance of buildings in the global environmental
makeup (Seto & Dhakal, 2014). With current trends and population forecasts, the principles of sustainability
demand that the design of future buildings consider environmental impact. There are many different
dimensions of sustainability such as building operations like efficient mechanical systems, use of daylight,
and utilization of renewable energy sources (Balta et al., 2010). Although much of the focus of sustainable
building design has been on operational energy, there is a growing body of research aimed at limiting the
embodied energy in buildings (Cabeza et al., 2013).
In particular, reducing the embodied energy of structural systems could meaningfully contribute to
the overall sustainability of buildings. Among building materials, structural concrete systems can have a
significant impact on the building’s overall weight, emissions, and energy as concrete slabs are one of the
largest contributors to a building’s embodied energy, specifically embodied carbon energy (Lenzen &
Treloar, 2002). Concrete floor systems have been a popular design solution for tall building design since
the 1960’s due to their bulk and stiffness, lack of floor deflections and vibrations, and ease of construction.
It is predicted that concrete design will continue to be utilized as design solutions evolve and building
construction technology advances (Ali & Sun Moon, 2007). Therefore, careful reduction of structural
system material, such as concrete, while maintaining structural integrity is an intriguing potential
sustainable design solution.
Yet at the same time, reducing the material in concrete structural systems can have negative
consequences for secondary design considerations such as thermal conductivity and acoustics. The
acoustics within a space may be impacted by how the structural system is optimized for sustainability, since

2
additional mass broadly increases acoustic performance. Sound phenomena such as speech can be
transmitted easily through lighter, thinner walls compared to heavier, thicker walls. The structural-acoustic
concept of transmission is a concern while reducing concrete mass as less material may cause a decrease in
the amount of sound transmission that a structure can provide, resulting in an unsatisfactory acoustical
environment for an adjacent space. Since the transmission loss through a partition can cause poor acoustics
in a building, building codes began to incorporate an acoustic metric to obtain a minimum satisfactory
acoustic environment. Current building codes cite specific sound transmission requirements for various
types of building structures (International Building Council, 2018).
To account for the different facets of a structural system, researchers must understand the
interdisciplinary relationships that the structure has within the broader scope of the building. Research that
uncovers the nature of interactions between primary and secondary design considerations can provide a
more holistic understanding of a structural system’s behavior.
1.1 Buildings’ environmental impact in a growing cityscape
Buildings have extensive energy demands throughout their life cycle due to occupancy and usage.
Building operational energy is typically defined by the amount of energy required to perform the daily tasks
for operations such as mechanical heating and cooling and electrical demands. Extensive research has been
performed that recommend methods to reduce the operational energy in buildings (Shoubi et al., 2014;
May-Ostendorp et al., 2011). Yet operational energy in buildings is not the only energy associated within
a building’s life. The embodied energy is the second energy type associated with a building. Embodied
energy is referred to as the energy stored within materials and used in the construction of the building.
Structural systems are responsible for a large portion of the embodied energy due to the amount of material
required to resist all loads, as well as the type of material used, and the energy demanding fabrication and
construction processes. Specifically, in a multistory concrete building frame, cement and steel account for
nearly 90% of the building’s total embodied energy as indicated in Figure 1-1 (Bardhan, 2011). Embodied
energy in materials used in the construction of a building’s structural system has increased significance in
a building’s life cycle as better energy performance is required of the building (Cabeza et al., 2013).

3
Figure 1-1: Percentage distribution of materials’ embodied energy in multi-story buildings (Bardhan, 2011).
According to Miller et al. (2015), 23 trillion kilograms of concrete is consumed annually in building
design. The authors also found that concrete contributed to 56% of the building’s mass. A further
investigation shows that the cement industry alone contributes approximately 5% of global anthropogenic
CO2 emissions; a major environmental factor (Flower & Sanjayan, 2007). Engineers and designers have a
unique responsibility as they can specify the production type and the material properties for structural
concrete systems (Ali, 2001). As such, designers can contribute to overall building sustainability by both
specifying greener materials and using less material through design. A reduction of concrete material
through either means can improve the health of the building and environment.
In a sustainable building study conducted by Ajayi et al. (2016), it was found that the more
sustainable a building is, the less its tendency for having negative health effects on building operatives,
occupants, and the global environment. However, the researchers did not elaborate on the occupant health
effects. In another study, sustainable solutions in office building air quality and thermal comfort have been
shown to improve occupancy satisfaction (Abbaszadeh et al., 2006). These studies suggest that
sustainability should be implemented in building design for the benefit of the global economy and the
building’s tenants.
In addition to the benefits mentioned, optimized structural concrete systems can reduce the vertical
height of buildings as efficiently designed concrete slabs can have a reduced thickness. Building story
height is of architectural interest because even if the slab on the floor is reduced by a few inches, this will
result in a reduction of several feet in building height for a tall building. The reduction also contributes to

4
sustainable solutions in building by reducing the amount of material needed. However, as sustainable
solutions reduce the seemingly critical considerations in building design, these solutions potentially neglect
important secondary building design considerations.
1.2 Acoustical considerations in buildings
While the immediate solution may appear to be to reduce the slab’s material in tall buildings, this
may impact secondary design considerations, such as acoustics. In design of large buildings, an acoustician
may assist in the building design such as auditoria or theater rooms. Yet for the acoustic design of other
rooms, many acoustic recommendations are not implemented in early building design. The early design
phase mainly focuses on the primary design disciplines and the overall building’s function. Outside of
auditoria, acoustics are often considered well after the conceptual design phase. Furthermore, acoustic
solutions may seem unnecessary during building fabrication and only implemented if occupants have
acoustic complaints. Acoustics is often a design consideration in buildings that is overlooked, which can
have a negative impact on building tenant health (Rasmussen, 2010).
Acoustics is critical to the design of buildings as it directly impacts whom buildings are designed
for: the occupants. If the acoustic environment is satisfactory, then occupants will be able to enjoy
inhabiting the building (Kamaruzzaman et al., 2018). But if the acoustic environment is not satisfactory,
then residents will find occupancy unpleasant and demand solutions to quiet certain rooms or areas in a
building. Abbaszadeh et al. (2006) found that the acoustic complaints generally increased in LEED certified
office buildings as seen in Figure 1-2. Despite the difference of sample size between the building types,
LEED buildings have higher complaint percentages, especially for acoustic problems involving speech.
The increase in speech complaints suggests that despite the effectiveness of LEED buildings to reduce
building energy and provide efficient design solutions to primary design concerns, that secondary design
concerns, like acoustics, should also be considered. In a different study, Field (2008) determined that
sustainable goals such as recycled material, daylighting, and natural ventilation have negative consequences
on the acoustic environment. Due to the importance of building sustainability, acoustics is often not
considered in the design phase, which leads to acoustic complaints post construction.

5
Figure 1-2: Average acoustic complaints in LEED-rated buildings (n=21), to building database (n=160)
(Abbaszadeh et al., 2006).
Acoustic solutions can be incorporated at the component scale. Sound masking and attaching
absorptive fabric on room surfaces are easy and relatively cheap solutions to improving the acoustic
environment in a building (Field, 2008). For example, implementing sound masking in the construction of
a new room is an inexpensive solution to improve the acoustic environment of the room (Moeller, 2014).
However, if acoustic solutions are applied after construction, the cost to implement the acoustic solutions
increases. Acoustic consideration post construction also limits retrofitting solutions. If acoustic design is
considered at the forefront, then the room’s structure could be designed to account for the acoustic
environment.
Often, the tenants must live or work in a less than ideal acoustic environment (Moeller, 2014).
Occupancy health is a major concern in a poor acoustic environment. The noise level and speech privacy
between rooms are the two primary acoustical concerns in buildings. Poor acoustics can lead to annoyance,
sleep disturbance, psychological stress, and mental health problems (Kamaruzzaman et al., 2018).
Therefore, the acoustic environment must be considered in the design of the building, often in accordance
with other design disciplines. Furthermore, understanding how acoustic concerns interact with early

6
decisions such as the selection of the structural system may yield broad benefits regarding building
sustainability and occupant health.
1.3 Structural and acoustic design trade-offs
There are several building disciplines that impact the acoustic environment such as mechanical
design, structural design, and lighting design (Moeller, 2014). Structural design is unique in that it is closely
integrated in the architectural design of the building while impacting the acoustic environment. The design
and construction of the structural system can significantly reduce the amount of sound in an acoustic
environment or the sound that travels through a structure. The interaction that a structure has on an incident
sound wave causes the sound wave to reflect, to be absorbed, or to be transmitted through a structure. The
transmission of sound is a significant aspect of this problem because sound generated in one acoustic
environment can be audible in another acoustic environment.
Transmission loss, or the amount of sound energy that is transmitted through the structure, is one
of the acoustic interactions incorporated into building design codes. Structural-acoustic interactions such
as transmission loss depend on the frequency of the sound source, therefore complicating the creation of a
total acoustic performance metric as a single number. However, a sound metric called Sound Transmission
Class (STC) is widely implemented for structures in building design codes because it characterizes the
transmission loss values observed in one-third octave center frequencies in the frequency range of speech.
However, structural-acoustic interaction was not originally investigated for applications of structural
systems in buildings.
Early research on sound-structure interaction was conducted by mechanical and aeronautical
engineering driven problems to reduce the amount of transmission through a structure. Plates, shells, and
beams were analyzed to investigate structural-acoustic waves. The analyzes were typically done using a
finite element model with definitive support conditions (Marburg et al., 2016). Applications for these
models were primarily for automobiles and airplanes, often to refine the design near the middle of the
design process. However, incorporation of structural-acoustic trade-offs may need to be incorporated earlier
in the design phase to ensure optimal structural and acoustic design.

7
1.4 The benefit of computation in building component design
As previously mentioned, quality design solutions must be found at the component scale to
accommodate for increased urbanization, environmental concerns, building utilization, and the well-being
of the occupants. This thesis uses several design space exploration approaches to generate and consider
multiple permutations of design solutions, based on geometric variables and building performance
objectives. Architects and engineers are increasingly using such techniques for early design, often creating
a catalogue of potential designs for selection. In some cases, however, it makes sense to automatically
move through a design space to find the best potential design solutions, which is referred to as optimization.
According to Goldberg (1989), design optimization methods such as genetic algorithms have
applications in many engineering disciplines. Optimization has been utilized for mechanical and aerospace
engineering for decades, but applications to civil structures has only been realized recently. The slower
incorporation of optimization design in civil structures is due to technological advancements in building
design programs for generating and evaluating designs. Computer simulation coupled with optimization
frameworks can pursue simultaneous design goals, prioritize them, and identify trade-offs in objectives.
The simultaneous pursuit of achieving design goals and identifying trade-offs is a variation of
optimization in the design industry. Optimization is a mathematical technique for minimizing an objective
function while subject to a particular set of variable bounds and constraints (Rardin, 2016). Yet, most
architects and engineers are evaluating designs based on several design objectives. To solve these complex
problems, multi-objective optimization (MOO) can be a solution for designers to find the trade-offs between
various objectives. Brown (2016) states that MOO could be used to improve current theoretical workflows
and generate high-performance designs by addressing a variety of objectives simultaneously.
Design space exploration techniques such as MOO, analyze the multiple designs’ objective
performance which enables architects and designers to create innovative solutions based on computational
results (Turrin et al., 2011). Through design space exploration, this thesis will identify novel building
solutions to solve complex design problems that were not previously discovered.
1.5 Thesis scope and structure
This thesis utilizes a multi-objective framework to investigate relationships between structural and
acoustic performance in shaped slabs and determine optimal structural designs for different acoustic
criteria. It first explores a structural-acoustic design space for curved one-way slabs using Latin Hypercube

8
Sampling (LHS). Each potential design is evaluated structurally under residential building loads using
American Concrete Institute (ACI) and American Society of Civil Engineers (ASCE) design codes. It is
then assigned an STC rating based on the American Society for Testing and Materials (ASTM) E413
standard using an analytical model for transmission loss. After an initial analysis of trends in the design
space and identification of non-dominated solutions, a multi-objective optimization algorithm (NSGA-II)
is used to find a higher resolution approximation of the Pareto front. The objective functions are to minimize
material mass (structural mass) and maximize acoustic performance (sound transmission class).
Constrained optimization is then conducted for specific STC ratings, which establishes the best designs on
the Pareto front for certain performance requirements. Finally, the best concrete slab designs are compared
to conventional floor constructions with good acoustic performance. The overall goals are to estimate how
much material can be saved while ensuring an adequate acoustic environment, and to understand the main
relationships between geometry, structural form, and acoustic performance objectives.
Following this introduction, the Chapter 2 of this thesis summarizes existing literature related to
embodied energy (specifically embodied carbon energy), sustainable concrete solutions, room acoustics,
and optimization applied to structural and acoustic design in buildings. It identifies research gaps and
formulates research questions. Chapter 3 presents the methodology for developing the geometric, structural,
and acoustic models, and describes the procedure for implementing design space exploration and
optimization. Chapter 4 provides the results of the initial design space exploration by identifying designs
that qualify based on structural and acoustic checks and noting geometric patterns that lead to high-
performance designs. Chapter 5 details the results of the multi-objective optimization and constrained
optimization, presenting an overall Pareto front approximation for this design problem. It also compares
the results of floor shaping to layered floor constructions with known good acoustics. Finally, Chapter 6
summarizes the contributions, limitations, and future work, noting opportunities for greater understanding
of the structural-acoustic behavior of shaped concrete slabs.

Chapter 2
Background: Optimizing Concrete Slabs in Building Design
This chapter introduces and discusses the major topics that are involved in this research including
embodied carbon, sustainable concrete structural systems, room acoustic design, optimization and design
space exploration, and the incorporation of optimization algorithms in a design space. The chapter
elaborates by detailing existing research at the intersection of building sustainability, structural building
design, acoustic building design, and computational optimization techniques. Research questions that
address holes in these research fields closes the chapter. Bolded terminology includes key terms used
throughout this chapter, in addition to other common terms provided for reference.
2.1 Sustainable design in buildings
To provide sustainable solutions to a growing environmental crisis, designers have increasingly
considered embodied energy, life cycle emissions, and other environmental concerns in building design.
According to De Wolf et al. (2017), the building industry is responsible for 40% of global energy
consumption and 30% of anthropogenic greenhouse gas emissions. As new infrastructure is designed, there
must be increased awareness of the environmental impact that the building has in order to reduce global
energy consumption. Operational energy in buildings has been investigated in research to investigate green
HVAC systems solutions and ways to utilize renewable resources (Balta et al., 2010; May-Ostendorp et al.,
2011; Shoubi et al., 2014;). Another facet of building energy is the building’s embodied energy.
Embodied energy, in a general sense, encompasses the direct energy obtained to support the
process under consideration in addition to the indirect energy embodied in inputs to the process (Fay et al.,
2010). Embodied energy in a building typically refers to the total amount of greenhouse gas energy exerted
in a process such as the fabrication of a building or the embodied energy of an input such as the embodied
energy in a structural system. A specific classification of embodied energy is embodied carbon energy (or
embodied carbon), which is defined as the amount of embodied CO2 energy stored within a material,
structural system, or building (De Wolf et al., 2017). The embodied carbon of structural systems in a multi-
story building is of interest as structural systems require more material and energy, specifically embodied
CO2 energy, for fabrication and construction (Foraboschi et al., 2014). The embodied carbon of a structure

10
is calculated by the structural material quantity (SMQ) multiplied by a material coefficient found in various
databases, such as the Inventory of Carbon and Energy (ICE) database (Jones et al., 2011). Embodied
carbon relates to structural optimization objective functions such as the amount of the material, stiffness,
or strain energy (Brown, 2016). This research investigates the structure’s embodied carbon energy.
Lower embodied carbon energy leads to more sustainable buildings, which have also been found
to have less negative local and global impacts on building operation and residents (Abbaszadeh et al., 2006;
Ajayi et al., 2016). As a result of their potential benefits, significant ongoing research is being conducted
to find ways to reduce building energy through innovative sustainable design solutions. Embodied carbon
energy correlates to the fabrication and construction of the building, which has led to recent research in a
building’s structural system. Since structural design is a primary building consideration, sustainable designs
are brought to the forefront of the design process.
Considerations of embodied carbon in structural materials become especially important for tall
buildings, since there is a structural premium paid for building taller structures and tall buildings contain
significant structural mass in both gravity and lateral systems. Technology growth in the construction
industry has enabled architects and engineers to develop novel solutions to design tall buildings.
Advancement in construction technology has enabled innovative design solutions for common structural
systems, such as concrete systems. In concrete alone, new concrete mixes have led to the development of
lightweight concrete, high strength concrete, and high-performance concrete. These advances have allowed
concrete to be a suitable solution in the design of skyscrapers and other unique structures. It is predicted
that concrete and composite structural systems may become the choice in the design of future cityscapes
due to the flexibility and formability properties (Ali, 2001).
Since concrete structural systems are common in the building industry, researchers have explored
the environmental impact that these systems have. In a multistory concrete building frame, cement and steel
account for nearly 90% of the building’s total embodied energy, with at least 50% of the embodied energy
within horizontally spanning elements as indicated in Figure 2-1 (Huberman et al., 2015). Horizontal
structural concrete systems are common in the building industry, specifically in multi-story building design.
Structures like concrete slabs are straightforward in the structural design and analysis yet have an excessive
amount of embodied energy.

11
Figure 2-1: Percentage distribution of embodied energy in multi-story concrete buildings (Huberman et
al., 2015).
Bending forces acting on the concrete slab are often what control the design for these members.
However, the concrete slab does not experience the same amount of bending force across the entire length
of the element. Similarly, the shear forces experienced on the concrete slab differ across the member. Since
the greatest structural forces are not experienced uniformly, the slab’s structural material could be reduced
without sacrificing structural integrity. Traditional construction practices have limited the amount of
structural material reduction, therefore resulting in excessive embodied carbon energy. Yet with advances
in construction technology and design tools, there is potential to reduce the amount of embodied carbon
energy in traditional concrete systems by shaping the concrete slabs according to the maximum structural
forces.
2.2 Structural design in buildings
Concrete slabs have been utilized in the design of tall building structures for over a century. One-
way slabs are widely utilized in the design of a building’s structural system as shown in Figure 2-2 (Ching,
2015). They are effective structural systems in providing uniform load paths from floor to floor in a building
and have well established structural behavior. While most concrete slabs are poured on-site during the
construction process, concrete slabs can be prefabricated and transported to the construction site for use.
Thus, an optimized slab configuration could be produced repeatedly in a clean environment, and then
applied in many building sites.

12
Figure 2-2: Architects and engineers utilize one-way slabs as a common structural system in building design
(Ching, 2015).
One-way concrete slabs are commonly banded beams, as shown in Figure 2-2, or pan joist systems.
In a pan joist one-way system, sheet metal pans and plywood deck form deep rectilinear ribs. Pan joist
systems are often characterized by high strength, but large floor depths. Structural code and traditional
construction methods have limited wide use of pan joist systems in building applications outside of parking
garages.
Other concrete systems include two-way concrete slabs. Unlike one-way slab systems, two-way
slabs are supported in both directions with a maximum short-to-long span ratio of 2. There are many specific
two-way slab systems including flat plate systems, flat slab systems, slab-beam systems, and two-way
ribbed or waffle slab systems. Two-way slab systems are more geometrically elaborate, with increasing
structural analysis complexity. As a result, the structural performance of these systems is commonly
assessed with computer-aided design programs.
To regulate the structural integrity of concrete systems, a design code was established. The
American Concrete Institute (ACI) structural concrete code, ACI-318, discusses the structural strength and
design requirements to accurately design concrete structures (ACI Committee 318 & American Concrete
Institute, 2019). ACI-318 also details the design of structural concrete floors. The equations in ACI-318 are
often based on extensive testing of conventional concrete structures.
Conventional concrete structures have been designed as continuous structures. Researchers and
designers did not begin to widely consider non-continuous structures until the 20th century. Concrete

13
structures were suggested to be segmented based on the strength demands along the concrete structure
(Timoshenko, 1953). Research into how structural load demands can lead to shaping of structural systems
began to grow. This research led to structural optimization based on the structural capacity requirements
(Muttoni, 2011). Recently, structural optimization has been investigated for maintaining structural integrity
while reducing the embodied energy of the structure. Reducing the amount of embodied energy within a
structure is paramount, especially due to the large amount of embodied energy within horizontal spanning
structures, as discussed in Section 2.1. Because of the potential for significant embodied energy reduction,
horizontal one-way concrete slabs are investigated in this thesis.
One method of shaping one-way slabs is a flat slab integrated with shaped joists. This system
provides designers with a unique solution to reduce the top slab thickness of a traditional flat slab system
while designing shaped joists that provide additional structural material along the length of the slab for
where the structural forces are greatest. A traditional flat slab, though easy to construct, has the most amount
of excessive structural material. An integrated flat slab with shaped joists provides a great opportunity to
reduce the amount of structural material, resulting in a reduction of embodied carbon energy.
With the reduction of concrete material in a concrete structural system, other building design
considerations are affected. The total cost of the building is reduced because of less material, the mass of
the building is reduced, and the vertical height of the building is reduced. Despite these advantages, a
disadvantage that has seldom been addressed to this solution is how this system impacts the acoustical
environment.
2.3 Acoustic design in buildings
When sound impedes on a structure, there are three primary structural-acoustic interactions that
occur. When an incident sound wave hits a structure, a percentage of the incident sound wave is reflected
off of the structure and back into the acoustic environment where the incident sound wave originated from,
absorbed by the structure, or transmitted through the structure and into a different acoustic environment.
Figure 2-3 provides a visualization of the main structural-acoustic interactions.

14
Figure 2-3: Sound-structure interaction.
The reflection and absorption of sound are the two interactions investigated in room acoustic
design. Room acoustics is defined as the acoustic phenomenon occurring within one room. especially in
churches, concert halls, and other spaces suited for live performances. Designers of historical cathedrals
had an interesting design challenge: they had to design a large room space that had good acoustics for both
speech and music which involved the understanding of both reflected sound and absorbed sound as seen in
Figure 2-4. Designers resolved to designing elaborate worship spaces with various room geometries (Giron
et al., 2017).
Figure 2-4: Images of (a) the Notre Dame Cathedral and (b) the Royal Chapel of the Cathedral of Seville
(Giron et al., 2017).
It was not until the past few centuries that a scientific, quantitative understanding of room acoustics
was developed. In 1895 Wallace Sabine conducted acoustical measurements in order to improve speech
audibility in a large lecture hall at Harvard University (Sekuler, 2002). Through these experiments, Sabine
explored the acoustical phenomenon of reverberation which was based on the amount of sound reflection

15
and absorption within a room. The understanding of reverberation led to the creation of the room acoustic
metric of reverberation time (Sekuler, 2002). Sabine’s investigation into acoustic interactions sparked the
field of room acoustics.
Room acoustics is the primary consideration in the design of churches and auditoria but is not
consistently considered in typical building environments such as residential and office buildings (Akama
et al., 2010; Barron, 2010). This is because acoustic metrics such as reverberation time are not critical
design variables in the design of most building spaces. However, the amount of sound power transmitted
between rooms is of importance due to the impact it has on the acoustic environment in adjacent spaces.
Unlike reflection and absorption, the transmission of sound is beyond the limit of one room:
therefore, sound transmission impacts building acoustics. Building acoustics is the investigation of acoustic
phenomenon between multiple rooms, specifically in relation to the transmission of sound. In the lens of
building acoustics, transmission through the structure is a major concern because the transmitted noise can
in some cases lead to unwanted noises in adjacent spaces and decrease the basic functionality of the room.
In the context of residential and office buildings, two acoustical concerns are the noise level and speech
privacy from room to room, which is directly contributed to the sound transmission through a structure
(Kamaruzzaman et al., 2017).
The standard acoustic quantity that describes the amount of sound transmission through a structure
is transmission loss (Cassidy et al., 2008; Moritz et al., 2015). Transmission loss, or sound power
reduction, in a building refers to the ratio of incident sound power to transmitted sound power. The ratio of
sound powers is determined through the calculation of the transmission coefficient, which is directly
inputted to obtain the transmission loss. A high transmission loss is preferable in the construction of
structures, including walls and floors. In a building, many sound sources exist such as speech, music, and
footfall. These sound sources translate to airborne and structural-borne noise in a building (Roozen et al.,
2018). Transmission loss is dependent on the acoustic frequency of the sounds in a building. As the
frequency increases the transmission loss, put broadly, increases. However, there are some nuances to this
relationship as indicated in Figure 2-5. As the frequency increases, the transmission loss moves from the
mass-controlled region to the stiffness-controlled region (Fahy, 1987). The stiffness-controlled region is
characterized by higher TL values than the mass-controlled region. Yet, there is an intermediate region
called the coincidence region that meaningfully reduces the TL. Depending on the structure’s mass density,
stiffness, and damping the frequency in which the coincidence region occurs varies. This variation of TL
in different frequencies makes it important to analyze a frequency range to quantify the acoustic
performance of a structure.

16
Figure 2-5: The frequency dependence of infinite panel transmission loss (Fahy, 1987).
In addition to the frequency range bounds, it is important that the frequency range investigated is
at a high enough resolution to meaningfully capture the coincidence dip. A low frequency resolution may
not be able to capture the depth of the coincidence dip compared to a high frequency resolution. The
common convention for acoustic research is to use a medium to high frequency resolution. Medium to high
frequency resolutions are important for accurate calculation of the transmission loss. Since the frequency-
dependence of the transmission loss quantity complicates its use in building codes, a simpler acoustic metric
is desirable.
The American Society for Testing and Materials (ASTM) developed a new acoustic metric that
was able to quantify the transmission performance of a structure (ASTM International, 2016). The acoustic
metric, called Sound Transmission Class (STC), was developed to quantify the sound-insulation value of
walls and floors in residential buildings (Northwood, 1962). The metric established a single integer rating
to a range of frequencies using an established STC contour. The STC contour was established based on
experimental research of many different structures. STC was primarily interested in investigating the
amount of speech transmission through a structure by investigating the transmission loss values at one-third
octave bands ranging from 125 Hz to 4,000 Hz. The metric also aimed to provide a recommended measure
for acoustic performance in buildings (Northwood, 1962).
To find the STC of a structure, the transmission loss from 125 Hz to 4,000 Hz must be found. The
transmission loss values for the frequency range are then adjusted for an STC contour. The obtained

17
transmission loss values are then subtracted from the STC contour to identify any STC deficiencies. STC
deficiencies are any transmission loss value below the STC contour and help determine the structure’s
acoustic performance. The two criteria for determining the STC are that the sum of the deficiencies cannot
exceed 32 dB and the max deficiency between the transmission loss value and the STC contour cannot
exceed 8 dB. Until the STC contour maximizes the sum of the deficiencies while behaving the two rules,
the STC contour is re-selected the procedure is iterated again. Once the final STC contour is found, the STC
contour value at 500 Hz is the specified STC integer. Figures 2-6 and 2-7 seen below visually explain the
criteria in determining a STC for a given transmission loss data.
Figure 2-6: Flowchart to determine sound transmission class.

18
Figure 2-7: Explanation of sound transmission class.
European countries use a similar laboratory calculation to quantify the transmission through a
single structural component called sound reduction index. The sound reduction index quantifies the amount
of sound transmission through a structure as specified by ISO 140 (Rindel, 2018). This calculation is
accurate when evaluating based on intensity measurements. Despite its accuracy and frequent usage in
European countries, the metric has not been incorporated into American building codes.
Research found that American building acoustic recommendations may not suggest the necessary
sound transmission requirements needed for optimal building functionality. Designers may meet a set
acoustical standard such as a sound transmission class in structural elements in the room design (Clark,
1970), yet these ratings are often not satisfactory on the overall building acoustic environment.
Additionally, standard acoustic metrics like STC fail to capture the entire acoustic performance of a
structural component as the acoustic performance is flattened down to a single integer. Even though a single

19
integer has benefits, it often oversimplifies the acoustic performance. Two structural components could
have the same STC rating but substantially different low, medium, and high frequency transmission.
The failure to accurately quantify the indoor acoustic environment in traditional acoustic metrics
has caused researchers to investigate and develop new acoustic metrics that quantify sound transmission.
In a recent study that explored the acoustic performance of a shaped concrete slab, Roozen et al. (2018),
determined that a mobility-based approach accurately quantifies a structure’s transmission behavior. But
this new metric did not resolve the frequency dependent values into a single acoustic number, therefore
limiting the application of this metric in an optimization framework. Furthermore, there are additional facets
of sound-structural interaction of sound transmission not captured by any standard metrics. Nevertheless,
research has demonstrated that the primary acoustic concern in sustainable buildings is unwanted speech
transmission, and STC is the current standard by which building components are evaluated. Therefore,
STC is the most appropriate quantitative metric for use with an optimization framework for initial slab
shaping, as described in this thesis.
2.4 Optimization
Within a computational framework, optimization is increasingly used in architecture and
engineering to find high-performance designs. Optimization is a mathematical procedure for finding the
best solution(s) out of several iterations while bound by multiple design variables and mathematical
constraints (Belegundu & Arora, 1985; Bendsøe & Kikuchi, 1988; Brown, 2016; Shepherd, 2019).
Therefore, optimization-based conceptual design simulations aid designers towards effective alternatives
that are the best or close to the best design solutions. In the design of buildings, optimization has many
forms. The energy use of mechanical systems, daylight operations, and structural load utilization are all
avenues of optimization in a building (Beghini et al., 2014; Harding, 2016; Wortmann, 2017).
Optimization in design requires identification of a quantitative objective function (also known as
the fitness, cost, value, or payoff function), which represents the quantity that must be minimized or
maximized in the design problem (Brown, 2016). Given the framework of this research project, this thesis
focuses on two objectives functions: structural mass, which for concrete structures is directly related to
embodied carbon energy, and sound transmission class (STC), which provides a single integer rating that
quantifies a structure’s acoustic performance of sound transmission.

20
An optimization problem also requires a set of options to choose from in the theoretical “design
space”. These options are defined by design vectors, which are formed by a collection of all design decisions
that are formulated as numerical design variables (Brown, 2016). The design variables are numbers that
correlate to a specific geometric feature or other element of the design. The variable bounds represent the
confines to which the variables can be adjusted (Brown, 2016). Additional design constraints can be added
to ensure that solutions satisfy specific conditions, such as a maximum possible slab depth.
The design space is the assemblage of the above rudiments that includes all possible design
solutions. The value for each design solution in the design space is stored in the objective space. The design
space and the objective space are linked and are explored differently depending on the research questions
asked and the utilization of the design solutions. Yet, in typical optimization problems, the design space is
explored to find the best potential combination of design variables found in the objective space (Marler &
Arora, 2004).
With the growing need to address diverse design concerns, these variables and objectives are often
linked through computational modeling. One of the computational solutions in design space exploration is
parametric design (Monedero, 2000; Woodbury, 2010; Oxman and Gu, 2015). Parametric design is used
to describe designs driven by a set of variables. Parametric design can significantly reduce the manual effort
needed to produce design iterations. Parametric models afford the ability to include required building
properties for simulation in the model definition itself, such that each generated option can be simulated
and directly compared without additional human effort (Brown, 2019).
In the building industry, structural engineering has traditionally considered to have been optimized
from designing the most structurally efficient and economical design. Structural optimization can be dated
back to the late 1500’s when Galileo Galilei determined a material optimized cantilever for a provided load
(Timoshenko, 1953). In the early 1900’s Mitchell (1904) furthered the research of reducing material of
structures by evaluating trusses, indicating that structural systems could be optimized by removing excess
material. Yet later in the century novel numerical simulation packages were created in parallel with an
increase in computational capacity resulting in the growing popularity of optimized parametric structural
design.
Structural optimization through computation has only been investigated more recently as
researchers and designers began to investigate design spaces through computational programs. With
technological advancement, the exploration of design spaces with complex structural analysis
methodologies evolved such as the structural analysis methodology explored by Block (2007) titled Thrust
Network Analysis. Woodbury (2010), Oxman and Gu (2015), and many other researchers have further

21
investigated structural design spaces, including geometric design variables and elements that impact the
iterated designs. Computational advancement has provided new geometric designs as design spaces are
modeled, iterated, and evaluated to find the best performing solutions.
Research in freeform architecture quickly followed as advanced design tools collided with
optimization procedures to find novel building designs. Freeform architecture was explored in the lens of
optimization through the work of Méndez Echenagucia et al. (2013) and Henriksson and Hult (2015).
Optimization was applied to shell structures such as concrete and masonry roofs, load-bearing masonry
walls, and auditoria design (Méndez Echenagucia et al., 2013). Henriksson and Hult (2015) investigated a
simple 2D truss, and then researched optimization of abstract triangular meshes in the search for structurally
efficient and aesthetically pleasing solutions. Freeform architecture is largely shaped by the performance
of one to several objectives in the design space. This novelty has led to performance-based design in many
fields.
2.4.1 Structural optimization of concrete elements
As previously mentioned, structural concrete slabs often have an excessive amount of material to
aid in the ease of construction, as concrete pours and molding are quick and efficient with simple geometry.
Yet with advances in digital fabrication, which enable complexly curved formwork, flexible formwork, or
even 3D printing of concrete, elaborate concrete slab geometries are more possible than before. This has
enabled the utilization of reduced concrete material in structural design.
Several developments in construction technology, especially in the field of additive manufacturing,
are relevant to this thesis. Recently, research at the intersection of digital design, additive manufacturing,
and material properties has been applied to architectural engineering disciplines (Lloret et al., 2015).
Researchers out of ETH Zurich, demonstrated the potential in this field with the fabrication of an elaborate
concrete column as shown in Figure 2-8. Their work continued, as a shaped concrete slab was designed and
fabricated that explored innovative structural concrete shaping while reducing embodied energy (Meibodi
et al., 2018). Additionally, topology optimization was utilized to investigate efficient concrete structures
(Jipa et al., 2016). Many other researchers such as Hawkins et al. (2019) and Ismail and Mueller (2019)
have further explored the potential of reducing the environmental impact horizontal concrete structures
have in building design.

22
Figure 2-8: Schematic illustration of the fabrication of an elaborate concrete column, incorporating; a) the
concrete mix; b) additional admixtures; c) feedback system; d) custom design program; and e) digital
fabrication (Lloret et al., 2015).
Further research has looked at the different facets of additive manufacturing of concrete materials.
The impact of cement admixtures in digital fabrication has shown to have an impact on concrete strength
(Marchon et al., 2018). The impact that cement admixtures has on the structural slab’s strength
demonstrates the importance of the manufacturing materials. In addition, how the concrete is fabricated is
essential. Figure 2-9 shows how additive fabrication for elaborate concrete structures is layered (Valente et
al., 2019), which helps generate elaborate geometries, such as the concrete structure in Figure 2-10
(Wangler et al., 2016).
Figure 2-9: Illustration of a layered extrusion process with concrete out of ETH Zurich. (Wangler et al.,
2016).

23
Figure 2-10: Complex geometric concrete structure constructed using digital fabrication (Wangler et al.,
2016).
As digital fabrication has advanced, it has increased the opportunity to implement complex
geometric structures in design practice. This innovative construction practice has caused a surge of research
in optimizing the shape of structural systems such as concrete slabs to maximize structural performance
while providing a sustainable design. Researchers at ETH Zurich have explored the reduction of concrete
material and steel reinforcement needed in complex ribbed concrete slab geometries. The Smart Slab
project, though designed using topology optimization, has spear-headed the investigation of implementing
an optimized shaped concrete slab in a building (Meibodi, 2018). Similarly, researchers in the Digital
Structures Research Group at MIT have investigated the optimization of structural systems by geometry.
Ismail (2019), a member of this research team, investigated the amount of embodied energy reduced by
shaping concrete beams. Additionally, he compared a ribbed slab to a traditional concrete slab and found
that embodied energy was saved using non-traditional concrete slab geometries as indicated in Figure 2-11.
Hawkins et al. (2019) also investigated non-traditional concrete slab geometries by investigating thin shell
concrete floor systems as a structural and sustainable solution in building design.

24
Figure 2-11: Ribbed slabs were found to have significant less embedded energy with increase in depth in
comparison to traditional concrete slabs (Ismail, 2019).
Foraboschi et al. (2014) investigated the reduction of embodied energy in structural concrete
systems in multi-story buildings and found that the floor type is the primary critical design element in tall
building design. Though this research did not incorporate a parametric modeling framework, the researchers
found that building geometric variables such as floor type, positioning of columns, and height of beams can
significantly how much concrete material can be reduced in an optimized concrete slab (Foraboschi et al.,
2014). Overall, there has been an increase in contributions regarding optimized shaped concrete slab
research. Structural performance-based optimization indicates that there are design solutions that are
sustainable, constructible, and aesthetically stimulating. However, there has been little research that has
combined structural performance-based design with secondary design considerations in a design
optimization framework.
Several researchers have assessed shaped concrete slabs for secondary design considerations such
as fire rating and acoustics, but the evaluations were performed post design optimization (Roozen et al.,
2018). Yet, the incorporation of secondary considerations such as acoustics in the optimization formulation
may produce different shaped concrete slab designs then if evaluated afterwards.

25
2.4.2 Acoustic performance-based design
The incorporation of acoustic performance in design optimization has only recently been
researched. The recency of this field is largely because the understanding of architectural acoustics is
continuing to grow. It has been found that acoustic objectives directly tie into primary design considerations
such as the structural system, building operations, and lighting (Shi and Yang, 2013). As stated by Badino
et al. (2020), acoustical performance is directly linked to architectural design because the room geometry
impacts sound behavior; specifically, sound reflection, diffusion, and absorption. As a result, there are
important geometric trade-offs with sound in a room. This realization has increased the need for
collaboration between architects and acousticians during the design phase.
As design tools have increasingly developed, the incorporation of acoustics has gradually increased
as a design consideration to evaluate. As architects and acousticians began to collaborate, novel auditoria
designs have been designed such as the music halls in Figure 2-12. The intricate design of these auditoria
has led to acoustic performance-based design in other room applications such as offices, gyms, and
residential areas (Badino et al., 2020).
Figure 2-12: Images of the Philharmonie de Paris and the Opera Hall of the Fuzhou Strait Culture and Art
Centre (Badino et al., 2020).
In addition to auditoria and other performance halls, acousticians are cited for acoustic solutions in
offices and residential complexes. Although the inclusion of building acoustics in these building types is
often initially neglected, it is incorporated further into the design process. Yet, when these acoustic solutions
are incorporated is an issue. Occasionally the solutions will be incorporated during the design or
construction of a building. But often acoustic consultants are called upon to mitigate existing building

26
acoustic problems. Therefore, the incorporation of acoustic performance early on in building acoustics
could be beneficial to the building owners and tenants.
Acoustic performance-based design has largely been incorporated at a room scale and not at a
building element scale aside from Méndez Echenagucia et al. (2016) who investigated curved structural
panels for sound reflection. Consideration of acoustic performance at the building element scale could
increase the indoor acoustic environment and resolve acoustic problems post construction. Specifically,
acoustic performance-based design has not thoroughly investigated the impact of sound transmission, likely
due to acoustic performance-based design only being incorporated for individual rooms. Research in the
area of sound transmission should be incorporated at a building element scale due to the impact it has on
building acoustics.
Despite the void in acoustic performance-based design for sound transmission with the application
towards building design, there has been research in sound transmission with the application toward
automobiles and aircraft. Furthermore, this research has been primarily focused on how a structural system
vibrates at certain modes under specific boundary conditions. This is because structural vibrations is an
important topic to many engineering disciplines such as aerospace and mechanical engineering.
Traditionally, research on structural-acoustic interaction has involved computational methods such as finite
element analysis and boundary element analysis to determine the impact of vibrational modes on structures
(Johnson & Cunefare, 2002; Shepherd, 2014). Experimentally, structural-acoustic research was conducted
through analysis of velocity patterns (Johnson & Cunefare 2007), advanced technology such as active
sensor control (Berkhoff, 2000). The effect of structural stiffeners on radiated power was thoroughly
researched in several curved geometries such as shells (Nandy & Jog, 2012) and flat panels (Shepherd,
2015). Sandwich structures were also investigated for constrained acoustic methods involving sound power
(Wennhage, 2003).
A small sample of research has investigated how acoustic performance-based design of sound
transmission is impacted by geometry. Ng and Hui (2008) found that honeycomb panels, with the geometry
shown in Figure 2-13, can have a transmission loss of up to 40 decibels in the mid-low frequency range,
suggesting that changing structure geometry can impact building acoustics. Similar work conducted by
Berry and Nicolas (1994) also suggests panel geometry can have a significant impact on structural acoustics
behavior (Blackstock, 2000). These researchers suggest that geometry of structural systems significantly
contributes to acoustic characters including transmission loss.

27
Figure 2-13: Dimensions of honeycomb geometry in research conducted by Ng and Hui (2008).
Research regarding geometric changes within the panel suggest that sound transmission would be
impacted by the structure’s geometry for complex floor systems. To investigate how sound transmission
and shaped concrete slabs could interact, a method to investigate both objects simultaneously is needed.
2.5 Multi-objective optimization in design
The algorithm settings and preferences must be considered in the early phases to accurately conduct
the research. There are many variables that impact the selection of an optimization algorithm. Kheiri (2018)
recommended the following optimization algorithm considerations: robustness, efficiency, accuracy,
single/multi-variable, single/multi-objective, local / global optimization, continuous and discrete variables,
and the building design stage. Touloupaki and Theodosiou (2017) stated that optimization is an iterative
process involving the selection of variables and objectives for optimization, the model necessary for
simulation, appropriate selection of objectives and optimization techniques, running the simulation until
convergence is reached, and data analysis of the results obtained. This research uses these optimization
considerations into the formulation of the proper optimization algorithms.
Multi-objective optimization (MOO) is the primary optimization technique used in this research.
MOO is performed using an evolutionary genetic algorithm called NSGA-II to identify the dominating
designs for a set of objectives (Deb et al., 2002). Marler and Arora (2004) discusses MOO broadly. The
authors detail optimization methods into a priori, which is a function that combines different objectives
into one composite function, a posteriori, which automates Pareto-equivalent solutions, and interactive,
which enables humans to select appropriate and desirable design solutions. This is done by generating a
Pareto curve which enables the designer to identify recurring distributional patterns while exploring

28
observed distributions in the objective space (Blanchet et al., 2017; McCormick & Shepherd, 2020). A
Pareto front provides the trade-off of potential solutions based on the objective functions provided in the
optimization. An example of a Pareto curve can be seen in Figure 2-14 (Corriou & Azzaro-Pantel, 2015).
Yet, there is a need to evaluate the design permutations produced by the Pareto curve output.
Figure 2-14: An example of Pareto curve that explores the best solutions for the objectives environmental
impact and cost (Corriou & Azzaro-Pantel, 2015).
Another optimization method, constrained optimization, also investigates the design space for the
best designs. Constrained optimization converges on the best designs with specified constraints and was
performed using a gradient-free algorithm called COBYLA. However, constrained optimization only
iterates through designs to optimize one objective. The other objective is held constant in addition to any
other constraints in the model. This is useful when specific values are desired for one objective, while
desiring to optimize for another objective.
There has been some research conducted at the intersection of structural systems, acoustics, and
optimization. Many aerospace and mechanical engineers investigated this work to discover ideal engine
solutions for large machinery and to solve other engineering problems. Panels for various applications have
been optimized for weight and vibration or noise depending on the research application. Marburg et al.

29
(2016) discusses the literature involving structural acoustic optimization. The authors recommend the
implementation of different optimization strategies to investigate variable performance in different models.
In research conducted by Wennhage, weight-optimization studies were performed on sandwich
panel structures at both a small (2002) and large scale (2003). Wennhage (2002) investigated how the
sandwich structure performed at various weights with respect to transmission loss. An accurate prediction
of transmission loss within 1 decibel was found. Wennhage (2003) discovered that with the addition of
acoustical constraints, structural weight increased.
In a study by Karaiskou (2018) structural masonry systems were investigated for their acoustical
properties in a building. The work used Rhino3D and Grasshopper simulations to investigate parametric
designs of masonry systems. Through this work, it was found that the manipulation of certain parameters
such as period, wall depth-to-width ratio, and wall width are critical at achieving an optimized acoustic
design (Karaiskou, 2018).
Literature has suggested that there are important trade-offs between structures and acoustics from
optimization algorithms. Yet, research currently does not conduct a parametric framework that generates
complex concrete geometries that satisfy structural codes, acoustic requirements, and provide a sustainable
building design solution. In addition, performance-based acoustic design has yet to be applied at the
building element scale.
2.6 Research questions
In summary, there is often separation between the primary and secondary considerations during the
design of building components. With contemporary design and analysis software, however, it is possible to
address interdisciplinary design goals in a shared computational environment. While advancements have
been made in structural optimization for buildings, parametric performance evaluation and optimization for
building acoustics is still a nascent field. Extensive research has been conducted on the relationship between
structure and sound, largely through the lens of vibrations, in the fields of mechanical, aerospace, and
seismic engineering. Sound-structure interaction is complex, and the acoustic phenomenon of transmission
has also been heavily studied in these fields. However, simultaneous optimization for structural and acoustic
performance has not been thoroughly investigated for customized concrete flooring systems such as shaped
one-way slabs, which have recently become possible through advancements in digital fabrication. Valuable
design possibilities may thus be discovered that distribute structural material, and corresponding embodied
carbon, exactly where it needs to be to satisfy design requirements.

30
After reviewing current structural and acoustic design practices in buildings, noting the limitations
of current design procedures and analysis metrics, and recognizing the value that optimization methods
have in exploring a design space, several research questions arise:
1) What is the nature of trade-offs between embodied carbon of a structure and sound transmission
class, and how should this be managed during design?
2) What are the designs for a structural concrete floor that reduces the structural material needed for
the design (minimizing structural mass) while achieving high acoustic performance (maximizing
sound transmission class)?
3) How do optimized shaped design solutions compare to layered floor constructions with known
acoustic performance?
4) Are the objectives of structural mass and sound transmission class appropriate to quantify structural
and acoustic performance-based design?
Critical evaluation of these questions also produces insights into the appropriateness of structural
mass and sound transmission class for quantifying the performance of shaped slab designs. The following
chapter discusses how these research questions will be evaluated through (1) design space exploration, (2)
optimization, (3) comparison, and (4) discussion. The research questions are revisited in the final chapter
with solutions, follow-up questions, and next steps.

Chapter 3
Research Methodology
This chapter presents the overall methodology for this thesis. Research in structural-acoustic
behavior with an optimization framework requires an interdisciplinary process, as shown in Figure 3.1.
Further details for the structural model, acoustic model, and optimization are provided in sections 3.2, 3.3,
and 3.4.
Figure 3-1: General methodology.
The overall methodology was segmented into several major steps. First, a design space for shaped
concrete slabs was generated based on a one-way spanning concrete joist system. The parametric modeling
and exploration of concrete slabs was implemented using Rhino3D, Grasshopper, and several open-source
plug-ins, including Karamba and Design Space Exploration. This design space utilized several geometric
features to generate the slabs, which are detailed in Section 3.1. After the concrete slab geometry was
generated, an investigation was performed to determine the proper acoustic model to use in the
determination of the concrete slabs’ acoustic performance. Both low and medium resolution acoustic
models are discussed further in Section 3.2. A structural model incorporating ACI-318 concrete code was
also used, which includes both structural strength and structural design checks. The shaped concrete slabs
were only shaped in one direction and were therefore only evaluated as one-way concrete slabs. These
checks filter the structurally unqualified shaped concrete slabs from the structurally qualified designs.
Section 3.3 elaborates on the structural checks. The objective functions of structural mass (which relates to
embodied carbon) and sound transmission class (STC) were calculated from their respective models and
were evaluated against each other by sampling the objective space.
Three different design space exploration techniques were used to investigate the structural-acoustic
interactions. Latin Hypercube Sampling (LHS) was first used to investigate initial trends in the objective

32
space (Mckay et al., 1979). An implementation of the evolutionary MOO algorithm NSGA-II was then used
to approximate the Pareto front in the design space and confirm the trends found from LHS (Deb et al.
2002). Lastly, the constrained optimization algorithm COBYLA was used to identify the best shaped
concrete slab designs at specific performance levels (Brownlee & Wright, 2015). The sequence of
exploration techniques thus yielded both broad information about the entire design space and specific
conclusions about high-performance designs. A comparison between these exploration techniques for
comparable computational investments also reveals strengths and weaknesses of each, providing further
guidance for future implementations of structural-acoustic optimization. The methodology for design space
exploration is further discussed in Section 3.4. Results of sampling and an initial investigation of the
objective space is provided in Chapter 4. Both multi-objective optimization and constrained optimization
are then conducted, with the results presented in Chapter 5.
3.1 Shaped slab geometric variables and model parameters
The research utilizes parametric modelling to iterate unique shaped concrete slab designs.
Parametric modelling incorporates a collection of geometric variables with specified bounds that are
modulated to generate 3-dimensional models of concrete slabs. Advances in design tools enable quick
geometric variable modifications while simultaneously performing simulations following the geometric
change. This framework enables the model to identify the best performing designs. Precise modeling of
shaped concrete slabs enables accurate simulation analyzes to determine if the designs would be satisfactory
in practice. Parametric frameworks are also beneficial when investigating sustainable design solutions
because concrete slab geometry can be manipulated to reduce the amount of embodied carbon energy within
the structure by placing it only where needed.
In knowing that a primary objective is to reduce the amount of structural mass, geometric variables
were selected that would provide the highest potential for generating sustainable solutions. As opposed to
rectilinear ribs, curved ribs allow for more flexible and continuous exploration of form, performance, and
aesthetics. Curved ribs have not traditionally been researched for their structural-acoustic performance.
The shaped concrete slab parametric model incorporates nine geometric variables as indicated in
Figure 3-2. The variables are: the number of ribs, top slab thickness, rib thickness on the ends, rib thickness
in the middle, two curvature points each with an end width and a taper and change of rib mid-width. Seven
of the geometric variables were used to shape a cross section of the shaped slab including both the top slab
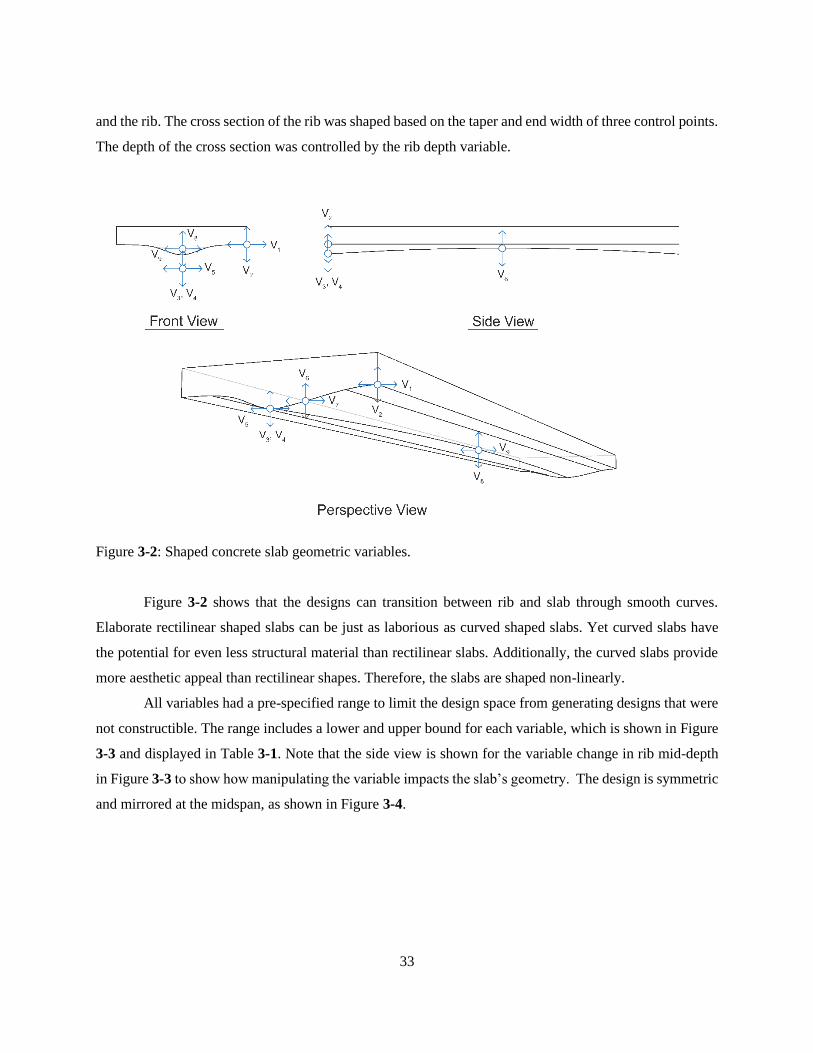
33
and the rib. The cross section of the rib was shaped based on the taper and end width of three control points.
The depth of the cross section was controlled by the rib depth variable.
Figure 3-2: Shaped concrete slab geometric variables.
Figure 3-2 shows that the designs can transition between rib and slab through smooth curves.
Elaborate rectilinear shaped slabs can be just as laborious as curved shaped slabs. Yet curved slabs have
the potential for even less structural material than rectilinear slabs. Additionally, the curved slabs provide
more aesthetic appeal than rectilinear shapes. Therefore, the slabs are shaped non-linearly.
All variables had a pre-specified range to limit the design space from generating designs that were
not constructible. The range includes a lower and upper bound for each variable, which is shown in Figure
3-3 and displayed in Table 3-1. Note that the side view is shown for the variable change in rib mid-depth
in Figure 3-3 to show how manipulating the variable impacts the slab’s geometry. The design is symmetric
and mirrored at the midspan, as shown in Figure 3-4.

34
Figure 3-3: Geometric variable bounds.
Table 3-1: Geometric variable information.
Geometric Variable Label Unit Lower Bound Upper Bound
Number of Ribs V1 Ribs 4 10
Slab Depth V2 Meters 0.050 0.400
Rib Depth V3 Meters 0.030 0.400
End Taper 1 V4 Unitless 0.200 0.700
End Width 1 V5 Unitless 0.200 0.700
End Taper 2 V6 Unitless 0.200 0.700
End Width 2 V7 Unitless 0.200 0.700
Change of Rib Mid-Depth V8 Meters -0.100 0.100
Change of Rib Mid-Width V9 % of Rib
Section Width
-10 80

35
Another important characteristic of the shaping concrete slab model is that the slab geometry is
mirrored across the middle of the slab. This potentially limits some interesting solutions to shaped concrete
slabs but reduces very complex geometries in the model. An example of the mirrored geometry can be seen
in the figure below.
Figure 3-4: Mirrored slab geometry.
In addition to the geometric variables, this research assumes several parameters that define the
specific design problem for optimization. The parameters are grouped into geometric parameters, structural
parameters, and acoustic parameters. The geometric parameters convey realistic concrete slabs. The
dimensions of the concrete slab are 6 meters by 6 meters, or nearly 20 feet by 20 feet, which are common
spans for a structural concrete slab. The slab is assumed to be an interior slab on both the length and width
sides. The concrete slab is assumed to be continuous on all sides. Floor-to-floor height in the building is 3
meters, or about 10 feet. The shaped concrete slabs are to be designed for incorporation within a multi-story
residential building. A floor layout of the concrete slab can be seen below in Figure 3-5. These geometric
parameters impact the shaped ribs and both the structural and acoustic matters.

36
Figure 3-5: Partial floor and elevation plans incorporating a shaped concrete slab.
The model includes several structural parameters and assumptions as stated in Table 3-2. Based
on required loads for a residential building, a uniform live load was placed on the concrete slab (ASCE7-
10). In addition, the shaped concrete slab is checked to handle its self-weight, which varies based on the
geometry of the concrete slab. Another assumption is that the steel reinforcement area is constant
throughout the length of rib. Steel reinforcement is discussed further in Section 3.3. The structural analysis
of a concrete column on the slab including punching shear, steel reinforcement, and other considerations is
outside the scope of this research.
Table 3-2: Structural parameter and assumption values.
Structural Parameter / Assumption SI Value English Value
Concrete Compressive Strength (f’c) 40 MPa 6,000 psi
Steel Reinforcement Yield Strength (fy) 420 MPa 60,000 psi
Concrete Modulus of Elasticity (Ec) 27,500 MPa 4 x 10⁶ psi
Steel Modulus of Elasticity (Es) 205,000 MPa 29 x 106 psi
Residential Uniform Live Load 1.915 kN/m2 40 psf

37
Similarly, to the structural parameters, there are multiple acoustic properties and assumptions
needed in order for the acoustic model to perform properly as seen in Table 3-3. Normal room conditions
are assumed on the rooms on both sides of the shaped concrete slab. This means that there the density of
air is assumed to be 1.29 kg/m3 and that the speed of sound is assumed to be 343 m/s as the temperature
and air conditions are typical in a building setting. The angle of incidence of the sound waves was held
constant at 45 degrees. It should be noted that there is a sensitivity analysis that investigates the impact the
angle of incidence has on the objective space in Appendix C. The frequency range under investigation in
this research was one-third octave bands from 63 Hz to 8,000 Hz. The frequency range was chosen due to
the frequency range needed to calculate sound transmission class (125 Hz to 4,000 Hz) and is a standard
frequency range for acoustic investigation. Specifically, the frequency range for speech ranges from 125
Hz to 4,000 Hz which is the focus of this research. An additional sensitivity analysis discussed in Appendix
B investigates the objective space when STC incorporates a frequency range from 100 Hz to 4,000 Hz.
Impact Insulation Class and floor vibrations are outside the scope of this research project; the acoustic
model focuses only on airborne sound. In addition, there is assumed that there is no acoustic flanking from
the shaped concrete slab.
Table 3-3: Acoustic parameter and assumption values.
Acoustic Parameter / Assumption SI Value English Value
Density of Air (ρo) 1.29 kg/m3 0.081 lb/ft3
Speed of Sound of Air (co) 343 m/s 1,130 ft/s
Angle of Incidence (φ) 45º 45º
One-Third Center Octave Frequency Range 63 Hz to
8,000 Hz
63 Hz to 8,000 Hz
Sound Transmission Class One-Third Center
Octave Frequency Range
125 Hz to
4,000 Hz
125 Hz to 4,000 Hz
3.2 The structural model
The structural model was based on concrete slab checks necessary for the structural design of a
one-way concrete slab system. This structural model utilized the American Concrete Institute (ACI) 318-
19 structural concrete design code for the structural checks (ACI Committee 318, 2019). The structural

38
methodology shown in Figure 3-6 consists of the following steps: (1) determine the structural material
properties and the factored loads on the concrete slab; (2) determine the ACI ductility requirements in the
concrete slab; (3) conduct the structural analysis by calculating the flexural and shear capacities; and (4)
check ACI design requirements.
Figure 3-6: Structural model methodology.
The structural material properties are noted in Section 3.1. The structural model incorporated both
the self-weight of the slab and a uniform live load. The slab is then sliced in ten sections and applied at
tenths along the length of the slab as shown in Figure 3-7. To conduct the structural analysis of the concrete
slab, the slab was cut into longitudinal sections by the number of ribs. Therefore, the analysis was conducted
on a rib of the slab, including both the top slab and the shaped rib. The single rib was cut into cross-sections
to interpolate the necessary structural forces to meet the structural requirements. Due to the longitudinal
curvature of the shaped rib, it was important to take many cuts across the rib from one end to the center of
the rib. But since there is symmetry from rib end to end, only half of the cross sections were necessary to
perform the structural evaluations.
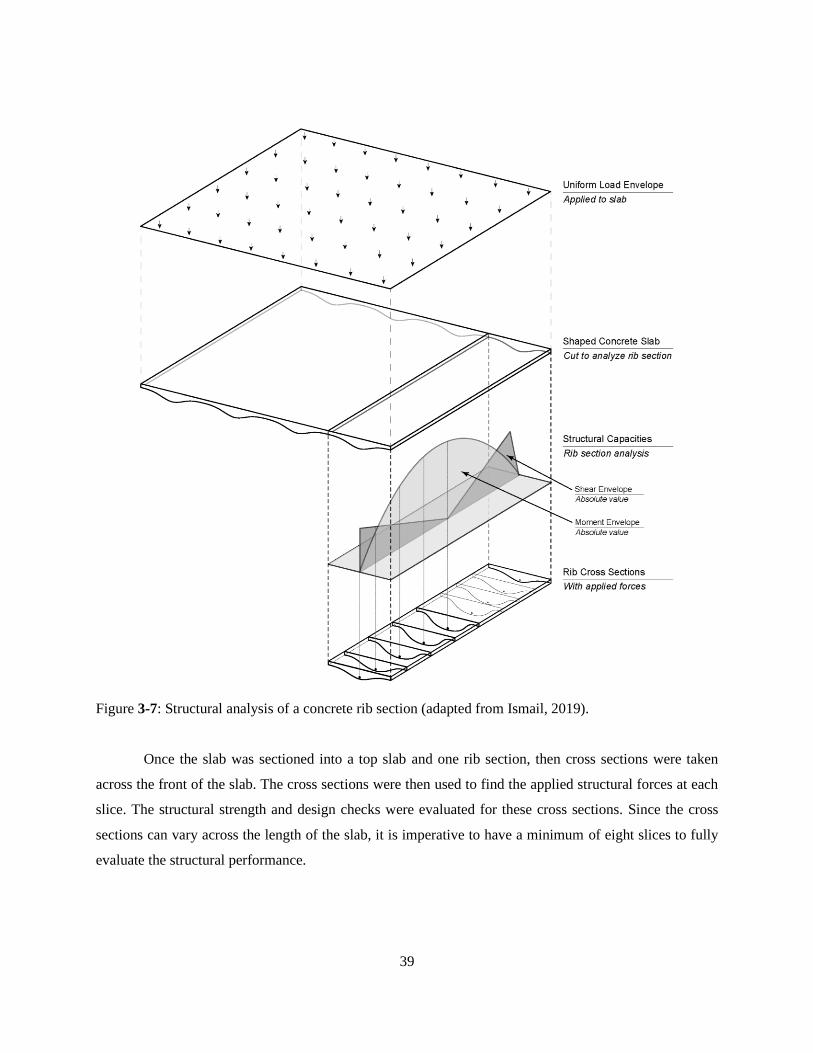
39
Figure 3-7: Structural analysis of a concrete rib section (adapted from Ismail, 2019).
Once the slab was sectioned into a top slab and one rib section, then cross sections were taken
across the front of the slab. The cross sections were then used to find the applied structural forces at each
slice. The structural strength and design checks were evaluated for these cross sections. Since the cross
sections can vary across the length of the slab, it is imperative to have a minimum of eight slices to fully
evaluate the structural performance.

40
3.2.1 Structural strength checks
The structural analysis conducted four strength checks on the structural cross sections to ensure
structural integrity in accordance with U.S. structural concrete code, ACI-318. The structural strength
checks include minimum ductility, maximum ductility, moment capacity, and shear capacity. If the shaped
concrete slab failed any of the strength checks, then the slab did not meet the ACI-318 strength requirements
and is not structurally qualified as a design solution. The shaped concrete slabs were analyzed for one-way
behavior. Therefore, the structural strength checks were conducted for a one-way concrete slab. In addition,
these members are analyzed rectilinearly and not with t-beam behavior.
The steel reinforcement in the concrete slab must be sufficient to meet the minimum reinforcement
requirement, yet not be overdesigned. ACI-18 specifies Equations 3-1 and 3-2 in metric units to find these
reinforcement bounds. The reinforcement ratios are based on the concrete compressive strength and steel
yield strength, f’c and fy. Structural concrete is known for having high compressive strength but low tensile
strength. The ductility minimum and maximum ensure that the steel reinforcement yields as designed and
that there is enough tension force in the concrete element.
𝜌𝑚𝑖𝑛 = 𝑙𝑎𝑟𝑔𝑒𝑟 𝑜𝑓 0.25√𝑓𝑐
′
𝑓𝑦,
1.4
𝑓𝑦 (Equation 3-1)
𝜌𝑚𝑎𝑥 =0.319𝑓𝑐
′
𝑓𝑦 (Equation 3-2)
It was found that estimating the longitudinal steel reinforcement in the concrete slab from the
maximum moment was not meeting the minimum steel reinforcement requirement for the slab in the model.
On a larger scale, the amount of designs in the design space that passed the steel reinforcement requirements
based on the maximum moment was around 20%. This failure is because the minimum reinforcement was
driven by the geometry of the concrete element. Therefore, an estimation of the steel reinforcement was
included in the model as seen in Figure 3-8. The steel reinforcement estimation is based on the minimum
reinforcement required by ACI-318 and rib geometry. Once the rib geometry is known, the distance from
the top of the slab to the center of the reinforcement and effective web width is estimated. Once these
estimates are obtained, a list of steel reinforcement areas are taken and divided by bwd to obtain the ductility
for each rebar size. The minimum ductility is calculated and subtracted from the provided ductility for each
rebar size. The list was then evaluated to determine the first positive number, which corresponded to passing
the minimum ductility check. Negative results of the provided ductility minus the minimum required
ductility were removed from consideration for steel reinforcement sizing. Implementation of the steel
reinforcement estimator doubled the amount of designs that were structurally qualified in the design space.

41
Figure 3-8: Estimation of steel reinforcement methodology.
Since the geometry is unique to each design, the procedure to estimate the steel reinforcement
accounts for several geometric variables to find the closest estimation of steel reinforcement needed for the
slab design. The steel reinforcement sizes range from a single #3 bar to #11 bar (shown in Table 3-4) and
double #8, #9, #10, and #11 bars.

42
Table 3-4: Steel reinforcement sizes.
Steel Reinforcement
(U.S. Bar Size)
SI Diameter English
Diameter
SI Area English Area
#3 Bar 9.53 mm 0.375 in 71 mm2 0.11 in2
#4 Bar 12.7 mm 0.500 in 129 mm2 0.20 in2
#5 Bar 15.9 mm 0.625 in 200 mm2 0.31 in2
#6 Bar 19.1 mm 0.750 in 284 mm2 0.44 in2
#7 Bar 22.2 mm 0.875 in 387 mm2 0.60 in2
#8 Bar 25.4 mm 1.000 in 509 mm2 0.79 in2
#9 Bar 28.7 mm 1.125 in 645 mm2 1.00 in2
#10 Bar 32.3 mm 1.250 in 819 mm2 1.27 in2
#11 Bar 35.8 mm 1.375 in 1006 mm2 1.56 in2
This approach introduces several limitations. In addition to the clear cover check that is detailed
below, any slab design with double reinforcement must fit in the rib portion of the concrete slab. The ribs
in these designs must be deep enough to support minimum cover, the diameter of both bars, and clear cover
between the bars. Another limitation is that even though the steel reinforcement will meet the required steel
minimum, it does not guarantee that the steel size will pass the steel maximum check. Due to the necessity
for a quick estimation of steel reinforcement and behavior of optimization algorithms, the steel sizing
estimator may simplify the steel reinforcement size required and may not suit the slab design. As a result,
slab designs that are designed with an overestimation of steel reinforcement will be structurally unqualified
in the objective space, even if a smaller steel reinforcement size would qualify the design structurally.
The limitations regarding structural reinforcement suggests the need for interaction between the
computer model and the designer. Despite the model’s rapid calculation of many designs, it overlooks
solutions that designers could be able to work in a typical concrete slab design. Steel reinforcement is often
an iterative process in concrete design and is often one of the last steps in the calculation of a concrete slab.
Since the steel reinforcement is necessary to evaluate the structural checks and evaluate acoustic
performance, the steel reinforcement does not re-iterate.
Once the steel reinforcement sizing is selected, the amount of compression and tension forces can
be found as seen in Figure 3-9. The amount of compression in the concrete is balanced with the amount of
tension in the steel reinforcement at a set distance apart, creating a couple in the concrete section. The
compression area, which is known as the Whitney stress block, is dependent on the compressive strength

43
of the concrete, the geometry of the concrete, and the maximum strain that the concrete and steel could
experience. The tension force is simply determined by the steel reinforcement area and the steel
reinforcement yield strength.
Figure 3-9: Visualization of a Whitney stress block to find the compression and tension forces.
The design steel reinforcement can also be estimated empirically using Equation 3-3 and placed at
the bottom of the concrete slab ribs as seen in Figure 3-10. In this procedure, the moment capacity has
determined from the factored loading. In addition, the design reinforcement was compared to the maximum
and minimum reinforcement area limits (Equations 3-4 and 3-5), based on the maximum and minimum
reinforcement ratios previously found. Then, the distance from the top of the rib to the bottom of the
compression block, a, was found (Equation 3-6). This calculation provides the final iteration of the area of
steel reinforcement needed for the design (Equation 3-7) which is used to find the design ductility ratio
(Equation 3-8) which is compared to the ductility bounds previously found.
𝐴𝑠 ≅ 𝑀𝑢
4𝑑 (Equation 3-3)
𝐴𝑠,𝑚𝑖𝑛 = 𝑙𝑎𝑟𝑔𝑒𝑟 𝑜𝑓 0.25√𝑓𝑐
′
𝑓𝑦 𝑏𝑤𝑑,
1.4
𝑓𝑦 𝑏𝑤𝑑 (Equation 3-4)
𝐴𝑠,𝑚𝑎𝑥 = 0.319 (𝑓𝑐
′
𝑓𝑦) 𝑏𝑑 (Equation 3-5)
𝑎 = 𝐴𝑠𝑓𝑦
0.85𝑓𝑐′𝑏
(Equation 3-6)
𝐴𝑠 =𝑀𝑢
𝛷𝐹𝑦(𝑑−𝑎
2) (Equation 3-7)
𝜌 = 𝐴𝑠
𝑏𝑤𝑑 (Equation 3-8)

44
Figure 3-10: General locations of the area of steel reinforcement and concrete area acting in compression
(adapted from Ismail, 2019).
The traditional framework of estimating the steel reinforcement ratio based on the factored moment
has limits for complex concrete structures. For standard concrete elements, the depth and effective web
width are easily identifiable. Yet for shaped structures, this process is less intuitive causing underestimates
of steel reinforcement. Another limitation is that the steel area estimate incorporates a rectilinear area of
the slab that acts in compression. For shaped concrete slabs, a curved area acts in compression. These
differences resulted in a new methodology for estimating the steel reinforcement ratio that is based on the
shaped slab’s geometric features as previously discussed. This methodology was important as it provided
better steel reinforcement sizes for the shaped concrete slab designs, which provided accurate results for
the ductility and flexural strength checks.
A flexural check was performed next to evaluate if the concrete slab is adequate for bending given
the loading. The flexural capacity is determined using the steel reinforcement area previously found and
the distance from the center of the compression block to the center of the steel reinforcement (Equation 3-
9). After the moment capacity was determined, the percent error that the slab was overdesigned or under-
designed was found. If the shaped slab was found to be under-designed for moment, then the shaped slab
was classified as a structurally unqualified design in the model.
𝑀𝑛 = 𝐴𝑠𝑓𝑦 (𝑑 −𝑎
2) (Equation 3-9)
Lastly, a shear check was conducted to ensure that the concrete slab is adequate for shear. Similarly,
to the flexural check, the shear was determined from the amount of shear resisted in the concrete and the
shear reinforcement. The shear reinforcement differs from the flexural reinforcement previously discussed,
as shear reinforcement in concrete slabs typically does not control for the design of the slab. For this model,
#3 steel stirrups at 0.300 meters were selected for the shear reinforcement and were held constant for every
model. The size and spacing of the steel stirrups were selected based on common practice. After the concrete
and steel contributions to the shear capacity were found, the shaped concrete slab’s total shear capacity was
calculated and compared to the factored shear (Equation 3-10). A percent error is calculated, informing how
much the design was overdesigned or under-designed. Again, if the shaped slab was found to be under-
designed for shear, then the shaped slab was classified as a structurally unqualified design in the model.

45
𝑉𝑛 = 𝑉𝑐 + 𝑉𝑠 = 0.167√𝑓𝑐′𝑏𝑤𝑑 +
𝐴𝑣𝑓𝑦𝑑
𝑠 (Equation 3-10)
3.2.2 Structural design checks
In addition to the structural strength checks, the structural model will evaluate the concrete slab
design based on several ACI-318 design checks. The design checks are based on geometric requirements
that the concrete structure must have to be adequate for concrete design. These checks include confirming
the minimum top slab thickness, effective flange width, and minimum clear cover. These design
recommendations are important to ensure the structural integrity and serviceability of the concrete slab.
The top slab thickness ensures that the slab is deep enough to maintain structural integrity. The
max slab thickness was determined from the top of the slab to the bottom of the rib (h in Figure 3-10) for
shaped concrete slabs. If the slab met the threshold from Equation 3-11, then the slab passed the design
check. In addition to checking the maximum slab thickness from the top of the slab to the bottom of the rib,
an additional check was established to ensure that the top slab was no less than 0.080 meters (roughly 3
inches). This was determined to provide enough structural compressive strength at the top of the slab, ensure
structural integrity, and slab constructability.
𝑆𝑙𝑎𝑏 𝑇ℎ𝑖𝑐𝑘𝑛𝑒𝑠𝑠 ≥ 𝑙
21 (Equation 3-11)
The effective flange width is based on ACI-318 recommendations. The effective flange width was
calculated from the width of the concrete rib and the spacing of the concrete ribs. If the spacing of the
concrete slab was too wide, then the slab would fail the flange width check.
The minimum clear cover is the final structural design requirement. Since the rib cross section
changes throughout the length of the slab, the clear cover check is vital to ensure that steel reinforcement
is continuous throughout the length of the rib as it provides flexural resistance. This is critical where the
moment is greatest: in the middle of the slab. This is checked by using the geometry of the design space. A
clear cover of 38 millimeters or 1.5” is used from the bottom of the rib as shown in Figure 3-11. Then the
steel reinforcement area is generated into a geometric circle. If the geometric circle is confounded within
the rib cross section across the whole length of the rib while maintaining the clear cover, then the design
passes the structural design check. Otherwise, the design is classified as a structurally unqualified design.

46
Figure 3-11: Clear cover check.
After all the structural strength and design checks are performed on the shaped concrete slab, it is
determined if the slab is a structurally qualified design in accordance to ACI-318 structural concrete
requirements. However, to be considered a fully qualified design, the structurally qualified designs need to
also have adequate acoustic performance.
3.3 The acoustic model
To investigate the acoustic characteristic of transmission through the shaped concrete slabs, the
following methodology is used. Figure 3-12 displays the acoustic methodology which takes the slab
geometry generated from the geometric variables along with the longitudinal steel reinforcement size found
in the structural model and uses acoustic formulas to determine the acoustic performance of the structure.

47
Figure 3-12: Acoustic methodology.
Two acoustic models were developed to investigate how the structural concrete slab geometry
impacts the transmission loss (TL). In the low-resolution model using the acoustic concept of mass law,
only the structure’s mass density influenced the TL. However, in a medium resolution model utilizing an
analytical approach to calculate the transmission coefficient, the structure’s mass density and stiffness
impacts the TL. Specifically, the shaped slab’s geometry has the greatest impact on the TL. This comparison
is necessary as the low-resolution model cannot differentiate between slabs with the same mass, while the
medium resolution model can. A comparison between the two models distinguishes that the infinite panel
model is more appropriate for early design optimization and exploration, in which a fast and accurate
evaluation is sought compared to utilizing finite element simulations that can be used later in the design
process to refine the design. Again, this research does not incorporate structural-borne forces such as
footfall or mechanical vibrations through the structure.
The acoustic analysis is performed similarly to the structural analysis. A cut across the shaped slab
is taken that includes both the top slab and rib. This cut is sliced into cross sections, similar to the structural
analysis, but the cross sections are divided into the top slab cross section and rib cross section as shown in
Figure 3-13. The cross sections are divided as such because the top slab and rib have different contributions

48
to the stiffness of the structure, and therefore different contributions to the acoustic performance of the slab.
Both the top slab and rib sections are analyzed simultaneously in the acoustic model.
Figure 3-13: Acoustic analysis of a concrete rib section.
The cross sections found are then used in the evaluation of the slab’s acoustic performance, but
only for the analytical transmission model. Mass law is only dependent on the frequency range for analysis
and the slab’s average mass density.
The frequency range and resolution are critical in the evaluation of acoustic performance. A
frequency range from 63 Hz to 8,000 Hz is investigated at 1 Hz intervals. The frequency range is then
applied to both mass law and the analytical transmission model to obtain transmission coefficient values at
each frequency as indicated in the methodology shown in Figure 3-14. Before obtaining the transmission
loss value, the transmission coefficients are binned and averaged according to the one-third octave band
frequency limits. Averaging across the one-third octave bands gives averaged transmission coefficients
before using the logarithmic equation to obtain the transmission loss values. Binning and averaging at one-

49
third octave bands is also important for STC calculation, as the metric requires transmission loss values at
one-third octave bands. Therefore, this frequency range and resolution provides a more accurate STC
calculation.
Figure 3-14: Frequency range and resolution methodology.
3.3.1 Low-resolution acoustic model
The mass law refers to a simple equation that approximates the structure’s transmission loss as a
function of the structure’s mass (Long, 2014). This relationship is dependent on the mass density of the
structure and the frequency range of the sound source (Equation 3-12). Specifically, incident mass law
incorporates a constant that accounts for the angle of incidence, on which the calculation of the transmission
coefficient is dependent. Mass law is measured in decibels and provides a general indication of acoustic
behavior below the coincidence frequency. Yet, the mass law equation cannot differentiate between designs
of equal mass but different slab geometry.

50
𝑇𝐿𝑀𝐿 = 20 log(𝑚𝑓) − 42 (Equation 3-12)
3.3.2 Medium-resolution acoustic model
The analytical model finds the transmission loss of a structure by calculating a transmission
coefficient for the structure as if it were an infinite panel. It is based on wave physics and the continuity of
normal velocity between the structure and air. The transmission coefficient accounts for more than the
structure’s mass, as it also incorporates the structure’s flexural rigidity, or stiffness, as seen in Equation 3-
13 (Blackstock, 2000). The transmission coefficient (Equation 3-14) is dependent on both the frequency
and angle of incidence of the sound source. It also incorporates other room acoustic properties that are
assumed in the mass law coefficient. After obtaining the transmission coefficient, the TL values can be
found using Equation 3-15.
𝐷 = 𝐸ℎ0
3
12(1−𝜈2)+
𝐸𝑠𝑡𝑖𝑓𝑓𝑒𝑛𝑒𝑟 𝐼𝑠𝑡𝑖𝑓𝑓𝑒𝑛𝑒𝑟
∆𝑠𝑡𝑖𝑓𝑓𝑒𝑛𝑒𝑟 (Equation 3-13)
𝜏(𝜑, 𝜔) = (
2𝜌0𝑐0𝑠𝑖𝑛𝜑
)2
(2𝜌0𝑐0𝑠𝑖𝑛𝜑
+𝜂(𝐷
𝜔)(𝑘0𝑠𝑖𝑛𝜑)4)2+(𝜔𝑚−(
𝐷
𝜔)(𝑘0𝑠𝑖𝑛𝜑)4)2
(Equation 3-14)
𝑇𝐿 = 10 log (1
𝜏) (Equation 3-15)
Even with the increased accuracy of the analytical transmission model, another question arises:
how can the acoustic performance be characterized by a single number if the TL is dependent on a
frequency range? An acoustic metric called sound transmission class is introduced below that addresses
this question.
3.3.3 Sound Transmission Class
As discussed in Chapter 2, the metric of sound transmission class (STC) was used to quantify the
acoustic performance of a component using a single integer (Long, 2014). Despite the simplification of the
acoustic model, STC is a good acoustic metric for optimization. This is due to how acoustic performance
can be simplified to one number that attempts to quantify the overall performance, rather than the
transmission loss for a single frequency.
The International Building Code (2018) and many local residential building codes require a
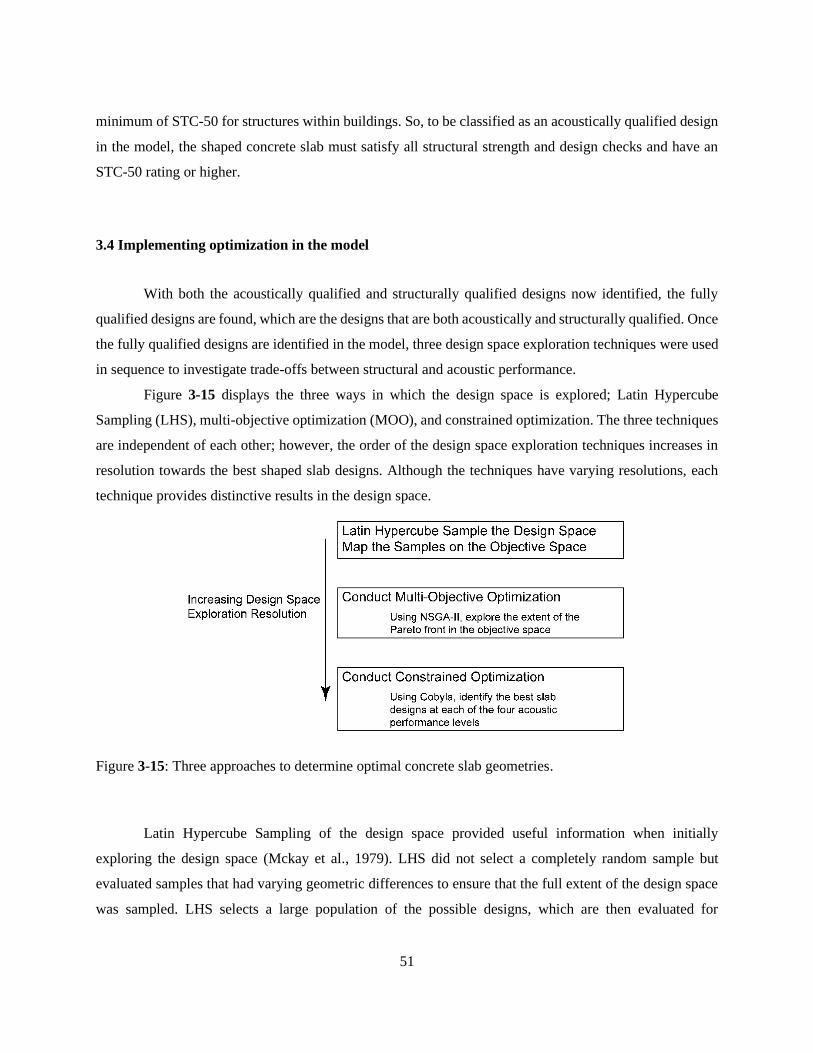
51
minimum of STC-50 for structures within buildings. So, to be classified as an acoustically qualified design
in the model, the shaped concrete slab must satisfy all structural strength and design checks and have an
STC-50 rating or higher.
3.4 Implementing optimization in the model
With both the acoustically qualified and structurally qualified designs now identified, the fully
qualified designs are found, which are the designs that are both acoustically and structurally qualified. Once
the fully qualified designs are identified in the model, three design space exploration techniques were used
in sequence to investigate trade-offs between structural and acoustic performance.
Figure 3-15 displays the three ways in which the design space is explored; Latin Hypercube
Sampling (LHS), multi-objective optimization (MOO), and constrained optimization. The three techniques
are independent of each other; however, the order of the design space exploration techniques increases in
resolution towards the best shaped slab designs. Although the techniques have varying resolutions, each
technique provides distinctive results in the design space.
Figure 3-15: Three approaches to determine optimal concrete slab geometries.
Latin Hypercube Sampling of the design space provided useful information when initially
exploring the design space (Mckay et al., 1979). LHS did not select a completely random sample but
evaluated samples that had varying geometric differences to ensure that the full extent of the design space
was sampled. LHS selects a large population of the possible designs, which are then evaluated for

52
performance and mapped onto a bi-objective plot, which is a visualization of the objective space. The
sampled objective space is insightful as it can indicate trends in the design space that can be explored with
further evaluation of the objectives. In addition, LHS shows the general trends within the design space that
is not biased towards the best designs. Sampling also can suggest a Pareto front, or the designs that have
the best objective performances. However, sampling does not necessarily converge on a high-resolution
Pareto front, as it near randomly evaluates designs. The results of sampling the shaped concrete slab design
space are discussed in Chapter 4.
For multi-objective optimization, an evolutionary genetic algorithm called NSGA-II was used to
explore the design space (Deb et al., 2002). A set population and generation size were specified so that the
algorithm could create design mutations within the parametric model that had the best objective
performance. Therefore, the Pareto front was obtained, as the later generation of NSGA-II converged on
some of the best designs. Unlike LHS, MOO does not show general design space trends as the designs are
biased towards the better performing designs. This is advantageous though, as trends can be found for the
best performing designs. MOO results are discussed in Section 5.1. One goal of the research was to compare
the resolution of a Pareto front approximation from the first two methods, which indicates the effectiveness
of each method for future, higher resolution exploration.
Constrained optimization is another optimization method which identifies the best performing
designs based on several constraints. A single objective is specified to be optimized while constraining the
other objective and any other constraints using a gradient-free algorithm called COBYLA (Brownlee &
Wright, 2015). An advantage that constrained optimization, using COBYLA, has over MOO is that each
constraint is evaluated individually instead of amalgamated as a single penalty function for each unique
geometric permutation. This thesis conducts constrained optimization runs that minimize structural material
subject to a specific STC level, structural checks, and any other constraints. The advantage of constrained
optimization is that it is likely to find a more structurally efficient design at a specific STC level than a
MOO algorithm. However, a single constrained optimization run requires considerable computation to
converge to only one shaped slab design, and thus it is more difficult to identify a smooth, full Pareto front.
There is thus a tradeoff between finding best designs versus general trends between MOO and constrained
optimization, which is revealed in the results sections. Therefore, general trends within the design space
cannot be obtained when using constrained optimization. Constrained optimization is discussed in Section
5.2.
An important practical consideration with these computational techniques is that they should be
well suited for the timescale that the designer and engineer have. For the early design explorations in this

53
thesis, many different optimization runs were conducted while adjusting the design space, determining the
sensitivity of various parameters, and comparing the merits of optimization approaches. The approach of
rapid, iterative optimization runs stems from the main research questions, which include evaluating the
nature of performance tradeoffs in addition to identifying potentially high-performance designs. Chapters
4 and 5 thus contain several final datasets that summarize the overall findings.
While specific optimization settings are explained in these results chapters, details about the
computational environment are provided here. The Latin Hypercube Sampling simulations were conducted
at a resolution of n = 5,000 on a desktop computer with an Intel® Core™ i7-7700 CPU @ 3.60GHz
processor and 8.00 GB of RAM. In this environment, each iteration took approximately 562 minutes, for
an overall time of 9.37 hours. For multi-objective optimization results, NSGA-II was run with a population
of 100 and a fixed generation of 50. This was intentionally chosen to approximate the computation time for
sampling, in order to compare the relative merits of each method. For the constrained optimization runs,
convergence criteria such as STC rating and structural strength checks were established, rather than a fixed
generation size. Constrained optimization would then converge to the smallest structural mass obtainable
while maintaining all constraints. As such, there was significant variability in the length of each run.
However, they generally converged to the results in approximately 40 minutes.
The exploration of the design space is insightful as it determines the best design solutions for
structural-acoustic building requirements. The best shaped concrete slab designs are also compared to other
floor constructions with known acoustic performances to put the shaped concrete slabs into context with
floors used in residential buildings.

Chapter 4
Investigation into the Design Space of Curved Shaped Slabs
Sampling the design space is the first step to exploring the design space model. This chapter
contains multiple visualizations of both the design and objective spaces in coordination with images of the
designs themselves, which reveal relationships among both variables and objectives. For this research, the
designs are plotted in accordance to their performance of the two objective functions, which are structural
mass and sound transmission class. The objective space shows trade-offs between the objectives that
indicate how the designs perform on both objectives. In these plots, the non-dominated designs are often
highlighted, which represent a low-resolution Pareto front approximation that is refined in the next chapter.
However, this chapter presents a fully qualified objective space along with discussion and takeaways across
the entire design space.
4.1 Initial sampling of the design space
The design space was created using a combination of nine geometric variables and a collection of
parameters and assumptions used in the model described in Chapter 3. The bottom side of the concrete slabs
were being shaped to meaningfully redistribute the mass to create satisfactory acoustic conditions while
reducing the total mass of the slab. The design space was first explored using Latin Hypercube Sampling
(LHS) at a resolution of 5,000 designs. In the design space, each data point represents a shaped concrete
slab. Figure 4-1 displays a representative 20 shaped concrete slab designs that were evaluated through
design space sampling. As discussed in Section 3.1, the slabs are shaped with curved tapers to reduce
excessive structural mass. The shaped slabs were plotted within the design space. However, since LHS was
used, there were no visible trends between any variables in the design space of all designs. A 3-dimensional
scatterplot is provided in Figure 4-2, emphasizing three main variables: slab thickness, rib number, and rib
depth. This shows the wide variety of shaped slab designs in the design space for three geometric variables.
Figure 4-2 also shows the designs with the largest amount of structural mass, as the plot moves from designs
with less structural mass (light color) to designs with more structural mass (dark color).

55
Figure 4-1: Randomization within the shaped concrete slab design space.
Figure 4-2: 3-Dimensional design space scatterplot of three geometric variables: rib number, top slab
thickness, and rib thickness colored by structural mass.

56
These sampled designs were then mapped onto the objective space, as shown in Figure 4-3. As
mentioned in Chapter 3, the designs were plotted using the two different acoustic models; mass law, a low-
resolution acoustic model, and the analytical transmission model, a medium-resolution acoustic model that
accounts for mass, stiffness, and damping of an infinite panel. The purpose of having the acoustic models
compared to each other is to identify how well the acoustic models estimate of the slab’s acoustic
performance using LHS. The designs are banded horizontally as the STC rating is always a whole number.
The x-axis quantifies the slab’s structural mass while the y-axis quantifies sound transmission class. It
should be noted that STC is plotted with an inverted y-axis to visually show that minimizing the two
objective functions results in the best performing designs. It should be noted that Appendix A provides
calculation checks to confirm the results found from LHS.
Figure 4-3: Comparison of the acoustic models in the objective space.
The comparison between the two acoustic models shows that in general, the mass law estimates a
higher STC for the slab design than the analytical transmission model. This is intuitive because mass law
does not account for stiffness, and the resulting coincidence dip that occurs in structures. To further assess
how the simulations quantify the acoustic models in an optimization framework, a case study of three
different slabs is conducted. Figure 4-4 shows the slabs’ objective performance compared to the entire
design space. It is important to note that the analytical transmission model does predict higher STC values

57
for slabs with a structural mass of 30,000 kg or higher. These higher values result from the STC metric
failing to capture the slab’s low coincidence frequency. This is discussed further in Section 4.3.
Figure 4-4: Case study designs’ performance for both acoustic models.
As can be seen in Figure 4-5, the three slabs vary greatly in geometry. Slab design 1 resembles a
flat slab with many small ribs. Slab design 2 has four defined ribs. Slab design 3 has six deep, curvy ribs.
Despite the geometric differences, the three slabs have the same structural mass when steel reinforcement
was included. The mass law, as mentioned in Section 3.2, is dependent solely on a structure’s mass. Even
though mass law provides for a quick estimation of the acoustic evaluation, there are major limitations to
relying solely on slab’s density. To provide more context on the geometric differences between the two
acoustic models, the STC for both models is calculated. The results of the slab comparison can be seen in
Table 4-1.
Figure 4-5: Mass law versus analytical transmission model case study slab designs.

58
Table 4-1: STC comparisons between mass law and analytical transmission model.
Slab Design Mass Density Mass Law STC Analytical Model STC
Slab Design 1 780 kg/m3 STC-74 STC-55
Slab Design 2 777 kg/m3 STC-74 STC-53
Slab Design 3 778 kg/m3 STC-74 STC-49
The inclusion of geometric differences, structural characteristics, and acoustic parameters have a
large impact on the TL values obtained. As discussed in Section 2.3, a structure’s mass density, stiffness,
and damping impact the location of the coincidence region when evaluating frequency versus TL. Figure
4-6 shows that the analytical transmission model is able to account for the coincidence region and decipher
where the coincidence dip occurs. The inclusion of the coincidence dip causes a decrease in STC, but
provides a more accurate acoustic performance measurement.
Figure 4-6: Comparison of one-third octave band frequency TL values for the acoustic models with a 45
degree angle of incidence.
As a result, the analytical transmission model is the acoustic model moving forward in the
remainder of the research. Figure 4-7 shows the objective space using the analytical transmission model.
The utopia point, identifying the ideal design with the minimum structural mass and highest STC, is also
provided on the plot. In general, the best slab designs have the closest objective performances to the utopia
point, although this can change slightly depending on priorities between the objectives. LHS only suggests
the best shaped slab designs, but the optimization techniques discussed in Chapter 5 find higher performing
shaped slab designs for specific requirements.

59
Figure 4-7: The objective space using the analytical transmission model.
Figure 4-7, which shows only the analytical transmission model, indicates broad structural-acoustic
trends. The first is that as structural mass increases, STC increases. The designs between STC-40 and STC-
55 show this relationship clearly. The relationship is generally logarithmic, which is intuitive due to the
relationship between transmission coefficient and TL. Above STC-55, the relationship between structural
mass and STC dramatically changes as considerably larger STC ratings become possible. The increase in
STC rating in this area of the objective space is due to the metric failing to account for low coincidence
regions. This trend is discussed further in Section 4.3.
To understand the structural-acoustic trade-offs, the objective space must be filtered to identify the
slab designs that meet all structural strength and design checks while meeting the minimum acoustic
building requirements. These fully qualifying designs will be further investigated, including structural-
acoustic trade-offs and variable-objective trade-offs.
4.2 Assessment of structurally qualified designs
To implement the shaped concrete slabs in the building’s structural system, structural concrete
checks must be performed on the slab. ACI-318 structural concrete code was implemented for the structural

60
checks, investigating both the strength and design checks of a concrete slab. If a slab design did not meet
all structural strength and design checks, the slab would be structurally unqualified for building design. The
structural strength checks consist of ductility requirements, moment capacity, and shear capacity. As
discussed in Section 3.2, these checks are based on the moment and shear demand caused from the area
load and slab self-weight. The steel reinforcement was estimated based on the slab’s geometry and the
strength capacities were determined. The strength design checks consist of minimum slab thickness,
effective flange width, and clear cover checks. These checks are based on the shaped slab’s geometry.
After all the structural strength and design checks have been calculated, a post-processing script
identified the slabs that were structurally unqualified in the objective space. Around 40% of the shaped
concrete slabs were structurally qualified. Figure 4-8 below shows the results of removing the structurally
unqualified slab designs.
Figure 4-8: Comparison of the structurally qualified and unqualified designs in the objective space.
After the structurally qualified designs were identified, an investigation of the longitudinal steel
reinforcing for the concrete slabs was conducted. This was to see if there were any visual trends in the
sizing of steel reinforcement sizes as it relates to structural mass and STC. The reinforcement sizes ranged
from #3 to #11 bars. Due to the amount of rebar sizes, Figure 4-9 groups the steel reinforcement into three
rebar size clusters: #5 to #7, #8 and #9, and #10 and #11 bars. It should be noted that no shaped slab was
designed with a #3 or #4 steel bar.

61
Figure 4-9: Structurally qualified designs categorized by steel reinforcement sizing.
When categorizing by steel reinforcement size, there are no visible trends from the logarithmic
region from STC-40 to STC-55. Yet above a rating of STC-55, the slab designs with high acoustic
performance and the least amount of structural mass had larger rebar sizes. This may indicate that the better
performing shaped slabs have deeper shaped ribs with enough clear cover for large steel bars. It also
suggests that the largest rebar sizes have the highest potential for low structural mass and high STC in the
LHS objective space.
It should be noted that the steel sizing could be reduced for several sampled designs. A designer
would iterate through steel reinforcement sizes to find the best reinforcement size. However, due to the
complications of the shaped slab geometry, the longitudinal steel reinforcement was automatically
estimated using the methodology detailed in Section 3.2. If a designer interacted with the steel
reinforcement estimator, there may be a more noticeable trend between steel reinforcement and the
objectives.
With the structurally qualified slab designs now identified from Figure 4-8, further investigation of
the acoustic performance is conducted to identify trends in the objective space along with relationships
between objectives and design variables.

62
4.3 Objective space subdivided by STC
To further understand the structural-acoustic relationships, the objective space must be evaluated
for acoustic performance. The International Building Code (IBC), requires a minimum rating of STC-50
for satisfactory acoustics within a building (International Building Council, 2018). However, many
acousticians believe that STC-55 or higher should be achieved to provide a better acoustic environment for
its occupants (Long, 2014). It is important to determine the amount of designs that qualify according to the
acoustic requirement.
There are four classifications of acoustic performance for structural elements as indicated in Figure
4-10. Any design below STC-50 does not adhere to IBC and is classified as an acoustically unqualified
design. Structures between STC-50 and STC-54 are adequate for building design code but are largely
recognized as not having desirable acoustics (Long, 2014). Structures between STC-55 and STC-59, are
classified as having acceptable acoustic environments for speech privacy. For higher speech privacy, a
structure should have a STC-60 or higher (Long, 2014). For highest acoustic quality, often desired for high
scale apartments and important commercial or government buildings, a STC-65 or higher is recommended.
Figure 4-10: Acoustic evaluation of the objective space.
However, as previously mentioned in Section 4.1, there is a region in the objective space where the
acoustic performance greatly increases with a small amount of additional structural mass. To help identify

63
the cause of this shape in the objective space, the objective space was clustered by each design’s coincidence
frequency which is displayed in Figure 4-11. The coincidence dip is the visual dip in the TL as discussed
in Section 2.3. Physically, the coincidence frequency occurs when the wavelength in the air matches the
structural wavelength of the slab. At this frequency, the slab acts as an efficient radiator of sound, hence
lowering the structure’s acoustic performance.
Figure 4-11: The objective space clustered by coincidence frequency.
Figure 4-11 indicates that there are many coincidence frequencies within the objective space
ranging from a one-third octave band frequency from 100 Hz to 400 Hz. It should be noted that the slabs’
coincidence frequency may not be exactly equivalent to the one-third center octave frequency, but within
the one-third octave band bounds; therefore all slab designs are classified by the one-third octave band bin
that the coincidence frequency falls into. The slabs were grouped based on the lowest averaged TL value at
one-third center octave frequencies in Figure 4-11. Yet not all of these slab designs are acoustically
qualified. Figure 4-12 displays the acoustically qualified designs and their respective one-third center
octave coincidence frequency.

64
Figure 4-12: Coincidence frequency case study designs’ objective performance in the acoustically qualified
objective space clustered by coincidence frequency.
The coincidence frequency clustering reveals structural-acoustic trends that significantly influence
the overall STC rating. The first takeaway is that as the structural mass increases, the coincidence frequency
decreases. There is some overlap with this, as there are no clear transition points that the coincidence
frequency changes due to structural mass. This relationship is largely due to the structure moving towards
the mass dominant region and away from the coincident region. Similarly, as the coincidence frequency
decreases, the peak STC increases. There is much more variability with this trend, generally as the STC
increases, the frequency in which the coincidence frequency occurs decreases. STC is dependent on the
slab’s geometry, slab’s mass, slab’s stiffness, and the slab’s damping. Since the slab’s damping is held as
a constant throughout this research, so the geometry, mass, and stiffness must be creating this trend. As the
mass of the slab increases, the mass dominates the acoustic equations and controls the transmission seen
through the structure.
The other notable observation is that the region where the acoustic performance increases with little
structural mass increase is mostly grouped by a coincidence frequency of 100 Hz. There are only three
different one-third octave band center coincidence frequencies for the acoustically qualified designs, 100
Hz to 160 Hz. This frequency range keeps with research showing concrete structures to have a range of
coincidence frequencies from 100 Hz to 1,000 Hz (Warnock, 1985). To understand why the acoustically

65
qualified designs are being clustered in these three frequencies, a new case study was conducted to
investigate the impact of the coincidence frequency for these heavier structures. Three different slab designs
representing the three different coincidence frequencies are highlighted as shown in Figure 4-12. The 3-
dimensional models of the three slabs can be seen in Figure 4-13.
Figure 4-13: Coincidence frequency case study slab designs.
STC is only characterized with a frequency range of 125 Hz to 4,000 Hz. Since the coincidence dip
is outside of this frequency region, the STC rating increases dramatically as the metric does not have to
account for the coincidence dip. Figure 4-14 shows that the coincidence dip occurs at the frequencies found
from the script when plotting the structure’s one-third octave center frequency transmission loss values
against one-third octave center frequencies.
Figure 4-14: One-third octave center band TL versus frequency for three shaped concrete slabs.
Figure 4-14 reveals three regions; a short flat slope, a dip that corresponds to the coincidence region,
and a positive linear relationship when investigating one-third octave center frequencies and one-third
octave TL values. These regions are generated due to the relationship between the slab’s mass and stiffness.
The flat slope and coincidence dip regions are not identical between the three designs as some of the
coincidence dips and flat slopes are slightly jagged. The visible jagged lines are due to the binning of TL

66
values at one-third octave center frequencies. STC requires a frequency resolution of one-third octave bands
so the TL values were averaged and binned into one-third octave frequencies for this research.
Figure 4-14 also shows an overlaid STC curve for each slab design. For the frequencies of 160 Hz
and 125 Hz, the STC metric is able to capture the coincidence dip. However, at a frequency of 100 Hz, STC
does not account for this dip, and therefore significantly increases in acoustic performance because the STC
deficiency is outside of the coincidence region. This is a major limitation of STC, as the acoustic metric
only considers the speech frequency range. Since mass and stiffness control the frequency in which the
coincidence frequency occurs, this emphasizes why the analytical transmission model was selected. The
variations in the STC ratings for the case study discussed in Section 4.1 are explained due to variations in
stiffness caused by differences in the shaped slabs’ geometry.
Another observation from Figure 4-14 is that lower coincidence frequency does not always equate
to a higher STC rating. The slab design with a coincidence frequency at the one-third center octave
frequency of 160 Hz has a higher STC rating than the slab design with a coincidence frequency at the one-
third center octave frequency of 125 Hz. One reason is that the two slab designs are close to the one-third
octave center band limit. The second reason is that the first slab design has a flatter coincidence dip between
125 Hz and 160 Hz in comparison to the second slab design with a deeper coincidence dip at 125 Hz. STC
penalizes the deeper coincidence dip, resulting in a lower STC for the second slab design. A flatter
coincidence region reduces the severity of the STC reduction, therefore resulting in a better STC rating in
the first slab design. Appendix B addresses how the sampled objective space would behave when STC
considers a frequency range of 100 Hz to 4,000 Hz.
Despite STC’s limitation to meaningfully capture the coincidence frequency across all shaped
concrete slab designs, the acoustic metric still has value. STC is a measurement describing the amount of
TL in the speech frequency range and is well integrated in the building industry. Although low frequency
sounds from televisions and stereos exist in residential buildings, speech frequency is fully accounted for
in STC. Though the coincidence dip may fall below this range, the slab designs with a coincidence dip
lower than 125 Hz are still accurately quantified according to TL of speech. Therefore, the slab designs in
the knee point are not excluded as acoustically qualified designs. The fully qualified objective space is
shown in the following section.

67
4.4 The fully qualified objective space
After early investigation into both the structural and acoustic models, the fully qualified designs
can be determined in the objective space as seen in Figure 4-15. A fully qualified design is defined as a
shaped concrete slab design that passes all ACI-318 structural strength and design requirements and has a
minimum STC-50, as required in the IBC. Therefore, the fully qualified designs are potential structural
floor designs in a building.
Figure 4-15: The fully qualified objective space.
The original trends are now confirmed in the objective space. As structural mass increases, STC
increases. However, above a STC-55, the acoustic performance increases significantly with little increase
in structural mass. Again, this is due to varying slabs’ coincidence frequency and the frequency range that
STC incorporates within the metric. Further investigations will incorporate optimization algorithms to
determine if the fully qualified objective found from LHS approaches any of the best performing shaped
concrete slabs in the design space.
The fully qualified design space enables further investigation between structural-acoustic trade-
offs. Trends between the geometric variables and the two objectives are analyzed, in addition to other
important characteristics in the model.

68
4.5 Relationships between design variables and objectives
The first exploration into the fully qualified design is to assess if there are any visible geometric
trends with the designs. A pair plot is created, as shown in Figure 4-16, pairing each of the geometric
variables against each other. The global x and y axes have the nine geometric variable names, while the
local x and y axes have the bounds for each geometric variable. The main diagonal plots show the
distribution of designs with the geometric variable. The bars in the main diagonal plots correspond to the
occurrence in which the designs have certain geometric features, for example, the number of shaped slabs
with 6 ribs.

69
Figure 4-16: Pair plot of the geometric variable distribution for the fully qualified designs obtained by LHS.
Several trends in the design space are revealed. First, larger top slab thicknesses in shaped concrete
slab, tend to increase the trend of full qualification, as they are more likely to pass the structural strength
checks. The second geometric trend is as the mid-depth increases (i.e. shapes into the slab), the less likely
the slab will become qualified. This is also instinctive because of the structural design checks, specifically
the clear cover check. If a short cross section is generated from the model, then it is likely that there is not

70
enough vertical distance to provide adequate clear cover. The other variables do not show clear trends, as
their pair plots show equal or binomial distributions.
The next analysis will be conducted between the geometric variables and the objective functions
of structural mass and STC. Each variable was investigated to determine the effect that it had on the primary
objectives of structural mass and STC. Most of the geometric variables did not have a direct relationship
with the two objectives. A summary of the findings can be seen below in Table 4.2.
Table 4-2: Relationships between geometric variables and objectives.
Geometric Variable Effect on Objective
Structural Mass Sound Transmission Class
Rib Number No Relationship No Relationship
Top Slab Thickness Linear Relationship (+) Non-Linear Relationship (+)
Rib Depth No Relationship Linear Relationship (+)
End Taper 1 No Relationship No Relationship
End Width 1 No Relationship No Relationship
End Taper 2 No Relationship No Relationship
End Width 2 No Relationship No Relationship
Rib Mid-Depth Slight Relationship (+) Slight Relationship (+)
Rib Mid-Width Slight Relationship (+) Slight Relationship (+)
For a majority of the geometric variables, there are no relationships between the geometric variable
and the objectives. That is in part due to how each of the geometric variables have different contributions
to the shaped concrete slab geometry. Rib mid-depth and rib mid-width show slight relationships to
structural mass and STC. That is because as the variables are manipulated, they can increase or decrease
the geometric volume of the concrete slab leading to an impact on structural mass. However, these
observations are small and do not control the design of the shaped slab.
The rib depth has a broad linear relationship with structural mass as indicated in Figure 4-17. As
the rib depth increases, the structural mass generally increases. However, this relationship is not very
defined as structural mass is impacted by other geometric variables, specifically top slab thickness. The rib
depth does not have an apparent relationship with the structural mass when evaluating the sampled designs.

71
Figure 4-17: Structural mass versus rib depth for the fully qualified designs found by LHS.
The top slab thickness has an important role in the design of shaped concrete slabs. Top slab
thickness is the only geometric variable directly related to both objectives. There are some important trade-
offs with top slab thickness. The top slab thickness must meet minimum thickness requirements for ACI-
318 design checks, but also be reduced to limit the amount of structural mass the slab has. In addition, STC
is greatly impacted by the top slab thickness. The relationships between top slab thickness and the objectives
can be seen in Figure 4-18. The x-axis displays top slab thickness as it increases in the positive x-direction.
The y axis displays the two objectives.

72
Figure 4-18: Slab thickness vs objectives for the fully qualified designs found by LHS.
The relationship between slab thickness and structural mass is generally linear, but there is some
variation as mass can be distributed more significantly in the slap or in the curved ribs. The relationship
between slab thickness and STC is slightly more complex, due to various acoustic phenomena. As the slab
thickness increases, STC logarithmically increases. However, there are a couple of regions that break the
trend shown in Figure 4-18 when slab thickness is around 0.30 m and 0.35m. From a slab thickness of 0.10

73
m to 0.30 m, the relationship between slab thickness and STC is a positive logarithmic relationship. Yet
once the slab thickness reaches 0.30 m, there is a small region with equivalent or lower STC ratings. Yet
following this region, the slab thickness and STC relationship increases non-linearly. From a slab thickness
of 0.35 m to 0.40 m, a region exists where slab designs have high STC ratings. This region corresponds to
the region seen in Figure 4-15 and in earlier plots where the slab’s coincidence frequency falls below the
frequency range accounted for by the STC metric. This results in high STC ratings.
Flexural rigidity was also plotted as shown in Figure 4-19 to evaluate how it impacts the analytical
transmission results. Flexural rigidity, or stiffness, contributes to the coincidence region previously
discussed in Chapter 2. It has contributions from both the top slab and the stiffener, or the shaped rib as
seen in Equation 4.1 provided below. Both contributions to the flexural rigidity are impacted by different
variables and properties which contribute to the overall behavior.
𝐷 = 𝐷𝑇𝑜𝑝 𝑆𝑙𝑎𝑏 + 𝐷𝑆𝑡𝑖𝑓𝑓𝑒𝑛𝑒𝑟 = 𝐸ℎ0
3
12(1−𝜈2)+
𝐸𝑠𝑡𝑖𝑓𝑓𝑒𝑛𝑒𝑟 𝐼𝑠𝑡𝑖𝑓𝑓𝑒𝑛𝑒𝑟
∆𝑠𝑡𝑖𝑓𝑓𝑒𝑛𝑒𝑟 (Equation 4-1)
Figure 4-19: Relationship between flexural rigidity and STC for the fully qualified designs found by LHS.
As seen in Figure 4-19, the relationship between flexural rigidity and STC mirrors the relationship
between slab thickness and STC found in Figure 4-18. To further evaluate the relationship between flexural
rigidity and STC, both the top slab’s and rib’s stiffness contributions are investigated. As noted in Equation

74
4-1, the top slab and rib have different variables that impact the flexural rigidity. That is why the top slab’s
and rib’s stiffness contribution is plotted separately in Figure 4-20.
Figure 4-20: Comparison of the top slab’s and rib’s contributions to the flexural rigidity.
Figure 4-20 shows that the slab’s flexural rigidity contribution mirrors the relationship of interest.
The plot also shows that the top slab provides more to the flexural rigidity than the rib, as the rib contributes
a smaller fraction of the combined flexural rigidity. The top slab’s contribution to the flexural rigidity is
dependent on the top slab’s modulus of elasticity, Poisson’s ratio, and top slab thickness. Modulus of
elasticity and Poisson’s ratio are both parameters in the model and are held constant. These values can be
found in Table 3-2. Therefore, the top slab’s contribution to flexural rigidity is only dependent on the top
slab thickness, which is a cubic relationship. The cubic relationship between the top slab thickness and the
slab’s contribution to the stiffness can be seen in Figure 4-21 below. Similarly, the top slab thickness has a
cubic relationship with the total flexural rigidity as displayed in Figure 4-22.
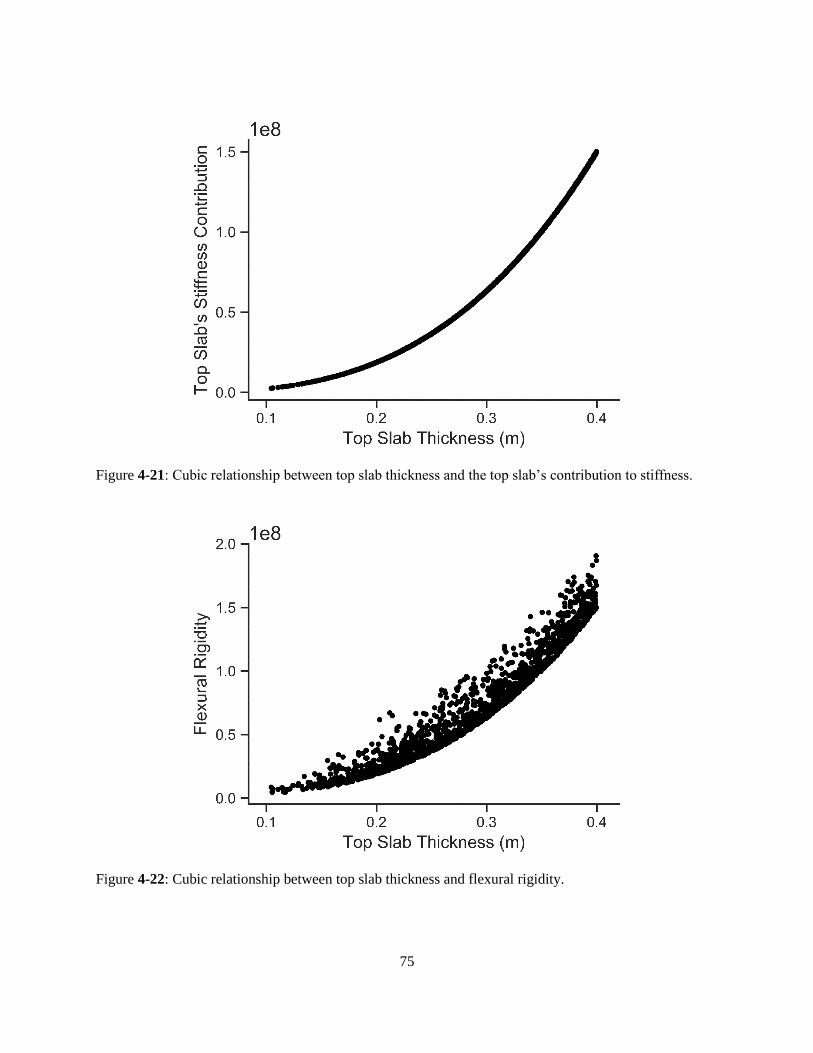
75
Figure 4-21: Cubic relationship between top slab thickness and the top slab’s contribution to stiffness.
Figure 4-22: Cubic relationship between top slab thickness and flexural rigidity.

76
Because of the cubic relationship in flexural rigidity and the frequency range evaluated by STC, a
region exists that quickly increases in STC rating. This is intuitive because the stiffness impacts the
coincidence region discussed in Section 3.3.2. The non-linear relationship also ties back to Section 4.3, as
the sampled objective space was clustered by coincidence frequency. The fully qualified designs in the
objective space had coincidence frequencies up to 160 Hz, which is close to when the coincidence dip starts
to break down in Figure 4-22. Since STC incorporates the frequency range from 125 Hz to 4,000 Hz, which
includes a portion of the shaped concrete slab’s coincidence region, it is generating this region.
4.6 Discussion
Sampling of the design space reveals several important structural-acoustic trade-offs. While an
increase in structural mass increases the chance for higher acoustic performance, it does not guarantee it.
There are many slab designs with high structural mass but low acoustic performance, depending on how
this material is distributed. While it can be effectively used for estimating transmission loss in other cases,
mass law was not able to distinguish between designs with the same mass density but different geometric
features, and it is thus unable to inform shape at this resolution. The analytical transmission model can
discern performance implications between the slabs due to the incorporation of mass, stiffness, damping,
and other acoustic parameters. While it captures higher resolution relationships, the analytical transmission
model is ideal for a fast but accurate acoustic evaluation.
The type of steel reinforcement showed no clear trend in the objective space from a rating of STC-
40 to STC-55. Above a rating of STC-55, the slab designs with high acoustic performance and the least
amount of structural mass have larger rebar sizes. As discussed previously, the shaped slab’s geometry
provides the estimate for the steel reinforcement sizing. However, the estimate may require future
improvements due to the complications of sizing steel rebar in a shaped slab compared to a rectilinear slab.
This could further the initial finding when clustering the objective space by steel reinforcement size.
Engineering judgement is also relied on in the sizing of steel reinforcement in a concrete slab. Therefore,
this suggests that further into the design phase a designer could manipulate the sizing of the shaped concrete
slab. If the designer had a steel reinforcement size in mind, the designer could iterate through generations
of the design space until a desired shaped concrete slab geometry, structural mass, acoustic performance,
and reinforcement size is achieved. Chapter 5 discusses the iteration of shaped concrete slab generations
using two optimization methods.

77
Another important observation is that the acoustic metric of sound transmission class does not fully
capture the structural-acoustic interaction at frequencies below 125 Hz. This means that STC is biased
towards designs with low coincidence frequencies. Then again, the shaped concrete slabs are being
investigated for speech transmission loss. Sounds around 100 Hz are often more associated with structural-
borne sounds such as “thumps” or music with lots of bass. Impact insulation class could be a solution to
investigate structural-borne sounds, however the metric does not evaluate low frequency airborne sound
transmission generated. When STC does incorporate a frequency range to 100 Hz, the region flattens out,
as seen in Appendix B. This suggests that an acoustic metric that provides a full evaluation of airborne
sounds from low to high frequencies may be more gradual.
Sound transmission class smears an important relationship between the structural mass and
stiffness. There is a region that breaks the positive logarithmic trend between stiffness and STC due to the
coincidence region. The coincidence region is not visible on the objective space yet understanding that the
non-linear relationship exists is critical for obtaining a high-performance shaped concrete slab.
The fully qualified objective space found from sampling also suggests where the Pareto front occurs
in the investigation of structural-acoustic trade-offs of shaped concrete slabs as seen in Figure 4-23. The
Pareto front is a collection of the non-dominated slab designs for which one objective cannot be improved
without a decrease in performance for the other. The Pareto front is only suggested in LHS, as the designs
in the objective space may not be the best performing designs. The next chapter details an automated
evolutionary method for approximating the Pareto front in the design space in addition to a gradient method
that converges to the best designs from a set of constraints. Additionally, the best shaped slabs found from
the two methods are found and compared to layered floor constructions.

78
Figure 4-23: The LHS objective space estimate of the Pareto front.

Chapter 5
Structural-Acoustic Optimization of Curved Shaped Slabs
This chapter discusses two approaches to automatically find the best shaped slab designs in the
design space: multi-objective optimization and constrained optimization. Multi-objective optimization
(MOO) utilized a genetic evolutionary algorithm to progressively approximate the set of non-dominated
designs. The algorithm finds high-performance shaped slabs by mutating through many generations each
with a set population of designs. The Pareto front was investigated to obtain trade-offs between the
geometric variables and the objectives. Constrained optimization utilized a gradient algorithm to find the
best shaped slab designs by minimizing the structural mass while constraining the acoustic objective. The
shaped slab designs with STC-50, STC-55, STC-60, and STC-65 were found. The best shaped slabs found
by constrained optimization outperformed the best shaped slab designs found by MOO. This section thus
also provides a brief discussion of the differences between MOO and constrained optimization and their
relative merits.
After the best shaped slab designs were identified for each acoustic performance level, the shaped
concrete slab designs were compared to non-shaped floor constructions with known good acoustic
performance. The purpose of this comparison was to determine the overall benefits of designing with a
shaped concrete slab.
5.1 Multi-objective optimization
Multi-objective optimization (MOO) was implemented using NSGA-II, a population of 100
designs, and 50 generations. These values were selected based on a common timescale appropriate for a
design simulation in practice. The Pareto front obtained by MOO outperforms the Pareto front suggested
from Latin Hypercube Sampling (LHS), as later generations converge to a higher density, higher
performance Pareto front. The results of MOO produced the bi-objective plot provided in Figure 5-1. The
plot limits match the figures in Chapter 4 for ease of comparison. A white-to-black gradient was applied to
the objective space to illustrate how the more generations that MOO iterated through, the closer MOO
converged on the Pareto front.

80
Figure 5-1: Objective space of the MOO results with penalty functions.
MOO was conducted on the two objectives, structural mass and STC, while incorporating the
structural strength and design checks. Instead of coding the algorithm to immediately remove any design
that fails a check, non-linear (except for the clear cover check) penalty functions were generated for each
structural check and added to the overall structural mass. The purpose of the penalty function
implementation was to allow NSGA-II to work through the entire design space – even designs that fail to
converge to the best performing designs that pass all structural and acoustic checks. MOO can also identify
slab designs that fail a structural check by a small margin. This allows the designer to look over these nearly
passable designs to determine if editing a property of the slab design, like the size of steel reinforcement,
deems the design as a fully qualified design.
Since each structural strength check had calculations for the percent error that the design had to
meet, the penalty function for these checks was based on the percent failed for that check (Equation 5-1).
However, the structural design checks needed unique penalty functions due to how the check is conducted.
The minimum top slab thickness penalty function was based on how much the slab thickness fails by
(Equation 5-2). The effective flange width penalty function was determined based on how much the flange
width was short by (Equation 5-3). The clear cover penalty function was calculated according to the number
of cross sections that did not maintain the specified clear cover (Equation 5-4).

81
𝐼𝑓 𝑑𝑒𝑠𝑖𝑔𝑛 𝑓𝑎𝑖𝑙𝑒𝑑 𝑠𝑡𝑟𝑢𝑐𝑡𝑢𝑟𝑎𝑙 𝑐ℎ𝑒𝑐𝑘: 𝑃𝑒𝑛𝑎𝑙𝑡𝑦 = (% 𝑒𝑟𝑟𝑜𝑟)3 (Equation 5-1)
𝐼𝑓 𝑑𝑒𝑠𝑖𝑔𝑛 𝑓𝑎𝑖𝑙𝑒𝑑 𝑡𝑜𝑝 𝑠𝑙𝑎𝑏 𝑡ℎ𝑖𝑐𝑘𝑛𝑒𝑠𝑠 𝑐ℎ𝑒𝑐𝑘: 𝑃𝑒𝑛𝑎𝑙𝑡𝑦 = (1
𝑡ℎ𝑖𝑐𝑘𝑛𝑒𝑠𝑠)
3 (Equation 5-2)
𝐼𝑓 𝑑𝑒𝑠𝑖𝑔𝑛 𝑓𝑎𝑖𝑙𝑒𝑑 𝑓𝑙𝑎𝑛𝑔𝑒 𝑤𝑖𝑑𝑡ℎ 𝑐ℎ𝑒𝑐𝑘: 𝑃𝑒𝑛𝑎𝑙𝑡𝑦 = (𝑡ℎ𝑖𝑐𝑘𝑛𝑒𝑠𝑠𝑟𝑒𝑞 − 𝑡ℎ𝑖𝑐𝑘𝑛𝑒𝑠𝑠𝑝𝑟𝑜𝑣)3 (Equation 5-3)
𝐼𝑓 𝑑𝑒𝑠𝑖𝑔𝑛 𝑓𝑎𝑖𝑙𝑒𝑑 𝑐𝑙𝑒𝑎𝑟 𝑐𝑜𝑣𝑒𝑟 𝑐ℎ𝑒𝑐𝑘: 𝑃𝑒𝑛𝑎𝑙𝑡𝑦 = (𝐹𝑎𝑖𝑙𝑒𝑑 𝐶𝑟𝑜𝑠𝑠 𝑆𝑒𝑐𝑡𝑖𝑜𝑛𝑠 ∗ 1000) (Equation 5-4)
Since the penalty functions were incorporated in the MOO algorithm and applied to the structural
mass objective, a final step was required to filter out designs if they were not fully qualified. Therefore, any
design that had additional structural mass from the penalty function was identified as an unqualified design
at its actual structural mass in Figure 5-2.
Figure 5-2: The fully qualified designs found by MOO.
Aside from the small cluster of fully qualified designs at low acoustic performance levels, the trends
found in the sampled objective space hold true when using MOO. The genetic evolutionary algorithm did
push the objective space further left; or found the best acoustic performing designs with minimal structural
mass. There was a broad trend that as the structural mass increased, the acoustic performance increased.
There are two regions in which the acoustic performance increases with little increase in structural mass,
from STC-50 to STC-55 and STC-56 to STC-75. There is a wide gap between the best performing designs

82
from STC-55 to STC-56, which was investigated by plotting the slab’s one-third octave band coincidence
frequency.
Investigation of the sampled designs’ coincidence frequency shown in Figure 5-3 explained that
the gap occurs in the objective space due to STC’s frequency range of 125 Hz to 4,000 Hz. If the design
has a coincidence dip below 125 Hz, then the coincidence dip was not accounted for by the STC metric.
This explains why the STC rating greatly improves with little increase in structural mass from STC-56 to
STC-75. The gap between STC-55 and STC-56 seems to be due to a shift in coincidence frequency between
100 Hz and 160 Hz, as the gap is characterized by multiple coincidence frequencies. It should be noted that
the TL values for the slabs were calculated at a 1 Hz interval and then binned at one-third octave band
center frequencies.
Figure 5-3: Investigation of the coincidence frequencies for the MOO designs.
Figure 5-3 shows that the region with the largest increase of acoustic performance with little
increase in structural mass is classified as having coincidence frequencies at 100 Hz and therefore the
coincidence dip is not accounted for by STC, as revealed in Section 4.3. Again, STC does not quantify low
frequency airborne sound, and is therefore not portraying the slabs’ full acoustic performance. The slabs in
the region will have good acoustics for speech transmission, but the objective space suggests that another
acoustic metric that incorporates lower airborne frequencies should be utilized to quantify the acoustic
performance.

83
MOO also found that the objective space was characterized by the three one-third octave band
center frequencies found in the LHS objective space; 100 Hz, 125 Hz, and 160 Hz. As mentioned in Section
4.3, there is generally a decrease of coincidence frequency as the structural mass increases. Therefore, the
reverse is true as well; as structural mass decreases, the coincidence frequency increases. However, there
is a region in the MOO objective space that exists between the best performing designs between STC-55
and STC-56 that is categorized by a coincidence frequency of 160 Hz. This appears to break the trend that
as structural mass increases the coincidence frequency decreases; but these slab designs were found to have
coincidence frequencies near the one-third octave band bounds from 125 Hz to 160 Hz. This meant that the
STC rating was slightly higher as the slab design had a coincidence frequency between the one-third octave
bands.
The objective space found by MOO was also investigated by grouping the designs by the
longitudinal steel reinforcement size. Figure 5-4 found similar results from LHS as discussed in Section
4.2. As the bar size increased, the potential for better slab designs with low structural mass and high acoustic
performance increased. The small group of designs between STC-50 and STC-55 are not categorized as
having large steel reinforcement sizes; they were all found to have rebar sizes between #5 to #7 bars. This
hints that the best performing shaped slab designs at low acoustic performance levels have smaller steel
reinforcement compared to the best performing shaped slab designs at high acoustic performance levels.
Figure 5-4: Investigation of steel reinforcement sizing for the MOO designs.

84
After identifying the fully qualified designs and validating the trends seen in the objective space,
the Pareto front was found. The Pareto front identifies the designs that are non-dominated in the objective
space, which are classified with minimizing structural mass while maximizing acoustic performance. The
Pareto front with cross sections for the best performing slabs at STC ratings of 50, 55, 62, and 65 can be
seen in Figure 5-5. The 3-dimensional models of these shaped slabs are shown in Figure 5-6.
Figure 5-5: Identification of the best shaped concrete slab designs found by MOO at each acoustic
performance level.
Figure 5-6: 3-Dimensional models of the five shaped concrete slabs from Figure 5-5.

85
The 3-dimensional slab design visuals of the best performing designs according to the MOO
simulation, show that as the top slab thickness increases, the acoustic performance increases. This leads to
the question; how do the geometric variables impact objective performance? To address the question, the
geometric variables for the best performing designs found by MOO were investigated against each other as
indicated in Figure 5-7. This was to see if there are any geometric similarities between the best shaped
concrete slabs.

86
Figure 5-7: Pair plot of the geometric variable distribution for the best performing slab designs found by
MOO.
In comparison to the pair plot findings from LHS, the pair plot findings of the designs found by
MOO are significant. Figure 5-7 found that there are preferences for most of the geometric variables that
NSGA-II pushed the designs towards. The tendencies shown in Figure 5-7 are listed in Table 5-1 shown
below.
Table 5-1: Geometric variable tendencies in the Pareto front found by MOO.
Geometric Variable Tendency
Rib Number 4 – 6 ribs
Slab Thickness > 0.350 meters
Rib Depth < 0.080 meters or > 0.350 meters
End Width 1 Medium end width
End Taper 1 Low or high end taper
End Width 2 Low or high end width
End Taper 2 Low end taper
Rib Mid-Depth 0.020 – 0.040
Rib Mid-Width > 0.600 meters
A comprehensive discussion regarding how the geometric variables’ impact on the two objectives
can be found in Section 4.5. Figure 5-8 shows the results when investigating the geometric variable of
slab thickness to the two objectives, structural mass and sound transmission class.

87
Figure 5-8: Slab thickness versus objectives for the best performing slab designs found by MOO.
The above figure shows that as the structural mass increases, both structural mass and STC increase
for the designs in the Pareto front found by MOO. The relationships are broadly linear except for the
extreme top slab thicknesses. This correlates to the designs in the region of the objective space with high
increase in acoustic performance with low increase in structural mass. Top slab thickness also suggests that
depending on the desired design performance, there is some flexibility in the geometry of the design. One
important observation is that there are gaps in Figure 5-8. This is partially due to the smaller number of
designs that are plotted, as only the best performing shaped slab designs found by MOO were evaluated.
The larger reason is that the gaps relate to specific top slab thickness values as seen in Figure 5-9. Three
slab thickness regions exist when evaluating the best performing shaped slabs; a region around a top slab
thickness of 0.17 m, a second region around a top slab thickness of 0.28 m, and a third region when the top
slab thickness exceeds 0.35 m.

88
Figure 5-9: Comparison of the best performing slab designs found by MOO to the fully qualified designs
found by LHS.
In the exploration of the geometric variables in the sampled design space in Section 4.5, it was
noted that there is a region of high acoustic performance at high top slab thickness values. This region was
generated as a result of the structure’s coincidence region being impacted by the top slab thickness. In the
lens of the best performing shaped slabs found by MOO, this result was further validated. Figure 5-10
shows that NSGA-II pushes the best slab designs as far left without significantly reducing the acoustic
performance, as the relationship with coincidence frequency for the MOO slab designs explains the region.
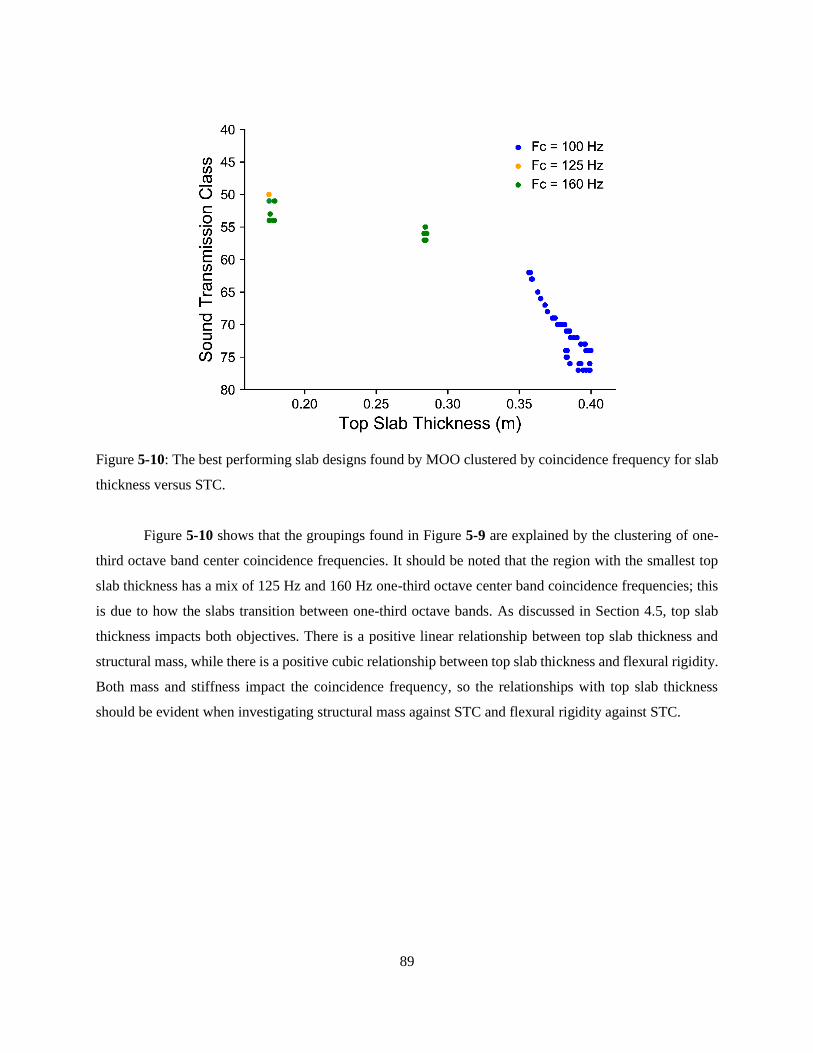
89
Figure 5-10: The best performing slab designs found by MOO clustered by coincidence frequency for slab
thickness versus STC.
Figure 5-10 shows that the groupings found in Figure 5-9 are explained by the clustering of one-
third octave band center coincidence frequencies. It should be noted that the region with the smallest top
slab thickness has a mix of 125 Hz and 160 Hz one-third octave center band coincidence frequencies; this
is due to how the slabs transition between one-third octave bands. As discussed in Section 4.5, top slab
thickness impacts both objectives. There is a positive linear relationship between top slab thickness and
structural mass, while there is a positive cubic relationship between top slab thickness and flexural rigidity.
Both mass and stiffness impact the coincidence frequency, so the relationships with top slab thickness
should be evident when investigating structural mass against STC and flexural rigidity against STC.

90
Figure 5-11: The best performing slab designs found by MOO clustered by coincidence frequency for
structural mass versus STC and flexural rigidity versus STC.
Figure 5-11 shows that the linear and cubic relationships with top slab thickness generally hold true
when investigating structural mass, flexural rigidity, and STC. There are still gaps between the coincidence
frequencies in the plot of flexural rigidity versus STC. As explained in Section 4.3, when the coincidence
dip deepens, the STC decreases significantly. Therefore, when the slab’s coincidence frequency approaches
a one-third octave center frequency, STC decreases.
These plots reveal several questions about the utility of STC for bi-objective optimization and its
ability to capture all airborne sound phenomena in buildings. STC appears to penalize the slab designs with
a coincidence frequency near the one-third octave center frequencies. A higher frequency resolution level
may also level out the gaps identified in Figure 5-11. Appendix B discusses an iteration of MOO when
STC evaluates a frequency range of 100 Hz to 4,000 Hz. The large gap seen in this section is shrunk when
STC evaluates lower frequencies but does converge to a completely gradual Pareto front. Future research
may determine if a different acoustic metric with a broader frequency range and a finer frequency resolution
should be utilized.
Multi-objective optimization using the evolutionary genetic algorithm of NSGA-II has shown to
extend the Pareto front well past the suggested Pareto front found by LHS. These designs are among the
best designs that the model can obtain. However, if there was manual input for certain parts of the design,
such as selecting the steel reinforcement, would there be designs that outperform the designs found by
NSGA-II? Another optimization method, called constrained optimization, will be utilized to find these
designs.

91
5.2 Constrained optimization
After conducting multi-objective optimization, constrained optimization was conducted using the
gradient-free algorithm COBYLA, through the Radical component from the Design Space Exploration
plug-in for Grasshopper. Constrained optimization was iterated four times; once for each acoustic level.
These designs are then compared to the best designs found from MOO as seen in Figure 5-12. The 3-
dimensional models of the shaped concrete slab designs obtained by constrained optimization are shown in
Figure 5-13.
Figure 5-12: Comparison of the best designs found from constrained optimization and multi-objective
optimization.

92
Figure 5-13: 3-Dimensional models of the best shaped concrete slabs obtained by constrained optimization.
Figure 5-12 shows that all slab designs obtained using constrained optimization perform better than
the best slab designs obtained from MOO, at least at the resolutions afforded by the objective functions.
The shaped slabs that constrained optimization found at the high acoustic performance levels significantly
outperform the MOO slab designs. A large part of this difference can be explained by the manual selection
of steel reinforcement for each constrained optimization iteration, instead of incorporating the steel sizing
estimate approach based on the slab’s geometry.
The steel reinforcement is estimated based on the minimum reinforcement ratio obtained by the
slab’s geometry and set structural constraints. This has great benefits when evaluating the design space
using LHS and MOO, as the number of designs that pass the structural strength checks regarding the
longitudinal steel reinforcement ratios is significantly higher compared to when LHS and MOO are run
with the longitudinal steel reinforcement size held constant or is based on the largest moment experienced
along the rib’s length. More qualified designs improve design exploration and evaluation of slab’s objective
performance. However, the longitudinal steel reinforcement estimator may be disqualifying potential
sustainable design solutions with an estimated low or high amount of steel reinforcement.
Through several permutations of constrained optimization simulations, the best performing shaped
slabs were found when the steel reinforcement size was constant and not estimated based on the shaped
slab’s geometry. The iterations found shaped slab designs that have strikingly different geometric features,
suggesting that the steel reinforcement ratio was biased against slab designs with these geometries.
Constrained optimization converges towards the shaped slab designs that minimize structural mass while

93
maintaining all structural strength and design checks and a set STC rating. These shaped slab designs are
typically controlled by maximum and minimum steel reinforcement ratios and the moment capacity. With
a specified longitudinal steel reinforcement size, the optimization converges towards reducing any
excessive structural material while maintaining all structural requirements; or simply reduce the amount of
structural mass while upholding a specific STC rating without compromising a ductility or flexural check.
This emphasizes the importance of specifying the steel reinforcement size once a desired STC rating is
known, or a specific shaped slab geometry is preferred.
Further research should be conducted to compare the steel reinforcement estimators steel sizing to
structural concrete design software programs. These comparisons would put the steel reinforcement
estimator into context with expectations for a typical concrete slab design. The comparisons could also
suggest how to refine the steel reinforcement sizing estimation. Simulations of LHS and MOO with a more
developed estimator could find shaped slab designs that outperform the best performing shaped slab designs
documented in Sections 4.4 and 5.1, potentially converging towards the shaped slab designs found by
constrained optimization.
Another limitation with MOO is that there was a set population and generation size for MOO. For
this research, MOO was run using a population size of 100 and 50 generations. The population and
generation size were selected to resemble the simulation time of LHS. However, with unlimited
computational time, a higher population and generation size would facilitate MOO to discover the true
Pareto front in the objective space. Constrained optimization uses COBYLA, which is a more efficient
algorithm than MOO’s algorithm, NSGA-II. COBYLA uses successive linear approximations of the
objective function performance and constraints to converge to the best designs instead of an evolutionary
genetic algorithm that quickly works through the objective space. However, constrained optimization takes
approximately 40 minutes to converge to one best performing shaped slab design. To find the true Pareto
front in a design space using constrained optimization, around 20 constrained optimizations would need to
be performed. This indicates that MOO has an advantage over constrained optimization as it can converge
to the potential best performing design solutions found by MOO in one iteration.
Now that the best slab designs have been found for the four acoustic performance levels STC-50,
STC-55, STC-60, and STC-65, the next intuitive question is how well do the best slab designs compare to
other floor constructions? The following section aims to contextualize the potential benefits of shaping
concrete slabs by comparing them to layered floor constructions with known acoustic performance.

94
5.3 Comparison to layered floor constructions
To evaluate the best shaped concrete slabs obtained from optimization and put them into context
with other floors, the best shaped slabs were compared to common building floor systems with known STC
ratings (Long, 2014). Five floor constructions will be used for the comparison, each with varying
construction materials and acoustic performance. The table below details the constructions of these floors.
The five floors have the following acoustic performances based on experimental laboratory measurement,
STC-50, STC-55, STC-60, STC-60, and STC-84. The two STC-60 floors differ greatly in material
construction, which adds breadth to comparing the shaped slabs to these floors. To help identify trends in
the investigations, the Pareto Front designs obtained by MOO are included in the figures below.
Table 5-2: Floor constructions with known measured acoustic performance (Long, 2014).
Floor
Construction
Sound
Transmission
Class
Materials
STC-50
LW Concrete Slab (3.5")
Metal Deck (1.5")
Fireproofing (3/4")
STC-55
Metal Deck (1.5")
16" Air Space
Gypsum Board (5/8")
Resilient Channel
STC-60
LW Concrete Slab (3.5")
Metal Deck (1.5")
Fireproofing (3/4")
16" Air Space
Mineral Tile in T-Bar (5/8")
STC-60
LW Concrete Slab (2.5")
Metal Deck (1")
Steel Joists (9.6" @ 24" O/C)
Neoprene Clips
Gypsum Board (5/8") x2
Resilient Channel

95
STC-84
Concrete Slab (6")
Steel Reinforcement
Fiberglass Insulation
1" Spring Isolator
Gypsum Board (5/8") x2
Four different comparisons were made between the floor types: structural mass of concrete vs STC;
max depth of floor vs STC; normalized cost vs STC; and embodied carbon vs STC. These comparisons
were selected based on additional criteria that designers consider in building design.
Figure 5-14: Investigation of structural mass of concrete and sound transmission class.
Figure 5-14 shows the comparison of the amount of structural mass of concrete between the best
shaped concrete slab designs and the floor constructions, the shaped slabs have a clear disadvantage. At
least 97% of the shaped slab’s volume consists of concrete, in comparison to the layered floor constructions
with minimal concrete. The higher performing layered floors have a variety of other materials that decreases
the need for additional concrete mass. To further compare the two floor types, the maximum depth of the
floor was evaluated.

96
Figure 5-15: Investigation of max depth of floor and sound transmission class.
Figure 5-15 indicates that for shaped concrete slabs, the maximum floor depth is the distance from
the top of the slab to the bottom of the shaped rib. However, the best performing shaped slab designs do
not necessarily minimize floor depth. This is partially due to the optimization methods minimizing the
objectives and not the geometric variables. That is why there is variability in where the shaped concrete
slabs are mapped. Note that aside from the composite floor construction, all other floors have a maximum
floor depth of around 0.4 m or higher. This indicates that if high acoustic performance is desired, the floor
depth will be large. Floor depth is of architectural importance, especially for high-rise residential buildings.
The larger the floor depth is, the greater the impact it has on the high-rise buildings.
With the structural mass and floor depth recommending different floor systems, the design’s cost
is the next objective that is investigated. Specifically, the floor’s normalized material cost is compared to
the floor’s acoustic performance.

97
Figure 5-16: Investigation of the floor’s normalized material cost and sound transmission class.
The approximate cost of the floor construction was determined using the 2020 National Contractor
Estimator provided by Craftsman (Pray, 2020). The estimator provided detailed material cost for common
construction materials. The material cost was determined for all floors and then normalized by the floor
with the least amount of material cost, which was the composite floor. The normalized material cost was
evaluated against STC with the results shown in Figure 5-16. The material cost had to be interpreted and
estimated for some of the layered floor materials such as the neoprene clips and the 1” spring isolator. This
is partially due to unique building materials used in the floor construction to provide good acoustic
performance. It is also due to the layered floor materials not having specific call outs. Therefore, certain
materials had to be estimated based on the known material cost for similar materials.
An important exclusion in the cost analysis is the cost of labor. This is because there is wide
variability in the labor needed for the floor constructions. The layered floor constructions vary in labor cost
due to the unique construction of each floor. The cost of labor for shaped concrete slabs is even more
complex. Shaped concrete slabs are not currently common in practice and would require experts in concrete
slab construction to build the slabs. The cost of transportation for the floor constructions is also not provided
due to great variability between materials and construction of the floor types.
The evaluation of the normalized material cost suggests that the layered floor constructions
dominate except at the highest acoustic performance level. This is intuitive because the majority of the

98
layered floor construction materials is common and readily available in the construction industry. However,
shaped slab designs provide other advantages that layered floors cannot provide as previously mentioned.
To further evaluate the floor types, the sustainability characterized by the amount of embodied carbon of
each floor design is evaluated.
Figure 5-17: Investigation of floor embodied carbon and sound transmission class.
Both layered and shaped concrete slabs provide embodied carbon advantages, but at different
acoustic performance levels as shown in Figure 5-17. At STC-50, the composite floor system has less
embodied carbon than the shaped slab, although the embodied carbon totals are comparable. At STC-55,
the shaped concrete slab beats out the layered floor construction in terms of the embodied carbon. At STC-
60, the layered floor without the steel joists has the least amount of embodied carbon. However, the layered
floor with the steel joists has significantly more embodied carbon than the shaped concrete slabs. Above
STC-60, the shaped concrete slabs linearly increase in embodied carbon. The layered floor construction
with STC-84 clearly has the most embodied carbon of all of the floors, indicating that shaped slabs may
have a significant sustainable advantage at higher acoustic performance levels.
The embodied carbon was determined for the floors using the ICE database (Jones et al., 2011).
The database includes embodied carbon for different materials and constructions, yet it does not have the
embodied carbon totals for all materials. This limits the accuracy of the embodied carbon totals for the

99
floors, especially the layered floor constructions. Little information is provided outside of what is displayed
in Table 5-2. The materials are also not specific, further limiting the embodied carbon calculation. However,
the ICE database had enough information to interpolate the embodied carbon for the layered floor materials
not shown in the database.
A major takeaway from the above comparisons is that there are advantages and disadvantages to
every design. There is no single design between the shaped concrete slabs and the floor constructions
analyzed that dominate all the explored objectives. A summary of the trade-offs is provided in Table 5-3.
Table 5-3: Summary of the floor types to different design objectives.
Objective STC Recommended Floor Type
Structural Mass of
Concrete
STC-50 Composite Floor Construction
STC-55 Layered Floor Construction
STC-60 Layered Floor Construction
STC-65+ Layered Floor Construction
Max Floor Depth
STC-50 Composite Floor Construction
STC-55 Shaped Concrete Slab
STC-60 Layered Floor Construction
STC-65+ Layered Floor Construction
Normalized Material Cost
STC-50 Composite Floor Construction
STC-55 Layered Floor Construction
STC-60 Layered Floor Construction
STC-65+ Shaped Concrete Slab
Embodied Carbon
STC-50 Composite Floor Construction
STC-55 Shaped Concrete Slab
STC-60 Layered Floor Construction
STC-65+ Shaped Concrete Slab
The above summary table shows that there is not a clear floor type that dominates the design
objectives at medium to high acoustic performances. The composite floor construction is consistently
preferred for all of the evaluated objectives, yet this floor type is only for acceptable acoustic performance.
At higher acoustic performances, the recommended floor type varies greatly. Due to the variety of
recommended floor types at high acoustic performances, the designer must evaluate the importance for

100
each of the above objectives. In addition to the objectives above, there are other critical assumptions made
for the shaped concrete slabs that may not be made for the layered floor constructions.
It should be noted that there are several limitations to the comparison between shaped concrete
slabs and layered floor constructions. First, the floor types do not have the same structural strength. The
shaped concrete slabs are fully qualified for the ACI-318 structural strength and design checks previously
discussed. These checks are meaningful, as they imply structural integrity for the shaped slab’s self-weight
and the residential live load. The layered floor constructions, though common in residential buildings, may
not have the same structural strength as the shaped concrete slabs.
In order for the layered floors to have the acoustic performance referenced above, the layered floors
must be constructed with specific floor materials. Not only are specific materials necessary, this evaluation
assumes that the floor is constructed correctly otherwise the layered floor will have sound leaks and sound
flanking. Sound leaks and sound flanking are a big acoustic problem that reduces the amount of sound
transmission provided by a structure. Sound leaks and sound flanking are often related to poor construction
of building structures. The shaped concrete floor must be constructed accurately as well, but advanced
construction technology enables a shaped concrete slab to be precisely constructed. Yet layered floor
construction is typically performed by manual labor. The floor area is also critical in the comparison of the
floor systems. The shaped concrete slabs are optimized with a slab area constant at 36 m2. This is a large
area, which is why concrete slabs are advantageous in bigger structures. Layered floor constructions may
need to be reinforced or redesigned to span the same area, therefore changing the comparison between the
floor systems.
Even though this comparison is uneven, there is valuable information from the initial assessment
of shaped concrete slabs to layered floor systems. The recommendations above provide the designer with a
good basis on when to incorporate floor types such as shaped concrete slabs. If the designer is evaluating
floor types for a sustainable high-rise residential building with high building acoustic performance, then a
shaped concrete slab would be the recommended floor type. A potential solution could be to combine
concrete slab shaping and layering to obtain a floor system that dominates the above four objectives while
maintaining high acoustic performance. The combined floor system would need to maximize the benefits
of each floor type to be a meaningful design solution yet could have sustainability benefits. The combined
floor system should be a focal point of future research in this field.

101
5.4 Discussion
This chapter refines the trends observed from sampling the design space. The comparison between
the best shaped concrete slabs and the floor constructions provides further understanding into how well
these slabs perform and suggests when they might be incorporated in residential building design. It also
suggests that a combination of shaping and layering may ultimately be the highest performing design
strategy in construction contexts that have easy access to materials beyond concrete.
The two design space exploration techniques validated the broad finding from LHS, that as the
structural mass increases, there is a greater potential for better acoustic performance. Even though MOO
and constrained optimization are biased with the best performing designs, the original structural-acoustic
trade-off is validated. Additionally, shaped slabs were found with various acoustic performances to show
that the structural mass does increase as STC increased.
Multi-objective optimization was used to find the extent of the Pareto front as mapped on the
objective space. It was found that the Pareto front obtained by MOO does move farther left, meaning that
more structural mass was reduced in the best shaped concrete slab designs compared to the Pareto front
obtained by LHS. Constrained optimization then found significantly better performing designs, which can
be attributed to both a more directed algorithmic search, as well as a set longitudinal steel reinforcement
size. The best designs obtained also showed that there were geometric features in the slabs that were similar
across all the designs. The number of ribs, rib thickness, and curvature control points had clear biases to
one side of the bounds. This indicates that the better performing shaped concrete slabs have geometric
similarities. However, not all geometric variables are as biased. This provides the designer some geometric
and aesthetic flexibility.
The geometric variable of top slab thickness was also explored. It was discovered that the same
trends seen in the investigation of top slab thickness for the LHS fully qualified designs were similar to the
trends seen in the Pareto front designs obtained by MOO. Linear and cubic relationships were found
between top slab thickness against structural mass and flexural rigidity. Due to these strong relationships,
the top slab thickness has a significant impact on the coincidence dip. It was also seen that STC significantly
penalizes the slab designs with a deep coincidence frequency resulting in a poor acoustic performance.
Therefore, there are noticeable jumps between groups of Pareto front designs.
Sound transmission class evaluates the acoustic performance of the structure at one-third octave
center frequencies. This acoustic metric is accurate for quantifying the transmission of speech sound for
floors with uniform thickness, but the assumptions associated with STC may break down at a one-third
octave center frequency resolution for more complex geometry. As discussed in Section 5.3, STC is an

102
accurate acoustic metric for quantifying floors with uniform depth. Even with layered floor constructions,
STC is still accurate. However, for structures with elaborate geometries, this metric may not accurately
quantify acoustic performance. This could impact the comparison between shaped concrete floors and floor
constructions with known acoustic properties.
Additionally, a sensitivity analysis with the one-third octave center frequency of 100 Hz was
incorporated into the calculation of STC. LHS and MOO were used to determine how the objective space
differs with the addition of this one-third octave center frequency. As was expected, the knee found in the
original objective spaces flattens out as a result of STC capturing the coincidence dip.
The sensitivity analysis again questions the qualification of STC as the acoustic performance metric
for design exploration of concrete slabs. Considering that both air-borne and structural-borne sounds relate
to floor systems, a larger frequency range may need to be considered in future work. A potential solution
could be to evaluate a frequency range of 10 Hz to 4,000 Hz with decreasing frequency resolution as
frequency resolution increases. This means that a high frequency resolution should be used for low
frequencies, but a low frequency resolution can be used at high frequencies. This would capture the mass,
coincidence, and stiffness controlled regions at a good resolution. To simplify the transmission loss values
into one integer would be complicated and may require the development of an innovative elaborative
metric.
A comparison between shaped concrete slabs and layered floor constructions with good acoustic
performance was discussed. Shaped concrete slabs have some advantages such as floor depth and embodied
carbon over layered floor constructions. Yet shaped concrete slabs are heavier floor systems and more
expensive than layered floors in many cases. In addition to the objectives investigated in the floor type
comparison, there are more objectives that a designer may need to investigate, such as the required floor
strength, desired max span area, and amount of sound flanking.
Another consideration is that only STC was used to quantify the acoustic performance between the
floor types. Meaning that the comparison is accurate when investigating the amount of speech transmission
through the structure, but it does not provide any insight on how the structure may behave at other
frequencies, including low frequencies. The investigation of shaped concrete slabs and layered floor
constructions for low frequency acoustic performance would provide more information on which design
strategy is most effective.

Chapter 6
Conclusion
This thesis has addressed several research questions involving structural-acoustic optimization of
shaped concrete slabs. These questions involve (1) the nature of tradeoffs between embodied carbon and
sound transmission class; (2) finding high-performance designs for both structure and acoustics; (3)
comparing shaped slabs to typical constructions; and (4) investigating STC as an appropriate metric for
design optimization.
The optimization of shaped concrete slabs has shown that as geometry becomes more complex, the
structural and acoustic equations introduce linear and non-linear interactions. Broadly, as structural mass
(which scales with the amount of embodied carbon in a structure) increases, the potential for higher sound
transmission class (STC) increases. There is a positive logarithmic relationship between structural mass
and STC until between a rating of STC-55 and STC-60. Once this acoustic performance level is reached,
STC greatly increases with little increase in structural mass. This region was generated due to the STC
metric’s exclusion of frequency evaluation below 125 Hz. These trends were originally found by sampling
the design space and evaluating the objective performance for each slab using Latin Hypercube Sampling
(LHS). Multi-objective optimization (MOO) further investigated the objective space to find better
performing shaped slab designs. These findings answer the first research question stated in Section 2.6.
The second research question is addressed through constrained optimization, which was the design
exploration technique that found the best performing shaped slab designs as discussed in Section 5.2. These
slab designs had the least amount of structural mass while achieving high acoustic performance at ratings
of STC-50, STC-55, STC-60, and STC-65. Figure 5-13 shows the 3-dimensional models of the shaped
slabs.
The best shaped slabs were preliminary compared to layered floor constructions to provide further
context on how the shaped slabs perform as detailed in Section 5.3. The floor types were evaluated based
on acoustic performance, amount of concrete mass, floor depth, materialized cost, and embodied carbon.
The initial comparisons indicated that both floor types have advantages and disadvantages when compared
against each other. Further research in these comparisons will further refine the answer to the third research
question.
As stated in Chapters 4 and 5, the objective of sound transmission class, which quantifies the
building acoustic performance of a structure, has limitations. While the analytical transmission model STC

104
is able to evaluate complex geometric designs, the acoustic metric is limiting the insightful acoustic
information obtained from the objective space analysis due to the frequency range considered. In addition,
the frequency resolution specified by STC is slightly smearing the coincidence region further complicating
the acoustic evaluation. Structural mass is an accurate objective for quantifying the overall mass and
embodied carbon in a structure. In response to the fourth research question, this thesis suggests the need for
a different building acoustic metric to quantify the transmission of a structure at all airborne frequencies
while incorporating structural-borne sounds.
6.1 Summary of research and contributions
First, a design space was developed that incorporated nine unique geometric variables capable of
generating shaped concrete slab designs. Slab designs were first filtered through the structural and acoustic
models to remove unqualified designs. Then each shaped slab design was evaluated based on the objectives
of structural mass and STC to investigate structural-acoustic trade-offs. Sampling the design space found
that there is a positive logarithmic relationship that when structural mass increases, the STC rating
increases. Additionally, there is a region with high STC ratings that is generated due to the STC metric not
considering the coincidence regions below 125 Hz. LHS also found trends with coincidence frequency and
longitudinal steel reinforcement. As the structural mass increased, the slab’s coincidence frequency
decreased. Finally, the best performing shaped slab designs found by MOO were classified as having larger
steel reinforcement sizes.
Multi-objective optimization was the second design space exploration technique that found shaped
slab designs that outperformed the best shaped slab designs found by LHS. Despite the bias of better
performing shaped slab designs, the trends found from LHS including structural-acoustic trade-offs,
structural mass-coincidence frequency, and best shaped slab designs-longitudinal steel reinforcement were
all confirmed by MOO. Additionally, MOO indicated that the best shaped slab designs can be found with
less structural mass.
Constrained optimization found the best shaped slab designs in the objective space. These slab
designs were characterized by deep, curvy ribs and a thin top slab. The slabs outperformed the best shaped
slab designs found by LHS and MOO demonstrating that constrained optimization is beneficial when
investigating one objective with a set of constraints. The best shaped concrete slabs were then compared to
layered floor constructions. The preliminary comparison indicated that shaped slabs have some advantages
in maximum floor depth and embodied carbon but disadvantages in concrete mass and material cost.

105
When flexural rigidity was explored further, non-linear behavior was found between flexural
rigidity and STC. After further investigation of the non-linear behavior found in the best shaped slabs
obtained by MOO, it was seen that gaps in the objective space were evident when flexural rigidity verses
STC was plotted. Further investigation showed that the gaps corresponded to when the coincidence dip was
very deep. This also resulted in the clustering of the shaped slabs by coincidence frequency in one-third
octave center frequencies.
Two sensitivity analyzes were conducted to evaluate assumptions within this research framework.
Appendix B performs LHS and MOO when the STC metric includes a frequency range from 100 Hz to
4,000 Hz. These simulations suggest that the incorporation of lower airborne frequencies in the acoustic
metric remove some of the nuances found in Chapters 4 and 5. Appendix C performs iterations of LHS and
MOO with different angle of incidences. Four different angles (0°, 30°, 60°, and 85°) are evaluated and
show that the incidence angle has a major impact on the overall shape of the objective space. However, an
angle of incidence of 45° was found to be an adequate median angle for acoustic evaluation. Two additional
simulations that evaluated a range of angles from 0° to 85° at intervals of 5° indicated that averaging the
transmission coefficients obtained from each of the angles to obtain every slab’s STC rating may be the
best solution to evaluate all angles. Future research will continue to evaluate the impact that the angle of
incidence has on the objective space.
This thesis shows the potential of including structural-acoustic performance-based design in an
optimization framework at the building component level. Concrete slabs can be shaped to reduce the
amount of structural mass without degrading the transmission performance of a structure. Further, design
space exploration techniques are an effective method to evaluate both objectives simultaneously while
converging to the best designs. This thesis suggests that shaped concrete slabs are a potential sustainable
design solution. Further research is necessary to evaluate the full acoustic performance of the slab while
further reducing the amount of structural mass of a shaped slab.
6.2 Research limitations
Throughout the parametric framework of shaped concrete slabs and the investigation of their
performance, several limitations exist. Some potential limitations relate to assumptions made about the
geometric variables in addition to the structural and acoustic models. The scope of the research was to
investigate the structural-acoustic trade-offs for complex concrete slabs, and many decisions in order to
conduct the investigation brought forth limitations of varying severity.

106
Each of the nine geometric variables in the parametric framework of the shaped concrete slabs had
specific bounds. The bounds were established in order to limit the amount of unqualified or constructible
designs. But with the exploration of the geometric similarities of the Pareto front designs obtained by MOO,
a lot of the slab designs had geometric variables pushed to one of the extremes of the variable’s bound as
seen in Figure 5-7. Increasing the bounds toward the geometric bias could generate even better shaped
concrete slab designs. The slab’s ribs were also limited to the geometric variables used in shaping the slab.
Only curved ribs were generated in the model.
The geometric parameters and assumptions also limit the research. The slab area was held at a
constant to specifically evaluate how the shaping of the slab’s ribs impacts structural-acoustic behavior.
Other shaped concrete slab solutions could be produced with adding the slab’s length and width as
geometric variables. Adding the length and width as geometric variables could provide more insight into
more elaborate concrete floors. With the addition of length and width as geometric variables, the direction
that the ribs are shaped could be manipulated. In this research, the ribs were only shaped along the slab’s
length. This is because the scope of this research is to investigate the shaping of one-way concrete floors.
Waffle slabs and other two-way concrete systems could provide more information on the benefit of
designing using shaped concrete slabs.
The implementation of the shaped concrete slab was in a residential building. This parameter limits
the application of the shaped concrete slab designs but also constrains the structural loading that is being
investigated. The research model only includes a residential live load, yet for different building applications
such as an office building, the structural load on the slab will differ. This would cause the amount of
qualified designs to change, impacting the fully qualified objective space. In addition, the geometric shaping
would likely change as more structural material would be needed for a larger structural load.
The structural parameters and assumptions limit the research as well. The assessment assumption
of rectilinear behavior was chosen because of standard structural concrete code, but structural equations
based on rectilinear geometry limits the structural analysis of shaped slabs. The shaped concrete slab is
designed using high compressive strength concrete. If a range of concrete compressive strength were
evaluated, the shaped concrete slab’s structural properties would be better understood. The other properties
of the concrete and steel limit any trends that could be seen with varying structural materials.
The acoustic model provides limits in the parameters as well. The angle of incidence, temperature,
and concrete absorption were all held constant. Despite these acoustic limitations, the largest limitation is
arguably the acoustic metric of sound transmission class. As discussed in the previous chapters, STC
excludes any transmission loss value below 125 Hz. This is because STC quantifies the structure’s acoustic

107
performance of speech transmission. Yet the objective space shows that there are high performing shaped
concrete slabs as the coincidence frequency decreases below 125 Hz. But since STC does not include any
frequency below 125 Hz, the acoustic performance objective is biased toward the transmission of speech.
Low frequencies and structural-borne noise were not incorporated into the evaluation of the structure’s
acoustic performance. However, STC is the common acoustic metric that quantifies speech transmission
through a structure in American building code and was thus the metric incorporated in this research.
The last major limitation is how the structural model estimates the flexural steel reinforcement. As
previously discussed, the longitudinal steel reinforcement is estimated based on the shaped slab’s geometry
and the required minimum ductility. The reinforcement estimator was included in the model due to the
limitation of estimating the steel reinforcement based on the moment capacity. Typically, an engineer would
design a structural concrete element by iterating through several rebar sizes. The behavior of the model
prevents iterations of failed designs due to the steel reinforcement. In addition, the longitudinal
reinforcement sizing limitation, the steel reinforcement is restricted to being the same area throughout the
length of the shaped rib and with the same clear cover. Variations of these parameters could introduce more
unique shaped concrete slabs.
LHS, MOO, and constrained optimization are largely dependent on the above limitations. However,
due to user defined sample, population, and generation sizes, these analyzes have slight limitations as well.
Provided enough computational resources, LHS, MOO, and constrained optimization could be further
refined to obtain the best shaped design solutions.
6.3 Future work
The investigation into the structural-acoustic trade-offs found in shaped concrete slabs using an
optimization framework implores for more research into this area. Especially as buildings become more
sustainable, with optimal performance, designers need to ensure that all design criteria are considered. Since
acoustic-based performance design is behind the performance design research in other building disciplines,
more research should be conducted within this field. Since this investigation found interesting trade-offs
between a concrete structural system’s geometry, structural performance, and acoustic performance, more
research should be conducted in structural-acoustic behavior of other structural systems in buildings. In
addition, structural performance is one only of several primary design considerations in a building. There
could be valuable research in the optimization of acoustics and other primary building considerations. For

108
example, mechanical system – acoustic optimization could potentially provide new insight on how
mechanical layouts in buildings could increase satisfactory acoustic environments within a building.
The following future work discussion is divided into three categories: structural model, acoustic
model, and high resolution, testing, and other work. This is to provide more detail about the future work
necessary for the different aspects of structural-acoustic optimization research.
6.3.1 Future structural model
Future research should also be performed on the structural model of the shaped concrete slab. The
ACI-318 strength and design equations are specific for rectilinear concrete elements. Yet with advanced
construction technology curved concrete elements are possible. The structural strength checks should be
re-evaluated for a shaped concrete slab as complex geometries contribute to the moment and shear capacity
in different ways. In addition, the extent of the application of ACI-318 design requirements for shaped
concrete slabs should be researched. Fire rating is another design objective that deems attention in the
model.
A sensitivity analysis on the serviceability criterion for a shaped concrete slab. The amount of
deflection experienced by a shaped concrete slab is important for the incorporation of shaped concrete slabs
in building design. If the deflection of a shaped concrete slab is found to be large, then this would limit the
incorporation of the slabs in the building design practice. Another serviceability criterion for the structural
vibrations should be investigated. The evaluation of the acoustic performance at low frequencies does not
equate to an evaluation of structural vibrations.
Other sensitivity analyzes can be conducted on some of the parameters and assumptions in the
current model. Optimization of a shaped concrete slab’s floor area would be intriguing and further the
understanding of shaped slabs for design implementation. Likewise, varying the clear cover and shear
reinforcement would be other useful studies to further this research.
6.3.2 Future acoustic model
Future work for shaped concrete slabs involves the inclusion of an existing acoustic metric, an
expansion of an existing metric, or the development of a new acoustic metric that captures the interesting
structural-acoustic phenomenon occurring at low frequencies. Impact insulation class (IIC) is an existing

109
metric that quantifies the transmission of structural-borne sound through a structure. Yet, it relies upon a
tapping machine to determine the transmission of structural-borne sounds. IIC does not include the
evaluation of low frequency airborne sound. Numerical studies have been conducted that suggest new
metrics for the investigation of low frequency structural-borne and airborne sounds, yet none of these
metrics have been compared to IIC or incorporated into building design practice.
A follow-up question from this research is: can a structure’s full acoustic performance be provided
in a single, meaningful quantity? STC and IIC both combine frequency dependent data into one number,
but both have limitations due to how the transmission data is obtained and how the metric is calculated.
The investigation of shaped concrete slabs shows the need for an acoustic metric that captures low
frequency airborne sounds in addition to the speech frequency range. Structural-borne sounds would need
to be incorporated as well. To completely understand the relationships between structural and acoustic
based performance designs, a high performing acoustic metric needs to be incorporated in the model.
A potential insightful study would be to calculate the standard STC and IIC values for a structure
and then scale the two metrics into one composite acoustic objective. The designer could determine if the
shaped concrete slab should be designed for better acoustic performance for low frequency structural-borne
sounds or mid to high frequency airborne sounds such as speech. This would be an interesting solution for
certain room designs, such as a floor design in a mall which would likely be more concerned with the low
frequency structural-borne sounds generated from people moving. A floor design in an office building
would be more concerned with the mid to high frequency range for good speech privacy. However, some
room designs, such as residential rooms, would likely desire high performance for low, mid, and high
frequency airborne sounds in addition to structural-borne sounds.
To further evaluate the coincidence region, the structural damping should be incorporated within
the structural model. Damping is held constant for this research, but along with mass and stiffness, it can
impact the coincidence region. Since the coincidence region has a significant impact on the acoustic
performance of a structure, this is a study that must be researched to continue to understand the structural-
acoustic behavior. The slab’s damping will be largely dependent on the support conditions and
implementation into the structural system.
The impact that the angle of incidence has on the structure’s acoustic performance is another sub-
study in this research discussed in Appendix C. Since the transmission coefficient is dependent on the angle
of incidence, results showed that different angles resulted in different objective space relationships. Further
research should include the incorporation of an averaged angle of incidence calculation as provided in

110
Appendix C and perform more sensitivity analyzes regarding the appropriate angle of incidence resolution
for design space exploration of shaped slabs.
Structural-acoustic interaction is not limited to transmission. The amount of sound that a shaped
concrete slab reflects would be of great interest, especially when considering scattering. Scattering can
occur when a sound wavelength and the spacing of a surface irregularity is similar. This could cause sound
to be concentrated to certain locations of an acoustic environment, which would be undesirable. The amount
of sound absorbed by a shaped concrete slab could be an interesting sustainable design solution.
6.3.3 High resolution, testing, and other future work
Future research should also incorporate the evaluation of a shaped concrete slab in a finite element
model. This would provide the highest resolution on the structural and acoustical performance and could
refine the relationships cited in this thesis. In addition to high resolution evaluation of the current shaped
slab geometries, two-way shaped slabs should be evaluated.
Shaped concrete slabs could be combined with material layering to generate innovative and
sustainable design solutions. As mentioned in Section 5.3, combining shaping and layering could
potentially reduce the amount of structural mass and embodied carbon in these floor systems. Unique
sustainable solutions could be generated that have broad applications outside of residential buildings, as
shaped-layered slabs could provide structural-acoustic benefits to offices, gymnasiums, and other building
types. Shaped-layered slabs may also provide acoustic benefits for the full range of airborne frequencies
and structural borne sounds without sacrificing structural integrity. Additionally, the designer could have
more aesthetic expression with different layering material options. Similar to layering, air pockets can be
strategically placed within a structural slab, creating a bubble slab (Aouf, 2019). There are many innovative
solutions to reducing the embodied carbon of a structural system beyond shaping the ribs at the bottom of
the concrete slab. As sustainability continues to play a role in the design of buildings, new solutions will
need to be developed to address environmental concerns while creating a healthy and enriching building
environment.
Beyond further computational modeling, experimental testing of a shaped concrete slab would
validate numerical results. Once a best performing shaped concrete slab is identified at a high resolution,
fabrication and testing of the slab should be performed. The structural strength and acoustic performances
could be tested. Even broader, research should be conducted to investigate the shaping of other structural
systems. In a similar vein to shaping concrete slabs, the shaping of concrete shear walls would be interesting

111
as there would be structural-acoustic (vibrations) trade-offs. Shaping of composite floor systems and the
incorporation of other materials could produce more valuable design solutions.
6.4 Il fine
To conclude, this thesis investigates the relationships between structural and acoustic performance
design in a parametric framework. Optimization was used to explore the best design solutions that met
structural and acoustic criteria at the resolution of early design. The best shaped concrete slabs were further
analyzed to identify geometric-objective relationships. It was found that both linear and non-linear
structural-acoustic relationships exist due to the mass and stiffness of the slab in addition to how the acoustic
metric quantified acoustic performance.
While this research provides significant new data concerning the relationship between structure
and sound in concrete floors, it represents only an initial step in the full design, production, and testing of
such building components. This conclusion identifies many areas of future research that should be
performed to fully understand the structural-acoustic relationships for shaped concrete slabs. More research
performed on sustainable structural design solutions such as shaped concrete slabs will increase their
visibility and viability as a potential solution in design practice. Beyond pure structural design approaches,
this thesis also shows the importance of incorporating acoustic performance in design optimization.
Computational design of concrete building components for both structural and acoustic
performance can be further explored by increasing the model resolution, evaluating other geometric
possibilities into the model, and through experimental fabrication and testing. With advances in digital
fabrication, opportunities remain for innovative geometric solutions that are only limited by the imagination
of the designer.

Appendix A
Geometrical, Structural, and Acoustical Result Validation
The provided hand calculations are shown to validate the results obtained from the structural-
acoustic model. Two different case studies were conducted to ensure accuracy. The case studies are broken
into geometry, structural, and acoustic result validation. Screenshots of Excel worksheets are provided to
supplement the calculation for repetitive equations, such as the maximum ductility and transmission
coefficient.
Case 1: 6” Flat Slab
Table App. A-1: Geometric variable values for validation case 1.
Geometric Variable Value
Rib Number 5 Ribs
Slab Thickness 0.152 m
Rib Depth 0.0 m
End Taper 1 0.200
End Width 1 0.200
End Taper 2 0.200
End Width 2 0.200
Rib Mid-Depth 0.000
Rib Mid-Width 0.000

113
Figure App. A-1: 3-dimensional view of case 1 slab.
Validate Mass:
Density = 2400 kg/m3
Area = 6m x 6m = 36 m2
𝑚𝑎𝑠𝑠 = 𝑑𝑒𝑛𝑠𝑖𝑡𝑦 × 𝑣𝑜𝑙𝑢𝑚𝑒 = 2400𝑘𝑔
𝑚3 × (0.152𝑚 × 36𝑚2) = 13132.8 𝑘𝑔
GH Model = 13132.8 kg
Validate Acoustic Model:
Modulus of Elasticity of Concrete = 27,500 MPa; Poisson’s Ratio = 0.15; Density of Air = 1.29 kg/m3;
Angle of Incidence = 45°; Air Speed of Sound = 343 m/s; Damping Coefficient = 0.01.
1) Mass Law
𝑀𝑎𝑠𝑠 𝐷𝑒𝑛𝑠𝑖𝑡𝑦 =𝑚𝑎𝑠𝑠
𝑎𝑟𝑒𝑎=
13132.8 𝑘𝑔
36𝑚2= 364.8
𝑘𝑔
𝑚2
Frequency range = 63 Hz to 8000 Hz in 1 Hz intervals.
For f = 500 Hz
𝑇𝐿𝑀𝐿 = 20𝑙𝑜𝑔10(𝑚𝑓) − 42 = 20 log10 ((364.8𝑘𝑔
𝑚2) (500𝐻𝑧)) − 42 = 63.2205 𝑑𝐵
GH Model = 63.2205 dB

114
The rest of the frequencies were validated using an Excel Spreadsheet:
Figure App. A-2: Mass law TL validation for case 1 slab using Excel.
The TL values were then grouped by 1/3 octave band frequency
𝐿𝑜𝑤𝑒𝑟 𝑏𝑜𝑢𝑛𝑑 =
13 𝑜𝑐𝑡𝑎𝑣𝑒 𝑐𝑒𝑛𝑡𝑒𝑟 𝑓𝑟𝑒𝑞𝑢𝑒𝑛𝑐𝑦
21/6
𝑈𝑝𝑝𝑒𝑟 𝑏𝑜𝑢𝑛𝑑 = (1
3𝑜𝑐𝑡𝑎𝑣𝑒 𝑏𝑎𝑛𝑑 𝑐𝑒𝑛𝑡𝑒𝑟 𝑓𝑟𝑒𝑞𝑢𝑒𝑛𝑐𝑦) × 21/6
For 500 Hz:
𝐿𝑜𝑤𝑒𝑟 𝑏𝑜𝑢𝑛𝑑 = 500 𝐻𝑧
21/6= 445 𝐻𝑧

115
GH Model = 445 Hz
𝑈𝑝𝑝𝑒𝑟 𝑏𝑜𝑢𝑛𝑑 = (500 𝐻𝑧)(21/6) = 561 𝐻𝑧
GH Model = 561 Hz
Excel was used to find the STC rating for Mass Law, which found STC-67
Figure App. A-3: Mass law STC validation for case 1 slab using Excel.
GH Model = STC-67
2) Analytical Transmission Model
Since no bottom rib, there is no rib contribution to flexural rigidity.
𝐷 = 𝐸ℎ0
3
12(1 − 𝜈2)+
𝐸𝑠𝑡𝑖𝑓𝑓𝑒𝑛𝑒𝑟𝐼𝑠𝑡𝑖𝑓𝑓𝑒𝑛𝑒𝑟
∆𝑠𝑡𝑖𝑓𝑓𝑒𝑛𝑒𝑟=
(27500 𝑀𝑃𝑎)(0.152𝑚)3(10002)
12(1 − (0.15)2)+ 0 = 8233138.96
GH Model = 8233138.96
Assume f = 500 Hz
𝜏(𝜑, 𝜔) = (
2𝜌0𝑐0𝑠𝑖𝑛𝜑
)2
(2𝜌0𝑐0𝑠𝑖𝑛𝜑
+𝜂(𝐷
𝜔)(𝑘0𝑠𝑖𝑛𝜑)4)2+(𝜔𝜌ℎ−(
𝐷
𝜔)(𝑘0𝑠𝑖𝑛𝜑)4)
2 =
(2(
1.29𝑘𝑔
𝑚3 )(343𝑚𝑠 )
sin (45°))
2
((2(
1.29𝑘𝑔
𝑚3 )(343𝑚𝑠 )
sin(45°))+(0.01)(
8233138.96
3141.59)((9.159)(sin(45°)))
4)
2
+((3141.59)(364.8 𝑘𝑔)−(8233138.96
3141.59)((9.159)(sin(45°)))
4)
2
=1.3044x10⁻⁷
GH Model =1.3044x10⁻⁷

116
𝑇𝐿 = 10 log (1
𝜏) = 10 log (
1
1.3044 × 10⁻⁷) = 68.8457 𝑑𝐵
GH Model = 68.8457 dB
Excel was used to find the STC rating for the Analytical Model which was found to be STC-40.
Figure App. A-4: Analytical Transmission Model STC validation for case 1 slab using Excel.
GH Model = STC-40
Soundflow was also used to validate the STC rating; it obtained STC-41. OK
Figure App. A-5: STC validation for case 1 slab using Soundflow.

117
Validate Structural Model
Loading:
Live load = 40 psf (residential live load).
Convert to a uniform line load applied over the length of a rib: 40 𝑝𝑠𝑓 × (6 𝑚
5 𝑟𝑖𝑏𝑠) × (
3.28 𝑓𝑡
1 𝑚) = 157.44 𝑝𝑙𝑓
Convert uniform line load to metric: 157.44 𝑝𝑙𝑓 ×1 𝑘𝑁/𝑚
68.521766 𝑝𝑙𝑓= 2.29766 𝑘𝑁/𝑚
Dead load = Slab’s self-weight at 10 sections
Convert to point loads applied at 10 sections along the length of a rib:
24𝑘𝑁
𝑚3× 0.152𝑚 × (
6 𝑚
5 𝑟𝑖𝑏𝑠) × (
6 𝑚
10 𝑠𝑒𝑐𝑡𝑖𝑜𝑛𝑠) = 2.6 𝑘𝑁
Apply LRFD load combination: 1.2D + 1.6L
1.2𝐷 = 1.2(2.6 𝑘𝑁) = 3.1 𝑘𝑁
GH Model = 3.09093 kN
1.6𝐿 = 1.6 (2.29766𝑘𝑁
𝑚) = 3.677 𝑘𝑁/𝑚
GH Model = 3.67717 kN/m

118
Shear and moment envelopes were calculated based on the factored loading in Excel:
Figure App. A-6: Shear and moment validation for case 1 slab using Excel.
The steel reinforcement for the flat slab was selected to be two (2) #10 bars. Therefore, 𝐴𝑠 = 1638 𝑚𝑚2
Reinforcement ratios were found for the structure at one section:
𝜌 =𝐴𝑠
𝑏𝑤𝑑=
(1638 𝑚𝑚2) (1 𝑚
1000 𝑚𝑚)2
(1.2 𝑚)(0.152 𝑚 − 0.038 𝑚)= 0.011974

119
𝜌𝑚𝑖𝑛 = 𝑙𝑎𝑟𝑔𝑒𝑟 𝑜𝑓 0.25√𝑓′𝑐
𝑓𝑦,
1.4
𝑓𝑦=
0.25√40 𝑀𝑃𝑎
420 𝑀𝑃𝑎= 0.0037646,
1.4
420= 0.003333,
𝜌𝑚𝑖𝑛 = 0.0037646
𝜌𝑚𝑎𝑥 =0.319𝑓′
𝑐
𝑓𝑦=
0.319(40 𝑀𝑃𝑎)
420 𝑀𝑃𝑎= 0.030381
Since, 𝜌𝑚𝑖𝑛 = 0.0037646 < 𝜌 = 0.011974 < 𝜌𝑚𝑎𝑥 = 0.030381, the slab meets the ductility
requirements.
GH Model Confirms the calculations
Excel was used to find the reinforcement ratios at all other sections:
Figure App. A-7: Steel reinforcement ratio validation for case 1 slab using Excel.
A flexural analysis was performed along the length of the rib:
𝛽1 = 0.85 − 0.005 𝑓𝑐
′ − 28 𝑀𝑃𝑎
7 𝑀𝑃𝑎= 0.85 − 0.05
(40 𝑀𝑃𝑎) − 28 𝑀𝑃𝑎
7 𝑀𝑃𝑎= 0.76429
𝑐 = 𝐴𝑠𝑓𝑦
0.85𝑓𝑐′𝑏𝑤𝛽1
=(1638 𝑚𝑚2) (
1 𝑚1000 𝑚𝑚)
2
(420 𝑀𝑃𝑎)
0.85(40 𝑀𝑃𝑎)(6 𝑚/5 𝑟𝑖𝑏𝑠)(0.76429)= 0.022062 𝑚
𝐴𝑐 = 𝛽1𝑐𝑏𝑤 = (0.76429)(0.022062 𝑚)(1.2 𝑚) = 0.020234 𝑚2
𝐶𝑐 = 0.85𝑓𝑐′𝐴𝑐 = 0.85(40 𝑀𝑃𝑎)(0.020234 𝑚2) = 687.96 𝑘𝑁

120
𝑧 = 𝑑 − 𝐴𝑐𝑐𝑒𝑛𝑡𝑟𝑜𝑖𝑑= (0.152 𝑚 − 0.038 𝑚) − 0.0084308 𝑚 = 0.10557 𝑚
𝑀𝑛 = 𝐴𝑠𝑓𝑦𝑧 = (1638 𝑚𝑚2)(420 𝑀𝑃𝑎)(0.10557 𝑚) = 72.628 𝑘𝑁 ∗ 𝑚
Since 𝑀𝑛 = 72.628 𝑘𝑁 ∗ 𝑚 > 𝑀𝑢 = 39.729 𝑘𝑁 ∗ 𝑚, the slab meets the flexural requirements.
GH Model Confirms the calculations
Excel was used to perform a flexural analysis at all other sections:
Figure App. A-8: Flexural analysis validation for case 1 slab using Excel.
A shear analysis was performed along the length of the rib:
Minimum shear reinforcement was selected for the slab since shear does not control concrete slab design.
𝑉𝑛 = 𝑉𝑐 + 𝑉𝑠 = 0.167√𝑓𝑐′𝑏𝑤𝑑 +
𝐴𝑣𝑓𝑦𝑑
𝑠
= 0.167√40 𝑀𝑃𝑎(1.2 𝑚)(0.152 𝑚 − 0.038 𝑚) + (71 𝑚𝑚2)(420𝑀𝑃𝑎)(0.152 𝑚 − 0.038 𝑚)
0.3 𝑚
= 144.49 𝑘𝑁 + 11.332 𝑘𝑁 = 155.82 𝑘𝑁
GH Model Confirms the calculations

121
Excel was used to perform a shear analysis at all other sections:
Figure App. A-9: Shear analysis validation for case 1 slab using Excel.
It should be noted that all of the structural design checks were based on the rib geometry. Since the flat
slab does not have any ribs, the structural design checks are not checked.
Case 2: Shaped Slab
Table App. A-2: Geometric variable values for validation case 2.
Geometric Variable Value
Rib Number 6 Ribs
Slab Thickness 0.400 m
Rib Depth 0.300 m
End Taper 1 0.200
End Width 1 0.200
End Taper 2 0.200
End Width 2 0.200
Rib Mid-Depth 0.000
Rib Mid-Width 0.000

122
Figure App. A-10: 3-dimensional view of case 2 slab.
Validate Mass:
Density = 2400 kg/m3
Area = 6m x 6m = 36 m2
𝑚𝑎𝑠𝑠 = 𝑑𝑒𝑛𝑠𝑖𝑡𝑦 × 𝑣𝑜𝑙𝑢𝑚𝑒 = 2400𝑘𝑔
𝑚3 × ((0.4 𝑚 × 36𝑚2) + (
𝜋(0.33 𝑚)2(6 𝑚)(6 𝑟𝑖𝑏𝑠)
2))
= 49340 𝑘𝑔
GH Model = 49083 kg OK
Validate Acoustic Model:
Modulus of Elasticity of Concrete = 27,500 MPa; Poisson’s Ratio = 0.15; Density of Air = 1.29 kg/m3;
Angle of Incidence = 45°; Air Speed of Sound = 343 m/s; Damping Coefficient = 0.01.
Steel reinforcement was selected to be one (1) #8 bar. Modulus of Elasticity of Steel = 205,000 MPa
1) Mass Law
𝑀𝑎𝑠𝑠 𝐷𝑒𝑛𝑠𝑖𝑡𝑦 =𝑚𝑎𝑠𝑠
𝑎𝑟𝑒𝑎=
49340 𝑘𝑔
36𝑚2= 1371
𝑘𝑔
𝑚2
Frequency range = 63 Hz to 8000 Hz in 1 Hz intervals.
For f = 500 Hz
𝑇𝐿𝑀𝐿 = 20𝑙𝑜𝑔10(𝑚𝑓) − 42 = 20 log10 ((1371𝑘𝑔
𝑚2) (500𝐻𝑧)) − 42 = 74.720 𝑑𝐵
GH Model = 74.672 dB

123
The rest of the frequencies were validated using an Excel Spreadsheet:
Figure App. A-11: Mass law TL validation for case 2 slab using Excel.
The TL values were then grouped by 1/3 octave band frequency
𝐿𝑜𝑤𝑒𝑟 𝑏𝑜𝑢𝑛𝑑 =
13 𝑜𝑐𝑡𝑎𝑣𝑒 𝑐𝑒𝑛𝑡𝑒𝑟 𝑓𝑟𝑒𝑞𝑢𝑒𝑛𝑐𝑦
21/6
𝑈𝑝𝑝𝑒𝑟 𝑏𝑜𝑢𝑛𝑑 = (1
3𝑜𝑐𝑡𝑎𝑣𝑒 𝑏𝑎𝑛𝑑 𝑐𝑒𝑛𝑡𝑒𝑟 𝑓𝑟𝑒𝑞𝑢𝑒𝑛𝑐𝑦) × 21/6
For 500 Hz:
𝐿𝑜𝑤𝑒𝑟 𝑏𝑜𝑢𝑛𝑑 = 500 𝐻𝑧
21/6= 445 𝐻𝑧
GH Model = 445 Hz

124
𝑈𝑝𝑝𝑒𝑟 𝑏𝑜𝑢𝑛𝑑 = (500 𝐻𝑧)(21/6) = 561 𝐻𝑧
GH Model = 561 Hz
Excel was used to find the STC rating for Mass Law, which found STC-79
Figure App. A-12: Mass law STC validation for case 2 slab using Excel.
GH Model = STC-79
2) Analytical Transmission Model
Since no bottom rib, there is no rib contribution to flexural rigidity.
𝐼𝑧 = 𝜋𝑟4
8=
𝜋(0.33 𝑚)4
8= 0.0046571 𝑚4
GH Model = 0.006537 m4 OK Ix = 0.000978 m4
𝐷 = 𝐸ℎ0
3
12(1 − 𝜈2)+
𝐸𝑠𝑡𝑖𝑓𝑓𝑒𝑛𝑒𝑟𝐼𝑠𝑡𝑖𝑓𝑓𝑒𝑛𝑒𝑟
∆𝑠𝑡𝑖𝑓𝑓𝑒𝑛𝑒𝑟
=(27500 𝑀𝑃𝑎)(0.4 𝑚)3(10002)
12(1 − (0.15)2)+
(27636.7 𝑀𝑃𝑎)(0.000978𝑚4)(10002)
1 𝑚
= 150042625 + 27028692 = 1770700000 𝑁 ∗ 𝑚
GH Model = 1.7707 x 10⁸ N*m

125
Assume f = 500 Hz
𝜏(𝜑, 𝜔) = (
2𝜌0𝑐0𝑠𝑖𝑛𝜑
)2
(2𝜌0𝑐0𝑠𝑖𝑛𝜑
+𝜂(𝐷
𝜔)(𝑘0𝑠𝑖𝑛𝜑)4)2+(𝜔𝜌ℎ−(
𝐷
𝜔)(𝑘0𝑠𝑖𝑛𝜑)4)
2 =
(2(
1.29𝑘𝑔
𝑚3 )(343𝑚𝑠
)
sin (45°))
2
((2(
1.29𝑘𝑔
𝑚3 )(343𝑚𝑠
)
sin(45°))+(0.01)(
1.7707×10⁸
3141.59)((9.159)(sin(45°)))
4)
2
+((3141.59)(1371 𝑘𝑔)−(1.7707×10⁸
3141.59)((9.159)(sin(45°)))
4)
2
=1.7396x10⁻¹⁰
GH Model =1.7396x10⁻¹⁰
𝑇𝐿 = 10 log (1
𝜏) = 10 log (
1
1.3044 × 10⁻⁷) = 97.596 𝑑𝐵
GH Model = 97.596 dB
Excel was used to find the STC rating for the Analytical Model which was found to be STC-72.
Figure App. A-13: Analytical Transmission Model STC validation for case 2 slab using Excel.
GH Model = STC-72
Soundflow was not able to validate the results because the software is limited to rectilinear shapes.

126
Validate Structural Model
Loading:
Live load = 40 psf (residential live load).
Convert to a uniform line load applied over the length of a rib: 40 𝑝𝑠𝑓 × (6 𝑚
6 𝑟𝑖𝑏𝑠) × (
3.28 𝑓𝑡
1 𝑚) = 131.2 𝑝𝑙𝑓
Convert uniform line load to metric: 131.2 𝑝𝑙𝑓 ×1 𝑘𝑁/𝑚
68.521766 𝑝𝑙𝑓= 1.9147 𝑘𝑁/𝑚
Dead load = Slab’s self-weight at 10 sections
Convert to point loads applied at 10 sections along the length of a rib:
24𝑘𝑁
𝑚3× (0.4 𝑚 + (
2
3) (0.3 𝑚)) × (
6 𝑚
6 𝑟𝑖𝑏𝑠) × (
6 𝑚
10 𝑠𝑒𝑐𝑡𝑖𝑜𝑛𝑠) = 8.64 𝑘𝑁
Apply LRFD load combination: 1.2D + 1.6L
1.2𝐷 = 1.2(8.64 𝑘𝑁) = 10.368 𝑘𝑁
GH Model = 9.3702 kN OK
1.6𝐿 = 1.6 (1.9147𝑘𝑁
𝑚) = 3.0635 𝑘𝑁/𝑚
GH Model = 3.0643 kN/m

127
Shear and moment envelopes were calculated based on the factored loading in Excel:
Figure App. A-14: Shear and moment validation for case 2 slab using Excel.
The steel reinforcement for the flat slab was selected to be one (1) #9 bar. Therefore, 𝐴𝑠 = 645 𝑚𝑚2
Reinforcement ratios were found for the structure at one section:
𝜌 =𝐴𝑠
𝑏𝑤𝑑=
(645 𝑚𝑚2) (1 𝑚
1000 𝑚𝑚)2
(0.2462 𝑚)(0.7 𝑚 − 0.038 𝑚)= 0.0039574

128
𝜌𝑚𝑖𝑛 = 𝑙𝑎𝑟𝑔𝑒𝑟 𝑜𝑓 0.25√𝑓′𝑐
𝑓𝑦,
1.4
𝑓𝑦=
0.25√40 𝑀𝑃𝑎
420 𝑀𝑃𝑎= 0.0037646,
1.4
420= 0.003333,
𝜌𝑚𝑖𝑛 = 0.0037646
𝜌𝑚𝑎𝑥 =0.319𝑓′
𝑐
𝑓𝑦=
0.319(40 𝑀𝑃𝑎)
420 𝑀𝑃𝑎= 0.030381
Since, 𝜌𝑚𝑖𝑛 = 0.0037646 < 𝜌 = 0.0039574 < 𝜌𝑚𝑎𝑥 = 0.030381, the slab meets the ductility
requirements.
GH Model Confirms the calculations
Excel was used to find the reinforcement ratios at all other sections:
Figure App. A-15: Steel reinforcement ratio validation for case 2 slab using Excel.
A flexural analysis was performed along the length of the rib:
𝛽1 = 0.85 − 0.005 𝑓𝑐
′ − 28 𝑀𝑃𝑎
7 𝑀𝑃𝑎= 0.85 − 0.05
(40 𝑀𝑃𝑎) − 28 𝑀𝑃𝑎
7 𝑀𝑃𝑎= 0.76429
𝑐 = 𝐴𝑠𝑓𝑦
0.85𝑓𝑐′𝑏𝑤𝛽1
=(645 𝑚𝑚2) (
1 𝑚1000 𝑚𝑚)
2
(420 𝑀𝑃𝑎)
0.85(40 𝑀𝑃𝑎)(6 𝑚/6 𝑟𝑖𝑏𝑠)(0.76429)= 0.010425 𝑚
𝐴𝑐 = 𝛽1𝑐𝑏𝑤 = (0.76429)(0.010425 𝑚)(0.2462 𝑚) = 0.0019616 𝑚2
𝐶𝑐 = 0.85𝑓𝑐′𝐴𝑐 = 0.85(40 𝑀𝑃𝑎)(0.0019616 𝑚2) = 66.696 𝑘𝑁

129
𝑧 = 𝑑 − 𝐴𝑐𝑐𝑒𝑛𝑡𝑟𝑜𝑖𝑑= (0.7 𝑚 − 0.038 𝑚) − 0.0009808 𝑚 = 0.66102 𝑚
𝑀𝑛 = 𝐴𝑠𝑓𝑦𝑧 = (645 𝑚𝑚2)(420 𝑀𝑃𝑎)(0.66102 𝑚) = 179.07 𝑘𝑁 ∗ 𝑚
Since 𝑀𝑛 = 179.07 𝑘𝑁 ∗ 𝑚 > 𝑀𝑢 = 85.699 𝑘𝑁 ∗ 𝑚, the slab meets the flexural requirements.
GH Model Confirms the calculations
Excel was used to perform a flexural analysis at all other sections:
Figure App. A-16: Flexural analysis validation for case 2 slab using Excel.
A shear analysis was performed along the length of the rib:
Minimum shear reinforcement was selected for the slab since shear does not control concrete slab design.
𝑉𝑛 = 𝑉𝑐 + 𝑉𝑠 = 0.167√𝑓𝑐′𝑏𝑤𝑑 +
𝐴𝑣𝑓𝑦𝑑
𝑠
= 0.167√40 𝑀𝑃𝑎(1.0 𝑚)(0.7 𝑚 − 0.038 𝑚) + (71 𝑚𝑚2)(420𝑀𝑃𝑎)(0.7 𝑚 − 0.038 𝑚)
0.3 𝑚
= 699.20 𝑘𝑁 + 65.803 𝑘𝑁 = 765.00 𝑘𝑁
GH Model Confirms the calculations

130
Excel was used to perform a shear analysis at all other sections:
Figure App. A-17: Shear analysis validation for case 2 slab using Excel.
It should be noted that all of the structural design checks were based on the rib geometry.
Minimum Floor Slab Thickness: 0.7 𝑚 > 0.2 𝑚 Passes
Minimum Flange Width: 6 𝑚
8= 0.75 𝑚 > (
1
2) (
6 𝑚
6 𝑟𝑖𝑏𝑠) = 0.5 𝑚 Passes
Clear Cover Check: 0.3 𝑚 > 2(0.038 𝑚) + 𝑑𝑏 Passes

131
Appendix B
Sound Transmission Class Sensitivity Analysis
To evaluate what the objective space would show with the incorporation of coincidence frequencies
below 125 Hz, the STC frequency range was extended down to the one-third octave center frequency of
100 Hz. This was done by extending the STC contour down to 100 Hz. The acoustic objective sensitivity
analysis was investigated using both LHS and MOO. The results obtained are seen in Figures App. B-1 and
App. B-2.
Figure App. B-1: The objective space obtained from LHS with the incorporation of 100 Hz into STC.
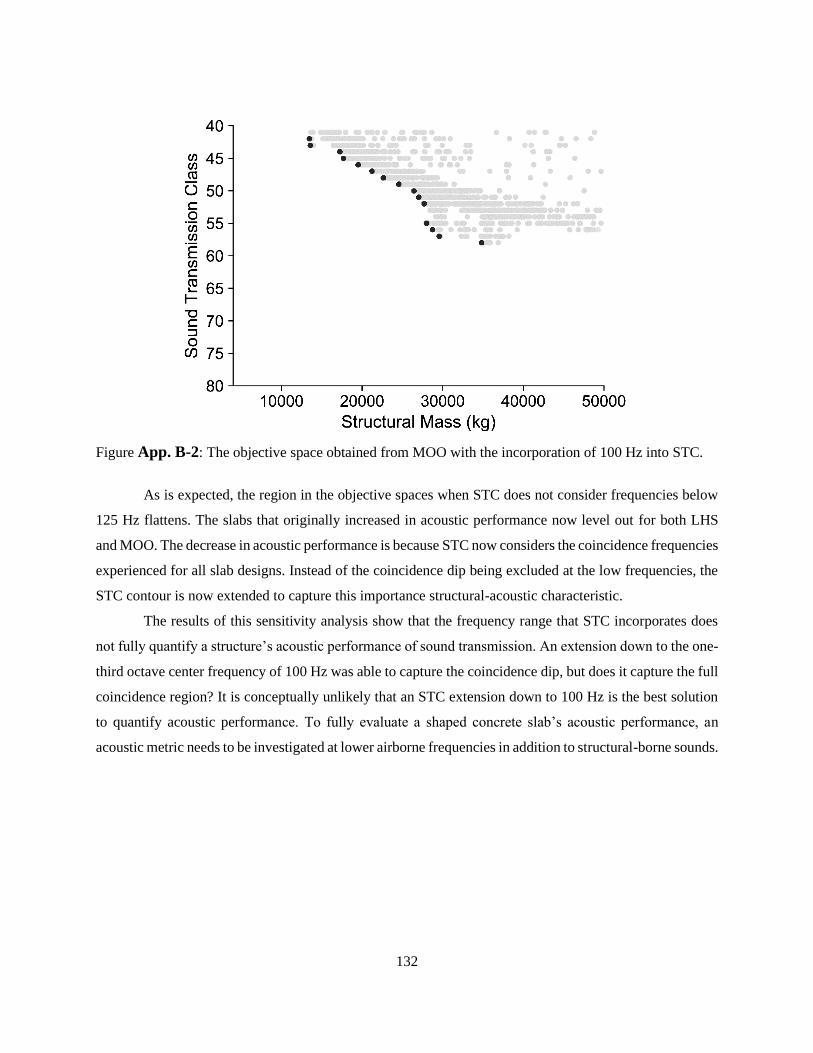
132
Figure App. B-2: The objective space obtained from MOO with the incorporation of 100 Hz into STC.
As is expected, the region in the objective spaces when STC does not consider frequencies below
125 Hz flattens. The slabs that originally increased in acoustic performance now level out for both LHS
and MOO. The decrease in acoustic performance is because STC now considers the coincidence frequencies
experienced for all slab designs. Instead of the coincidence dip being excluded at the low frequencies, the
STC contour is now extended to capture this importance structural-acoustic characteristic.
The results of this sensitivity analysis show that the frequency range that STC incorporates does
not fully quantify a structure’s acoustic performance of sound transmission. An extension down to the one-
third octave center frequency of 100 Hz was able to capture the coincidence dip, but does it capture the full
coincidence region? It is conceptually unlikely that an STC extension down to 100 Hz is the best solution
to quantify acoustic performance. To fully evaluate a shaped concrete slab’s acoustic performance, an
acoustic metric needs to be investigated at lower airborne frequencies in addition to structural-borne sounds.

133
Appendix C
Angle of Incidence Sensitivity Analysis
The angle of incidence is the angle that an incoming sound wave makes with the normal angle of a
structure as seen in Figure App. C-1. In the body of this thesis, the angle of incidence was held constant at
45°. This was to limit the number of variables that was manipulated in the simulations so that broad
structural-acoustic behaviors could be identified and understood. With a foundation of structural-acoustic
trade-offs for shaped concrete slabs now established, a sensitivity analysis was performed on a variety of
angles of incidence. As mentioned in Section 3.3, the analytical transmission model is dependent on the
angle of sound incidence. Therefore, LHS and MOO were conducted to investigate how the angle of
incidence impacted the objective space. The angles that were investigated were 0°, 30°, 45°, 60°, and 85°,
which provided a broad range of incident angles that could interact with a structure. Lastly, the transmission
coefficients were found from 0° to 85° at intervals of 5° and averaged together to evaluate the objective
spaces over a large range of angles.
Figure App. C-1: Angle of incidence of an incoming sound wave.
First, LHS was investigated at the five angles of incidence. To provide context for 0°, 30°, 60°, and
85° angles, the objective space found from sampling at an angle of incidence of 45° is provided from
Chapter 4. The figure displays the qualified and unqualified designs against each other.

134
Figure App. C-2: The qualified objective space at angle of incidence of 45° using LHS.
Since the analytical transmission model is dependent on the angle of incidence, it is expected that
the objective space for the other four angles contrasts to the objective space found previously.

135
Figure App. C-3: The qualified objective space at angles of incidence of 0°, 30°, 60°, and 85° using LHS.
Figure App. C-3 indicates that the objective space drastically changes based on the angle of
incidence. In general, as the angle of incidence increases, the number of qualified designs increases.
Additionally, the qualified designs have less mass as the angle of incidence increases while maintaining
acceptable to great acoustic quality. Another note is that the 0° objective space resembles the results of
evaluating structural mass and STC using mass law, suggesting that evaluation at just 0° does not capture
a shaped slab’s full airborne acoustic performance.
The 45° objective space suggests a good median when investigating a single angle of incidence, as
it indicates the general structural-acoustic logarithmic relationship while showing that the shaped slab’s
airborne acoustic performance can dramatically increase when the coincidence region is not fully captured.

136
Yet the 45° objective space does not fully indicate a shaped slab’s acoustic performance, especially for
shaped slabs with low structural mass. Therefore, sampling was run while averaging the transmission
coefficients over a range of incidence angles from 0° to 85° at intervals of 5°. It is important to average the
transmission coefficients obtained at each of the angles as transmission loss values cannot be linearly
averaged due to the logarithmic relationship between the transmission coefficient and transmission loss
values.
Figure App. C-4: The qualified objective space at a range of angles of incidence from 0° to 85° using LHS.
Figure App. C-4 indicates that the structural-acoustic relationship is logarithmic, as suggested at
lower angles of incidence. Additionally, when a range of angles of incident are considered, the qualified
designs in the objective space do not drastically increase in STC once a specific structural mass is reached.
This feature is leveled out, but it does increase the overall acoustic performance for shaped slabs with lower
structural mass than previously found in the objective space using an angle of incidence of 45°.
To further evaluate the impact that the angle of incidence has on the objective space, MOO is used
to identify the best shaped slab designs. Similar to LHS, angles of incidence of 0°, 30°, 60°, and 85° were
assessed individually by MOO, and then a range of angles of incidence from 0° to 85° at 5° intervals was
investigated using MOO.

137
Figure App. C-5: The qualified objective space at angles of incidence of 0°, 30°, 60°, and 85° using MOO.
Figure App. C-5 indicates that the objective space drastically changes based on the angle of
incidence to the same extent found by LHS. In general, as the angle of incidence increases, the number of
qualified designs increases. Additionally, the qualified designs have less mass as the angle of incidence
increases while maintaining acceptable to great acoustic quality. It is of particular interest that there is a
noticeable gap between low and high STC ratings when the angle of incidence is 60°. This could be due to
how STC captures the coincidence frequency or another phenomenon. Future research in each of the
objective spaces would provide more clarity on the most suitable single angle solution for evaluating a
structure’s transmission. Despite the differences seen in the above figure, an angle of incidence of 45°
appears to be a good median solution.

138
Figure App. C-6: The qualified objective space at a range of angles of incidence from 0° to 85° using MOO.
Figure App. C-6 indicates that the structural-acoustic relationship is logarithmic when averaging
across a range of angles, as suggested by LHS. Additionally, when a range of angles of incident are
considered, the qualified designs in the objective space do not drastically increase in STC once a specific
structural mass is reached. This feature is leveled out, as found by LHS, but it does increase the overall
acoustic performance for shaped slabs with lower structural mass than previously found in the objective
space using an angle of incidence of 45°.

139
Bibliography
Abbaszadeh, S., Zagreus, L., Lehrer, D., & Huizenga, C. (2006). Occupant satisfaction with indoor
environmental quality in green buildings. HB 2006 - Healthy Buildings: Creating a Healthy Indoor
Environment for People, Proceedings, 3, 365–370.
ACI Committee 318, & American Concrete Institute. (2019). Building code requirements for structural
concrete (ACI 318-19): An ACI standard: commentary on building code requirements for structural
concrete (ACI 318R-19), an ACI report. American Concrete Institute.
Ajayi, S. O., Oyedele, L. O., Jaiyeoba, B., Kadiri, K., & David, S. A. (2016). Are sustainable buildings
healthy? An investigation of lifecycle relationship between building sustainability and its
environmental health impacts. World Journal of Science, Technology and Sustainable Development,
13(3), 190–204.
Akama, T., Suzuki, H., & Omoto, A. (2010). Distribution of selected monaural acoustical parameters in
concert halls. Applied Acoustics, 71(6), 564–577.
Ali, M. (2001). Evolution of concrete skyscrapers: from Ingalls to Jin mao. In Electronic Journal of
Structural Engineering, 1(1), 2-14.
Ali, M., & Sun Moon, K. (2007). Structural developments in tall buildings: current trends and future
prospects. Architectural Science Review, 50(3), 205-223.
American Society of Civil Engineers (2010). Minimum Design Loads for Buildings and Other Structures.
ASCE/SEI Standard 7-10. American Society of Civil Engineers.
Aouf, R. S. (2019). Plastic bubbles incorporated into high-rise to reduce concrete usage by 35 per cent.
Retrieved from: dezeen.com/2019/11/23/reduction-concrete-plastic-bubbles-enables-cobiax/
Aries, M. B., Veitch, J. A., & Newsham, G. R. (2010). Windows, view, and office characteristics predict
physical and psychological discomfort. Journal of Environmental Psychology, 30(4), 533-541.
ASTM International. (2016). E413 Classification for Rating Sound Insulation. ASTM International.
Badino, E., Shtrepi, L., & Astolfi, A. (2020). Acoustic performance-based design: a brief overview of the
opportunities and limits in current practice. Acoustics, 2(2), 246-278.
Balta, M. T., Dincer, I., & Hepbasli, A. (2010). Performance and sustainability assessment of energy options
for building HVAC applications. Energy and Buildings, 42(8), 1320-1328.
Barron, M., Auditorium Acoustics and Architectural Design. (2nd ed.), Spon Press, 2010.
Beghini, L. L. et al. (2014). Structural optimization using graphic statics. Structural and Multidisciplinary
Optimization, 49(3), 351-366.

140
Belegundu, A. D., & Arora, J. S. (1985). A study of mathematical programming methods for structural
optimization. Part I: Theory. International Journal for Numerical Methods in Engineering, 21(9),
1583–1599.
Bendsøe, M. P., & Kikuchi, N. (1988). Generating optimal topologies in structural design using a
homogenization method. Computer Methods in Applied Mechanics and Engineering, 71(2), 197–224.
Berkhoff, A. P. (2000). Sensor scheme design for active structural acoustic control. The Journal of the
Acoustical Society of America, 108(3), 1037-1045.
Berry, A., & Nicolas, J. (1994). Structural acoustics and vibration behavior of complex panels. Applied
Acoustics, 43(3), 185–215.
Blackstock D.T., Fundamentals of Physical Acoustics. Wiley, 2000.
Blanchet, T., Fournier, J., & Piketty, T. (2017). Generalized Pareto curves: theory and applications. World
Wealth & Income Database: The Source for Global Inequality Data.
Block, P., & Ochsendorf, J. (2007). Thrust network analysis: A new methodology for three-dimensional
equilibrium. Journal of the International Association for Shell and Spatial Structures, 48(3), 1–7.
Brown, N. C. Multi-Objective Optimization Conceptual Design of Structures. SMBT Thesis, Massachusetts
Instiute of Technology, 2016.
Brown, N. C. Early Building Design Using Multi-Objective Data Approaches. Doctoral Dissertation,
Massachusetts Institute of Technology, 2019.
Brownlee, A., & Wright, J. (2015). Constrained, mixed-integer and multi-objective optimization of building
designs by NSGA-II with fitness approximation. Applied Soft Computing, 33, 114-126.
Cabeza, L. F., Barreneche, C., Miró, L., Morera, J. M., Bartolí, E., & Inés Fernández, A. (2013). Low
carbon and low embodied energy materials in buildings: A review. Renewable and Sustainable Energy
Reviews, 23(C), 536-542.
Cassidy, M., Cooper, R. K., Gault, R., & Wang, J. (2008). Evaluation of standards for transmission loss
tests, in Proceedings - European Conference on Noise Control. Acoustics '08 Paris, 1675–1679.
Ching, F. D. K., Building Construction Illustrated (5th ed.), Hoboken: John Wiley & Sons, 2015.
Clark, D. M. (1970). Subjective study of the sound‐transmission class system for rating building partitions.
The Journal of the Acoustical Society of America, 47(3A), 676–682.
Corriou, J. P., & Azzaro-Pantel, C. (2015). Process optimization strategies. Green Process Engineering,
27–48.
Deb, K., Pratap, A., Agarwal, S., and Meyarivan, T. (2002). A fast and elitist multi-objective genetic
algorithm: NSGA-II. IEEE Transactions on Evolutionary Computation, 6(2), 182-197.

141
Fahy, F. Sound and Structural Vibration. (1st ed.), Academic Press, 1987.
Fay, R., Treloar, G., & Iyer-Raniga, U. (2010). Life-cycle energy analysis of buildings: A case study.
Building Research and Information, 28(1), 31–41.
Field, C. (2008). Acoustic design in green buildings. ASHRAE Journal, September 2008.
Flower, D. J. M., & Sanjayan, J. G. (2007). Green house gas emissions due to concrete manufacture.
International Journal of Life Cycle Assessment, 12(5), 282–288.
Foraboschi, P., Mercanzin, M., & Trabucco, D. (2014). Sustainable structural design of tall buildings based
on embodied energy. Energy and Buildings, 68, 254-269.
Giron, S., Alvarez-Morales, L., & Zamarreno, T. (2017). Church acoustics: a state-of-the-art review after
several decades of research. Journal of Sound and Vibration, 411, 378-408.
Goldberg, D. E. Genetic Algorithms in Seach Optimization and Machine Learning (1st ed.), Addison-
Wesley Publishing Company, Inc, 1989.
Harding, J. (2016). Dimensionality reduction for parametric design exploration. In S. Adriaenssens et al.,
eds. Advances in Architectural Geometry 2016. Zurich, Switzerland, 201-221.
Hawkins, W., Orr, J., Shepherd, P., & Ibell, T. (2019). Design, construction and testing of a low carbon
thin-shell concrete flooring system. Structures, 18, 60-71.
Henriksson, V., & Hult, M. (2015). Rationalizing freeform architecture: Surface discretization and multi-
objective optimization. MS Thesis, Chalmers Univesity.
Huberman, N., Pearlmutter, D., Gal, E., & Meir, I. A. (2015). Optimizing structural roof form for life-cycle
energy efficiency. Energy Build, 104(C), 336-349.
International Code Council (ICC), 2018 International Building Code. International Code Council, 2018.
Ismail M. Materially Efficient Structural Floor Systems for Housing in India. SMArchS Thesis,
Massachusetts Institute of Technology, 2019.
Ismail, M. A., & Mueller, C. (2019). Computational structural design and fabrication of hollow-core
concrete beams, in Proceedings of the IASS Symposium 2018, Creativity in Structural Design, Mueller
C. and Adriaenssens S. (eds), 2018, 1-8.
Jipa A., Bernhard M., Meibodi M.A., & Dillenburger B. (2016). 3D-printed stay-in-place formwork for
topologically optimized concrete slabs, in TxA Emerging Design + Technology, 96-107.
Johnson, W. M., & Cunefare, K. A. (2002). Structural acoustic optimization of a composite cylindrical shell
using FEM/BEM. Journal of Vibration and Acoustics, Transactions of the ASME, 124(3), 410–413.
Johnson, W. M., & Cunefare, K. A. (2007). Use of principle velocity patterns in the analysis of structural
acoustic optimization. The Journal of the Acoustical Society of America, 121(2), 938–948.

142
Jones C., Hammond G., Lowrie F., & Tse P. (2011). Embodied Carbon: The Inventory of Carbon and
Energy (ICE). Building Services Research & Information Association.
Kamaruzzaman, S. N., Razali, A., Zawawi, A., & Riley, M. (2018). Factors affecting indoor environmental
quality and potential health risks of housing residents, in National Invention and Innovation Through
Exhibition Competition Conference 2017.
Karaiskou, A. (2018). Bricks as Spatial Sound Modulators - Towards Tuning the Geometry. MS Thesis,
Delft University of Technology.
Kheiri, F. (2018). A review on optimization methods applied in energy-efficient building geometry and
envelope design. Renewable and Sustainable Energy Reviews, 92, 897-920.
Lenzen, M., & Treloar, G. (2002). Embodied energy in buildings: wood versus concrete-reply to Borjesson
and Gustavsson. Energy Policy, 30(3), 249-255.
Lloret, E., Shahab, A. R., Mettler, L. K., & Flatt, R. J. (2015). Complex concrete structures: merging
existing casting techniques with digital fabrication. Computer-Aided Design, 60, 40-49.
Long, M. Architectural Acoustics. (2nd ed.), Elsevier Science & Technology, 2014.
Marburg, S., Shepherd, M., & Hambric, S. A. Structural – Acoustic Optimization. Engineering
Vibroacoustic Analysis: Methods and Applications (1st ed.), 268–304. John Wiley & Sons, 2016.
Marchon, D., Kawashima, S., Bessaies-Bey, H., Mantellato, S., & Ng, S. (2018). Hydration and rheology
control of concrete for digital fabrication: Potential admixtures and cement chemistry. Cement and
Concrete Research, 112, 96-110.
Marler, R. T., & Arora, J. S. (2004). Survey of multi-objective optimization methods for engineering.
Structural and Multidisciplinary Optimization, 26, 369–395.
May-Ostendorp, P., Henze, G. P., Corbin, C. D., Rajagopalan, B., & Felsmann, C. (2011). Model-predictive
control of mixed-mode buildings with rule extraction. Building and Environment, 46(2), 428–437.
Mckay, M., Beckman, R., & William C. (1979). A comparison of three methods for selecting vales of input
variables in the analysis of output from a computer code. Technometrics, 21, 239-245.
McCormick, C. A., & Shepherd, M. R. (2020). Design optimization and performance comparison of three
styles of one-dimensional acoustic black hole vibration absorbers. Journal of Sound and Vibration,
470, 1-12.
Meibodi, M. A., Jipa, A., Giesecke, R., Shammas, D., Bernhard, M., Leschok, M., Graser, K. and
Dillenburger B. (2018). Smart slab – computational design and digital fabrication of a lightweight
concrete slab, in ACADIA 2018: Imprecision in Materials + Production, 434-443.
Méndez Echenagucia, T., Roozen, N. B., & Block, P. (2016). Minimization of sound radiation in doubly

143
curved shallow shells by means of structural stiffness, in Proceedings of the IASS Annual Symposium
2016, Spatial Structures in the 21st Century, 1–10.
Méndez Echenagucia, T., Sassone, M., Astolfi, A., Shtrepi, L., & van der Harten, A. (2013). EDT, C80 and
G driven auditorium design. Building Acoustics, 21(1), 43–54.
Miller, D., Doh, J., & Mulvey, M. (2015). Concrete slab comparison and embodied energy optimisation for
alternate design and construction techniques. Shell Structures for Architecture: Construction and
Building Materials, 80, 329-338.
Mitchell, A. G. (1904). The limits of economy of material in frame-structures. Philosophical Magazine,
8(47), 589-597.
Moeller, N. (2014). Retrofitting Sound Masking: Improving speech privacy and noise control in occupied
spaces. Retrieved from: constructionspecifier.com/retrofitting-sound-masking-improving-speech-
privacy-and-noise-control-in-occupied-spaces/
Monedero, J. (2000). Parametric design: a review and some experiences. Automation in Construction, 9,
369-377.
Moritz, C., Shaw, J., Carrera, A., Chen, K., & Herrin, D. (2015). Measurement and prediction of the sound
transmission loss for various sample positions. INTER-NOISE 2015 - 44th International Congress
and Exposition on Noise Control Engineering, 1–12.
Muttoni, A. The Art of Structures: Introduction to the Functioning of Structures in Architecture. EPFL
Press, 2011.
Nandy, A. K., & Jog, C. S. (2012). Optimization of vibrating structures to reduce radiated noise. Structural
and Multidisciplinary Optimization, 45(5), 717–728.
Ng, C. F., & Hui, C. K. (2008). Low frequency sound insulation using stiffness control with honeycomb
panels. Applied Acoustics, 69(4), 293–301.
Northwood, T. D. (1962). Sound-insulation ratings and the new ASTM sound-transmission class. The
Journal of the Acoustical Society of America, 34(4), 493-501.
Oxman, R., & Gu, N. (2015). Theories and models of parametric design thinking, in eCAADe 33, 1-6.
Pray, R., 2020 National Construction Estimator. (68th ed.), Craftsman, 2020.
Rardin, R., Optimization in Operations Research. (2nd ed.), Pearson, 2016.
Rasmussen, B. (2010). Sound insulation between dwellings - requirements in building regulations in
Europe. Applied Acoustics, 71(4), 373-385.
Rindel, J. H. Sound Insulation in Buildings (1st ed.). Boca Raton: Taylor & Francis Group, 2018.

144
Roozen, N. B., Leclère, Q., Urbán, D., Méndez Echenagucia, T., Block, P., Rychtáriková, M., & Glorieux,
C. (2018). Assessment of the airborne sound insulation from mobility vibration measurements; a
hybrid experimental numerical approach. Journal of Sound and Vibration, 432, 680–698.
Sekuler, R. (2002). Reverberation and the Art of Architectural Acoustics. Retrieved from:
people.brandies.edu.
Seto, K. C., Dhakal, S. (2014). Human settlements, infrastructure, and spatial planning. Mitigation of
Climate Change, 923-1000.
Shepherd, M. R., Campbell, R. L., & Hambric, S. A. (2019). A parallel computing framework for
performing structural-acoustic optimization with stochastic forcing. Structural and Multidisciplinary
Optimization, 61, 675-685.
Shepherd, M. R., & Hambric, S. A. (2014). Minimization of acoustic power radiated by fluid-loaded panel
excited by turbulent boundary layer flow. The Journal of the Acoustical Society of America, 136(5),
2575-2585.
Shi, X., & Yang, W. (2013). Performance-driven architectural design and optimization technique from a
perspective of architects. Automation in Construction. 32, 125-135.
Shoubi, M. V., Bagchi, A., & Barough, A. S. (2015). Reducing the operational energy demand in buildings
using building information modeling tools and sustainability approaches. Ain Shams Engineering
Journal, 6, 41-55.
Timoshenko, S. P. History of Strength of Materials. New York: McGraw-Hill, 1953.
Touloupaki, E., & Theodosiou, T. (2017). Optimization of building form to minimize energy consumption
through parametric modelling. Procedia Environmental Sciences, 38, 509-514.
Turrin, M., Von Buelow, P., & Stouffs, R. (2011). Design explorations of performance driven geometry in
architectural design using parametric modeling and genetic algorithms. Advanced Engineering
Informatics, 25, 656-675.
UN, (2018). World Urbanization Prospects: The 2018 Revision. United Nations Population Division.
Valente, M., Sibai, A., & Sambucci, M. (2019). Extrusion-Based Additive Manufacturing of Concrete
Products: Revolutionizing and Remodeling the Construction Industry. Journal of Composites Science,
3(3), 88.
Wangler, T., Lloret, E., Reiter, L., Hack, N., Gramazio, F., Kohler, M., Bernhard, M., Dillenburger, B.,
Buchli, J., Roussel, N., & Flatt, R. (2016). Digital concrete: opportunities and challenges. RILEM
Technical Letters, 1, 67-75.
Warnock, A. C. C. (1985). Factors affecting sound transmission loss, Canadian Building Digest, July 1985.

145
Wennhage, P. (2002). Weight Optimization of Sandwich Panel with Acoustic Constraints, Experimental
Verification. Journal of Sandwich Structures & Materials, 4(4), 353–365.
Wennhage, P. (2003). Weight Optimization of Large Scale Sandwich Structures with Acoustic and
Mechanical Constraints. Journal of Sandwich Structures and Materials, 5(3), 253–266.
De Wolf C., Pomponi F., & Moncaster A. (2017). Measuring embodied carbon dioxide equivalent of
buildings: A review and critique of current industry practice. Energy and Buildings, 140, 68-80.
Woodbury, R., Elements of Parametric Design. Taylor & Francis Group, 2010.
Wortmann, T. (2017). Surveying design spaces with performance maps: a multivariate visualization method
for parametric design and architectural design optimization. International Journal of Architectural
Computing, 15(1), 38-53.