Embed Size (px)
Citation preview

TEXAS TRANSPORTATION INSTITUTE
CRASH TESTING AND EVALUATION OF SAFETY-SHAPED CONCRETE MEDIAN BARRIER RETROFITTED
~THCONCRETEGLARESCREEN
by
D. Lance Bullard, Jr. Engineering Research Associate
TTl Research Study No. 270687-WDTl Final Report
Sponsored by
Washington State Department of Transportation Transportation Building
P.O. Box 47300 Olympia, W A 98504-7300
SEPTEMBER 1995
TEXAS TRANSPORTATION INSTITUTE THE TEXAS A & M UNIVERSITY SYSTEM
COLLEGE STATION, TEXAS

CRASH TESTING AND EVALUATION OF SAFETY-SHAPED CONCRETE MEDIAN BARRIER RETROFITTED
WITH CONCRETE GLARE SCREEN
by
D. Lance Bullard, Jr. Engineering Research Associate
TTl Research Study No. 270687-WDTI Final Report
Sponsored by
Washington State Department of Transportation Transportation Building
P.O. Box 47300 Olympia, W A 98504-7300
September 1995
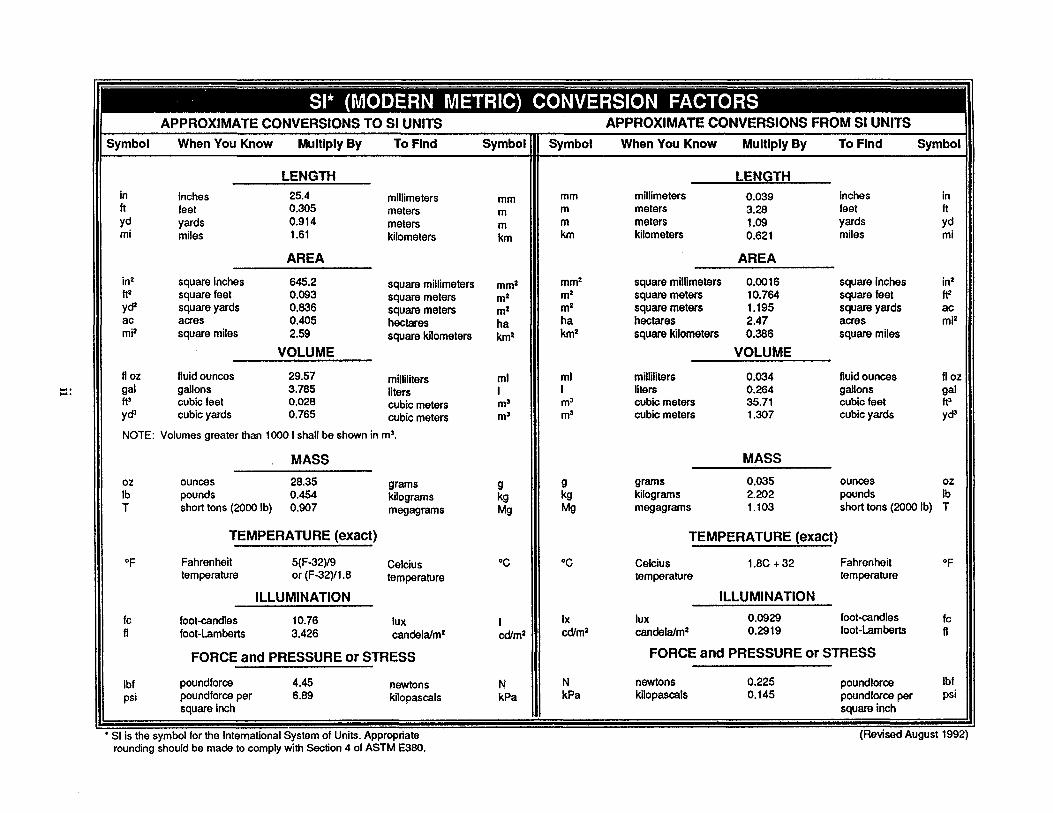
APPROXIMATE CONVERSIONS TO Sl UNITS APPROXIMATE CONVERSIONS FROM Sl UNITS
Symbol When You Know Multiply By To Find Symbol Symbol When You Know Multiply By To Find Symbol
LENGTH LENGTH in inches 25.4 millimeters mm mm millimeters 0.039 inches in ft feet 0.305 meters m m meters 3.28 feet ft yd yards 0.914 meters m m meters 1.09 yards yd mi miles 1.61 kilometers km km kilometers 0.621 miles mi
AREA AREA
in2 square inches 645.2 square millimeters mm2 mm2 square millimeters 0.0016 square inches in2
ft2 square feet 0.093 square meters mz mz square meters 10.764 square feet ft2 yd2 square yards 0.836 square meters mz mz square meters 1.195 square yards ac ac acres 0.405 hectares ha ha hectares 2.47 acres mi2
mi2 square miles 2.59 square kilometers km2 km2 square kilometers 0.386 square miles
VOLUME VOLUME
fl oz fluidounces 29.57 milliliters ml ml milliliters 0.034 fluid ounces floz -· gal gallons 3.785 liters I I liters 0.264 gallons gal -· ft3 cubic feet 0.028 cubic meters m3 m3 cubic meters 35.71 cubic feet ft3 yd3 cubic yards 0.765 cubic meters m3 m3 cubic meters 1.307 cubic yards yd3
NOTE: Volumes greater than 1000 I shall be shown in m3.
MASS MASS
oz ounces 28.35 grams g g grams 0.035 ounces oz lb pounds 0.454 kilograms kg kg kilograms 2.202 pounds lb T short tons (2000 lb) 0.907 megagrams Mg Mg megagrams 1.103 short tons (2000 lb) T
TEMPERATURE (exact) TEMPERATURE (exact)
OF Fahrenheit 5(F-32)19 Celcius oc oc Celcius 1.8C + 32 Fahrenheit OF temperature or (F-32)11.8 temperature temperature temperature
ILLUMINATION ILLUMINATION
fc foot-candles 10.76 lux lx lux 0.0929 foot-<:andles fc fl foot-Lamberts 3.426 candelalm2 cdlm2 cdlm2 candelalm2 0.2919 foot-Lamberts fl
FORCE and PRESSURE or STRESS FORCE and PRESSURE or STRESS
lbf pound force 4.45 newtons N N newtons 0.225 pound force lbf psi poundforce per 6.89 kilopascals kPa kPa kilo pascals 0.145 poundforce per psi
square Inch square inch
• Sl is the symbol for the International System of Units. Appropriate (Revised August 1992) rounding should be made to comply with Section 4 of ASTM E380.

DISCLAIMER
, This document is disseminated under the sponsorship of the Washington State Department of Transportation. The contents of this report reflect the views of the author who is solely responsible for the opinions, findings, and conclusions presented herein. This report does not necessarily reflect the official views or policies of Texas Transportation Institute. This report does not constitute a standard, specification, or regulation. Texas Transportation Institute assumes no liability for its contents or use thereof. Texas Transportation Institute does not endorse products or manufacturers.
iii
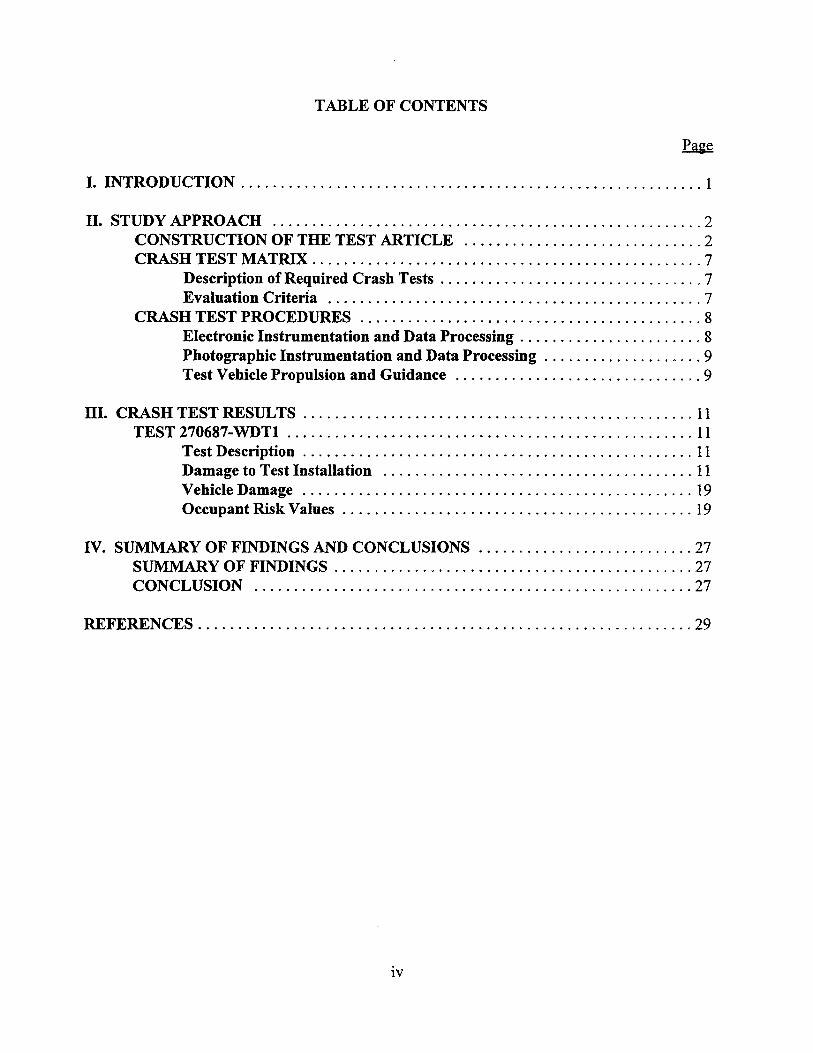
TABLE OF CONTENTS
I. INTRODUCTION .......................................................... I
II. STUDY APPROACH ...................................................... 2 CONSTRUCTION OF THE TEST ARTICLE .............................. 2 CRASH TEST MATRIX ................................................. 7
Description of Required Crash Tests ................................. 7 Evaluation Criteria ............................................... 7
CRASH TEST PROCEDURES ........................................... 8 Electronic Instrumentation and Data Processing ....................... 8 Photographic Instrumentation and Data Processing .................... 9 Test Vehicle Propulsion and Guidance ............................... 9
III. CRASH TEST RESULTS ................................................. II TEST270687-WDT1 ................................................... II
Test Description ................................................. 11 Damage to Test Installation ....................................... II Vehicle Damage ................................................. 19 Occupant Risk Values ............................................ I9
IV. SUMMARY OF FINDINGS AND CONCLUSIONS ........................... 27 SUMMARY OF FINDINGS ............................................. 27 CONCLUSION ....................................................... 27
REFERENCES .............................................................. 29
iv

LIST OF FIGURES
Figure No. Page
1 Details of the safety-shaped concrete median barrier ......................... 3
2 Details of the concrete glare screen ....................................... 4
3 Safety-shaped CMB installation with glare screen before test 270687-WDT1 ............................................ 0. 5
4 Pin and wire loop connection for glare screen before test 270687.,WDT1 .............................................. 6
5 Vehicle/barrier geometries for test 270687-WDT1 .......................... 12
6 Vehicle before test 270687-WDT1 ...................................... 13
7 Vehicle properties for test 270687-WDT1 ................................. 14
8 Sequential photographs for test 270687-WDT1. (overhead and frontal views) ........................................... 15
9 Sequential photographs for test 270687-WDTl. (perpendicular view) ................................................. 17
10 Safety-shaped CMB installation with glare screen after test 270687-WDT1 .............................................. 18
11 Vehicle after test 270687-WDT1 ........................................ 20
12 Vehicle after being uprighted (test 270687-WDT1) ......................... 21
13 Summary of results for test 270687-WDT1 ................................ 22
14 Vehicle angular displacements for test 270687-WDT1 ....................... 23
15 Vehicle longitudinal accelerometer trace for test 270687-WDT1 ........... 0 ••• 24
16 Vehicle lateral accelerometer trace for test 270687-WDT1 .................... 25
17 Vehicle vertical accelerometer trace for test 270687-WDT1 ................... 26
v

LIST OF TABLES
Table No. Page
1 Assessment of results oftest on the concrete safety-shaped barrier with glare screen .................................................... 28
VI
I. INTRODUCTION
The Washington State Department of Transportation initiated a crash-test program at Texas Transportation Institute (TTl) Proving Ground to evaluate the safety performance of a pin and wire loop type concrete safety-shaped median barrier retrofitted with a concrete glare screen according to National Cooperative Highway Research Program (NCHRP) Report 350 "Recommended Procedures for the Safety Performance Evaluation of Highway Features".W A portable type installation (i.e. not anchored to the pavement) was constructed and tested by means of a full-scale high-speed vehicular crash test.
This report covers the construction and performance of the crash test performed. The crash test was performed and evaluated in accordance with National Cooperative Highway Research Program (NCHRP) Report 350.
1

II. STUDY APPROACH
CONSTRUCTION OF THE TEST ARTICLE
A concrete safety-shaped median barrier (CMB) type installation was retrofitted with a 457 mm concrete glare screen (the entire installation will herei:a be referred to as CMBGS). The CMB segments were 700 mm wide at the base, 152 mm wide at the top and 813 mm tall. The installation was constructed of fifteen 3.0 m long CMB segments attached together by a wire loop and pin connection. Anchorage of the CMB installation to the roadway was not provided for this test. The installation was constructed the same as would be installed in both permanent and work zone type installations. The total test installation length was 46 m.
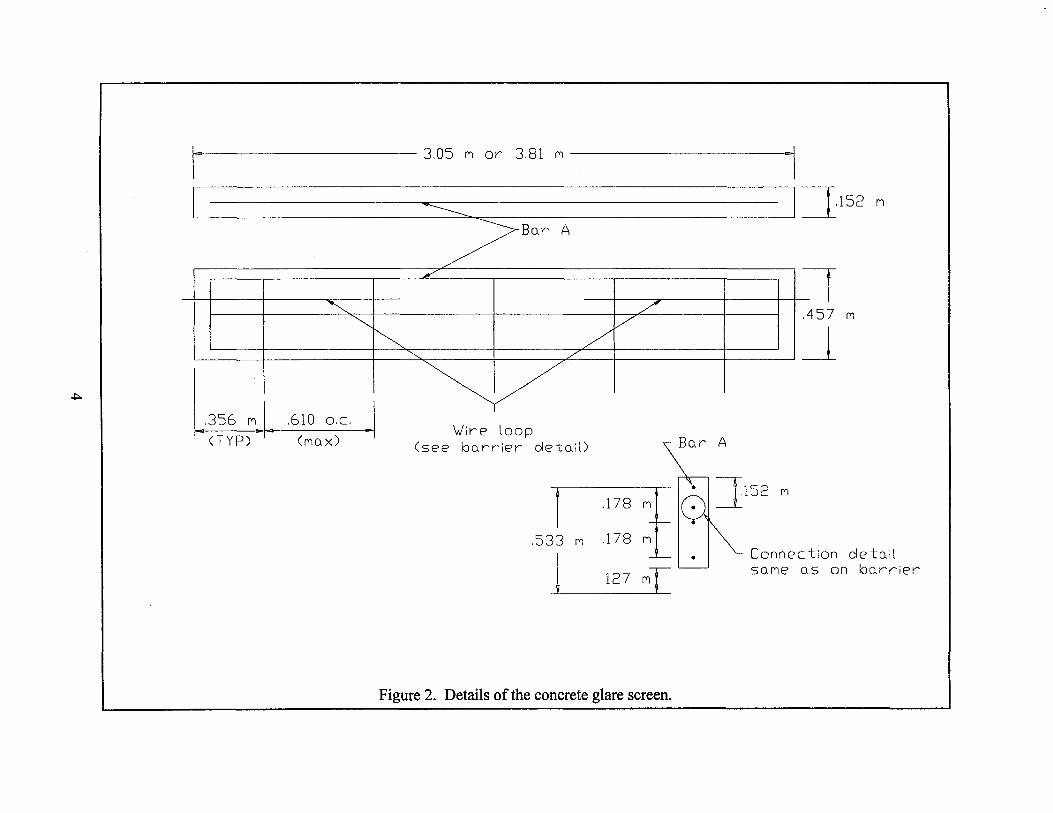
Attached to the top of the CMB segments were precast concrete glare screens. The glare screens were 152 mm wide at the base, 127 mm wide at the top and 3 m long. Each glare screen was anchored to the top of the CMB segment by five number 15 grade 300 steel reinforcing dowels. The dowels protruded from the bottom of the glare screen and were anchored into the CMB segments by drilling 32 mm diameter holes into the top of the CMB and filling with grout. The dowels were typically spaced 356 mm from the end of the glare screen and a maximum of 610 mm apart thereafter. Like the CMB segments, the glare screen segments were attached together at the ends with a wire loop and pin connection.
The wire loop connection was fabricated from 16 mm diameter 25 wires in 6 strands IP steel with IWRC center wrapped RRL with a minimum breaking strength of 159 kN. The wire loops were fastened together with a 29 mm diameter, 1 143 mm long steel pin. The pins were placed through the wire loops and held in place with a steel plate washer over the pin and a cotter pin placed through the pin on top of the washer. The pin and washer anchor was used only at the top loop. No upward restraint of the pin was provided.
Detailed specifications of the concrete safety-shaped median barrier type installation retrofitted with a 457 mm concrete glare screen installation are shown in figures 1 and 2, respectively. Photographs of the completed installation are shown in figures 3 and 4.
2

1 1/l'"Hotrr,.. , ....... fi c.-a1 Nolin ""'"«:e~~~Unbll'ocll~lum~bf'U..ccNorioiOI'ICIII'oclllolll'! ::T"..=. ~ ':"'~~::'~· ~';d.4t..'';:ro;,~ ,.,...:.h,.-co9..t(tltt.e~ ...
\ll:rletial1lt>GIIO'oMt!NICilli»>r.tro"i'IY.i"''tq'"""'411\1;
~~ J=~~Mfi~,:C,:'J8~~ o.roomM••~~SM-..r~·ASNMt1(l"coo5Vwjtll~.o.ooo,...) ~OIIS\..tASNAJ6er~ 1'"-llgp~~· I!IWar. tlrendl
~ : Steol ~~~!;'~:.W 1om. ,alq.OOI.Cdorsl'oc!INr~~ .. :U.UO. U.ifom!T•of'llcCor!llalo...icM(~""Ihal
1\oMIIIIt<lll-~oo.
~e:r~~of~~~'£·?..-:::o:: ~~~ -~'"""'"":tl Ocwlll>ol" ill PI""'" .... ~ bf'69t IIOIII"cct ortlo ..,.,c;~ O.pcx. tllol
SPECIAL END UNIT ::::=~~~:S.W:t::r~ ~loo!lo~r.dlllt4'..,1Nptlce"""""otriwl~ltm1.
No5cotr
TYPICAL PRECAST UNI I lbS(IIIt
~r==·~~~rC$.;;t!:~· "'"'- lo:Wod.,. .... irfo<·r:~ d •oo~WJ loll,.,..,. b'J pgetdatoo.wlrl<ltlotb•_,.,,.,.
::;•~C~~~ !P'~a:! c:~';!~!,.o!:::~!~t,~OIIC.!:''b~~!'"' r ..... t Nlghtoy Ad"II>IS't<"v.\1011. Tntt'dCOMt'C'liOftt """PI~> tlld LQ09 CO.torh thou), o-~nrl Splrcn, Vrttrnl 1·11'o"• lo!lP"d
•q.uvott'llt hstrn. ~~~,;j=lll.lfor-~~.,. 1 ~tUit not tl'lo•• Oft lhrt dr'oot•g rut1
VIRE ROPE LOQP DElAIL ' Sc:ol•• 1 Ill·· • 1 '·I'' ~~~~~~~:~:,.~'7,~,'1"11°.tC~t"t\",~\"{'"'~~~~r':'h,!'!t~;,;,,/:;":011~~,:,:~ t
f , Pt1cr J 649rlt PI'~ Uolrt QPP011t" trofr:c stdrrof ~~rtf't'.
l. Ploc• 3 cto ... t, prr ll'>tt t'llth ~~~• of borrlt~ thto bo.N'II'r ~pvoiH \roHI(.
~~~·
®c'"'~~"~~'"""~~"'~'"""· "'"''~ 4fnt,J'IortUII.hl"-ll h"""IP(trd\o lldoiSitMhiiiOf"'"I"'(OOot'(tlcr>t).
I _I ;:;;, Vtcl I to ..,.,,.,. to ~··-• <>e··. __ __JV\It...l.---1 - tl'r (D ~I ... >Cicr> II lnl I~ l' •II' '.
SECT ION A-A
Figure 1. Details of the safety-shaped concrete median barrier.
DETAILS or PRECASI BARRIER fOR
TEMPORARY TRAfrJC CONTROL
1896.
~------------ 3.05 M or 3.81 M -----------~
.________ /Bar A
/
"' / ~
~ / /
-........_ /
~ 'Wire loop
(see barrier detail)
.610 o.c. .. 1
(Max) CTYP)
r .178
:£ .533 M .178
j .127 MT
Figure 2. Details of the concrete glare screen.
Bar A
~.152 M
~ 457 M
_l
Connection detail saMe as on barrier

Figure 3. Safety-shaped CMB installation with glare screen before test 270687-WDTI.
5
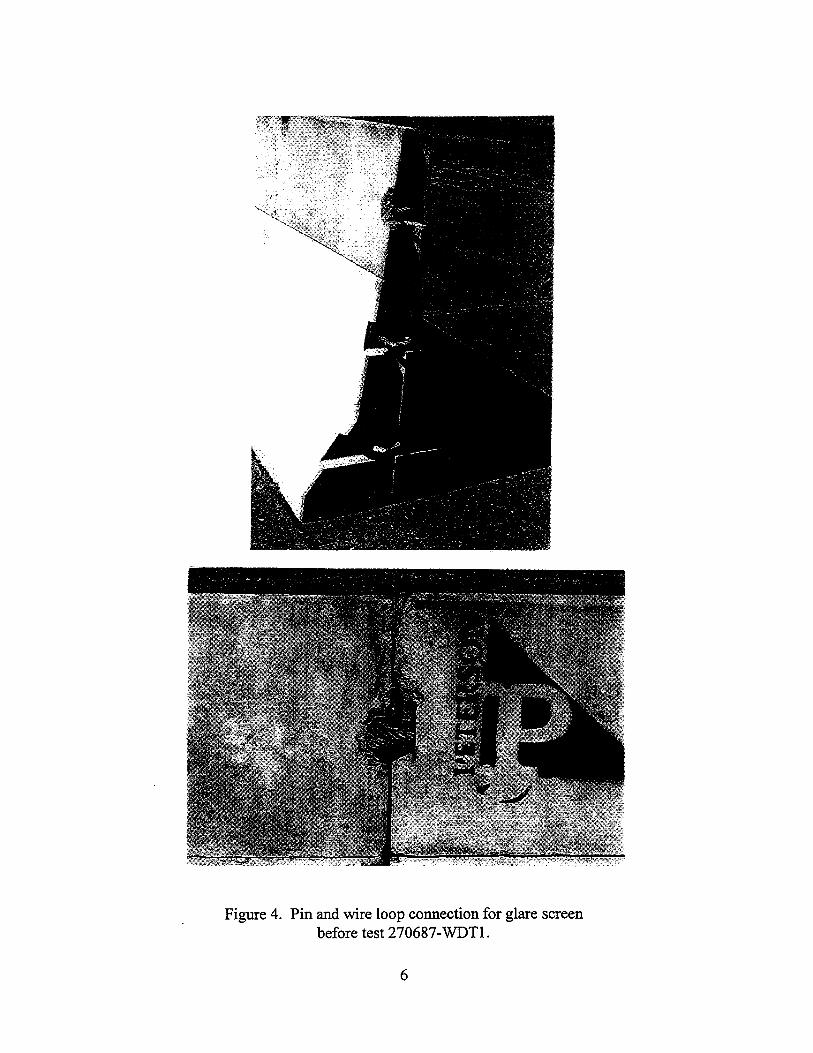
Figure 4. Pin and wire loop connection for glare screen before test 270687-WDTl.
6
CRASH TEST MATRIX
Description of Required Crash Tests
According to NCHRP Report 350 guidelines, two crash tests are recommended for test level- 3 (TL3) evaluation oflongitudinal barriers:
NCHRP Test Designation 3-10: 820C vehicle impacting the length of need section at a speed of 1 00 km/h with the vehicle bumper at an impact angle of 25 degrees.
NCHRP Test Designation 3-11: 2000P vehicle impacting the length of need section at a speed of 1 00 km/h with the vehicle bumper at an impact angle of 25 degrees.
The small car test is conducted for evaluating the overall performance characteristics of the length-of-need section of a longitudinal barrier in general, and occupant risks in particular. The pickup truck test is performed for the purpose of evaluating the strength of the section in containing and redirecting the larger and heavier vehicle. Occupant risks are of foremost concern in the evaluation of both tests. However, the primary objective of this study was to evaluate the structural adequacy of the installation in containing and redirecting errant vehicles. Therefore, only NCHRP crash test designation 3-11 was performed under this study.
Evaluation Criteria
All crash tests were evaluated in accordance with the criteria presented in NCHRP Report 350. As stated in NCHRP Report 350, "Safety performance of a highway appurtenance cannot be measured directly but can be judged on the basis of three factors: structural adequacy, occupant risk, and vehicle trajectory after collision." Accordingly, the following safety evaluation criteria from Table 5.1 ofNCHRP Report 350 were used for test designation 3-11 performed in this study:
e Structural adequacy
(A) The test article should contain and redirect the vehicle; the vehicle should not penetrate, underride, or override the installation although controlled lateral deflection of the test article is acceptable.
(D) Detached elements, fragments or other debris from the test article should not penetrate or show potential for penetrating the occupant compartment or present undue hazard to other traffic, pedestrians, or personnel in a work zone. Deformations of, or intrusions into,
7

the occupant compartment that could cause serious injuries should not be permitted.
e Occupant Risk
(F) The vehicle should remain upright during and after collision although moderate roll, pitching and yawing are acceptable.
e Vehicle Trajectory
(K) After collision, it is preferable that the vehicle's trajectory not intrude into adjacent traffic lanes.
(L) The occupant impact velocity in the longitudinal direction should not exceed 12m/sand the occupant ridedown acceleration in the longitudinal direction should not exceed 20 g's.
(M) The exit angle from the test article preferably should be less than 60 percent of test impact angle, measured at time of vehicle loss of contact with test device.
CRASH TEST PROCEDURES
Electronic Instrumentation and Data Processing
Each test vehicle was instrumented with three solid-state angular rate transducers to measure roll, pitch and yaw rates; a triaxial accelerometer near the vehicle center-of-gravity to measure longitudinal, lateral, and vertical acceleration levels; and a back-up biaxial accelerometer in the rear of the vehicle to measure longitudinal and lateral acceleration levels. The accelerometers were strain gauge type with a linear millivolt output proportional to acceleration.
Electronic signals from the accelerometers and transducers were transmitted to a base station by means of a constant bandwidth FMJFM telemetry link. Calibration signals were recorded before and after the tests, and accurate, time reference signals were recorded simultaneously with the data. Pressure sensitive switches on the bumpers of impacting vehicles were actuated just prior to impact by wooden dowels to indicate the elapsed time over known distances to provide measurement of impact velocities. The initial contacts also produced "event" marks on the data records to establish the exact instants of contact with the test installations.
The multiplex of data channels, transmitted on one radio frequency, was received at the data acquisition station, and demultiplexed into separate tracks of Inter-Range Instrumentation
8
Group (IRIG) tape recorders. After the test, the data were played back from the tape machines, filtered with anSAE J211 filter, and digitized using a microcomputer. The digitized data were then processed using two computer programs: DIGITIZE and PLOT ANGLE. Brief descriptions of the functions of these two computer programs are provided as follows.
The DIGITIZE program uses digitized data from vehicle-mounted linear accelerometers to compute occupant/compartment impact velocities, time of occupant/compartment impact after vehicle impact, and the highest 10-ms average ridedown acceleration. The DIGITIZE program also calculates a vehicle impact velocity and the change in vehicle velocity at the end of a given impulse period. Maximum average accelerations over 50-ms intervals in each of the three directions are computed. For reporting purposes, the data from the vehicle-mounted accelerometers are filtered with a 60 Hz digital filter and acceleration versus time curves for the longitudinal, lateral, and vertical directions are plotted using a commercially available software package (QUATTRO PRO).
The PLOT ANGLE program uses the digitized data from the yaw, pitch, and roll rate transducers to compute angular displacement in degrees at 0.0067-second intervals and then instructs a plotter to draw a reproducible plot: yaw, pitch, and roll versus time. These displacements are in reference to the vehicle-fixed coordinate system, with the initial position and orientation of the vehicle-fixed coordinate system being that which existed at initial impact.
Photographic Instrumentation and Data Processing
Photographic coverage of the test included three high-speed cameras; one with a field of view perpendicular to and aligned with the test installation, one placed downstream with the field of view parallel to the face of the test article and one placed overhead and perpendicular to the top of the test article. Flash bulbs visible from each camera were activated by pressure sensitive tape switches positioned on the impacting vehicle to indicate the instance of contact with the test installation. The films from these high-speed cameras were analyzed on a computer-linked Motion Analyzer to observe phenomena occurring during the collisions and to obtain time-events, displacements and angular data. A professional Betacam video camera and 35 mm still cameras were used to document the pre-test and post-test condition of the vehicle and test installation.
Test Vehicle Propulsion and Guidance
The test vehicle was towed into the test installation using a steel cable guidance and reverse tow system. A steel cable for guiding the test vehicle was tensioned along the impact path, anchored at both ends, and threaded through a guide plate attachment anchored to the front wheel of the test vehicle. An additional steel cable was connected to the test vehicle, passed around a pulley near the impact points and attached to a tow vehicle. A 2 to 1 speed ratio existed between the test and tow vehicle. Just prior to impact with the test installation, the test vehicle
9

was released to be free-wheeling and unrestrained. The vehicle remained free-wheeling, i.e., no steering or braking inputs, until the vehicle cleared the immediate area of the test site, at which time brakes on the vehicle were activated to bring the vehicle to a safe and controlled stop.
10

III. CRASH TEST RESULTS
TEST 270687-WDTl
A 1989 Ford F-250, shown in figures 5 and 6, was used for the crash test. Curb weight of the vehicle was 2059 kg and its test inertia weight was 2000 kg. The height to the lower edge of the vehicle bumper was 475 mm and it was 735 nun to the upper edge of the bumper. Additional dimensions and information on the vehicle are given in figure 7. The vehicle was directed into the concrete safety-shaped median barrier installation retrofitted with a concrete glare screen installation (hereafter, CMBGS), using the cable reverse tow and guidance system, and was released to be free-wheeling and unrestrained just prior to impact.
Test Description
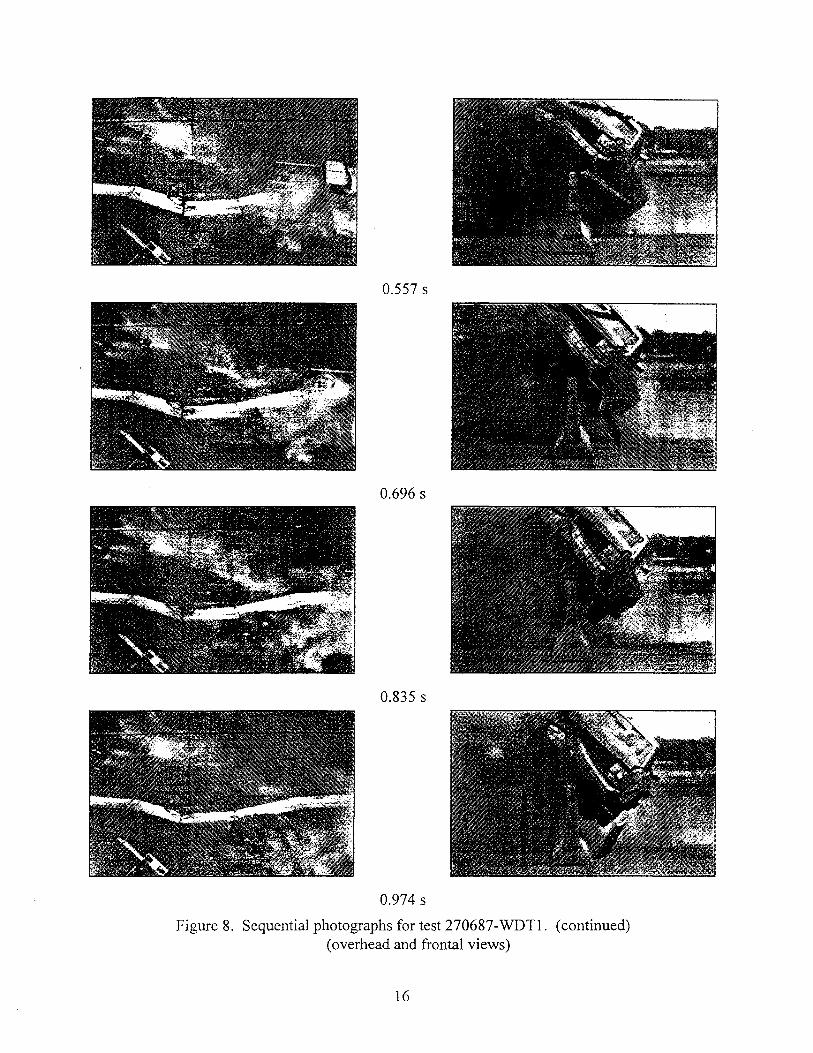
The vehicle impacted 14.0 m from the end of the 45.7 m long test installation (1.2 m upstream of joint no. 5) at a speed of 104.2 km/h and a 25.6 degree impact angle. As the vehicle impacted the installation, the bumper began to deform. The right front tire began to climb the lower face of the CMBGS and had lost contact with the pavement by 0.013 second. As the vehicle climbed the CMBGS, the test installation began to displace and the top of the installation rotated rearward. At approximately 0.183 second, the left front tire became airborne and subsequently struck the upper sloped portion of the CMBGS by 0.319 second. Shortly thereafter, the left rear tire struck the lower portion of the CMBGS at 0.502 second and began to climb the installation. The vehicle climbed up the installation obtaining a height such that the center of the left front spindle was even with the top of the glare screen and the right side of the vehicle was over the installation and not in contact with the installation. As the vehicle started to descend, the inside of the right front wheel snagged on the top of the glare screen. As the vehicle exited the installation at 1.461 s, the vehicle landed on the left side tires, rolled onto its side, slid and came to rest 3 7.2 m downstream from the point of impact. Sequential photographs of the crash test are shown in figures 8 and 9. Final rest positions of the vehicle and test installation are shown in figure 10.
Damage to Test Installation
As can be seen in figure 10, the test installation received moderate damage. The barrier was displaced and the concrete in the glare screen was broken within the area of impact. A maximum permanent deflection of 1.0 m occurred at the sixth barrier segment (one segment downstream from initial impact) of the CMBGS test installation. Maximum dynamic roll of the CMBGS installation was 279 mm at maximum deflection. Tire and scrape marks were noted on barrier segment nos. 5 through 9. The vehicle remained in contact with the installation for 14.88 m. There was minimal debris scatter.
11

\ '
Figure 5. Vehicle/barrier geometries for test 270687-WDTl.
12

Figure 6. Vehicle before test 270687-WDTl.
13

DATE: 06,/30,/95
YEAR: 1 989
TEST NO.: 270687-WDIJ
MAKE: FORD
VIN NO.: 1 ETHF25HXKKA24969
MODEL: F-2500
TIRE INFLATION PRESSURE: ------ ODOMETER: -~1c..:4:r...3""."'-3!oi.6 ____ _ TIRE SIZE: LT235 85R 1 6
MASS DISTRIBUTION (kg) LF 553 RF_~5~.o5...,.3..__ __
DESCRIBE ANY DAMAGE TO VEHICLE PRIOR TO TEST:
TEST INERTIAL C.IA.
LR _--=::~4:..:4<..<2'------ RR _ _..::4t..5.l..<2'-----
'i', VEHICLE O WHEEL
TRACK
e Denotes accelerometer location.
NOTES: -----
ENGINE TYPE: 8 CYL EEl ENGINE CID: 5. 8 L
TRANSMISSION TYPE:
X AUTO
_MANUAL
OPTIONAL EQUIPMENT:
0-'-++---------+---. 0
I
-'----'---'-+-~..L--..J-~----'-t--'-H l M,
GEOMETRY - (mm)
A 1900 B Z50 c 3380
1320
5450 G 1510
D 1890 H ____ __
MASS - (kg)
11 33
926 2059
K
M
M,
1240 N
Z35 0
BO p
4Z5 Q
TEST INERTIAL
1106 894
2000
1665 1635 Z90 450
DUMMY DATA:
TYPE: --------
MASS:----------
SEAT POSITION: ____ __
R no s 1060
1520 u 41ZO
GROSS STATIC
Figure 7. Vehicle properties for test 270687-WDTI.
14

0.000 s
0.139 s
0.278 s
0.418 s
Figure 8. Sequential photographs for test 270687-WDTl. (overhead and frontal views)
15
0.557 s
0.696 s
0.835 s
0.974 s
Figure 8. Sequential photographs for test 270687-WDTl. (continued) (overhead and frontal views)
16

0.000 s 0.557 s
0.139s 0.696 s
0.278 s 0.835 s
0.418 s 0.974 s
Figure 9. Sequential photographs for test 270687-WDTl. (perpendicular view)
17
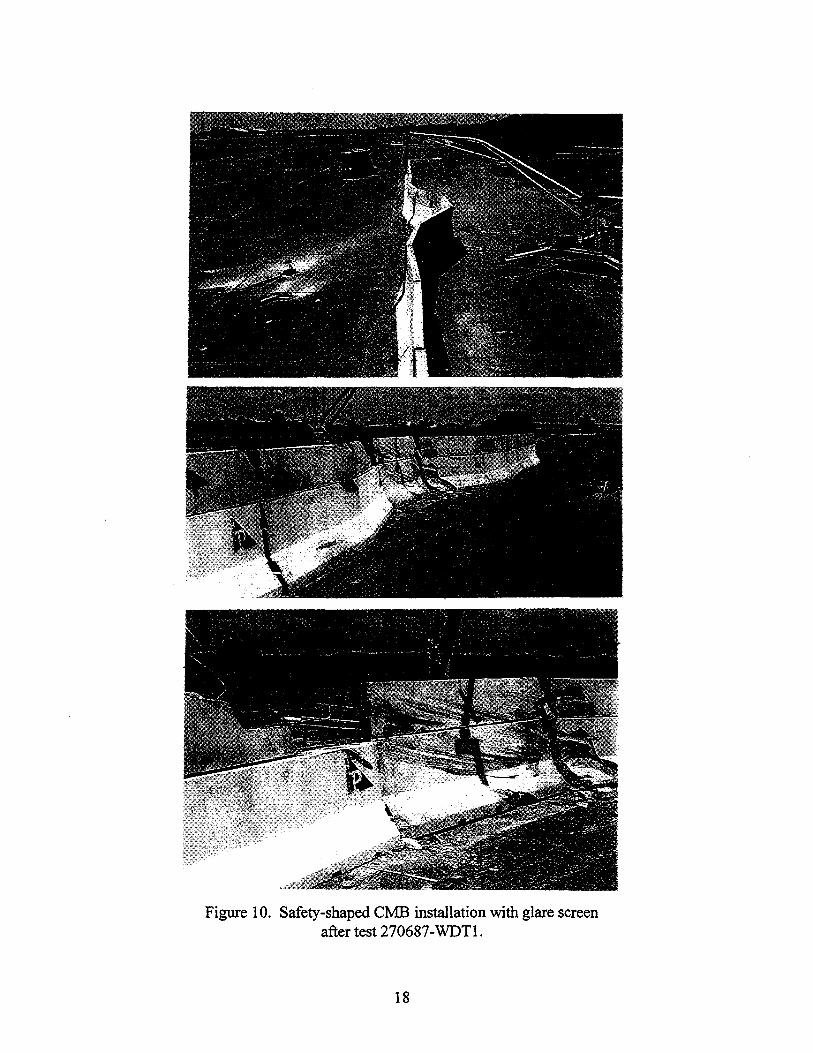
Figure 10. Safety-shaped CMB installation with glare screen after test 270687-WDTI.
18

Vehicle Damage
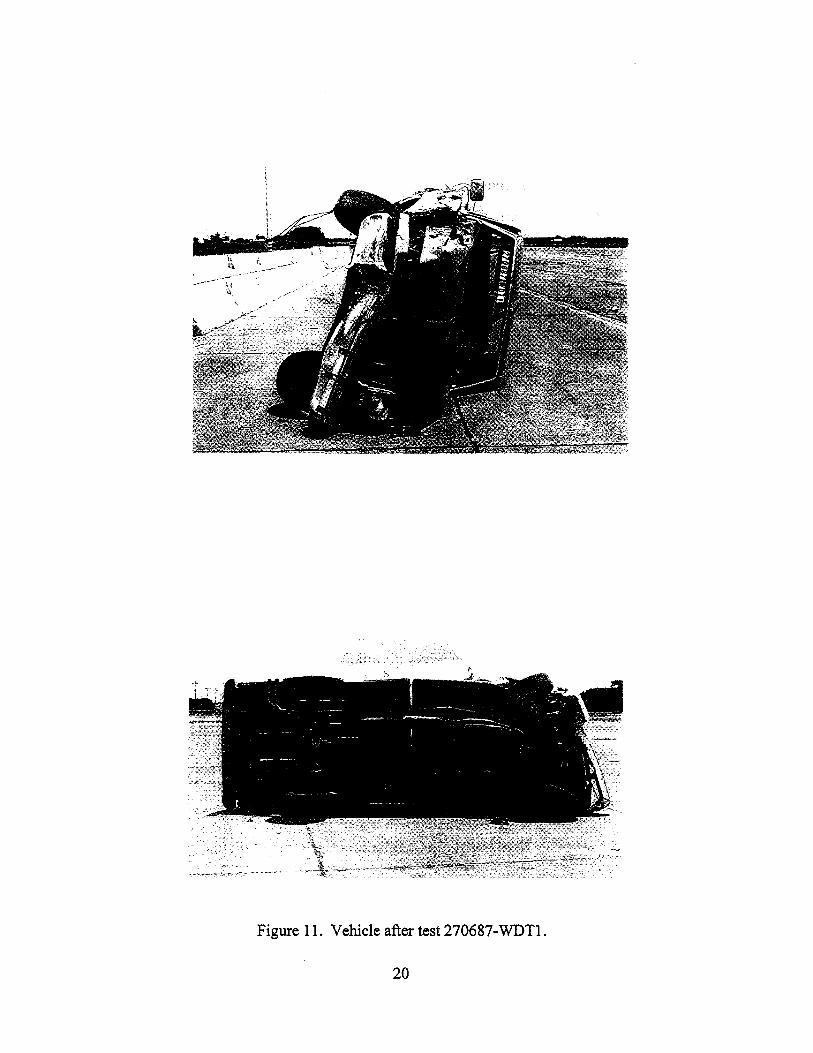
The vehicle sustained moderate damage. The spindle arm broke, and the spindle connecting rod, radius arm, and 1-beam were bent. There was buckling in the floor pan area near the transmission tunnel and the frame was bent. The front bumper, grill, hood, radiator, fan, windshield, both front quarter panels, both doors, and right rear quarter panel were damaged. Both front and rear tires and rims on the right side were also damaged. Maximum exterior crush at the right front corner of the vehicle was 510 mm at bumper height. Maximum crush in the right side floor pan area was 25 mm. Photographs of the vehicle after the test are shown in figures 11 and 12.
Occupant Risk Values
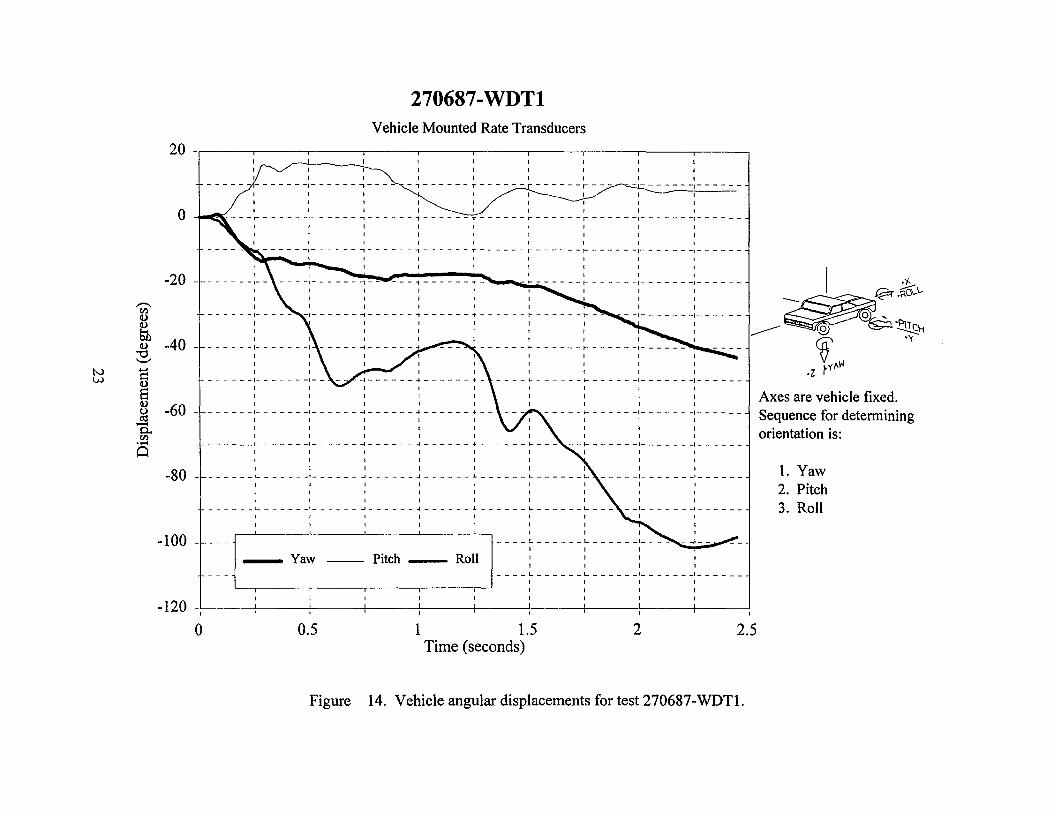
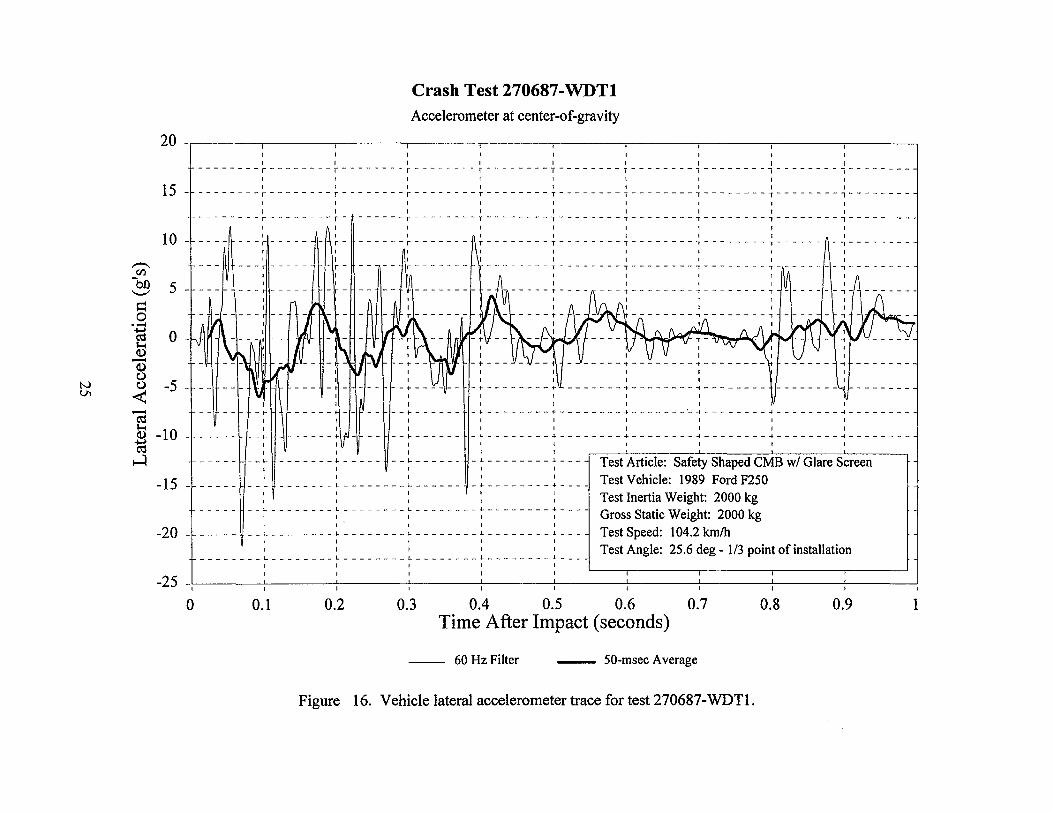
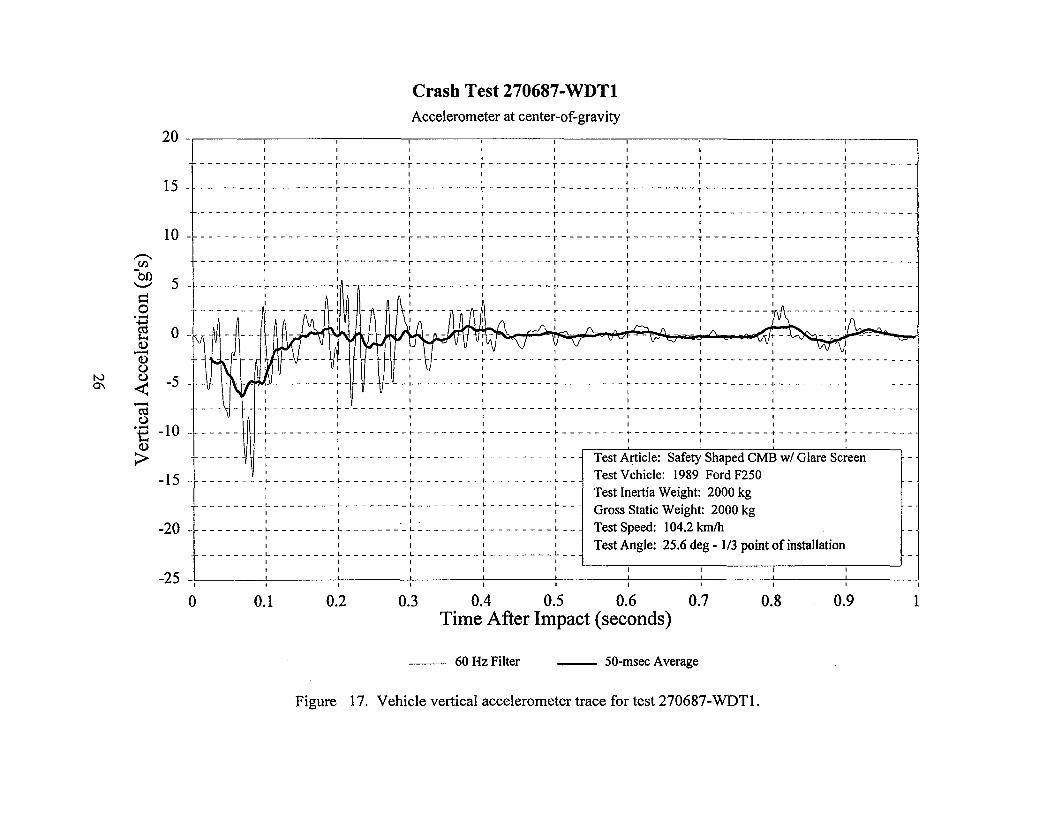
Data from the accelerometer located at the vehicle center-of-gravity were digitized for evaluation of occupant risk and were computed as follows. In the longitudinal direction, occupant impact velocity was 8.37 m/s at 0.424 second, the highest 0.010-second average ridedown acceleration was -16.19 g between 0.490 and 0.500 second, and the maximum 0.050-second average acceleration was -8.38 g between 0.316 and 0.366 second. Lateral occupant impact velocity was 0.31 m/s at 0.500 second, the highest 0.01 0-second occupant ridedown acceleration was -10.45 g between 0.483 and 0.493 second and the maximum 0.050-second average acceleration was -5.99 g between 0.342 and 0.392 second. These data and other pertinent information from the test are summarized in figure 13. Vehicular angular displacements are displayed in figure 14. Vehicular accelerations versus time traces filtered digitally at 60 Hz are presented in figures 15 through 17.
19
;~ "'
• • ~-:~,~-~' ..... ;.~~v: •'- ••->.~··~ •" •
Figure 11. Vehicle after test 270687-WDTl.
20

Figure 12. Vehicle after being uprighted (test 270687-WDTI).
21
0.000 s 0.278 s 0.555 s
_ r . "''' 0 ~~
FF=-~~~.I==·*r==[F~~·a/~,~~~~~~-·~·-···~:~-+~·:·~-*f==F=~·~3-,~~4:~)L~.;~¥~~~-:~••: N N
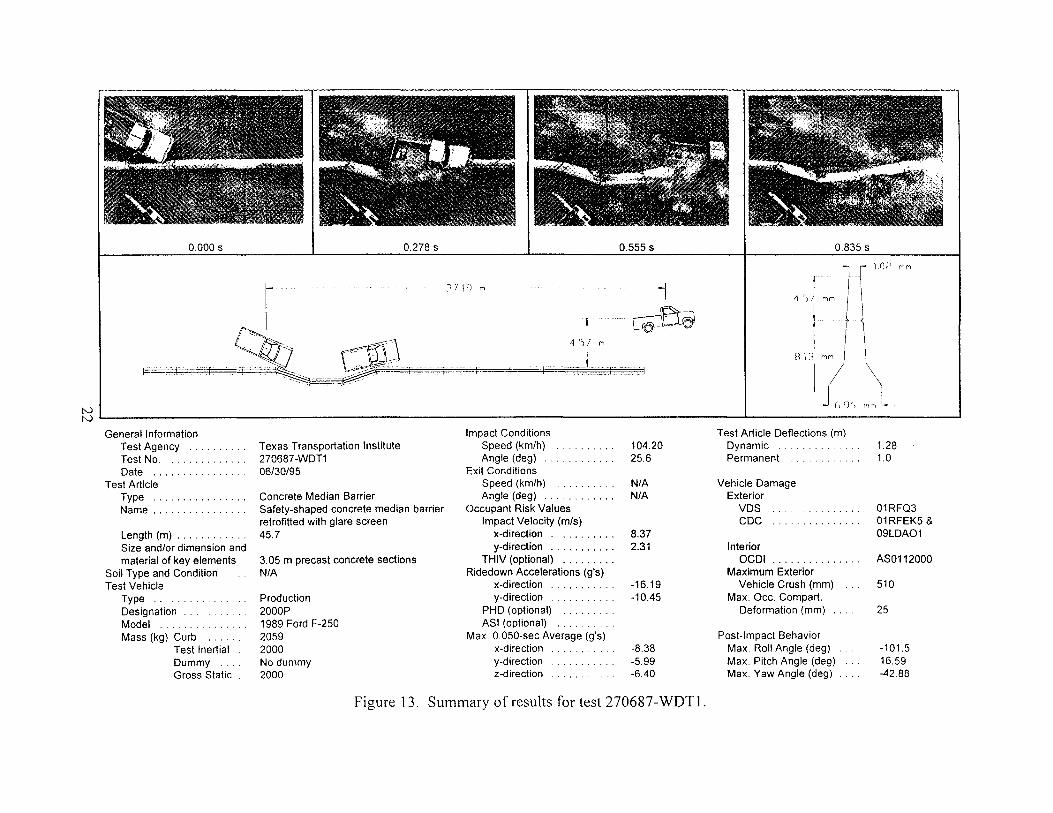
General Information Impact Conditions Test Agency Texas Transportation Institute Speed (km/h) 104.20 Test No. 270687 -WDT1 Angle (deg) 25.6 Date 06/30/95 Exit Conditions
Test Article Speed (km/h) N/A Type . . . . . . . . . . . Concrete Median Barrier Angle (deg) ............ N/A Name. Safety-shaped concrete median barrier Occupant Risk Values
retrofitted with glare screen Impact Velocity (m/s) Length (m) ............ 45.7 x-direction . .......... 8.37 Size and/or dimension and y-direction ........... 2.31 material of key elements 3.05 m precast concrete sections THIV (optional) .........
Soil Type and Condition N/A Ridedown Accelerations (g's) Test Vehicle x-direction -16.19
Type .. '. Production y-direction -10.45 Designation .. '. 2000P PHD (optional) ' . . . . . . . . Model ... 1989 Ford F-250 ASI (optional) .. ' .... '
Mass (kg) Curb 2059 Max. 0.050-sec Average (g's) Test Inertial 2000 x-direction -8.38 Dummy No dummy y-direction ........ -5.99 Gross Static 2000 z-direction -6.40
Figure 13. Summary of results for test 270687-WDT I.
0.835 s
IO;> MM
H 1J MM
l J h')(, '"'"'
Test Article Deflections (m) Dynamic Permanent
Vehicle Damage Exterior
VDS CDC
Interior OCDI
Maximum Exterior Vehicle Crush (mm)
Max. Occ. Compart. Deformation (mm)
Post-Impact Behavior Max. Roll Angle (deg) Max. Pitch Angle (deg) Max. Yaw Angle (deg)
1.28 1.0
01RFQ3 01RFEK5 & 09LDA01
AS0112000
510
25
-101.5 16.59 -42.88
N w
270687-WDTl Vehicle Mounted Rate Transducers
20 -,----.-----.----.-----.----.-----.----~----.-----.----.
-i------~------~--~ ----:~-
1 I I I I I
0 1 1 1 -- -~------ -~-- ----I------ "'1---- -- T--- --- r------- I--- ---a---- -- -~------
I I I I I I I I
1 I 1 I I I I I I I I
- - - - - -a- - - - - - , - - - - - - .., - - - - - - T - - - - - - r - - - - - - r- - - - - - -a- - - - - - -a- - - - - -
-20 - - - - '1 - - - - - - T - ---..J:...;-~- - - - - t- - - - - - -t- - - - - - -t- - - - - -I I I 1
I
-40 - - - - - - - 1- - - - - - -I 1
I
- - - - - -I- - - -· - - - - 1- - - - - - - 1- - - - - - -I- - - - - - -1- - - - - -
-60 - - - - - - - 1- - - - - - -1- - - - - - -1 - - - - - - .... - - - - - - + - - - - - - - ..... - - - - - -I- - - - - - _, - - - - - -I I I I I
1 I I I
------I-- ---- _,_----- -1----- - -1--- - -- + ---- -- 1---- --f-.----- -I--- --- -1------1 1
-80 - ----- _,_- -- - - _,_----- -1- - ---- -1- --- -- + - - - - - - 1- ------ ~ -----I---- -- _,_-----I I I I I I I I I
I
- - - - - - ,_ - - - - - _,- - - - - - ..J - - - - - - -1 - -· - - -- - J. - - - - - - 1- - - - - - - I- - - -I I I
1 I
-100 - ,-- -- ~-- ---- ~----- _:_--- - _:_-
---- ~ ------~ ------1- ------i- -----I I I I
1
- I ~.i6-" -----~~" ~ •Y
.z ~yt-1'1
Axes are vehicle fixed. Sequence for determining orientation is:
1. Yaw 2. Pitch 3. Roll
-120 -
0 0.5 1 1.5 2 2.5 Time (seconds)
Figure 14. Vehicle angular displacements for test 270687-WDTl.

Crash Test 270687-WDTl Accelerometer at center-of-gravity
20 -~----~----~~----~----~-----~~----~------~----~------~~----~ I
~ 0 ....... ~ ;.... Q) -Q) (.) (.)
15 -
10 -
5 -
0 -
< - -5-~ .......
'"0 .s -10 -....... gp 0 ~ -15 -
-20 -
-25 -
0
I I I I I I I I I - - - - - - - - r - - - - - - - - 1 - - - - - - - - 1 - - - - - - - - -,- - - - - - - - -,- - - - - - - - - ,- - - - - - - - - r - - - - - - - - r - - - - - - - - 1 - - - - - - - -
I I --------r--------1--
I I --------r--------,.--1
I --------r--------,.--
I -----··--r------ ---,.--
-- - - - - - - - r - - - - - - - - 'T - -
- -- - - - - - - ,. - - - - - - - - 't - -
I I
--------,----- - - ...
I
---------+-
- -~--------...j.-1 I I
----1..---------1.-I
--------!---------...1.-1 I
I I I I I I I
- - - - - ., - - - - - - - - -,- - - - - - - - -,- - - - - - - - - ,- - - - - - - - - r - - - - - - - - r - - - - - - - - ., - - - - - - - -I I
I I I I I I I - - - - - , - - - - - - - - -,- - - - - - - - -,- - - - - - - - - ,- - - - - - - - - r - - - - - - - - T - - - - - - - - 1 - - - - - - - -
I
I I I I I I I - ·- - - - ., - - - - - - - - -~- ·~ - - - - - - -~- - - - - - - - - r - - - - - - - - r - - - - - - - - T - - - - - - - - -, - - - - - - - -
I I I I I I - - - - - ., - - - - - - - - -~- - - - - - - - -,- - - - - - - - - ,- - - - - - - - - r - - - - - - - - T - - - - - - - - ·1 - - - - - - - -
I
- - - - - , - - - - - - - -~- - - - - - - - -~- - - - - - - - - r - - - - - - - - r - - - - - - - - i - - - - - - - - , - - - - - - - -
-1- - - - - - - - -~- - - - - - - - - r- - - - - - - - - t" - - - - - - - - T - - - - - - - "1 - - - - - - - -
I I I I I
- -i - - - - - - - -1 - - - - - - - - -I- - - - - - - - - 1- - - - - - - - - t- - - - - - - - - + - - - - - - - - -i - - - - - - - -I
- - -I- - - - - - - - -I- - - - - - - - - 1- - - - - - - - - t- - - - - - - - - + - - - - - - - - -i - - - - - - - -I I I
- - - - - -1- - - - - - - - -1- - - - - - - - -I- - - - - - - - - 1- - - - - - - - - t- - - -- - - - - + - - - - - - - - 4 - - - - - - - -I I I I I
- - - - - - -1 - - - - - - - - -1 - - - - - - - - -I- - - - - .-----:--::----:---:::----:----~--:--::-:--~-------,
1 Test Article: Safety Shaped CMB w/ Glare Screen I
------ _,---------I-------- -I----- Test Vehicle: 1989 Ford F250 I I
- - - - - - ..J - - - - - - - - _,- - - - - - - - -I- - - - -I I I
- - - - - - - - J... - - - - - - - - J. - - - - - - - ..J - - - - - - - - _,- - - - - - - - _,_ - - - -
Test Inertia Weight: 2000 kg Gross Static Weight: 2000 kg
Test Speed: 104.2 km/h I I I I I I I I
- - - - - - - - L - - - - - - - - l - - - - - - -~ -- _J - - - •• - - - - _I - -- - •.•. -- - - _I_ - - - - Test Angle: 25.6 deg - 1/3 point of installation
-----~--------~------~------~- -----~--~==~========~======~======~======= I
0.1 0.2 0.3 0.4 0.5 0.6 0.7 0.8 0.9 Time After Impact (seconds)
-- 60 Hz Filter - 50-msec Average
Figure 15. Vehicle longitudinal accelerometer trace for test 270687-WDTl.
1
Crash Test 270687-WDTl Accelerometer at center-of-gravity
20 -~----~----~~------.-----~------~----~------~----~------~----~ I
..--Cil
15 -
10 -
-bO 5 ...._, -1=: 0 ·-1d ~ -~ u u -5 -< ] ~ -10 -1d ~
-15 -
-20 -
I I I I I I I I I - - - - - - - - I - - - - - - - - f - - - - - - - - f - - - ~· - - -· - f - - - - - - - - T - - - - - - - - T - - - - - - - - l - - - - - - - - l - - - - - - - - I - - - - - - - -
I
I I I I I I I I I --------r--------r--------r--------r··-------r--------,--------,--------,---------,--------I I
I I I I I I I I I --------r--------r- ------r--------r--·------r--------,--------,--------,---------,--------
I I ---r----- - r-
- 1-
I
- 1-
-- .. - - ..
- r-
I
--t-------1
I --1-------
-------l------ --l-------
-------l---------l-------
1
I I I I I I r------···-T--------1--------·,---------,------ -,--------·
--------t---------t--------1 I I
-------+--------;--------I
-·--------+--------+-------~·--------·--------~--------
I
_,.. ________ +--------+---------f--------4---------l--------l I
-.J.--------"----1
-.1..--------+---
Test Article: Safety Shaped CMB w/ Glare Screen Test Vehicle: 1989 Ford F250 Test Inertia Weight: 2000 kg
--L---------1---------l---------.l.---------+--- Gross Static Weight: 2000 kg 1 I I I
Test Speed: 104.2 km/h I I I I
--1---------1---------I...--------J..--------J.- __
------ _ -L- _____ -- L- ------ _ L------ -- L- ------ _l. __ _ Test Angle: 25.6 deg- 1/3 point of installation
I
-25 -~----~------~----~------~-----~------~----~------~----~~----~
0 0.1 0.2 0.3 0.4 0.5 0.6 0.7 0.8 0.9 1 Time After Impact (seconds)
-- 60 Hz Filter - 50-msec Average
Figure 16. Vehicle lateral accelerometer trace for test 270687-WDTl.
N 0\
ta c.>
Crash Test 270687-WDTl Accelerometer at center-of-gravity
20 -.------.------,------,------,------,------,------,------~~------~----~ I
I I I I I --------,--------~--------~--------,--------,--------,--------~--------~--------,--------
' I I 1 I I I I I I I I I I I I
--------r--------r--------r--------r--------r--------r--------r--------r--------,--------15 -1
I I I I I I I I I ·- - - - - - - - r - - - - - - - - r - - - - - - - - r - - - - - - - - r - - - - - - - - r - - - - - - - - r - - - - - - - - r - - - - - - - - r - - - - - - - - r - - - - - - - -I
I I I I I I I I --------r--------r--------r--------r--------r--------r--------T--------T--------T--------10 -1 I I
I I I I I I I I I --------r--------r--------r--------r--------r--------r--------T--------T--------T--------
1 I I
5 - --------r--------- --------r--------f'--------r--------r--------T--------T--------T--------1
--------r--------r--------T--------1 I I
- - - - - - t· - oM - - - Oo - - t- - - - - - - - - t" - - - - - - - - -t - - - - - - - - -t - - - - - - - - "t - - - - - - - -
I I I
-5 - - ---r--------t---------t---------+----------t---------t---------t--------1 I I I I
I I I I --l---------r--------r--------+---------4---------+---------+--------+---------t--------
'€ -10 - -1---------l---------l---------+---------+---------+---------+--------+---------t--------l I I I I I I I I
0)
> -l--------- ~-------- ~------ .. •·····-------~--
-15 -I I
-!---------'-----------I---------~--------~------.
--------1---------1---------1---------1---------1---l I I I I I I ~ I
--------1---------1---------1---------'---------L---20 -I I I I
I
--------L--------L--------L--------L--------L--1 I I
Test Article: Safety Shaped CMB w/ Glare Screen Test Vehicle: 1989 Ford F250 Test Inertia Weight: 2000 kg Gross Static Weight: 2000 kg Test Speed: 104.2 km/h
Test Angle: 25.6 deg- 1/3 point of installation
I
-25 -L------L------~----~------7------7------~----~------~----~------~
0 0.1 0.2 0.3 0.4 0.5 0.6 0.7 0.8 0.9 1 Time After Impact (seconds)
-- 60 Hz Filter - 50-msec Average
Figure 17. Vehicle vertical accelerometer trace for test 270687-WDTI.
IV. SUMMARY OF FINDINGS AND CONCLUSIONS
SUMMARY OF FINDINGS
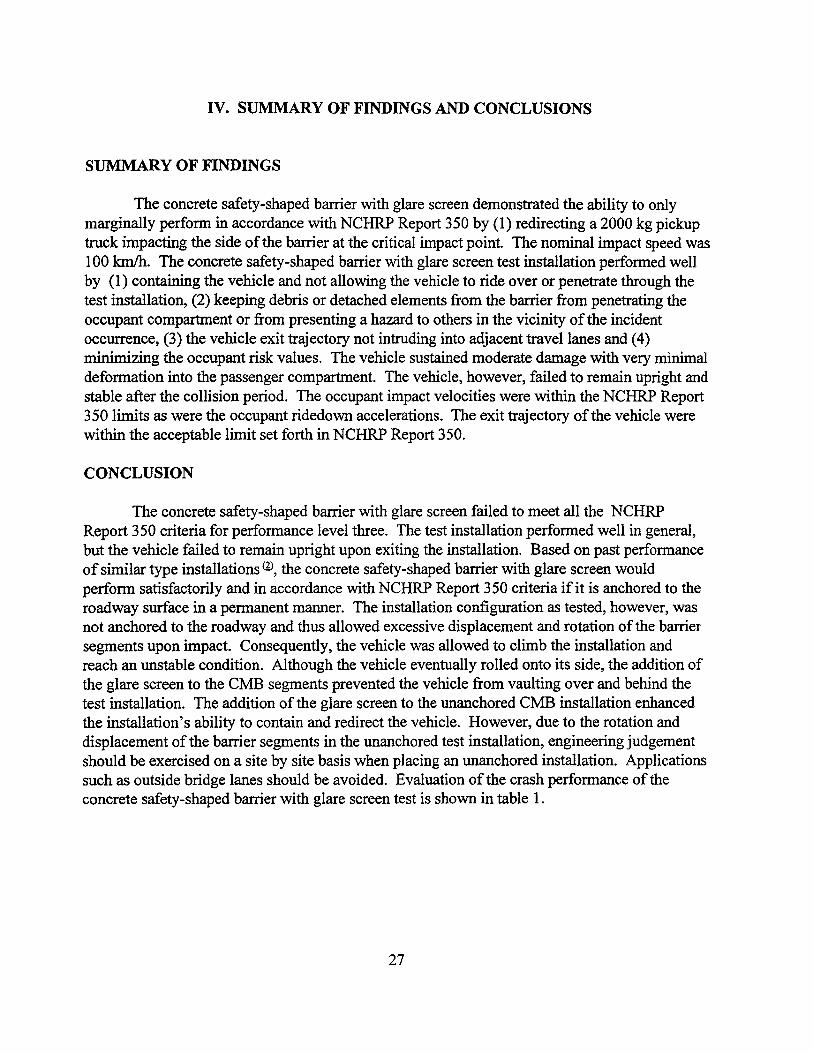
The concrete safety-shaped barrier with glare screen demonstrated the ability to only marginally perform in accordance with NCHRP Report 350 by (1) redirecting a 2000 kg pickup truck impacting the side of the barrier at the critical impact point. The nominal impact speed was 100 kmlh. The concrete safety-shaped barrier with glare screen test installation performed well by (1) containing the vehicle and not allowing the vehicle to ride over or penetrate through the test installation, (2) keeping debris or detached elements from the barrier from penetrating the occupant compartment or from presenting a hazard to others in the vicinity of the incident occurrence, (3) the vehicle exit trajectory not intruding into adjacent travel lanes and (4) minimizing the occupant risk values. The vehicle sustained moderate damage with very minimal deformation into the passenger compartment. The vehicle, however, failed to remain upright and stable after the collision period. The occupant impact velocities were within the NCHRP Report 350 limits as were the occupant ridedown accelerations. The exit trajectory of the vehicle were within the acceptable limit set forth in NCHRP Report 350.
CONCLUSION
The concrete safety-shaped barrier with glare screen failed to meet all the NCHRP Report 350 criteria for performance level three. The test installation performed well in general, but the vehicle failed to remain upright upon exiting the installation. Based on past performance of similar type installations ill, the concrete safety-shaped barrier with glare screen would perform satisfactorily and in accordance with NCHRP Report 350 criteria if it is anchored to the roadway surface in a permanent manner. The installation configuration as tested, however, was not anchored to the roadway and thus allowed excessive displacement and rotation of the barrier segments upon impact. Consequently, the vehicle was allowed to climb the installation and reach an unstable condition. Although the vehicle eventually rolled onto its side, the addition of the glare screen to the CMB segments prevented the vehicle from vaulting over and behind the test installation. The addition of the glare screen to the unanchored CMB installation enhanced the installation's ability to contain and redirect the vehicle. However, due to the rotation and displacement of the barrier segments in the unanchored test installation, engineering judgement should be exercised on a site by site basis when placing an unanchored installation. Applications such as outside bridge lanes should be avoided. Evaluation of the crash performance of the concrete safety-shaped barrier with glare screen test is shown in table 1.
27

N 00
Table 1. Assessment of results of test on the concrete safety-shaped barrier with glare screen.
Test Agency: Texas Transportation Institute Test No.: 270687-WDTI Test Date: 06/30/95
NCHRP Report 350 Evaluation Criteria Test Results Assessment
Structural Adequacy
A. Test article should contain and redirect the vehicle; the vehicle The concrete safety-shaped barrier with glare screen should not penetrate, underride, or override the installation contained and redirected the vehicle with minimal to
Pass although controlled lateral deflection of the test article is moderate deflections of the barrier segments. acceptable.
Occupant Risk
D. Detached elements, fragments or other debris from the test article There were few detached elements or debris to show should not penetrate or show potential for penetrating the occupant potential for penetrating the occupant compartment or compartment, or present an undue hazard to other traffic, presenting undue hazard to other traffic in the area. There
Pass pedestrians, or personnel in a work zone. Deformations of, or was minimal deformation of the occupant compartment (25 intrusions into, the occupant compartment that could cause serious mm in the floor pan area). injuries should not be permitted.
F. The vehicle should remain upright during and after collision The vehicle did not remain upright and stable throughout the Fail
although moderate roll, pitching and yawing are acceptable. collision and after loss of contact.
vehicle Trajectmy
K. After collision it is preferable that the vehicle's trajectory not The vehicle did not intrude into adjacent traffic lanes as it intrude into adjacent traffic lanes. came to rest on the vehicle's left side near the test Pass
installation.
L. The occupant impact velocity in the longitudinal direction should Longitudinal occupant impact velocity was 8.37 m/s and not exceed 12m/sand the occupant ridedown acceleration in the longitudinal occupant ridedown acceleration was -16.19 G' s. Pass longitudinal direction should not exceed 20 G's.
M The exit angle from the test article preferably should be less than The exit angle at loss of contact with the barrier was not 60 percent of test impact angle, measured at time of vehicle loss of quantitatively obtainable from the high-speed film Pass contact with test device.

REFERENCES
1. H. E. Ross, Jr., D. L. Sicking, R. A. Zimmer, and J.D. Michie, "Recommended Procedures for the Safety Performance Evaluation of Highway Features", NCHRP Report 350, Transportation Research Board, National Research Council, Washington, D. c., 1993.
2. S. M. Rowhani, et. al, "Vehicle Crash Tests of a Concrete Median Barrier Retrofitted with a Slipformed Concrete Glare Screen", FHWA Report CA!TL-92/05, Federal Highway Administration, Department of Transportation, Washington D.C., 1992.
29