Embed Size (px)
Citation preview
Fracture Mechanics of Concrete and Concrete Structures -Recent Advances in Fracture Mechanics of Concrete - B. H. Oh, et al.(eds)
ⓒ 2010 Korea Concrete Institute, Seoul, ISBN 978-89-5708-180-8
Energy emissions from fracture of concrete: Acoustic, electromagnetic, piezonuclear
A. Carpinteri & G. Lacidogna Politecnico di Torino, Torino, Italy
ABSTRACT: Characterizing the nature of the different forms of energy emitted during compressive failure of brittle materials is an open and debated argument in the scientific literature. Some research has been already conducted on this subject in the scientific community based on the signals captured by the acoustic emission measurement systems. On the other hand, there are not many studies yet about the emission of electromag-netic charge, and for the first time we are talking about piezonuclear neutron emissions from very brittle fail-ure of rocks specimens in compression. The authors analyze these three different emissions from an experi-mental point of view.
1 INTRODUCTION
It is possible to demonstrate experimentally that the failure phenomena, in particular when they occur in a brittle way. i.e. with a mechanical energy release, emit additional forms of energy related to the fun-damental natural forces.
While the acoustic emission (AE), due to pressure waves travelling in the medium as it happens for earthquakes, is well-known and already exploited for monitoring purposes, the electromagnetic radiation (EM), due to an electric charge redistribution after material failure, can be considered a relatively new phenomenon, which is at present under investiga-tion. As regards, then, the neutron emission, this is the first time that a similar phenomenon is captured (Carpinteri et al. 2009a, Cardone et al. 2009a).
Only for fluids subjected to cavitation, analogous piezonuclear emissions of neutrons were previously found in the experiments. Totally accepted theories explaining such anomalous phenomena are still lack-ing in the literature. It is not in the aims of the pre-sent contribution to provide a theoretical physics ex-planation to piezonuclear emissions, although the emergence of these emissions in relation to a cusp catastrophe failure may result to be of interest also to Fracture Mechanics.
2 ACOUSTIC EMISSION
2.1 A fractal criterion for AE monitoring
Monitoring a structure by means of the AE technique, it proves possible to detect the occurrence and evolution of stress-induced cracks. Cracking, in fact,
is accompanied by the emission of elastic waves which propagate within the bulk of the material. These waves can be received and recorded by transducers applied to the surface of structural elements. This technique, originally used to detect cracks and plastic deformations in metals, has been extended to studies in the field of rocks and can be used for the diagnosis of structural damage phenomena (Ohtsu 1996).
In AE monitoring, piezoelectric (PZT) sensors are generally used, thereby exploiting the capabilities of certain crystals to produce electric signals whenever they are subjected to a mechanical stress. The signal picked up by a transducer is preamplified and trans-formed into electric voltage (Fig. 1). It is then fil-tered to eliminate unwanted frequencies, such as the vibration arising from the mechanical instrumenta-tion, which is generally lower than 100 kHz. Up to this point the signal can be represented as a damped oscillation. The signal is therefore analysed by a meas-uring system counting the emissions that exceed a cer-tain voltage threshold measured in volts (V).
Threshold level
Envelope Curve
1 2 3 4 5 6 7
1
Events Counting
Oscillations Counting
Signal Voltage
Duration Time Dead Time
Figure 1. Schematic signal detected by AE technique.
Recently AE data have been interpreted by the authors on the basis of the statistical and fractal theories of fragmentation (Carpinteri & Pugno 2002, 2004, Carpinteri et al. 2004). The following size-scaling law is assumed during the damage process:
3/D
VNW ∝∝ , (1)
where W is the released energy, V the structural ele-ment volume, D the so-called fractal exponent com-prised between 2 and 3, and N the cumulative num-ber of AE events that the structure provides during the damage monitoring. The damage level of a struc-ture can be obtained from AE data of a reference specimen (pedex r) extracted from the structure it-self and tested up to failure. From Equation 1 we have:
( ) 3
maxmax/
D/
rrVVNN = , (2)
from which we can obtain the critical number of acoustic emission events Nmax that the structure may provide before achieving the critical condition. The details of the procedure are given in (Carpinteri et al. 2007).
The authors have also shown that energy release, as measured with the AE technique during the dam-aging process, obeys the following time-scaling law (Carpinteri et al. 2005b, 2007):
,
tβtNW ∝∝ with ,30
t≤≤ β (3)
where t is the monitoring time and βt stands for the time-scaling exponent of the released energy. The experimental validation of Equation 3 was carried out through laboratory compressive tests conducted on concrete cylinders of different diameters and slenderness ratios. All compressive tests were per-formed under displacement control, by imposing a constant rate to the upper loading platen. The trend observed was that of an increase in βt with increas-ing specimen diameter. The time-scaling values ob-tained experimentally were seen to agree with the law of Equation 3, providing an exponent in the range 1.38 to 2.92 (Carpinteri et al. 2005b).
Using the AE monitoring technique, we have ana-lysed the evolution of cracks and estimated the re-leased strain energy during their propagation in structural members. Significant tests were performed on laboratory specimens and full-size structures (Carpinteri et al. 2007).
2.2 Experimental results for the fractal exponent D
Laboratory tests were performed on the cylindrical concrete specimens in compression, shown in Figure 2a, to obtain an experimental confirmation of the laws described above (Carpinteri et al. 2005b, 2007).
A comparison between experimental results and theoretical predictions is herein presented. For all the tested specimens, the critical number of acoustic emissions Nmax r was evaluated in correspondence to the peak stress σu. The compression tests show an increase in AE cumulative event number by increas-ing the specimen volume. Subjecting the average experimental data to a statistical analysis, we can quantify the parameters D in Equation 1. The pa-rameter D represents the slope, in the bilogarithmic diagram, of the line that relates Nmax to the specimen volume. From the best-fitting, we obtain D/3 ≅ 0.766, Figure 2b, so that the fractal exponent results, as predicted by the fragmentation theories, to be comprised between 2.0 and 3.0 (D ≅ 2.3).
Figure 2. (a) Geometries of the tested specimens. (b) Volume-effect on Nmax.
2.3 AE frequency-magnitude statistics
Extensive studies on fracture of brittle materials by means of the AE technique have shown that fracture and damage growth can be characterized through the b-value of the Gutenberg-Richter (GR) law, which changes systematically during the different stages of the failure process. This parameter can be linked to the value of the exponent of the power-law distribu-tion of the crack size in a damaged medium. We propose a statistical interpretation for the variation of the b-value during the evolution of damage de-tected by AE, which is based on a treatment origi-nally proposed by Carpinteri and co-workers (Carpinteri 1986,1994, Carpinteri et al. 2008,2009b).
Proceedings of FraMCoS-7, May 23-28, 2010
hThD ∇−= ),(J (1)
The proportionality coefficient D(h,T) is called moisture permeability and it is a nonlinear function of the relative humidity h and temperature T (Bažant & Najjar 1972). The moisture mass balance requires that the variation in time of the water mass per unit volume of concrete (water content w) be equal to the divergence of the moisture flux J
J•∇=∂
∂−
t
w (2)
The water content w can be expressed as the sum
of the evaporable water we (capillary water, water vapor, and adsorbed water) and the non-evaporable (chemically bound) water wn (Mills 1966, Pantazopoulo & Mills 1995). It is reasonable to assume that the evaporable water is a function of relative humidity, h, degree of hydration, αc, and degree of silica fume reaction, αs, i.e. we=we(h,αc,αs) = age-dependent sorption/desorption isotherm (Norling Mjonell 1997). Under this assumption and by substituting Equation 1 into Equation 2 one obtains
nscw
s
ew
c
ew
hh
Dt
h
h
ew
&&& ++∂
∂
∂
∂
=∇•∇+∂
∂
∂
∂
− αα
αα
)(
(3)
where ∂we/∂h is the slope of the sorption/desorption isotherm (also called moisture capacity). The governing equation (Equation 3) must be completed by appropriate boundary and initial conditions.
The relation between the amount of evaporable water and relative humidity is called ‘‘adsorption isotherm” if measured with increasing relativity humidity and ‘‘desorption isotherm” in the opposite case. Neglecting their difference (Xi et al. 1994), in the following, ‘‘sorption isotherm” will be used with reference to both sorption and desorption conditions. By the way, if the hysteresis of the moisture isotherm would be taken into account, two different relation, evaporable water vs relative humidity, must be used according to the sign of the variation of the relativity humidity. The shape of the sorption isotherm for HPC is influenced by many parameters, especially those that influence extent and rate of the chemical reactions and, in turn, determine pore structure and pore size distribution (water-to-cement ratio, cement chemical composition, SF content, curing time and method, temperature, mix additives, etc.). In the literature various formulations can be found to describe the sorption isotherm of normal concrete (Xi et al. 1994). However, in the present paper the semi-empirical expression proposed by Norling Mjornell (1997) is adopted because it
explicitly accounts for the evolution of hydration reaction and SF content. This sorption isotherm reads
( ) ( )( )
( ) ( )⎥⎥
⎦
⎤
⎢⎢
⎣
⎡
⎥⎥⎥
⎦
⎤
⎢⎢⎢
⎣
⎡
−
−∞
+
−∞
−=
1110
,1
110
11,
1,,
hcc
ge
scK
hcc
ge
scG
sch
ew
αα
αα
αα
αααα
(4)
where the first term (gel isotherm) represents the physically bound (adsorbed) water and the second term (capillary isotherm) represents the capillary water. This expression is valid only for low content of SF. The coefficient G1 represents the amount of water per unit volume held in the gel pores at 100% relative humidity, and it can be expressed (Norling Mjornell 1997) as
( ) ss
s
vgkc
c
c
vgk
scG αααα +=,1
(5)
where k
cvg and k
svg are material parameters. From the
maximum amount of water per unit volume that can fill all pores (both capillary pores and gel pores), one can calculate K1 as one obtains
( )1
110
110
11
22.0188.00
,1
−⎟⎠
⎞⎜⎝
⎛−∞
⎥⎥⎥
⎦
⎤
⎢⎢⎢
⎣
⎡⎟⎠
⎞⎜⎝
⎛−∞
−−+−
=
hcc
ge
hcc
geGs
ssc
w
scK
αα
αα
αα
αα
(6)
The material parameters k
cvg and k
svg and g1 can
be calibrated by fitting experimental data relevant to free (evaporable) water content in concrete at various ages (Di Luzio & Cusatis 2009b).
2.2 Temperature evolution
Note that, at early age, since the chemical reactions associated with cement hydration and SF reaction are exothermic, the temperature field is not uniform for non-adiabatic systems even if the environmental temperature is constant. Heat conduction can be described in concrete, at least for temperature not exceeding 100°C (Bažant & Kaplan 1996), by Fourier’s law, which reads
T∇−= λq (7)
where q is the heat flux, T is the absolute temperature, and λ is the heat conductivity; in this
The proposed model captures the transition from the condition of diffused criticality to that of imminent failure localisation.
According to seismology (Richter 1958), the magnitude in terms of AE technique is defined as follows:
)(max10
rfALogm += , (4)
where Amax is the signal amplitude, measured in volts, while f(r) is a correction taking into account that the amplitude is a decreasing function of the dis-tance r between the source and the sensor. Accord-ing to Uomoto (1987), for large-sized structures, the amplitude reduction for AE signals is f(r) = k r, where r is measured in meters and k is equal to five magnitudes per meter. Signal amplitude analyses must be performed by means of an AE equipment that can identify the complete shape of AE waves (Carpinteri et al. 2005a).
In seismology, earthquakes of larger magnitude occur less frequently than earthquakes of smaller magnitude. This fact can be quantified in terms of a magnitude-frequency relation, proposed by Guten-berg and Richter in an empirical way:
( ) bmamNLog −=≥
10, or ( ) bma
mN−
=≥ 10 , (5)
where N is the cumulative number of earthquakes with magnitude ≥ m in a specified area and over a specified time span, and a and b are positive con-stants varying from region to region.
The GR relationship has been tested successfully in the acoustic emission field to study the scaling of the ‘‘amplitude distribution’’ of AE waves (Carpin-teri et al. 2008,2009b, Colombo et al. 2003): this ap-proach substantiates the similarity between the dam-age process in a structure and the seismic activity in a region of the Earth Crust and, at the same time, it widens the scope of the GR relationship. From Equation 5, we find that the b-value is the negative gradient of the log-linear AE frequency-magnitude diagram and hence it represents the slope of the am-plitude distribution. The b-value changes systemati-cally during the different stages of damage growth (Carpinteri et al. 2008,2009b, Colombo et al. 2003), and hence it can be used to estimate the development of the damage process.
2.4 b-value analysis
The aim is to establish a theoretical basis for taking bmin= 1.0 at failure, as observed both in AE labora-tory tests and in tests performed on full sized engi-neering structures (Carpinteri 1986,1994, Carpinteri et al. 2008,2009b). By analogy with earthquakes, the AE damage size-scaling entails the validity of the re-
lationship:
( ) b
LcLN2−
=≥ , (6)
where N is the cumulative number of AE events generated by source defects with a characteristic lin-ear dimension ≥ L, c is a constant of proportionality, and 2b = D is the fractal dimension of the damage domain (Rundle et al. 2003, Turcotte 1992). It has been pointed out that this interpretation rests on the assumption of a dislocation model for the seismic source and requires that 2.0 ≤ D ≤ 3.0, i.e., the cracks are distributed in a fractal domain comprised between a surface and the volume of the analysed region (Rundle et al. 2003, Turcotte 1992).
The cumulative distribution (6) is substantially identical to the cumulative distribution proposed by Carpinteri (Carpinteri 1986,1994), which gives the probability of a defect with size ≥ L being present in a body:
( ) γ−
∝≥ LLP . (7)
Therefore, the number of defects with size ≥ L is:
( ) γ−
∼≥ LNLNtot
* , (8)
where γ is a statistical exponent measuring the de-gree of disorder, i.e. the scatter in the defect size dis-tribution, and Ntot is the total number of defects in the body. By equating distributions (6) and (8) it is found that: 2b = γ.
At the collapse, the size of the maximum defect is proportional to the characteristic size of the struc-ture. As shown in (Carpinteri 1994, Carpinteri et al. 2008,2009b), the related cumulative defect size dis-tribution (referred to as self-similarity distribution) is characterized by the exponent γ = 2.0, which cor-responds to b = 1.0. In (Carpinteri 1994) it was also demonstrated that γ = 2.0 is a lower bound which corresponds to the minimum value b = 1.0, observed experimentally when the load bearing capacity of a structural member has been exhausted.
Therefore, by determining the b-value it is possi-ble to identify the modalities of energy dissipation in a structural element during the monitoring process. The extreme cases envisaged by Equation 1 are D = 3.0, which corresponds to the critical conditions b = 1.5, when energy dissipation takes place through small defects homogeneously distributed throughout the volume, and D = 2.0, which corresponds to b = 1.0, when energy dissipation takes place on a sur-face. In the former case diffused damage is ob-served, whereas in the latter two-dimensional cracks are formed leading to the separation of the structural element.
Proceedings of FraMCoS-7, May 23-28, 2010
hThD ∇−= ),(J (1)
The proportionality coefficient D(h,T) is called moisture permeability and it is a nonlinear function of the relative humidity h and temperature T (Bažant & Najjar 1972). The moisture mass balance requires that the variation in time of the water mass per unit volume of concrete (water content w) be equal to the divergence of the moisture flux J
J•∇=∂
∂−
t
w (2)
The water content w can be expressed as the sum
of the evaporable water we (capillary water, water vapor, and adsorbed water) and the non-evaporable (chemically bound) water wn (Mills 1966, Pantazopoulo & Mills 1995). It is reasonable to assume that the evaporable water is a function of relative humidity, h, degree of hydration, αc, and degree of silica fume reaction, αs, i.e. we=we(h,αc,αs) = age-dependent sorption/desorption isotherm (Norling Mjonell 1997). Under this assumption and by substituting Equation 1 into Equation 2 one obtains
nscw
s
ew
c
ew
hh
Dt
h
h
ew
&&& ++∂
∂
∂
∂
=∇•∇+∂
∂
∂
∂
− αα
αα
)(
(3)
where ∂we/∂h is the slope of the sorption/desorption isotherm (also called moisture capacity). The governing equation (Equation 3) must be completed by appropriate boundary and initial conditions.
The relation between the amount of evaporable water and relative humidity is called ‘‘adsorption isotherm” if measured with increasing relativity humidity and ‘‘desorption isotherm” in the opposite case. Neglecting their difference (Xi et al. 1994), in the following, ‘‘sorption isotherm” will be used with reference to both sorption and desorption conditions. By the way, if the hysteresis of the moisture isotherm would be taken into account, two different relation, evaporable water vs relative humidity, must be used according to the sign of the variation of the relativity humidity. The shape of the sorption isotherm for HPC is influenced by many parameters, especially those that influence extent and rate of the chemical reactions and, in turn, determine pore structure and pore size distribution (water-to-cement ratio, cement chemical composition, SF content, curing time and method, temperature, mix additives, etc.). In the literature various formulations can be found to describe the sorption isotherm of normal concrete (Xi et al. 1994). However, in the present paper the semi-empirical expression proposed by Norling Mjornell (1997) is adopted because it
explicitly accounts for the evolution of hydration reaction and SF content. This sorption isotherm reads
( ) ( )( )
( ) ( )⎥⎥
⎦
⎤
⎢⎢
⎣
⎡
⎥⎥⎥
⎦
⎤
⎢⎢⎢
⎣
⎡
−
−∞
+
−∞
−=
1110
,1
110
11,
1,,
hcc
ge
scK
hcc
ge
scG
sch
ew
αα
αα
αα
αααα
(4)
where the first term (gel isotherm) represents the physically bound (adsorbed) water and the second term (capillary isotherm) represents the capillary water. This expression is valid only for low content of SF. The coefficient G1 represents the amount of water per unit volume held in the gel pores at 100% relative humidity, and it can be expressed (Norling Mjornell 1997) as
( ) ss
s
vgkc
c
c
vgk
scG αααα +=,1
(5)
where k
cvg and k
svg are material parameters. From the
maximum amount of water per unit volume that can fill all pores (both capillary pores and gel pores), one can calculate K1 as one obtains
( )1
110
110
11
22.0188.00
,1
−⎟⎠
⎞⎜⎝
⎛−∞
⎥⎥⎥
⎦
⎤
⎢⎢⎢
⎣
⎡⎟⎠
⎞⎜⎝
⎛−∞
−−+−
=
hcc
ge
hcc
geGs
ssc
w
scK
αα
αα
αα
αα
(6)
The material parameters k
cvg and k
svg and g1 can
be calibrated by fitting experimental data relevant to free (evaporable) water content in concrete at various ages (Di Luzio & Cusatis 2009b).
2.2 Temperature evolution
Note that, at early age, since the chemical reactions associated with cement hydration and SF reaction are exothermic, the temperature field is not uniform for non-adiabatic systems even if the environmental temperature is constant. Heat conduction can be described in concrete, at least for temperature not exceeding 100°C (Bažant & Kaplan 1996), by Fourier’s law, which reads
T∇−= λq (7)
where q is the heat flux, T is the absolute temperature, and λ is the heat conductivity; in this
2.5 Experimental results on b-value
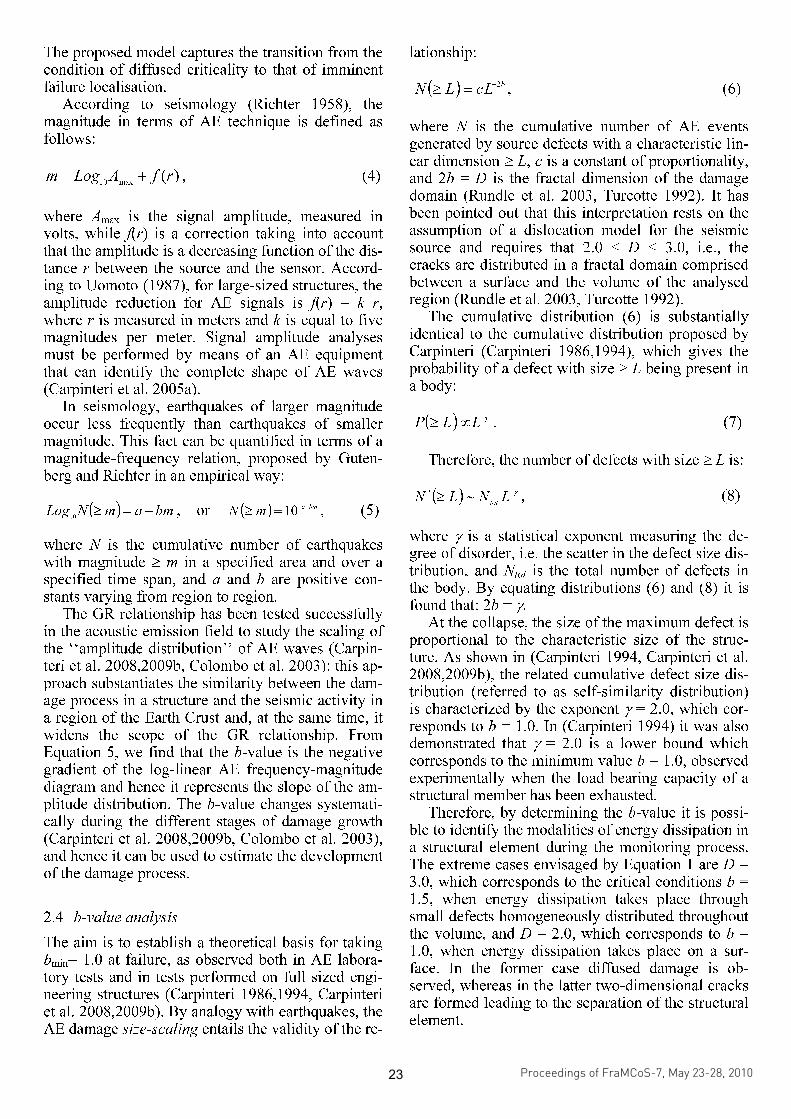
From the laboratory tests described above, one of the 59 mm diameter specimens, with a height/diameter ratio h/d = 2, is shown in Figure 3a (Carpinteri et al. 2005a). The compression tests were performed in displacement control, by imposing a constant rate of displacement to the upper loading platen. A dis-placement rate equal to 4x10
–6 m/s was adopted to
obtain a slow crack growth. Compressive load vs. time, cumulated event number, and event rate for each second of the testing period are depicted in 3(b. The load-time diagram was subdivided into three stages. A first stage (t0, t1) extending from the initial time to peak load, a second stage (t1, t2) going from peak load to the mainshock, as identified by the maximum value of the acoustic emission rate, and a third stage (t2, tf) going from the mainshock to the end of the process. The b-values obtained for each stage are shown in Figure 3c; they range from 1.64 to 1.20. The minimum value, rather close to 1.0, was obtained in the softening tail of the load-time curve.
These values are in good agreement with the frac-tal laws, Equations 6 and 8. At the start of the load-ing process, energy dissipation takes place mostly through the formation of microcracks scattered throughout the volume of the material (b ≅ 1.64, D ≅ 3.0); at the end of the process, instead, energy dissi-pation is seen to concentrate into a two-dimensional crack of a size comparable to that of the specimen, which brings about its separation (b ≅ 1.20, D ≅ 2.0).
The initial and final values presented by the frac-tal exponent D, obtained through the b-values, are strictly connected to the analogous exponent evalu-ated on the basis of the fragmentation theories: D ≅ 2.3, see Figure 2b. The latter, indeed, is related to the critical cumulative number of acoustic emissions Nmax at the peak stress σu, when the crack formation is not yet so advanced to lead to the complete specimen separation.
The non-perfect matching between the values of D exponent at the peak load, obtained by Equation 1 and b-value procedures, is due to the fact that both are indirect estimations of the fractal dimension D. As a matter of fact, Equation 1 evaluates D by an energetic approach, while the b-value is based on a statistical model, that in this case overestimates the D exponent (Fig. 3c). The direct computation of the fractal dimension D should be performed by geomet-rical methods like box-counting (Turcotte 1992), which need the exact localization of AE sources.
In conclusion, taking into account available AE data −event counts, event magnitudes, event source localization− we can apply one or more of these pro-cedures to get the fractal dimension of the damage domain.
Finally, for the three loading stages, Figure 3d gives the values of the βt parameter, Equation 3. The
values, between 1.63 and 0.58, were determined by best-fitting the cumulating count of the AE events divided by the total count for each loading stage. These results confirm that during the sequences of signals preceding the critical condition (foreshock), it is βt > 1, whereas during the sequences following the critical condition (aftershock), βt < 1, energy dissipa-tion having been exhausted. It should be noted that a comparative reading of the b-value and βt parameters makes it possible to assess the evolution of the entire loading process: the βt parameters, in fact, have a pre-dictive function relative to the reaching of the critical condition, whereas the b-values have a descriptive function relative to the damage level reached.
Figure 3. Cylindrical concrete specimen in compression. (a) Testing set-up. (b) Load vs. time curve and AE activity. (c) b-values during the test. (d) Variation in βt parameter during the test.
3 ELECTROMAGNETIC EMISSION
It is reported in the literature that changes in geoelectric potential and anomalous radiation of geoelectromagnetic waves, especially in low-frequency bands, occur before major earthquakes. At the laboratory scale, similar phenomena have also been observed on rock specimens under compres-sion tests (O’Keefe & Thiel 1995). In this case, crack growth is accompanied by acoustic emission ultrasonic waves (AE) and electromagnetic emission (EME). We measured the magnetic field, given by the moving charges, in the low-frequency range
Proceedings of FraMCoS-7, May 23-28, 2010
hThD ∇−= ),(J (1)
The proportionality coefficient D(h,T) is called moisture permeability and it is a nonlinear function of the relative humidity h and temperature T (Bažant & Najjar 1972). The moisture mass balance requires that the variation in time of the water mass per unit volume of concrete (water content w) be equal to the divergence of the moisture flux J
J•∇=∂
∂−
t
w (2)
The water content w can be expressed as the sum
of the evaporable water we (capillary water, water vapor, and adsorbed water) and the non-evaporable (chemically bound) water wn (Mills 1966, Pantazopoulo & Mills 1995). It is reasonable to assume that the evaporable water is a function of relative humidity, h, degree of hydration, αc, and degree of silica fume reaction, αs, i.e. we=we(h,αc,αs) = age-dependent sorption/desorption isotherm (Norling Mjonell 1997). Under this assumption and by substituting Equation 1 into Equation 2 one obtains
nscw
s
ew
c
ew
hh
Dt
h
h
ew
&&& ++∂
∂
∂
∂
=∇•∇+∂
∂
∂
∂
− αα
αα
)(
(3)
where ∂we/∂h is the slope of the sorption/desorption isotherm (also called moisture capacity). The governing equation (Equation 3) must be completed by appropriate boundary and initial conditions.
The relation between the amount of evaporable water and relative humidity is called ‘‘adsorption isotherm” if measured with increasing relativity humidity and ‘‘desorption isotherm” in the opposite case. Neglecting their difference (Xi et al. 1994), in the following, ‘‘sorption isotherm” will be used with reference to both sorption and desorption conditions. By the way, if the hysteresis of the moisture isotherm would be taken into account, two different relation, evaporable water vs relative humidity, must be used according to the sign of the variation of the relativity humidity. The shape of the sorption isotherm for HPC is influenced by many parameters, especially those that influence extent and rate of the chemical reactions and, in turn, determine pore structure and pore size distribution (water-to-cement ratio, cement chemical composition, SF content, curing time and method, temperature, mix additives, etc.). In the literature various formulations can be found to describe the sorption isotherm of normal concrete (Xi et al. 1994). However, in the present paper the semi-empirical expression proposed by Norling Mjornell (1997) is adopted because it
explicitly accounts for the evolution of hydration reaction and SF content. This sorption isotherm reads
( ) ( )( )
( ) ( )⎥⎥
⎦
⎤
⎢⎢
⎣
⎡
⎥⎥⎥
⎦
⎤
⎢⎢⎢
⎣
⎡
−
−∞
+
−∞
−=
1110
,1
110
11,
1,,
hcc
ge
scK
hcc
ge
scG
sch
ew
αα
αα
αα
αααα
(4)
where the first term (gel isotherm) represents the physically bound (adsorbed) water and the second term (capillary isotherm) represents the capillary water. This expression is valid only for low content of SF. The coefficient G1 represents the amount of water per unit volume held in the gel pores at 100% relative humidity, and it can be expressed (Norling Mjornell 1997) as
( ) ss
s
vgkc
c
c
vgk
scG αααα +=,1
(5)
where k
cvg and k
svg are material parameters. From the
maximum amount of water per unit volume that can fill all pores (both capillary pores and gel pores), one can calculate K1 as one obtains
( )1
110
110
11
22.0188.00
,1
−⎟⎠
⎞⎜⎝
⎛−∞
⎥⎥⎥
⎦
⎤
⎢⎢⎢
⎣
⎡⎟⎠
⎞⎜⎝
⎛−∞
−−+−
=
hcc
ge
hcc
geGs
ssc
w
scK
αα
αα
αα
αα
(6)
The material parameters k
cvg and k
svg and g1 can
be calibrated by fitting experimental data relevant to free (evaporable) water content in concrete at various ages (Di Luzio & Cusatis 2009b).
2.2 Temperature evolution
Note that, at early age, since the chemical reactions associated with cement hydration and SF reaction are exothermic, the temperature field is not uniform for non-adiabatic systems even if the environmental temperature is constant. Heat conduction can be described in concrete, at least for temperature not exceeding 100°C (Bažant & Kaplan 1996), by Fourier’s law, which reads
T∇−= λq (7)
where q is the heat flux, T is the absolute temperature, and λ is the heat conductivity; in this
(from 10 Hz to 400 kHz) during laboratory fracture experiments on rocks and concrete samples loaded up to failure (Lacidogna et al. 2009).
Four specimens made of different brittle materi-als, Concrete, Syracuse Limestone, Carrara Marble and Green Luserna Granite, were examined in this study. The acoustic emission emerging from the compressed specimens was detected applying to the sample surface a PZT transducer, sensitive in the frequency range from 50 to 500 kHz, for detection of AE. By means of PZT accelerometric transducers, we have also identified AE at low frequencies (be-tween 1 kHz and 10 kHz) emerging just before the collapse of the Concrete specimen (Schiavi et al. 2009). The EM emission was analysed using an iso-tropic probe calibrated for measuring magnetic fields. The adopted device works in the frequency range between 10 Hz and 400 kHz, the measurement range is between 1 nT to 80 mT, and the three-axial measurement system has a 100 cm
2 magnetic field
sensor for each axis. This device was placed 1 m away from the specimens.
In all the considered cases, the presence of AE events has been always observed during the damage process. On the contrary, it is very interesting to note that, despite their different mechanical behaviour, all the specimens generate EME only during sharp drops in stress. These drops are due to a rapid decay of the material mechanical properties, generated by the for-mation of new micro-cracks during the loading proc-ess. Indeed, as has been shown, the energy release mo-dalities during compressive tests depend on the intrinsic brittleness of the material of the test specimens, as well as on test specimen dimensions and slenderness (Carpinteri 1989,1990, Hudson et al. 1972).
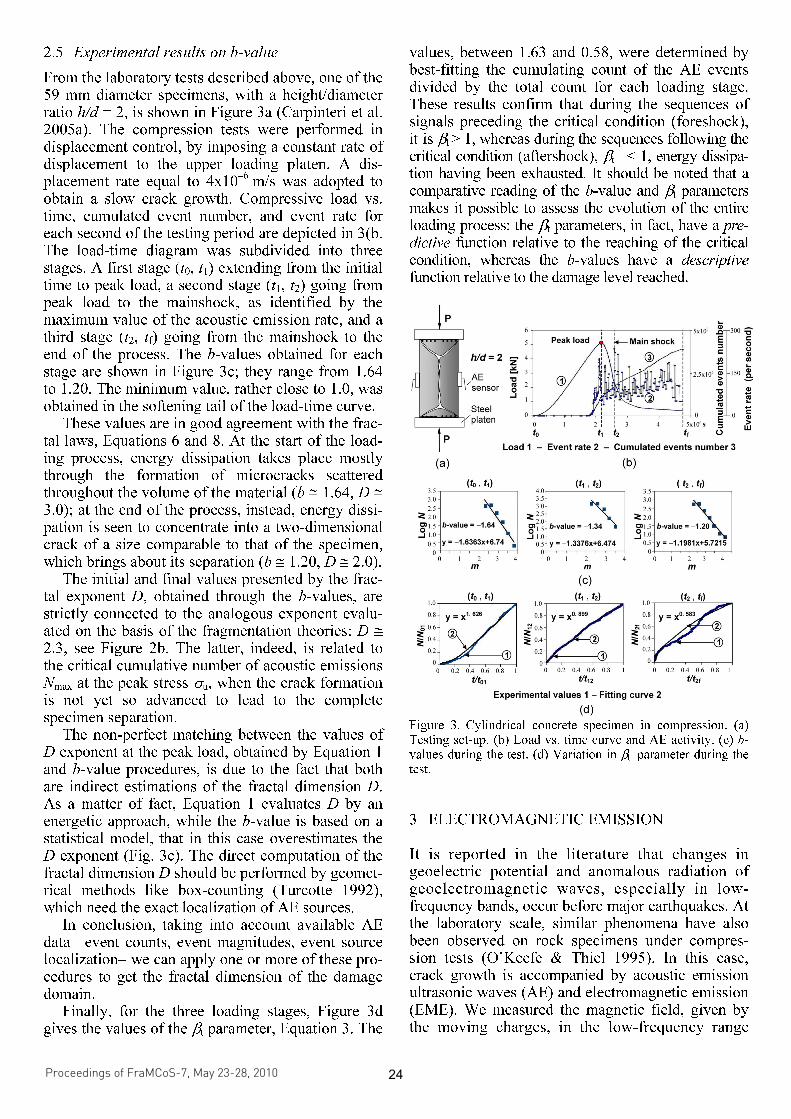
One of the experiments conducted on a rock specimen, Syracuse Limestone, is depicted in Figure 4. The specimen was subjected to uniaxial compres-sion by imposing a displacement rate of 1×10
−6 m/s
to obtain a very slow crack growth. As can be seen in Figure 4, the mechanical behaviour of the speci-men is characterized by a complex load vs. time dia-gram. This is due to the composition of limestone, which is a natural and heterogeneous material. We observed a constant increase in AE until the first stress drop, occurred at 70% of the peak load. This stage is followed by a staircase response up to the peak load. The cumulated number of AE events saturates after the peak load. Three EME events, with magnetic fields ranging between 1.4 and 1.8 µT, were detected in correspondence of each ob-served stress drop until the peak load was reached.
Even in this case, AE plays the role of fracture precursor since it precedes EME events accompany-ing stress drops and related discontinuous fracture advancements. During the post-peak stage, i.e., sof-tening branch in the load vs. time diagram, no fur-ther EME signals were detected. In fact, at the peak
0
20
40
60
80
100
0 1000 2000 3000 4000 5000 6000
0
500
1000
1500
2000
2500
3000
Load [kN]
Syracuse Limestone specimen
π × 2.52 ×10 cm
3
Load
EME 1= 1.4 µT
EME 2 = 1.5 µT
EME 3 = 1.8 µT
Time (s) Cumulated AE counting number
Piston velocity 1.0× 10⁻⁶ m s-1
AE
Figure 4. Load vs. time curve of the Syracuse Limestone specimen (bold line). The dashed line represents the cumulated number of AE. The stars on the graph show the moments of EME events with magnetic fields comprised between 1.4 and 1.8 µT.
load the fracture is completely formed and the sub-sequent stages are characterized mainly by opening of the fracture surfaces.
This evidence enables the simultaneous investiga-tion of AE and EM signals as collapse precursors in materials like rocks and concrete. Furthermore, the observed magnetic activity from laboratory experi-ments looks very promising for effective applica-tions at the geophysical scale (O’Keefe & Thiel 1995).
4 PIEZONUCLEAR EMISSION
Neutron emission measurements by means of he-lium-3 neutron detectors were performed on rock test specimens during crushing failure (Carpinteri et al. 2009a, Cardone et al. 2009a).
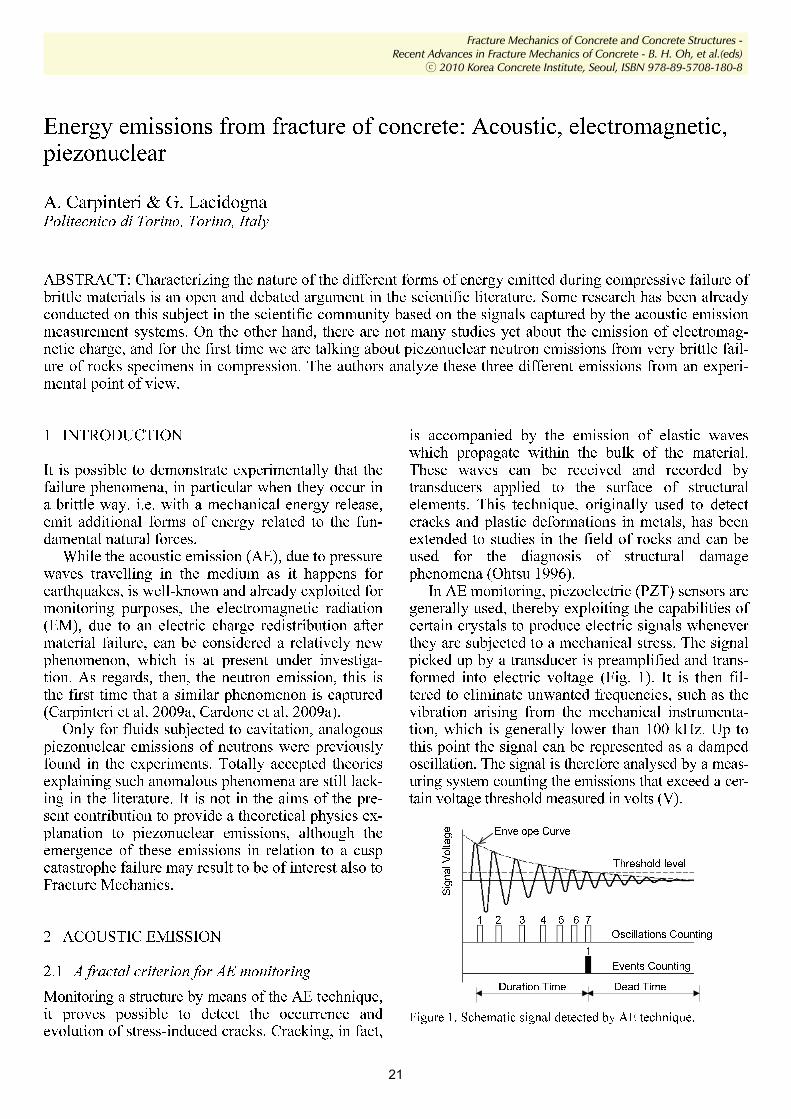
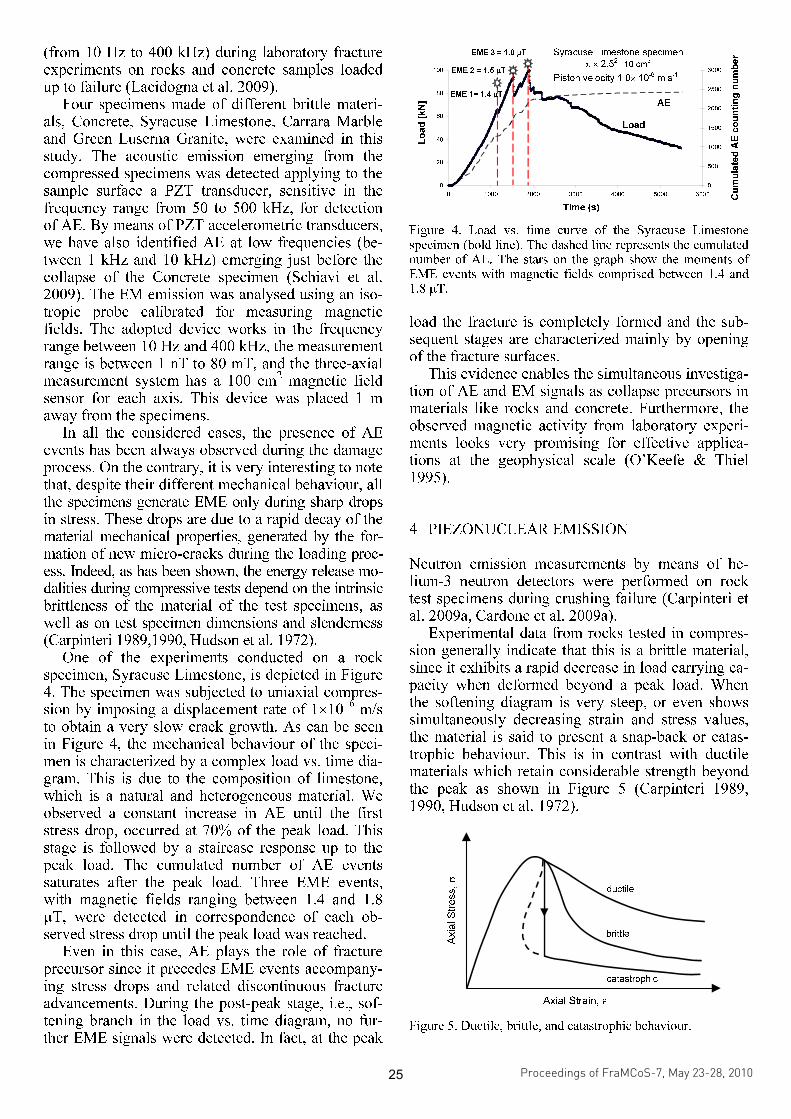
Experimental data from rocks tested in compres-sion generally indicate that this is a brittle material, since it exhibits a rapid decrease in load carrying ca-pacity when deformed beyond a peak load. When the softening diagram is very steep, or even shows simultaneously decreasing strain and stress values, the material is said to present a snap-back or catas-trophic behaviour. This is in contrast with ductile materials which retain considerable strength beyond the peak as shown in Figure 5 (Carpinteri 1989, 1990, Hudson et al. 1972).
Axial Strain, ε
Axial Stress, σ
ductile
brittle
catastrophic
Figure 5. Ductile, brittle, and catastrophic behaviour.
Proceedings of FraMCoS-7, May 23-28, 2010
hThD ∇−= ),(J (1)
The proportionality coefficient D(h,T) is called moisture permeability and it is a nonlinear function of the relative humidity h and temperature T (Bažant & Najjar 1972). The moisture mass balance requires that the variation in time of the water mass per unit volume of concrete (water content w) be equal to the divergence of the moisture flux J
J•∇=∂
∂−
t
w (2)
The water content w can be expressed as the sum
of the evaporable water we (capillary water, water vapor, and adsorbed water) and the non-evaporable (chemically bound) water wn (Mills 1966, Pantazopoulo & Mills 1995). It is reasonable to assume that the evaporable water is a function of relative humidity, h, degree of hydration, αc, and degree of silica fume reaction, αs, i.e. we=we(h,αc,αs) = age-dependent sorption/desorption isotherm (Norling Mjonell 1997). Under this assumption and by substituting Equation 1 into Equation 2 one obtains
nscw
s
ew
c
ew
hh
Dt
h
h
ew
&&& ++∂
∂
∂
∂
=∇•∇+∂
∂
∂
∂
− αα
αα
)(
(3)
where ∂we/∂h is the slope of the sorption/desorption isotherm (also called moisture capacity). The governing equation (Equation 3) must be completed by appropriate boundary and initial conditions.
The relation between the amount of evaporable water and relative humidity is called ‘‘adsorption isotherm” if measured with increasing relativity humidity and ‘‘desorption isotherm” in the opposite case. Neglecting their difference (Xi et al. 1994), in the following, ‘‘sorption isotherm” will be used with reference to both sorption and desorption conditions. By the way, if the hysteresis of the moisture isotherm would be taken into account, two different relation, evaporable water vs relative humidity, must be used according to the sign of the variation of the relativity humidity. The shape of the sorption isotherm for HPC is influenced by many parameters, especially those that influence extent and rate of the chemical reactions and, in turn, determine pore structure and pore size distribution (water-to-cement ratio, cement chemical composition, SF content, curing time and method, temperature, mix additives, etc.). In the literature various formulations can be found to describe the sorption isotherm of normal concrete (Xi et al. 1994). However, in the present paper the semi-empirical expression proposed by Norling Mjornell (1997) is adopted because it
explicitly accounts for the evolution of hydration reaction and SF content. This sorption isotherm reads
( ) ( )( )
( ) ( )⎥⎥
⎦
⎤
⎢⎢
⎣
⎡
⎥⎥⎥
⎦
⎤
⎢⎢⎢
⎣
⎡
−
−∞
+
−∞
−=
1110
,1
110
11,
1,,
hcc
ge
scK
hcc
ge
scG
sch
ew
αα
αα
αα
αααα
(4)
where the first term (gel isotherm) represents the physically bound (adsorbed) water and the second term (capillary isotherm) represents the capillary water. This expression is valid only for low content of SF. The coefficient G1 represents the amount of water per unit volume held in the gel pores at 100% relative humidity, and it can be expressed (Norling Mjornell 1997) as
( ) ss
s
vgkc
c
c
vgk
scG αααα +=,1
(5)
where k
cvg and k
svg are material parameters. From the
maximum amount of water per unit volume that can fill all pores (both capillary pores and gel pores), one can calculate K1 as one obtains
( )1
110
110
11
22.0188.00
,1
−⎟⎠
⎞⎜⎝
⎛−∞
⎥⎥⎥
⎦
⎤
⎢⎢⎢
⎣
⎡⎟⎠
⎞⎜⎝
⎛−∞
−−+−
=
hcc
ge
hcc
geGs
ssc
w
scK
αα
αα
αα
αα
(6)
The material parameters k
cvg and k
svg and g1 can
be calibrated by fitting experimental data relevant to free (evaporable) water content in concrete at various ages (Di Luzio & Cusatis 2009b).
2.2 Temperature evolution
Note that, at early age, since the chemical reactions associated with cement hydration and SF reaction are exothermic, the temperature field is not uniform for non-adiabatic systems even if the environmental temperature is constant. Heat conduction can be described in concrete, at least for temperature not exceeding 100°C (Bažant & Kaplan 1996), by Fourier’s law, which reads
T∇−= λq (7)
where q is the heat flux, T is the absolute temperature, and λ is the heat conductivity; in this
The materials selected for the compression tests were Carrara Marble (calcite) and green Luserna Granite (gneiss). This choice was prompted by the consideration that they present a different iron con-tent and, test specimen dimensions being the same, different brittleness numbers (Carpinteri 1989) would cause catastrophic failure in granite, not in marble. The test specimens were subjected to uniax-ial compression to assess scale effects on brittleness (Carpinteri 1990). Four test specimens were used, two made of Carrara Marble, consisting mostly of calcite, and two made of Luserna Granite, all of them measuring 6×6×10 cm
3.
The tests were performed in piston travel dis-placement control by setting, for all the test speci-mens, a velocity of 10
−6 m/s during compression.
Neutron emission measurements were made by means of a helium-3 detector placed at a distance of 10 cm from the test specimen and enclosed in a polystyrene case so as to prevent the results from be-ing altered by vibrations or impacts. This detector was also calibrated for the measurement of thermal neutrons; its sensitivity is 65 cps/nthermal, i.e., the flux of thermal neutrons was 1 thermal neutron/s cm
2,
corresponding to a count rate of 65 cps. The neutron background was measured at 600 s time intervals to obtain sufficient statistical data. The average back-ground count rate was: 3.8×10
−2 ± 0.2×10
−2 cps, cor-
responding to an equivalent flux of thermal neutrons of 5.8×10
−4 ± 0.3×10
−4 nthermal/s cm
2.
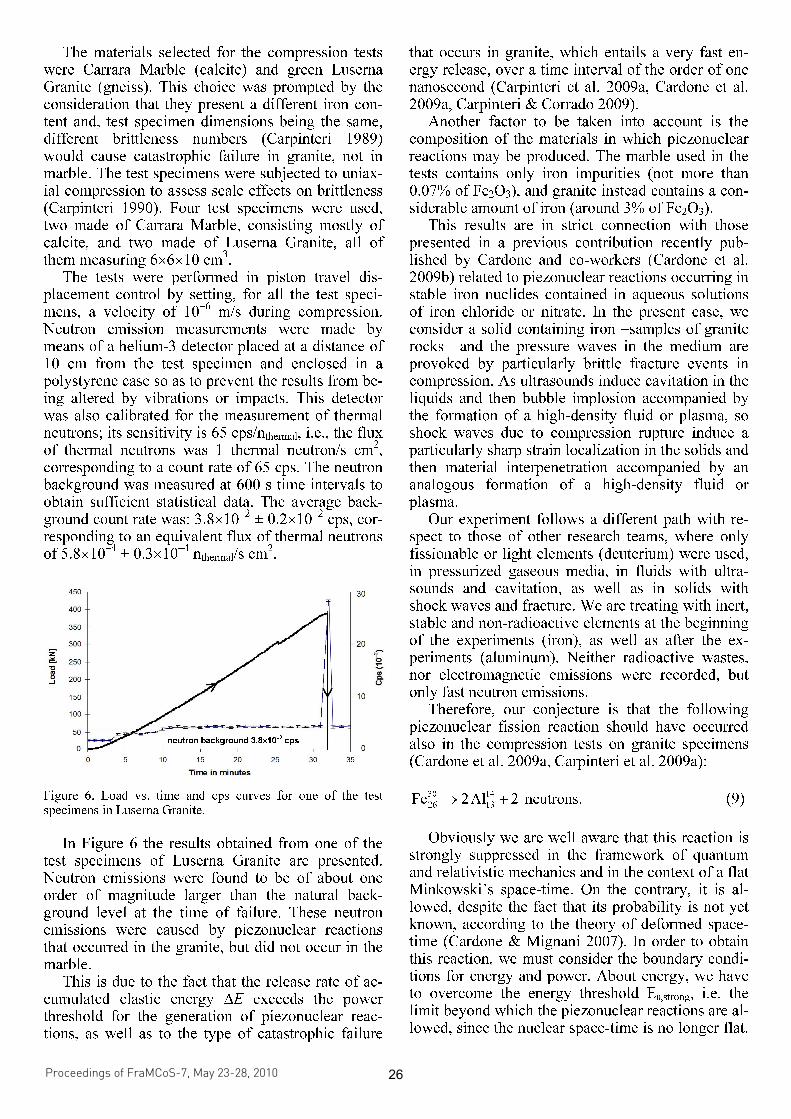
Specimen P3
neutron background 3.8×10⁻² cps
Figure 6. Load vs. time and cps curves for one of the test specimens in Luserna Granite.
In Figure 6 the results obtained from one of the
test specimens of Luserna Granite are presented. Neutron emissions were found to be of about one order of magnitude larger than the natural back-ground level at the time of failure. These neutron emissions were caused by piezonuclear reactions that occurred in the granite, but did not occur in the marble.
This is due to the fact that the release rate of ac-cumulated elastic energy ∆E exceeds the power threshold for the generation of piezonuclear reac-tions, as well as to the type of catastrophic failure
that occurs in granite, which entails a very fast en-ergy release, over a time interval of the order of one nanosecond (Carpinteri et al. 2009a, Cardone et al. 2009a, Carpinteri & Corrado 2009).
Another factor to be taken into account is the composition of the materials in which piezonuclear reactions may be produced. The marble used in the tests contains only iron impurities (not more than 0.07% of Fe2O3), and granite instead contains a con-siderable amount of iron (around 3% of Fe2O3).
This results are in strict connection with those presented in a previous contribution recently pub-lished by Cardone and co-workers (Cardone et al. 2009b) related to piezonuclear reactions occurring in stable iron nuclides contained in aqueous solutions of iron chloride or nitrate. In the present case, we consider a solid containing iron −samples of granite rocks− and the pressure waves in the medium are provoked by particularly brittle fracture events in compression. As ultrasounds induce cavitation in the liquids and then bubble implosion accompanied by the formation of a high-density fluid or plasma, so shock waves due to compression rupture induce a particularly sharp strain localization in the solids and then material interpenetration accompanied by an analogous formation of a high-density fluid or plasma.
Our experiment follows a different path with re-spect to those of other research teams, where only fissionable or light elements (deuterium) were used, in pressurized gaseous media, in fluids with ultra-sounds and cavitation, as well as in solids with shock waves and fracture. We are treating with inert, stable and non-radioactive elements at the beginning of the experiments (iron), as well as after the ex-periments (aluminum). Neither radioactive wastes, nor electromagnetic emissions were recorded, but only fast neutron emissions.
Therefore, our conjecture is that the following piezonuclear fission reaction should have occurred also in the compression tests on granite specimens (Cardone et al. 2009a, Carpinteri et al. 2009a):
neutrons.2Al2Fe14
13
30
26+→ (9)
Obviously we are well aware that this reaction is
strongly suppressed in the framework of quantum and relativistic mechanics and in the context of a flat Minkowski’s space-time. On the contrary, it is al-lowed, despite the fact that its probability is not yet known, according to the theory of deformed space-time (Cardone & Mignani 2007). In order to obtain this reaction, we must consider the boundary condi-tions for energy and power. About energy, we have to overcome the energy threshold E0,strong, i.e. the limit beyond which the piezonuclear reactions are al-lowed, since the nuclear space-time is no longer flat.
Proceedings of FraMCoS-7, May 23-28, 2010
hThD ∇−= ),(J (1)
The proportionality coefficient D(h,T) is called moisture permeability and it is a nonlinear function of the relative humidity h and temperature T (Bažant & Najjar 1972). The moisture mass balance requires that the variation in time of the water mass per unit volume of concrete (water content w) be equal to the divergence of the moisture flux J
J•∇=∂
∂−
t
w (2)
The water content w can be expressed as the sum
of the evaporable water we (capillary water, water vapor, and adsorbed water) and the non-evaporable (chemically bound) water wn (Mills 1966, Pantazopoulo & Mills 1995). It is reasonable to assume that the evaporable water is a function of relative humidity, h, degree of hydration, αc, and degree of silica fume reaction, αs, i.e. we=we(h,αc,αs) = age-dependent sorption/desorption isotherm (Norling Mjonell 1997). Under this assumption and by substituting Equation 1 into Equation 2 one obtains
nscw
s
ew
c
ew
hh
Dt
h
h
ew
&&& ++∂
∂
∂
∂
=∇•∇+∂
∂
∂
∂
− αα
αα
)(
(3)
where ∂we/∂h is the slope of the sorption/desorption isotherm (also called moisture capacity). The governing equation (Equation 3) must be completed by appropriate boundary and initial conditions.
The relation between the amount of evaporable water and relative humidity is called ‘‘adsorption isotherm” if measured with increasing relativity humidity and ‘‘desorption isotherm” in the opposite case. Neglecting their difference (Xi et al. 1994), in the following, ‘‘sorption isotherm” will be used with reference to both sorption and desorption conditions. By the way, if the hysteresis of the moisture isotherm would be taken into account, two different relation, evaporable water vs relative humidity, must be used according to the sign of the variation of the relativity humidity. The shape of the sorption isotherm for HPC is influenced by many parameters, especially those that influence extent and rate of the chemical reactions and, in turn, determine pore structure and pore size distribution (water-to-cement ratio, cement chemical composition, SF content, curing time and method, temperature, mix additives, etc.). In the literature various formulations can be found to describe the sorption isotherm of normal concrete (Xi et al. 1994). However, in the present paper the semi-empirical expression proposed by Norling Mjornell (1997) is adopted because it
explicitly accounts for the evolution of hydration reaction and SF content. This sorption isotherm reads
( ) ( )( )
( ) ( )⎥⎥
⎦
⎤
⎢⎢
⎣
⎡
⎥⎥⎥
⎦
⎤
⎢⎢⎢
⎣
⎡
−
−∞
+
−∞
−=
1110
,1
110
11,
1,,
hcc
ge
scK
hcc
ge
scG
sch
ew
αα
αα
αα
αααα
(4)
where the first term (gel isotherm) represents the physically bound (adsorbed) water and the second term (capillary isotherm) represents the capillary water. This expression is valid only for low content of SF. The coefficient G1 represents the amount of water per unit volume held in the gel pores at 100% relative humidity, and it can be expressed (Norling Mjornell 1997) as
( ) ss
s
vgkc
c
c
vgk
scG αααα +=,1
(5)
where k
cvg and k
svg are material parameters. From the
maximum amount of water per unit volume that can fill all pores (both capillary pores and gel pores), one can calculate K1 as one obtains
( )1
110
110
11
22.0188.00
,1
−⎟⎠
⎞⎜⎝
⎛−∞
⎥⎥⎥
⎦
⎤
⎢⎢⎢
⎣
⎡⎟⎠
⎞⎜⎝
⎛−∞
−−+−
=
hcc
ge
hcc
geGs
ssc
w
scK
αα
αα
αα
αα
(6)
The material parameters k
cvg and k
svg and g1 can
be calibrated by fitting experimental data relevant to free (evaporable) water content in concrete at various ages (Di Luzio & Cusatis 2009b).
2.2 Temperature evolution
Note that, at early age, since the chemical reactions associated with cement hydration and SF reaction are exothermic, the temperature field is not uniform for non-adiabatic systems even if the environmental temperature is constant. Heat conduction can be described in concrete, at least for temperature not exceeding 100°C (Bažant & Kaplan 1996), by Fourier’s law, which reads
T∇−= λq (7)
where q is the heat flux, T is the absolute temperature, and λ is the heat conductivity; in this
About power, we need to overcome the threshold in the “speed of energy”, Wstrong, which determines whether the potential reactions are possible or not (Cardone et al. 2009a).
In addition to the previous observations and ex-periments, other strong reasons of a very general na-ture push us to emphasize this type of explanation. The present natural abundance of aluminum (7-8% in the Earth crust), which is less favoured than iron from a nuclear point of view (it has a lower bond en-ergy per nucleon), is possibly due to the above pie-zonuclear fission reaction. This reaction –less infre-quent than we could think– would be activated where the environment conditions (pressure and temperature) are particularly severe, and mechanical phenomena of fracture, crushing, fragmentation, comminution, erosion, friction, etc., may occur.
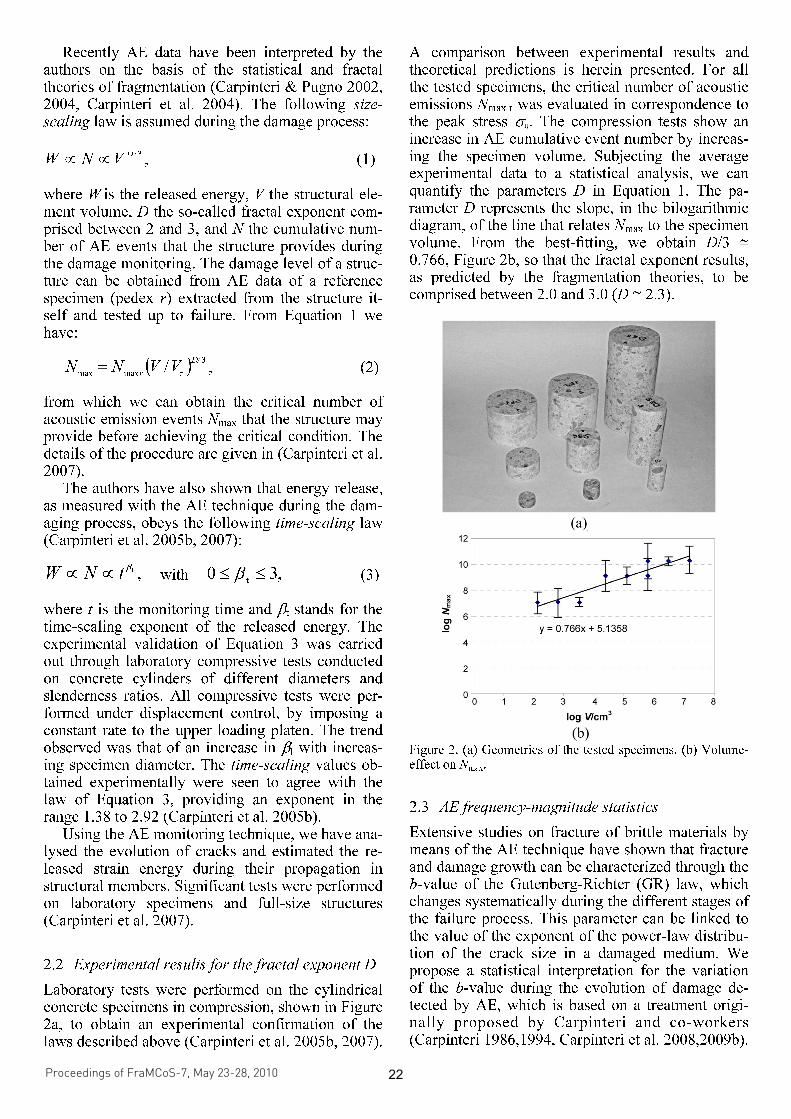
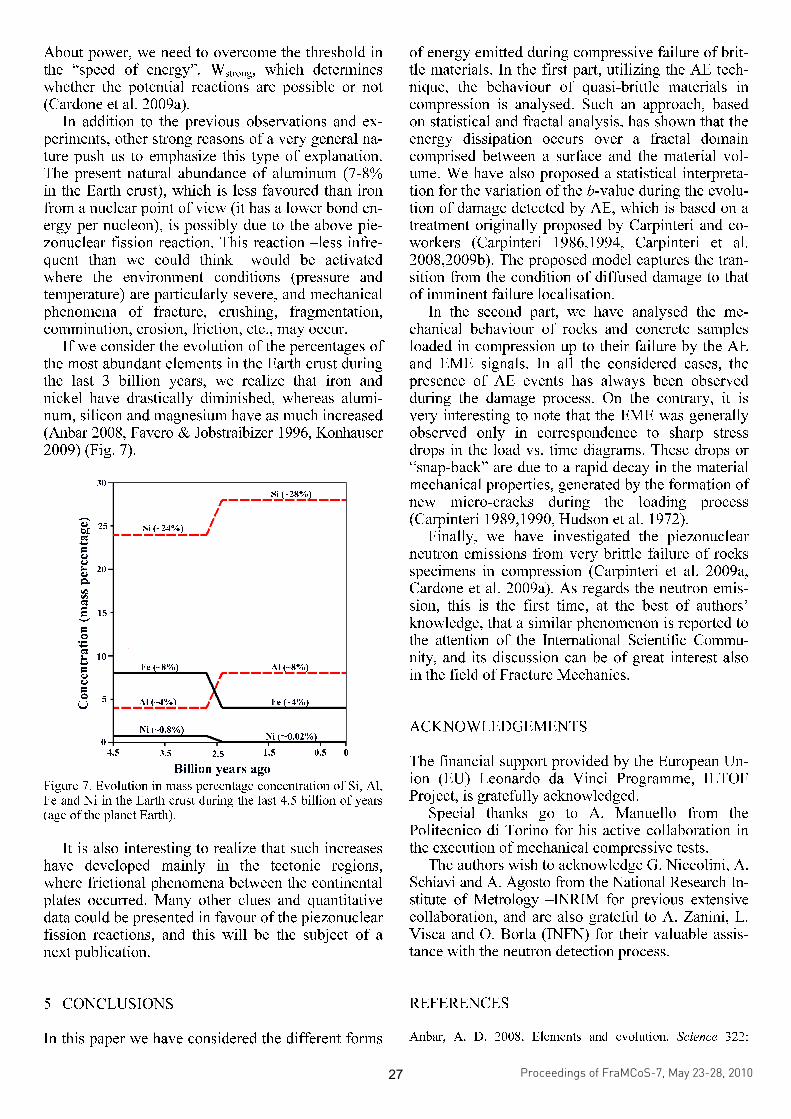
If we consider the evolution of the percentages of the most abundant elements in the Earth crust during the last 3 billion years, we realize that iron and nickel have drastically diminished, whereas alumi-num, silicon and magnesium have as much increased (Anbar 2008, Favero & Jobstraibizer 1996, Konhauser 2009) (Fig. 7).
4.5 3.5 2.5 1.5 0.50
5
10
Ni (~0.8%)Ni (~0.02%)
Al (~4%)
Fe (~8%)
Concentration(mass percentage)
Si (~28%)
Al (~8%)
Fe (~4%)
Si (~24%)
Billion years ago
15
20
25
30
04.5 3.5 2.5 1.5 0.50
5
10
Ni (~0.8%)Ni (~0.02%)
Al (~4%)
Fe (~8%)
Concentration(mass percentage)
Si (~28%)
Al (~8%)
Fe (~4%)
Si (~24%)
Billion years ago
15
20
25
30
04.5 3.5 2.5 1.5 0.50
5
10
Ni (~0.8%)Ni (~0.02%)
Al (~4%)
Fe (~8%)
Concentration(mass percentage)
Si (~28%)
Al (~8%)
Fe (~4%)
Si (~24%)
Billion years ago
15
20
25
30
0
Figure 7. Evolution in mass percentage concentration of Si, Al, Fe and Ni in the Earth crust during the last 4.5 billion of years (age of the planet Earth).
It is also interesting to realize that such increases
have developed mainly in the tectonic regions, where frictional phenomena between the continental plates occurred. Many other clues and quantitative data could be presented in favour of the piezonuclear fission reactions, and this will be the subject of a next publication.
5 CONCLUSIONS
In this paper we have considered the different forms
of energy emitted during compressive failure of brit-tle materials. In the first part, utilizing the AE tech-nique, the behaviour of quasi-brittle materials in compression is analysed. Such an approach, based on statistical and fractal analysis, has shown that the energy dissipation occurs over a fractal domain comprised between a surface and the material vol-ume. We have also proposed a statistical interpreta-tion for the variation of the b-value during the evolu-tion of damage detected by AE, which is based on a treatment originally proposed by Carpinteri and co-workers (Carpinteri 1986,1994, Carpinteri et al. 2008,2009b). The proposed model captures the tran-sition from the condition of diffused damage to that of imminent failure localisation.
In the second part, we have analysed the me-chanical behaviour of rocks and concrete samples loaded in compression up to their failure by the AE and EME signals. In all the considered cases, the presence of AE events has always been observed during the damage process. On the contrary, it is very interesting to note that the EME was generally observed only in correspondence to sharp stress drops in the load vs. time diagrams. These drops or “snap-back” are due to a rapid decay in the material mechanical properties, generated by the formation of new micro-cracks during the loading process (Carpinteri 1989,1990, Hudson et al. 1972).
Finally, we have investigated the piezonuclear neutron emissions from very brittle failure of rocks specimens in compression (Carpinteri et al. 2009a, Cardone et al. 2009a). As regards the neutron emis-sion, this is the first time, at the best of authors’ knowledge, that a similar phenomenon is reported to the attention of the International Scientific Commu-nity, and its discussion can be of great interest also in the field of Fracture Mechanics.
ACKNOWLEDGEMENTS
The financial support provided by the European Un-ion (EU) Leonardo da Vinci Programme, ILTOF Project, is gratefully acknowledged.
Special thanks go to A. Manuello from the Politecnico di Torino for his active collaboration in the execution of mechanical compressive tests.
The authors wish to acknowledge G. Niccolini, A. Schiavi and A. Agosto from the National Research In-stitute of Metrology –INRIM for previous extensive collaboration, and are also grateful to A. Zanini, L. Visca and O. Borla (INFN) for their valuable assis-tance with the neutron detection process.
REFERENCES
Anbar, A. D. 2008. Elements and evolution. Science 322:
Proceedings of FraMCoS-7, May 23-28, 2010
hThD ∇−= ),(J (1)
The proportionality coefficient D(h,T) is called moisture permeability and it is a nonlinear function of the relative humidity h and temperature T (Bažant & Najjar 1972). The moisture mass balance requires that the variation in time of the water mass per unit volume of concrete (water content w) be equal to the divergence of the moisture flux J
J•∇=∂
∂−
t
w (2)
The water content w can be expressed as the sum
of the evaporable water we (capillary water, water vapor, and adsorbed water) and the non-evaporable (chemically bound) water wn (Mills 1966, Pantazopoulo & Mills 1995). It is reasonable to assume that the evaporable water is a function of relative humidity, h, degree of hydration, αc, and degree of silica fume reaction, αs, i.e. we=we(h,αc,αs) = age-dependent sorption/desorption isotherm (Norling Mjonell 1997). Under this assumption and by substituting Equation 1 into Equation 2 one obtains
nscw
s
ew
c
ew
hh
Dt
h
h
ew
&&& ++∂
∂
∂
∂
=∇•∇+∂
∂
∂
∂
− αα
αα
)(
(3)
where ∂we/∂h is the slope of the sorption/desorption isotherm (also called moisture capacity). The governing equation (Equation 3) must be completed by appropriate boundary and initial conditions.
The relation between the amount of evaporable water and relative humidity is called ‘‘adsorption isotherm” if measured with increasing relativity humidity and ‘‘desorption isotherm” in the opposite case. Neglecting their difference (Xi et al. 1994), in the following, ‘‘sorption isotherm” will be used with reference to both sorption and desorption conditions. By the way, if the hysteresis of the moisture isotherm would be taken into account, two different relation, evaporable water vs relative humidity, must be used according to the sign of the variation of the relativity humidity. The shape of the sorption isotherm for HPC is influenced by many parameters, especially those that influence extent and rate of the chemical reactions and, in turn, determine pore structure and pore size distribution (water-to-cement ratio, cement chemical composition, SF content, curing time and method, temperature, mix additives, etc.). In the literature various formulations can be found to describe the sorption isotherm of normal concrete (Xi et al. 1994). However, in the present paper the semi-empirical expression proposed by Norling Mjornell (1997) is adopted because it
explicitly accounts for the evolution of hydration reaction and SF content. This sorption isotherm reads
( ) ( )( )
( ) ( )⎥⎥
⎦
⎤
⎢⎢
⎣
⎡
⎥⎥⎥
⎦
⎤
⎢⎢⎢
⎣
⎡
−
−∞
+
−∞
−=
1110
,1
110
11,
1,,
hcc
ge
scK
hcc
ge
scG
sch
ew
αα
αα
αα
αααα
(4)
where the first term (gel isotherm) represents the physically bound (adsorbed) water and the second term (capillary isotherm) represents the capillary water. This expression is valid only for low content of SF. The coefficient G1 represents the amount of water per unit volume held in the gel pores at 100% relative humidity, and it can be expressed (Norling Mjornell 1997) as
( ) ss
s
vgkc
c
c
vgk
scG αααα +=,1
(5)
where k
cvg and k
svg are material parameters. From the
maximum amount of water per unit volume that can fill all pores (both capillary pores and gel pores), one can calculate K1 as one obtains
( )1
110
110
11
22.0188.00
,1
−⎟⎠
⎞⎜⎝
⎛−∞
⎥⎥⎥
⎦
⎤
⎢⎢⎢
⎣
⎡⎟⎠
⎞⎜⎝
⎛−∞
−−+−
=
hcc
ge
hcc
geGs
ssc
w
scK
αα
αα
αα
αα
(6)
The material parameters k
cvg and k
svg and g1 can
be calibrated by fitting experimental data relevant to free (evaporable) water content in concrete at various ages (Di Luzio & Cusatis 2009b).
2.2 Temperature evolution
Note that, at early age, since the chemical reactions associated with cement hydration and SF reaction are exothermic, the temperature field is not uniform for non-adiabatic systems even if the environmental temperature is constant. Heat conduction can be described in concrete, at least for temperature not exceeding 100°C (Bažant & Kaplan 1996), by Fourier’s law, which reads
T∇−= λq (7)
where q is the heat flux, T is the absolute temperature, and λ is the heat conductivity; in this
1481-1482. Cardone, F., Carpinteri, A. & Lacidogna, G. 2009a. Piezonu-
clear neutrons from fracturing of inert solids. Physics Letters A 373: 4158-4163.
Cardone, F., Cherubini, G. & Petrucci, A. 2009b. Piezonuclear neutrons. Physics Letters A 373: 862-866.
Cardone, F. & Mignani, R. 2007. Deformed Spacetime, Dordrecht: Springer (Chaps 16-17).
Carpinteri, A. 1986. Mechanical Damage and Crack Growth in Concrete: Plastic Collapse to Brittle Fracture. Dordrecht: Martinus Nijhoff Publishers.
Carpinteri, A. 1989. Cusp catastrophe interpretation of fracture instability. Journal of the Mechanics and Physics of Solids 37: 567-582.
Carpinteri, A. 1990. A catastrophe theory approach to fracture mechanics. International Journal of Fracture 44: 57-69.
Carpinteri, A. 1994. Scaling laws and renormalization groups for strength and toughness of disordered materials. Interna-tional Journal of Solids and Structures 31: 291-302.
Carpinteri, A., Cardone, F. & Lacidogna, G. 2009a. Piezonu-clear neutrons from brittle fracture: Early results of me-chanical compression tests. Strain 45: 332-339.
Carpinteri, A. & Corrado, M. 2009. An extended (fractal) over-lapping crack model to describe crushing size-scale effects in compression. Engineering Failure Analysis 16: 2530-2540.
Carpinteri, A., Lacidogna, G. & Niccolini, G. 2005a. Critical behaviour in concrete structures and damage localization by acoustic emission. Key Engineering Materials 312: 305-310.
Carpinteri, A., Lacidogna, G., Niccolini, G. & Puzzi, S. 2008. Critical defect size distributions in concrete structures de-tected by the acoustic emission technique. Meccanica 43: 349-363.
Carpinteri, A., Lacidogna, G. & Pugno, N. 2004. Scaling of en-ergy dissipation in crushing and fragmentation: A fractal and statistical analysis based on particle size distribution. International Journal of Fracture 129: 131-139.
Carpinteri, A., Lacidogna, G. & Pugno, N. 2007. Structural damage diagnosis and life-time assessment by acoustic emission monitoring. Engineering Fracture Mechanics 74: 273-289.
Carpinteri, A., Lacidogna, G. & Pugno, N. 2005b. Time-scale effects during damage evolution: a fractal approach based on acoustic emission. Strength, Fracture and Complexity 3: 127-135.
Carpinteri, A., Lacidogna, G. & Puzzi, S. 2009b. From critical-ity to final collapse: Evolution of the b-value from 1.5 to 1.0. Chaos, Solitons & Fractals 41: 843-853.
Carpinteri, A. & Pugno, N. 2002. One- two- and three-dimensional universal laws for fragmentation due to impact and explosion. Journal of Applied Mechanics 69: 854-856.
Carpinteri, A. & Pugno, N. 2004. Size effects on average and standard deviation values for the mechanical properties of condensed matter: a energy based unified approach. Inter-national Journal of Fracture 128: 253-261.
Colombo, S., Main, I.G. & Forde, M.C. 2003. Assessing dam-age of reinforced concrete beam using ‘‘b-value’’ analysis of acoustic emission signals. Journal of Materials in Civil Engineering, ASCE 15: 280-286.
Favero, G. & Jobstraibizer, P. 1996. The distribution of alumi-num in the Earth: From cosmogenesis to Sial evolution. Coord. Chem. Rev. 149: 467- 400.
Hudson, J. A., Crouch, S. L. & Fairhurst, C. 1972. Soft, stiff and servo-controlled testing machines: A review with refer-ence to rock failure. Engineering Geology 6: 155-189.
Konhauser, K. O., Pecoits, E., Lalonde, S. V., Papineau, D., Nisbet, E. G., Barley, M. E., Arndt, N. T., Zahnle, K. & Kamber, B. S. 2009. Oceanic Nickel depletion and a methanogen famine before the great oxidation event. Nature 458:750-754.
Lacidogna, G., Manuello, A., Durin, G., Niccolini, G., Agosto, A. & Carpinteri, A. 2009. Acoustic and magnetic emissions as precursor phenomena in failure processes. Proc. of SEM Annual Conference & Exposition on Experimental and Ap-plied Mechanics, Albuquerque, 1-4 June 2009. Paper No. 540.
Ohtsu, M. 1996. The history and development of acoustic emission in concrete engineering. Magazine of Concrete Research 48: 321-330.
O’Keefe, S. G. & Thiel, D. V. 1995. A mechanism for the pro-duction of electromagnetic radiation during fracture of brit-tle materials. Phys. Earth Plant. Inter. 89: 127-135.
Richter, C.F. 1958. Elementary Seismology. San Francisco & Lon-don: W. H. Freeman & Company.
Rundle, J.B., Turcotte, D.L., Shcherbakov, R., Klein, W. & Sammis, C. 2003. Statistical physics approach to under-standing the multiscale dynamics of earthquake fault sys-tems. Reviews of Geophysics 41: 1-30.
Schiavi, A., Niccolini, G., Tarizzo, P., Lacidogna, G., Manuello, A. & Carpinteri, A. 2009. Analysis of acoustic emission at low frequencies in brittle materials under com-pression. Proc. of SEM Annual Conference & Exposition on Experimental and Applied Mechanics, Albuquerque, 1-4 June 2009. Paper No. 539.
Turcotte, D. L. 1992. Fractals and Chaos in Geology and Geo-physics. Cambridge: Cambridge University Press.
Uomoto, T. 1987. Application of acoustic emission to the field of concrete engineering. Journal of Acoustic Emission 6: 137-144.
Proceedings of FraMCoS-7, May 23-28, 2010
hThD ∇−= ),(J (1)
The proportionality coefficient D(h,T) is called moisture permeability and it is a nonlinear function of the relative humidity h and temperature T (Bažant & Najjar 1972). The moisture mass balance requires that the variation in time of the water mass per unit volume of concrete (water content w) be equal to the divergence of the moisture flux J
J•∇=∂
∂−
t
w (2)
The water content w can be expressed as the sum
of the evaporable water we (capillary water, water vapor, and adsorbed water) and the non-evaporable (chemically bound) water wn (Mills 1966, Pantazopoulo & Mills 1995). It is reasonable to assume that the evaporable water is a function of relative humidity, h, degree of hydration, αc, and degree of silica fume reaction, αs, i.e. we=we(h,αc,αs) = age-dependent sorption/desorption isotherm (Norling Mjonell 1997). Under this assumption and by substituting Equation 1 into Equation 2 one obtains
nscw
s
ew
c
ew
hh
Dt
h
h
ew
&&& ++∂
∂
∂
∂
=∇•∇+∂
∂
∂
∂
− αα
αα
)(
(3)
where ∂we/∂h is the slope of the sorption/desorption isotherm (also called moisture capacity). The governing equation (Equation 3) must be completed by appropriate boundary and initial conditions.
The relation between the amount of evaporable water and relative humidity is called ‘‘adsorption isotherm” if measured with increasing relativity humidity and ‘‘desorption isotherm” in the opposite case. Neglecting their difference (Xi et al. 1994), in the following, ‘‘sorption isotherm” will be used with reference to both sorption and desorption conditions. By the way, if the hysteresis of the moisture isotherm would be taken into account, two different relation, evaporable water vs relative humidity, must be used according to the sign of the variation of the relativity humidity. The shape of the sorption isotherm for HPC is influenced by many parameters, especially those that influence extent and rate of the chemical reactions and, in turn, determine pore structure and pore size distribution (water-to-cement ratio, cement chemical composition, SF content, curing time and method, temperature, mix additives, etc.). In the literature various formulations can be found to describe the sorption isotherm of normal concrete (Xi et al. 1994). However, in the present paper the semi-empirical expression proposed by Norling Mjornell (1997) is adopted because it
explicitly accounts for the evolution of hydration reaction and SF content. This sorption isotherm reads
( ) ( )( )
( ) ( )⎥⎥
⎦
⎤
⎢⎢
⎣
⎡
⎥⎥⎥
⎦
⎤
⎢⎢⎢
⎣
⎡
−
−∞
+
−∞
−=
1110
,1
110
11,
1,,
hcc
ge
scK
hcc
ge
scG
sch
ew
αα
αα
αα
αααα
(4)
where the first term (gel isotherm) represents the physically bound (adsorbed) water and the second term (capillary isotherm) represents the capillary water. This expression is valid only for low content of SF. The coefficient G1 represents the amount of water per unit volume held in the gel pores at 100% relative humidity, and it can be expressed (Norling Mjornell 1997) as
( ) ss
s
vgkc
c
c
vgk
scG αααα +=,1
(5)
where k
cvg and k
svg are material parameters. From the
maximum amount of water per unit volume that can fill all pores (both capillary pores and gel pores), one can calculate K1 as one obtains
( )1
110
110
11
22.0188.00
,1
−⎟⎠
⎞⎜⎝
⎛−∞
⎥⎥⎥
⎦
⎤
⎢⎢⎢
⎣
⎡⎟⎠
⎞⎜⎝
⎛−∞
−−+−
=
hcc
ge
hcc
geGs
ssc
w
scK
αα
αα
αα
αα
(6)
The material parameters k
cvg and k
svg and g1 can
be calibrated by fitting experimental data relevant to free (evaporable) water content in concrete at various ages (Di Luzio & Cusatis 2009b).
2.2 Temperature evolution
Note that, at early age, since the chemical reactions associated with cement hydration and SF reaction are exothermic, the temperature field is not uniform for non-adiabatic systems even if the environmental temperature is constant. Heat conduction can be described in concrete, at least for temperature not exceeding 100°C (Bažant & Kaplan 1996), by Fourier’s law, which reads
T∇−= λq (7)
where q is the heat flux, T is the absolute temperature, and λ is the heat conductivity; in this