Embed Size (px)
Citation preview

Research team Paul Omondi Walter Odera Peter Mwangi Wycliffe Elahalwa Ruman Idris
Strengthening citizens’ influence on WASH in the devolved governance system Baseline Survey Report
June 2015

ii
Acknowledgement Recognizing the broader goals of this study – to go beyond the general thinking of water, sanitation and hygiene in terms of practices and interventions, the study team put a lot of effort to collect information, analyze the data and develop this report as the ultimate product. Undertaking this work would, however not have been possible without the guidance and support that the research team received from numerous people. The team would like to convey gratitude to the staff of Maji na Ufanisi for their enthusiastic help in conducting this assessment particularly Mr. Geoffrey Rotich for the invaluable advice in relation to the pre-survey consultative discussions which provided critical direction for this work. We also like to extend our special gratitude the County Government of Taita Taveta for expediting authorization to allow for data collection, and also for the staff who willingly providing crucial information. In undertaking this work, we also received great support from Mr. Darius Mombo and Austin Vita of Ngua Mlambo Community Development Trust in terms of valuable tie they provided in the field. Appreciation is also extended to the enumerators, and more importantly, to the respondents, both the household survey and key informant. We note with gratitude their contributions towards this survey. Any views expressed in this report are those of the authors and not necessarily those of the organizations or institutions consulted.
Paul Omondi Lead Researcher

iii
Acronyms and Abbreviations
AIDS – Acquired Immunity Deficiency Syndrome
CWSB – Coast Water Services Board
CBO – Community Based organization
CIDP – County Integrated Development Plans
ECD – Early Childhood Development
FGD – Focus Group Discussion
HIV – Human Immuno-Deficiency Virus
ICF – International Classification of Functioning
KCDP – Kenya Coastal Development Project
MOH – Ministry of Health
NGO – Non-Governmental Organization
ODF – Open Defecation Free
PLHIV – People Living with HIV/AIDS
PWD – People with Disability
RWH – Rain water Harvesting
SPSS – Statistical Product and Service Solutions
TAVEVO – Tavevo Water and Sewerage Company
VIP – Ventilated Improved Pit Latrine
WARUA – Water Resource Users Association
WSP – Water Service Provider

iv
Contents
Executive Summary ........................................................................................................................................... 1 1 Introduction ................................................................................................................................... 5 1.1 Background ................................................................................................................................... 5 1.2 Purpose of this Study .................................................................................................................... 5 2 Research Methodology.................................................................................................................. 6 2.1 Study Approach ............................................................................................................................. 6 3 Literature Review .......................................................................................................................... 8 3.1 The Biophysical Contexts ............................................................................................................. 8 3.2 Socio-economic Context ............................................................................................................... 9 3.3 Water and Sanitation: Situation Analysis .................................................................................... 10 3.4 Cross-Cutting Issues ................................................................................................................... 11 3.5 Budget Allocation and Funding .................................................................................................. 13 4 Findings from Household Survey ............................................................................................... 15 4.1 Demographic Profile ................................................................................................................... 15 4.2 Domestic Water ........................................................................................................................... 16 4.3 Sanitation .................................................................................................................................... 20 4.4 Solid Waste ................................................................................................................................. 24 4.5 Health .......................................................................................................................................... 28 4.6 Livelihoods .................................................................................................................................. 30 4.7 Conflict and Insecurity ................................................................................................................ 33 4.8 Community Participation and Governance ................................................................................. 34 5 Findings from Household Survey ............................................................................................... 37 5.1 Challenges and Priorities in Water and Sanitation ...................................................................... 37 5.2 Vulnerability Contexts and Priorities .......................................................................................... 48 5.3 Coordination, Collaboration and Networks ................................................................................ 49 5.4 Service Provision for Schools ..................................................................................................... 52 5.5 Public Participation ..................................................................................................................... 54 5.5 Budget Deficit and Funding ........................................................................................................ 55 Conclusion ..................................................................................................................................................... 57 References ..................................................................................................................................................... 61

v
List of Tables
Table 2.1 Achieved sample by Sub-County .......................................................................................................................... 6 Table 3.1 Population data for Taita Taveta County .......................................................................................................... 8 Table 3.2 Spatial distribution and major characteristics of the agro-economic zones...................................... 9 Table 3.3 Proportions of parcels using fertilizer (2005-6) ........................................................................................... 9 Table 3.4 Livestock population ................................................................................................................................................. 9 Table 3.5 Main source of household water ....................................................................................................................... 10 Table 3.6 Ministry of Health (2014) county sanitation benchmarking ................................................................. 11 Table 3.7 Main mode of human waste disposal .............................................................................................................. 11 Table 3.8 Share of status in total economic participation (age 5 and over) by county and sex .................. 12 Table 3.9 Status of disability ................................................................................................................................................... 12 Table 3.10 HIV and related indicators ................................................................................................................................ 13 Table 3.11 Population distribution by age ........................................................................................................................ 13 Table 4.1 Respondent profile by gender ............................................................................................................................ 15 Table 4.2 Respondent profile by age ................................................................................................................................... 15 Table 4.3 Respondent profile by marital status .............................................................................................................. 15 Table 4.4 Main source of drinking water ........................................................................................................................... 16 Table 4.5 Alternate option for drinking water ................................................................................................................ 17 Table 4.6 Main source of water for non-drinking uses ................................................................................................ 17 Table 4.7 Proportions providing negative ratings of cost, adequacy and access of water ........................... 17 Table 4.8 Challenges faced by vulnerable groups in relation to water access ................................................... 18 Table 4.9 Methods and reasons for treating water ....................................................................................................... 20 Table 4.10 Type of toilet facility ............................................................................................................................................ 21 Table 4.11 Location of toilet facility .................................................................................................................................... 21 Table 4.12 Proportions providing negative ratings of cost, adequacy and access of toilet facilities ........ 21 Table 4.13 Challenges faced by vulnerable groups in relation to toilet access .................................................. 23 Table 4.14 Reasons for actions in disposing child stool .............................................................................................. 24 Table 4.15 Methods used for waste disposal ................................................................................................................... 25 Table 4.16 Motivations for using given methods to dispose waste products .................................................... 25 Table 4.17 Proportions providing positive ratings of cost, adequacy and access of garbage disposal ... 26 Table 4.18 Challenges faced by vulnerable groups in relation to access to garbage disposal facilities .. 27 Table 4.19 Method of garbage storage ............................................................................................................................... 27 Table 4.20 Disease incident by number of episodes and type of infection.......................................................... 29 Table 4.21 Source of information on sanitation and hygiene ................................................................................... 30 Table 4.22 Main source of income ........................................................................................................................................ 30 Table 4.23 Size of land for farming ...................................................................................................................................... 31 Table 4.24 Source of water for farming when it has not rained .............................................................................. 31 Table 4.25 Livestock ownership............................................................................................................................................ 32 Table 4.26 Size of herd owned by household .................................................................................................................. 32 Table 4.27 Source of water for livestock (primary & alternate) .............................................................................. 33 Table 4.28 Frequency distribution of human-wildlife conflicts and problems occuring .............................. 33 Table 4.29 Frequency distribution and causes of inter-communal conflicts ..................................................... 34 Table 4.30 Level of community participation and nature of activities .................................................................. 34 Table 4.31 Participants’ understanding of devolution ................................................................................................. 35 Table 4.32 Proportion aware of right to participate in governance processes ................................................. 35 Table 4.33 Factors impeding participation by citizens ................................................................................................ 36 Table 4.34 Strategies for addressing vulnerable contexts ......................................................................................... 49

vi
Table 4.35: Issues that hamper the ability of public to effectively participate ........................................................................................................................................................................................ 55 .......................................................................................................................................................................
List of Figures and Photos
Figure 3.1 Taita Taveta County budget allocations in the financial year 2013/2014..................................... 14 Figure 4.1 Perceptions of water access and vulnerability .......................................................................................... 18 Figure 4.2Proportion of households that treat drinking water- by source ......................................................... 19 Figure 4.3 Perceptions of toilet access and vulnerability ........................................................................................... 22 Figure 4.4 Action taken in disposing child stool ............................................................................................................. 23 Figure 4.5 Perceptions of access to garbage disposal facilities and vulnerability ............................................ 26 Figure 4.6 Disease incident by type of infection ............................................................................................................. 28 Figure 4.7 Access to health messaging and nature of message ................................................................................ 29
ж ж ж ж ж ж ж ж ж ж ж ж ж ж ж ж ж ж ж ж ж ж ж ж ж
Photo 5.1 Josa spring, a community based water supply scheme, Josa (Wundanyi) ...................................... 38 Photo 5.2 Maungu-Buguta water in-take and pump station with elephant waterhole, Maungu (Voi) .... 40 Photo 5.3 Ngangu community water project, Sechu (Mwatate) .............................................................................. 41 Photo 5.4 One of the storage tanks for Mwakitawa Secondary School Water project , Tausa (Voi) ......... 42 Photo 5.5 Derelict water kiosk and pipe (inset), Gimba - Lower Sagalla (Voi) .................................................. 43 Photo 5.6 A water pan in Buguta, one of those in dange of runoff contamination, Buguta (Voi) ............... 43 Photo 5.7 The County’s only exhauster drawing sludge, (Voi town) ..................................................................... 44 Photo 5.8 Private refuse storage chamber, Maungu (Voi) .......................................................................................... 45 Photo 5.9 Emerging problem of inappropriate dumping in a gully, Maungu (Voi) ......................................... 46 Photo 5.10 Voi Youth Forum shredding yard and plastic stockpile, Sofia (Voi) .................................... 47 Photo 5.11 Private stock pile of plastic collected for recycling, Maungu (Voi) ................................................. 48 Photo 5.12 Equipment and office (inset) used by Bona Youth Group for garbage collection, Sofia (Voi)
................................................................................................................................................................................... 51 Photo 5.13 Water kiosk for a stalled CBO water supply project, Maungu (Voi) ................................................ 52 Photo 5.14 Rainwater harvesting and hand washing (inset) facilities, Gimba Primary School, Lower
Sagalla (Voi) ......................................................................................................................................................... 53 Photo 5.15 Derelict girls’ bathroom at Mwatate primary School, Mwatate ........................................................ 54

1
xecutive Summary
This study was undertaken by Africa Data and Information Network on behalf of Maji na Ufanisi during the month of April 2015. The main aim of the research was to assess the water, sanitation and hygiene (WASH) situation in Mombasa and Taita Taveta counties respectively. However, taking cognizance that the impacts of the practices and interventions relating to water, sanitation and hygiene cannot be considered in isolation, this study also sought to go beyond the more general outlook to also consider a range of other key issues around water, sanitation and hygiene in order to provide a comprehensive picture of the situation. In view of this, the study was designed around seven main themes, namely domestic water, sanitation, solid waste, health, livelihoods, conflict and insecurity and community participation and governance. The main highlights of the survey were as follows:
❖ Domestic water
Taita Taveta County has not been able to adequately its water demand. The challenges of meeting the County’s water demands, are in part, linked to unproportional low share from the main pipeline from Mzima Springs. The other key reasons for not achieving water supply distribution equally in the County is linked to distribution issues, relating to both piping and storage aspects. In the Taita part of the County, the biggest problem is found in areas in the lower region areas, such as Buguta, where as noted, people have to move up to distances of 10 km to find water. Alternately, in the Taveta part of the County, the piping and storage challenges are linked to combined factors of increasing population and aging distribution systems. As noted, the initial planning failed to consider potential population growth. The demographic shift has as a result outstretched the ability of the current aging infrastructure. The study also identified the protection and conservation of the water catchment areas and the natural resources as the critical aspect that demands immediate action by the county government, water management issues attributed to lack of coordination between the National and County Governments, and land ownership issues in relation to community water projects.
Result from the household survey show that majority of the households (81%) of the households rely on improved sources for drinking water. Across the sub-counties, the proportions with access to improved water range from 59% (Mwatate) to 94% (Taveta). Slightly below half of households experience difficulties, noted by the following proportions that provide a negative rating: cost (43%), adequacy (44%) and ease of access (41%). Across the Counties, the results are more negatively skewed in Mwatate, where the results indicating that all the three aspects of the service delivery are salient for more than half of the households. Notable concerns also emerge in Taveta concerning adequacy. ❖ Sanitation
Although officially, the sanitation situation in Taita Taveta tells of a major progress in the use of improved sanitation facilities over the past years, all the key informant interviews tell of a worrisome situation, which is largely attributed to the increasing issue of open defecation, which is mostly associated with recent movements and settlement in Taita Taveta of populations largely coming from parts of the country. In relation to waste water management, it is noted that all the three major towns in Taita Taveta still lack a conventional sewerage system. As a result, the County remains with relatively high unmet sanitation needs. At the moment, the County relies on one exhauster truck to empty septage, which other than Voi town, sometime goes to Mwatate, sometime to Taveta, and even up to MacKinnon Road.
E

2
Result from the household survey similarly show that substantially high proportion of households relies on unimproved sanitation facilities, with overall access to improved sanitation for the surveyed areas standing at 17%. Across the sub-counties, the proportions that use improved sanitation range from 20% (Mwatate) to 5% (Wundanyi).
❖ Solid waste management
The approach used for waste collection is through provision of designated refuse storage chambers where residents can take their garbage. An immediate positive outcome is that the process has resulted in a fairly efficient disposal system. Even so, challenges prevail in relation to facilities, notably in terms of number and type of collection vehicles, the efficiency of the waste collection, in this case, is restricted due to the design of the garbage trucks. The design of the existing garbage trucks places huge requirements for manual lifting of the refuse, which in turn increases the time required to collect and dispose the waste materials from different collection points across the County. An important solid waste and sanitation issue is that of disposable sanitary towels and baby diapers. Sanitary towels are being dumped everywhere and they get drained by rain into the rivers. Regarding diapers, although the impact of improper disposal has not been investigated, this is emerging as a public health concern, primarily because there is no significant difference between open defecation and improper disposing of diapers. Result from the household survey show that 85% of the households practice safe waste disposal, comprising: burning (37%), garbage truck (10%), and rubbish pit (20%). The unsafe waste disposal methods used include: throwing in the yard/compound (12%), on the road (3%) and river/gully (0.2%).
❖ Vulnerability reduction
Current priorities on vulnerability focus on gender, disability and populations that live in remote, rural areas with significantly reduced access to services. Programmes aimed at reducing vulnerability have been directed towards gender and disability. These are currently addressed through strengthening the capacity of groups of women and PWD, as well as context-specific actions that involve bringing water to the nearest point of collection. There is however no specific programmes designed at the moment to address the needs of elderly people, while for HIV/AIDS; support is directed to specific contexts, mainly through existing support groups.
❖ Water and sanitation situation in schools The schools mostly depend on piped water supplied by Tavevo. Alternative sources for the schools include RWH and water vendors. The findings also suggest that schools tend to share water with local communities from community boreholes. The school officials interviewed acknowledged a number of constraints in relation to water supply. The main problem cited in relation to the water supplied by Tavevo was inadequacy due to too much rationing. Observations on the ground established that nearly all the primary schools have RWH and hand washing facilities. RWH is however not in such areas as Mwatate because of unevenly distributed and unreliable rainfall. For sanitation, most schools have either or both pour flash and pit latrines. The findings suggest an existing problem of high ratios of toilet use, which are above the Ministry of Education standard. The research findings also highlighted complications and challenges related to related problem of bath and disposal of used sanitary. Schools generally lack bathrooms for the girls to take a bath. ❖ Health

3
The total number of disease episodes was 38 and 26 for Mombasa and Taita Taveta respectively. Overall, diarrhea [cause unspecified] (27%), malaria (22%), typhoid (20%) and cholera (16%) stand out as the most occurring diseases. The other diseases cited were stomach infection, amoeba, bilharzia, cough and bronchitis. Notable contrasts emerged at the county and setting levels, in this case Mombasa and urban areas leading in number of disease episodes. During the specified time-period (past six months), most of the households experienced single episodes of the diseases, and The highest proportion among the households that experienced more than one episode were found in Mombasa, with typhoid, malaria and diarrhea being the diseases to which households were more prone to repeat episodes.
❖ Livelihoods
Majority of the households surveyed rely on salary/wage income (48%) and business/trading (35%). One-tenth depends on remittance, while another 7% rely on either or both farming and livestock activities. Both farming and livestock related activities, although emerging with modest scores, are almost a predominant feature of Taita Taveta, and unsurprisingly, in this the rural areas. Of note here is the figure of 2% emerging in respect to ‘selling farm products’ in Taita Taveta, which can be interpreted to mean limited activities in urban farming. Overall, just below one-third (27%) own a parcel of land for farming. The disparity across the counties and settings is apparent, with Taita Taveta and the rural areas being the geographical locations own a parcel for farming. More specifically, most households own 1 to 2 acres, reflected by proportions of 36% and 39% respectively. On aggregate, about one-quarter own 3 acres or more. In terms of access to water for farming when it has not rained,
❖ Human-wildlife
Human-wildlife is a problem, and occurs in particularly in the areas near that are in close proximity to Tsavo East and Tsavo West National Parks. Elephants were identified as persistently causing damage to water infrastructure and crops, and are a problem for the community water projects, particularly during the dry seasons. Human-wildlife conflicts were largely restricted to Taita Taveta County, most were in the rural areas. Overall, of the 39 households that reported wildlife invasion, the most commonly offered descriptions of the problems were destruction of crops (N=22), destruction of water infrastructure (12), human death (8) and exhaustion of water reservoir (7). Watering troughs or waterholes are used to ensure the animals are able to get the water they need while keeping them away from the water infrastructure, particularly and utility pipes and storage tanks.
❖ Governance
Participants’ responses regarding their understanding of the term ‘devolution’ reflect different views, with a preponderance of opinion emerging in favor of issues relating ‘decentralized development’ (26%). Other opinions emerging related to ‘citizen right to participate,’ either in governance or by right of access to information depict a total of 9%, while those relating to identify politics (majimbo and people to stay in or return to their counties) depicting a total of 4%. A tinge reflecting lethargy in politics was evident in the response “I don’t care about politics,” albeit with minimal mention. Across gender, the results reveals that women lag behind in terms of level of awareness of devolution, notably in matters pertaining to decentralized development, right to participate and right to be heard/information, and on the flipside, a higher proportion of female than males providing a “don’t know/not sure” response. On awareness of the right to participate in governance processes, the results show that, almost without exception, ‘identifying and deciding about development projects’ is the predominant process that residents of both males and females are aware of. This is depicted by an aggregate awareness figure of 91%. The results show that public participation is impeded by an interplay various factors, key among these being lack of information (44%), with a relatively narrow contrast seen in terms of county and setting. The other factors cited related to perceptions of

4
corruption, Low education/illiteracy, discrimination/ tribalism, and lack of involvement, all emerging a distance in an overall range of between 5% and 15%.

5
Introduction
1.1 Background The water and sanitation sector in Kenya continue to face numerous challenges today. Whereas the country has made some progress in recent years, challenges persist. Many households still do not have access to clean, safe drinking water. Similarly, access to suitable sanitation facilities is also limited. The Millennium Development Goal (MDG) no. 7C targets to halve the number of people without sustainable access to water and basic sanitation by 2015. The MDG target for Kenya can be calculated at 74% with access to improved drinking water and 63% access to improved sanitation. The county governments, working in conjunction with the line ministries and relevant parastatals are spearheading the drive towards attaining these targets through the devolved system. In 2011, water coverage in Kenya stood at 61% of the population with access to an improved water source, while sanitation coverage stood at 21% of the population with access to an improved sanitation facility.1 In Taita Taveta County, approximately 64% have access to improved water, while 67% have access to improved sanitation.2 Disparities however prevail, with lower than the county estimates evident in the relatively arid and semi-arid areas in Taita Taveta. More generally, although urban areas have a higher coverage than rural, the situation in urban areas. Unimproved sanitation has been linked to negative implications on the household economy. For example, estimates place at Ksh. 283 million the that Taita Taveta County experience each year due to poor sanitation.3 This includes losses due to access time, premature death, health care costs and productivity. In parallel to improving health situation, improving water and sanitation is central to improving economic wellbeing, in terms of the time savings, which is made available for economic activities on the one hand, and on the other hand, in relation to prevention of water related diseases, which have a negative bearing on the household economy. By doing so, the time, energy and resources saved by improved access to water and sanitation can very often be used on productive economic activities.
ж ж ж ж ж ж ж ж ж ж ж ж ж ж ж ж ж ж ж ж ж ж ж ж ж 1.2 Purpose of this Study Broadly, this research aimed to assesses the water, sanitation and hygiene (WASH) situation in Taita Taveta County. The study aimed to generate data that can help inform on the status of water and sanitation, and which can also be used to guide programme priorities. The study was designed around a number of themes, including. domestic water, sanitation, solid waste, health, livelihoods, conflict and insecurity and community participation and governance.
1

6
Research Methodology
2.1 Study Approach Research design The exploratory design was adopted due to the nature of this research. The term exploratory research implies that the research in question was intended to maximize discovery of broad generalizations that underlie what is being investigated. Research procedure This study employed a mixed methods design in which different but complementary quantitative and qualitative data were collected and analyzed separately. The main objective of this approach was to triangulate results to gain a broader understanding about the themes under investigation. The following approaches were used for data collection.
i) Household survey For this line of the study, a face-to-face quantitative survey was conducted using randomly selected respondents at the household level. Inquiry centered on issues of water, sanitation, solid waste, health livelihoods, conflict and insecurity, and community participation and governance. The sample was stratified by geographical location. Sub-Counties were adopted for the first stage of sample selection, while second stage corresponded to sub-locations. For the selection, geographical diversity and contrasting water situations were considered, along with specific targeting of informal settlement enclaves. Each household had one member chosen to participate. Table 2.1 presents achieved sample. Table 2.1 Achieved sample by Sub-County
N % Total 275 48 Urban 372 65 Rural 196 35 Mwatate 66 12 Nyali 53 9 Taveta 52 9 Voi 116 20 Wundanyi 42 7
ii) Focus group discussion
One focus group discussion (FGD) was conducted with selected representatives of Communit Based Organizations (CBOs) and Water Resource User Associations (WARUA). Although not initially planned, the research team leveraged on a concurrent capacity workshop to hold a discussion with 10 members representing different groups. The discussions delved around the issues of challenges, service delivery and participation.
iii) Key informant interviews Key informants represented a diverse range of stakeholder across the duty bearers and service providers groups. These included County Government officials, representatives of NGOs, representatives of WRUAs,
2

7
school teachers and community leaders, targeting those with experiential knowledge about issues at hand. The interviews aimed to obtain different perspectives on the research areas. Additional purpose was to complement and cross-validate the information obtained from household survey.
iv) Observations Observations were made through site visits and transect walks. Site visits were more structured in that they were planned to include visits to locations where particular programmes have been undertaken. The transect walks were accomplished through walks in various locations to make unstructured evaluation of the projects and other activities. Research instruments Different sets of instruments were developed for purposes of data collection for different components of the survey. These consisted of a structured questionnaire for the quantitative component, and separate questionnaires for the key informants’ components. Data analysis method Qualitative analysis: - The chosen method for the qualitative data was ‘Thematic analysis. The principle purpose of thematic analysis is to explore the understanding of an issue, rather than to reconcile conflicting definitions of a problem. The analysis was undertaken through processes that involved identifying important features of the data that might be relevant to answering the research question, examining the codes and collated data to identify significant broader patterns of meaning, and developing a detailed analysis of each theme, and working out the scope and focus of each theme to determine the main ‘point’. Quantitative analysis: - Quantitative data was analyzed using the Statistical Product and Service Solutions (SPSS). Analyses were performed primarily using descriptive statistics, with key issues identified through a frequency analysis of how many participants referenced a particular response. In order to determine whether the responses varied for locations, comparisons have been made across the counties, as well as across the urban and rural settings. Limitations As with any research, in designing analyzing the data for this survey, three factors represented a limitation of one sort or another. Readers therefore need to consider the presented results within the context of these limitations.
i. One main challenge faced was scheduling meetings with key informants from the executive level of the county governments. It is considerable that the key informants or their appointed alternatives agreed to allocate time for personal interviews, even against their tight schedules. On this basis, the fairly limited time for interview made it a challenge to sufficiently collect the required information.
ii. The key informant interviews, despite their strengths, and approval of the survey by concerned officials also had some limitations. A major limitation of this approach was the concern of anonymity and having standpoints attributed to them may have conditioned respondents’ views. For this purpose, names and identifying information have been removed from the quotes.
iii. Sample size: In this connection, It should be noted that, even with fairly large samples set for this survey, a random household survey was unable to obtain a sufficient number of cases for some indicators, making it is unreasonable to generalize these views. The estimates for these particular indicators are provided with a caveat.

8
Literature Review
3.1 The Biophysical Contexts 3.1.1 Demography
Taita Taveta’s land covers 17,128.3 km2 , of which Tsavo National Park constitutes of the 10,680.7 km2 of the total area4 Population density however, varies widely within county. According to the Population and Housing Census (Table 3.1), in 2009, the population for Taita Taveta was estimated at 284,657. The County has over 33% of its residents living in its urban area. These are mostly concentrated within the four main urban centres of Wundanyi, Mwatate, Taveta and Voi. 5 This settlement pattern underlines issues of inequities in access to services, opportunities and resources. With this population expected to exponentially rise due to high incidences of rural-to-urban migration as opposed to natural growth rate.6 Table 3.1 Population data for Taita Taveta County
Households Population size Population density Mwatate 16648 56021 79.9 Voi 23087 89458 12.1 Wundanyi 13663 71513 38.9 Taveta 16274 67665 9.4
3.1.2 Climate
Taita Taveta County is characterized by a number of ecological regions based mainly on relief and different climatic conditions. With a maximum elevation of 2,208 metres above sea level (Wuria peak), rainfall distribution is uneven, with the highlands receiving higher rainfall than the lowland areas. With an annual mean rainfall is 650 mm, the long rains vary from 265mm in the highlands to 157mm in the lowlands, while short rains vary from 1,200 mm to 341mm for highlands and lowlands respectively. The average temperature in the County is 230C, with temperatures getting as low as 18.20C in the hilly areas (Taita, Mwambirwa and Sagalla), while on lower zones, temperatures rise to about 250C.7 Climate change and variability is an emerging threat to sustainable development in the County. These changes present a number challenges to the socio-economic development of the County. Farmers have experienced reduced yields leading to food insecurity. Rising temperatures lead to high prevalence of pests and diseases, which affect productivity both in crops and livestock, while shifting seasons affects crop performance, while drought results in reduced pasture.8 3.1.3 Agro-ecological zones
Taita Taveta covers a wide range in terms of the agro-economic zones, from CL3 to those denoted as Lower Middle (LM) Upper Middle (UM) and Lower Highland (LH). The lower parts of Taita Taveta share the same zone (CL5) with Mombasa, and therefore also belong to this temperature belt. The higher parts belong to three cooler belts, namely Lower Midlands (LM) (21-24oC), Upper Midlands (18-21oC) and a small area of Lower Highlands (15-18oC).9 The spatial distribution of the zones and major characteristics is showed in Table 3.2.
3

9
Table 3.2 Spatial distribution and major characteristics of the agro-economic zones
ж ж ж ж ж ж ж ж ж ж ж ж ж ж ж ж ж ж ж ж ж ж ж ж ж 3.2 Socio-economic Context 3.2.1 Production of agriculture crops
The CDIP focuses on improved access to subsidized fertilizer as one of the strategies to increase farm yields and by extension increase farmers’ income at the house hold level.. Fertilizer Cost Reduction Project is an ongoing project, which is being undertaken as Kenya Vision 2030 Flagship Projects, and targets to provide 15,200 metric tonnes of ferlilzer to farmers. Overall County estimates for 2005-6 for fertilizer use (Table 3.9) was approximately 31.2%, which is 38.2% lower relative to the national average. Table 3.3 Proportions of parcels using fertilizer (2005-6)
Kenya average Taita Taveta Total Count 6559597 75998 % Any Fertiliser 69.4 31.2 % Organic 31.2 24.8 % Inorganic 58.7 15.7
3.2.2 Production of livestock
The CIDP for Taita Taveta underlines the County’s livestock production potential. The County’s rangeland forms one of the disease free zones under Vision 2030, aimed at supporting production of livestock products for export. Livestock production is undertaken both at household level and through large scale ranching activities. The County has a total of 28 ranches, with 10 of these owned by the government under the Directed Agricultural Company (DAC) arrangement. The other major categories comprise private and group ranches. Table 3.4 shows the County livestock population by type (2009). Table 3.4 Livestock population
Agro-economic zones Approx.
altitude (m) Annual mean
temp. (oC) Annual
rainfall (mm)
Area % CL5 Lowland Livestock-Millet Zone 1-800 24-33 600-900 1029 17.6 CL6 Lowland Ranching Zone 50-700 21-24 <700 1934 33.3 LM6 Lower Midland Ranching Zone 600-900 21-25 <500 1405 24.0
LM5 Lowland Midland Livestock-Millet Zone 800-1000 21-26 500-700 762 13.0
LM4 Marginal Cotton Zone 900-1200 21-27 600-800 442 7.6 UM4 Sunflower-Maize Zone 1200-1500 18-21 700-900 103 1.8 UM3 Marginal Coffee Zone 1350-1700 18-22 900-1200 118 2.0 LH2 Wheat/Maize-Pyrethrum Zome >1600 15-18 >1200 40 0.7

10
N
Cattle 153768 Sheep 45327 Goats 166660 Donkeys 3568 Pigs 1054 Indigenous (Chicken) 212129 Chicken (Commercial) 38235
ж ж ж ж ж ж ж ж ж ж ж ж ж ж ж ж ж ж ж ж ж ж ж ж ж 3.3 Water and Sanitation: Situation Analysis 3.3.1 Water Resources
Taita Taveta County is home to large reserves of both surface and underground water sources. The surface water sources include Mzima springs, Lakes Challa and Jipe, and some rivers like Mwatate, Kishenyi, Ziwani, Lumi, Sanga, Wanganga and Voi, Challa, Kigombo and Kishushe. Underground water resources include two springs, Homer‘s and Lemonya, and a number of streams including Njukini, Sanite Njoro Kubwa, Kitobo, and Maji ya Waleni.10
3.3.2 Situation of drinking water
Approximately 64% of the County’s households have access to improved water.11 The households’ main main source of water is showed in Table 3.5. The County is served by a number of water supply schemes: Mzima Water Project, which supplies water to Voi town and its environs through a number of projects including Voi water supply, Mbololo water supply, Irima, Kimwa and Kaloleni water projects, Miasenyi water project, Manyani water supply, and Maungu-Buguta water project.12 Other major water schemes are found in Taveta and Wundanyi. In Taveta, there are four schemes, namely: Taveta Lumi water supply, Challa water project, Chumvuni water project, and Kitobo water project.13 Table 3.5 Main source of household water
% Surface Ground Piped
system Rain Water vendor Other
Mwatate 28 9 56 0 7 0 Taveta 19 14 63 0 4 0 Voi 10 7 74 0 9 0 Wundanyi 51 15 33 0 1 0
3.3.3 Situation of domestic human waste disposal
As showed in Table 3.6, Taita Taveta County is ranked number 27 respectively out of 47 in the county sanitation benchmarking by the Ministry of Health (MOH) according to according to the following key

11
indicators.14 Inadequate sanitation causes considerable economic losses, due to access time, premature death, health care costs and productivity, amounting Ksh. 283. Table 3.6 Ministry of Health (2014) county sanitation benchmarking
Taita Taveta Rank out of 47 27 Budget for sanitation/ 5 0 No. of ODF claim/ 10 5 Cost per ODF claim /10 0 Economic costs of poor sanitation / 10 8 Pupil: Latrine coverage (Girls)/ 10 0 Pupil: Latrine coverage (Boys)/ 10 0 Household latrine coverage rate/ 15 0 No. of handwashing facilities per school/ 10 0 Rate of open defaction/ 10 0 No. of ODF villages (DPHO certified)/ 10 5 Percent of ODF targets achieved/ 10 10 Percent of ODF villages/ 10 5
The proportion of households with access to improved water is estimated at 67%.15 The distribution of the households’ main mode of human waste disposal, by type of disposal method is showed in Table 3.7. In all localities, the main method used by the households is pit latrine (covered/ uncovered), depicting a coverage ranging from 51% to 86%. Table 3.7 Main mode of human waste disposal
% Main
Sewer Septic Tank
Cess Pool
VIP Pit Latrine
Pit Latrine (Covered/
Uncovered) Bucket Bush Other
Mwatate 0.2 2 0.1 21 71 0.0 5 0.2 Taveta 1 2 0.2 3 86 0.0 7 0.0 Voi 3 9 1 7 74 0.1 7 0.1 Wundanyi 1 2 0.1 17 77 0.0 2 0.0
ж ж ж ж ж ж ж ж ж ж ж ж ж ж ж ж ж ж ж ж ж ж ж ж ж 3.4 Cross-Cutting Issues 3.4.1 Gender
The Gender Inequality Index reflects gender-based disadvantage in three dimensions, namely reproductive health, empowerment and the labour market. The CIDP identifies key fundamental challenges facing gender issues to include gender inequality on economic growth and productivity in the County. For example, while 75% agricultural labour consists of women, they only control and have access

12
to 40% of the accruing benefits. Table 3.8 provides indicators for gender, in relation to economic participation. Key message take-out is that, whereas both male and female are likely to seek work in almost equal measure, males are more likely to get employed as compared with females, with females more likely to be economically inactive. Table 3.8 Share of status in total economic participation (age 5 and over) by county and sex
% Urban Rural
Male Female Male Female Employed 57 42 56 44 Seeking Work / No Work Available 6 5 6 4 Economically Inactive 35 49 35 49 Employment status unclassified 3 3 4 3
3.4.2 Disability
The WHO’s International Classification of Functioning, Disability and Health (IFC) clarifies disability in relation to the physical, personal, social and environmental consequences of impairment. 16 In mainstreaming disability, the environment may be changed to improve health conditions, prevent impairments, and improve outcomes for persons with disabilities. The CIDP recognizes disability as a key cross-cutting issue that has to be addressed with strategic interventions. On-going projects and programmes cover three areas, namely education, community based rehabilitation and cash transfer. Overall disability figure (Table 3.9) is approximately 5%, which is 2% higher relative to the national average. Table 3.9 Status of disability
% Kenya Average Taita Taveta N % N %
Total 1 588 949 3 17436 5 People with a Visual disability 366 811 1 4940 2 People with Hearing disability 236 491 1 2078 1 People with a Speech disability 204 438 1 1358 0 People with Physical / Self Care disability 505 028 1 5154 2 People with Mental disability 155 874 0 2086 1 People with Other disability 120 307 0 1820 1
3.4.3 HIV/AIDS
The CIDP identifes HIV & AIDS as a major social and economic challenge because of the threat it poses to the County‘s development initiatives. The key negative consequences identified include increase of children headed households and loss of the skilled labour force. Table 3.10 provides a broader perspective of selected HIV indicators for Taita Taveta County.

13
Table 3.10 HIV and related indicators
3.4.4 The elderly
To mainstream elderly issues, the CIDP the need to put into place necessary infrastructure to support their needs, including, healthcare. The aged segment (65 years+) is expected to register a odest increase, rising from 14,733 in 2012 to 15,096 and 15,851 in 2015 and 2017 respectively. Table 3.11 provides population distribution by age cohort. Estimates indicate that the elderly population is approximately 8% of the County’s total. Table 3.11 Population distribution by age
Urban Rural
N % N % 1 to 59 yrs 61 640 96 202 214 92 60 to 70 yrs 1 469 2 10 623 5
71 to 79 yrs 656 1 4271 2 80+ yrs 497 1 3146 1 Not mentioned 27 0.0 114 0.1
ж ж ж ж ж ж ж ж ж ж ж ж ж ж ж ж ж ж ж ж ж ж ж ж ж 3.5 Budget Allocation and Funding Figure 3.1 shows the County budget allocation for Taita Taveta in the financial year 2013/2014. Out of the total budget of Ksh 2.9 billion, the health sector had the highest allocation with Ksh 605 million, second had the County Executive with Ksh 542 million, while the County Assembly has the third highest allocation Ksh 377 million. The three units took up Ksh 1.6 billion or 53 percent of the total county budget for the
% Adult (15+) HIV prevalence 6.1 New HIV Infections (Adults 15+) 330 New HIV Infections (Children 0-14) 35 % ART Coverage 52 HIV+ Adults 9781 Total Population 323867 % HIV Prevalence (men) 7.3 % HIV Prevalenc e (women) 10.6 Adults in need of ART 5570 Adults receiving ART 2903 Children in need of ART 988 Children receiving ART 194 No. of households with an orphan 8645 Poor households with an orphan 4236 (KES) cash transfer beneficiary poor households with an orphan 2205 Aids related Deaths (15+) 410

14
year. Approximately Ksh. 260 million, representing about 9% of the total budget was earmarked for the County Ministry of Water, Environment and Natural Resources.17 Figure 3.1 Taita Taveta County budget allocations in the financial year 2013/2014
Source: Internation Budget Partnership, u.d

15
Findings from Household Survey
4.1 Demographic Profile Table 4.1 shows the distribution of the participants by gender. The highest proportion of participants were female (53%), which is largely attributed to the fact that the issues of water is seen as female domain, and male household members tended to want females members to respond to the interview. Table 4.1 Respondent profile by gender
Table 4.2 shows the distribution of the sample by age. Young adults (18-24) comprised 9% of the sample. Age 25 to 34 comprised arounf half of the saple (49%), while the middle age (35-50) and senior (50+) categories comprised 33% and 9% respectively. Table 4.2 Respondent profile by age
In respect to marital status, the results in Table 4.3 show that, overall, just below one-third (30%) were single; while just below two-thirds (62%) were married. Table 4.3 Respondent profile by marital status
ж ж ж ж ж ж ж ж ж ж ж ж ж ж ж ж ж ж ж ж ж ж ж ж ж
4
N % Male 129 47 Female 146 53 Total 275
N % 18 to 24 24 9 25 - 34 133 49 35 - 50 89 33 50-60 17 6 Over 60 7 3
N % Single 72 26 Married 161 59 Widowed 25 9 Divorced/Separated 16 6

16
4.2 Domestic Water 4.2.1 Water access and use
In exploring water use and access, it is first necessary to establish the distribution of the modes by which the sampled households receive or obtain water, for both drinking and general use. The results in Table 4.4 show the following:
• Overall, majority of the households (81%) in the surveyed areas rely on improved sources for drinking1
• Across the Sub-Counties, however, the proportions with access to improved water range from 59% (Mwatate) to 94% (Taveta)
• Piped system is the main source of water, with a reasonable portion also relying on kiosk On account of these figures, it can be seen that, relative to National MGD target of 74%, there are notable gains made towards the MDG target, with exceptions of Likoni, Mvita and Mwatate where gaps remain evident. Table 4.4 Main source of drinking water
% Total
Improved Piped into
house/cpd Kiosk Bore hole
Rain water Vendor Surface
Shallow well Bottled
Total 81 51 24 5 1 9 9 1 - Urban 81 71 8 4 3 8 8 - - Rural 74 43 30 5 1 9 10 1 1 Mwatate 59 27 23 9 3 14 23 2 - Taveta 94 83 - 12 - - 4 - 2 Voi 85 56 28 1 2 11 2 - - Wundanyi 76 33 43 - - 5 17 2 -
Table 4.5 depicts the alternate sources for drinking water, when the primary sources are inadequate. The results establish the following:
• Overall, it is seen that around two-thirds (65%) of the households that currently use water from improved sources, would still use water from another improved source if the primary source is inadequate. Across setting, the rates are higher in urban than in rural areas
• Across sub-counties, the rates of those relying on improved sources as alternate option range from 60% to 68%
• Among those who turn to safe options, the main alternate is piped into house/compound (94%), followed at a distance by kiosk (48%)
1 In this respect, the water coming from piped system, kiosk, borehole and rain water is considered improved. Note here, however, that these figures may not necessarily compare with the population and housing census figures given that the survey targeted specific informal settlement enclaves

17
Table 4.5 Alternate option for drinking water
% Total
Improved Piped into
house/cpd Kiosk Bore hole
Rain water Vendor Surface
Shallow well
Total 65 94 48 20 4 18 25 11 Urban 76 100 12 18 6 8 22 - Rural 59 94 61 22 - 19 26 20 Mwatate 60 100 44 36 - 19 33 33 Taveta 63 80 - 22 - - - - Voi 68 100 39 8 11 19 - - Wundanyi 61 100 91 - - 22 50 -
The source of water for non-drinking purposes is next examined. The results in Table 4.6 indicate the following:
• Overall, most of the households receive non-drinking water from public kiosks (24%) and piped system (29%)
• Further analysis of how water sources are used to meet variety of needs, the results show that, overall, 67% of the households tend to use the same source for drinking and non-drinking purposes
Table 4.6 Main source of water for non-drinking uses
% Use source
for drinking Piped into
house/cpd Kiosk Bore hole
Rain water Vendor Surface
Shallow well
Total 67 29 24 9 4 12 19 2 Urban 69 50 5 5 6 5 24 4 Rural 67 21 32 11 3 15 17 1 Mwatate 63 11 20 16 3 17 30 3 Taveta 52 42 4 20 6 4 24 - Voi 77 41 29 4 3 13 6 3 Wundanyi 68 10 39 - 5 12 34 -
4.2.2 Ratings of the cost, adequacy and access problems of water
As a measure of equity and effectiveness with the water delivery, respondents were asked to rate the challenges of water in terms of cost, adequacy and ease of access on a five-point scale, ranging from very big problem to not a problem. Table 4.7 shows the percentage for ‘Top box’ scores among those who either said it was a ‘very big’ or ‘fairly big’ problem. The following observations can be made across the counties:
• Moderately low scores are seen regarding problems of cost, adequacy and ease of access, observed by overall negative ratings from 41% to 44%
• Across the sub-counties, the results are more negatively skewed in Mwatate, showed by above 50% of negative ratings concerning all the three aspects, and in Taveta concerning adequacy.
Table 4.7 Proportions providing negative ratings of cost, adequacy and access of water
% Cost Adequacy Ease of access

18
Taita Taveta 43 44 41 Mwatate 65 60 54 Taveta 38 56 29 Voi 33 29 49 Wundanyi 41 46 48
4.2.3 Water access and vulnerability
Perceptions of water access and vulnerability were determined on the basis of participants’ responses to the question, “Which groups of people are constrained in terms of access to water in this community?” From Figure 4.1, the following observations can be made:
• Total responses show that PWD (84%) and the elderly (81%) are the groups seen to be most vulnerable in terms of access to water
• The other notable groups seen to be vulnerable, in ranking order are children (48%), women (44%), PLHIV (39%), and expectant women (36%). Note however that PLHIV receive minimal or no mention spontaneous response
Figure 4.1 Perceptions of water access and vulnerability
Table 4.8 shows the challenges associated with the selected groups or contexts of vulnerability in relation to access to water. The most important challenges are observed as follows:
▪ Overall, the most important challenge relates to the physical challenge of carrying water (56%), followed at a distance by physical challenge of long distance (9%),
▪ The above problem shows evidence of salience across all the vulnerability contexts, with exception of women. The challenge is most salient among PWD (72%), the elderly (72%), and PLHIV (67%).
Table 4.8 Challenges faced by vulnerable groups in relation to water access
%
Total PWD Children Elderly Women PLHIV Expectant
women
4
4
10
3
9
20
11
17
19
22
20
16
39
38
0 20 40 60 80 100
Other
Men
Low income/ Unemployed
Expectant women
PLHIV
Women
Children
Elderly
PWD
Spontaneous
Prompted
Base: All Respondents (N=276)%

19
Physical challenge of carrying water 56 72 42 72 12 67 33 Physical challenge of long distance 9 8 6 12 17 2 10 Disproportionate share of burden 9 - 9 - 43 4 18 High cost of water/Lack of income 8 9 3 11 14 4 3 Risk of using contaminated water 5 0 6 0 0 4 28 Risk of insecurity 4 4 18 1 5 4 Physical challenge of long queues 3 1 - 1 5 2 8 Face social stigma 3 4 - - - 11 - Problem of personal hygiene 2 1 9 1 5 0 0 Not given consideration in queues 1 1 3 - - - - Danger of falling into well 0.3 - 3 - - - -
4.2.4 Safe water practices
Perceptions of safe water practices were determined on the basis of participants’ responses to the question, “Do you treat your water in any way to make it safer to drink?” Figure 4.2 shows the results, establishing the following:
▪ Overall, halfof the households (48%, N=131) of the households treat their water regardless of the source
▪ Piped sources stand out as the water in which majority of households (59%) show safety concerns, and shallow well and rainwater, the categories in which they show show least safety concerns (each 2%)
Figure 4.2 Proportion of households that treat drinking water- by source
Table 4.9 presents the results by type of method used to treat water. The results reveal the following:
• Chemical disinfection using chlorine (52%) and boiling (46%) are the most widely-practiced means of treating water at the household level
• Overall, the main reasons for treating are to kill germs (43%) and make it safe from cholera (25%). Boling is correlated the most with killing germs, while chemical disinfection is correlated the most with safety from cholera
Piped, 59%
Borehole,8%
Vendor, 5%
Rainwater, 2%
Surface, 7%
Shallow well, 2%
Base: Households that treat water (N=131, 48%)

20
Table 4.9 Methods and reasons for treating water
%
Total Chemical
disinfection Boiling Solar
disinfection
Method used 52 46 2 Reasons Kill germs 43 36 48 100 Be safe from cholera 25 29 22 - Make it safe for drinking 14 20 9 - Make it clean 10 8 12 - Make it soft 3 3 3 - Advice fro health worker 3 5 2 - Don't trust source 2 - 3 -
ж ж ж ж ж ж ж ж ж ж ж ж ж ж ж ж ж ж ж ж ж ж ж ж ж 4.3 Sanitation 4.3.1 Toilet use and access
In looking at sanitation, we first explore the level of access to toilet facilities. Form the findings presented in Tables 4.10, the following observations can be made:
▪ Overall, substantially high proportion of households in the surveyed areas rely on unimproved sanitation facilities,2 with just above one-quarter (22%) having access to improved sanitation
▪ Across the sub-counties, the proportions that use improved sanitation range from 20% (Mwatate) to 5% (Wundanyi)
▪ Ore specifically, the types of facilities most used in both counties are shared ordinary latrine (63%)
In view of the National MDG target of 63% for improved sanitation, it is clear that gaps remain wide across all the sub-counties in term of progress towards achieving MDG.
2 In this survey, flush/pour flush and VIP are considered improved sanitation. Again, note that these figures may not necessarily compare with the population and housing census figures given that the survey targeted specific informal settlement enclaves

21
Table 4.10 Type of toilet facility
% Total
Improved Flush/ Pour
flush VIP Private pit
latrine Shared pit
latrine Bush/
Field
Taita Taveta 22 18 4 14 63 18 Urban 27 24 3 18 56 - Rural 20 15 5 13 66 1 Mwatate 20 24 8 55 12 2 Taveta 19 15 10 52 23 - Voi 20 21 1 65 14 - Wundanyi 5 2 2 86 10 -
Table 4.11shows the location of the toilet facilities. Here, the results reveal the following:
▪ Overall, considerable majority (72%) have access to toilets inside the compound, while only 12% have the facilities inside the house
▪ In total, just above one-tenth (13%) of the facilities are not secure for women and girls at night, mainly those located outside the compound or neighbour’s
Table 4.11 Location of toilet facility
% Location Not secure at night
Inside house 12 6
Inside compound 72 3
Outside compound/ Neighbour's 16 10
4.3.2 Ratings of the cost, adequacy and access problems of toilet
Regarding sanitation, similarly, the measure of equity and effectiveness with the service was determined by asking respondents to rate the challenges of toilet facilities in terms of cost, adequacy and ease of access, similarly on a five-point scale, ranging from very big problem to not a problem. Table 4.12 shows the results based on ‘Top box’ (very/fairly big problem). The following can be observed:
▪ Overall, relatively low proportion of negative scores appear in respect of of cost, adequacy and ease of access (13 to 14%), indicating lower level of challenges posed by these issues
▪ Across sub-counties, Mwatate, and to a lower extent, Taveta, are the locations where more households are likely to experience more challenges across all these three aspects
Table 4.12 Proportions providing negative ratings of cost, adequacy and access of toilet facilities
% Cost Adequacy Ease of access Total 14 13 13 Mwatate 20 17 17 Taveta 38 37 37 Voi 5 5 4 Wundanyi 5 2 2

22
4.3.3 Sanitation access and vulnerability
For perceptions of access to sanitation facilities and vulnerability, the question asked was: “Which groups of people are constrained in terms of access to toilet in this community?” From Figure 4.3, the following observations can be made:
• Total responses show that PWD (60%) and children (43%) are the groups considered most vulnerable in terms of access to toilet
• The other notable groups seen to be vulnerable, in ranking order, are elderly (32%) and PLHIV (19%)
Figure 4.3 Perceptions of toilet access and vulnerability
Table 4.13 shows the challenges associated with the selected groups or contexts of vulnerability in relation to access to sanitation facilities. The most important issues emerged as follows:
▪ Overall, the most important challenge relates to dependence on others for assistance (43%), followed at a distance by unsuitable design (22%)
▪ Problems relating to ‘dependence on others for assistance’ is marked across a range of vulnerability contexts, with exception of women and expectant women. The challenges are most salient among PLHIV (62%), elderly (60%), PWD (45%), and children (29%)
▪ Problems of ‘unsuitable design’ is markedly a disability issue, largely affecting PWD (42%)
3
5
1
10
27
18
9
7
18
21
15
42
0 20 40 60 80 100
Women
Expectant women
PLHIV
Elderly
Children
PWD
Spontaneous
Prompted
Base: All Respondents (N=276)%
23
Table 4.13 Challenges faced by vulnerable groups in relation to toilet access
%
Total PWD Children Elderly Women PLHIV Expectant
women Dependence on others for assistance 43 45 29 60 5 62 13 Unsuitable design 22 42 13 16 5 3 13 Insecurity at night 9 2 23 2 42 3 13 Physical callenge of long distance 5 2 - 12 5 5 7 Poor hygiene conditions 4 - 10 - 5 40 Danger of falling inside the pit latrine 4 2 19 - - 3 - Social stigma 4 1 - - - 19 - Disposing sanitary pads 2 1 - 2 11 - 7 Lack of privacy 2 - 3 2 5 3 - Men and women sharing facility 2 - - 5 5 - 7 Post natal hygiene care 1 - - - 16 - - Facility is locked/Not readily accessible 1 2 3 - - - -
4.3.4 Safe toilet practices
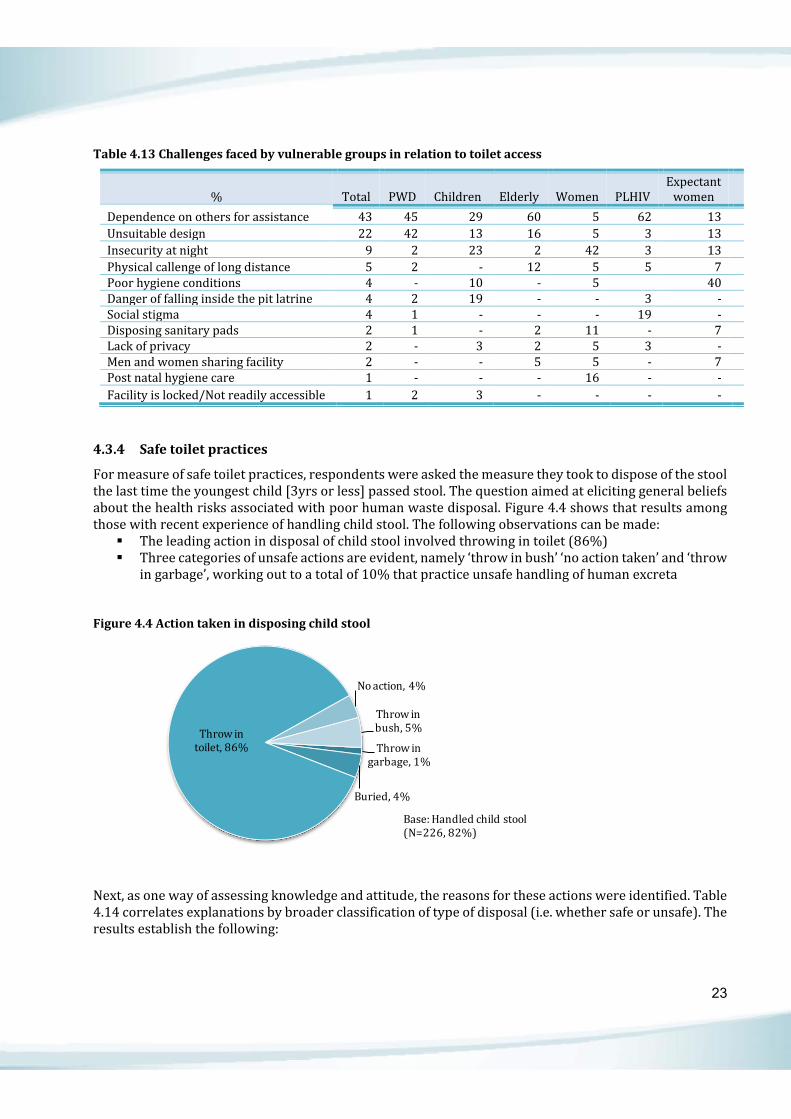
For measure of safe toilet practices, respondents were asked the measure they took to dispose of the stool the last time the youngest child [3yrs or less] passed stool. The question aimed at eliciting general beliefs about the health risks associated with poor human waste disposal. Figure 4.4 shows that results among those with recent experience of handling child stool. The following observations can be made:
▪ The leading action in disposal of child stool involved throwing in toilet (86%) ▪ Three categories of unsafe actions are evident, namely ‘throw in bush’ ‘no action taken’ and ‘throw
in garbage’, working out to a total of 10% that practice unsafe handling of human excreta Figure 4.4 Action taken in disposing child stool
Next, as one way of assessing knowledge and attitude, the reasons for these actions were identified. Table 4.14 correlates explanations by broader classification of type of disposal (i.e. whether safe or unsafe). The results establish the following:
Throw in garbage, 1%
Buried, 4%
Throw in toilet, 86%
No action, 4%
Throw in bush, 5%
Base: Handled child stool (N=226, 82%)
24
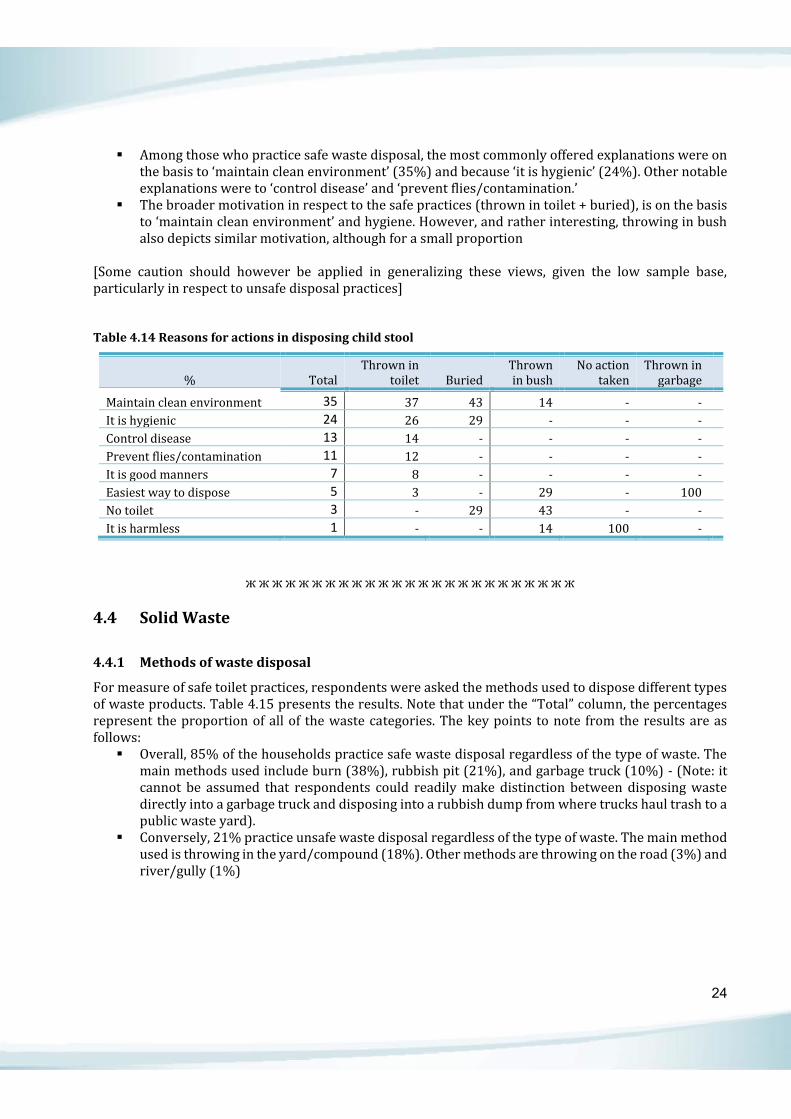
▪ Among those who practice safe waste disposal, the most commonly offered explanations were on the basis to ‘maintain clean environment’ (35%) and because ‘it is hygienic’ (24%). Other notable explanations were to ‘control disease’ and ‘prevent flies/contamination.’
▪ The broader motivation in respect to the safe practices (thrown in toilet + buried), is on the basis to ‘maintain clean environment’ and hygiene. However, and rather interesting, throwing in bush also depicts similar motivation, although for a small proportion
[Some caution should however be applied in generalizing these views, given the low sample base, particularly in respect to unsafe disposal practices] Table 4.14 Reasons for actions in disposing child stool
% Total Thrown in
toilet Buried Thrown in bush
No action taken
Thrown in garbage
Maintain clean environment 35 37 43 14 - - It is hygienic 24 26 29 - - - Control disease 13 14 - - - - Prevent flies/contamination 11 12 - - - - It is good manners 7 8 - - - - Easiest way to dispose 5 3 - 29 - 100 No toilet 3 - 29 43 - - It is harmless 1 - - 14 100 -
ж ж ж ж ж ж ж ж ж ж ж ж ж ж ж ж ж ж ж ж ж ж ж ж ж 4.4 Solid Waste 4.4.1 Methods of waste disposal
For measure of safe toilet practices, respondents were asked the methods used to dispose different types of waste products. Table 4.15 presents the results. Note that under the “Total” column, the percentages represent the proportion of all of the waste categories. The key points to note from the results are as follows:
▪ Overall, 85% of the households practice safe waste disposal regardless of the type of waste. The main methods used include burn (38%), rubbish pit (21%), and garbage truck (10%) - (Note: it cannot be assumed that respondents could readily make distinction between disposing waste directly into a garbage truck and disposing into a rubbish dump from where trucks haul trash to a public waste yard).
▪ Conversely, 21% practice unsafe waste disposal regardless of the type of waste. The main method used is throwing in the yard/compound (18%). Other methods are throwing on the road (3%) and river/gully (1%)

25
Table 4.15 Methods used for waste disposal
Total Food waste Paper Polythene Metal Total safe waste disposal 85 58 94 96 85 Burn 38 8 61 60 11 Rubbish pit 21 24 19 17 27 Garbage truck 10 13 11 10 10 Reuse 5 3 5 8 Sell 5 0 16 Recycle 4 3 10 Compost 2 11 Total unsafe waste disposal 15 42 6 4 15 In yard/compound 12 39 3 2 10 On road 3 3 3 2 4 River/Gully 0.2 0 0
In order to more precisely evaluate the motivations for using particular methods to dispose different types of waste products, the various ways used to disposal may first be condensed into four general options as follows:
a. Waste reduction: Burn, Bury, Dump site, Garbage truck, Toilet b. Waste reuse: Reuse, Compost c. Waste recycling: Recycle, Sell d. Improper disposal: Yard, Road, River/Gully
The above categories can then be used to show the motivations for using particular options are next examined. From the results in Table 4.16 the following observations can be made:
▪ Overall, the most frequently mentioned reason is on the basis of ‘maintain clean environment’ (44%). The other notable reasons are on the basis that it is ‘convenient/readily available’ (11%) and ‘only place available’ (8%)
▪ All the above three key motivations are is found to most strongly correlate to reduction and the range of unsafe disposal options
Table 4.16 Motivations for using given methods to dispose waste products
% Total Reduction Reuse Recycle Unsafe
disposal
Maintain clean environment 44 55 30 8 27 Convenient/Readily available 11 14 10 2 6 Only place available 8 7 1 2 18 Prevent injuries 6 6 3 3 10 Avoid wastage 6 2 38 18 1 Sell to make money 5 0 0 65 0 Can easily burn/Decompose 5 6 5 1 2 Use to feed animals 5 0 0 0 29 Free/Not charged 4 5 1 0 1 Other 6 5 11 1 8

26
4.4.2 Ratings of the cost, adequacy and access problems of garbage disposal
Concomitant to water and sanitation (toilet) aspects, a question was asked to measure the challenges of disposing non-degradable waste in terms of cost, adequacy and ease of access, again on a five-point scale, ranging from very big problem to not a problem. Table 4.17presents the results for the ‘Top box’ scores reflecting those who either said it was a ‘very big’ or ‘fairly big’ problem. The following can be observed from the results:
▪ On the overall, the proportion of the households that are likely to experience a problem across any of these aspects is fairly low (11 to 13%)
▪ Across the sub-counties, Taveta stand out in terms of the level all the three aspects are a problem Table 4.17 Proportions providing positive ratings of cost, adequacy and access of garbage disposal
% Cost Adequacy Ease of access Taita Taveta 11 13 12 Mwatate 5 6 3 Taveta 23 35 33 Voi 9 9 9 Wundanyi 11 8 11
4.4.3 Garbage disposal and vulnerability
For the final line of inquiry regarding vulnerability determined perceptions of the same and garbage disposal. Here, the question asked was: “Which groups of people are constrained in regard to garbage disposal in this community?” Looking at the results in Figure 4.5, the research establishes the following:
▪ Total responses show that the status of PWD (47%), children and elderly (both at 32%) is the context most underlined in terms of vulnerability access to garbage disposal facilities
▪ The notable groups are PLHIV (19%) and women (18%). [Note, however the lack of any spontaneous mention for PLHIV]
Figure 4.5 Perceptions of access to garbage disposal facilities and vulnerability
5
3
6
3
7
11
18
16
6
11
19
21
14
31
0 20 40 60 80 100
Other
Homeless
Men
Expectant women
Women
PLHIV
Elderly
Children
PWD
Spontaneous
Prompted
Base: All Respondents (N=276)%

27
Table 4.18 shows the challenges associated with the selected groups or contexts of vulnerability in relation to access to garbage disposal facilities. Here, the key points to note from the results are as follows:
▪ Overall, the two most important challenge relates to dependence on others for assistance (51%), followed at a distance by physical callenge of long distance (23%)
▪ Problems relating to ‘dependence on others for assistance’ is marked across a range of vulnerability contexts, with exception of women. The challenges are most salient among elderly (72%), PLHIV (69%), PWD (58%), and children (30%)
▪ On the other hand, in relation to distance, challenges are more marked among PWD (40%) and the elderly (24%)
Table 4.18 Challenges faced by vulnerable groups in relation to access to garbage disposal facilities
%
Total PWD Children Elderly Women PLHIV Expectant
women Dependence on others for assistance 51 58 30 72 7 69 22 Physical callenge of long distance 23 40 15 24 - 19 11 Disproportionate burden of cleaning 6 2 0 0 47 0 11 Lack of money/income 4 - - 3 33 - - Risk of getting infection 4 - - - 7 12 11 Risk of injury 4 - 15 - - - 22 Lack of skills in handling garbage 4 - 25 - - - - Insecurity 2 - 10 - 7 - - Problem reaching garbage truck 1 - 5 - - 11 Disposing sanitary pads 1 - - - - 11
4.4.4 Safe garbage practices (household level)
Further question was asked to assess the practices of garbage handling indoor. The results in Table 4.19 indicate the following:
▪ Safe garbage storage practices relating to keep garbage in plastic bags or in closed trash cans, overall comprise 24% of methods used to disposal of home trash, with use of plastic bags being a more common method of disposal in both urban and rural areas
▪ Relatively unsafe practices relating to open dumping in the yard/compound and use of open trash can account for considerable portion (76%) of methods used to disposal of home trash, with open disposal, overall being the ost common method
Table 4.19 Method of garbage storage
% Total Urban Rural
Closed container 7 9 7 Single-use plastic bags 17 16 18 Open container 17 37 9 Throw in yard/outside 59 38 67
ж ж ж ж ж ж ж ж ж ж ж ж ж ж ж ж ж ж ж ж ж ж ж ж ж

28
4.5 Health 4.5.1 Disease incidence
For this particular indicator, separate questions were asked regarding disease incidence attributed to unsafe drinking-water on the one hand, and those attributed to poor sanitation and hygiene on the other during the last six months. However, given the collective problems in water and sanitation and the fact that respondents can always easily make a distinction between the two, this analysis examines the cases of a disease from these two factors jointly. Figure 4.6 shows the results, showed as actual numbers, rather than percentages due to the thin sample bases. The following can be noted:
▪ The total number of disease episodes related to water and sanitation for the surveyed period was 26, representing 9% of the total sample
▪ The type of diseases experienced were characteristically diarrheal, fever, respiratory and water borne illnesses, the most occurring being: typhoid (31%) and diarrhea (19%). The other diseases that could be identified cited were stomach infection, amoeba, bilharzia, cough and bronchitis
Figure 4.6 Disease incident by type of infection
4.5.2 Disease frequency
Table 4.20 presents the results in terms of the number of times each household was affected by a particular disease during the specified time-period. Again, the results are presented as actual numbers, rather than percentages due to the thin sample bases. The results establish the following:
▪ It is seen that, overall, majority of the households (67%) experienced repeat episodes of the diseases within the specified period
▪ More specifically, the diseases to which households were more prone to repeat episodes were typhoid (25%) and diarrhea (18%)
31
19 19
12 12 12 12
4 4 4
0
20
40
60
Typhoid Diarrhea Unspecified Stomach infection
Cholera Bilharzia Amoebiasis Malaria Cough Bronchitis
%
Base: Households with experience of disease episode (N=26, 9%)

29
Table 4.20 Disease incident by number of episodes and type of infection
Total episodes
(N) Once (%) More than
once (%)
Total 66 33 67 Typhoid 16 23 25 Diarrhea 10 9 18 Unspecified 10 23 11 Stomach infection 6 9 9 Cholera 6 9 9 Bilharzia 6 5 11 Amoeba 6 14 7 Malaria 2 0 5 Cough 2 5 2 Bronchitis 2 5 2
4.5.3 Health messaging
In addition to the application of the specified disease indicators, the survey provided a further opportunity to investigate the views of households on access to health messages on sanitation and hygiene. Figure 4.7 provides an indication of the range of messages reported. Here, the results establish the following:
▪ Overall, around one-third of the respondents (34%) reported that they had seen or heard a message
▪ On the whole, the frequently recalled messages were: ‘Keeping the environment clean’ (34%) and ‘hand washing with Dettol’ (28%), and ‘toilet use and hygiene’ (17%)
Figure 4.7 Access to health messaging and nature of message
1
2
2
5
9
17
28
34
0 20 40 60
Clean environment/Garbage disposal
Campaign on free sanitary towels
Use and disposal if diappers
Water treating using water guard
Personal hygiene (Ad on soap)
Toilet use and hygiene
Handwashing with dettol
Keeping the environment clean
%Base: Exposed to health message(N=95, 34%)

30
Access to information was further analyzed in terms of source of information. Note that the question asked allowed for multiple responses, therefore the figures may not add up to 100%. Table 4.21 presents the results, which establish the following:
▪ The figures obtained exhibit a considerable range the sources of information; the leading sources being the conventional media of TV (33%) and radio (23%), and health worker (23%)
▪ Making urban-rural comparison, the marked contrast among these figures is the much higher percentage for TV in the ruabn areas
Table 4.21 Source of information on sanitation and hygiene
% Total Urban Rural TV 33 59 25 Radio 23 18 24 Health worker 23 14 25 Community meeting 9 0 11 NGO/Agency worker 8 9 7 Neighbour/Friend 5 5 6 Other [Poster/Billboard, Garbage truck, Roadshow/Demo] 3 5 2
ж ж ж ж ж ж ж ж ж ж ж ж ж ж ж ж ж ж ж ж ж ж ж ж ж
4.6 Livelihoods 4.6.1 Main source of income
The first indicator for measuring livelihoods was main sources of household income. The results in Table 4.22 reveal the following:
▪ Overall, majority of the households rely on salary/wage income (37%) and business/trading (38%). About one-tenth (11%) depends on remittance, while 4% and 10% rely on selling animal and farm products respectively
▪ A comparison across the sub-counties exhibit some contrasts in terms of the proportions relying on livestock and farming. The results indicate higher dependence on selling animal products in Mwatate, and on selling farming products in Taveta and Wundanyi
Table 4.22 Main source of income
% Salary/
Wage Business/
Trading Selling animal
products Selling farm
products Remittance
Total 37 38 4 10 11 Urban 45 34 - 10 10 Rural 34 40 6 9 11 Mwatate 38 30 11 9 13 Taveta 29 44 8 13 6 Voi 41 42 - 6 12 Wundanyi 37 34 - 15 15

31
4.6.2 Farming activities
Two criteria were applied to the issue of farming activities: size of farm and sources of water. The results, as seen in Table 4.23 indicate the following:
▪ Overall, around half (51%)of the households own a parcel of land for farming, varying from 48% to 62% across the sub-counties.
▪ Majority of the households own between 1 and 2 acres, reflected by proportions of 36% and 40% respectively, suggesting small scale farming plays an important role in sustaining household food insecurity
Table 4.23 Size of land for farming
% Households with land Size of land
1 acre 2 acres 3 acres 4+ acres Total 51 36 40 16 8 Mwatate 48 25 44 22 9 Taveta 53 23 47 27 3 Voi 48 40 40 10 10 Wundanyi 62 52 31 10 7
The question: “When it has not rained, what is the source of water that you rely on for farming?” was asked to assess farmers' adaptations to rainfall related climate variability. The results presented in Table 4.24 shows the following:
▪ Overall, just about one-third of the households (33%) practice irrigated farming when it has not rained
▪ Comparatively, notable contrast is observed across the sub-counties, with Wundanyi being the location where crop farming activities are likely to be disrupted the most, and Taveta, the least
▪ More specifically, surface water [river/pond] (18%) is overall the main source for irrigated farming, however with piped and ground sources [borehole/well] also emerging as important sources in Voi and Taveta respectively
Table 4.24 Source of water for farming when it has not rained
% Total irrigated farming Source of water Piped water Borehall/Well River/Pond
Total 33 9 6 18 Mwatate 39 3 6 30 Taveta 53 3 20 30 Voi 30 18 2 10 Wundanyi 14 3 - 10
4.6.3 Livestock activities
Having considered farming activities, the same type of analysis is applied to livestock activities. First, considering livestock ownership in general terms, the results (Table 4.25) reveal that:

32
▪ Overall, just below one-third (27%) of the households own a livestock of any category ▪ Across sub-counties, Taveta lead in this regard (22%), followed by Mwatate (14%). Both Voi and
Wundanyi show relatively minimal livestock activities ▪ More specifically, ost livestock activities are mainly related to cattle and goat rearing – 27% and
22% respectively Table 4.25 Livestock ownership
% Households with livestock Size of herd
Cattle Sheep Goat Doneky Camel Total 27 27 14 22 5 2 Mwatate 14 32 14 27 8 2 Taveta 22 37 21 35 13 12 Voi 5 23 14 18 0 0 Wundanyi 3 19 10 12 2 0
Next, livestock activities are analyzed in terms of the size of herd. Table 4.26 shows the results, with the following being observed:
▪ For most households, the herd size is fairly limited. For the highest proportion (83%) of the households, the size of herd across all categories range between 1-10
▪ For the large herd size (20+), the highest proportions are found in respect to sheep (20%) and goat (19%)
Table 4.26 Size of herd owned by household
% Cattle Sheep Goat Donkey Camel 1-10 83 68 76 100 57 11-19 11 13 5 - 29 20-50 4 15 19 - 14 51+ 3 5 - - -
To conclude this section, livestock rearing activities are examined in terms of access to water for the herd. Table 4.27 shows the results, with the following being observed:
▪ For the highest proportion of the households, surface water (river/pond) both the primary source of water for livestock during normal season (59%), and similarly the alternate source during drought (41%). The other notable sources during drought is piped and ground water.
▪ On the basis of the sub-county differences, contrasts emerges in respect of surface water, in favour of Taveta and Wundanyi; and piped and borehole water, in favour of Mwatate and Voi

33
Table 4.27 Source of water for livestock (primary & alternate)
% Surface
[river/pond] Piped Ground
[borehole/well] Rainwater Kiosk/Vendor
Primary source (Total) 59 15 10 5 11
Alternate source (Total) 41 37 22 Mwatate 26 41 32 Taveta 68 4 28 Voi 27 58 16 Wundanyi 75 17 8
ж ж ж ж ж ж ж ж ж ж ж ж ж ж ж ж ж ж ж ж ж ж ж ж ж 4.7 Conflict and Insecurity 4.7.1 Human –wildlife conflict relating to water issues
Two criteria were applied to the issue of human-wildlife conflict with regard to the use of water and water infrastructure: number of episodes and effect of event. It should be noted that human-wildlife conflicts were largely restricted to Taita Taveta. It is also useful to note that the survey did not intend to specifically address elephant related incidences, although from what emerged (not depicted), practically all incidents related to elephant activities, with only four relating to crocodiles. Table 4.28 presents the results, showed by actual numbers, rather than percentages due to the thin sample bases. The following can be noted:
▪ Overall, of the 39 households affected ▪ The most commonly offered descriptions of the problems were destruction of crops (N=22),
destruction of water infrastructure (12), human death (8) and exhaustion of water reservoir (7) Table 4.28 Frequency distribution of human-wildlife conflicts and problems occuring
Total (N) No. of events 39 Problem occuring Destroy crops 22 Destroy water infrastructure 12 Human death 8 Exhaust water reservoir 7 Human injury 2 Livestock death 1
4.7.2 Inter-communal conflicts relating to water issues

34
Turning to inter-communal conflicts with regard to the use of water and water infrastructure, this time using the criteria of number of episodes and factors is employed. The figures are similarly presented (Table 4.29) as actual numbers, rather than percentages due to the thin sample bases. Regarding the results, the following can be noted:
▪ First, the main point to note is the low occurrence incidents of inter-communal, reaching only 6 incidents, primarily in rural areas
▪ An analysis of the reasons indicate that the conflicts occurred in the context of resources access/sharing, sand harvesting, river diversion and stealing of water pipes, which in this case is likely to reflect inter-communal differences rather than criminal incidence
Table 4.29 Frequency distribution and causes of inter-communal conflicts
Total (N) No. of events 6 Cause Resource access/Sharing 2 Sand harvesting 2 River diversion 1 Pipes stolen 1
ж ж ж ж ж ж ж ж ж ж ж ж ж ж ж ж ж ж ж ж ж ж ж ж ж 4.8 Community Participation and Governance 4.8.1 Community participation
The level of community participation was determined on the basis of participants’ responses to the question, “Are you a member of any community based group?” Table 4.30 presents the results for the level of community participation and nature of group activities. However, given the low sample base. The results should therefore be taken as indicative rather than conclusive. The following can be observed:
▪ The level of participation is relativelylow key, observed by overall proportion of just 12% of the total sample that are currently members in any CBO; with males leading in terms of participation
▪ The highest proportion belong to groups involved in economic empowerment (54%) . In relation to the broader objectives of this survey, just 4 gtroups are engaged in environment and sanitation related activities
Table 4.30 Level of community participation and nature of activities
N % Total participation 31 12

35
Male 20 16 Female 11 8 Nature of activities Economic empowerment 13 54 Environment 7 29 Social welfare 2 8 Water 1 4 Youth empowerment 1 4
4.8.2 Governance processes
Next, moving onto governance criteria, the survey commenced with the understanding of the term ‘devolution’, which was addressed by asking respondents the question: “What is your understanding of the term ‘Devolution’?” Table 4.31 presents the results for the overall and by gender, revealing the following:
▪ Regarding the findings, the first point to note is the relatively high rate of “Don’t Know/Not sure” responses of (71%)
▪ Substantive responses reflect varying views, with a preponderance of opinion emerging in favor of issues relating decentralized development (27%)
▪ Across gender, the results reveals that women lag behind in terms of level of awareness of devolution, in this case, in relation to decentralized development and right to participate
▪ A tinge reflecting lethargy in politics was evident in the response “I don’t care about politics,” albeit with minimal mention
Table 4.31 Participants’ understanding of devolution
Total Male Female Decentralized development 27 30 23 Right to participate in governance 1 2 - "I don't care about politics" 1 - 2 Majimbo 0.4 - 1 Not sure 71 68 74
The next indicator looks at levels of awareness of the of “right to participate” in the context of specific governance processes. The results, as seen from Table 4.32 shows the following:
▪ Almost without exception, identifying and deciding about development projects is the predominant process that participants were aware of (87%) - though as noted the rates for spontaneous mentions are negligible at just 2%.
▪ Relatively narrow contrast is seen between male and female Table 4.32 Proportion aware of right to participate in governance processes
% -Yes Total [Spontaneous] Male Female
Identifying and deciding about development projects 87 [ 2] 88 87
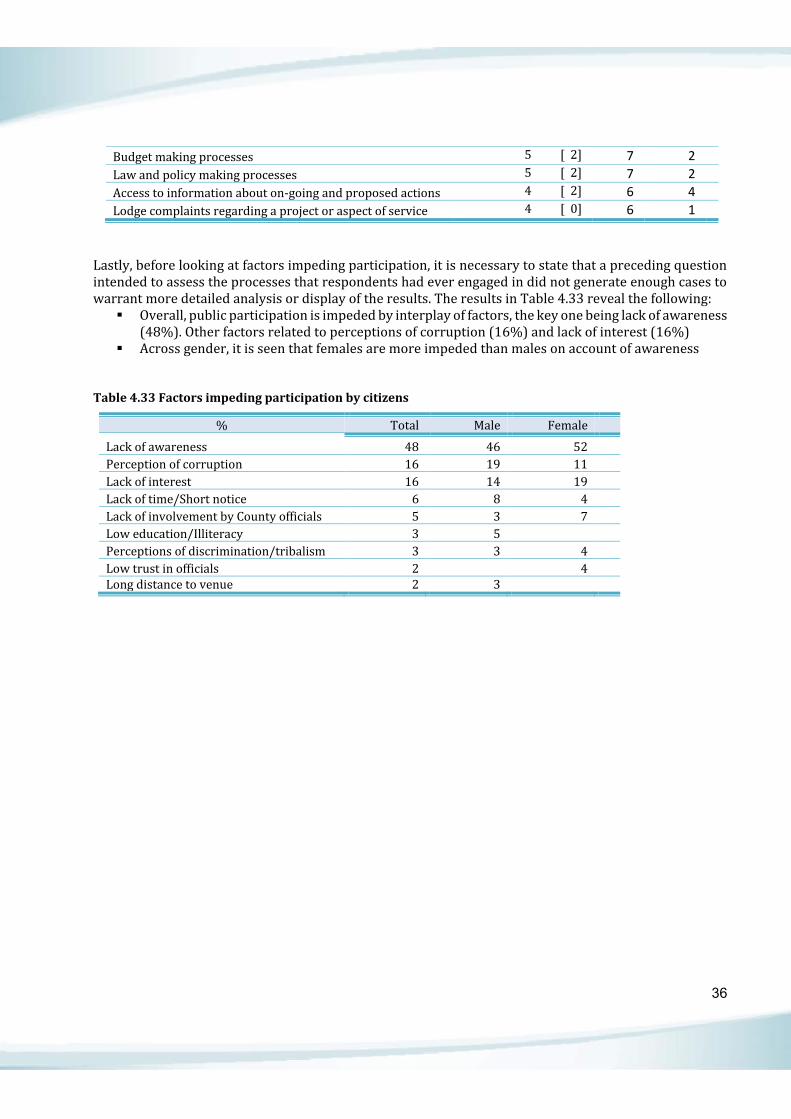
36
Budget making processes 5 [ 2] 7 2 Law and policy making processes 5 [ 2] 7 2 Access to information about on-going and proposed actions 4 [ 2] 6 4 Lodge complaints regarding a project or aspect of service 4 [ 0] 6 1
Lastly, before looking at factors impeding participation, it is necessary to state that a preceding question intended to assess the processes that respondents had ever engaged in did not generate enough cases to warrant more detailed analysis or display of the results. The results in Table 4.33 reveal the following:
▪ Overall, public participation is impeded by interplay of factors, the key one being lack of awareness (48%). Other factors related to perceptions of corruption (16%) and lack of interest (16%)
▪ Across gender, it is seen that females are more impeded than males on account of awareness Table 4.33 Factors impeding participation by citizens
% Total Male Female Lack of awareness 48 46 52 Perception of corruption 16 19 11 Lack of interest 16 14 19 Lack of time/Short notice 6 8 4 Lack of involvement by County officials 5 3 7 Low education/Illiteracy 3 5 Perceptions of discrimination/tribalism 3 3 4 Low trust in officials 2 4 Long distance to venue 2 3

37
Findings from Key Informants
5.1 Challenges and Priorities in Water and Sanitation 5.1.1 Key water issues in Taita Taveta
i. Water supply and distribution
Taita Taveta County has not been able to adequately its water demand. The challenges of meeting the County’s water demands, are in part, linked to unproportional low share from the main pipeline from Mzima Springs. The other important factor is challenges in the existing distribution and storage capacities. In Voi, the biggest problem is found in areas in the lower region areas, such as Buguta, where as noted, residents have to move up to distances of 10km to find water.
[[“People move 6-10km to get water. In most cases the water problems are just addressed in towns but they do not consider the villages. There are a lot of challenges for the people who cannot even come to town, the government should therefore try to go and address their issues.” ~ (FGD participant, Voi)]]
Alternately, in Taveta Sub-County, the piping and storage challenges are linked to combined factors of increasing population and aging distribution systems. The initial planning in the area failed to consider potential population growth. On the other hand, the demographic shift has as a result outstretched the ability of the current aging infrastructure.
[[“The reserve tank is too small, and the pressure in the major service line too low. Initially, even in taller buildings, you did not need extra pressure. They need other reserve tanks in the villages. There is no connection to households, now every main line is punctured.” ~ (Community leader, Taveta)]]
ii. Watershed degradation
Water catchments are key to the County’s water security. Perspective of the watershed was similar between the key informant and representatives of WARUAs/CBOs. With most these catchments remaining unprotected, measures to protect and conserve the forest ecosystems fundamental to the watersheds was identified as a critical aspect that demands immediate action by the County Government. More specifically, the most important watersheds in need of protection are Lake Jipe, Lake Chala, Njoro Spring and Mzima Spring. There are also a number of smaller watersheds such as Iyale and Mlemboho springs. The County Government is currently giving attention to planting of trees, soil conservation, protection of the catchment areas and protection of intakes, in relation to protection and restoration of the ecosystems, and also enhancing activities of Water Management Committees as a strategy for managing water catchment protection at local levels.
5

38
Photo 5.1 Josa spring, a community based water supply scheme, Josa (Wundanyi)
iii. Water management issues
There were several observations revealing pitfalls with the way water resource in the County are managed. The principle issue was attributed to lack of coordination between the National and County Governments, this problem stems from unclear definition of roles and responsibilities of the two levels. A FGD participant’s statement below reflects the mood of how they felt the water sector is managed:
[[“There is a problem with the management within the water sector. Up to now it is still hard to understand who is responsible for what in the distribution of water and the water sources. There is confusion in the national government and the county government.” ~ (WRUA official, Taita Taveta)]]
The other observations reflected concerns about the management and delivery of water services. The FGD participants made the following comments:
i. Lack of community participation in project planning ii. Conflicts between the community water projects and the Tavevo in terms of management
iii. Absence of sector priorities due to lack of a Water Master Plan iv. Communities lack of capacity to manage water projects, particularly in respect to finances v. Poor accountability for resources, for example regarding funds allocated for Maungu and Buguta
vi. Water bowsers are used by those with ability to make bulk purchase to trade. When they bring the water, they sell it exorbitantly at Ksh. 30 instead of 2 shillings
vii. Lack of maintenance of water infrastructure, seen in failure to repair some taps which are broken or pipes that have also burst
viii. Drilling of new boreholes and poor maintenance of the existing ones The strategy and actions planned to addresses existing water supply challenges primarily related to financing water-related projects and strengthening water management. The specific priorities were identified as follows: i) look for partners or investors to fund some of the county’s projects, ii) persuade the Governor (or county assembly) to increase the budget for water, iii) empower CBOs, and iv) capacity building for the water committees.
iv. Gender based violence and early marriage
FGD participants’ views suggest that insecure access to water resources is associated with increased gender based violence and early marriages in some sections of the County. women and girls physically

39
bear the brunt of water insecurity through risk of rape and defilement. From a different perspective, household water insecurity and the disproportionate amount of the burden that women and girls carry is also an underlying cause of early marriage and sexual and reproductive health issues affecting girls. girls are lured by bicycle riders or handcart operators who offer their assistance. FGD participant’s comment below reflects this view:
[[“There are problems such as rape, defilement and early marriages which are mainly due to water problems. People with bicycles or handcarts may also take advantage of children..” ~ (FGD participant, Taita Taveta)]]
v. Water in health care facilities
Regarding sanitation in healthcare facilities, it was noted that despite a number of caveats in relation to access to and availability of clean water, the views of the key informant interviewed was that the state of sanitation remains good and the level of hygiene generally higher. The problem of access to water is especially bigger in Mwatate, where most facilities are not connected to the piped network. This is seen as an issue, particularly for public facilities, essentially because the few private hospitals have their own source of water. To address this problem, the County government department concerned comes and fills their tanks with water.
[[“In Mwatate there is a challenge. The few private hospitals have their own source of water. Dispensaries are quite many but their main challenge is water. I have seen when it is very dry the county government comes and fills those tanks with water.” ~ (NGO Official, Voi)]]
vi. Human-wildlife conflict
Human-wildlife is a problem, and occurs in particularly in the areas near that are in close proximity to Tsavo East and Tsavo West National Parks. Elephants were identified as persistently causing damage to water infrastructure and crops, and are a problem for the community water projects, particularly during the dry seasons. Discussions with officials representing Ngangu Water project in Mwatate also established that elephants have occasionally caused extensive damage to the water infrastructure, particularly to the water storage tanks, a problem which they seek to address with elephant fences.
[[“During the dry season the elephants are all over the place. They smell that there is water here especially when there are leakages. They have not interfered with the pipes. They have only interfered with the tanks and on most occasions broken the lid...We have approached the County Government and they said they would assist us to do the fence and intake here. I also talked to the water officer and they said they have set some funds aside from the Environment Ministry to go and fence the source and then when this is done we will plant some trees to preserve that area.” ~ (WARUA official, Taita Taveta)]]
Wildlife is also affecting school programs and general standards of education, particularly in the lower areas of the County. Schoolchildren fare unable to go to school early, and it also requires them to leave school sooner.
[[“Children, and even women cannot go out early to collect water, because from 6 to around 8 am, elephants are still loitering around. It is from around 10 am that children are allowed to go to school. By 3 pm, the teachers have to permiy them to go home before the elephants get back. … In general, wildlife invasion is contributing in a large way to low education standards in Taita Taveta County) because most schools are in the lower zone – i.e. human-wildlife conflict zone.” If you look at the entire county, the raised zone is very limited, primarily just Wundanyi; but Voi, Mwatate and Taveta are all problematic.”~ (FGD participants, Taita Taveta)]]

40
At the Maungu-Buguta water intake and pump station, the research established that elephants occasionally cause damage to the water installations, which not only cause supply interruptions to the larger Maungu-Buguta area, but is also wasteful and costly to repair. To ensure that the elephants have access to water, a waterhole is provided to meet the needs of elephants and other wild animals. Photo 5.2 Maungu-Buguta water in-take and pump station with elephant waterhole, Maungu (Voi)
Watering troughs or waterholes are used to ensure the animals are able to get the water they need while keeping them away from the water infrastructure, particularly and utility pipes and storage tanks. In the areas prone to elephant invasion, World Vision is incorporating ‘elephant-friendly’ measures to prevent elephants from entering to cause damage. This is done by placing watering holes away from the facility, and ensuring that the elephants continue to get water, as noted below.
[[“In Kamtonga, we built a perimeter wall and put huge lighting to scare away the animals. We will provide the water and the will do the troughs, and even the pipes, but KWS will have to identify a conservancy and the trenching and the routes. Alternatively they (KWS) were saying we can also do it at the source. We just do a big trough at the source and in the evening the operator fills that rough for the elephants to use. The elephants are very friendly when they find water but when they do not they vandalize property.” ~ (NGO official, Taita Taveta)]]
vii. Land issues
Land ownership emerged as an important issue in the management of community water projects. These are largely attributed to failure to arrive at a negotiated agreement prior to beginning project construction. Differences between the community and the title holder occasionally manifest in tussles over roles in managing the project and selling responsibilities. For donor funded projects, in most instances, a negotiated agreement for the purchase of the land is sought, as illustrated by the key informant comment below.
[[“Land ownership is a problem as well but we are quite in a different angle. (For the project at Mwakitatwa) we involved the County Government and we had a memo. So before we develop a source they acquire the land and it becomes a community property. (There are also legal challenges in the sense that) some people have title deeds for community land.” ~ (NGO official, Taita Taveta)]]
Box 4.1 illustrates a case in point regarding an existing water project in Mwatate, highlighting the land related issues over control of the water project.

41
Box 4.1 Ngangu Water Project, Mwatate
The Ngangu was started in 2002 when we got funds from Maji na Ufanisi, while the CDF and Ministry of Water brought technical experts. Material support included pipes and cement to put up intake and tanks, while the community contributed through digging trenches. The community also contributed in terms of manual work. The project all together was supposed to cost 3.8 million and to cover 15 km, although due to insufficient funds the work was left in between. The project is managed by a management board that is constitutionally is supposed to serve for a term of two years. Currently, the project has a tank capacity of 30 cubic metres, and serves a population of around 2000 people, about 1000 herds of cattle and numerous goats, and is a critical source, especially during the dry season. There has been a different over control of the project. For the community, the hope is for an improved access and a sustainable water system, whereas for the land holders it appears to be the status of having the project on their parcel and to obtain an income stream. Anecdotal evidence indicated that an already exhibited difference between the title owner and community group reflected in occasional tussle to control the selling and collection of water revenue. Photo 5.3 Ngangu community water project, Sechu (Mwatate)
As part of the project expansion, additional borehole called Makimori that has already been sunk. However, the bore hole is on a private land, and the owner demanding compensation. For this particular phase, the group has already approached the area member of parliament to assist in facilitating financial compensation to the land owner.
viii. Issues in resource sharing
One dimension of the social context that affects water projects is resource sharing. The study established that the community water projects tend to provoke competition over the use and control of the water resources. Information obtained from the key informant indicated that resource sharing issues correlated with lower cooperation rather than aggression. Tension is usually characterized by differences over quantity of water piped to downstream users and occasional interferences with the water pipes, as noted from the comments below:
[[“For example, in relation to Ngangu Water Project, there is upper zone and lower zoone. People (in the lower zone) have tapped a lot of water from the main line, so donwstrean communities cannot recive adequate water…. They're deliberately denying the people downstream water, but once they tap a lot of water from the main line, the downstream people become unserved because of the system used to access the water.”) ~ FGD participant, Taita Taveta)]]

42
[[“Since January there has been a problem with water. In fact we hardly sold anything between January and March. (the water was inadequate) because there was competition as we have a larger population up there and they claim that they own the source…(and) they do interfere with the pipeline a lot.” ~ (WARUA official, Taita Taveta)]]
On another level, the challenges of water access have also led to competition between community and institutional users. Due to strain on limited wateric resources, in 2005, Ngua Mlmabo Development Trust, with support from Danida, implement a water project at Mwakitawa Secondary School to help address the water needs of school and community at various levels (see Box 4.2). Box 4.2 Mwakitawa Secondary School Water Project, Tausa
The water project at Mwakitawa Secondary School was started in 2005 after implementing a similar project in Moi High School Kasigau, which was implemented through the partnership with Maji na Ufanisi. After implementing four tanks at Moi High School, several schools forwarded their requests for, so the community group looked for another partner to provide financial support. Danida came forth and offered funds to support three institutions, including Mwakitawa Secondary School. The project was constructed at a cost of Ksh. one million, with the school paying 10% of the funds, and the rest provided by the support partner. The project has two storage tanks of 10,000 liters each, and combines water gravity flow system from springs and rainwater harvesting through roof catchment. The spring water runs into a storage tank by gravity to supply the distribution network. Photo 5.4 One of the storage tanks for Mwakitawa Secondary School Water project , Tausa (Voi)
At the time, the school had only one stream, with a total of 200 students, with all students being day scholars. Currently, there are around 700 students, with around ninety percent being boarders. The water project has reduced the conflict because in the beginning there was only one tank serving both the school and community. In some cases initially, the school was almost closed because of water shortage. The school can now also use two other tanks. The project has also benefitted the community when it comes to control of soil erosion through runoff water which is now tapped and conserved. The roof catchment water is only meant for the school, but in a large way, the community is relieved as now there is no competition with the school at the communal water point. The School Board of Management has made additional request for more tanks because of the increasing school population and because of the huge potential for more catchment, and for control of soil erosion, evidenced by widening gullies within the school compound.
ix. Communal differences

43
Another dimension of the social context that affects development and management of water projects is linked to communal differing arising from conflicting interests among competing groups. Lessons from a water supply development project showed that the relationship between competing interest groups tend to cloud the wider community aspiration, and can have repercussions on the long term success of a project. One of note was a project which stalled due to lack of political will and communal differences, as observed from the comment below:
[[“The donor had their guidelines and the political elite and the community had their interest, and didn’t turn up to support the donor, so the donor took off.” ~ (Public Health Officer, Taita Taveta County)]]
Photo 5.5 Derelict water kiosk and pipe (inset), Gimba - Lower Sagalla (Voi)
5.1.2 Key sanitation issues in Taita Taveta
The situation of sanitation in the County is improving, yet. Existing challenges are linked to two key issues: open defecation and lack of sewerage system.
i. Open defecation
Although officially, the sanitation situation in Taita Taveta tells of a major progress in the use of improved sanitation facilities over the past years, all the key informant interviews tell of a worrisome situation, which is largely attributed to the increasing issue of open defecation, which is mostly associated with new settlement in Taita Taveta of pastoral populations. Most of these settlements have occurred in parts of Maungu, Buguta and Masenyi. In part, lack of sanitation facilities is linked to the cost of constructing toilets is very high. Information obtained from dialogue with various residents in Buguta intimated problems of defecation in the rainwater gullies, particularly in Mwachabo area, which becomes a source of runoff contamination in the water pans.
Photo 5.6 A water pan in Buguta, one of those in dange of runoff contamination, Buguta (Voi)

44
Issues arising from the informant interview also established that open defecation is also becoming an intra-county problem, primarily because of the health impacts felt across the county boundaries. The case in point is the localities at the perimeter of Taita Taveta and Kwale Counties. Open defecation remains fairly widespread in Kwale, with the practice also having a significant impact on public health in Taita Taveta.
ii. Exhauster emptying services
At the moment, the County relies on one exhauster truck to empty sludge, which other than Voi town, sometime goes to Mwatate, sometime to Taveta, and even up to MacKinnon Road. To receive the service, one is at times forced to wait, even wait up to a week. For this reason, wastewater produced by the households in the neighbourhoods is allowed to flow freely most of the time. Other people have diverted the waste systems in their buildings to the storm water systems, and when it rains, they allow the effluence to discharge untreated into the open ground. For most of the others with, pit latrines, the common practice when the toilets fill up is to apply “jivu” (ash). Photo 5.7 The County’s only exhauster drawing sludge, (Voi town)
iii. Waste water management

45
In relation to waste water management, it is noted that all the three major towns in Taita Taveta still lack a conventional sewerage system. In Taveta, previous attempt to construct a sewer system to address the market needs, a project that was being supported by Norwegian Embassy is not completed due to lack of funds. The project was also interrupted by the shifting of the market location, which was moved closer to the border post. Taveta town is confronted by additional challenge of congestion, particularly in Babati and Chechewa, where waste water pipes are practically passing under people’s homes due to lack of space. The problem of waste water is compounded by the fact that the water table if fairly high, particularly in Voi. As a result, the depths dug for the septic tanks and soak pits are fairly shallow, which makes most fill up sooner. The County Government is in process of implementing water and sewerage systems. The work which is under progress is Maungu. The County is currently also developing proposals for Taveta, Voi town and Wundanyi.
iv. Market sanitation
One area that has also suffered from the problem sanitation is the market places, due to lack of adequate number of toilets and water. The lack of toilet facilities is more salient in the rural areas since the markets do not have access to toilets, requiring traders to make their own arrangements for toilet and hand washing. The two comments below highlight these views:
[[“Generally the County has poor sanitation. Like in Voi there are four toilets. One is in the market and there is another one in the stage. Here is another one in the town but the toilets are not up to standards. The water used for the toilets are not sufficient. initially there were no toilets at all. Now they are there but we should improve on their standards.” ~ (FGD participant, Taita Taveta)]]
[[“Urban centres are abit okay. But in rural markets, toilets are not available, so traders have to make their own arrangements with the locals to use their home toilets.” ~ (NGO official, Taita Taveta)]]
5.1.6 Key Solid waste issues in Taita Taveta
i. Garbage collection and disposal
The basic waste management objectives – to prevent waste prevention and increase access to the disposal sites is fairly well addressed at the moment. The approach used for waste collection is through provision of designated refuse storage chambers where residents can take their garbage. At the moment, waste disposal is fairly efficient disposal system, largely because the quantity of waste currently generated in the townships is relatively manageable. Observations in this study also showed private refuse storage chambers modeled after existing County facilities, as shown in the image below. Photo 5.8 Private refuse storage chamber, Maungu (Voi)

46
For this approach of waste management, the challenges experienced relate to the number and type of collection garbage trucks the County is in possession of. The efficiency of the waste collection, in this case, is restricted due to the design of the garbage trucks. The design of the existing garbage trucks places huge requirements for manual lifting of the refuse, which in turn increases the time required to collect and dispose the waste materials from different collection points across the County.
ii. Disposable sanitary towels and baby diapers
An important solid waste and sanitation issue is that of disposable sanitary towels and baby diapers. Sanitary towels are being dumped everywhere and they get drained by rain into the rivers. Regarding diapers, although the impact of improper disposal has not been investigated, this is emerging as a public health concern, primarily because there is no significant difference between open defecation and improper disposing of diapers, as noted from the comment below.
[[“Pampers for children have become a big problem. When we talk about open defecation where someone goes to defecate in the bush, with pampers, the child defecates and the used pamper is thrown carelessly… Our women like a lot this idea of pampers, but now how do we dispose them? Some children have disease and it is important to dispose them in the right way.” ~ (Public Health Officer, Taita Taveta County Government)]]
iii. Improper garbage disposal
Disposal of dometics wate is one of the rising environmental problems facing households due to inadequate or unsuitably sited waste disposal facilities, particularly in the rural and small urban areas. While in the urban areas, the County department responsible collect and dispose off garbage, in the rural areas, garbage is improperly disposed in the farms.
[[“I place outside my compound and then the ‘municiple’ (County department) collects and put them in their trucks where they are then emptied into the dumpsite. In rural areas they are mostly thrown on the farms and in some occasions people dig holes and put the wastes inside and burn them..” ~ (FGD participant, Taita Taveta]]
Improper disposal practices that also represent emerging rural environmental problems. A practice noted by way of observation on the ground was that of disposal of waste into gullies. Photo 5.9 Emerging problem of inappropriate dumping in a gully, Maungu (Voi)

47
iv. Waste disposal and revenue opportunities
On closer observation, there was evidence that waste recycling has given rise to new opportunities for employment in the recycling sector through both individual initiatives and community-based approaches. The activities, which were essentially observed in Voi, involve collection of plastic materials, which are then transported and sold to middlemen in Mombasa. Box 4.2 Voi Youth Forum recycling project, Voi
A successful case emerging in this regard is that of Voi Youth Forum, which was started in 2004 with an aim of empowering the youth. The group is currently undertaking projects that address three key areas, namely: reproductive health initiatives to to help the youth to make wise health decisions, civic education, and environmental conservation. In respect to environmental conservation, the main focus in this area is on tree planting and recycling of plastic, which are shredded in the group’s yard for onward transportation to Nairobi, for export. Initially, the project was funded by UN Habitat, and is currently is being funded by KCDP. Key challenge includes reduction of plastic material. The other challenge comes from the larger companies in Mombasa, which as reported, “also raid on the market in Voi at times.” Photo 5.10 Voi Youth Forum shredding yard and plastic stockpile, Sofia (Voi)

48
Currently, six people are employed to work in the workshop, with each earning Ksh. 6000 per month. As of now, the group which operates as a CBO, intends to transform into a Trust, but the delay has been caused by the Public Benefits Organizations Act, which intends to moving registration of Trusts from the National to the County government. Photo 5.11 Private stock pile of plastic collected for recycling, Maungu (Voi)
ж ж ж ж ж ж ж ж ж ж ж ж ж ж ж ж ж ж ж ж ж ж ж ж ж 5.2 Vulnerability Contexts and Priorities
i. Priorities on vulnerability
In Taita Taveta, priorities on vulnerability focuses on gender, disability and populations that live in remote, rural areas with significantly reduced access to services, albeit with a gender and disability focus. For example, in some areas, such as Buguta in Marungu, people move long distances, up to 10 km with donkeys to find water. The challenges confronting Taveta relate to inadequacy, with an average household requiring up to 200 litres a day. As a result, the amounts spent on water are high, rising up to a monthly figure of Ksh. 2000 for the households, Ksh. 50,000 for hotel establishments. A number of people prefer to obtain water from streams using bowsers, while others have resorted to sinking boreholes. These challenges have broad implications for the residents and communities in terms of the following:
i. Disruption of economic activities throughout. It is noted that women are especially affected, given that in extreme cases, some spend up to 6 hours or more in search of water
ii. Vulnerability to disease outbreaks with inadequate water and sanitation iii. Conflicts seen over the little water available iv. Human-wildlife conflicts include physical damage to water infrastructure by elephants
ii. Measures to reduce vulnerability
Programmes aimed at reducing vulnerability have been directed towards gender and disability. The cross-cutting issues are addressed through strengthening the capacity of groups of women and PWD, as well as context-specific actions that involve bringing water to the nearest point of collection. There is however no specific programmes designed at the moment to address the needs of elderly people, while for HIV/AIDS,

49
support is directed to specific contexts, mainly through existing support groups. The comments are illustrated in Table 4.1 below. Table 5.1 Strategies for addressing vulnerable contexts
Vulnerability context Comment
Gender
“We are doing gender mainstreaming; all people have to get equal opportunities. We construct or buy water storage tanks to the nearest point of collection”
Disability “In areas which have a lot of such (PWD) people, we are buying water storage tanks and take them to the nearest points. We also give 30% grant to mitigate risks, following the thirty-percent directive”
Elderly “We do not yet have a policy on them in relation to water or other issues” HIV/AIDS “They have their own groups; we go through these groups in order to address their
challenges”
ж ж ж ж ж ж ж ж ж ж ж ж ж ж ж ж ж ж ж ж ж ж ж ж ж 5.3 Coordination, Collaboration and Networks 5.3.1 Inter-county coordination
The close inter-link of the water ecosystems and other aspects of the economy within the coastal region has necessitated the collaboration among the County Governments under a forum, in what has come to be known as “Jumuiya ya Kaunti za Pwani.” Essentially, the broader goal of this forum is to foster collaboration through the identification of shared objectives in terms of economic and political development. The forum is considered useful in terms of address outstanding issues and reducing potential politics around water resources, as noted from the comment below.
[[“Here in coast we have got a Jumuiya. The Jumuiya is a group of all Governors of coast region and they share the challenges and come up with solutions that are easy for them to handle as a group not necessarily thinking of external forces but they believe each and every county has its own strengths and weaknesses; and there are resources that can be tapped and shared rather than clinging to your own and failing to satisfy oneself. “~ (Chief of Staff, Mombasa County Government)]]
Other than the coastal initiative, Taita Taveta County is currently also in the process of fostering a dialogue on modalities for boosting cooperation with both Makueni and Kajiado Counties regarding the sharing of water resources. 5.3.2 NGO/FBO collaboration
Generally, involvement of NGOs and FBOs in implementation of WASH programmes in the County has been limited. So far, the key organizations identified were World Vision Voi and Kenya Coastal Development Project (KCDP), with no lead agency in ters of project implementation across the non-governmental sector. The current areas of programmatic activities for these two organizations are as follows:

50
o World Vision:- Integrated water resources management activities, comprising water supply and environment protection. So far, World Vision has supported spring protection, projects in roof catchment and provision of water storage tanks of 30 cubic and sinking two major boreholes
o KCDP:- Currently in initia stage, KCDP is a multi-sectoral development project working comunity groups to support projects that are related to national resource management or community service, including water projects. Project is
5.3.3 CBO networks
The number of CBOs is difficult to determine but it is safe to say it is large. The research established that CBOs are play role in the water, sanitation and solid waste management. In terms of grassroots activities, the CBOs may be the main actors, but mainly through partnerships and collaboration with both National and County government institutions or departments, as well as NGOs/FBOs. The comments below illustrate this observation.
[[“(We are working with) quite a number of groups. We have the Taita Taveta Environmental Imitative, Mtakatifu Teresia in Taveta, Founding hope, etc. There are several.” ~ (Project Manager, Government Agency, Taita Taveta)]]
The CBOs involved in WASH pogrammes generally fell into two key categories, namely: WARUAs, whose main activities revolve around water resource management and development, and Community Development Associations, whose key focus is on providing direct income benefits for their members. The also play important roles of providing water and sanitation services. In view of their current initiatives, among the key skills of these organizations were identified as follows:
o Community mobilization and advocacy o Solicitation forproject funding and partnerships with donors o Supply of water mainly from catchment areas o Maintainance and repair of water infrastructure o Retailing water
[Note: The research also established that CBOs in Mombasa are focusing on treating water at source. The current initiative is undertaken through operational partnership with World Vision, which is providing skills in water treatment, water testing and overall quality assurance at source.] Key challenges
The interviews point to three key problems that CBOs experience, all of them primarily relating to cost recovery problems. These largely affect community-based water supply projects and solid waste management projects. These are discussed and illustrated using the case studies below.
i. Willingness to pay
The research findings show that many users, particularly in residential areas, in low-end localities are reluctant to pay for toilet and bathroom. For example, in Bangladesh informal settlement in Mombasa, Uvumilivu Development CBO runs a sanitation centre comprising of toilets, bath, and a water kiosk., that was constructed through the support of Maji na Ufanisi. The facility is managed through a pay-and-use approach to sustain the costs for operations and routine maintenance. User fees of 10 and 20 shillings are charged for toilet and bathroom use respectively. While the research affirmed the residents’ willingness-to-pay for improved water, when it it comes to toilet and bathroom, however, there is reluctance to use the facilities, primarily on account of the fees charged.

51
ii. Late payments
The research findings suggest that late payments are one of the key issues that are likely to affect CBO operations. For Bona Youth Group, a CBO providing garbage collection services in Sophia area in Voi town, the key challenges relate to the cash flow required for operational costs such as office rent, replacement of refuse bins, and wages, as well as cash required for routine maintenance of the hand carts used to collect and transport garbage. Photo 5.12 Equipment and office (inset) used by Bona Youth Group for garbage collection, Sofia (Voi)
iii. Management issues
The management problems cover a wide range. For one particular stalled community-based water supply projects assessed, the information obtained through dialogue with a second party pointed to problems relating to non-payment of water bills and lack of accountability in revenue collection.

52
Photo 5.13 Water kiosk for a stalled CBO water supply project, Maungu (Voi)
ж ж ж ж ж ж ж ж ж ж ж ж ж ж ж ж ж ж ж ж ж ж ж ж ж 5.4 Service Provision for Schools According to the County Government official interviewed, the role of County Government in school water and sanitation programmes is limited by the existing legal framework, which limits devolved functions to the early childhood development (ECD). Most of the functions are supposed to be taken care of at the National Government level. The County Government, however has plans to improve the access of water and sanitation services in the schooling system. These include:
o Provide all the schools with water storage tanks o Where there are no connections to the piped network, to supply water using the County bowser o Provide gutters for tapping of rain water o Encourage schools to utilize underground water
5.4.1 Situation of school water supply
The schools mostly depend on piped water supplied by Tavevo. Alternative sources for the schools include RWH and water vendors. The findings also suggest that schools tend to share water with local communities from community boreholes. The school officials interviewed acknowledged a number of constraints in relation to water supply. The main problem cited in relation to the water supplied by Tavevo was inadequacy due to too much rationing. Observations on the ground established that nearly all the primary schools have RWH and hand washing facilities. RWH is however not in such areas as Mwatate because of unevenly distributed and unreliable rainfall.
[[ “There is a lot of rationing; we do not have water all the time…There is no regular rainfall here. We have the tanks of course, but they are not helpful because we do not have much rain. We have a borehole down there for the community…When there is no water in the compound they have to go there, but you know they can meet anything out there, so sometime the teacher

53
is forced to escort them, or sometime when they feel a lot of thirst and there is no teacher to escort them, they take a risk of going all the way there.” ~ (Senior teacher, Mwatate) ]]
Photo 5.14 Rainwater harvesting and hand washing (inset) facilities, Gimba Primary School, Lower Sagalla (Voi)
The research findings also suggest increasingly supply interruptions due to interfere with the pipes laid for the school, associated with unauthorised connections and vandalism as observed from the comment below.
[[“There is recurrent supply interruptions, about two to three times in a term, caused by vandalism or illegal connections. We take a lot of time to trace the source of the problem, especially during the dry season.” ~ (Head teacher, Taveta) ]]
Concerning the utilization of rain water system, a lack of connection to the schools’ main plumbing systems, resulting in difficulties in accessed water from a variety of locations within the school compound.
[[“I don’t know whether that is a problem on the part of the management, but plumbing has not yet been done in connection with the (RWH) tanks, because we have two tanks.” ~ (Senior teacher, Mwatate) ]]
For one particular school with a feeding programme for the special needs children and standard eight candidates, water shortages create challenges for every day needs relating to food preparation. When there is a shortage, sometime food is not at all prepared or is improperly cooked.
[[“Most of the special needs children take meals in school. We have a feeding programme. When there is no water, sometime the food is not prepared, or it is not soaked the previous evening, so normally by the time it is being prepared, it is often improperly cooked.” ~ (Senior teacher, Mwatate) ]]
5.4.2 Situation of school sanitation
The schools’ sanitation facilities comprise either or both pour flash and pit latrines. For the younger pupils, it is risky in particular to use the pit latrines toilets because of the physical danger that they pose for the children. The teachers interviewed expressed fear that the younger pupils could accidentally slip.
[[“The toilets are pit latrines and sometime the hole is too big, which is risky. I wish they can have their own, which is meant to be for pre-schools. (Currently) they are sharing.” ~ (Teacher, Voi) ]]

54
The findings suggest an existing problem of high ratios of toilet use, which are above the Ministry of Education standard. In general, the major challenge pointed related to lack of privacy for the pupils because some share a toilet at the same time.
[[“For the boys, sometimes they go in twos so that they can hurry up. Privacy is not there. The urinals are not enough. We have only one which is not very useable, so I think they are not enough.” ~ (Teacher, Voi) ]]
The research also established challenges related to menstrual hygiene management, in terms of disposal of sanitary towels, most of the schools lacked sanitary bins. In these cases, the napkins are disposed in the pit latrines, and quickly filling the pits.
[[“That is a big challenge also, because for these flush toilets, you will find that they (girls) dump the sanitary towl into the toilets and block the system, So we also though of having a separate containers within the girls’ toilets. The other challenge is that, as we speak now, the pit latricnes are also full. ” ~ (Head Teacher, Mombasai) ]]
[[“For the girls, sometimes when they use sanitary towels, they lack enough buckets, and also I wish we can have somewhere built so that we can burn them…The last time they were duped in the boys pit latrine, but that now may not be very good because soon the latrine will fill up if we throw such solid (material) inside.” ~ (Teacher, Voi) ]]
The research also established challenges related to girls’ personal hygiene during their menstrual period, due to lack of bathrooms. Even where a bathroom was available, it remained unused due to lack of water. Photo 5.15 Derelict girls’ bathroom at Mwatate primary School, Mwatate
ж ж ж ж ж ж ж ж ж ж ж ж ж ж ж ж ж ж ж ж ж ж ж ж ж 5.5 Public Participation Although there are mechanisms at the County Government governments level to address requirements for participatory planning and decision-making, the findings from the FGD in showed that the delivery is

55
yet to benefit a portion of the community. More generally, the discussins pointed to low attendance in public hearings or public information meetings. Participants cited a number of factors in relation to issues that hamper the ability of public to effectively participate. Table 4.4 depicts participants’ statements, highlighting the the key challenges: Table 1.4: Issues that hamper the ability of public to effectively participate
ж ж ж ж ж ж ж ж ж ж ж ж ж ж ж ж ж ж ж ж ж ж ж ж ж 5.5 Budget Deficit and Funding County requires corresponding amounts of Ksh. 10 billion and 250 million to meet the County’s water and sanitation targets. As such, the current allocation of Ksh. 300 million (10%) and 27 million (2%) towards water and sanitation respectively restrict the extent to which the two issues can be given sufficient
Imediment Comment
Insufficient time for notice of meetings
“The County Givernment does not give notice in sufficient tme. You are informed that there will be a meeting tomorrow, for example, for budgeting. As a result, you find that many people are unable to attend.”
Lack of understanding what public participation processes entail
“When the system (of public participation) was instituted, few people had understanding of what the process entails. It would have been better for people to be first educated regarding the processes – i.e. the difference between budget andCDIP. May of those who attended made contributions without understanding the exact purpose of CIDP and budget, so they mixed up everything. By the time they realized CIDP entails 5year planning, it was too late.”
Language barrier “They preferred to use Kiswahili, which some people had a problem understanding.”
“The hearings is too rushed, probably 2 hours. Their interest is to simply have people writing their names and then claim the public has paryicipated, but which essentially is not real participation”
Failure to disperse information to the public
“You get informed today, yet the even is tomorrow. They do not distribute any copies (of the proposals). They simply read out the information, so people do not understand most of the things.”
Use of technical language that alienates majority of citizens
“You know even the language of the budget is technical for one to understand. You know when you want to give a layman information, just say this is how mcuh we want to spend. You see, programme based budget has so many other items, soit really confuses our people, and as a results it doesn’t make sense to have public participation.”
Popular opinion are discarded when the proposals are discussed at County Assembly
“When it (proposal) gets to the County Assembly and they pass the budget, the views that you provided are not included. For example, in the 2014/15 budget, Mwamburi bore hole was allocated Ksh. 5million, which we clearly confirmed., but after the budget, when we went to check with the Ministry of Water, we were informed that the bore hole had no allocation.”

56
attention on the development agenda. However, beyond the national and local revenues, Taita Taveta County is already or in the process of establishing collaboration with various development partners. A special mention was made of Cingral, which is supporting improved access to safe, adequate and sustainable water supply in the County, and Norwegian Embassy, which is supporting the development of the sewerage system in Taveta Sub-County.

57
onclusion
Although efforts to achieve water and sanitation access have been in progress, the results of this survey show that challenges still persist in both Mombasa and Taita Taveta Counties, four year after the coming of devolved system. While a number of factors may used to explain these gaps, two are insufficient resources and rapid urban population growth. On another level, and more specifically in respect to water services, a seemingly distal factor that appears to also influence water and sanitation delivery is the existing policy context and legal framework, that as noted, is likely to be a source of institutional mismatches at the National and County Government levels responsibility, is also likely to impede ability County Government in the administration of policy, and therefore, by extension, its capacity to effectively operationalize devolution in water delivery. It is quite clear that the CBOs, through donor support are playing crucial a role in improving access to services, particularly in the area of water. On this basis, greater government/community collaboration has potential to increase even greater access to services very quickly. Taking all the evidence into account, a number of useful observations have emerged from this study. The findings and recommendations around the key areas of information are offered below. 1. Domestic water
First, in relation to water, the survey data shows that in the surveyed areas, drinking water comes from three main sources, namely piped system, kiosks and private vendors. However, the data, while showing fairly high rates of use of improved water for drinking, conceals the challenges that the residents, and in particular vulnerable groups have to make in accessing the services, in terms of cost, adequacy and ease of access. Considering the proportion of the households currently using water from unimproved sources such as private vendors and surface water, that do not treat their water to make it safe before drinking, the results suggest that households, either have less awareness of health risks associated with consuming unsafe water, or water classified as unsafe may not necessarily be regarded as such by those using it, suggesting that the possibilities of treating water at the point of consumption (household) is not certain.
Recommendations: o In addition to increasing awareness about safe water practices, it is useful to promote increased
water “treatment-at-source” by the private and community based providers to improve the quality of water people are consuming
o Access to water can be increased by greater engagement of CBOs in water provision. The most useful starting point is to revive or rehabilitate the stalled water projects that are still viable
o For the stand-alone communal water projects, particularly borehole projects managed by WARUAs, potential financial pitfalls can prevented through water metering to monitor consumption of water and therefore ensure accountability in revenue collection
o For projects involving the use of private land, any issues with the land need to be sorted out before the project commences
o The water projects appear to experience problems relating to poor management. It is necessary to improve CBOs’ skills, both in both financial management and conflict mitigation. This will help prevent the water projects, and in particularly those that have had huge investments being derailed
C

58
o During the conception stage of a project, it is useful to addresses potential problems likely to arise from communal differences to prevent intended projects being derailed or taken over by narrow and stronger interest groups
2. Sanitation
Regarding sanitation and hygiene, the survey estimates show that a large proportion still lack access to improved sanitation. The survey findings show that the use of ordinary latrines is a common feature in the sub-counties. This situation is principally coming out in Mombasa where the use of pit latrines is particularly high, resulting in the contaminating of groundwater. In Taita Taveta, a relatively small percentage of households, but which is to be considered salient. Relative to the practices when handling child excreta, diapers or sanitary pads, the results suggest that even when access to sanitation is being improved, attitudes and toilet habits may prevent households or people from practices considered unhygienic by health standards. Poor sanitation also constitutes a potential source of a sustained disease burden. The study established that the range of diseases related to water and sanitation include diarrheal, fever, respiratory and water borne related illnesses, with the main ones being malaria, typhoid and cholera.
Recommendations: o On the account that most toilet facilities are ordinary pit latrines, and given the higher incidences
of diarrheal illnesses, it is useful to promote sanitation and hygiene practices in existing infrastructure through basic measures such as use of slab to cover pit latrines
o Promote and increase awareness about the hazards of improper disposal of baby diapers, which can be equated to open defecation
o For increased use of the existing communal pay toilet facilities, particularly those at residential areas, monthly payments that cover the household rather than pay-and-use approach may be considered. Modalities and amounts need to be worked and agreed communally to increase community buy-in
o Address the cultural-religious sensitivity issues relating to toilet sharing – between men and women, and equally between children and adults
3. Solid waste
In relation to solid waste management, it is apparent that although the methods used to collection domestic refuse are different in Mombasa and Taita Taveta Counties, both models may generally be characterized as a matter of managing end-of-pipe waste problems, primarily intended to address waste prevention and increase access to disposal sites and then discharging them. The analysis from this research shows that the residents in both counties use a range of garbage collection options, namely burning, garbage truck, rubbish pit and in-yard/compound. An examination of the reasons for using particular options shows two key motivations. For the largest portion, even among those who dispose improperly, it is interesting that the broader motivation is to maintain clean environment. With about one fifth of those who dispose improperly citing this reason, one problem can immediately be discerned; that a large number of households or people still are not aware about the potential negative implications of improper disposal on the environment. For another group, the choice of disposal method is on the basis of its convenience or ease of access. With about one quarter of those who dispose improperly citing this as their reason, these results immediately suggest issues of inadequate provision of solid waste management facilities, particularly in the rural areas, resulting in indiscriminate disposal.
Recommendations: o The roots of the problem of waste management in the Counties start at the household level, It is
necessary that the County Government, through the relevant department, set out policy direction on garbage handling for the home owners/landlords

59
o Given that a lot of garbage problems happen within the vicinity of the household compound or yard, it is useful to promote awareness of what constitutes proper and improper garbage disposal, and associated hazards of improper disposal on the environment
o Promote initiatives that involve the community in environmental protection, particularly in rural areas, to stem existing or potential problem of waste management that are likely to occur when people dispose garbage in the bush, rainwater/river gullies
o Encourage community groups to identify innovative business models that drive income generation opportunities
4. Schools
The provision of water and sanitation is a key development intervention that both Mombasa and Taita Taveta County Governments focus on. Although there are regulations concerning minimum quality standards as regards water and sanitation in schools, the results suggest that a number of schools still exhibit gaps in this regard. One major problem that schools face is insufficient services, in terms of inadequate water supply and high inadequate toilet facilities. The other problems that the schools struggle with are cost of operation and maintenance, particularly those relying on ground water sources, and the disintegration of existing infrastructure.
Recommendations: o Separate toilet facilities for younger and older pupils may be considered to address the unique
challenges that younger pupils are likely to face. This is also likely to improve the way cleanliness in the toilets are managed
o Increase pupil-toilet ratio due to free primary education underline a need for more toilet facilities o To maintain hygiene conditions of the toilets, access to water to necessary as the pour flush
become unusable when water is insufficient o Consideration should be given to installing push water taps in Integrated Schools to preventing
taps being left running and reduces wastage
5. Participation
The survey reveals that the principles of public participation in the context of devolution are yet to register on the minds of many residents. Mostly, it is lack of information that impedes participation. The other related factor is attributed to low education or high illiteracy levels. The slow progress in public participation is also linked to pessimism about the devolved governance system or officials. This is reflected in perceptions of corruption, discrimination and tribalism, and general low trust in the officials.
Recommendations: o Increase awareness about rights and opportunities for citizen participation in the governance
processes o Strengthen ability of citizens to coordinate and combine their efforts to demand for services as a
platforms for public participation o Address the lack of trust and feelings of disaffection with County Government and officials by
promoting a sense of civic duty 6. Human-wildlife conflict
Human-wildlife conflict is a serious challenge to both water supply and farming activities in a large number of areas in Taita Taveta County. Practically all incidents are linked to elephants, with minimal, if any, linked to crocodiles. The most common problems caused by wildlife are destruction of crops, destruction of water infrastructure, human death and depletion of water reservoir.
Recommendations:

60
o Include ‘elephant-friendly’ measures in water projects located in areas prone to human-wildlife conflicts, notably by providing waterholes to provide easy access to water elephants
7. Vulnerable groups
The survey identifies a number of issues impeding the ability of vulnerable groups to access services. In particular, the status of PWD and children, and to a lower extent, that of women, expectant women, PLHIV and the elderly, and the contribution of these contexts to their vulnerability are underlined. In Mombasa County, by and large, there are no specific programmes set aside by the County Government aimed at reducing vulnerability of minority groups, although support are directed to specific contexts, mainly through existing support groups. In Taita Taveta, programmes aimed at reducing vulnerability have been directed towards gender and disability, however, with no specific programmes designed at the moment to address the needs of elderly people and PLHIV.
Recommendations: o Strengthen ability of vulnerable groups or community associations representing these groups to
coordinate and combine their efforts to demand for services o Encourage establishment of self-help or community groups, as appropriate, as platforms to
improve participation of members of hidden groups, such as PLHIV
61
References Awuor, C., Orindi, V., and Adwera, A., 2008. Climate change and coastal cities: the case of Mombasa, Kenya, Environment & Urbanization, Vol 20(1): 231–242, International Institute for Environment and Development (IIED) Foeken, D (u.d.). PhysicaL resources and infrastructure https://openaccess.leidenuniv.nl/bitstream/handle/1887/4671/ASC-1241504-042.pdf?sequence=1 International Budget Partnership, u.d. Kenya Budget Analysis: Mombasa County International Budget Partnership, u.d. Kenya Budget Analysis: Taita Taveta County International Labour Organization, 2012. Global Employment Trends for Women Kenya National Bureau of Statistics, 2009. Population and Housing Census Kenya National Commission on Human Rights, 2014. The Devolution Issue, Nguzo za Haki, Issue 11 | April 2012 Mwamburi, E, 2006. Factors Affecting Access Of Water Supply In Kisauni Area, Mombasa County, Kenya, Department of Geography & Environmental Studies, Faculty of Science of the University of Nairobi Mombasa County Government: The First Mombasa County Integrated Development Plan, 2013-2017 Mombasa District Strategic Plan 2005-2010 Moraa, H., Otieno, A., and Salim, A., 2012. Water governance in Kenya: Ensuring Accessibility, Service delivery and Citizen Participation, iHub Research Munga, D. (2002). Freshwater Shortage and Groundwater Quality in Mombasa, KMFRI, Mombasa. National Environment Management Authority, 2011. Integrated Coastal Zone Management Action Plan for Kenya, 2011-2015 Nkongo, D and Chonya, C, 2009. Access to Water and Sanitation for People Living with HIV and AIDS: An Exploratory Study, WaterAid Tanzania and AMREF in Tanzania Odira, P., u.d. Challenges in Water Sanitation Services Provision in Kenya, Kenya- Situational analysis on CLTS/SLTS/ULTS
Sleap, B. 2006. Access for all: securing older people’s access to water and sanitation, 32nd WEDC International Conference, Colombo, Sri Lanka, 2006 Unicef, 2008. Message 3 ‐ Sanitation Contributes to Social Development

62
USAID, u.d. Kenya Water and Sanitation Profile Taita Taveta County Government: The First Taita Taveta County Integrated Development Plan, 2013-2017 WASH in Schools, 2014. Enabling Policy Environment for WASH in Schools Water and Sanitation Program, 2014. Country Sanitation Profiles Water and Sanitation Program, 2013. Devolution in Kenya: Opportunities and Challenges for the Water Sector http://wsp.org/sites/wsp.org/files/publications/Devolution-in-Kenya-Opportunities-and-Challenges-for-the-Water-Sector.pdf Water Resource Management Authority, 2006. The Water Resources Management Rules, 2006 Water Supply and Sanitation Collaborative Council (WSSCC), 2006. For her it’s the big issue: Putting women at the centre of water supply, sanitation and hygiene, WASH Evidence Report Water Supply and Sanitation Collaborative Council, 2013. Trends and targets: improved sanitation and drinking water coverage http://www.wsscc.org/countries/africa/kenya/trends-and-targets WHO, 2011. World report on disability Worldbank (Water and Sanitation Program), 2015. Access to Water Supply and Sanitation Improves Quality of Life for People living with HIV/AIDS. Accessed May 26, 2015 https://www.wsp.org/featuresevents/features/access-water-supply-and-sanitation-improves-quality-life-people-living-hivai Taita Taveta County Government, 2013. The First Taita Taveta County Integrated Development Plan, 2013-2017 Notes
1 Water Supply and Sanitation Collaborative Council, 2013. Trends and targets: improved sanitation and drinking water coverage 2 Kenya National Bureau of Statistics & and Society for International Development, 2013. Exploring Kenya Inequality”: Pulling Apart or Pooling Together? – Taita Taveta County 3 Water and Sanitation Program, 2014. Country Sanitation Profiles 4Taita Taveta County Government: The First Taita Taveta County Integrated Development Plan, 2013-2017 5Taita Taveta County Government: The First Taita Taveta County Integrated Development Plan, 2013-2017 6Taita Taveta County Government: The First Taita Taveta County Integrated Development Plan, 2013-2017 7Taita Taveta County Government: The First Taita Taveta County Integrated Development Plan, 2013-2017 8Taita Taveta County Government: The First Taita Taveta County Integrated Development Plan, 2013-2017 9 Foeken, D (u.d.). 10Taita Taveta County Government: The First Taita Taveta County Integrated Development Plan, 2013-2017 11 Kenya National Bureau of Statistics & and Society for International Development, 2013. Exploring Kenya Inequality”: Pulling Apart or Pooling Together? – Taita Taveta County

63
12Taita Taveta County Government: The First Taita Taveta County Integrated Development Plan, 2013-2017 13Taita Taveta County Government: The First Taita Taveta County Integrated Development Plan, 2013-2017 14 Water and Sanitation Program, 2014. Country Sanitation Profiles 15 Kenya National Bureau of Statistics & and Society for International Development, 2013. Exploring Kenya Inequality”: Pulling Apart or Pooling Together? – Taita Taveta County 16 WHO, 2011. World report on disability 17 International Budget Partnership, u.d. Kenya Budget Analysis: Taita Taveta County