Embed Size (px)
Citation preview
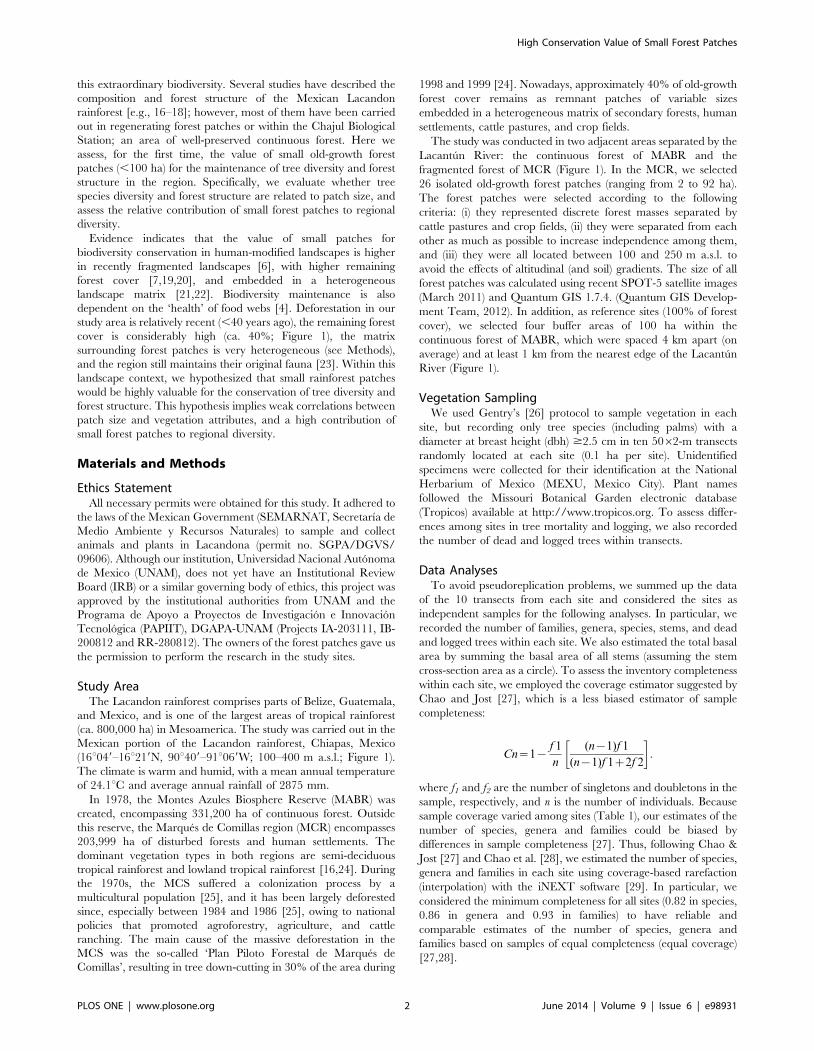
Conserving Tropical Tree Diversity and Forest Structure:The Value of Small Rainforest Patches inModerately-Managed LandscapesManuel A. Hernandez-Ruedas1, Vıctor Arroyo-Rodrıguez1*, Jorge A. Meave2, Miguel Martınez-Ramos1,
Guillermo Ibarra-Manrıquez1, Esteban Martınez3, Gilberto Jamangape4, Felipe P. L. Melo5,
Braulio A. Santos6
1 Centro de Investigaciones en Ecosistemas, Universidad Nacional Autonoma de Mexico, Morelia, Michoacan, Mexico, 2 Departamento de Ecologıa y Recursos Naturales,
Facultad de Ciencias, Universidad Nacional Autonoma de Mexico, Mexico City, Mexico, 3 Departamento de Botanica, Instituto de Biologıa, Universidad Nacional Autonoma
de Mexico, Mexico City, Mexico, 4 Ejido Loma Bonita, Ocosingo, Chiapas, Mexico, 5 Departamento de Botanica, Universidade Federal de Pernambuco, Recife, Pernambuco,
Brazil, 6 Departamento de Sistematica e Ecologia, Universidade Federal da Paraıba, Joao Pessoa, Paraıba, Brazil
Abstract
Rainforests are undergoing severe deforestation and fragmentation worldwide. A huge amount of small forest patches arebeing created, but their value in conserving biodiversity and forest structure is still controversial. Here, we demonstrate thatin a species-rich and moderately-managed Mexican tropical landscape small rainforest patches (,100 ha) can be highlyvaluable for the conservation of tree diversity and forest structure. These patches showed diverse communities of nativeplants, including endangered species, and a new record for the country. Although the number of logged trees increased insmaller patches, patch size was a poor indicator of basal area, stem density, number of species, genera and families, andcommunity evenness. Cumulative species-area curves indicated that all patches had a similar contribution to the regionalspecies diversity. This idea also was supported by the fact that patches strongly differed in floristic composition (high b-diversity), independently of patch size. Thus, in agreement with the land-sharing approach, our findings support that smallforest patches in moderately-managed landscapes should be included in conservation initiatives to maintain landscapeheterogeneity, species diversity, and ecosystem services.
Citation: Hernandez-Ruedas MA, Arroyo-Rodrıguez V, Meave JA, Martınez-Ramos M, Ibarra-Manrıquez G, et al. (2014) Conserving Tropical Tree Diversity andForest Structure: The Value of Small Rainforest Patches in Moderately-Managed Landscapes. PLoS ONE 9(6): e98931. doi:10.1371/journal.pone.0098931
Editor: Norman W.H. Mason, Landcare Research, New Zealand
Received January 27, 2014; Accepted May 8, 2014; Published June 5, 2014
Copyright: � 2014 Hernandez-Ruedas et al. This is an open-access article distributed under the terms of the Creative Commons Attribution License, whichpermits unrestricted use, distribution, and reproduction in any medium, provided the original author and source are credited.
Funding: This research was funded by the Programa de Apoyo a Proyectos de Investigacion e Innovacion Tecnologica (PAPIIT), DGAPA-UNAM (Projects IA-203111, IB-200812 and RR-280812). MAHR obtained a scholarship from the CONACyT, Mexico. The Centro de Investigaciones en Ecosistemas (UNAM) providedlogical support. H. Ferreira and A. Palencia provided technical support, and A. Navarrete provided the SPOT images. C. Dobler digitized the maps and S. Nicasio-Arzeta elaborated the Figure 1. A. Garmendia, M. San-Jose and M. Sola assisted the field work. MAHR is grateful to M.G.F. Mendes, K.M. Demetrio, U. Gonzalez-Gordillo, and their families for their support. The authors are indebted to the local people of the Marques de Comillas region. Part of this paper was written whileMAHR was on a research stay at the Departamento de Botanica, Universidade Federal de Pernambuco, and Departamento de Sistematica e Ecologia, UniversidadeFederal da Paraıba funded by the Programa de Apoyo a los Estudios de Posgrado (PAEP), UNAM, and the Programa de Becas Mixtas para Becarios CONACyTnacionales, CONACyT. The funders had no role in study design, data collection and analysis, decision to publish, or preparation of the manuscript.
Competing Interests: The authors have declared that no competing interests exist.
* E-mail: [email protected]
Introduction
Approximately 83% of earth’s land surface has been altered by
human action [1], leading to the rapid destruction and fragmen-
tation of terrestrial ecosystems. In the tropics, habitat loss and
degradation are main drivers of biodiversity loss [2], but the
effectiveness of forest patches to retain large subsets of species
diversity and forest structure is still controversial [3,4], particularly
when considering tropical plants [5,6]. For example, whereas some
studies argue that highly fragmented tropical landscapes can
maintain high levels of the original diversity [7,8], others
demonstrate that species diversity in forest patches declines rapidly
after forest fragmentation [9,10].
In particular, increasing tree mortality rates have been reported
near forest edges [9], particularly among emergent species [11,12].
This process may lead to declines in tree species richness in smaller
forest patches [10,13], particularly near forest edges [11,12].
Logging and tree mortality can also alter forest structure, as they
usually provoke the collapse of tree biomass [9]. However, under
certain circumstances (e.g., in recently fragmented landscapes with
lower deforestation levels), small and large forest patches can
maintain similar tree species diversities [7,8]. Thus, to correctly
assess the conservation value of small forest patches it is necessary
to conduct more studies, encompassing landscapes and regions
with contrasting management histories and intensities of land use.
Such studies are particularly valuable if performed within tropical
biodiversity hotspots [6,7,14].
The Mesoamerican region is among the most important tropical
biodiversity hotspots because of their high number of species and
high rates of deforestation [15]. The Lacandon rainforest
contributes greatly to the floristic diversity of Mesoamerica,
especially the Mexican portion of this forest, where ca. 3000
vascular plant species have been recorded [16]. Unfortunately, the
rapid loss and fragmentation of this forest are seriously threatening
PLOS ONE | www.plosone.org 1 June 2014 | Volume 9 | Issue 6 | e98931
this extraordinary biodiversity. Several studies have described the
composition and forest structure of the Mexican Lacandon
rainforest [e.g., 16–18]; however, most of them have been carried
out in regenerating forest patches or within the Chajul Biological
Station; an area of well-preserved continuous forest. Here we
assess, for the first time, the value of small old-growth forest
patches (,100 ha) for the maintenance of tree diversity and forest
structure in the region. Specifically, we evaluate whether tree
species diversity and forest structure are related to patch size, and
assess the relative contribution of small forest patches to regional
diversity.
Evidence indicates that the value of small patches for
biodiversity conservation in human-modified landscapes is higher
in recently fragmented landscapes [6], with higher remaining
forest cover [7,19,20], and embedded in a heterogeneous
landscape matrix [21,22]. Biodiversity maintenance is also
dependent on the ‘health’ of food webs [4]. Deforestation in our
study area is relatively recent (,40 years ago), the remaining forest
cover is considerably high (ca. 40%; Figure 1), the matrix
surrounding forest patches is very heterogeneous (see Methods),
and the region still maintains their original fauna [23]. Within this
landscape context, we hypothesized that small rainforest patches
would be highly valuable for the conservation of tree diversity and
forest structure. This hypothesis implies weak correlations between
patch size and vegetation attributes, and a high contribution of
small forest patches to regional diversity.
Materials and Methods
Ethics StatementAll necessary permits were obtained for this study. It adhered to
the laws of the Mexican Government (SEMARNAT, Secretarıa de
Medio Ambiente y Recursos Naturales) to sample and collect
animals and plants in Lacandona (permit no. SGPA/DGVS/
09606). Although our institution, Universidad Nacional Autonoma
de Mexico (UNAM), does not yet have an Institutional Review
Board (IRB) or a similar governing body of ethics, this project was
approved by the institutional authorities from UNAM and the
Programa de Apoyo a Proyectos de Investigacion e Innovacion
Tecnologica (PAPIIT), DGAPA-UNAM (Projects IA-203111, IB-
200812 and RR-280812). The owners of the forest patches gave us
the permission to perform the research in the study sites.
Study AreaThe Lacandon rainforest comprises parts of Belize, Guatemala,
and Mexico, and is one of the largest areas of tropical rainforest
(ca. 800,000 ha) in Mesoamerica. The study was carried out in the
Mexican portion of the Lacandon rainforest, Chiapas, Mexico
(16u049–16u219N, 90u409–91u069W; 100–400 m a.s.l.; Figure 1).
The climate is warm and humid, with a mean annual temperature
of 24.1uC and average annual rainfall of 2875 mm.
In 1978, the Montes Azules Biosphere Reserve (MABR) was
created, encompassing 331,200 ha of continuous forest. Outside
this reserve, the Marques de Comillas region (MCR) encompasses
203,999 ha of disturbed forests and human settlements. The
dominant vegetation types in both regions are semi-deciduous
tropical rainforest and lowland tropical rainforest [16,24]. During
the 1970s, the MCS suffered a colonization process by a
multicultural population [25], and it has been largely deforested
since, especially between 1984 and 1986 [25], owing to national
policies that promoted agroforestry, agriculture, and cattle
ranching. The main cause of the massive deforestation in the
MCS was the so-called ‘Plan Piloto Forestal de Marques de
Comillas’, resulting in tree down-cutting in 30% of the area during
1998 and 1999 [24]. Nowadays, approximately 40% of old-growth
forest cover remains as remnant patches of variable sizes
embedded in a heterogeneous matrix of secondary forests, human
settlements, cattle pastures, and crop fields.
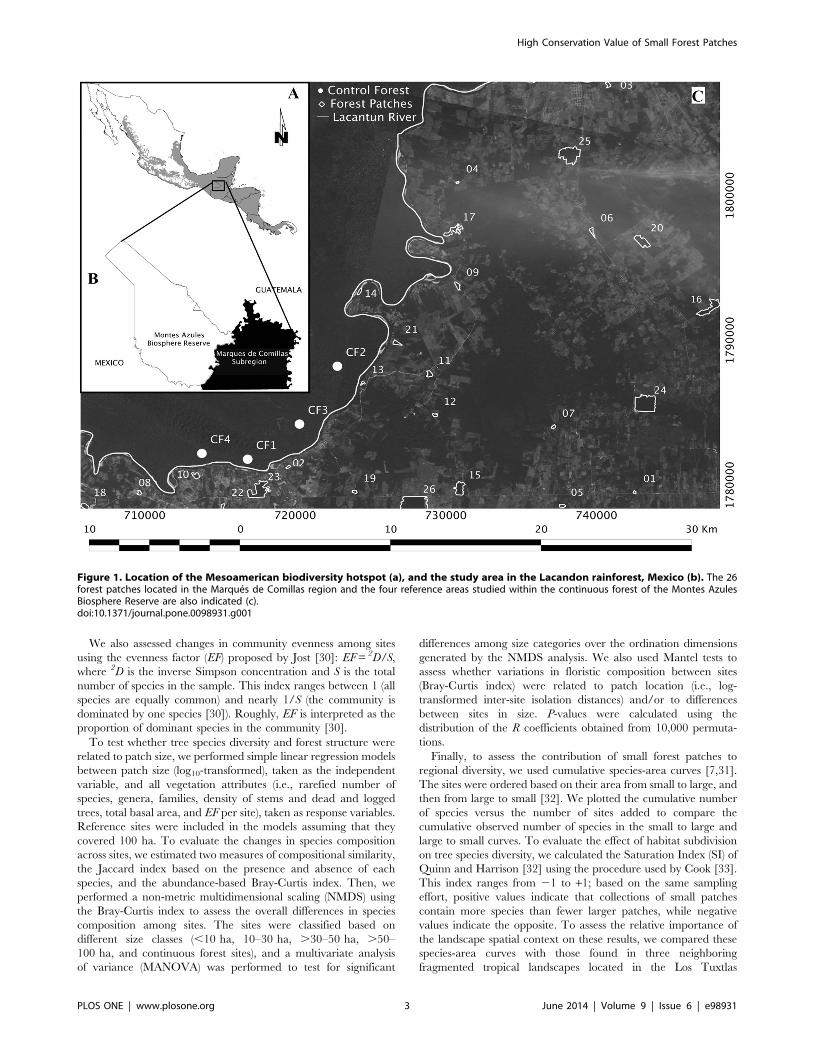
The study was conducted in two adjacent areas separated by the
Lacantun River: the continuous forest of MABR and the
fragmented forest of MCR (Figure 1). In the MCR, we selected
26 isolated old-growth forest patches (ranging from 2 to 92 ha).
The forest patches were selected according to the following
criteria: (i) they represented discrete forest masses separated by
cattle pastures and crop fields, (ii) they were separated from each
other as much as possible to increase independence among them,
and (iii) they were all located between 100 and 250 m a.s.l. to
avoid the effects of altitudinal (and soil) gradients. The size of all
forest patches was calculated using recent SPOT-5 satellite images
(March 2011) and Quantum GIS 1.7.4. (Quantum GIS Develop-
ment Team, 2012). In addition, as reference sites (100% of forest
cover), we selected four buffer areas of 100 ha within the
continuous forest of MABR, which were spaced 4 km apart (on
average) and at least 1 km from the nearest edge of the Lacantun
River (Figure 1).
Vegetation SamplingWe used Gentry’s [26] protocol to sample vegetation in each
site, but recording only tree species (including palms) with a
diameter at breast height (dbh) $2.5 cm in ten 5062-m transects
randomly located at each site (0.1 ha per site). Unidentified
specimens were collected for their identification at the National
Herbarium of Mexico (MEXU, Mexico City). Plant names
followed the Missouri Botanical Garden electronic database
(Tropicos) available at http://www.tropicos.org. To assess differ-
ences among sites in tree mortality and logging, we also recorded
the number of dead and logged trees within transects.
Data AnalysesTo avoid pseudoreplication problems, we summed up the data
of the 10 transects from each site and considered the sites as
independent samples for the following analyses. In particular, we
recorded the number of families, genera, species, stems, and dead
and logged trees within each site. We also estimated the total basal
area by summing the basal area of all stems (assuming the stem
cross-section area as a circle). To assess the inventory completeness
within each site, we employed the coverage estimator suggested by
Chao and Jost [27], which is a less biased estimator of sample
completeness:
Cn~1{f 1
n
(n{1)f 1
(n{1)f 1z2f 2
� �:
where f1 and f2 are the number of singletons and doubletons in the
sample, respectively, and n is the number of individuals. Because
sample coverage varied among sites (Table 1), our estimates of the
number of species, genera and families could be biased by
differences in sample completeness [27]. Thus, following Chao &
Jost [27] and Chao et al. [28], we estimated the number of species,
genera and families in each site using coverage-based rarefaction
(interpolation) with the iNEXT software [29]. In particular, we
considered the minimum completeness for all sites (0.82 in species,
0.86 in genera and 0.93 in families) to have reliable and
comparable estimates of the number of species, genera and
families based on samples of equal completeness (equal coverage)
[27,28].
High Conservation Value of Small Forest Patches
PLOS ONE | www.plosone.org 2 June 2014 | Volume 9 | Issue 6 | e98931
We also assessed changes in community evenness among sites
using the evenness factor (EF) proposed by Jost [30]: EF = 2D/S,
where 2D is the inverse Simpson concentration and S is the total
number of species in the sample. This index ranges between 1 (all
species are equally common) and nearly 1/S (the community is
dominated by one species [30]). Roughly, EF is interpreted as the
proportion of dominant species in the community [30].
To test whether tree species diversity and forest structure were
related to patch size, we performed simple linear regression models
between patch size (log10-transformed), taken as the independent
variable, and all vegetation attributes (i.e., rarefied number of
species, genera, families, density of stems and dead and logged
trees, total basal area, and EF per site), taken as response variables.
Reference sites were included in the models assuming that they
covered 100 ha. To evaluate the changes in species composition
across sites, we estimated two measures of compositional similarity,
the Jaccard index based on the presence and absence of each
species, and the abundance-based Bray-Curtis index. Then, we
performed a non-metric multidimensional scaling (NMDS) using
the Bray-Curtis index to assess the overall differences in species
composition among sites. The sites were classified based on
different size classes (,10 ha, 10–30 ha, .30–50 ha, .50–
100 ha, and continuous forest sites), and a multivariate analysis
of variance (MANOVA) was performed to test for significant
differences among size categories over the ordination dimensions
generated by the NMDS analysis. We also used Mantel tests to
assess whether variations in floristic composition between sites
(Bray-Curtis index) were related to patch location (i.e., log-
transformed inter-site isolation distances) and/or to differences
between sites in size. P-values were calculated using the
distribution of the R coefficients obtained from 10,000 permuta-
tions.
Finally, to assess the contribution of small forest patches to
regional diversity, we used cumulative species-area curves [7,31].
The sites were ordered based on their area from small to large, and
then from large to small [32]. We plotted the cumulative number
of species versus the number of sites added to compare the
cumulative observed number of species in the small to large and
large to small curves. To evaluate the effect of habitat subdivision
on tree species diversity, we calculated the Saturation Index (SI) of
Quinn and Harrison [32] using the procedure used by Cook [33].
This index ranges from 21 to +1; based on the same sampling
effort, positive values indicate that collections of small patches
contain more species than fewer larger patches, while negative
values indicate the opposite. To assess the relative importance of
the landscape spatial context on these results, we compared these
species-area curves with those found in three neighboring
fragmented tropical landscapes located in the Los Tuxtlas
Figure 1. Location of the Mesoamerican biodiversity hotspot (a), and the study area in the Lacandon rainforest, Mexico (b). The 26forest patches located in the Marques de Comillas region and the four reference areas studied within the continuous forest of the Montes AzulesBiosphere Reserve are also indicated (c).doi:10.1371/journal.pone.0098931.g001
High Conservation Value of Small Forest Patches
PLOS ONE | www.plosone.org 3 June 2014 | Volume 9 | Issue 6 | e98931
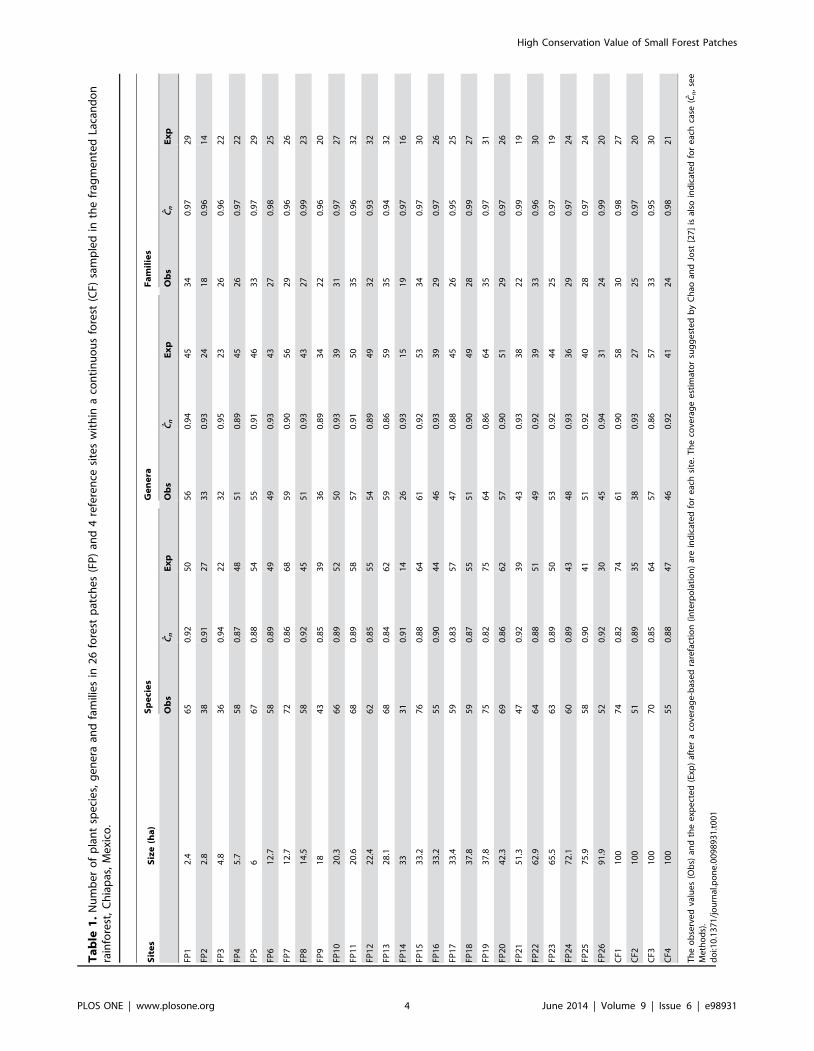
Ta
ble
1.
Nu
mb
er
of
pla
nt
spe
cie
s,g
en
era
and
fam
ilie
sin
26
fore
stp
atch
es
(FP
)an
d4
refe
ren
cesi
tes
wit
hin
aco
nti
nu
ou
sfo
rest
(CF)
sam
ple
din
the
frag
me
nte
dLa
can
do
nra
info
rest
,C
hia
pas
,M
exi
co.
Sit
es
Siz
e(h
a)
Sp
eci
es
Ge
ne
raF
am
ilie
s
Ob
sC
nE
xp
Ob
sC
nE
xp
Ob
sC
nE
xp
FP1
2.4
65
0.9
25
05
60
.94
45
34
0.9
72
9
FP2
2.8
38
0.9
12
73
30
.93
24
18
0.9
61
4
FP3
4.8
36
0.9
42
23
20
.95
23
26
0.9
62
2
FP4
5.7
58
0.8
74
85
10
.89
45
26
0.9
72
2
FP5
66
70
.88
54
55
0.9
14
63
30
.97
29
FP6
12
.75
80
.89
49
49
0.9
34
32
70
.98
25
FP7
12
.77
20
.86
68
59
0.9
05
62
90
.96
26
FP8
14
.55
80
.92
45
51
0.9
34
32
70
.99
23
FP9
18
43
0.8
53
93
60
.89
34
22
0.9
62
0
FP1
02
0.3
66
0.8
95
25
00
.93
39
31
0.9
72
7
FP1
12
0.6
68
0.8
95
85
70
.91
50
35
0.9
63
2
FP1
22
2.4
62
0.8
55
55
40
.89
49
32
0.9
33
2
FP1
32
8.1
68
0.8
46
25
90
.86
59
35
0.9
43
2
FP1
43
33
10
.91
14
26
0.9
31
51
90
.97
16
FP1
53
3.2
76
0.8
86
46
10
.92
53
34
0.9
73
0
FP1
63
3.2
55
0.9
04
44
60
.93
39
29
0.9
72
6
FP1
73
3.4
59
0.8
35
74
70
.88
45
26
0.9
52
5
FP1
83
7.8
59
0.8
75
55
10
.90
49
28
0.9
92
7
FP1
93
7.8
75
0.8
27
56
40
.86
64
35
0.9
73
1
FP2
04
2.3
69
0.8
66
25
70
.90
51
29
0.9
72
6
FP2
15
1.3
47
0.9
23
94
30
.93
38
22
0.9
91
9
FP2
26
2.9
64
0.8
85
14
90
.92
39
33
0.9
63
0
FP2
36
5.5
63
0.8
95
05
30
.92
44
25
0.9
71
9
FP2
47
2.1
60
0.8
94
34
80
.93
36
29
0.9
72
4
FP2
57
5.9
58
0.9
04
15
10
.92
40
28
0.9
72
4
FP2
69
1.9
52
0.9
23
04
50
.94
31
24
0.9
92
0
CF1
10
07
40
.82
74
61
0.9
05
83
00
.98
27
CF2
10
05
10
.89
35
38
0.9
32
72
50
.97
20
CF3
10
07
00
.85
64
57
0.8
65
73
30
.95
30
CF4
10
05
50
.88
47
46
0.9
24
12
40
.98
21
Th
eo
bse
rve
dva
lue
s(O
bs)
and
the
exp
ect
ed
(Exp
)af
ter
aco
vera
ge
-bas
ed
rare
fact
ion
(in
terp
ola
tio
n)
are
ind
icat
ed
for
eac
hsi
te.
Th
eco
vera
ge
est
imat
or
sug
ge
ste
db
yC
hao
and
Jost
[27
]is
also
ind
icat
ed
for
eac
hca
se(C
n,
see
Me
tho
ds)
.d
oi:1
0.1
37
1/j
ou
rnal
.po
ne
.00
98
93
1.t
00
1
High Conservation Value of Small Forest Patches
PLOS ONE | www.plosone.org 4 June 2014 | Volume 9 | Issue 6 | e98931
rainforest, Mexico, but with higher deforestation levels (24%, 11%
and 4% of remaining forest cover). The species-area curves in this
case were generated using the same protocol described above,
based on a vegetation data set that was collected by VAR using the
same sampling methodology and sampling effort as in the
Lacandona rainforest [7,8]. The only difference was that
Arroyo-Rodrıguez et al. [7,8] included not only trees and palms,
but also lianas. Thus, we excluded lianas from the original data set
of VAR to make the results comparable with the present study.
Results
We recorded 6222 trees from 55 families, 144 genera, and 228
species (including 24 morphospecies) in a total sampled area of 3
ha (Table S1). On average (6 SD), we recorded 2865 families,
5069 genera, and 59612 species per site (Table 1). Stem density
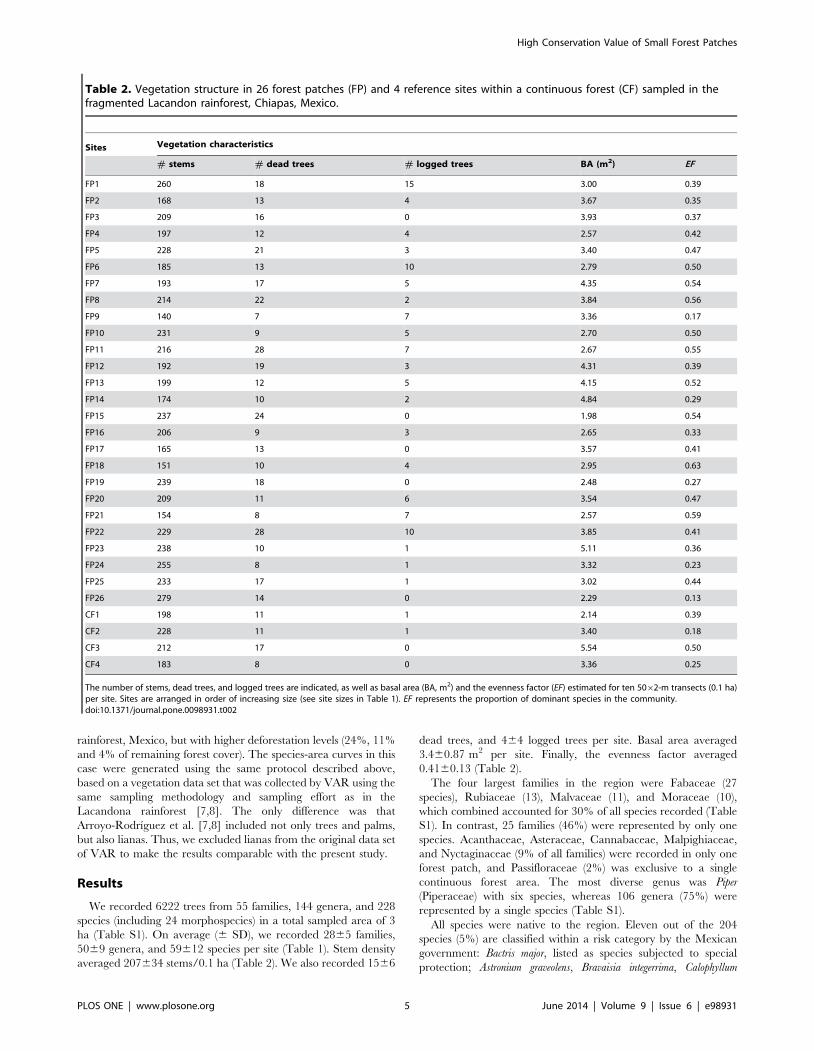
averaged 207634 stems/0.1 ha (Table 2). We also recorded 1566
dead trees, and 464 logged trees per site. Basal area averaged
3.460.87 m2 per site. Finally, the evenness factor averaged
0.4160.13 (Table 2).
The four largest families in the region were Fabaceae (27
species), Rubiaceae (13), Malvaceae (11), and Moraceae (10),
which combined accounted for 30% of all species recorded (Table
S1). In contrast, 25 families (46%) were represented by only one
species. Acanthaceae, Asteraceae, Cannabaceae, Malpighiaceae,
and Nyctaginaceae (9% of all families) were recorded in only one
forest patch, and Passifloraceae (2%) was exclusive to a single
continuous forest area. The most diverse genus was Piper
(Piperaceae) with six species, whereas 106 genera (75%) were
represented by a single species (Table S1).
All species were native to the region. Eleven out of the 204
species (5%) are classified within a risk category by the Mexican
government: Bactris major, listed as species subjected to special
protection; Astronium graveolens, Bravaisia integerrima, Calophyllum
Table 2. Vegetation structure in 26 forest patches (FP) and 4 reference sites within a continuous forest (CF) sampled in thefragmented Lacandon rainforest, Chiapas, Mexico.
Sites Vegetation characteristics
# stems # dead trees # logged trees BA (m2) EF
FP1 260 18 15 3.00 0.39
FP2 168 13 4 3.67 0.35
FP3 209 16 0 3.93 0.37
FP4 197 12 4 2.57 0.42
FP5 228 21 3 3.40 0.47
FP6 185 13 10 2.79 0.50
FP7 193 17 5 4.35 0.54
FP8 214 22 2 3.84 0.56
FP9 140 7 7 3.36 0.17
FP10 231 9 5 2.70 0.50
FP11 216 28 7 2.67 0.55
FP12 192 19 3 4.31 0.39
FP13 199 12 5 4.15 0.52
FP14 174 10 2 4.84 0.29
FP15 237 24 0 1.98 0.54
FP16 206 9 3 2.65 0.33
FP17 165 13 0 3.57 0.41
FP18 151 10 4 2.95 0.63
FP19 239 18 0 2.48 0.27
FP20 209 11 6 3.54 0.47
FP21 154 8 7 2.57 0.59
FP22 229 28 10 3.85 0.41
FP23 238 10 1 5.11 0.36
FP24 255 8 1 3.32 0.23
FP25 233 17 1 3.02 0.44
FP26 279 14 0 2.29 0.13
CF1 198 11 1 2.14 0.39
CF2 228 11 1 3.40 0.18
CF3 212 17 0 5.54 0.50
CF4 183 8 0 3.36 0.25
The number of stems, dead trees, and logged trees are indicated, as well as basal area (BA, m2) and the evenness factor (EF) estimated for ten 5062-m transects (0.1 ha)per site. Sites are arranged in order of increasing size (see site sizes in Table 1). EF represents the proportion of dominant species in the community.doi:10.1371/journal.pone.0098931.t002
High Conservation Value of Small Forest Patches
PLOS ONE | www.plosone.org 5 June 2014 | Volume 9 | Issue 6 | e98931
brasiliense, Cryosophila stauracantha, Geonoma interrupta, Guatteria anom-
ala, Magnolia mexicana, and Spondias radlkoferi, listed as threatened
species; and Ormosia isthmensis and Vatairea lundellii, listed as
endangered species (Table S1). All these species were recorded
in forest patches (Table S1). Furthermore, we reported for the first
time the occurrence of Ouratea crassinervia Engl. (Ochnaceae) for the
Mexican flora (see online Appendix S1). This species was recorded
in two areas within the continuous forest and in two forest patches
(Table S1).
Analyzing the full set of sites (n = 30), there were no significant
relationships between patch size and vegetation attributes: rarefied
number of families (R2 = 0.002, P = 0.80), genera (R2 = 0.022,
P = 0.43), and species (R2 = 0.034, P = 0.33), density of stems
(R2 = 0.016, P = 0.50) and dead trees (R2 = 0.041, P = 0.28), basal
area (R2 = 0.001, P = 0.91) and evenness factor (R2 = 0.045,
P = 0.26). Only the density of logged trees was negatively
correlated with patch size (R2 = 0.207, P = 0.01). Based on the
presence and absence of species within the sites (Jaccard index), we
found that on average they shared 2769% species, indicating a
high species turnover among sites. Considering the abundance of
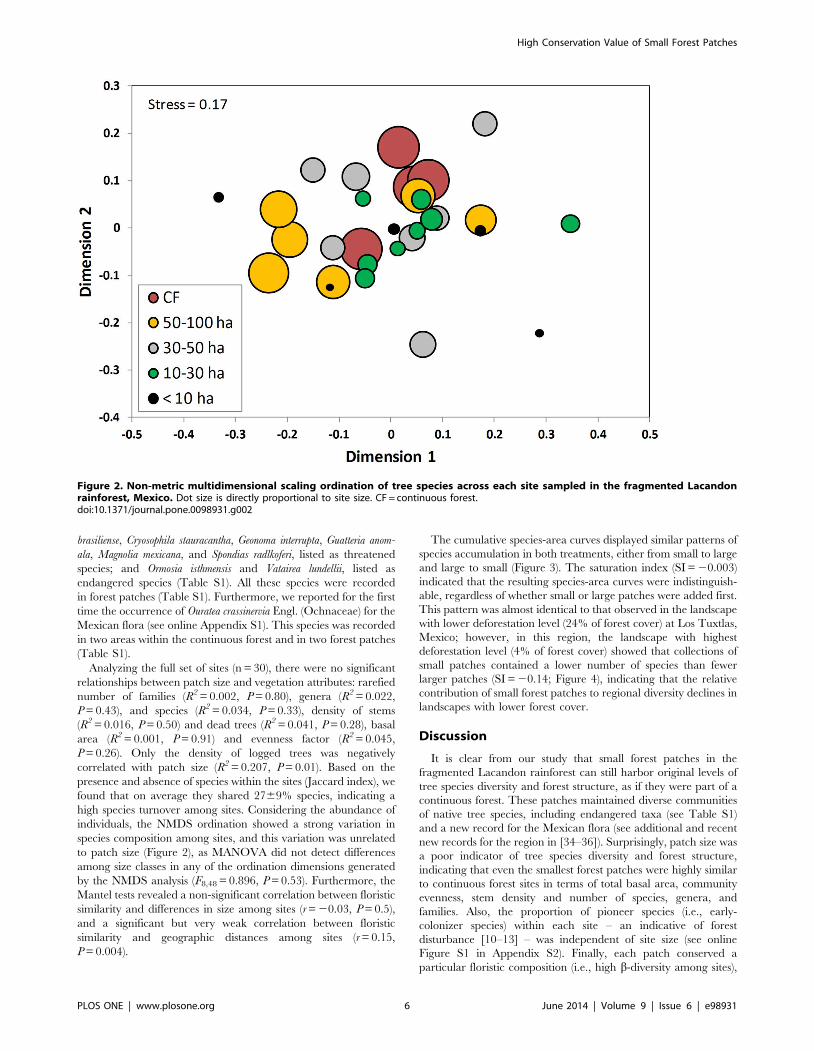
individuals, the NMDS ordination showed a strong variation in
species composition among sites, and this variation was unrelated
to patch size (Figure 2), as MANOVA did not detect differences
among size classes in any of the ordination dimensions generated
by the NMDS analysis (F8,48 = 0.896, P = 0.53). Furthermore, the
Mantel tests revealed a non-significant correlation between floristic
similarity and differences in size among sites (r = 20.03, P = 0.5),
and a significant but very weak correlation between floristic
similarity and geographic distances among sites (r = 0.15,
P = 0.004).
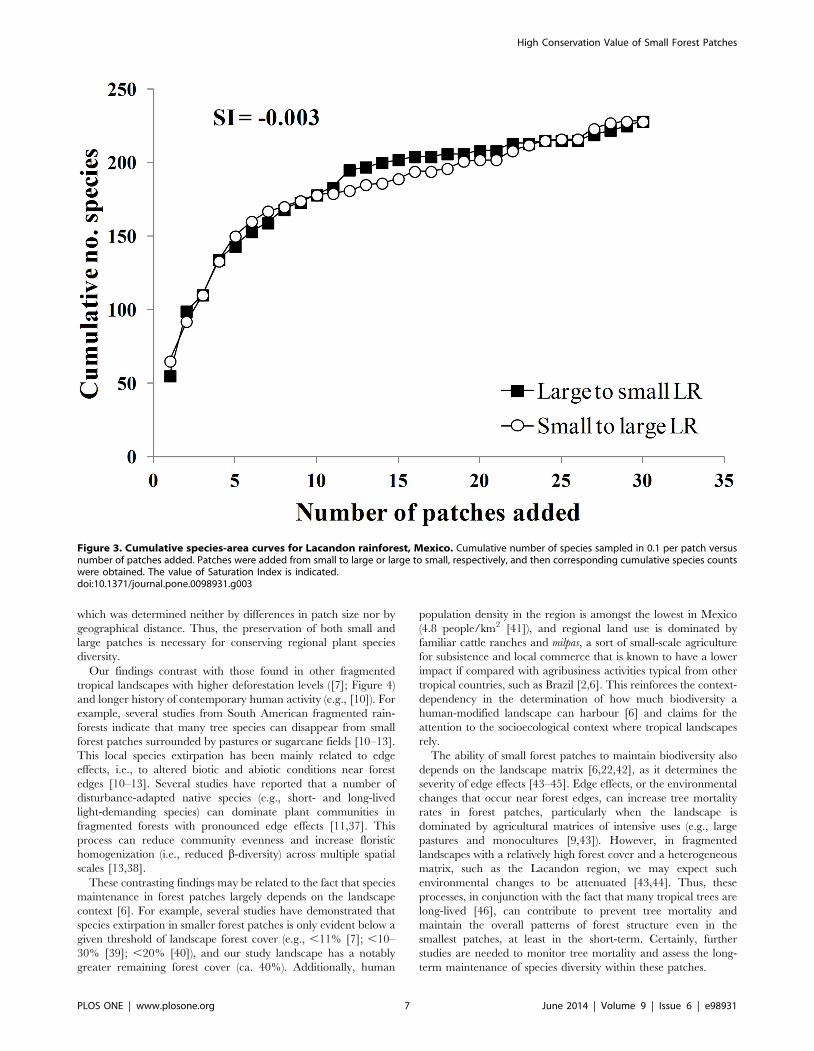
The cumulative species-area curves displayed similar patterns of
species accumulation in both treatments, either from small to large
and large to small (Figure 3). The saturation index (SI = 20.003)
indicated that the resulting species-area curves were indistinguish-
able, regardless of whether small or large patches were added first.
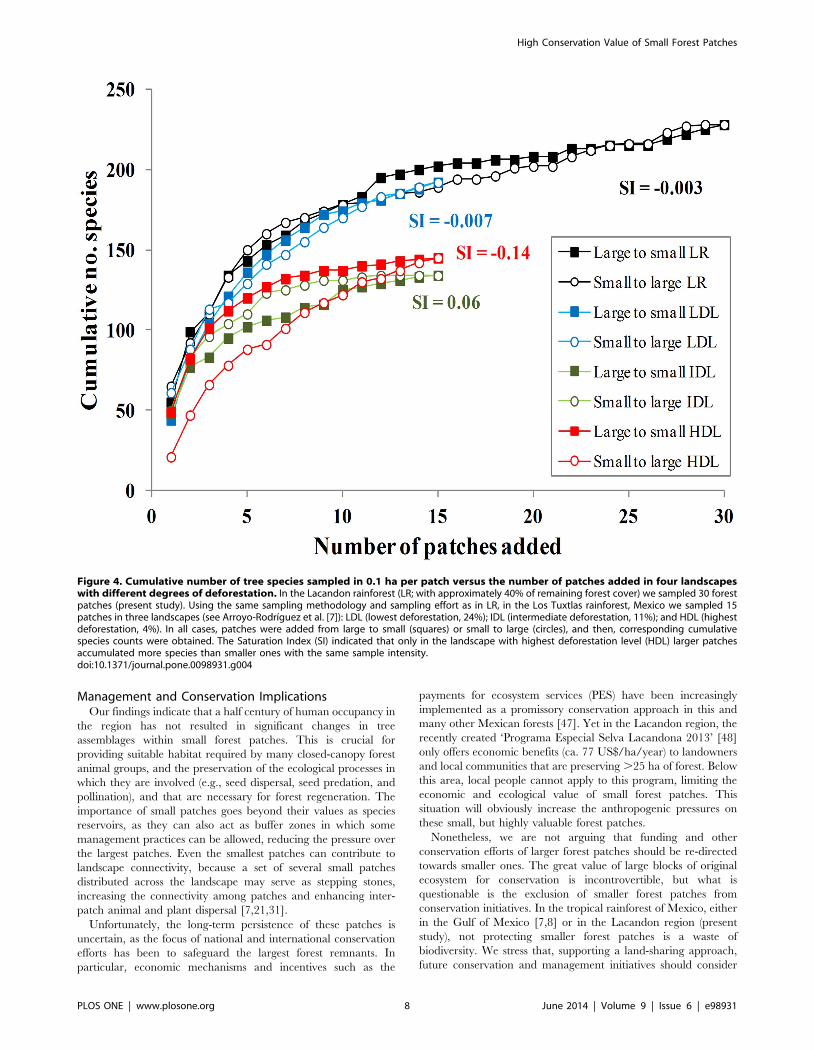
This pattern was almost identical to that observed in the landscape
with lower deforestation level (24% of forest cover) at Los Tuxtlas,
Mexico; however, in this region, the landscape with highest
deforestation level (4% of forest cover) showed that collections of
small patches contained a lower number of species than fewer
larger patches (SI = 20.14; Figure 4), indicating that the relative
contribution of small forest patches to regional diversity declines in
landscapes with lower forest cover.
Discussion
It is clear from our study that small forest patches in the
fragmented Lacandon rainforest can still harbor original levels of
tree species diversity and forest structure, as if they were part of a
continuous forest. These patches maintained diverse communities
of native tree species, including endangered taxa (see Table S1)
and a new record for the Mexican flora (see additional and recent
new records for the region in [34–36]). Surprisingly, patch size was
a poor indicator of tree species diversity and forest structure,
indicating that even the smallest forest patches were highly similar
to continuous forest sites in terms of total basal area, community
evenness, stem density and number of species, genera, and
families. Also, the proportion of pioneer species (i.e., early-
colonizer species) within each site – an indicative of forest
disturbance [10–13] – was independent of site size (see online
Figure S1 in Appendix S2). Finally, each patch conserved a
particular floristic composition (i.e., high b-diversity among sites),
Figure 2. Non-metric multidimensional scaling ordination of tree species across each site sampled in the fragmented Lacandonrainforest, Mexico. Dot size is directly proportional to site size. CF = continuous forest.doi:10.1371/journal.pone.0098931.g002
High Conservation Value of Small Forest Patches
PLOS ONE | www.plosone.org 6 June 2014 | Volume 9 | Issue 6 | e98931
which was determined neither by differences in patch size nor by
geographical distance. Thus, the preservation of both small and
large patches is necessary for conserving regional plant species
diversity.
Our findings contrast with those found in other fragmented
tropical landscapes with higher deforestation levels ([7]; Figure 4)
and longer history of contemporary human activity (e.g., [10]). For
example, several studies from South American fragmented rain-
forests indicate that many tree species can disappear from small
forest patches surrounded by pastures or sugarcane fields [10–13].
This local species extirpation has been mainly related to edge
effects, i.e., to altered biotic and abiotic conditions near forest
edges [10–13]. Several studies have reported that a number of
disturbance-adapted native species (e.g., short- and long-lived
light-demanding species) can dominate plant communities in
fragmented forests with pronounced edge effects [11,37]. This
process can reduce community evenness and increase floristic
homogenization (i.e., reduced b-diversity) across multiple spatial
scales [13,38].
These contrasting findings may be related to the fact that species
maintenance in forest patches largely depends on the landscape
context [6]. For example, several studies have demonstrated that
species extirpation in smaller forest patches is only evident below a
given threshold of landscape forest cover (e.g., ,11% [7]; ,10–
30% [39]; ,20% [40]), and our study landscape has a notably
greater remaining forest cover (ca. 40%). Additionally, human
population density in the region is amongst the lowest in Mexico
(4.8 people/km2 [41]), and regional land use is dominated by
familiar cattle ranches and milpas, a sort of small-scale agriculture
for subsistence and local commerce that is known to have a lower
impact if compared with agribusiness activities typical from other
tropical countries, such as Brazil [2,6]. This reinforces the context-
dependency in the determination of how much biodiversity a
human-modified landscape can harbour [6] and claims for the
attention to the socioecological context where tropical landscapes
rely.
The ability of small forest patches to maintain biodiversity also
depends on the landscape matrix [6,22,42], as it determines the
severity of edge effects [43–45]. Edge effects, or the environmental
changes that occur near forest edges, can increase tree mortality
rates in forest patches, particularly when the landscape is
dominated by agricultural matrices of intensive uses (e.g., large
pastures and monocultures [9,43]). However, in fragmented
landscapes with a relatively high forest cover and a heterogeneous
matrix, such as the Lacandon region, we may expect such
environmental changes to be attenuated [43,44]. Thus, these
processes, in conjunction with the fact that many tropical trees are
long-lived [46], can contribute to prevent tree mortality and
maintain the overall patterns of forest structure even in the
smallest patches, at least in the short-term. Certainly, further
studies are needed to monitor tree mortality and assess the long-
term maintenance of species diversity within these patches.
Figure 3. Cumulative species-area curves for Lacandon rainforest, Mexico. Cumulative number of species sampled in 0.1 per patch versusnumber of patches added. Patches were added from small to large or large to small, respectively, and then corresponding cumulative species countswere obtained. The value of Saturation Index is indicated.doi:10.1371/journal.pone.0098931.g003
High Conservation Value of Small Forest Patches
PLOS ONE | www.plosone.org 7 June 2014 | Volume 9 | Issue 6 | e98931
Management and Conservation ImplicationsOur findings indicate that a half century of human occupancy in
the region has not resulted in significant changes in tree
assemblages within small forest patches. This is crucial for
providing suitable habitat required by many closed-canopy forest
animal groups, and the preservation of the ecological processes in
which they are involved (e.g., seed dispersal, seed predation, and
pollination), and that are necessary for forest regeneration. The
importance of small patches goes beyond their values as species
reservoirs, as they can also act as buffer zones in which some
management practices can be allowed, reducing the pressure over
the largest patches. Even the smallest patches can contribute to
landscape connectivity, because a set of several small patches
distributed across the landscape may serve as stepping stones,
increasing the connectivity among patches and enhancing inter-
patch animal and plant dispersal [7,21,31].
Unfortunately, the long-term persistence of these patches is
uncertain, as the focus of national and international conservation
efforts has been to safeguard the largest forest remnants. In
particular, economic mechanisms and incentives such as the
payments for ecosystem services (PES) have been increasingly
implemented as a promissory conservation approach in this and
many other Mexican forests [47]. Yet in the Lacandon region, the
recently created ‘Programa Especial Selva Lacandona 2013’ [48]
only offers economic benefits (ca. 77 US$/ha/year) to landowners
and local communities that are preserving .25 ha of forest. Below
this area, local people cannot apply to this program, limiting the
economic and ecological value of small forest patches. This
situation will obviously increase the anthropogenic pressures on
these small, but highly valuable forest patches.
Nonetheless, we are not arguing that funding and other
conservation efforts of larger forest patches should be re-directed
towards smaller ones. The great value of large blocks of original
ecosystem for conservation is incontrovertible, but what is
questionable is the exclusion of smaller forest patches from
conservation initiatives. In the tropical rainforest of Mexico, either
in the Gulf of Mexico [7,8] or in the Lacandon region (present
study), not protecting smaller forest patches is a waste of
biodiversity. We stress that, supporting a land-sharing approach,
future conservation and management initiatives should consider
Figure 4. Cumulative number of tree species sampled in 0.1 ha per patch versus the number of patches added in four landscapeswith different degrees of deforestation. In the Lacandon rainforest (LR; with approximately 40% of remaining forest cover) we sampled 30 forestpatches (present study). Using the same sampling methodology and sampling effort as in LR, in the Los Tuxtlas rainforest, Mexico we sampled 15patches in three landscapes (see Arroyo-Rodrıguez et al. [7]): LDL (lowest deforestation, 24%); IDL (intermediate deforestation, 11%); and HDL (highestdeforestation, 4%). In all cases, patches were added from large to small (squares) or small to large (circles), and then, corresponding cumulativespecies counts were obtained. The Saturation Index (SI) indicated that only in the landscape with highest deforestation level (HDL) larger patchesaccumulated more species than smaller ones with the same sample intensity.doi:10.1371/journal.pone.0098931.g004
High Conservation Value of Small Forest Patches
PLOS ONE | www.plosone.org 8 June 2014 | Volume 9 | Issue 6 | e98931
the importance of protecting both small- and large-sized forest
patches.
Supporting Information
Table S1 Check list of the tree species recorded in 26forest patches and 4 reference sites within a continuousforest located in the Lacandon rainforest, Chiapas,Mexico.(DOCX)
Appendix S1 Novelty for the Lacandon rainforest flora,Chiapas, Mexico.(DOCX)
Appendix S2 Proportion of pioneer (i.e., early-coloniz-er) and persistent (i.e., late-successional and old-growthforest) plant species within different-sized forest patch-es and continuous forest sites in the Lacandon rain-forest, Mexico.(DOCX)
Acknowledgments
The Centro de Investigaciones en Ecosistemas (UNAM) provided logical
support. H. Ferreira, A. Valencia and A. Lopez provided technical support,
and A. Navarrete provided the SPOT images. C. Dobler digitized the
maps and S. Nicasio-Arzeta elaborated the Figure 1. A. Garmendia, M.
San-Jose and M. Sola assisted the field work. MAHR is grateful to M.G.F.
Mendes, K.M. Demetrio, U. Gonzalez-Gordillo, and their families for their
support. We are indebted to the local people of the Marques de Comillas
region. Part of this paper was written while MAHR was on a research stay
at the Departamento de Botanica, Universidade Federal de Pernambuco,
and Departamento de Sistematica e Ecologia, Universidade Federal da
Paraıba.
Author Contributions
Conceived and designed the experiments: VAR MAHR JAM MMR.
Performed the experiments: MAHR GJ GIM EM. Analyzed the data:
MAHR VAR. Contributed reagents/materials/analysis tools: VAR
MAHR JAM MMR EM FPLM BAS. Wrote the paper: MAHR VAR
JAM MMR EM BAS FPLM GIM. Plant species identification: MAHR
GIM EM.
References
1. Sanderson EW, Jaiteh M, Levy MA, Redford KH, Wannebo AV, et al. (2002)
The human footprint and the last of the wild. Bioscience 52: 891–904.
2. Laurance WF, Sayer J, Cassman KG (2014) Agricultural expansion and its
impacts on tropical nature. Trends Ecol Evol 29: 107–116.
3. Lindenmayer D, Hobbs RJ, Montague-Drake R, Alexandra J, Bennett A, et al.
(2008) A checklist for ecological management of landscapes for conservation.
Ecol Lett 11: 78–91.
4. Gardner TA, Barlow J, Chazdon R, Ewers RM, Harvey CA, et al. (2009)
Prospects for tropical forest biodiversity in a human-modified world. Ecol Lett
12: 561–582.
5. Chazdon RL, Harvey CA, Komar O, Griffith DM, Ferguson BG, et al. (2009)
Beyond reserves: a research agenda for conserving biodiversity in human-
modified tropical landscapes. Biotropica 41: 142–153.
6. Melo FPL, Arroyo-Rodrıguez V, Fahrig L, Martınez-Ramos M, Tabarelli M
(2013) On the hope for biodiversity-friendly tropical landscapes. Trends Ecol
Evol 28: 461–468.
7. Arroyo-Rodrıguez V, Pineda E, Escobar F, Benıtez-Malvido J (2009) Value of
small patches in the conservation of plant-species diversity in highly fragmented
rainforest. Conserv Biol 23: 729–739.
8. Arroyo-Rodrıguez V, Cavender-Bares J, Escobar F, Melo FPL, Tabarelli M,
et al. (2012) Maintenance of tree phylogenetic diversity in a highly fragmented
rain forest. J Ecol 100: 702–711.
9. Laurance WF, Delamonica P, Laurance SG, Vasconcelos HL, Lovejoy TE
(2000) Rainforest fragmentation kills big trees. Nature 404: 836.
10. Silva JMC, Tabarelli M (2000) Tree species impoverishment and the future flora
of the Atlantic forest of northeast Brazil. Nature 404: 72–74.
11. Laurance WF, Nascimento HEM, Laurance SG, Andrade A, Ribeiro JELS,
et al. (2006) Rapid decay of tree-community composition in Amazonian forest
fragments. Proc Natl Acad Sci USA 103: 19010–19014.
12. Santos BA, Peres CA, Oliveira MA, Grillo A, Alves-Costa CP, et al. (2008)
Drastic erosion in functional attributes of tree assemblages in Atlantic forest
fragments of northeastern Brazil. Biol Conserv 141: 249–260.
13. Tabarelli M, Peres CA, Melo FPL (2012) The ‘few winners and many losers’
paradigm revisited: emerging prospects for tropical forest biodiversity. Biol
Conserv 155: 136–140.
14. Turner IM, Corlett RT (1996) The conservation value of small, isolated
fragments of lowland tropical rain forest. Trends Ecol Evol 11: 330–333.
15. Myers N, Mittermeier RA, Mittermeier CG, da Fonseca GAB, Kent J (2000)
Biodiversity hotspots for conservation priorities. Nature 403: 853–858.
16. Martınez E, Ramos CH, Chiang F (1994) Lista florıstica de la Lacandona,
Chiapas. Bol Soc Bot Mex 54: 99–177.
17. Ibarra-Manrıquez G, Martınez-Ramos M (2002) Landscape variation of liana
communities in a Neotropical rain forest. Plant Ecol 160: 91–112.
18. van Breugel M, Martınez-Ramos M, Bongers F (2006) Community dynamics
during early secondary succession in Mexican tropical rain forests. J Trop Ecol
22: 663–674.
19. Fahrig L (2003) Effects of habitat fragmentation on biodiversity. Annu Rev Ecol
Evol Syst 34: 487–515.
20. Pardini R, Bueno AA, Gardner TA, Prado PI, Metzger JP (2010) Beyond the
fragmentation threshold hypothesis: regime shifts in biodiversity across
fragmented landscapes. PLoS ONE 5: e13666.
21. Ewers RM, Didham RK (2006) Confounding factors in the detection of species
responses to habitat fragmentation. Biol Rev 81: 117–142.
22. Fahrig L, Baudry J, Brotons L, Burel FG, Crist TO, et al. (2011) Functional
landscape heterogeneity and animal biodiversity in agricultural landscapes. EcolLett 14: 101–112.
23. Garmendia A, Arroyo-Rodrıguez V, Estrada A, Naranjo E, Stoner KE (2013)Landscape and patch attributes impacting medium- and large-sized terrestrial
mammals in a fragmented rain forest. J Trop Ecol 29: 331–344.
24. Martınez E (2003) Marquez de Comillas. In: Lichtinger V, Enkerlin E, EnrıquezC, Garcıa P, editors. La Deforestacion en 24 Regiones PRODERS. Mexico
City: Secretarıa de Medio Ambiente y Recursos Naturales, 124–131.
25. Aguilar LF, Mora CS (1992) Colonizacion y deterioro de la selva Lacandona.
Rev Geogr 116: 67–84.
26. Gentry AH (1982) Patterns of Neotropical plant species diversity. In: Hecht MK,Wallace B, Prance GT, editors. Evolutionary Biology. New York: Plenum Press,
1–84.
27. Chao A, Jost L (2012) Coverage-based rarefaction and extrapolation:standardizing samples by completeness rather than size. Ecology 93: 2533–2547.
28. Chao A, Gotelli NJ, Hsieh TC, Sander EL, Ma KH, et al. (2014) Rarefactionand extrapolation with Hill numbers: a framework for sampling and estimation
in species diversity studies. Ecol Monogr (doi:10.1890/13-0133.1).
29. Hsieh TC, Ma KH, Chao A (2013) iNEXT online: interpolation andextrapolation (Version 1.3.0) Software. Available: http://chao.stat.nthu.edu.
tw/blog/software-download/.
30. Jost L (2010) The relation between evenness and diversity. Diversity 2: 207–232.
31. Fischer J, Lindenmayer DB (2002) Small patches can be valuable for biodiversity
conservation: two case studies on birds in southeastern Australia. Biol Conserv106: 129–136.
32. Quinn JF, Harrison SP (1988) Effects of habitat fragmentation and isolation on
species richness: evidence from biogeographic patterns. Oecologia 75: 132–140.
33. Cook RR (1995) The relationship between nested subsets, habitat subdivision,
and species diversity. Oecologia 101: 204–210.
34. Ibarra-Manrıquez G, Cornejo-Tenorio G, Gonzalez-Castaneda N, Piedra-Malagon EM, Luna A (2012) El genero Ficus L. (Moraceae) en Mexico. Bot Sci
90: 389–452.
35. Santos BA, Lombera R, Benıtez-Malvido J (2009) New records of Heliconia
(Heliconiaceae) for the region of Chajul, Southern Mexico, and their potential
use in biodiversity-friendly cropping systems. Rev Mex Biodivers 80: 857–860.
36. Schutzman B, Vovides AP (1998) A new Zamia (Zamiaceae, Cycadales) from
Eastern Chiapas, Mexico. Novon 8: 441–446.
37. Santos GGA, Santos BA, Nascimento HEM, Tabarelli M (2012) Contrastingdemographic structure of short- and long-lived pioneer tree species on
Amazonian forest edges. Biotropica 44: 771–778.
38. Lobo D, Leao T, Melo FPL, Santos AMM, Tabarelli M (2011) Forest
fragmentation drives Atlantic forest of northeastern Brazil to biotic homogeni-zation. Divers Distrib 17: 287–296.
39. Andren H (1994) Effects of habitat fragmentation on birds and mammals in
landscapes with different proportions of suitable habitat: a review. Oikos 71:355–366.
40. Fahrig L (1998) When does fragmentation of breeding habitat affect population
survival? Ecol Model 105: 273–292.
41. SEDESOL (2014) Secretarıa de Desarrollo Social. Microrregiones-Catalogo de
localidades. Available: http://www.microrregiones.gob.mx/catloc/LocdeMun.aspx?tipo = clave&campo = loc&ent = 07&mun = 116 Accessed 10 January
2014.
42. Perfecto I, Vandermeer J. Wright A (2009) Nature’s matrix: linking agriculture,conservation and food sovereignty. London: Earthscan.
High Conservation Value of Small Forest Patches
PLOS ONE | www.plosone.org 9 June 2014 | Volume 9 | Issue 6 | e98931
43. Mesquita R, Delamonica P, Laurance WF (1999) Effects of surrounding
vegetation on edge-related tree mortality in Amazonian forest fragments. BiolConserv 91: 129–134.
44. Murcia C (1995) Edge effects in fragmented forests: implications for
conservation. Trends Ecol Evol 10: 58–62.45. Pinto SRR, Mendes G, Santos AMM, Dantas M, Tabarelli M, et al. (2010)
Landscape attributes drive complex spatial microclimate configuration ofBrazilian Atlantic forest fragments. Trop Conserv Sci 3: 399–402.
46. Martınez-Ramos M, Alvarez-Buylla ER (1998) How old are tropical rain forest
trees? Trends Plant Sci 3: 400–405.47. CONAFOR (2010) Coordinacion General de Produccion y Productividad.
Gerencia de Servicios Ambientales del Bosque. Mexico City: Comision Nacional
Forestal.48. CONAFOR (2013). Programa Especial Selva Lacandona 2013. Coordinacion
General de Produccion y Productividad. Gerencia de Servicios Ambientales delBosque. Mexico City: Comision Nacional Forestal.
High Conservation Value of Small Forest Patches
PLOS ONE | www.plosone.org 10 June 2014 | Volume 9 | Issue 6 | e98931