Embed Size (px)
Citation preview

2
Table of Contents
Introduction ......................................................................................... 4
Browser Requirements and Troubleshooting ............................................. 5
The User Interface ................................................................................ 5
Moving Around on the Map.................................................................. 6
Displaying Layers and the Map Legend ................................................. 7
Report, About, and Help Links ................................................................ 8
Report .............................................................................................. 8
About ............................................................................................... 9
Help ............................................................................................... 10
The Sidebar – Getting Information for User-Selected Ungaged Sites ......... 10
Select a State/Region ....................................................................... 10
Identify a Study Area and Delineate a Basin ........................................ 12
Editing a Basin ................................................................................ 14
State/Region Specific Functions ......................................................... 15
Select Scenarios .............................................................................. 17
Build a Report ................................................................................. 17
Reports for User-Selected Ungaged Sites ............................................... 18
Basin Characteristics Tables .............................................................. 19
Scenario Tables ............................................................................... 20 Parameters ................................................................................... 21
Statistics ...................................................................................... 21
Limitations and Error Indicators for Estimated Statistics ..................... 22
Estimates for Sites with Basins in Multiple Hydrologic Regions within a State ........................................................................................... 23
Estimates for Sites with Basins in Multiple States .............................. 25
Exploration Tools ............................................................................. 26 Measure Tool ................................................................................ 26
Elevation Profile Tool ..................................................................... 27
Show Your Location ....................................................................... 28

3
Getting Information for Streamgages ................................................. 28
Getting Information for Streamgages .................................................... 29
Descriptive Information Tables: ......................................................... 29
Basin Characteristics Tables: ............................................................. 31
Streamflow Statistics Tables: ............................................................ 32
Citations Tables: .............................................................................. 35

4
Introduction
The StreamStats home page can be accessed at:
https://streamstats.usgs.gov
The top of the home page provides an image of the StreamStats user interface with a button imposed on it for accessing the application. A button to the left of the screen image provides a link to the StreamStats Twitter
feed . The Twitter feed provides announcements of changes in the status of StreamStats and occasional interesting related items. Below the screen image is a brief description of the application, followed by a row of buttons (not visible in the above image) with links to news items, documentation, web services, a batch tool, and help. Below the links are notes about web browser compatibility and warnings and disclaimers about use of StreamStats, which should be read before attempting to use the application.

5
Browser Requirements and Troubleshooting StreamStats works within Web browser software on personal computers and mobile devices, and is best viewed using the latest versions of Internet Explorer, Microsoft Edge, Chrome, or Firefox. The browser must allow HTML5 asynchronous script execution.
The User Interface
StreamStats version 4 provides a single national user interface, shown above, through which the application for any implemented state or region can be accessed. The two main areas on the user interface are the Map Frame and the Sidebar. Also, in the black banner above the map are the Report, About, and Help links, which are explained below.
NOTE: Users should always wait until processing is completed and the map is re-drawn before attempting to do additional work with StreamStats. In addition, please help us conserve our server system resources and close the Interactive Map window when you are finished using it. Doing so will help ensure system availability for all users. Thank you.
Map Frame Sidebar
Exploration Tools Layers
Zoom In/Out

6
The Map Frame, forming the major part on the user interface, displays base maps and additional map layers, such as streamgage locations. The map is used primarily to locate places of interest and get information. Initially, the map is focused on North America.
Within the Map Frame are buttons for changing the scale of the map (zooming in and out), viewing the map legend and selecting map layers, and accessing the Exploration Tools, which are discussed in the Exploration Tools section.
The Sidebar, to the left of the Map Frame, presents a series of banners that will open like an accordion when the banner is selected to expose a panel with instructions in a gray box just below the banner and tool buttons below the instructions. The active banner will appear in dark blue. Inactive banners appear in light gray. The provided instructions guide the user through the steps necessary to delineate a basin, calculate basin characteristics, and compute flow statistics and other scenarios. In some cases, the banners will allow users to complete custom functions for a specific state or region.
Moving Around on the Map
The map is set initially for panning, meaning moving the center of the map while remaining at the same scale. Panning is accomplished by clicking on a point on the map, holding down on the mouse button, moving the cursor to another location, and then releasing the button. Alternately, on a touch screen or mobile device, users can pan by touching a point on the map, maintaining contact with the screen while moving their finger to a new location, and then releasing it. Zooming in, meaning changing the map to a larger scale, can be accomplished by the following methods:
• If your mouse has a scroll wheel, then turn the wheel upward (away from your body) to zoom in or downward to zoom out.
• Click on the plus and minus buttons at the top left of the map to zoom in and zoom out .
• Hold down the shift key on your keyboard and then draw a box by clicking at the location of a corner of where you want the box to be, holding down the mouse button while moving the mouse to the opposite corner of where you want the box to be, and then releasing the mouse button.
• On a touch screen or mobile device, use a pinching action to zoom out by touching the screen at two locations and then moving your fingers together to zoom in or moving them apart to zoom in.
• A location search option also is available, and is explained below.

7
Toward the bottom left of the Map Frame is a white text box that displays the current zoom level (between 1 and 20), the map scale ratio, and the latitude and longitude of the location at which the user’s cursor is pointing on the map. Initially, the map appears at zoom level 4. Below the
text box is a scale bar, which indicates the length that is shown on the map for a given distance. As you zoom in and out, the displayed zoom level and map scale will change accordingly.
Displaying Layers and the Map Legend
The Layers pane at the top right of the map is initially open to show the Base Maps and National Layers banners. Clicking on the X at the right of the black Layers banner will
close the pane and replace it with a small icon ( ). Clicking on the icon will cause the pane to reopen.
The Base Maps and National Layers banners have down arrowheads (∨) at the right side of each banner, and state-specific map layers. The state-specific map layers banner will appear only after the map is zoomed into at least zoom level 8 and a state is selected. The state-specific banner will be labeled as XX Map Layers, where XX is the 2-letter postal abbreviation for the selected state. A down arrowhead (∨) is at the right side of each banner.
Clicking anywhere on the Base Maps banner will cause it to turn blue and a list of available base map options will appear below it, with radio buttons to the left of each listed layer to allow selection of the base map to be displayed. Clicking again on the Base Maps banner will turn it gray again and the list of base maps will disappear.
Some layers do not appear in the map until it is zoomed into a minimum scale. For example, the streamgages will not appear until zoomed into zoom level 9, and the stream grid used to select points for delineating basin boundaries will not appear until zoomed into zoom level 15.
The National Layers banner has a check box on the left side and a down arrowhead (∨) at the right side of the banner. By default, the check box is checked, indicating that the nationally available layers will be displayed on the map when it is at zoom level 9 or greater. Clicking anywhere on the banner except on the down arrowhead (∨) at the right side of it will remove the check from the check box and disable the display of the national layers. Clicking on the down arrowhead will turn the banner blue and expose a

8
panel showing the layers that are available nationally and the symbols used on the map to display them. Clicking on the up arrowhead will collapse the list and turn the banner back to gray.
Each state and region has layers that are specific to the operation of the state’s or region’s application. These layers cannot be displayed until the state or region is selected in the Sidebar at a minimum of zoom level 8. After the state or region is selected, a banner for controlling the display of the layers that are available specifically that state is added to the Layers pane. The panel for a state will be named XX Map Layers, where XX is the 2-letter postal code for the selected state. The panel for a region, typically a river basin, will be named XXX Map Layers, where XXX is the first letter of the river basin name. For example, if the user selects Colorado, then the panel will be named CO Map Layers. This panel operates in the same manner as the National Layers panel. Each state and region has at least the StreamGrid and ExcludePolys layers available, but other layers may be
available. ExcludePolys appear as hatched areas ( ) on the map. Functionality is limited in these areas. Warnings are provided in pop-ups on the map to explain the limitations when attempting to accomplish a task that is not allowed. Typically, it is not possible to delineate basins in these areas; however, sometimes delineations can be obtained but basin characteristics or flow statistics or both cannot be obtained for the delineated areas. Although the state layers panel appears after the state is selected at zoom
level 8, the stream grid ( ) will not actually appear on the map and delineations will not be possible until zoom level 15.
Report, About, and Help Links
The Report, About, and Help links are to the right side of the black banner above the map, which also contains the USGS logo.
Report
The Report link is used to generate a report that contains the outputs from whatever processes the user has completed thus far using the tools in the sidebar, which may include a basin delineation, computed basin characteristics, estimated flow statistics, or outputs from any special tools that are available for the state in which the selected site is located. The report output provides buttons that allow (1) printing the report, (2) saving the basin boundary as a shapefile or a geodatabase, with any computed basin characteristics and estimated flow statistics included as attributes, and (3) saving the report as a comma-delineated file (.csv), which can be imported into various other programs.
9
About
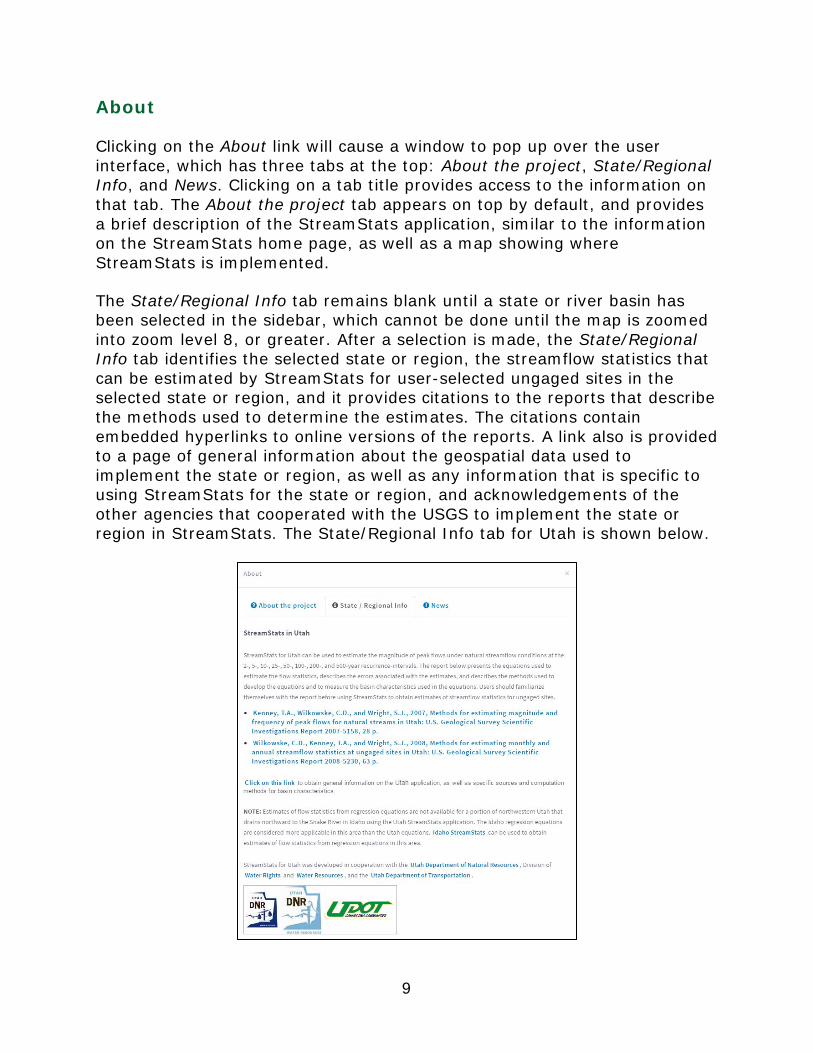
Clicking on the About link will cause a window to pop up over the user interface, which has three tabs at the top: About the project, State/Regional Info, and News. Clicking on a tab title provides access to the information on that tab. The About the project tab appears on top by default, and provides a brief description of the StreamStats application, similar to the information on the StreamStats home page, as well as a map showing where StreamStats is implemented.
The State/Regional Info tab remains blank until a state or river basin has been selected in the sidebar, which cannot be done until the map is zoomed into zoom level 8, or greater. After a selection is made, the State/Regional Info tab identifies the selected state or region, the streamflow statistics that can be estimated by StreamStats for user-selected ungaged sites in the selected state or region, and it provides citations to the reports that describe the methods used to determine the estimates. The citations contain embedded hyperlinks to online versions of the reports. A link also is provided to a page of general information about the geospatial data used to implement the state or region, as well as any information that is specific to using StreamStats for the state or region, and acknowledgements of the other agencies that cooperated with the USGS to implement the state or region in StreamStats. The State/Regional Info tab for Utah is shown below.
10
The News tab provides access to brief articles that describe items of potential interest to users, such as announcements of the release of new regression equations for a state or announcements of planned outages. When starting StreamStats, any new news items that have been posted since the last time StreamStats was used will be displayed so that users will be aware of the items.
Help
Clicking on the Help link will cause a window to pop up over the user interface. This window has three tabs at the top; User Manual, Frequently Asked Questions, and Submit a Support Request. Initially, the Users’ Manual tab is on top. The Users’ Manual, which is essentially this document, provides a description of the user interface and instructions on how to use it. Links are provided on this tab to view the major sections of the users’ manual, as well as a link at the bottom to download this entire document. The Frequently Asked Questions tab provides a list of questions previously submitted by users and their answers. The Submit a Support Request tab provides a form for use in submitting requests for assistance or comments to the StreamStats development team. The team will respond to your submittals by email.
The Sidebar – Getting Information for User-Selected Ungaged Sites The sidebar presents a series of banners that will open like an accordion when the banner is selected to expose a panel with instructions in a medium blue box just below the banner and tool buttons below the instructions. Initially, four banners are visible; (1) Select a State/Region, (2) Identify a Study Area, (3) Select Scenarios, and (4) Build a Report. The active banner will appear in dark blue. Inactive banners appear in light gray. Initially, the active banner is Select a State/Region. The panels that are visible when a banner is active provide instructions to guide the user through the steps necessary to delineate a basin, calculate basin characteristics, compute flow statistics and get reports. In some cases, the banners will allow users to complete custom functions for a specific state or region.
Select a State/Region
When StreamStats version 4 is started, the Select a State/Region banner will be shown in bright blue at the top of the sidebar. On the panel just below the banner is a gray box that instructs users to “Use the map or the search tool to identify an area of interest. At zoom level 8 or greater State/Region

11
selection will be enabled.” A Help link below the search tool’s text box provides a list of the supported types of search strings that can be entered. As words or numbers are typed into the text box, likely solutions will appear in a list below the text box. Select a location from the list or continue typing until your desired location appears. The location search tool uses the USGS Search API for Javascript, which is documented at https://txpub.usgs.gov/dss/search_api/2.0/.
The geospatial data used for delineating drainage basins for user-selected sites are prepared separately for each state, usually using the map projection that is preferred by the local state agencies. In the data-preparation process, areas that are in adjoining states but that drain into the state for which the data are being prepared also need to be processed in the selected map projection. As a result, data from multiple state or regional applications overlap at many user-selected locations.
Beginning at zoom level 8, StreamStats will display the names of the states that appear on the map. States that are listed in blue have been implemented in StreamStats, whereas states listed in gray have not. In the example to the right, users can get delineations for Colorado, Idaho, and Utah, but not for Wyoming. To the right of each listed state is a small gray button with a smaller
black circle and an “i” in it . Clicking one of these buttons will cause the About window to appear with the state/regional information shown for the associated state or region. In areas where there is overlapping data, users generally should select the state in which the site of interest is located except when one of the options is the Connecticut, Delaware, or Rainy River Basin. In these cases, if the user will want to obtain estimates of streamflow statistics from regression equations, then the state should be selected. The river basin applications primarily are used to obtain delineations and basin characteristics for user-selected sites, which for the Connecticut and Delaware River Basins can be used as inputs to separate models for estimating daily flows at the selected site. The State/Regional Info tabs on

12
the About pages for these basin applications provide information on how to access the separate models.
Identify a Study Area and Delineate a Basin
After a state or region has been selected, the Select a State/Region banner will turn gray and the name of the selected state or region will display in the banner. To the right of the state name is a black circle with an “i” in it . Clicking on this symbol will open the About window, with the State/Regional Info tab for the selected state, as described above.
The Identify a Study Area banner will now turn bright blue and its associated panel will open. A gray text box at the top indicates that the user needs to be into zoom level 15 or greater to enable the Delineate tool. The Delineate button will turn from gray to bright blue at this zoom level, and a gridded representation of the stream network will appear on the map in dark blue. Click on the Delineate button and then on a point on the stream grid. Initially, StreamStats will place a blue pointer at the selected location and a small pop-up window will appear above the point, providing the latitude and longitude of the selected point. Also, a series of notifications will appear and then disappear towards the bottom right of the map giving feedback on the progress of the processing to determine the drainage-basin boundary for your selected site. Eventually, the screen will redraw, showing the blue pointer at the selected site and its drainage basin highlighted in yellow. On the sidebar, the Identify A Study Area banner will indicate “BASIN DELINEATED.” It is good practice at this point to zoom in and pan around the basin boundary to assure that StreamStats has delineated it accurately.
The Identify A Study Area panel will now display four or more buttons, depending on the state or region in which the selected site is located. The buttons that always will appear include Clear Basin, Edit Basin, Download Basin, and Continue. Below the Edit Basin button, some states or regions will have a State/Region Specific Functions panel that includes additional buttons to perform tasks that are unique to the selected area, as explained in the State/Region Specific Functions section below. Clicking on Clear Basin will cause the delineated basin to disappear from the map. The Identify A Study Area banner will then turn blue again and the Delineate button will re-appear, allowing you to select a new location. Editing a basin is explained

13
below. Clicking on the Download button provides options for downloading the basin in formats that can be used by other GIS applications, including GeoJSON, Shapefile, and ESRI file geodatabase formats. If the basin is downloaded at this point the file will contain the geospatial data for the delineated basin. Users will also have the opportunity to download the basin after computing basin characteristics and estimating streamflow statistics, at which point the computed values will be included as attributes in the downloaded files. Clicking on Continue will activate the Select Scenarios banner and open its panel.

14
Editing a Basin
Clicking on the Edit Basin button will cause the area in the Identify A Study Area panel to be replaced with a set of instructions for using the edit tool and buttons for adding an area, removing an area, undoing edits, and finishing the edits. This tool does not work for very large basins, usually exceeding more than 1,000 square miles. The Edit Basin button will not appear when a delineated basin is too large.
Adding an Area
Click on the Add Area button. Your cursor will change from a pointer to a set of cross-hairs. Click on at least 3 points on the map, at least one of which must be within the delineated basin boundary. StreamStats will draw lines between each point. Double-click on the last point to complete defining the area to be added. The map will then redraw showing the area added to the previously delineated boundary.
Deleting an Area
Click on the Remove Area button. Your cursor will change from a pointer to a set of cross-hairs. Click on at least 3 points on the map, at least one of which must be outside of the delineated basin boundary. StreamStats will draw lines between each point. Double-click on the last point to complete defining the area to be added. The map will then redraw showing the area removed from the previously delineated boundary.
Polygon drawn to remove area
Resulting edited basin

15
Undo Edits
Clicking on the Undo Edits button will cause any edits made to disappear and the the basin will revert to the original shape. The sidebar will then appear as it does in the screen capture that is just above the Editing a Basin section. Click on Continue to proceed with getting further information for the delineated basin.
Finished
Clicking on the Finished button also will cause any edits made to be retained and the sidebar to appear as it does in the screen capture that is just above the Editing a Basin section. Click on Continue to proceed with getting further information for the edited basin.
State/Region Specific Functions
Custom functionality has been created for some states. In these cases, the sidebar will display these optional functions after completing a delineation. For example, a special function that tests for the presence of upstream regulation from dams has been developed for Colorado and Montana. Also, a special function that provides a summary of water withdrawals and discharges within a delineated basin is available for the Delaware River Basin and northeastern Ohio. These special functions must be used prior to selecting the Continue button within the Basin Delineation sub-panel, as the State/Region Specific Functions panel will disappear after clicking on Continue.
The test for upstream dams for Colorado is illustrated below. In this case, after the basin delineation is completed a button labeled Check for upstream regulation appears within the State/Region Specific Functions sub-panel. Clicking on this button will run a process that identifies the locations of any upstream dams, computes the drainage area upstream from the dams and the drainage area downstream from the dams. Finally, the areas upstream from the dams will be displayed in orange on the map and the State/Region Specific Functions sub-panel will list the percentage of the watershed that is affected by dam regulations in a green text box, as indicated in the image below.

16
17
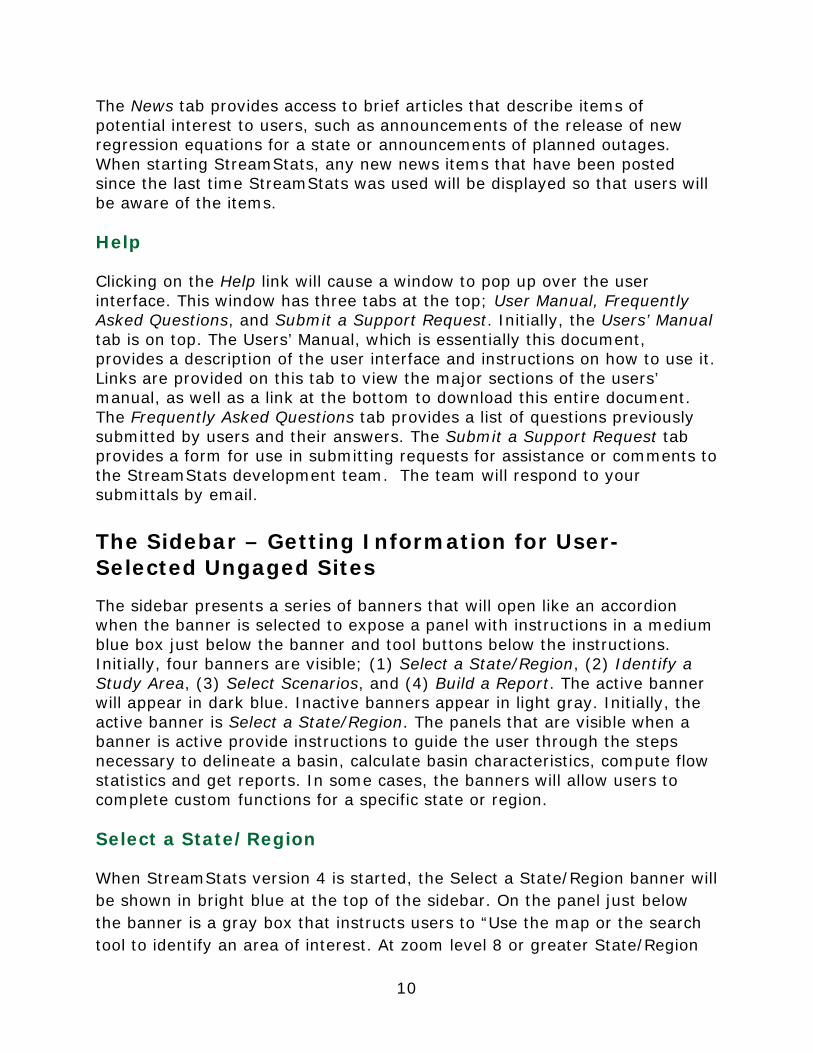
Select Scenarios
After clicking on the Continue button in the Identify A Study Area panel, its banner will go gray, and the Select Scenarios banner will become dark blue. In the panel under it will be a gray message box, followed by panels for regression-based scenarios and basin characteristics. The regression-based scenarios panel provides buttons labeled with the types of streamflow statistics for which regression equations are available to estimate the statistics for the delineated basin. The basin characteristics panel has an arrow button in the top right corner. Clicking on the arrow button will reveal a list of basin characteristics that can be computed with check boxes to allow selecting which ones you want computed. Select the scenarios and basin characteristics of interest to you. The scenarios and the basin characteristics that are available vary widely among the states, and sometimes among regions within the states. Refer to the introductory page for the state in which your selected site is located and use the links provided to view the reports that are cited on that page for more information.
Users may now select one, more, or all of available scenarios by clicking on the buttons in the regression-based scenarios panel. Selecting a scenario causes the button to change from white to blue. Users may also expand the basin characteristics panel and select all or individual basin characteristics to be computed. Users may choose to get only regression-based scenarios or only basin characteristics, or both. After the selections have been made, click on the green Continue button below the basin characteristics panel to proceed.
Build a Report
After clicking on Continue on the Select Scenarios panel, the banner for that panel will turn gray and the banner for the Build A Report will turn dark blue. The Build A Report panel, like other panels, will have a gray message box at the top, which indicates that you can modify the basin characteristics that were computed by StreamStats before building a report. The panel includes the Show Basin Characteristics button, check boxes that allow selecting whether the report should contain just a basin characteristics report, just a

18
scenario flow report, or both, and the Continue button. After making your selections, click on Continue to generate a report in a pop-up window that contains your desired information.
The Show Basin Characteristics button within the panel has a down arrowhead on the left. Clicking on the arrowhead will reveal a list of the basin characteristics needed to solve the regression equations for the scenarios that were selected and their computed values. The computed values may be changed before building a report. This functionality is useful for understanding how estimates of streamflow statistics will change in response to real or hypothesized changes in the basin characteristics. Changing the basin characteristics also can be used to assist in estimating flow statistics when a delineated basin has drainage area in more than one state, as described in the Estimates for Sites with Basins in Multiple States section.
Reports for User-Selected Ungaged Sites The reports for user-selected ungaged sites contain text entry boxes near the top that allow users to enter a report title and comments that will display on the printed reports. Below these, the reports identify the state or regional application name, the workspace ID, the latitude and longitude of the user-selected point, and the time the report was created. If there are any problems with the report, then the workspace ID should be provided to the StreamStats development team, along with a description of the problem, by filling out the provided form after clicking on the Help button above the map on the user interface.
The reports also contain maps showing the user-selected points and their drainage areas. Users can pan and zoom within the map before printing it. Buttons at the bottom of the reports allow users to (1) download the basin as either a shapefile or an ESRI geodatabase file; (2) download the output report as a .csv file, which can be input into various spreadsheet, GIS, and database programs; (3) print the report; and (4) close it.
StreamStats will display the warning below if the watershed boundary was edited before computing basin characteristics or flow statistics. This warning will appear just below the Basin Characteristics section in the report.

19
Basin Characteristics Tables
If it was chosen to compute basin characteristics, then a table of the computed basin characteristics will be displayed in the report just below the map. The first column in the table contains the label used for the basin characteristic internally within StreamStats. The following three columns contain a description of the basin characteristic, the computed value, and its units of measure, respectively (see the example below). Methods and geospatial data used to compute the basin characteristics are identified on the General Information page for each state or region. A link to this page is provided on the State/Regional Info tab of the About link above the Map Frame.
20
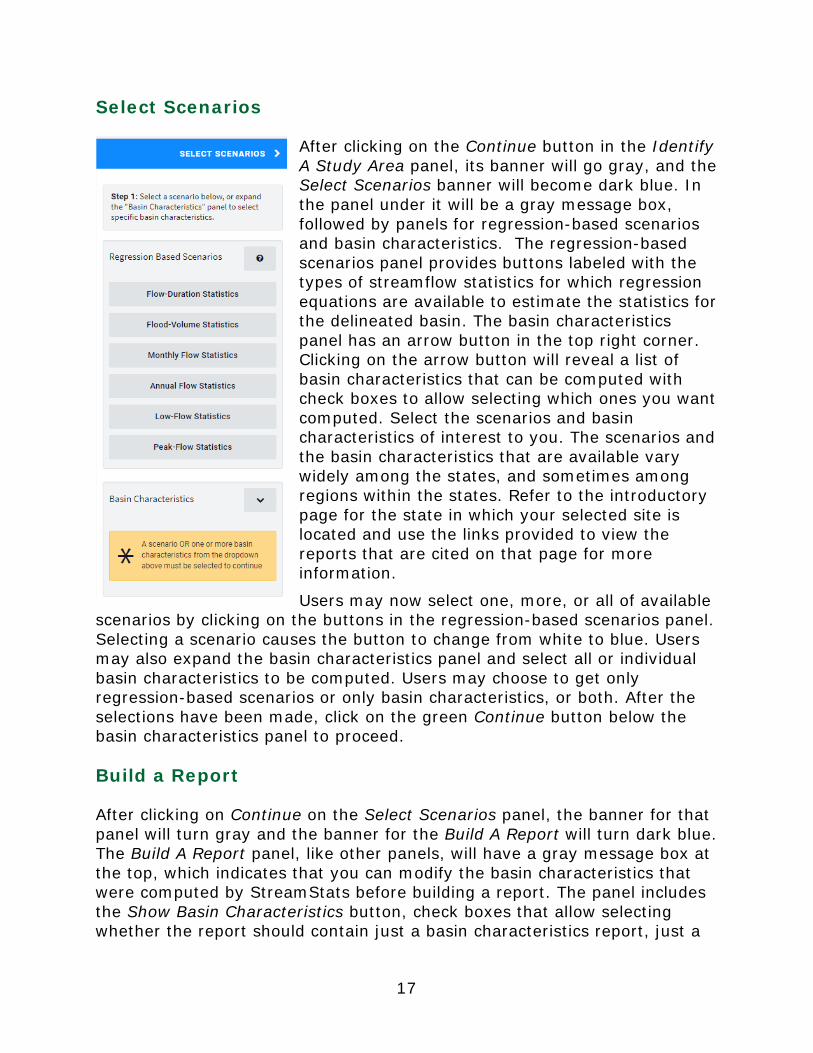
Scenario Tables
Below the basin characteristics tables, the reports contain separate sections for each selected scenario. Within each of these sections are a table of parameters (the basin characteristics used as explanatory variables in the regression equations) and a table of the estimated streamflow statistics. Headings for each of the tables begin with names of the scenarios that were selected. As an example, the screen capture below shows the report section that corresponds to the Flow-Duration Statistics scenario that was shown above in the Select Scenarios section of this users’ manual, thus the table names are Flow-Duration Statistics Parameters and Flow-Duration Statistics Flow Report. To the right of the headings, in smaller lettering, is the percentage of the basin that is within the noted hydrologic region and the hydrologic region name. In the example for a site in New Hampshire, the basin is 100 percent within the Low Flow Statewide region.

21
Parameters
The columns in the parameters tables list the names of the parameters, their computed values, and then the minimum (Min) and maximum (Max) limit values, respectively. Definitions for the parameters can be found on the Basin Characteristic Definitions page.
The Min and Max limit values provide the ranges of the values of the basin characteristics that were available for the streamgages used to develop the regression equations. If any of the computed values of the parameters for the user-selected site are outside of the Min/Max range the value is highlighted in orange in the table and a message will appear below the table indicating that “One or more of the parameters is outside the suggested range. Estimates were extrapolated with unknown errors.” This is further discussed below.
If any of the basin characteristics used as parameters in the regression equations were edited before creating a report, the report will contain a warning message above the scenario sections, such as the one below. Messages also will be provided if the basin boundary has been edited, or the selected point was in an exclusion area. For Colorado, when applicable, a disclaimer also will be provided to warn that the flow at the selected site is affected by dam regulations. In addition, if any of the basin characteristics used as explanatory variables in the regression equations are outside of the given min limit or max limit, then the value of the basin characteristic will be highlighted in orange and an orange disclaimer will be provided.
Statistics
The columns in the streamflow statistics tables list the names of the statistics, their values, and their units of measure, respectively, followed by any indicators that are available of the errors that are associated with the estimates. No error indicators will be displayed when any of the parameters are outside their indicated Min and Max ranges. Definitions for the statistics can be found on the Streamflow Statistics Definitions page.
Regression equations for estimating streamflow statistics usually are developed as part of studies for an entire state. As part of the studies, the states very often are divided geographically or on some other basis into regions of similar hydrology. In most cases, delineated drainage areas for user-selected sites will fall within a single hydrologic region within a state. However, in some cases the drainage areas will span multiple regions.

22
When this occurs, StreamStats reports will present flow estimates based on the regression equations for each hydrologic region and also area-averaged estimates that are determined by weighting the flow estimates for each region by the percentage of the drainage area that is within the region.
Limitations and Error Indicators for Estimated Statistics
The StreamStats Web application provides access to automated procedures and very large, complex data sets. These data sets are known to contain occasional errors. Users are advised to carefully check all results for accuracy and to exercise their own professional judgment in evaluating the appropriateness of the results for their application. Basin delineations, in particular, frequently have been found to be erroneous. StreamStats provides tools and base maps useful for verifying the accuracy of the basin delineations and for correcting them, if necessary.
Estimates of streamflow statistics provided by StreamStats for user-selected ungaged sites are determined by solving USGS-developed regression equations that have been compiled for the nation in the National Streamflow Statistics (NSS) program, which StreamStats uses to solve the equations. The NSS report by Ries (2006) provides a general description of the development and application of regression equations. The NSS Web site contains links to all reports that contain regression equations included in the software. The reports also are listed on the State/Regional Info tab for each state. These reports describe how the equations were developed and their limitations. Users should read and understand the limitations described in these reports before attempting to use the Estimate Flows Using Regression Equations tool to obtain flow estimates for ungaged sites.
Indicators of the errors associated with estimates of streamflow statistics provided by StreamStats may include the equivalent years of record, the average standard error of estimate, the average standard error of prediction, the minimum and maximum values of the 90-percent prediction interval, and the percent correct. Typically, only some of these indicators will be available for an estimated statistic. Definitions for the error indicators are:
• Equivalent years of record indicates the number of years that a streamgage would have operated at the user-selected site to obtain an estimate of the streamflow statistic that is equal in accuracy to the estimate provided by the regression equation.
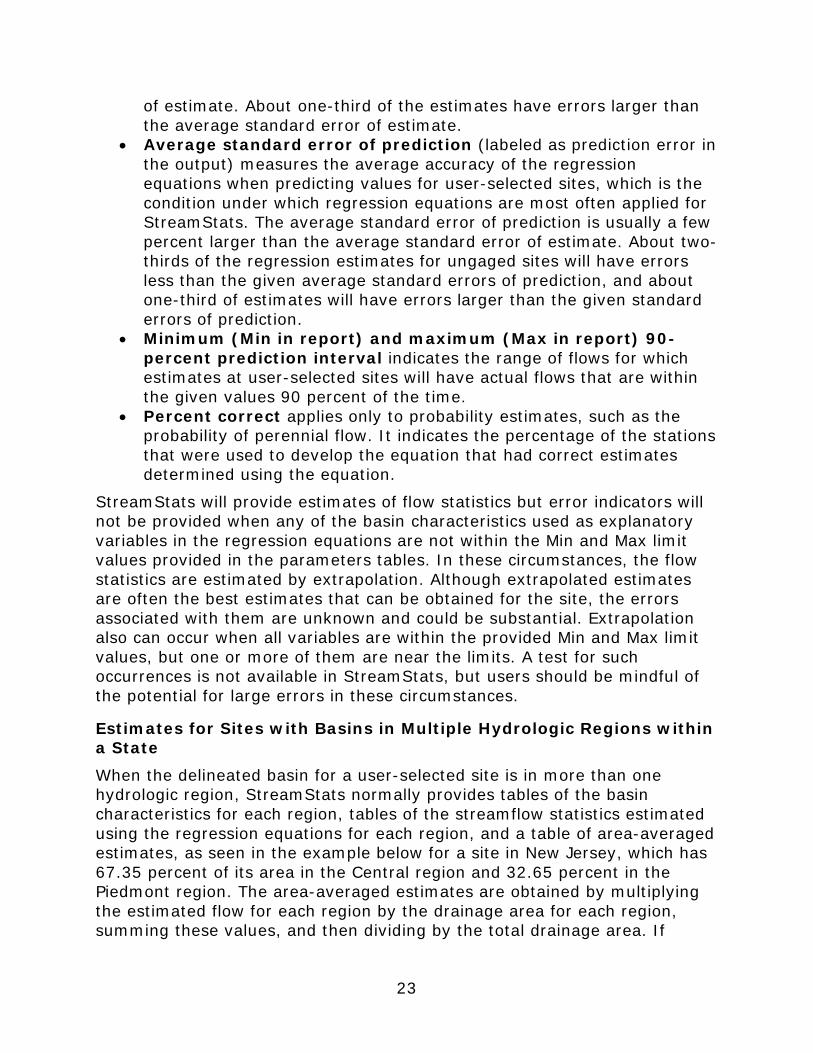
• Average standard error of estimate (labeled as estimate error in the output) measures the average variation between the regression estimates and estimates derived from the data collected for the streamgages used to develop the regression equations. About two-thirds of the regression estimates for the streamgages used in the regression analyses have errors less than the average standard error
23
of estimate. About one-third of the estimates have errors larger than the average standard error of estimate.
• Average standard error of prediction (labeled as prediction error in the output) measures the average accuracy of the regression equations when predicting values for user-selected sites, which is the condition under which regression equations are most often applied for StreamStats. The average standard error of prediction is usually a few percent larger than the average standard error of estimate. About two-thirds of the regression estimates for ungaged sites will have errors less than the given average standard errors of prediction, and about one-third of estimates will have errors larger than the given standard errors of prediction.
• Minimum (Min in report) and maximum (Max in report) 90-percent prediction interval indicates the range of flows for which estimates at user-selected sites will have actual flows that are within the given values 90 percent of the time.
• Percent correct applies only to probability estimates, such as the probability of perennial flow. It indicates the percentage of the stations that were used to develop the equation that had correct estimates determined using the equation.
StreamStats will provide estimates of flow statistics but error indicators will not be provided when any of the basin characteristics used as explanatory variables in the regression equations are not within the Min and Max limit values provided in the parameters tables. In these circumstances, the flow statistics are estimated by extrapolation. Although extrapolated estimates are often the best estimates that can be obtained for the site, the errors associated with them are unknown and could be substantial. Extrapolation also can occur when all variables are within the provided Min and Max limit values, but one or more of them are near the limits. A test for such occurrences is not available in StreamStats, but users should be mindful of the potential for large errors in these circumstances.
Estimates for Sites with Basins in Multiple Hydrologic Regions within a State
When the delineated basin for a user-selected site is in more than one hydrologic region, StreamStats normally provides tables of the basin characteristics for each region, tables of the streamflow statistics estimated using the regression equations for each region, and a table of area-averaged estimates, as seen in the example below for a site in New Jersey, which has 67.35 percent of its area in the Central region and 32.65 percent in the Piedmont region. The area-averaged estimates are obtained by multiplying the estimated flow for each region by the drainage area for each region, summing these values, and then dividing by the total drainage area. If

24
available, prediction errors and equivalent years of record are computed by the same weighting method. Prediction errors and equivalent years of record will be provided for area-averaged estimates only if all regions have this information available.
Estimates of streamflow statistics for user-selected sites with basin characteristics that are not within the given Min and Max values have errors that are of unknown magnitude. When this occurs, the output will have the computed value highlighted in red, and a warning message will be displayed at the bottom of the section. For a few states, such as Virginia, StreamStats provides flow estimates based on the equations only for the hydrologic region in which the selected site is located.
Special Conditions
1. Reports for some states recommend that only the regression equations for the hydrologic region in which the selected site is located should be used to determine estimates of streamflow statistics for the site. Virginia is an example. In these cases, StreamStats operates as suggested in the reports and does not provide area-weighted estimates.
2. Reports with regression equations for some states recommend the use of different weighting methods than those that are used in StreamStats, although the results usually are very similar. StreamStats users should refer to the individual reports to determine if different weighting methods should be used. In some cases, report

25
authors have provided spreadsheets or programs in which the basin characteristics from StreamStats can be inserted and estimates can be obtained according to the methods that are described in those reports. Links to the applicable reports are provided on the State/Regional Info tab of the About link above the Map Frame.
Estimates for Sites with Basins in Multiple States
Flow estimates obtained from regression equations for watersheds that span state boundaries may give different results depending on which state’s equations are used. Unless otherwise stated, each state’s regression equations are applicable only within the state for which the equations were developed. Ries (2006, p. 8) indicates that in cases where a delineated watershed has area in multiple states, flow estimates should be determined using the regression equations for each state, and then final estimates should be determined by weighting the separate sets of flow estimates according to the proportion of the drainage area that is in each state. This is the same method that StreamStats uses to determine area-averaged estimates for sites with drainage area in multiple hydrologic regions within a state.
Programing and data limitations usually do not allow StreamStats to provide estimates using the regression equations for each state with area in a delineated basin. In cases where StreamStats is available for each state, it may be possible to determine area-averaged estimates by use of the following process:
1. Zoom into the vicinity of site of interest, select the state in which the site is located, delineate the drainage basin, obtain all possible basin characteristics and the desired flow estimates, and then save the output.
2. Refresh the StreamStats user interface and then follow the same process as in step 1, except select the upstream state and then select the point for delineation just upstream from where the stream of interest crosses the state border.
3. It will be necessary to adjust the estimates that were determined using the upstream state’s application to represent the full drainage area at the initial point of interest. Such adjustments may be possible by one of the following approaches:
a. If the output from the downstream state’s application has provided all of the basin characteristics needed to solve the upstream state’s regression equations, then before building the report, click on the Show Basin Characteristics button and change the computed basin characteristics to be those from the

26
output for the downstream state. Build the report after making the changes and the adjusted flows will appear in the output.
b. If not all of the basin characteristics needed to solve the regression equations for the upstream state are available from the downstream state’s application, and if the proportion of the drainage area that is in the downstream state is small, then it may be reasonable to use the values of some basin characteristics that were obtained from the upstream state’s application to determine the final weighted estimates. For example, if the upstream state’s application requires the percent forest, but the downstream state’s application does not provide it, then if the area in the downstream state is small and the percent forest within the downstream state appears similar to that for the upstream state, then when using the Show Basin Characteristics tool for the upstream state, edit the drainage area to be that from the output for downstream state, but do not edit the percent forest before recomputing the flow estimates.
c. If neither of the above two conditions exists, then it will not be possible to weight the flow estimates from the two state applications.
4. If it was possible to adjust the estimates that were determined using the upstream state’s application to represent the full drainage area at the initial point of interest, then manually weight the adjusted flow estimates from the upstream state’s application with those from the downstream state’s application according to the proportion of the total drainage area that is in each state. An example manual computation is provided by Ries (2006, p. 8).
Exploration Tools
To the left of the map, below the plus and minus zoom buttons, is the Exploration Tools button, which has a tool box on it. Clicking on the button will cause a small
window to appear over the map. The exploration tools includes the Measure Tool, Elevation Profile Tool, and the Show your location tool. Clicking on one of these tool buttons causes the button to turn from blue to orange to indicate that the tool is active.
Measure Tool
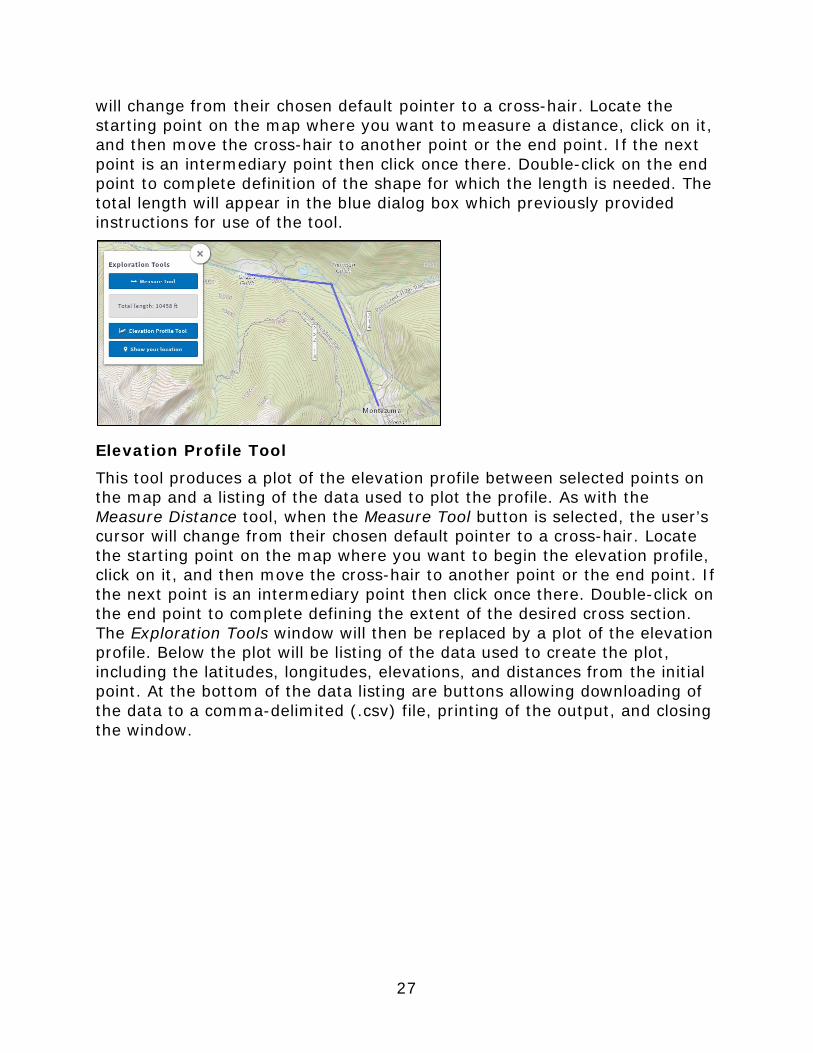
This tool computes the distance between selected points on the map. When the Measure Tool button is selected, a blue dialog box will appear below the tool button with instructions on how to use the tool. Also, the user’s cursor
27
will change from their chosen default pointer to a cross-hair. Locate the starting point on the map where you want to measure a distance, click on it, and then move the cross-hair to another point or the end point. If the next point is an intermediary point then click once there. Double-click on the end point to complete definition of the shape for which the length is needed. The total length will appear in the blue dialog box which previously provided instructions for use of the tool.
Elevation Profile Tool
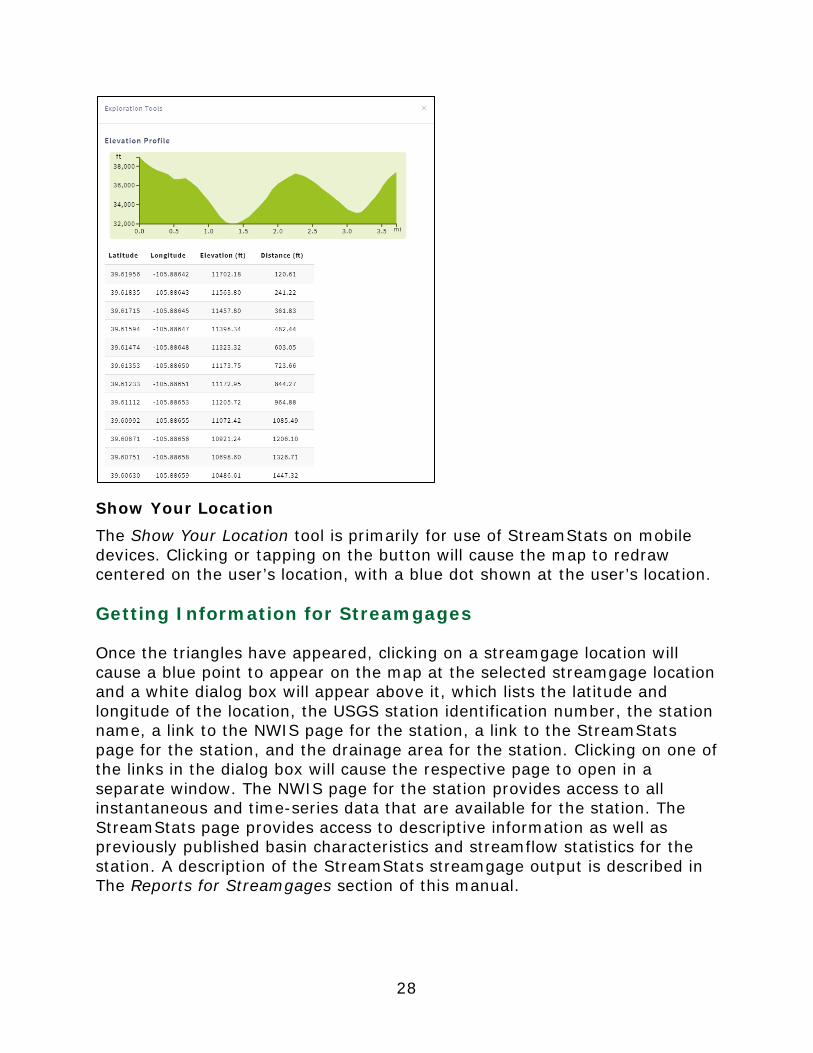
This tool produces a plot of the elevation profile between selected points on the map and a listing of the data used to plot the profile. As with the Measure Distance tool, when the Measure Tool button is selected, the user’s cursor will change from their chosen default pointer to a cross-hair. Locate the starting point on the map where you want to begin the elevation profile, click on it, and then move the cross-hair to another point or the end point. If the next point is an intermediary point then click once there. Double-click on the end point to complete defining the extent of the desired cross section. The Exploration Tools window will then be replaced by a plot of the elevation profile. Below the plot will be listing of the data used to create the plot, including the latitudes, longitudes, elevations, and distances from the initial point. At the bottom of the data listing are buttons allowing downloading of the data to a comma-delimited (.csv) file, printing of the output, and closing the window.
28
Show Your Location The Show Your Location tool is primarily for use of StreamStats on mobile devices. Clicking or tapping on the button will cause the map to redraw centered on the user’s location, with a blue dot shown at the user’s location.
Getting Information for Streamgages
Once the triangles have appeared, clicking on a streamgage location will cause a blue point to appear on the map at the selected streamgage location and a white dialog box will appear above it, which lists the latitude and longitude of the location, the USGS station identification number, the station name, a link to the NWIS page for the station, a link to the StreamStats page for the station, and the drainage area for the station. Clicking on one of the links in the dialog box will cause the respective page to open in a separate window. The NWIS page for the station provides access to all instantaneous and time-series data that are available for the station. The StreamStats page provides access to descriptive information as well as previously published basin characteristics and streamflow statistics for the station. A description of the StreamStats streamgage output is described in The Reports for Streamgages section of this manual.
29
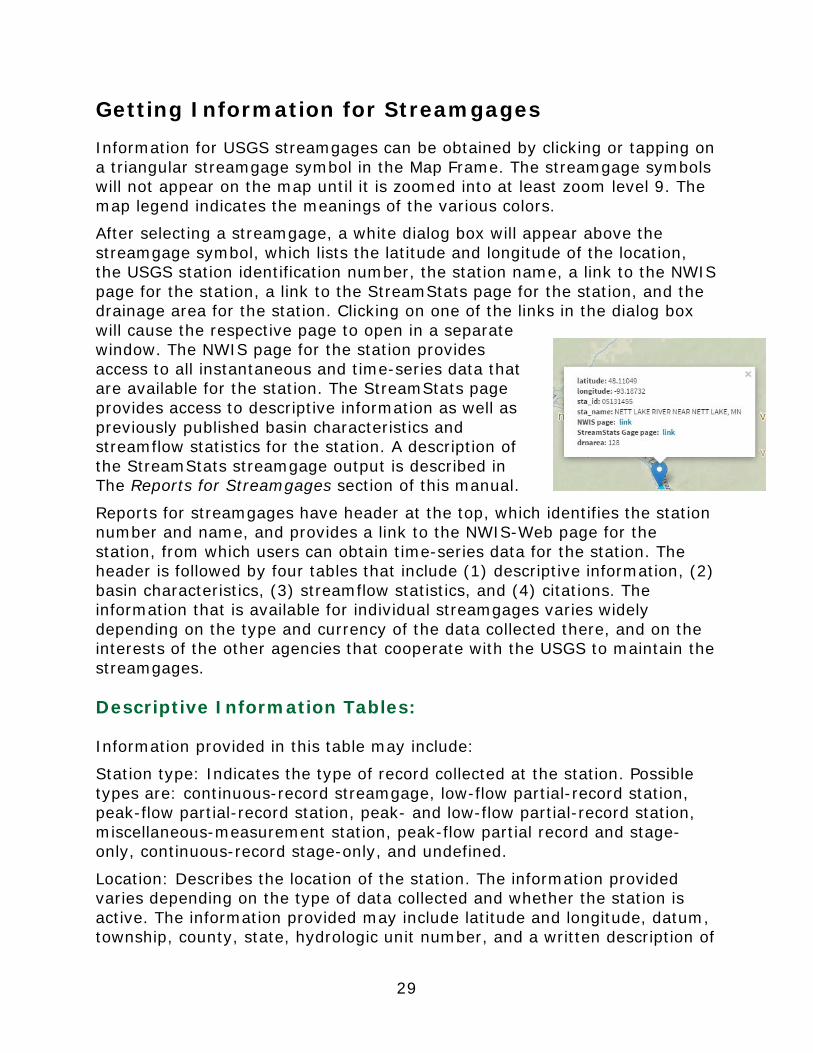
Getting Information for Streamgages Information for USGS streamgages can be obtained by clicking or tapping on a triangular streamgage symbol in the Map Frame. The streamgage symbols will not appear on the map until it is zoomed into at least zoom level 9. The map legend indicates the meanings of the various colors.
After selecting a streamgage, a white dialog box will appear above the streamgage symbol, which lists the latitude and longitude of the location, the USGS station identification number, the station name, a link to the NWIS page for the station, a link to the StreamStats page for the station, and the drainage area for the station. Clicking on one of the links in the dialog box will cause the respective page to open in a separate window. The NWIS page for the station provides access to all instantaneous and time-series data that are available for the station. The StreamStats page provides access to descriptive information as well as previously published basin characteristics and streamflow statistics for the station. A description of the StreamStats streamgage output is described in The Reports for Streamgages section of this manual.
Reports for streamgages have header at the top, which identifies the station number and name, and provides a link to the NWIS-Web page for the station, from which users can obtain time-series data for the station. The header is followed by four tables that include (1) descriptive information, (2) basin characteristics, (3) streamflow statistics, and (4) citations. The information that is available for individual streamgages varies widely depending on the type and currency of the data collected there, and on the interests of the other agencies that cooperate with the USGS to maintain the streamgages.
Descriptive Information Tables:
Information provided in this table may include:
Station type: Indicates the type of record collected at the station. Possible types are: continuous-record streamgage, low-flow partial-record station, peak-flow partial-record station, peak- and low-flow partial-record station, miscellaneous-measurement station, peak-flow partial record and stage-only, continuous-record stage-only, and undefined.
Location: Describes the location of the station. The information provided varies depending on the type of data collected and whether the station is active. The information provided may include latitude and longitude, datum, township, county, state, hydrologic unit number, and a written description of
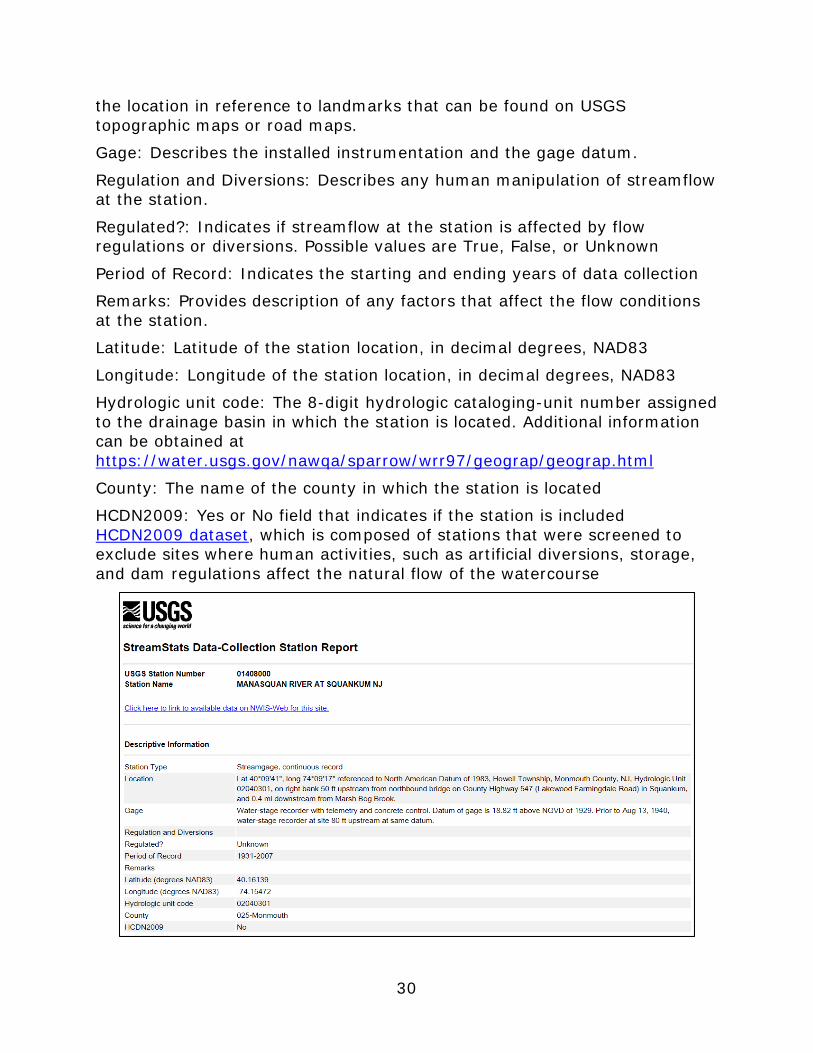
30
the location in reference to landmarks that can be found on USGS topographic maps or road maps.
Gage: Describes the installed instrumentation and the gage datum.
Regulation and Diversions: Describes any human manipulation of streamflow at the station.
Regulated?: Indicates if streamflow at the station is affected by flow regulations or diversions. Possible values are True, False, or Unknown
Period of Record: Indicates the starting and ending years of data collection
Remarks: Provides description of any factors that affect the flow conditions at the station.
Latitude: Latitude of the station location, in decimal degrees, NAD83
Longitude: Longitude of the station location, in decimal degrees, NAD83
Hydrologic unit code: The 8-digit hydrologic cataloging-unit number assigned to the drainage basin in which the station is located. Additional information can be obtained at https://water.usgs.gov/nawqa/sparrow/wrr97/geograp/geograp.html
County: The name of the county in which the station is located
HCDN2009: Yes or No field that indicates if the station is included HCDN2009 dataset, which is composed of stations that were screened to exclude sites where human activities, such as artificial diversions, storage, and dam regulations affect the natural flow of the watercourse
31
Basin Characteristics Tables:
These tables may contain any of potentially hundreds of physical and climatic characteristics of the drainage basin that contributes streamflow to a data-collection station. The characteristics that are available vary widely among the stations. The table is separated into sections of characteristics of the same type. The types may include precipitation, temperature, climate, runoff, flood depth, recharge, topographical, soil, geological, stream channel, basin dimensional, and burned area characteristics, as well as additional descriptive information. The table consists of four columns:
• Characteristic Name - the short names of the characteristics. Definitions of the characteristics are provided on the Basin Characteristics Definitions page.
• Value - the quantity of the characteristic that was measured for the station
• Units - the English units of measure for the value
• Citation Number - number that corresponds with the Citation Number in the Citations table. Each physical characteristic and streamflow statistic that is provided by StreamStats has been published previously in a report that is cited in the Citations table and is referenced by the Citation Number in the other tables.

32
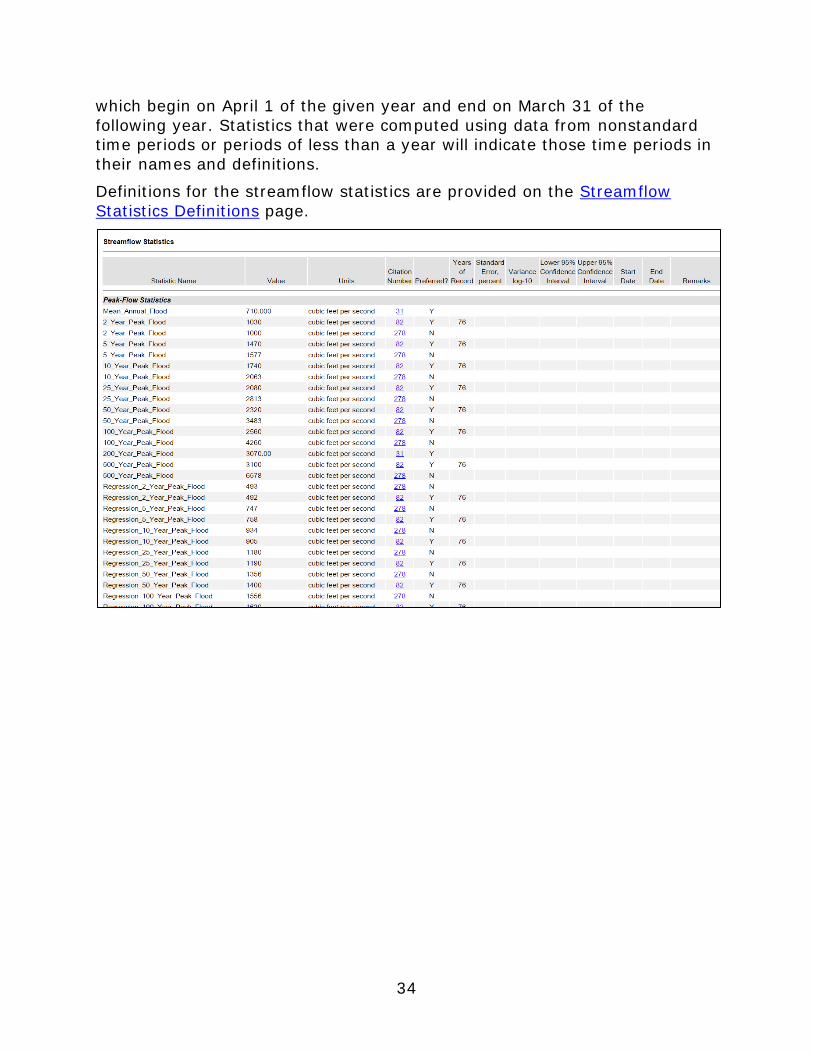
Streamflow Statistics Tables:
These tables may contain any of more than 2,500 different streamflow statistics separated into as many as 41 sections of statistics of the same type, such as peak-flow statistics, low-flow statistics, and flow-duration statistics. The tables include 13 columns, although usually at least some of them will not be filled:
• Statistic Name - gives the names of the statistics. Within the table, the statistics are grouped by statistic type.
• Value - gives the computed value for the corresponding statistic
• Units - gives the English units of measure for the value
33
• Citation Number - gives a number that corresponds with the Citation Number in the Citations table
• Preferred? – indicates Y if the statistic is the preferred value, and N if it is not preferred
• Years of Record – the number of years of record that were used to compute the statistic
• Standard Error, percent – the standard error, in percent, of the computed statistic, which indicates there is an approximately 2/3 chance that the true value is within the given percentage of the provided value
• Variance, log-10 – the variance of the estimate, as computed from the base-10 logarithms of the data that were used to compute the statistic
• Lower 95% Confidence Interval – the lower end of the interval within which there is a 95 percent chance that the true value of the statistic occurs
• Upper 95% Confidence Interval – the upper end of the interval within which there is a 95 percent chance that the true value of the statistic occurs
• Start Date –the beginning date of the period of record that was used to compute the statistic
• End Date - the ending date of the period of record that was used to compute the statistic
• Remarks – optional comments about how the statistic was computed
Typically, when a new value of a statistic is published for a station, and the new value was computed using a longer record or improved methods, or both, then the new value is considered to supersede the older value. As a result, normally when new values of a statistic become available they replace the older values in the database that stores the statistics for StreamStats. However, StreamStats can provide multiple values of the same statistic in cases where there is justification to do so. An example is where a state has regulations that require the use of statistics from a specific report, but newer values have become available since the report was published. In such cases, IsPreferred? will be set to Y for the newer value and to N for the older value, and both values will appear in the statistics table.
Unless otherwise noted, all streamflow statistics presented in the output tables, except low-flow frequency statistics, were computed on the basis of water years, which begin October 1 of the preceding year and end September 30 of the given year. Low-flow frequency statistics, such as the 7-day, 10-year low flow, were computed on the basis of climatic years,
34
which begin on April 1 of the given year and end on March 31 of the following year. Statistics that were computed using data from nonstandard time periods or periods of less than a year will indicate those time periods in their names and definitions.
Definitions for the streamflow statistics are provided on the Streamflow Statistics Definitions page.

35
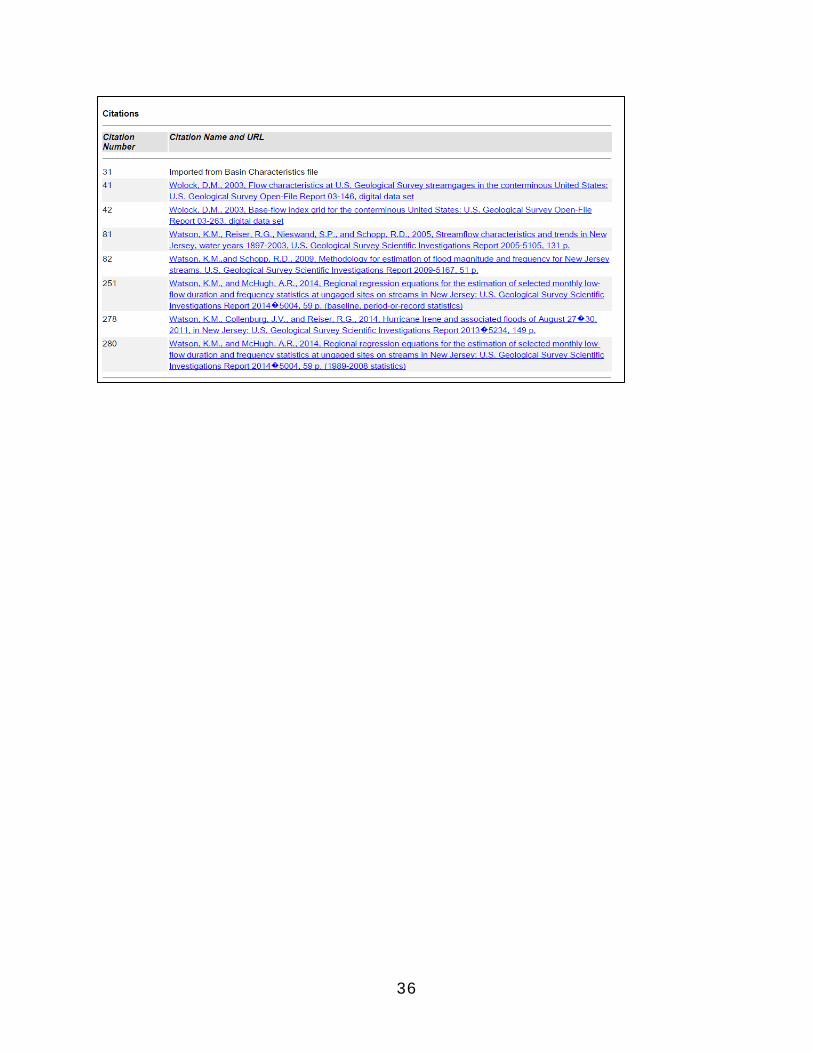
Citations Tables:
These tables contain columns of the citation numbers given in the previous tables, the corresponding citations for the reports that contain the statistics, and links to the online versions of the reports, respectively. Users can refer to those reports to determine when, why, and how the statistics were calculated.
Many of the statistics presented in the tables have an associated citation of “Imported from Basin Characteristics file.” The Basin Characteristics File (BCF) was a USGS database that was retired in the late 1990s. No time tags were associated with any of the data entered in the BCF. As a result, users should understand that information from the BCF is likely to be 20 or more years old. In many cases, newer information is available in reports published by the various USGS Water Science Centers. Users should check the Web pages of the individual Centers to determine if reports containing newer statistics are available.
NOTE: The information that StreamStats provides in reports for data-collection stations is maintained in a database that must be updated by scientists who work in the USGS state offices. These offices generally rely on partnering with local agencies to cover at least half of the cost of the needed database work. Often, the database is updated as part of the process of initially implementing StreamStats, but additional updates subsequent to implementation and updates for states that are not implemented sometimes are difficult to achieve. As a result, some of the data in our database is out of date.
If a statistic found in a StreamStats output has a citation that is from an older source than the reports listed on the State/Regional Info tab for an implemented state, then the newer source should be examined to determine if a newer statistic is available for the station. A more comprehensive list of reports that contain regression equations and computed interpretive streamflow statistics for the streamgages used to develop the equations is at https://water.usgs.gov/osw/programs/nss/NSSpubs_Rural.html. Also, the USGS office for each state maintains a web page at http://xx.water.usgs.gov, where xx is the 2-letter postal cost for the state. The web pages normally provide links to publications that have produced by scientists in that state. A search of these publications may turn up additional reports that contain streamflow statistics.
36