Embed Size (px)
Citation preview
U.S. Department of the InteriorU.S. Geological Survey
Fact Sheet 2012–3137December 2012
StreamStats in North Carolina: A Water-Resources Web ApplicationIntroduction
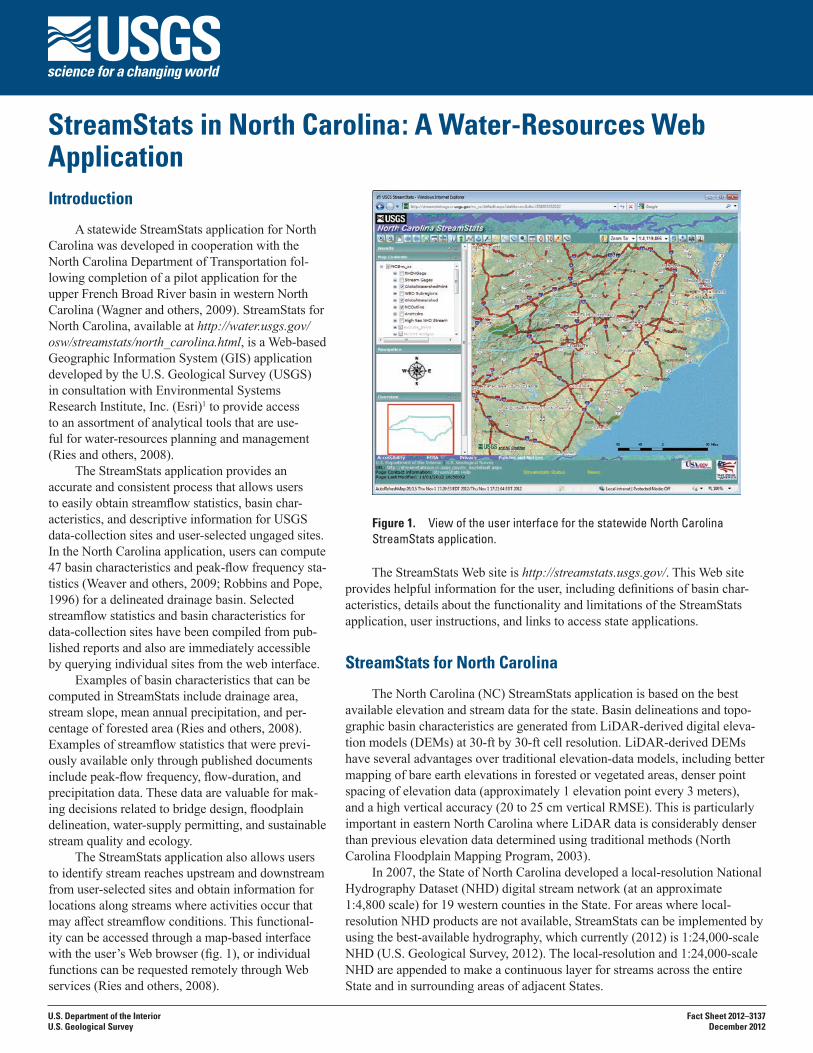
A statewide StreamStats application for North Carolina was developed in cooperation with the North Carolina Department of Transportation fol-lowing completion of a pilot application for the upper French Broad River basin in western North Carolina (Wagner and others, 2009). StreamStats for North Carolina, available at http://water.usgs.gov/osw/streamstats/north_carolina.html, is a Web-based Geographic Information System (GIS) application developed by the U.S. Geological Survey (USGS) in consultation with Environmental Systems Research Institute, Inc. (Esri)1 to provide access to an assortment of analytical tools that are use-ful for water-resources planning and management (Ries and others, 2008).
The StreamStats application provides an accurate and consistent process that allows users to easily obtain streamflow statistics, basin char-acteristics, and descriptive information for USGS data-collection sites and user-selected ungaged sites. In the North Carolina application, users can compute 47 basin characteristics and peak-flow frequency sta-tistics (Weaver and others, 2009; Robbins and Pope, 1996) for a delineated drainage basin. Selected streamflow statistics and basin characteristics for data-collection sites have been compiled from pub-lished reports and also are immediately accessible by querying individual sites from the web interface.
Examples of basin characteristics that can be computed in StreamStats include drainage area, stream slope, mean annual precipitation, and per-centage of forested area (Ries and others, 2008). Examples of streamflow statistics that were previ-ously available only through published documents include peak-flow frequency, flow-duration, and precipitation data. These data are valuable for mak-ing decisions related to bridge design, floodplain delineation, water-supply permitting, and sustainable stream quality and ecology.
The StreamStats application also allows users to identify stream reaches upstream and downstream from user-selected sites and obtain information for locations along streams where activities occur that may affect streamflow conditions. This functional-ity can be accessed through a map-based interface with the user’s Web browser (fig. 1), or individual functions can be requested remotely through Web services (Ries and others, 2008).
The StreamStats Web site is http://streamstats.usgs.gov/. This Web site provides helpful information for the user, including definitions of basin char-acteristics, details about the functionality and limitations of the StreamStats application, user instructions, and links to access state applications.
StreamStats for North Carolina
The North Carolina (NC) StreamStats application is based on the best available elevation and stream data for the state. Basin delineations and topo-graphic basin characteristics are generated from LiDAR-derived digital eleva-tion models (DEMs) at 30-ft by 30-ft cell resolution. LiDAR-derived DEMs have several advantages over traditional elevation-data models, including better mapping of bare earth elevations in forested or vegetated areas, denser point spacing of elevation data (approximately 1 elevation point every 3 meters), and a high vertical accuracy (20 to 25 cm vertical RMSE). This is particularly important in eastern North Carolina where LiDAR data is considerably denser than previous elevation data determined using traditional methods (North Carolina Floodplain Mapping Program, 2003).
In 2007, the State of North Carolina developed a local-resolution National Hydrography Dataset (NHD) digital stream network (at an approximate 1:4,800 scale) for 19 western counties in the State. For areas where local-resolution NHD products are not available, StreamStats can be implemented by using the best-available hydrography, which currently (2012) is 1:24,000-scale NHD (U.S. Geological Survey, 2012). The local-resolution and 1:24,000-scale NHD are appended to make a continuous layer for streams across the entire State and in surrounding areas of adjacent States.
Figure 1. View of the user interface for the statewide North Carolina StreamStats application.
The NC StreamStats application uses the most current regional streamflow-regression equations and datasets of landscape characteris-tics. Basin characteristics, including rainfall data, topographic variables (such as slope and drainage area), and 1992, 2001, and 2006 National Land-Cover Datasets (NLCDs), are incorporated in the NC StreamStats application. The combination of accurate elevation surfaces for basin delineation, and basin-characteristics data available for use in regression equations is a powerful tool to evalu-ate changes in streamflow statistics as basins become more urbanized.
Application Functionality
The current (2012) functionality in the NC StreamStats application includes the following features:• Navigating and viewing base-map features
in the user interface, such as roads, streams, political boundaries, and USGS topographic maps. Current aerial imagery also is served through the NCOneMap Web-mapping service to provide the most up-to-date geospatial data available in participating counties in the State.
• Zooming in or out to different map scales based on user input of (1) a drawn rectangle surrounding an area of interest, (2) latitude and longitude coordinates, or (3) a specified scale.
• Accessing published peak-flow frequency and other streamflow statistics, basin character-istics, and descriptive information for USGS data-collection sites, plus a link to the USGS National Water Information System (NWIS) that provides access to historical and real-time data collected at selected sites.
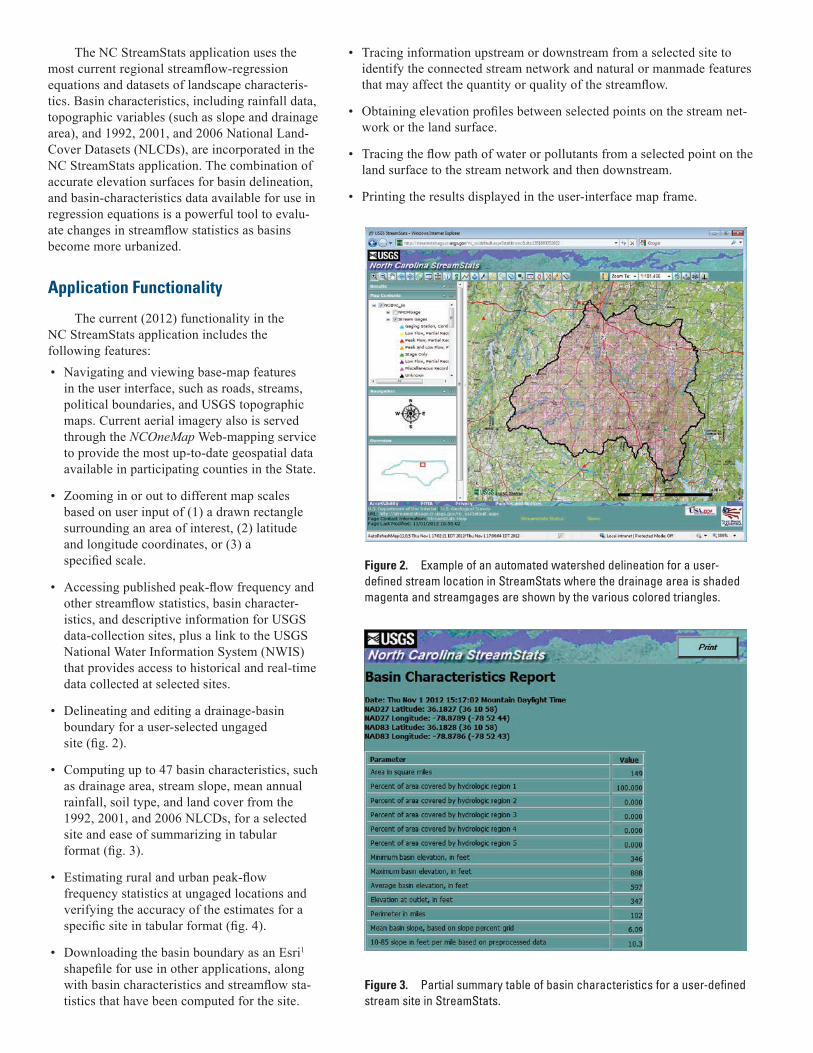
• Delineating and editing a drainage-basin boundary for a user-selected ungaged site (fig. 2).
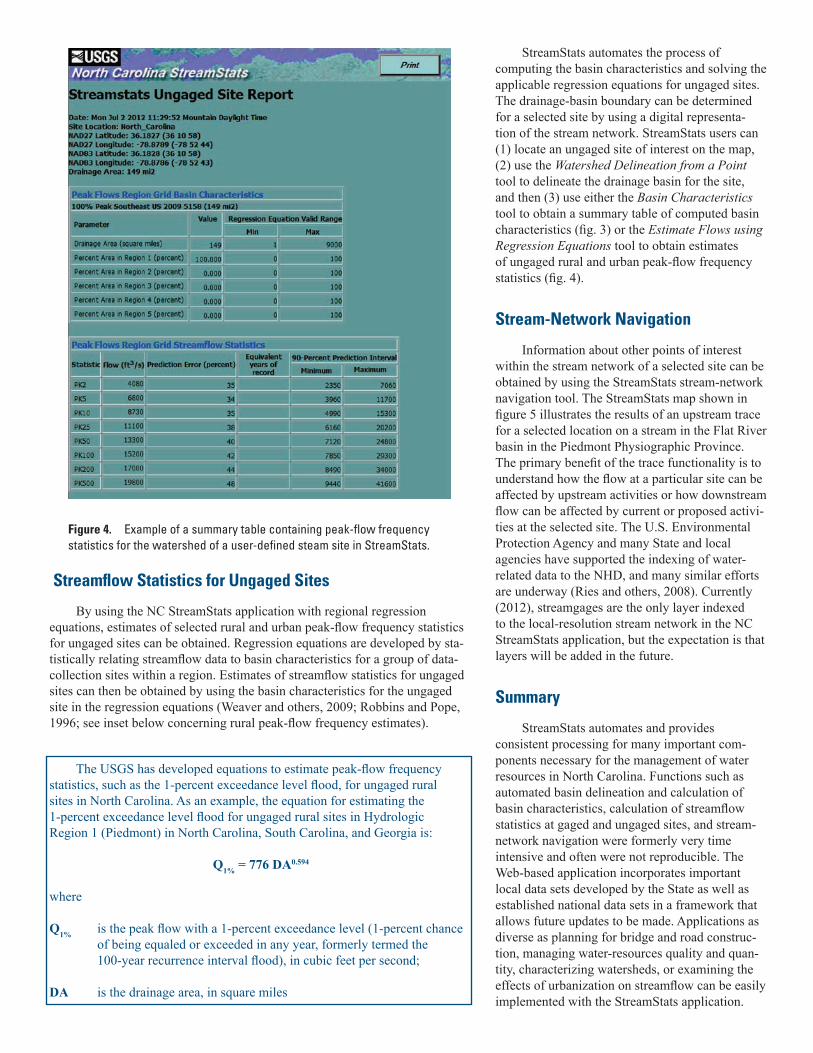
• Computing up to 47 basin characteristics, such as drainage area, stream slope, mean annual rainfall, soil type, and land cover from the 1992, 2001, and 2006 NLCDs, for a selected site and ease of summarizing in tabular format (fig. 3).
• Estimating rural and urban peak-flow frequency statistics at ungaged locations and verifying the accuracy of the estimates for a specific site in tabular format (fig. 4).
• Downloading the basin boundary as an Esri1 shapefile for use in other applications, along with basin characteristics and streamflow sta-tistics that have been computed for the site.
Figure 2. Example of an automated watershed delineation for a user-defined stream location in StreamStats where the drainage area is shaded magenta and streamgages are shown by the various colored triangles.
Figure 3. Partial summary table of basin characteristics for a user-defined stream site in StreamStats.
• Tracing information upstream or downstream from a selected site to identify the connected stream network and natural or manmade features that may affect the quantity or quality of the streamflow.
• Obtaining elevation profiles between selected points on the stream net-work or the land surface.
• Tracing the flow path of water or pollutants from a selected point on the land surface to the stream network and then downstream.
• Printing the results displayed in the user-interface map frame.
Streamflow Statistics for Ungaged Sites
By using the NC StreamStats application with regional regression equations, estimates of selected rural and urban peak-flow frequency statistics for ungaged sites can be obtained. Regression equations are developed by sta-tistically relating streamflow data to basin characteristics for a group of data-collection sites within a region. Estimates of streamflow statistics for ungaged sites can then be obtained by using the basin characteristics for the ungaged site in the regression equations (Weaver and others, 2009; Robbins and Pope, 1996; see inset below concerning rural peak-flow frequency estimates).
StreamStats automates the process of computing the basin characteristics and solving the applicable regression equations for ungaged sites. The drainage-basin boundary can be determined for a selected site by using a digital representa-tion of the stream network. StreamStats users can (1) locate an ungaged site of interest on the map, (2) use the Watershed Delineation from a Point tool to delineate the drainage basin for the site, and then (3) use either the Basin Characteristics tool to obtain a summary table of computed basin characteristics (fig. 3) or the Estimate Flows using Regression Equations tool to obtain estimates of ungaged rural and urban peak-flow frequency statistics (fig. 4).
Stream-Network Navigation
Information about other points of interest within the stream network of a selected site can be obtained by using the StreamStats stream-network navigation tool. The StreamStats map shown in figure 5 illustrates the results of an upstream trace for a selected location on a stream in the Flat River basin in the Piedmont Physiographic Province. The primary benefit of the trace functionality is to understand how the flow at a particular site can be affected by upstream activities or how downstream flow can be affected by current or proposed activi-ties at the selected site. The U.S. Environmental Protection Agency and many State and local agencies have supported the indexing of water-related data to the NHD, and many similar efforts are underway (Ries and others, 2008). Currently (2012), streamgages are the only layer indexed to the local-resolution stream network in the NC StreamStats application, but the expectation is that layers will be added in the future.
Summary
StreamStats automates and provides consistent processing for many important com-ponents necessary for the management of water resources in North Carolina. Functions such as automated basin delineation and calculation of basin characteristics, calculation of streamflow statistics at gaged and ungaged sites, and stream-network navigation were formerly very time intensive and often were not reproducible. The Web-based application incorporates important local data sets developed by the State as well as established national data sets in a framework that allows future updates to be made. Applications as diverse as planning for bridge and road construc-tion, managing water-resources quality and quan-tity, characterizing watersheds, or examining the effects of urbanization on streamflow can be easily implemented with the StreamStats application.
Figure 4. Example of a summary table containing peak-flow frequency statistics for the watershed of a user-defined steam site in StreamStats.
The USGS has developed equations to estimate peak-flow frequency statistics, such as the 1-percent exceedance level flood, for ungaged rural sites in North Carolina. As an example, the equation for estimating the 1-percent exceedance level flood for ungaged rural sites in Hydrologic Region 1 (Piedmont) in North Carolina, South Carolina, and Georgia is:
Q1% = 776 DA0.594
where
Q1% is the peak flow with a 1-percent exceedance level (1-percent chance of being equaled or exceeded in any year, formerly termed the 100-year recurrence interval flood), in cubic feet per second;
DA is the drainage area, in square miles
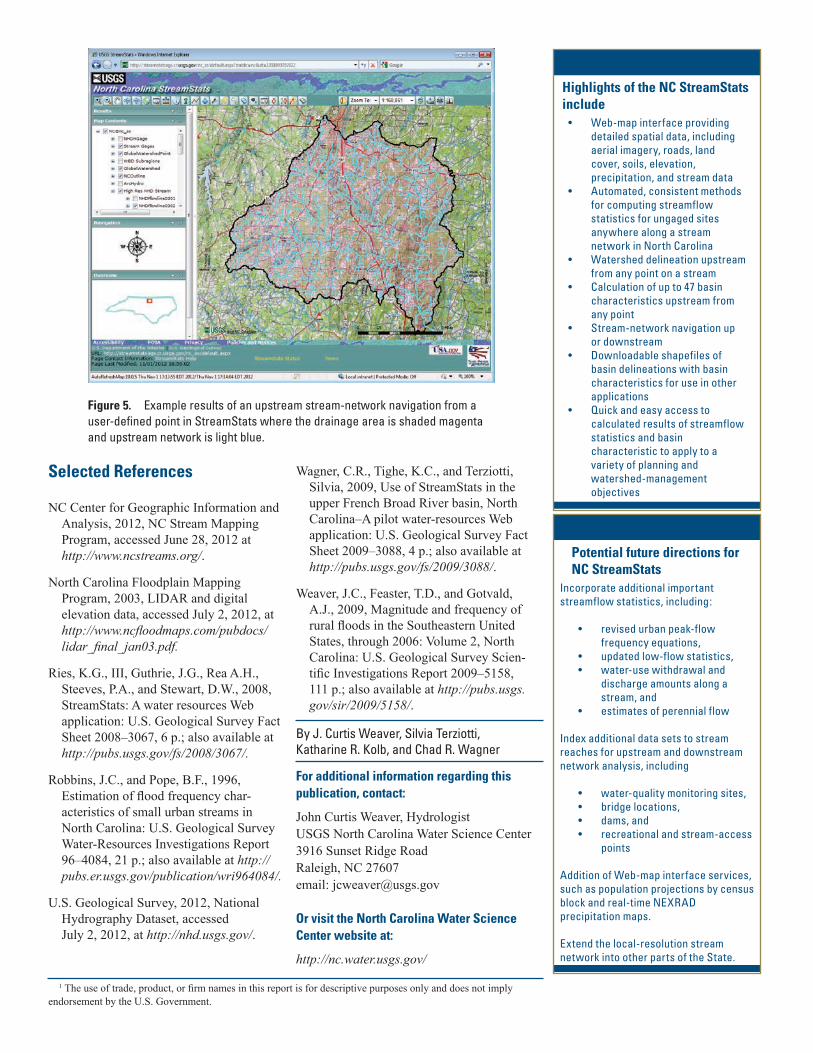
Figure 5. Example results of an upstream stream-network navigation from a user-defined point in StreamStats where the drainage area is shaded magenta and upstream network is light blue.
Selected References
NC Center for Geographic Information and Analysis, 2012, NC Stream Mapping Program, accessed June 28, 2012 at http://www.ncstreams.org/.
North Carolina Floodplain Mapping Program, 2003, LIDAR and digital elevation data, accessed July 2, 2012, at http://www.ncfloodmaps.com/pubdocs/lidar_final_jan03.pdf.
Ries, K.G., III, Guthrie, J.G., Rea A.H., Steeves, P.A., and Stewart, D.W., 2008, StreamStats: A water resources Web application: U.S. Geological Survey Fact Sheet 2008–3067, 6 p.; also available at http://pubs.usgs.gov/fs/2008/3067/.
Robbins, J.C., and Pope, B.F., 1996, Estimation of flood frequency char-acteristics of small urban streams in North Carolina: U.S. Geological Survey Water-Resources Investigations Report 96–4084, 21 p.; also available at http://pubs.er.usgs.gov/publication/wri964084/.
U.S. Geological Survey, 2012, National Hydrography Dataset, accessed July 2, 2012, at http://nhd.usgs.gov/.
For additional information regarding this publication, contact:
John Curtis Weaver, HydrologistUSGS North Carolina Water Science Center3916 Sunset Ridge RoadRaleigh, NC 27607email: [email protected]
Or visit the North Carolina Water Science Center website at:
http://nc.water.usgs.gov/
Wagner, C.R., Tighe, K.C., and Terziotti, Silvia, 2009, Use of StreamStats in the upper French Broad River basin, North Carolina–A pilot water-resources Web application: U.S. Geological Survey Fact Sheet 2009–3088, 4 p.; also available at http://pubs.usgs.gov/fs/2009/3088/.
Weaver, J.C., Feaster, T.D., and Gotvald, A.J., 2009, Magnitude and frequency of rural floods in the Southeastern United States, through 2006: Volume 2, North Carolina: U.S. Geological Survey Scien-tific Investigations Report 2009–5158, 111 p.; also available at http://pubs.usgs.gov/sir/2009/5158/.
By J. Curtis Weaver, Silvia Terziotti, Katharine R. Kolb, and Chad R. Wagner
1 The use of trade, product, or firm names in this report is for descriptive purposes only and does not imply endorsement by the U.S. Government.
Highlights of the NC StreamStats include
Potential future directions for NC StreamStats
• Web-map interface providing detailed spatial data, including aerial imagery, roads, land cover, soils, elevation, precipitation, and stream data• Automated, consistent methods for computing streamflow statistics for ungaged sites anywhere along a stream network in North Carolina• Watershed delineation upstream from any point on a stream• Calculation of up to 47 basin characteristics upstream from any point• Stream-network navigation up or downstream• Downloadable shapefiles of basin delineations with basin characteristics for use in other applications• Quick and easy access to calculated results of streamflow statistics and basin characteristic to apply to a variety of planning and watershed-management objectives
Incorporate additional importantstreamflow statistics, including:
• revised urban peak-flow frequency equations,• updated low-flow statistics,• water-use withdrawal and discharge amounts along a stream, and • estimates of perennial flow
Index additional data sets to streamreaches for upstream and downstreamnetwork analysis, including
• water-quality monitoring sites, • bridge locations,• dams, and• recreational and stream-access points
Addition of Web-map interface services, such as population projections by censusblock and real-time NEXRADprecipitation maps.
Extend the local-resolution streamnetwork into other parts of the State.