Embed Size (px)
Citation preview

A Streamflow Statistics (StreamStats) Web Application for Ohio
By G. F. Koltun, Stephanie P. Kula, and Barry M. Puskas
U.S. Department of the InteriorU.S. Geological Survey
In cooperation with the Ohio Department of Transportation; U.S. Department of Transportation, Federal Highway Administration; Federal Emergency Management Agency; Ohio Environmental Protection Agency; and Ohio Department of Natural Resources
Scientific Investigations Report 2006-5312

U.S. Department of the InteriorDIRK KEMPTHORNE, Secretary
U.S. Geological SurveyMark D. Myers, Director
U.S. Geological Survey, Reston, Virginia: 2006For sale by U.S. Geological Survey, Information ServicesBox 25286, Denver Federal CenterDenver, CO 80225
The contents of this report do not necessarily reflect the official views or policies of the Ohio Department of Transpor-tation or the Federal Highway Administration. This report does not constitute a standard, specification or regulation.
For more information about the USGS and its products:Telephone: 1-888-ASK-USGSWorld Wide Web: http://www.usgs.gov/
Any use of trade, product, or firm names in this publication is for descriptive purposes only and does not imply endorse-ment by the U.S. Government.
Although this report is in the public domain, permission must be secured from the individual copyright owners to repro-duce any copyrighted materials contained within this report.
Suggested citation:
Koltun, G.F., Kula, S.P., and Puskas, B.M., 2006, A Streamflow Statistics (StreamStats) Web Application for Ohio:U.S. Geological Survey Scientific Investigations Report 2006-5312, 62 p.

3. Recipient’s Catalog No.
5. Report Date
October 2006
6. Performing Organization Code
8. Performing Organization Report No.
SIR 06-5312
10. Work Unit No. (TRAIS)
11. Contract or Grant No.
State Job No. 134265
13. Type of Report and Period Covered
Final Report
14. Sponsoring Agency Code
2.Government Accession No.1. Report No.
FHWA/OH-2006/25
4. Title and Subtitle
A Streamflow Statistics (StreamStats) Web Application for Ohio
7. Author(s)
G.F. Koltun, Stephanie P. Kula, and Barry M. Puskas
9. Performing Organization Name and Address
U.S. Dept. of Interior, U.S. Geological SurveyWater Resources Division6480 Doubletree AvenueColumbus, OH 43229-1111
12. Sponsoring Agency Name and Address
Ohio Department of Transportation1980 West Broad StreetColumbus, OH 4322315. Supplementary Notes
Prepared in cooperation with the Federal Emergency Management Agency, Ohio Environmental Protection Agency, and Ohio Department of Natural Resources
16. Abstract
A StreamStats Web application was developed for Ohio that implements equations for estimating a variety of streamflow statistics including the 2-, 5-, 10-, 25-, 50-, 100-, and 500-year peak streamflows, mean annual streamflow, mean monthly streamflows, harmonic mean streamflow, and 25th-, 50th-, and 75th-percentile stream-flows. StreamStats is a Web-based geographic information system application designed to facilitate the estimation of streamflow statistics at ungaged locations on streams. StreamStats can also serve precomputed streamflow statistics determined from streamflow-gaging station data. The basic structure, use, and limitations of Stream-Stats are described in this report.
To facilitate the level of automation required for the StreamStats application, the technique used by Koltun (2003) for computing main-channel slope was replaced with a new computationally robust technique. The new channel slope characteristic, referred to as SL10-85, differed from the National Hydrography Data based channel slope values (SL) reported by Koltun (2003) by an average of -28.3 percent, with the median change being -13.2 percent. In spite of the differences, the two slope measures are strongly correlated.
The change in channel slope values necessitated revision of the full-model equations for flood-peak discharges presented by Koltun (2003). Average standard errors of prediction for the revised full-model equations presented in this report increased by a small amount over those reported by Koltun (2003), with increases ranging from 0.7 to 0.9 percent. Mean percentage changes in the revised regression and weighted flood-frequency estimates rela-tive to regression and weighted estimates reported by Koltun (2003) were small, ranging from -0.72 to -0.25 per-cent and -0.22 to 0.07 percent, respectively.
17. Key Words
Flood frequency, flood-peak estimation, flood-peak discharge, streamflow statistics, StreamStats
18. Distribution Statement
No Restrictions. This document is available to the public through the National Technical Information Service, Springfield, Virginia 22161
19. Security Classif. (of this report)
Unclassified
20. Security Classif. (of this page)
Unclassified
21. No. of Pages
62
22. Price
Form DOT F 1700.7 (8-72) Reproduction of completed page authorized


v
Contents
Abstract .................................................................................................................................................................. 1Introduction ............................................................................................................................................................ 1Purpose and Scope ............................................................................................................................................... 2Methods .................................................................................................................................................................. 2Processing of Geospatial Datasets ......................................................................................................... 2Determination of Channel Slope ............................................................................................................... 3Generalized Least-Squares Regression Analysis .................................................................................. 9
StreamStats............................................................................................................................................................. 12Limitations .............................................................................................................................................................. 13Acknowledgments ................................................................................................................................................. 14Summary.................................................................................................................................................................. 14References .............................................................................................................................................................. 14Appendixes.............................................................................................................................................................. 56
1. Appendix A — Statistical techniques for determining confidence intervals and testing for extrapolation .................................................................................................................................. 57
2. Appendix B — Basin characteristics used as regressor variables .............................................. 62
Figures
1. Locations of streamflow-gaging stations used in the analyses .......................................................... 10
Tables
1. Selected basin characteristics of streamflow-gaging stations.......................................................... 32. Statistics of selected basin characteristics, by region, for streamflow-gaging stations used
in the regression analyses....................................................................................................................... 113. Full-model equations for estimating flood-peak discharges of rural, unregulated streams in
Ohio ............................................................................................................................................................. 114. Simple equations for estimating flood-peak discharges of rural, unregulated streams in Ohio... 125. Flood-frequency data for streamflow-gaging stations......................................................................... 176. Statistics of percent differences between old and new flood-frequency estimates...................... 137. Matrix for the simple equations in table 4............................................................................. 588. Matrix for the full-model equations in table 3...................................................................... 599. Model error variances and maximum mean-square sampling errors for regression models ........ 60
XTΛ 1– X{ } 1–
XTΛ 1– X{ } 1–

vi
Conversion Factors
Multiply By To obtain
Length
inch (in.) 25.4 millimeterfoot (ft) 0.3048 metermile (mi) 1.609 kilometer
Volume
ounce, fluid (fl. oz) 0.02957 liter gallon (gal) 3.785 litercubic inch (in3) 0.01639 liter
Area
square mile (mi2) 2.590 square kilometer
Flow rate
cubic foot per second (ft3/s) 0.02832 cubic meter per secondmillion gallons per day (Mgal/d) 0.04381 cubic meter per second

Abstract 1
A Streamflow Statistics (StreamStats) Web Application for OhioBy G. F. Koltun, Stephanie P. Kula, and Barry M. Puskas
Abstract
A StreamStats Web application was developed for Ohio that implements equations for estimating a variety of stream-flow statistics including the 2-, 5-, 10-, 25-, 50-, 100-, and 500-year peak streamflows, mean annual streamflow, mean monthly streamflows, harmonic mean streamflow, and 25th-, 50th-, and 75th-percentile streamflows. StreamStats is a Web-based geo-graphic information system application designed to facilitate the estimation of streamflow statistics at ungaged locations on streams. StreamStats can also serve precomputed streamflow statistics determined from streamflow-gaging station data. The basic structure, use, and limitations of StreamStats are described in this report.
To facilitate the level of automation required for Ohio’s StreamStats application, the technique used by Koltun (2003)1 for computing main-channel slope was replaced with a new computationally robust technique. The new channel-slope char-acteristic, referred to as SL10-85, differed from the National Hydrography Data based channel slope values (SL) reported by Koltun (2003)1 by an average of -28.3 percent, with the median change being -13.2 percent. In spite of the differences, the two slope measures are strongly correlated.
The change in channel slope values resulting from the change in computational method necessitated revision of the full-model equations for flood-peak discharges originally pre-sented by Koltun (2003)1. Average standard errors of prediction for the revised full-model equations presented in this report increased by a small amount over those reported by Koltun (2003)1, with increases ranging from 0.7 to 0.9 percent. Mean percentage changes in the revised regression and weighted flood-frequency estimates relative to regression and weighted estimates reported by Koltun (2003)1 were small, ranging from -0.72 to -0.25 percent and -0.22 to 0.07 percent, respectively.
Introduction
A variety of streamflow statistics have been determined for Ohio streamflow-gaging stations in recent years and subse-quently published in U. S. Geological Survey reports (Koltun, 2003; Koltun and Whitehead, 2002; Sherwood, 1993, and Straub, 2001). Many of those statistics are used by government agencies, engineers, scientists, and watershed groups for pur-poses of water management, permitting, and (or) design. Because streamflow statistics commonly are needed at loca-tions where there are no stream gages, several studies have been performed to develop equations for estimating streamflow sta-tistics at ungaged locations in Ohio (Koltun, 2003; Koltun and Whitehead, 2002; and Sherwood, 1993). Historically, the esti-mation equations were based on explanatory variables that were determined from maps or other hard-copy sources; however, recent equations for estimating selected streamflow statistics have been developed for streams in Ohio using digital geospa-tial datasets and Geographic Information System (GIS) technol-ogy (Koltun, 2003; Koltun and Whitehead, 2002) to derive explanatory variables. The use of a GIS can greatly improve the efficiency of estimating streamflow statistics; however, proper application of the equations with GIS-based explanatory vari-ables depends on use of digital datasets and GIS techniques that are equivalent to those used to determine measures of explana-tory variables used in the equations. Unfortunately, use of these digital datasets and GIS techniques requires significant data storage and processing, costly proprietary software programs, and a level of familiarity with GIS techniques that many users lack.
The USGS, in cooperation with Environmental Systems Research Institute (ESRI) Inc., has developed a national Web-based GIS application called StreamStats that can serve pub-lished streamflow statistics to the public and facilitate the esti-mation of streamflow statistics for ungaged sites. As described by Ries and others (2004), the StreamStats application consists of five major components: (1) a user interface that displays maps and allows users to select stream locations where they want streamflow statistics information, (2) a database that con-tains previously published streamflow statistics and descriptive information for USGS data-collection stations, (3) an auto-mated GIS process that determines drainage boundaries for user-selected ungaged sites and measures the basin characteris-tics for those sites, (4) a GIS database that stores base-map data
1Koltun, G.F., 2003, Techniques for Estimating Flood-Peak Dis-charges of Rural, Unregulated Streams in Ohio, Second Edition: U. S. Geological Survey Water-Resources Investigations Report 03-4164, 76 p

2 A Streamflow Statistics (StreamStats) Web Application for Ohio
needed for users to locate sites of interest and other geospatial data needed for measuring basin characteristics2, and (5) an automated process that takes the measured basin characteristics for ungaged sites as input, solves regression equations to esti-mate various streamflow statistics, and outputs the estimates for display to the user in a Web browser window.
The availability of StreamStats presented an opportunity to make GIS-based estimation of streamflow statistics easier, faster, and more consistent for the average user than previous manual and semiautomated techniques. Consequently, the U.S. Geological Survey (USGS), in cooperation with the Ohio Department of Transportation; U.S. Department of Transporta-tion, Federal Highway Administration; Federal Emergency Management Agency; Ohio Environmental Protection Agency; and Ohio Department of Natural Resources have implemented StreamStats for Ohio. To facilitate the level of automation required for Ohio’s StreamStats application, a new computa-tionally robust technique for estimating channel slope was implemented which, in turn, necessitated revision of the full-model equations for flood-peak discharges presented by Koltun (2003).
Purpose and Scope
The purposes of this report are to (1) present revised flood-frequency equations and estimates determined on the basis of channel slope estimates derived with a different and computationally more robust technique than previously pre-sented by Koltun(2003), and (2) describe the development, characteristics, use, and limitations of the StreamStats applica-tion constructed for Ohio that implements the revised flood-fre-quency equations as well as equations previously published for selected other streamflow characteristics.
Methods
StreamStats incorporates a web-based map and data server, a geographic information system (ArcGIS), and a hydro-logic data structure and toolbox (ArcHydro) to form an inte-grated GIS application. A large part of the effort involved in implementing StreamStats surrounds developing, quality assur-ing, and preprocessing geospatial datasets required to determine basin characteristic explanatory variables used in the regression models. The main geospatial datasets required for Ohio’s imple-mentation of StreamStats include a 10-meter (32.81 ft) digital
elevation model (DEM) developed for this study, the 1992 National Landcover Dataset (NLCD) (U.S. Geological Survey, 2000), the medium resolution (1:100,000 scale) National Hydrography Dataset (NHD) U.S. Geological Survey, 2004), a flood-region boundary dataset for Ohio (Quigley, 2003), a mean annual precipitation dataset (Whitehead, 2002a), and a stream-flow variability index dataset (Whitehead, 2002b). All geospa-tial datasets used in this study were projected to Universal Transverse Mercator, zone 17 coordinates.
Processing of Geospatial DatasetsStreamStats uses a DEM to derive the stream network
and drainage area contributing to any chosen point. Conse-quently, the accuracy and resolution of the DEM can greatly influence the accuracy of the derived stream network and drain-age area. The 10-meter (32.81 ft) DEM used in this study was, in general, developed by using the TOPOGRID command (Environmental Systems Research Institute, 2005) to convert 1:24,000 scale hypsographic coverages to grid format. Hypso-graphic coverages were not available for a small area in South-ern Michigan that drains into Ohio so the 10-meter (32.81 ft) DEM for that area was created by resampling the 30-meter (92.83 ft) National Elevation Dataset (NED) to a 10-meter (32.81 ft) grid spacing.
Several of the geospatial datasets were preprocessed to facilitate rapid determination of basin characteristics when using StreamStats and to help ensure accurate basin character-istic determinations. The preprocessing steps include (1) selec-tion of primary flow paths in those areas where the NHD indicated split flow (such as might occur when flow splits around an island in a river), (2) “walling” of basin boundaries, (3)“burning in” streams, and (4) elimination of sinks.
In split flow situations, primary flow paths were deter-mined by examining the 1:24,000 scale digital raster graphic (DRG) and(or) orthophotograph(s) of the area where the flow split occurred. The channel that appeared to carry the greatest amount of flow was selected as the primary flow path and the alternate flow path(s) removed.
The process of “walling” of basin boundaries involves artificially increasing elevations of grid cells that are co-located with known basin boundaries. Walling the basin boundaries ensures that known drainage divides are conserved. Like the burning in process, the walling process is most critical to accu-rate basin delineation in very flat terrain where small differ-ences between DEM elevations and actual land-surface elevations can result in incorrect derivation of basin divides. The basin boundaries used for walling corresponded to the most resolved hydrologic unit or basin-boundary coverages available (Natural Resources Conservation Service, 1999; U.S. Geologi-cal Survey, 1999; Michigan Department of Environmental Quality, 1998 Pennsylvania Department of Environmental Pro-tection, 1998).
The process of “burning in” streams involves artificially reducing elevations of grid cells that are co-located with stream
2In this report, the term “basin characteristic” refers to a physical or environmental characteristic that is associated with a specific drain-age area. StreamStats computes several basin characteristics on the basis of information contained in geospatial datasets.

Methods 3
lines as defined in the medium resolution (1:100,000 scale) NHD dataset. A surface-reconditioning algorithm called AGREE (Hellweger, 1997) was used to burn in streams. In addition to reducing elevations of grid cells that are co-located with stream lines, the AGREE process creates a smooth transi-tion in elevations between the stream-line grid cells and adja-cent grid cells extending a fixed distance (in this case 60 m) away and ensures that there are no in-stream elevation depres-sions along the flow path.
This stream burning process ensures that the stream net-work derived from the DEM follows the expected flow path-ways at those locations where they are defined in the NHD. That becomes most critical in flat terrain where small differences between DEM elevations and actual land-surface elevations can result in derivation of incorrect flow paths. Ideally, a high reso-lution (1:24,000 scale) NHD dataset would be used for this pur-pose; however, at the time of this writing (June, 2006), a high resolution NHD was not available for the entire state. Because of scale differences between the 1:100,000 scale medium reso-lution NHD and the 1:24,000 scale digital raster graphics (DRGs) of the 7.5 minute quadrangle topographic maps, the DEM-based flow pathways may at times be offset somewhat from the blue lines (representing streams) shown on the DRGs.
Once the DEM has been modified as described above, it is processed to remove depressions that result in non-contribut-ing area (sinks) within a drainage. The process of removing sinks commonly is referred to as “filling”. Implicit in the filling process is the assumption that the sinks are not real, but instead are artifacts in the DEM.
The filled DEM is used to develop a flow direction grid which, in turn, is used to develop a flow-accumulation grid.The flow-direction grid contains values that identify the flow direc-tion from each grid cell to one of its 8 adjacent grid cells. The flow direction is assumed to follow the path of steepest descent from one grid cell to the next. The flow-accumulation grid is created from the flow-direction grid by totaling the number of up-gradient grid cells that contribute to each individual grid cell.
A stream grid (representing the location of streams) is created from the flow-accumulation grid by determining where the flow accumulation grid values exceed a set threshold of con-tributing area (typically, 15 km2 (5.79 mi2)). The stream grid is further processed to establish linkages between stream seg-ments and determine locations of outlets from distinct catch-ments. Ultimately, flow-accumulation and outlet information are used in combination to delineate gridded representations of catchments, which subsequently are vectorized and used as clipping boundaries along with other geospatial datasets to determine basin characteristics.
Determination of Channel SlopeThe NHD-based main-channel slope characteristic (SL)
used by Koltun (2003) in Ohio’s most recent peak flow estima-tion report was abandoned in favor of a new channel slope char-
acteristic that is computationally more robust. The new channel slope characteristic (SL10-85) is computed by (a) determining the longest flowpath from the point of interest to a topographic divide, (b) determining the elevation at 10 percent of the dis-tance along the longest flowpath upstream from the point at which the flow statistic is desired (E10), (c) determining the ele-vation at 85 percent of the distance along the longest flowpath upstream from the point at which the flow statistic is desired (E85), (d) determining the length of the stream segment between points 10- and 85-percent of the distance along the longest flow-path upstream from the point at which the flow statistic is desired (L10-85), and then (e) dividing the change in elevation (E85 - E10) by L10-85.
The SL10-85 channel slope values computed for this study (table 1) differed from the SL values reported by Koltun (2003) by an average of -28.3 percent, with the median change being -13.2 percent. In spite of the differences (which were expected due to changes in method of computation), the two slope measures are strongly correlated (Pearson’s r = 0.97) and consequently should provide nearly the same information in regression models. The channel slope characteristic was the only explanatory variable that was changed from those described by Koltun (2003).
Table 1. Selected basin characteristics of streamflow-gaging stations[Bold station numbers indicate peak streamflows at this station presently (2006) are considered regulated. Station names and locations are given in table 5. Abbreviations: DA, drainage area; SL10-85, channel slope determined by 10-85 method; W, percentage of the basin area classified in the National Land Cover Dataset as the sum of water and wetlands; nd, not determined; ft/mi, feet per mile; mi2, square miles]
MapID
(fig. 1)
Stationnumber Region DA
(mi2)SL10-85(ft/mi)
W(%)
1 03022500 A 629 6.19 3.87
2 03023000 A 90.2 7.94 7.90
3 03086100 A 15.6 45.8 0.02
4 03086500 A 89.2 11.5 2.79
5 03087000 A 17.4 22.1 1.66
6 03088000 A 33.2 11.5 9.70
7 03089500 A 19.1 10.9 3.94
8 03090500 A 248 5.12 4.61
9 03092000 A 21.9 14.1 7.12
10 03092090 A 21.8 20.2 10.22
11 03092100 A 10.6 18.8 6.35
12 03092500 A 96.3 10.9 7.03

4 A Streamflow Statistics (StreamStats) Web Application for Ohio
13 03092600 A 0.21 76 4.89
14 03093000 A 97.6 10.5 10.50
15 03094900 A 8.45 15 9.66
16 03096000 A 138 4.9 11.48
17 03098500 A 66.3 6.74 5.39
18 03098700 A 14 44.6 6.65
19 03102900 A 1.13 28.1 1.86
20 03102950 A 96.7 5.47 12.94
21 03104760 A 2.26 51.5 3.87
22 03106000 A 356 5.17 0.13
23 03106500 A 398 5.79 3.36
24 03108000 B 178 8.11 0.35
25 03109000 A 6.19 53.9 0.40
26 03109500 A 496 7.89 1.42
27 03110000 B 147 9.36 1.12
28 03110980 B 0.04 457 0.00
29 03111150 B 10.3 35.5 0.00
30 03111450 B 1.31 70.4 0.99
31 03111455 B 10.9 35.8 4.33
32 03111470 B 1.57 75.9 1.59
33 03111490 B 0.44 103 1.05
34 03111500 B 123 15.2 2.34
35 03111540 A 0.34 239 0.00
36 03111548 A 97.7 13.4 1.15
37 03112000 A 281 9.84 0.31
38 03113700 A 4.95 127 0.03
39 03114000 A 134 13.6 0.84
40 03114240 A 0.53 206 0.39
Table 1. Selected basin characteristics of streamflow-gaging stations—Continued[Bold station numbers indicate peak streamflows at this station presently (2006) are considered regulated. Station names and locations are given in table 5. Abbreviations: DA, drainage area; SL10-85, channel slope determined by 10-85 method; W, percentage of the basin area classified in the National Land Cover Dataset as the sum of water and wetlands; nd, not determined; ft/mi, feet per mile; mi2, square miles]
MapID
(fig. 1)
Stationnumber Region DA
(mi2)SL10-85(ft/mi)
W(%)
41 03114500 A 458 3.65 0.25
42 03114550 A 0.88 131 0.29
43 03114600 A 1.22 126 0.00
44 03115280 A 5.45 83.7 0.22
45 03115400 A 210 5.5 0.30
46 03115410 A 0.13 301 0.00
47 03115500 A 258 4.32 0.38
48 03115510 A 1.52 110 0.02
49 03115600 A 3.46 67.1 0.31
50 03115710 A 0.19 337 0.76
51 03115973 B 3.65 9.82 5.64
52 03116000 B 174 8.11 7.20
53 03116100 B 16.4 10.3 0.78
54 03116200 B 146 6.07 2.41
55 03117000 B 518 5.24 4.76
56 03117500 B 253 3.14 2.57
57 03118000 B 43.1 4.78 4.23
58 03118500 B 175 6.71 2.57
59 03119000 B 481 4.06 2.87
60 03119700 B 14.3 40.8 1.24
61 03122500 B 1,405 2.78 3.18
62 03123400 B 0.74 137 1.07
63 03125000 B 1.64 92.2 0.17
64 03125300 A 2.26 78 0.49
65 03125450 A 1.97 105 0.55
66 03127950 B 5.45 85.1 1.76
67 03128650 A 0.55 149 1.45
68 03129000 B 2,443 1.82 1.51
Table 1. Selected basin characteristics of streamflow-gaging stations—Continued[Bold station numbers indicate peak streamflows at this station presently (2006) are considered regulated. Station names and locations are given in table 5. Abbreviations: DA, drainage area; SL10-85, channel slope determined by 10-85 method; W, percentage of the basin area classified in the National Land Cover Dataset as the sum of water and wetlands; nd, not determined; ft/mi, feet per mile; mi2, square miles]
MapID
(fig. 1)
Stationnumber Region DA
(mi2)SL10-85(ft/mi)
W(%)

Methods 5
69 03129012 A 0.01 674 0.00
70 03129014 A 0.44 250 0.08
71 03129016 A 0.12 337 0.32
72 03129300 A 0.24 55.7 0.44
73 03130500 A 5.44 34.3 2.78
74 03132000 A 136 7.37 2.26
75 03134000 A 120 10.3 1.17
76 03136000 A 948 3.03 0.52
77 03136500 A 202 8.1 1.27
78 03137000 A 455 6.35 1.10
79 03138500 A 1,505 3.04 0.30
80 03138900 A 0.9 134 0.08
81 03139000 A 464 3.62 2.54
82 03139930 A 0.54 197 0.73
83 03139940 A 1.44 137 0.30
84 03139960 A 2.38 81.8 0.23
85 03139970 A 0.19 245 0.00
86 03139980 A 4.02 67.3 0.20
87 03139990 A 7.16 40.5 0.23
88 03140000 A 27.2 21.8 0.19
89 03140010 A 0.12 305 0.85
90 03140020 A 0.06 489 0.50
91 03140030 A 0.04 386 0.00
92 03142200 A 55.6 6.41 2.00
93 03144000 A 140 10.2 0.33
94 03144500 A 5,993 1.82 0.98
95 03144800 A 1.1 27.6 0.82
96 03145500 A 82.7 13.5 0.78
Table 1. Selected basin characteristics of streamflow-gaging stations—Continued[Bold station numbers indicate peak streamflows at this station presently (2006) are considered regulated. Station names and locations are given in table 5. Abbreviations: DA, drainage area; SL10-85, channel slope determined by 10-85 method; W, percentage of the basin area classified in the National Land Cover Dataset as the sum of water and wetlands; nd, not determined; ft/mi, feet per mile; mi2, square miles]
MapID
(fig. 1)
Stationnumber Region DA
(mi2)SL10-85(ft/mi)
W(%)
97 03145600 A 3.17 20.1 2.19
98 03146000 A 116 9.57 0.92
99 03146500 A 537 8.66 1.69
100 03147000 A 672 7.74 1.45
101 03147500 A 742 6.83 0.41
102 03147900 A 10.1 40 0.23
103 03148300 A 80.6 8.88 2.49
104 03149500 A 75.7 8.29 0.34
105 03150000 A 7,422 1.54 1.11
106 03150600 A 0.99 59.3 0.15
107 03154500 A 79.4 4.86 0.06
108 03155500 A 453 4.09 0.15
109 03157000 A 89 8.63 0.25
110 03157500 A 459 5.72 0.81
111 03158100 A 1.04 97.6 0.03
112 03158220 A 1.09 93.1 0.85
113 03159450 A 1.48 73.9 0.24
114 03159500 A 943 4 0.94
115 03159540 A 156 4.09 0.30
116 03159700 A 0.7 150 0.52
117 03201440 A 1.04 82 0.00
118 03201480 A 0.7 118 0.00
119 03201550 A 0.3 206 0.24
120 03201600 A 0.98 109 0.04
121 03201700 A 1.01 104 0.00
122 03202000 A 585 1.9 0.78
123 03204500 A 256 4.74 0.07
124 03205995 A 0.73 119 0.00
Table 1. Selected basin characteristics of streamflow-gaging stations—Continued[Bold station numbers indicate peak streamflows at this station presently (2006) are considered regulated. Station names and locations are given in table 5. Abbreviations: DA, drainage area; SL10-85, channel slope determined by 10-85 method; W, percentage of the basin area classified in the National Land Cover Dataset as the sum of water and wetlands; nd, not determined; ft/mi, feet per mile; mi2, square miles]
MapID
(fig. 1)
Stationnumber Region DA
(mi2)SL10-85(ft/mi)
W(%)

6 A Streamflow Statistics (StreamStats) Web Application for Ohio
125 03207000 A 291 6.95 0.67
126 03216563 A 0.94 117 1.15
127 03217000 C 242 4.03 0.44
128 03217500 A 257 2.56 0.48
129 03218000 B 72.4 3.7 0.41
130 03219500 A 567 1.61 0.75
131 03219590 A 83.2 4.72 0.52
132 03220000 A 178 4.92 0.75
133 03221000 A 980 1.65 0.74
134 03223000 A 157 5.61 0.74
135 03224000 A 25.4 9.48 0.08
136 03224500 A 98.7 11.5 0.74
137 03225500 A 393 3.93 0.76
138 03226200 A 5.84 8.12 0.84
139 03226850 A 0.4 50.6 0.99
140 03228000 A 11 28.8 0.65
141 03228300 A 101 6.92 0.89
142 03228500 A 190 10.1 0.59
143 03228805 A 122 9.6 0.00
144 03229000 A 189 6.69 0.46
145 03229500 A 544 7.93 1.87
146 03230500 A 534 4.6 0.80
147 03230600 A 5.66 54.1 0.27
148 03230800 A 228 7.03 0.67
149 03231000 A 333 5.98 0.54
150 03231500 A 3,849 2.41 1.25
151 03231600 A 3.82 10 0.15
152 03232000 A 249 3.96 0.15
Table 1. Selected basin characteristics of streamflow-gaging stations—Continued[Bold station numbers indicate peak streamflows at this station presently (2006) are considered regulated. Station names and locations are given in table 5. Abbreviations: DA, drainage area; SL10-85, channel slope determined by 10-85 method; W, percentage of the basin area classified in the National Land Cover Dataset as the sum of water and wetlands; nd, not determined; ft/mi, feet per mile; mi2, square miles]
MapID
(fig. 1)
Stationnumber Region DA
(mi2)SL10-85(ft/mi)
W(%)
153 03232300 A 209 4.78 0.21
154 03232500 A 140 9.41 0.41
155 03234000 A 807 5.19 0.73
156 03234100 A 9.6 49.5 0.24
157 03234500 A 5,131 2.34 1.05
158 03235000 A 11.5 27.2 0.04
159 03235080 A 3.13 55.9 0.21
160 03235200 A 0.89 118 0.04
161 03235400 A 0.3 226 0.00
162 03235500 A 1.35 143 0.00
163 03235995 A 268 11.9 0.35
164 03236090 A 1.28 77.8 0.20
165 03236100 A 3.76 37.9 0.13
166 03237095 A 1.22 117 0.12
167 03237210 A 1.04 172 0.03
168 03237280 C 12.2 68.5 0.01
169 03237300 C 0.89 54.5 0.12
170 03237500 C 387 8.78 0.41
171 03238030 C 1.9 57 0.10
172 03238400 C 0.88 22.9 0.00
173 03238500 C 218 7.41 0.35
174 03239000 A 48.9 11.1 0.20
175 03239500 A 28.9 10 1.45
176 03240000 A 129 13 0.60
177 03240500 A 28.9 6.91 0.21
178 03241000 A 17.1 6.39 0.06
179 03241500 A 63.2 12.3 0.19
180 03241600 A 4.21 24 0.05
Table 1. Selected basin characteristics of streamflow-gaging stations—Continued[Bold station numbers indicate peak streamflows at this station presently (2006) are considered regulated. Station names and locations are given in table 5. Abbreviations: DA, drainage area; SL10-85, channel slope determined by 10-85 method; W, percentage of the basin area classified in the National Land Cover Dataset as the sum of water and wetlands; nd, not determined; ft/mi, feet per mile; mi2, square miles]
MapID
(fig. 1)
Stationnumber Region DA
(mi2)SL10-85(ft/mi)
W(%)

Methods 7
181 03242050 A 366 9.14 0.54
182 03242100 A 1.01 77.5 0.04
183 03242150 A 71.4 11 0.49
184 03242200 A 77.8 6.93 0.25
185 03242300 A 209 7.97 0.00
186 03242500 A 680 7.19 0.00
187 03244000 C 219 11.1 0.87
188 03245500 C 1,203 6.19 0.70
189 03246500 C 237 5.17 0.47
190 03247100 C 3.34 22.8 0.26
191 03247500 C 476 6.9 0.52
192 03248000 C 1,713 6.07 1.12
193 03254400 C 13.6 32.9 0.00
194 03255500 C 73 8.58 0.36
195 03258000 C 35.6 20.2 0.26
196 03260700 A 36.3 27.3 0.78
197 03260800 A 59.1 23.6 0.78
198 03261500 A 541 2.79 2.10
199 03262750 A 0.83 76.2 0.17
200 03263100 A 3.11 48.5 0.07
201 03263700 A 4.83 18.5 0.14
202 03264000 A 193 5.01 0.92
203 03265000 A 503 5.39 0.58
204 03265100 A 0.46 21.3 0.05
205 03266500 A 7.31 33.2 1.02
206 03267000 A 162 11.3 0.39
207 03267900 A 310 8.95 0.53
208 03268000 A 65.3 18 0.56
Table 1. Selected basin characteristics of streamflow-gaging stations—Continued[Bold station numbers indicate peak streamflows at this station presently (2006) are considered regulated. Station names and locations are given in table 5. Abbreviations: DA, drainage area; SL10-85, channel slope determined by 10-85 method; W, percentage of the basin area classified in the National Land Cover Dataset as the sum of water and wetlands; nd, not determined; ft/mi, feet per mile; mi2, square miles]
MapID
(fig. 1)
Stationnumber Region DA
(mi2)SL10-85(ft/mi)
W(%)
209 03268300 A 3.33 16.6 0.36
210 03268500 A 39.2 14.7 1.36
211 03269000 A 139 14.7 0.61
212 03269500 A 490 26.1 0.58
213 03270500 A 2,511 3.24 1.01
214 03270800 C 22.7 15.6 0.22
215 03271000 C 68.7 16.2 0.33
216 03271800 C 197 9.3 0.26
217 03272695 C 0.33 129 0.11
218 03272700 C 69 15.8 0.23
219 03272800 C 120 15.5 0.57
220 03272900 C 0.94 116 0.08
221 03273500 C 307 13 0.67
222 03274000 A 3,630 3.21 0.90
223 03274100 C 0.29 84.3 0.25
224 03274880 C 0.78 52.1 0.13
225 03275500 C 121 12.1 1.05
226 03275600 C 200 11.2 1.13
227 03275800 C 0.3 103 0.00
228 03275900 C 5.39 23.3 0.19
229 03276640 C 0.25 343 0.79
230 03322500 A 262 7.54 7.75
231 03325500 A 133 7.54 1.01
232 04096515 B 48.7 13.5 6.19
233 04099060 B 1.22 18.4 1.67
234 04176000 B 463 5.28 7.78
235 04176900 B 3.52 14.6 4.37
236 04177400 B 1.84 12.1 3.91
Table 1. Selected basin characteristics of streamflow-gaging stations—Continued[Bold station numbers indicate peak streamflows at this station presently (2006) are considered regulated. Station names and locations are given in table 5. Abbreviations: DA, drainage area; SL10-85, channel slope determined by 10-85 method; W, percentage of the basin area classified in the National Land Cover Dataset as the sum of water and wetlands; nd, not determined; ft/mi, feet per mile; mi2, square miles]
MapID
(fig. 1)
Stationnumber Region DA
(mi2)SL10-85(ft/mi)
W(%)

8 A Streamflow Statistics (StreamStats) Web Application for Ohio
237 04177720 B 37.5 10.9 6.86
238 04178000 B 610 3.54 4.70
239 04179500 B 87.3 7.23 2.38
240 04180000 B 270 5.91 3.57
241 04182590 B 21.9 4.03 1.05
242 04183500 B 2,129 1.72 2.65
243 04183750 B 0.34 34.9 0.85
244 04184500 B 206 6.83 5.16
245 04184750 B 2.58 18.9 0.26
246 04184760 B 0.56 29.2 1.30
247 04185000 B 410 5.28 3.70
248 04185150 B 0.4 41.3 1.90
249 04185440 B 4.23 17.1 1.30
250 04185945 B 0.51 20.1 0.00
251 04186500 B 332 3.45 0.57
252 04186800 B 0.53 45.9 0.34
253 04187100 B 128 4.32 1.58
254 04187500 B 160 3.91 1.51
255 04187945 B 1.45 12.4 1.07
256 04188500 B 55 8.5 0.70
257 04189000 B 346 3.44 1.22
258 04189100 B 4.65 9.89 0.71
259 04189500 B 644 2.7 0.98
260 04190350 B 1.04 5.79 0.25
261 04190500 B 5.14 7.89 0.54
262 04191480 B 1.66 6.61 0.54
263 04191500 B 2,318 1.91 0.80
264 04192500 B 5,545 1.36 1.95
Table 1. Selected basin characteristics of streamflow-gaging stations—Continued[Bold station numbers indicate peak streamflows at this station presently (2006) are considered regulated. Station names and locations are given in table 5. Abbreviations: DA, drainage area; SL10-85, channel slope determined by 10-85 method; W, percentage of the basin area classified in the National Land Cover Dataset as the sum of water and wetlands; nd, not determined; ft/mi, feet per mile; mi2, square miles]
MapID
(fig. 1)
Stationnumber Region DA
(mi2)SL10-85(ft/mi)
W(%)
265 04192900 B 0.98 13.7 0.35
266 04193500 B 6,330 1.21 1.87
267 04195500 B 428 3.8 1.29
268 04196000 B 88.8 6.81 1.42
269 04196500 B 298 5.9 1.26
270 04196700 B 5.29 9.13 0.27
271 04196800 B 229 3 0.90
272 04197000 B 774 3.98 1.06
273 04197100 B 149 4.85 0.99
274 04197170 B 34.6 7.11 0.44
275 04197300 B 66.2 5.59 0.73
276 04197400 B 70.1 6.74 0.67
277 04197500 B 4.28 9.17 1.41
278 04198000 B 1,251 3.75 1.06
279 04198100 A 4.92 15.4 0.12
280 04198500 A 85.5 15.1 0.97
281 04199000 A 371 9.38 1.02
282 04199155 A 22.1 30.9 1.55
283 04199500 A 262 6.93 1.68
284 04199800 A 0.76 29.9 0.81
285 04200000 A 217 6.67 2.04
286 04200100 A 4.83 12.6 3.15
287 04200500 A 396 6.47 2.26
288 04201500 A 267 9.08 2.87
289 04202000 A 151 3.54 12.14
290 04206212 A 5.58 48.8 2.51
291 04206220 A 30.7 34.4 4.29
292 04207200 A 83.9 4.69 8.93
Table 1. Selected basin characteristics of streamflow-gaging stations—Continued[Bold station numbers indicate peak streamflows at this station presently (2006) are considered regulated. Station names and locations are given in table 5. Abbreviations: DA, drainage area; SL10-85, channel slope determined by 10-85 method; W, percentage of the basin area classified in the National Land Cover Dataset as the sum of water and wetlands; nd, not determined; ft/mi, feet per mile; mi2, square miles]
MapID
(fig. 1)
Stationnumber Region DA
(mi2)SL10-85(ft/mi)
W(%)

Methods 9
Generalized Least-Squares Regression Analysis
Generalized least-squares (GLS) regression analyses were done using data from the same 305 streamflow-gaging stations used by Koltun (2003) with the exception that SL10-85 was substituted for the NHD-based main-channel slope char-acteristic used previously (fig. 1 and table 1). Otherwise, the techniques and streamflow-gaging station data used to develop the revised regression models are identical to those described by Koltun (2003) with the exceptions that no ordi-nary least-squares regression analyses were done and no attempt was made to reevaluate flood-region boundaries or alternative model forms. Readers who are interested in more information about GLS regression or aspects of model devel-opment are referred to Koltun (2003).
Table 2 shows summary statistics of the basin charac-teristics used to develop the revised equations. Appendix B contains descriptions of the characteristics listed in table 2.
The revised GLS regression full-model equations are shown in table 3. SL10-85 was statistically significant (p ≤ 0.0001) in the revised equations. Average standard errors
of prediction for the full-model equations presented in this report increased by a small amount over those reported by Koltun (2003), with increases ranging from 0.7 to 0.9 percent. The simple-model equations reported by Koltun (2003) (table 4) were not revised because they relate peak streamflows only to drainage area, which did not change.
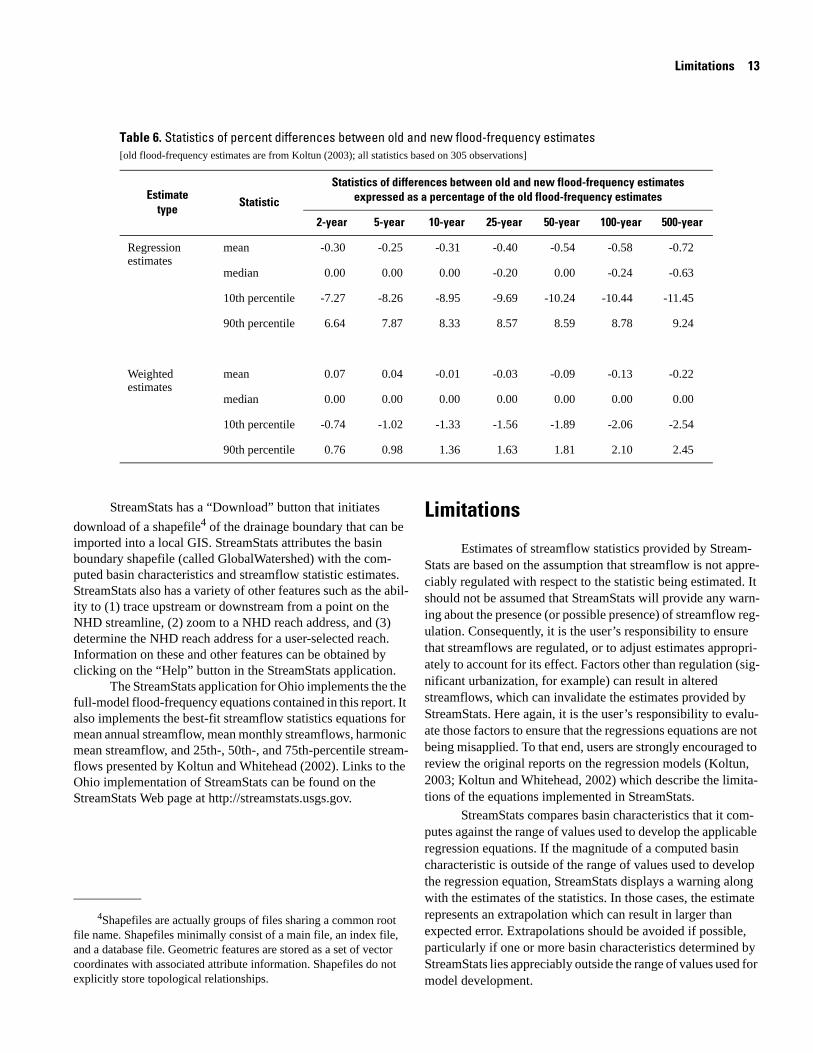
Flood-frequency estimates determined by means of the revised full-model equations are reported in table 5 (page 17) along with the at-site log-Pearson Type III estimates and esti-mates determined as a weighted average of the at-site log-Pearson Type III estimate and the regression estimate (see Koltun, 2003, for a discussion of the weighting technique). Mean percentage changes in the revised regression and weighted flood-frequency estimates relative to regression and weighted estimates reported by Koltun (2003) were small, ranging from -0.72 to -0.25 percent and -0.22 to 0.07 percent, respectively (table 6). In the most extreme case (correspond-ing to the 500-year recurrence interval), 80 percent of the revised weighted estimates changed by no more than 2.54 per-cent (table 6). The revised weighted estimates reported in table 5 do not necessarily supersede those reported by Koltun (2003). They merely represent alternative estimates based on a different set of explanatory variables.
The revision to the full-model equation necessitated revision of the matrices, model error variances, and maximum mean-square sampling errors required to determine confi-dence intervals and to test for extrapolation. Those revisions are reported in appendix A.
293 04208000 A 707 6.97 9.45
294 04209000 A 246 13.3 5.48
295 04210000 A 25.6 20 12.47
296 04210090 A 0.29 47.9 1.12
297 04210100 A 5.42 25.3 25.84
298 04211000 A 69.2 2.46 17.91
299 04211500 A 82 9.08 18.52
300 04212000 A 581 1.53 16.42
301 04212100 A 685 2.33 15.18
302 04212500 A 121 11.4 17.74
303 04212600 A 0.88 101 6.48
304 04213000 A 175 6.71 3.10
305 04213040 A 2.53 55.8 6.27
Table 1. Selected basin characteristics of streamflow-gaging stations—Continued[Bold station numbers indicate peak streamflows at this station presently (2006) are considered regulated. Station names and locations are given in table 5. Abbreviations: DA, drainage area; SL10-85, channel slope determined by 10-85 method; W, percentage of the basin area classified in the National Land Cover Dataset as the sum of water and wetlands; nd, not determined; ft/mi, feet per mile; mi2, square miles]
MapID
(fig. 1)
Stationnumber Region DA
(mi2)SL10-85(ft/mi)
W(%)

10 A Streamflow Statistics (StreamStats) Web Application for Ohio
Figure 1. Locations of streamflow-gaging stations used in the analyses.

Methods 11
where RC is the regression constant for a region taken from the following matrix:
Table 2. Statistics of selected basin characteristics, by region, for streamflow-gaging stations used in the regression analyses[DA, drainage area; SL10-85, channel slope determined by 10-85 method; W, percentage of the basin classified as water and wetlands; mi2, square miles; ft/mi, feet per mile]
Region StatisticDA
(mi2)SL10-85(ft/mi)
W(percent)
A
MaximumMinimumMeanMedian
7,422.01
290.564.3
6741.53
49.311.5
25.8.00
2.130.67
B
MaximumMinimumMeanMedian
6,330.04
41460.6
4571.21
25.67.17
7.78.00
1.951.28
C
MaximumMinimumMeanMedian
1,713.25
192.68.7
3434.03
42.015.8
1.13.00.39.26
Table 3. Full-model equations for estimating flood-peak discharges of rural, unregulated streams in Ohio[Qt, flood-peak discharge with a t-year recurrence interval, in cubic feet per second; DA, drainage area in square miles; SL10-85, channel slope in feet per mile determined from 10-85 method; W, percentage of the drainage area classified in the 1992 National Land Cover Dataset as open water and wetlands]
Equationnumber
Equation
Average standard error
of prediction(percent)
Average equivalent
years of record
1 Q2 = (RC)(DA)0.777(SL10-85)0.130(W+1)-0.187 37.0 2.1
2 Q5 = (RC)(DA)0.764(SL10-85)0.170(W+1)-0.232 34.6 3.3
3 Q10 = (RC)(DA)0.761(SL10-85)0.191(W+1)-0.253 34.4 4.4
4 Q25 = (RC)(DA)0.758(SL10-85)0.211(W+1)-0.273 35.4 5.9
5 Q50 = (RC)(DA)0.757(SL10-85)0.222(W+1)-0.285 36.5 6.8
6 Q100 = (RC)(DA)0.757(SL10-85)0.232(W+1)-0.295 37.9 7.5
7 Q500 = (RC)(DA)0.756(SL10-85)0.251(W+1)-0.314 42.1 8.6
Region Q2 Q5 Q10 Q25 Q50 Q100 Q500
A 71.4 111.1 136.8 168.7 191.9 214.7 266.0
B 50.4 75.8 91.1 108.9 121.3 132.9 157.5
C 115.6 171.4 205.4 246.2 275.2 303.1 363.8

12 A Streamflow Statistics (StreamStats) Web Application for Ohio
where RC is the regression constant for a region taken from the following matrix:
Table 4. Simple (drainage-area only) equations for estimating flood-peak discharges of rural, unregulated streams in Ohio[Qt, flood-peak discharge with a t-year recurrence interval, in cubic feet per second; DA, drainage area in square miles]
Equationnumber
Equation
Average standard error
of prediction(percent)
Average equivalent
years of record
1 Q2 = (RC)(DA)0.716 39.6 1.9
2 Q5 = (RC)(DA)0.686 39.0 2.6
3 Q10 = (RC)(DA)0.674 39.5 3.4
4 Q25 = (RC)(DA)0.663 41.1 4.4
5 Q50 = (RC)(DA)0.657 42.7 5.1
6 Q100 = (RC)(DA)0.652 44.4 5.7
7 Q500 = (RC)(DA)0.644 49.0 6.6
Region Q2 Q5 Q10 Q25 Q50 Q100 Q500
A 106.3 186.1 244.4 321.0 379.6 439.1 582.3
B 69.1 114.9 146.1 184.9 213.0 240.5 302.5
C 188.6 322.7 417.5 539.3 630.6 721.9 936.9
StreamStats
The Ohio implementation of StreamStats allows a user to select any point in Ohio (excepts points in the Ohio River and Lake Erie proper) by means of a Web-based GIS interface. Points can not be selected until the display is sufficiently zoomed in so that the “BasinDelineation” button is active (not greyed out). Once the BasinDelineation button is active and has been selected, a point can be selected by left-clicking on it. StreamStats then determines and displays the boundary of the area that drains to that point3 and requests confirmation that the displayed drainage boundary is correct. If the drainage bound-ary is not correct because the point selected lies off the intended location, the boundary can be rejected and a new point selected.
If instead the drainage boundary is not correct due to other fac-tors (for example, two areas that are separated by what would otherwise be a drainage divide could be connected by a culvert; however, that connection might not be reflected in NHD or the DEM), the derived basin boundary can be confirmed and later modified manually with the “EditBasin” tool built into the StreamStats interface. Once an acceptable drainage boundary has been defined, StreamStats can determine the other basin characteristics required to compute the desired streamflow sta-tistics by selecting the “FlowStats” button on the StreamStats toolbar. After StreamStats computes basin characteristics for a point of interest, the characteristics are passed to the USGS National Streamflow Statistics Program (NSS) (formerly referred to as the National Flood Frequency Program (Ries and others, 2002)), which computes estimates of the streamflow sta-tistics. Depending on how a particular regression model was developed and what information is supplied, NSS may compute confidence limits for a streamflow statistic. The streamflow sta-tistics and confidence limits (if applicable) are returned to the StreamStats Web interface and displayed in a pop-up window.
3Determination of the drainage boundary involves an on-the-fly delineation using the DEM from the point of interest up to where the dynamically determined boundary intersects with a static predeter-mined basin boundary. The dynamically determined boundary is merged with the static predetermined boundary to form the total drain-age boundary.
Limitations 13
Table 6. Statistics of percent differences between old and new flood-frequency estimates [old flood-frequency estimates are from Koltun (2003); all statistics based on 305 observations]
Estimatetype Statistic
Statistics of differences between old and new flood-frequency estimates expressed as a percentage of the old flood-frequency estimates
2-year 5-year 10-year 25-year 50-year 100-year 500-year
Regressionestimates
mean -0.30 -0.25 -0.31 -0.40 -0.54 -0.58 -0.72
median 0.00 0.00 0.00 -0.20 0.00 -0.24 -0.63
10th percentile -7.27 -8.26 -8.95 -9.69 -10.24 -10.44 -11.45
90th percentile 6.64 7.87 8.33 8.57 8.59 8.78 9.24
Weightedestimates
mean 0.07 0.04 -0.01 -0.03 -0.09 -0.13 -0.22
median 0.00 0.00 0.00 0.00 0.00 0.00 0.00
10th percentile -0.74 -1.02 -1.33 -1.56 -1.89 -2.06 -2.54
90th percentile 0.76 0.98 1.36 1.63 1.81 2.10 2.45
StreamStats has a “Download” button that initiates download of a shapefile4 of the drainage boundary that can be imported into a local GIS. StreamStats attributes the basin boundary shapefile (called GlobalWatershed) with the com-puted basin characteristics and streamflow statistic estimates. StreamStats also has a variety of other features such as the abil-ity to (1) trace upstream or downstream from a point on the NHD streamline, (2) zoom to a NHD reach address, and (3) determine the NHD reach address for a user-selected reach. Information on these and other features can be obtained by clicking on the “Help” button in the StreamStats application.
The StreamStats application for Ohio implements the the full-model flood-frequency equations contained in this report. It also implements the best-fit streamflow statistics equations for mean annual streamflow, mean monthly streamflows, harmonic mean streamflow, and 25th-, 50th-, and 75th-percentile stream-flows presented by Koltun and Whitehead (2002). Links to the Ohio implementation of StreamStats can be found on the StreamStats Web page at http://streamstats.usgs.gov.
Limitations
Estimates of streamflow statistics provided by Stream-Stats are based on the assumption that streamflow is not appre-ciably regulated with respect to the statistic being estimated. It should not be assumed that StreamStats will provide any warn-ing about the presence (or possible presence) of streamflow reg-ulation. Consequently, it is the user’s responsibility to ensure that streamflows are regulated, or to adjust estimates appropri-ately to account for its effect. Factors other than regulation (sig-nificant urbanization, for example) can result in altered streamflows, which can invalidate the estimates provided by StreamStats. Here again, it is the user’s responsibility to evalu-ate those factors to ensure that the regressions equations are not being misapplied. To that end, users are strongly encouraged to review the original reports on the regression models (Koltun, 2003; Koltun and Whitehead, 2002) which describe the limita-tions of the equations implemented in StreamStats.
StreamStats compares basin characteristics that it com-putes against the range of values used to develop the applicable regression equations. If the magnitude of a computed basin characteristic is outside of the range of values used to develop the regression equation, StreamStats displays a warning along with the estimates of the statistics. In those cases, the estimate represents an extrapolation which can result in larger than expected error. Extrapolations should be avoided if possible, particularly if one or more basin characteristics determined by StreamStats lies appreciably outside the range of values used for model development.
4Shapefiles are actually groups of files sharing a common root file name. Shapefiles minimally consist of a main file, an index file, and a database file. Geometric features are stored as a set of vector coordinates with associated attribute information. Shapefiles do not explicitly store topological relationships.

14 A Streamflow Statistics (StreamStats) Web Application for Ohio
The geospatial datasets used by StreamStats represent discrete approximations of continuous spatial characteristics. Although we have attempted to use the best available data, there may be errors in the datasets or other factors that result in deter-mination of inaccurate basin-characteristic measures or incor-rect basin boundaries. For example, in extremely low relief areas, the digital elevation model may not be sufficiently resolved to accurately detect some basin divides. Also, it is pos-sible that the geospatial datasets don’t reflect the current condi-tions on the landscape such as might arise if a stream channel had been rerouted subsequent to the creation of the spatial dataset. Another possible scenario that can lead to inaccuracies in basin-characteristic measures and basin boundaries is that in which a sufficiently elevated roadway embankment spans from one point on the topographic divide to another point on the divide within the same basin, resulting in what appears (on the basis of the DEM alone) to be a new topographic divide.
Because map-based drainage areas were used to develop regression estimates presented in this report, streamflow statis-tic estimates derived by selecting a gage location within StreamStats may differ somewhat from those reported in table 5. Although differences between map-based drainage areas and those determined by StreamStats were generally small (averag-ing about 0.2 percent of the map-based value), map-based drainage areas were used to develop the regression equations and estimates because it was felt that they were the most accu-rate drainage areas available. In some cases, the map-based drainage areas were based in part on field inspections or surveys in areas where locations of basin divides could not be ascer-tained with reasonable certainty from a topographic map.
Acknowledgments
The authors thank Laura Simonson, hydrologist with the USGS, for her efforts related to quality assuring and correcting hypsographic coverages used to derive the DEM developed for this study.
Summary
StreamStats is a Web-based GIS application for serving predetermined streamflow statistics and computing estimates of streamflow statistics at ungaged locations. A StreamStats appli-cation was developed for Ohio that implements the full-model flood-frequency equations contained in this report and best-fit streamflow statistics equations for mean annual streamflow, mean monthly streamflows, harmonic mean streamflow, and 25th-, 50th-, and 75th-percentile streamflows presented by Kol-tun and Whitehead (2002). Links to the Ohio implementation of StreamStats can be found on the StreamStats Web page at http://streamstats.usgs.gov.
To facilitate the level of automation required for the StreamStats application, a new computationally robust tech-nique for estimating channel slope was implemented. The new channel slope characteristic, referred to as SL10-85, differed from the NHD-based main-channel slope values (SL) reported by Koltun (2003) by an average of -28.3 percent, with the median change being -13.2 percent. In spite of the differences, the two slope measures are strongly correlated and conse-quently should provide nearly the same information in regres-sion models.
The change in channel slope values necessitated revision of the full-model equations for flood-peak discharges presented by Koltun (2003). Average standard errors of prediction for the revised full-model equations presented in this report increased by a small amount over those reported by Koltun (2003), with increases ranging from 0.7 to 0.9 percent. Mean percentage changes in the revised regression and weighted flood-frequency estimates relative to regression and weighted estimates reported by Koltun (2003) were small, ranging from -0.72 to -0.25 per-cent and -0.22 to 0.07 percent, respectively.
References
Environmental Systems Research Institute 2005, ArcInfo ver. 8 manual (on-line documentation), Environmental Systems Research Institute (ESRI), Corp. Redlands, CA
Hellweger, F.L. 1997, AGREE - DEM Surface Reconditioning System: University of Texas at Austin, accessed July 5, 2006 at http://www.ce.utexas.edu/prof/maidment/gishy-dro/ferdi/research/agree/agree.html
Koltun, G.F., 2003, Techniques for Estimating Flood-Peak Dis-charges of Rural, Unregulated Streams in Ohio, Second Edition: U. S. Geological Survey Water-Resources Inves-tigations Report 03-4164, 76 p
Koltun, G.F., and Whitehead, M.T., 2002, Techniques for Esti-mating Selected Streamflow Characteristics of Rural, Unregulated Streams in Ohio: U. S. Geological Survey Water-Resources Investigations Report 02-4068, 50 p.
Michigan Department of Environmental Quality, 1998, Water-shed Boundary Data: Michigan Department of Environ-mental Quality, accessed June 3, 2006 at http://www.dnr.state.mi.us/spatialdatalibrary/sdl/hydrography/watersheds/_Lower_Peninsula/Lower_Peninsula_Watersheds_24k.exe
Natural Resources Conservation Service, 1999, Statewide 14-digit Hydrologic Unit Dataset: Natural Resources Conser-vation Service, accessed on June 3, 2006, at ftp://ftp-fc.sc.egov.usda.gov/OH/pub/14-digit_ws/Oh14dig.zip

References 15
Pennsylvania Department of Environmental Protection, 1998, Pennsylvania—104 State Water Plan watersheds, 1998: Pennsylvania Department of Environmental Protection, accessed on June 3, 2006, at ftp://pasda.cac.psu.edu/pub/pasda/watersheds/sheds104.zip
Quigley, S.M., 2003, Flood regions for Ohio: U.S. Geological Survey data available on the World Wide Web at URL http://water.usgs.gov/lookup/getspatial?floodregions
Ries, K.G., III, and Crouse, M.Y., 2002, The National Flood Frequency Program, Version 3: A Computer Program for Estimating Magnitude and Frequency of Floods for Ungaged Sites, 2002: U.S. Geological Survey Water-Resources Investigations Report 02-4168, 42 p.
Ries, K.G., III, Steves, P.A., Coles, J.D., Rea, A.H, and Steward, D.W., 2004, StreamStats: A U.S. Geological Survey Web Application for Stream Information; U.S. Geological Sur-vey Fact Sheet FS 2004-3115, 4 p.
Sherwood, J. M., 1993, Estimation of flood volumes and simu-lation of flood hydrographs for ungaged small rural streams in Ohio: U. S. Geological Survey Water-Resources Investigations Report 93-4080, 52 p.
Straub, D.E., 2001, Low-Flow Characteristics of Streams in Ohio through Water Year 1997: U. S. Geological Survey Water-Resources Investigations Report 01-4140, 416 p.
U.S. Geological Survey, 2000, National Land Cover Dataset (version 03-16-2000): U.S. Geological Survey, accessed on June 3, 2006, at http://landcover.usgs.gov/natlland-cover.php
U.S. Geological Survey, 2004, The National Hydrography Dataset: U.S. Geological Survey, accessed June 3, 2006 at http://nhd.usgs.gov
U.S. Geological Survey, 1999, Digital Data Set of 14-Digit Hydrologic Units in Indiana: U.S. Geological Survey, accessed June 3, 2006 at http://in.water.usgs.gov/cdfact-sheet/index.shtml
Whitehead, M.T., 2002a, Mean annual precipitation for Ohio, 1931-80: U.S. Geological Survey data available on the Web, accessed June 3, 2006 at http://water.usgs.gov/lookup/getspatial?raintin
Whitehead, M.T., 2002b, Streamflow variability indices for Ohio: U.S. Geological Survey data available on the Web, accessed June 3, 2006 at http://water.usgs.gov/lookup/getspatial?varindexgrid
16 A Streamflow Statistics (StreamStats) Web Application for Ohio
FLOOD FREQUENCY TABLE

17
earson Type III estimates, the middle numbers are s, cubic feet per second.]
Record Largest recorded discharge
Years Periodused
Cal-endaryear
Magni-tude(ft3/s)
19 1913, 1922-1939
1913 26,300
28 1911-1938 1913 5,250
16 1963-1978 1975 2,540
60 1942-2001 1959 9,740
12 1944-1954,1959
1950 2,210
15 1942-1955, 1959
1959 3,660
36 1942-1977 1946 1,900
12 1931-1942 1937 8,630
Table 5. Flood-frequency data for streamflow-gaging stations[Bold station numbers indicate peak streamflows at this station presently (2003) are considered regulated. For each station, the upper numbers are the log-Pregression estimates, and the lower numbers are weighted estimates. Streamflow-gaging stations are in Ohio unless indicated otherwise. Abbreviations: ft3/
MapID
(fig. 1)
Stationnumber Station name Latitude Longitude
Flood-peak discharge (ft3/s) for indicated recurrence interval, in years
2 5 10 25 50 100 500
1 03022500 French Creek at Sae-gerstown, Pa.
41°42′50″ 80°08′50″ 10,500 13,800 15,900 18,500 20,400 22,300 26,600
10,000 14,400 17,500 21,300 24,100 26,900 33,500
10,400 13,900 16,100 19,000 21,100 23,200 28,000
2 03023000 Cussewago Creek near Meadville, Pa.
41°40′20″ 80°12′55″ 1,540 2,110 2,540 3,130 3,610 4,130 5,500
2,050 2,970 3,590 4,360 4,930 5,490 6,790
1,560 2,160 2,620 3,250 3,760 4,300 5,690
3 03086100 Big Sewickley Creek near Ambridge, Pa.
40°36′27″ 80°09′49″ 622 1,010 1,320 1,790 2,180 2,630 3,870
988 1,730 2,280 3,010 3,570 4,140 5,510
659 1,110 1,500 2,070 2,540 3,050 4,400
4 03086500 Mahoning River at Alliance
40°55′58″ 81°05′41″ 2,120 3,380 4,380 5,840 7,090 8,490 12,400
2,500 3,820 4,740 5,900 6,770 7,630 9,650
2,130 3,390 4,390 5,850 7,070 8,410 12,100
5 03087000 Beech Creek near Bolton
40°55′50″ 81°08′50″ 1,080 1,580 1,910 2,310 2,600 2,890 3,530
818 1,330 1,690 2,160 2,510 2,860 3,690
1,040 1,530 1,850 2,260 2,570 2,880 3,600
6 03088000 Deer Creek at Lima-ville
40°58′45″ 81°09′35″ 1,060 1,340 1,540 1,790 1,990 2,190 2,690
956 1,410 1,720 2,100 2,390 2,660 3,310
1,050 1,350 1,560 1,840 2,050 2,270 2,800
7 03089500 Mill Creek near Berlin Center
41°00′01″ 80°58′07″ 972 1,360 1,620 1,940 2,180 2,420 2,980
714 1,100 1,360 1,690 1,930 2,170 2,730
959 1,340 1,600 1,910 2,150 2,390 2,940
8 03090500 Mahoning River below Berlin Dam near Berlin Center
41°02′54″ 81°00′05″ 5,560 7,410 8,530 9,850 10,800 11,700 13,600
4,630 6,640 8,000 9,710 11,000 12,200 15,100
5,430 7,260 8,400 9,810 10,800 11,900 14,100

18A
Streamflow
Statistics (StreamStats) W
eb Application for O
hio
1942-1993 1959 3,890
1966-2001 1979 2,810
1947-1969 1959 2,400
1927-1966 1959 8,340
1950-1962 1956 103
1927-1934, 1938-2001
1979 8,150
1947-1977 1959 1,470
1930-1943 1943 3,080
Ta[Bo pe III estimates, the middle numbers are reg et per second.]
(
Record Largest recorded discharge
s Periodused
Cal-endaryear
Magni-tude
(ft3/s)
9 03092000 Kale Creek near Price-town41°08′23″ 80°59′43″ 1,090 1,660 2,100 2,750 3,300 3,920 5,630 52
748 1,130 1,400 1,730 1,970 2,210 2,770
1,080 1,630 2,050 2,640 3,140 3,680 5,160
10 03092090 West Branch Mahoning River near Ravenna
41°09′41″ 81°11′50″ 922 1,310 1,590 1,960 2,250 2,550 3,300 36
736 1,120 1,370 1,700 1,940 2,180 2,730
914 1,300 1,570 1,930 2,210 2,500 3,210
11 03092100 Hinkley Creek near Charlestown
41°09′10″ 81°10′05″ 334 499 625 805 955 1,120 1,560 23
450 700 871 1,090 1,250 1,400 1,770
341 516 653 847 1,000 1,170 1,610
12 03092500 West Branch Mahoning River near Newton Falls
41°10′18″ 81°01′16″ 2,570 3,730 4,530 5,590 6,400 7,230 9,270 40
2,290 3,380 4,110 5,040 5,730 6,410 7,980
2,560 3,710 4,500 5,540 6,330 7,130 9,090
13 03092600 Ordnance Creek near Newton Falls
41°11′20″ 81°01′05″ 37 66 89 121 147 175 246 13
27 47 61 79 93 107 139
35 60 78 102 120 139 185
14 03093000 Eagle Creek at Pha-lanx Station
41°15′40″ 80°57′16″ 2,680 3,780 4,500 5,400 6,050 6,700 8,200 72
2,150 3,120 3,770 4,580 5,170 5,760 7,130
2,670 3,760 4,470 5,360 6,000 6,640 8,120
15 03094900 Walnut Creek at Cort-land
41°19′49″ 80°43′28″ 487 816 1,050 1,370 1,610 1,860 2,460 31
342 520 640 789 898 1,010 1,260
479 789 1,000 1,280 1,480 1,690 2,190
16 03096000 Mosquito Creek at Niles
41°11′02″ 80°45′39″ 1,580 2,450 3,060 3,840 4,450 5,050 6,510 14
2,510 3,500 4,150 4,960 5,550 6,130 7,470
1,630 2,540 3,180 4,020 4,640 5,260 6,720
ble 5. Flood-frequency data for streamflow-gaging stations—Continuedld station numbers indicate peak streamflows at this station presently (2003) are considered regulated. For each station, the upper numbers are the log-Pearson Tyression estimates, and the lower numbers are weighted estimates. Streamflow-gaging stations are in Ohio unless indicated otherwise. Abbreviations: ft3/s, cubic fe
MapID
fig. 1)
Stationnumber Station name Latitude Longitude
Flood-peak discharge (ft3/s) for indicated recurrence interval, in years
2 5 10 25 50 100 500 Year

19
35 1913, 1944-1977
1913 7,140
24 1959-1982 1959 2,140
31 1947-1977 1958 749
36 1966-2001 1986 2,740
12 1969-1980 1980 398
86 1916-2001 1924 23,000
57 1912-1932, 1934-1969
1937 19,000
76 1916-1932, 1942-1994, 1996-2001
1922 10,000
Table 5. Flood-frequency data for streamflow-gaging stations—Continued[Bold station numbers indicate peak streamflows at this station presently (2003) are considered regulated. For each station, the upper numbers are the log-Pearson Type III estimates, the middle numbers are regression estimates, and the lower numbers are weighted estimates. Streamflow-gaging stations are in Ohio unless indicated otherwise. Abbreviations: ft3/s, cubic feet per second.]
Record Largest recorded discharge
Years Periodused
Cal-endaryear
Magni-tude(ft3/s)
17 03098500 Mill Creek at Young-stown
41°04′19″ 80°41′26″ 1,470 2,410 3,190 4,350 5,360 6,510 9,790
1,680 2,470 2,990 3,650 4,140 4,620 5,730
1,480 2,420 3,170 4,280 5,220 6,260 9,140
18 03098700 Crab Creek at Young-stown
41°07′20″ 80°38′08″ 671 857 982 1,140 1,270 1,390 1,700
621 993 1,260 1,590 1,840 2,090 2,680
668 866 1,010 1,190 1,340 1,490 1,840
19 03102900 Clear Creek at Dil-worth
41°26′45″ 80°39′56″ 64 123 175 254 324 404 632
100 169 218 281 328 375 485
66 127 180 258 325 398 595
20 03102950 Pymatuning Creek at Kinsman
41°26′34″ 80°35′18″ 1,420 1,960 2,310 2,720 3,010 3,290 3,900
1,890 2,650 3,150 3,760 4,210 4,650 5,660
1,430 1,990 2,360 2,800 3,110 3,420 4,090
21 03104760 Harthegig Run near Greenfield, Pa.
41°11′10″ 80°19′38″ 175 273 342 434 505 577 756
167 281 362 466 544 622 806
174 274 347 444 519 594 777
22 03106000 Connoquenessing Creek near Zelienople, Pa.
40°49′01″ 80°14′33″ 7,970 10,700 12,600 15,100 17,000 19,000 23,800
8,290 12,700 15,800 19,800 22,800 25,800 32,900
7,980 10,800 12,800 15,400 17,400 19,500 24,600
23 03106500 Slippery Rock Creek at Wurtemburg, Pa.
40°53′02″ 80°14′02″ 7,480 10,900 13,200 16,100 18,400 20,600 26,000
7,120 10,300 12,500 15,300 17,400 19,400 24,100
7,470 10,800 13,100 16,100 18,300 20,500 25,900
24 03108000 Raccoon Creek at Moffatts Mill, Pa.
40°37′40″ 80°20′16″ 3,720 5,550 6,820 8,490 9,770 11,100 14,300
3,500 5,290 6,480 7,930 8,970 9,970 12,200
3,710 5,540 6,800 8,450 9,700 11,000 14,000
MapID
(fig. 1)
Stationnumber Station name Latitude Longitude
Flood-peak discharge (ft3/s) for indicated recurrence interval, in years
2 5 10 25 50 100 500

20A
Streamflow
Statistics (StreamStats) W
eb Application for O
hio
1947-1981 1958 1,500
1916-2001 1941 25,000
1941-2001 1952 9,580
1978-1987 1980 17
1961-1978, 1983-1985
1978 1,700
1978-1987, 1990
1990 190
1978-1987, 1990
1990 620
1978-1987 1987 222
Ta[Bo pe III estimates, the middle numbers are reg et per second.]
(
Record Largest recorded discharge
s Periodused
Cal-endaryear
Magni-tude
(ft3/s)
25 03109000 Lisbon Creek atLisbon40°46′55″ 80°45′53″ 382 614 797 1,060 1,290 1,540 2,230 35
464 815 1,080 1,420 1,680 1,950 2,590
387 630 828 1,110 1,350 1,610 2,300
26 03109500 Little Beaver Creek near East Liverpool
40°40′33″ 80°32′27″ 8,980 13,300 16,400 20,600 24,000 27,600 36,800 86
9,820 14,800 18,200 22,700 26,000 29,300 37,100
8,990 13,300 16,400 20,700 24,100 27,700 36,800
27 03110000 Yellow Creek near Hammondsville
40°32′16″ 80°43′31″ 3,020 4,390 5,420 6,840 8,000 9,240 12,500 61
2,820 4,220 5,140 6,260 7,050 7,810 9,520
3,010 4,390 5,400 6,800 7,910 9,100 12,200
28 03110980 Consol Run at Bloom-ingdale
40°19′56″ 80°48′44″ 6 12 17 24 30 37 55 10
9 18 25 34 41 48 64
7 15 21 30 37 44 61
29 03111150 Brush Run near Buf-falo, Pa.
40°11′54″ 80°24′28″ 533 933 1,240 1,670 2,010 2,380 3,310 21
490 826 1,060 1,350 1,570 1,780 2,250
529 917 1,200 1,590 1,880 2,190 2,940
30 03111450 Branson Run at Geor-getown
40°12′26″ 80°55′22″ 58 102 139 193 239 290 433 11
95 164 212 272 315 357 453
64 117 162 223 272 321 443
31 03111455 South Fork Short Creek at George-town
40°12′27″ 80°55′12″ 224 360 461 601 714 834 1,140 11
375 586 727 896 1,020 1,130 1,390
244 402 525 691 817 944 1,250
32 03111470 Little Piney Fork at Parlett
40°18′07″ 80°50′55″ 63 129 191 291 385 497 839 10
105 179 231 294 340 385 487
69 141 204 293 365 441 638
ble 5. Flood-frequency data for streamflow-gaging stations—Continuedld station numbers indicate peak streamflows at this station presently (2003) are considered regulated. For each station, the upper numbers are the log-Pearson Tyression estimates, and the lower numbers are weighted estimates. Streamflow-gaging stations are in Ohio unless indicated otherwise. Abbreviations: ft3/s, cubic fe
MapID
fig. 1)
Stationnumber Station name Latitude Longitude
Flood-peak discharge (ft3/s) for indicated recurrence interval, in years
2 5 10 25 50 100 500 Year

21
10 1978-1987 1978 73
60 1942-2001 1990 8,200
10 1978-1987 1978 180
18 1983-1987, 1989-2001
1998 5,470
60 1941-2000 1943 22,100
12 1970-1977, 1980,
1994-1996
1976 1,400
52 1927-1935, 1959-2001
1980 21,900
10 1978-1987 1981 240
Table 5. Flood-frequency data for streamflow-gaging stations—Continued[Bold station numbers indicate peak streamflows at this station presently (2003) are considered regulated. For each station, the upper numbers are the log-Pearson Type III estimates, the middle numbers are regression estimates, and the lower numbers are weighted estimates. Streamflow-gaging stations are in Ohio unless indicated otherwise. Abbreviations: ft3/s, cubic feet per second.]
Record Largest recorded discharge
Years Periodused
Cal-endaryear
Magni-tude(ft3/s)
33 03111490 Piney Fork tributary near Piney Fork
40°16′18″ 80°50′48″ 15 26 35 50 63 78 125
43 75 99 128 149 169 216
20 39 56 81 102 123 175
34 03111500 Short Creek near Dil-lonvale
40°11′36″ 80°44′04″ 2,820 4,120 4,970 6,020 6,780 7,530 9,220
2,410 3,600 4,390 5,350 6,030 6,680 8,150
2,810 4,100 4,940 5,970 6,720 7,450 9,110
35 03111540 Sloan Run tributary near Harrisville
40°09′07″ 80°52′59″ 49 133 224 388 551 756 1,430
63 124 171 236 286 338 465
52 130 199 301 386 478 726
36 03111548 Wheeling Creek below Blaine
40°04′01″ 80°48′31″ 2,620 4,040 5,030 6,320 7,300 8,290 10,700
3,050 4,800 6,040 7,630 8,830 10,000 12,900
2,650 4,140 5,200 6,600 7,660 8,730 11,300
37 03112000 Wheeling Creek at Elm Grove, W. Va.
40°02′40″ 80°39′40″ 9,120 13,700 16,800 21,100 24,300 27,700 36,000
7,290 11,400 14,400 18,200 21,100 24,000 30,900
9,040 13,500 16,700 20,800 24,000 27,200 35,300
38 03113700 Little Grave Creek near Glendale, W. Va.
39°57′40″ 80°42′04″ 495 940 1,310 1,870 2,340 2,870 4,320
462 853 1,160 1,560 1,870 2,190 2,980
489 918 1,260 1,750 2,140 2,560 3,650
39 03114000 Captina Creek at Arm-strongs Mills
39°54′31″ 80°55′27″ 6,120 9,320 11,600 14,700 17,100 19,600 25,900
4,010 6,340 8,000 10,100 11,700 13,400 17,200
6,030 9,150 11,300 14,200 16,500 18,800 24,600
40 03114240 Wood Run near Woodsfield
39°46′56″ 81°03′21″ 65 133 192 284 365 456 713
82 157 215 293 353 414 565
69 140 201 288 359 433 624
MapID
(fig. 1)
Stationnumber Station name Latitude Longitude
Flood-peak discharge (ft3/s) for indicated recurrence interval, in years
2 5 10 25 50 100 500

22A
Streamflow
Statistics (StreamStats) W
eb Application for O
hio
1875, 1916-1922, 1926-1995,
1997
1875 30,000
1966-1977 1974 585
1967-1977 1974 635
1978-1987 1981 2,020
1959-1981, 1996-2001
1998 32,300
1978-1987 1979 79
1916-1935 1935 16,800
1978-1987 1980 760
Ta[Bo pe III estimates, the middle numbers are reg et per second.]
(
Record Largest recorded discharge
s Periodused
Cal-endaryear
Magni-tude
(ft3/s)
41 03114500 Middle Island Creek atLittle, W. Va.39°28′30″ 80°59′50″ 13,500 17,600 20,400 23,900 26,600 29,300 35,900 79
9,450 14,200 17,500 21,700 24,900 28,000 35,400
13,400 17,500 20,300 23,800 26,500 29,200 35,800
42 03114550 Buffalo Run near Friendly, W. Va.
39°30′23″ 81°01′41″ 207 369 493 665 804 950 1,320 12
116 218 295 398 478 559 757
184 317 411 537 635 737 993
43 03114600 Little Buffalo Run near Friendly, W. Va.
39°30′10″ 81°00′59″ 254 416 535 697 825 959 1,290 11
156 294 401 543 653 766 1,040
228 375 481 625 739 857 1,150
44 03115280 Trail Run near Antioch 39°37′29″ 81°02′54″ 629 979 1,260 1,670 2,030 2,420 3,530 10
457 822 1,100 1,470 1,750 2,040 2,730
591 934 1,200 1,590 1,900 2,230 3,110
45 03115400 Little Muskingum River at Bloom-field
39°33′47″ 81°12′14″ 7,340 10,900 13,600 17,400 20,600 24,000 33,100 29
5,400 8,310 10,400 13,000 14,900 16,900 21,500
7,210 10,700 13,200 16,700 19,500 22,500 30,200
46 03115410 Graham Run near Bloomfield
39°32′36″ 81°12′52″ 20 40 58 84 106 130 194 10
31 62 86 119 145 172 238
23 49 72 104 129 156 223
47 03115500 Little Muskingum River at Fay
39°28′48″ 81°17′09″ 7,650 11,200 13,600 16,900 19,500 22,100 28,600 20
6,070 9,200 11,400 14,200 16,200 18,300 23,100
7,510 10,900 13,300 16,400 18,700 21,200 27,100
48 03115510 Moss Run near Wingett
39°28′24″ 81°18′52″ 221 369 493 681 847 1,040 1,590 10
181 338 458 619 743 870 1,180
211 359 479 652 794 947 1,350
ble 5. Flood-frequency data for streamflow-gaging stations—Continuedld station numbers indicate peak streamflows at this station presently (2003) are considered regulated. For each station, the upper numbers are the log-Pearson Tyression estimates, and the lower numbers are weighted estimates. Streamflow-gaging stations are in Ohio unless indicated otherwise. Abbreviations: ft3/s, cubic fe
MapID
fig. 1)
Stationnumber Station name Latitude Longitude
Flood-peak discharge (ft3/s) for indicated recurrence interval, in years
2 5 10 25 50 100 500 Year

23
33 1947-1979 1957 2,350
10 1978-1987 1984 69
10 1992-2001 1997 151
53 1913, 1927-1978
1935 2,700
26 1947-1972 1969 3,930
23 1959-1981 1969 12,500
63 1939-2001 1969 10,700
63 1939-2001 1959 15,000
Table 5. Flood-frequency data for streamflow-gaging stations—Continued[Bold station numbers indicate peak streamflows at this station presently (2003) are considered regulated. For each station, the upper numbers are the log-Pearson Type III estimates, the middle numbers are regression estimates, and the lower numbers are weighted estimates. Streamflow-gaging stations are in Ohio unless indicated otherwise. Abbreviations: ft3/s, cubic feet per second.]
Record Largest recorded discharge
Years Periodused
Cal-endaryear
Magni-tude(ft3/s)
49 03115600 Barnes Run near Sum-merfield
39°46′20″ 81°22′26″ 540 1,090 1,580 2,350 3,060 3,870 6,290
308 551 733 973 1,160 1,340 1,800
518 1,010 1,420 2,010 2,520 3,080 4,650
50 03115710 Buffalo Run tributary near Dexter City
39°39′41″ 81°26′58″ 44 52 58 64 69 74 86
38 74 102 140 169 199 273
42 60 75 97 115 134 178
51 03115973 Schocalog Run at Copley Junction
41°06′11″ 81°36′12″ 114 134 146 159 168 176 194
130 194 234 280 313 344 411
117 148 171 199 220 239 280
52 03116000 Tuscarawas River at Clinton
40°55′40″ 81°37′58″ 1,320 1,810 2,130 2,530 2,840 3,140 3,850
2,450 3,420 4,040 4,770 5,270 5,760 6,820
1,340 1,850 2,200 2,640 2,970 3,290 4,050
53 03116100 Little Chippewa Creek near Smithville
40°53′39″ 81°48′46″ 739 1,150 1,440 1,820 2,120 2,430 3,180
538 836 1,030 1,270 1,440 1,600 1,960
723 1,110 1,370 1,710 1,960 2,220 2,830
54 03116200 Chippewa Creek at Easton
40°56′47″ 81°44′35″ 1,800 3,070 4,250 6,210 8,080 10,400 17,900
2,430 3,490 4,170 4,990 5,560 6,110 7,310
1,830 3,110 4,240 6,000 7,570 9,390 14,800
55 03117000 Tuscarawas River at Massillon
40°46′13″ 81°31′27″ 4,120 5,440 6,330 7,480 8,350 9,230 11,400
5,770 7,940 9,310 10,900 12,100 13,200 15,600
4,150 5,500 6,430 7,630 8,540 9,460 11,700
56 03117500 Sandy Creek at Waynesburg
40°40′21″ 81°15′36″ 3,400 4,830 5,860 7,240 8,330 9,470 12,400
3,390 4,700 5,530 6,500 7,190 7,840 9,260
3,400 4,830 5,850 7,190 8,240 9,330 12,000
MapID
(fig. 1)
Stationnumber Station name Latitude Longitude
Flood-peak discharge (ft3/s) for indicated recurrence interval, in years
2 5 10 25 50 100 500

24A
Streamflow
Statistics (StreamStats) W
eb Application for O
hio
1942-2001 1959 2,470
1922-2001 1959 8,600
1924-1947 1937 14,200
1947-1981 1963 1,170
1913, 1924-1937
1913 62,000
1966-1986 1969 340
1937-1979 1969 378
1950-1965 1950 740
Ta[Bo pe III estimates, the middle numbers are reg et per second.]
(
Record Largest recorded discharge
s Periodused
Cal-endaryear
Magni-tude
(ft3/s)
57 03118000 Middle BranchNimishillen Creek at Canton
40°50′29″ 81°21′14″ 629 935 1,170 1,500 1,780 2,080 2,890 60
842 1,200 1,420 1,670 1,850 2,020 2,390
634 944 1,180 1,510 1,780 2,070 2,840
58 03118500 Nimishillen Creek at North Industry
40°44′03″ 81°21′08″ 3,140 4,410 5,260 6,330 7,130 7,930 9,820 80
2,810 4,040 4,830 5,770 6,430 7,070 8,470
3,140 4,400 5,240 6,300 7,080 7,870 9,720
59 03119000 Sandy Creek at Sandyville
40°38′04″ 81°22′28″ 7,200 10,500 12,700 15,300 17,200 19,000 23,000 24
5,680 7,880 9,270 10,900 12,100 13,200 15,700
7,100 10,300 12,300 14,600 16,300 17,800 21,400
60 03119700 Conotton Creek at Jewett
40°21′59″ 81°00′13″ 491 753 938 1,180 1,370 1,560 2,020 35
554 901 1,140 1,430 1,650 1,850 2,320
494 764 957 1,210 1,410 1,600 2,070
61 03122500 Tuscarawas River below Dover Dam near Dover
40°31′47″ 81°25′48″ 15,000 20,800 24,700 29,900 33,900 38,000 47,900 15
12,300 16,500 19,100 22,300 24,500 26,600 31,300
14,800 20,300 24,000 28,500 32,000 35,400 43,700
62 03123400 Dundee Creek at Dundee
40°35′35″ 81°36′13″ 147 273 369 498 600 704 956 21
66 117 154 200 234 267 343
130 227 290 368 425 483 620
63 03125000 Home Creek near New Philadelphia
40°28′06″ 81°24′10″ 121 210 274 356 419 481 624 43
129 230 302 393 460 526 678
122 213 278 363 427 491 638
64 03125300 West Branch Spencer Creek at Hendrys-burg
40°03′30″ 81°09′30″ 202 420 596 846 1,050 1,260 1,780 16
220 396 528 702 835 971 1,300
204 415 578 797 968 1,140 1,570
ble 5. Flood-frequency data for streamflow-gaging stations—Continuedld station numbers indicate peak streamflows at this station presently (2003) are considered regulated. For each station, the upper numbers are the log-Pearson Tyression estimates, and the lower numbers are weighted estimates. Streamflow-gaging stations are in Ohio unless indicated otherwise. Abbreviations: ft3/s, cubic fe
MapID
fig. 1)
Stationnumber Station name Latitude Longitude
Flood-peak discharge (ft3/s) for indicated recurrence interval, in years
2 5 10 25 50 100 500 Year

25
10 1978-1987 1978 147
11 1978-1987, 1990
1990 1,270
10 1978-1987 1981 38
17 1913, 1922-1937
1913 83,000
19 1940-1958 1946 35
65 1937-2001 1957 1,140
25 1938-1955, 1957-1963
1946 193
28 1950-1977 1969 310
Table 5. Flood-frequency data for streamflow-gaging stations—Continued[Bold station numbers indicate peak streamflows at this station presently (2003) are considered regulated. For each station, the upper numbers are the log-Pearson Type III estimates, the middle numbers are regression estimates, and the lower numbers are weighted estimates. Streamflow-gaging stations are in Ohio unless indicated otherwise. Abbreviations: ft3/s, cubic feet per second.]
Record Largest recorded discharge
Years Periodused
Cal-endaryear
Magni-tude(ft3/s)
65 03125450 Robinson Run near Hendrysburg
40°05′08″ 81°10′27″ 97 130 150 174 191 207 244
204 372 499 667 796 927 1,240
114 177 231 308 369 431 572
66 03127950 Clear Fork near Jewett 40°19′28″ 81°01′20″ 209 380 534 782 1,010 1,290 2,140
277 466 598 762 880 996 1,260
218 398 551 775 961 1,160 1,700
67 03128650 Mud Run tributary at Wainwright
40°25′07″ 81°24′57″ 11 19 26 37 47 58 89
73 134 180 241 287 334 448
16 35 55 87 114 143 216
68 03129000 Tuscarawas River at Newcomerstown
40°15′41″ 81°36′33″ 21,300 31,100 38,400 48,500 56,600 65,300 88,200
19,600 26,300 30,500 35,600 39,200 42,600 50,100
21,100 30,600 37,300 46,100 52,900 60,000 77,800
69 03129012 White Eyes Creek trib-utary near Coshocton
40°21′41″ 81°47′52″ 3 11 20 38 56 80 160
5 10 14 20 25 30 42
4 10 17 26 34 42 64
70 03129014 White Eyes Creek trib-utary near Coshocton
40°21′36″ 81°47′04″ 99 212 321 507 686 905 1,610
76 149 206 283 343 405 557
97 205 304 462 605 773 1,280
71 03129016 White Eyes Creek trib-utary near Coshocton
40°21′29″ 81°46′53″ 30 68 105 170 233 311 559
28 55 77 107 130 153 211
29 65 97 147 190 238 376
72 03129300 Whetstone Creek trib-utary near Olives-burg
40°53′15″ 82°24′25″ 42 71 93 124 150 177 249
37 68 91 121 143 166 221
42 71 93 123 148 174 239
MapID
(fig. 1)
Stationnumber Station name Latitude Longitude
Flood-peak discharge (ft3/s) for indicated recurrence interval, in years
2 5 10 25 50 100 500

26A
Streamflow
Statistics (StreamStats) W
eb Application for O
hio
1947-1978, 1987
1987 1,030
1946-1975, 1987
1987 21,300
1913, 1926-1949,
1959, 1962-1964, 1966, 1969
1969 27,000
1913, 1922-1937
1913 55,000
1954-2001 1959 38,000
1913, 1922-1974
1959 75,900
1913, 1922-1937
1913 102,000
1946, 1966-1982
1946 1,880
Ta[Bo pe III estimates, the middle numbers are reg et per second.]
(
Record Largest recorded discharge
s Periodused
Cal-endaryear
Magni-tude
(ft3/s)
73 03130500 Touby Run at Mans-field40°45′53″ 82°32′43″ 403 627 788 1,010 1,180 1,350 1,790 33
329 543 696 892 1,040 1,190 1,530
398 619 777 988 1,150 1,320 1,740
74 03132000 Clear Fork at Butler 40°35′37″ 82°25′20″ 3,310 5,430 7,250 10,100 12,700 15,800 25,100 31
3,370 5,070 6,240 7,720 8,820 9,910 12,500
3,310 5,400 7,160 9,830 12,200 14,800 22,600
75 03134000 Jerome Fork at Jerom-eville
40°48′07″ 82°12′01″ 2,540 4,090 5,430 7,590 9,570 11,900 19,200 31
3,450 5,360 6,700 8,420 9,700 11,000 14,000
2,580 4,160 5,540 7,680 9,590 11,800 18,300
76 03136000 Mohican River at Greer
40°30′53″ 82°11′44″ 10,700 15,100 18,200 22,300 25,500 28,800 37,200 17
15,700 22,900 28,000 34,400 39,200 43,900 55,100
11,000 15,800 19,300 24,100 27,800 31,600 40,900
77 03136500 Kokosing River at Mount Vernon
40°24′20″ 82°30′00″ 4,350 6,750 8,710 11,700 14,300 17,200 25,800 48
4,960 7,570 9,400 11,700 13,500 15,200 19,300
4,380 6,800 8,770 11,700 14,200 16,900 24,600
78 03137000 Kokosing River at Millwood
40°23′51″ 82°17′09″ 9,730 16,300 21,700 29,600 36,400 44,000 65,400 54
9,170 13,800 17,000 21,100 24,100 27,200 34,400
9,710 16,200 21,300 28,700 34,900 41,600 60,200
79 03138500 Walhonding River below Mohawk Dam at Nellie
40°20′29″ 82°03′56″ 19,600 28,900 34,900 42,200 47,500 52,600 63,900 17
23,100 33,800 41,300 50,900 58,000 65,200 81,900
19,900 29,400 35,800 43,700 49,500 55,100 67,900
80 03138900 Jennings Ditch tribu-tary near Wooster
40°44′45″ 81°55′48″ 76 195 331 600 895 1,300 2,830 18
123 232 315 428 514 603 819
81 202 327 541 742 983 1,740
ble 5. Flood-frequency data for streamflow-gaging stations—Continuedld station numbers indicate peak streamflows at this station presently (2003) are considered regulated. For each station, the upper numbers are the log-Pearson Tyression estimates, and the lower numbers are weighted estimates. Streamflow-gaging stations are in Ohio unless indicated otherwise. Abbreviations: ft3/s, cubic fe
MapID
fig. 1)
Stationnumber Station name Latitude Longitude
Flood-peak discharge (ft3/s) for indicated recurrence interval, in years
2 5 10 25 50 100 500 Year

27
71 1931-2001 1969 47,500
35 1937-1971 1957 382
35 1937-1971 1969 724
35 1937-1971 1957 1,404
34 1938-1971 1957 216
35 1937-1971 1957 1,590
36 1935, 1937-1971
1935 9,020
65 1937-2001 1969 8,720
Table 5. Flood-frequency data for streamflow-gaging stations—Continued[Bold station numbers indicate peak streamflows at this station presently (2003) are considered regulated. For each station, the upper numbers are the log-Pearson Type III estimates, the middle numbers are regression estimates, and the lower numbers are weighted estimates. Streamflow-gaging stations are in Ohio unless indicated otherwise. Abbreviations: ft3/s, cubic feet per second.]
Record Largest recorded discharge
Years Periodused
Cal-endaryear
Magni-tude(ft3/s)
81 03139000 Killbuck Creek at Kill-buck
40°28′53″ 81°59′10″ 3,340 5,370 7,210 10,300 13,100 16,700 28,100
7,840 11,200 13,600 16,500 18,600 20,800 25,700
3,410 5,510 7,420 10,600 13,500 16,900 27,900
82 03139930 Little Mill Creek tribu-tary near Coshocton
40°24′23″ 81°48′11″ 63 135 203 315 421 546 933
79 150 204 277 333 390 529
65 137 203 307 399 503 801
83 03139940 Little Mill Creek near Coshocton
40°24′01″ 81°47′54″ 155 306 434 626 790 972 1,470
171 319 432 583 700 819 1,110
156 308 434 618 770 935 1,370
84 03139960 Little Mill Creek near Coshocton
40°23′32″ 81°48′24″ 301 591 836 1,210 1,520 1,880 2,850
239 435 582 778 928 1,080 1,450
296 572 795 1,120 1,380 1,670 2,420
85 03139970 Little Mill Creek tribu-tary near Coshocton
40°23′33″ 81°48′19″ 26 65 105 173 237 315 552
40 80 111 152 185 219 301
27 67 106 168 221 282 452
86 03139980 Little Mill Creek near Coshocton
40°23′03″ 81°49′04″ 414 810 1,140 1,620 2,020 2,470 3,650
352 631 841 1,120 1,330 1,550 2,070
409 790 1,090 1,520 1,870 2,240 3,200
87 03139990 Little Mill Creek near Coshocton
40°21′51″ 81°50′20″ 701 1,420 2,080 3,180 4,210 5,440 9,290
513 894 1,180 1,550 1,830 2,110 2,800
689 1,360 1,960 2,880 3,700 4,640 7,410
88 03140000 Mill Creek near Coshocton
40°21′46″ 81°51′45″ 1,230 2,360 3,440 5,250 7,000 9,150 16,200
1,340 2,250 2,910 3,770 4,420 5,070 6,640
1,230 2,360 3,390 5,090 6,660 8,530 14,400
MapID
(fig. 1)
Stationnumber Station name Latitude Longitude
Flood-peak discharge (ft3/s) for indicated recurrence interval, in years
2 5 10 25 50 100 500

28A
Streamflow
Statistics (StreamStats) W
eb Application for O
hio
1940-1970 1957 240
1939-1972, 1975-2001
1957 116
1940-1969 1957 76
1957-1967 1963 3,890
1937-2001 1979 16,800
1913, 1922-1937
1913 228,000
1966-1982, 1990
1979 365
1940-1948, 1959
1959 8,700
Ta[Bo pe III estimates, the middle numbers are reg et per second.]
(
Record Largest recorded discharge
s Periodused
Cal-endaryear
Magni-tude
(ft3/s)
89 03140010 Spoon Creek tributarynear Coshocton40°22′01″ 81°47′58″ 22 57 92 154 212 283 503 31
26 50 70 95 115 136 185
22 56 87 135 177 224 356
90 03140020 Spoon Creek tributary near Coshocton
40°21′58″ 81°48′04″ 7 16 26 44 62 84 162 61
17 34 47 66 80 95 132
7 18 29 47 65 87 154
91 03140030 Spoon Creek tributary near Coshocton
40°21′27″ 81°48′11″ 14 33 50 78 104 133 214 30
13 26 37 51 63 75 104
13 31 46 68 86 106 157
92 03142200 Salt Fork near Cam-bridge
40°05′05″ 81°27′20″ 1,740 2,590 3,220 4,080 4,780 5,520 7,430 11
1,680 2,550 3,140 3,890 4,450 5,000 6,280
1,730 2,580 3,200 4,020 4,670 5,330 6,970
93 03144000 Wakatomika Creek near Frazeysburg
40°07′57″ 82°08′53″ 4,270 7,070 9,190 12,100 14,500 17,100 23,600 65
4,250 6,730 8,500 10,800 12,500 14,200 18,300
4,270 7,050 9,140 12,000 14,300 16,700 22,900
94 03144500 Muskingum River at Dresden
40°07′13″ 81°59′59″ 46,100 68,600 84,800 106,000 123,000 141,000 186,000 17
58,400 80,900 96,400 116,000 131,000 146,000 180,000
46,800 69,800 86,200 108,000 125,000 142,000 184,000
95 03144800 Etna Creek at Etna 39°58′08″ 82°40′55″ 108 191 259 359 444 538 799 18
106 183 238 310 363 417 545
107 189 252 339 409 482 667
96 03145500 Raccoon Creek at Granville
40°03′50″ 82°31′35″ 4,060 6,090 7,290 8,640 9,520 10,300 11,900 10
2,780 4,420 5,590 7,100 8,230 9,360 12,100
3,910 5,830 6,950 8,260 9,180 10,100 11,900
ble 5. Flood-frequency data for streamflow-gaging stations—Continuedld station numbers indicate peak streamflows at this station presently (2003) are considered regulated. For each station, the upper numbers are the log-Pearson Tyression estimates, and the lower numbers are weighted estimates. Streamflow-gaging stations are in Ohio unless indicated otherwise. Abbreviations: ft3/s, cubic fe
MapID
fig. 1)
Stationnumber Station name Latitude Longitude
Flood-peak discharge (ft3/s) for indicated recurrence interval, in years
2 5 10 25 50 100 500 Year

29
31 1947-1977 1959 445
24 1940-1948, 1956, 1959, 1970-1982
1979 10,200
62 1940-2001 1959 45,000
45 1903-1906, 1913,
1922-1961
1959 49,800
22 1913, 1940-1960
1959 47,000
31 1947-1977 1976 2,430
25 1963-1987 1963 5,600
14 1935-1947,2001
1940 5,240
Table 5. Flood-frequency data for streamflow-gaging stations—Continued[Bold station numbers indicate peak streamflows at this station presently (2003) are considered regulated. For each station, the upper numbers are the log-Pearson Type III estimates, the middle numbers are regression estimates, and the lower numbers are weighted estimates. Streamflow-gaging stations are in Ohio unless indicated otherwise. Abbreviations: ft3/s, cubic feet per second.]
Record Largest recorded discharge
Years Periodused
Cal-endaryear
Magni-tude(ft3/s)
97 03145600 Otter Fork near Cen-terburg
40°17′35″ 82°43′09″ 125 208 272 364 440 523 747
208 342 435 555 644 732 940
131 222 294 398 482 571 797
98 03146000 North Fork Licking River at Utica
40°13′41″ 82°27′06″ 4,910 6,360 7,310 8,500 9,380 10,300 12,400
3,400 5,300 6,640 8,360 9,640 10,900 13,900
4,780 6,240 7,210 8,470 9,430 10,400 12,700
99 03146500 Licking River near Newark
40°03′33″ 82°20′23″ 11,800 17,800 22,100 27,700 32,100 36,700 48,000
10,400 15,600 19,200 23,800 27,300 30,800 39,000
11,800 17,700 21,900 27,400 31,700 36,100 46,900
100 03147000 Licking River at Toboso
40°03′26″ 82°13′12″ 12,800 20,100 25,200 31,800 36,700 41,700 53,300
12,400 18,500 22,800 28,300 32,400 36,500 46,200
12,800 20,100 25,100 31,500 36,300 41,100 52,400
101 03147500 Licking River below Dillon Dam near Dillon Falls
39°59′18″ 82°04′50″ 13,900 24,200 32,300 43,900 53,400 63,700 90,800
14,600 22,300 27,700 34,700 40,000 45,300 57,700
14,000 24,000 31,500 41,700 49,700 58,200 79,500
102 03147900 Timber Run near Zanesville
39°57′00″ 82°03′07″ 803 1,340 1,730 2,260 2,670 3,090 4,130
670 1,160 1,530 2,000 2,370 2,740 3,620
790 1,320 1,690 2,200 2,590 2,990 3,970
103 03148300 Moxahala Creek at Roseville
39°48′38″ 82°04′13″ 2,350 3,390 4,150 5,200 6,050 6,960 9,340
2,270 3,450 4,260 5,300 6,060 6,820 8,600
2,350 3,390 4,170 5,220 6,060 6,930 9,160
104 03149500 Salt Creek near Chan-dlersville
39°54′31″ 81°51′38″ 3,180 4,130 4,720 5,430 5,940 6,440 7,560
2,570 4,060 5,120 6,470 7,490 8,510 10,900
3,100 4,120 4,810 5,710 6,390 7,080 8,660
MapID
(fig. 1)
Stationnumber Station name Latitude Longitude
Flood-peak discharge (ft3/s) for indicated recurrence interval, in years
2 5 10 25 50 100 500

30A
Streamflow
Statistics (StreamStats) W
eb Application for O
hio
1913, 1922-1937
1913 270,000
1966-1980 1980 470
1952-1978, 1997, 2000,
2002
2000 8,700
1930-1931, 1939-1994,
1997
1950 28,100
1940-2001 1948 16,000
1907, 1932-2001
1907 36,000
1966-1977 1968 370
1977-1987 1981 250
Ta[Bo pe III estimates, the middle numbers are reg et per second.]
(
Record Largest recorded discharge
s Periodused
Cal-endaryear
Magni-tude
(ft3/s)
105 03150000 Muskingum River atMcconnelsville39°38′42″ 81°51′00″ 55,800 85,800 107,000 135,000 156,000 178,000 232,000 17
66,600 91,200 108,000 130,000 146,000 162,000 199,000
56,500 86,300 107,000 134,000 154,000 175,000 224,000
106 03150600 Tupper Creek at Devola
39°28′24″ 81°27′58″ 139 224 292 391 475 569 828 15
118 214 286 381 454 527 704
134 221 290 387 466 549 764
107 03154500 Reedy Creek near Reedy, W. Va.
38°57′40″ 81°23′25″ 3,620 4,920 5,790 6,920 7,780 8,660 10,800 30
2,600 4,060 5,080 6,390 7,370 8,350 10,600
3,560 4,840 5,710 6,850 7,720 8,600 10,800
108 03155500 Hughes River at Cisco, W. Va.
39°07′07″ 81°16′39″ 14,300 19,500 22,900 27,100 30,200 33,300 40,500 59
9,660 14,600 18,100 22,600 25,900 29,200 37,100
14,200 19,300 22,600 26,700 29,800 32,900 40,100
109 03157000 Clear Creek near Rockbridge
39°35′18″ 82°34′43″ 2,630 4,100 5,310 7,160 8,790 10,700 16,200 62
2,960 4,700 5,930 7,520 8,710 9,910 12,700
2,640 4,130 5,360 7,200 8,780 10,600 15,600
110 03157500 Hocking River at Enterprise
39°33′54″ 82°28′29″ 7,010 10,900 14,100 19,000 23,300 28,300 42,800 71
9,360 14,100 17,400 21,600 24,800 27,900 35,300
7,060 11,000 14,300 19,200 23,400 28,300 42,000
111 03158100 Hayden Run near Hay-denville
39°28′57″ 82°19′06″ 83 149 207 298 381 477 765 12
133 247 335 452 541 633 855
91 173 246 355 447 547 811
112 03158220 Glen Run near Doan-ville
39°24′06″ 82°11′44″ 106 171 219 283 334 387 520 11
123 223 297 396 471 547 730
109 184 244 326 390 457 619
ble 5. Flood-frequency data for streamflow-gaging stations—Continuedld station numbers indicate peak streamflows at this station presently (2003) are considered regulated. For each station, the upper numbers are the log-Pearson Tyression estimates, and the lower numbers are weighted estimates. Streamflow-gaging stations are in Ohio unless indicated otherwise. Abbreviations: ft3/s, cubic fe
MapID
fig. 1)
Stationnumber Station name Latitude Longitude
Flood-peak discharge (ft3/s) for indicated recurrence interval, in years
2 5 10 25 50 100 500 Year

31
10 1978-1987 1981 265
90 1873, 1884, 1907, 1913, 1916-2001
1907 50,000
36 1966-2001 1997 15,600
13 1965-1977 1971 615
13 1965-1977 1973 870
13 1965-1977 1965 299
10 1978-1987 1983 125
11 1971-1981 1974 990
Table 5. Flood-frequency data for streamflow-gaging stations—Continued[Bold station numbers indicate peak streamflows at this station presently (2003) are considered regulated. For each station, the upper numbers are the log-Pearson Type III estimates, the middle numbers are regression estimates, and the lower numbers are weighted estimates. Streamflow-gaging stations are in Ohio unless indicated otherwise. Abbreviations: ft3/s, cubic feet per second.]
Record Largest recorded discharge
Years Periodused
Cal-endaryear
Magni-tude(ft3/s)
113 03159450 Mill Creek near Chauncey
39°22′46″ 82°05′04″ 120 197 256 340 409 483 679
163 296 397 529 631 734 983
128 223 302 414 504 598 830
114 03159500 Hocking River at Athens
39°19′44″ 82°05′16″ 12,200 17,700 22,000 28,200 33,300 39,000 54,500
15,400 22,600 27,600 33,900 38,600 43,400 54,400
12,200 17,900 22,200 28,400 33,600 39,200 54,500
115 03159540 Shade River near Chester
39°03′49″ 81°52′55″ 3,540 5,080 6,290 8,050 9,550 11,200 15,900
4,130 6,300 7,810 9,730 11,200 12,600 15,900
3,570 5,170 6,430 8,250 9,760 11,400 15,900
116 03159700 Grasslick Run near Ripley, W. Va.
38°45′53″ 81°40′40″ 149 243 321 442 549 672 1,030
96 180 244 329 395 462 625
137 224 293 393 476 566 807
117 03201440 Sixteenmile Creek near Pliny, W. Va.
38°38′39″ 82°02′53″ 298 474 617 831 1,020 1,220 1,820
131 242 327 439 526 614 828
253 394 498 642 761 888 1,230
118 03201480 Threemile Creek Trib-utary near Pt. Pleasant, W. Va.
38°50′15″ 82°05′42″ 134 243 326 438 526 617 839
101 190 259 351 422 495 672
126 227 301 399 476 555 749
119 03201550 Starr Run near New Plymouth
39°23′46″ 82°20′49″ 52 83 106 139 166 194 268
54 104 143 196 237 279 381
53 90 121 166 201 238 331
120 03201600 Sandy Run above Big Four Hollow Creek near Lake Hope
39°21′45″ 82°18′47″ 109 269 446 783 1,140 1,610 3,340
129 241 327 441 530 620 840
113 260 397 607 789 994 1,590
MapID
(fig. 1)
Stationnumber Station name Latitude Longitude
Flood-peak discharge (ft3/s) for indicated recurrence interval, in years
2 5 10 25 50 100 500

32A
Streamflow
Statistics (StreamStats) W
eb Application for O
hio
1971-1983 1974 1,200
1916-1935, 1937,
1939-1985, 1992-2001
1968 20,000
1938-1980, 1997
1979 20,700
1978-1987 1979 242
1916-1922, 1928-1931,
1939, 1947-1966
1939 22,000
1976-1987 1980 378
1934, 1937, 1941-2000
1997 34,400
1913, 1927-1935, 1938-1951,
1959
1959 16,300
Ta[Bo pe III estimates, the middle numbers are reg et per second.]
(
Record Largest recorded discharge
s Periodused
Cal-endaryear
Magni-tude
(ft3/s)
121 03201700 Big Four HollowCreek near Lake Hope
39°21′48″ 82°18′51″ 118 308 528 970 1,460 2,130 4,760 13
132 247 334 452 542 635 859
121 289 452 712 945 1,210 2,030
122 03202000 Raccoon Creek at Adamsville
38°51′32″ 82°21′43″ 6,090 8,990 11,100 14,100 16,500 19,100 25,900 78
9,820 14,100 17,000 20,700 23,400 26,100 32,300
6,150 9,120 11,300 14,400 16,900 19,500 26,300
123 03204500 Mud River near Milton, W. Va.
38°23′18″ 82°06′48″ 6,260 9,930 12,900 17,200 20,900 25,000 36,500 44
6,410 9,860 12,300 15,400 17,700 20,100 25,500
6,270 9,920 12,800 17,000 20,500 24,300 34,700
124 03205995 Sandusky Creek near Burlington
38°25′03″ 82°30′36″ 100 143 175 219 254 291 388 10
104 197 268 364 437 513 696
101 160 209 279 336 396 543
125 03207000 Twelvepole Creek at Wayne, W. Va.
38°13′05″ 82°26′55″ 6,470 10,100 12,800 16,400 19,300 22,300 30,000 32
6,840 10,500 13,000 16,300 18,700 21,200 26,900
6,490 10,100 12,800 16,400 19,200 22,100 29,500
126 03216563 Mile Branch near Rush, Ky.
38°21′50″ 82°47′45″ 192 273 327 395 445 495 613 12
110 199 267 356 423 492 659
172 251 306 379 436 494 635
127 03217000 Tygarts Creek near Greenup, Ky.
38°33′51″ 82°57′08″ 7,090 11,600 15,200 20,300 24,700 29,400 42,500 62
9,180 13,200 15,900 19,200 21,600 23,900 29,200
7,140 11,700 15,200 20,300 24,400 28,900 40,900
128 03217500 Scioto River at Larue 40°34′28″ 83°23′15″ 5,300 7,960 9,640 11,600 13,000 14,300 17,200 25
5,590 8,270 10,100 12,400 14,200 15,900 19,800
5,310 7,990 9,690 11,700 13,200 14,600 17,600
ble 5. Flood-frequency data for streamflow-gaging stations—Continuedld station numbers indicate peak streamflows at this station presently (2003) are considered regulated. For each station, the upper numbers are the log-Pearson Tyression estimates, and the lower numbers are weighted estimates. Streamflow-gaging stations are in Ohio unless indicated otherwise. Abbreviations: ft3/s, cubic fe
MapID
fig. 1)
Stationnumber Station name Latitude Longitude
Flood-peak discharge (ft3/s) for indicated recurrence interval, in years
2 5 10 25 50 100 500 Year

33
38 1939-1976 1959 5,160
88 1913, 1915-2001
1913 27,000
16 1982-1997 1987 4,420
60 1913, 1943-2001
1997 21,800
81 1913, 1922-2001
1913 74,500
55 1947-2001 1959 14,900
10 1947-1955, 1959
1959 4,120
20 1955-1974 1959 19,100
Table 5. Flood-frequency data for streamflow-gaging stations—Continued[Bold station numbers indicate peak streamflows at this station presently (2003) are considered regulated. For each station, the upper numbers are the log-Pearson Type III estimates, the middle numbers are regression estimates, and the lower numbers are weighted estimates. Streamflow-gaging stations are in Ohio unless indicated otherwise. Abbreviations: ft3/s, cubic feet per second.]
Record Largest recorded discharge
Years Periodused
Cal-endaryear
Magni-tude(ft3/s)
129 03218000 Little Scioto River above Marion
40°37′43″ 83°10′11″ 1,090 1,710 2,200 2,900 3,500 4,140 5,920
1,560 2,300 2,780 3,360 3,760 4,150 5,010
1,100 1,750 2,250 2,950 3,530 4,150 5,760
130 03219500 Scioto River near Prospect
40°25′10″ 83°11′50″ 6,000 8,100 9,400 10,900 12,000 13,100 15,400
9,420 13,500 16,200 19,600 22,200 24,700 30,500
6,050 8,210 9,580 11,200 12,400 13,600 16,100
131 03219590 Bokes Creek near Warrensburg
40°19′20″ 83°10′30″ 2,010 2,990 3,640 4,460 5,070 5,660 7,030
2,500 3,850 4,780 5,960 6,840 7,710 9,760
2,050 3,100 3,840 4,780 5,490 6,190 7,800
132 03220000 Mill Creek near Belle-point
40°14′54″ 83°10′26″ 4,640 6,900 8,600 11,000 13,000 15,100 20,900
4,430 6,710 8,290 10,300 11,800 13,300 16,800
4,630 6,890 8,580 11,000 12,900 15,000 20,400
133 03221000 Scioto River below O’Shaughnessy Dam near Dublin
40°08′36″ 83°07′14″ 12,900 19,600 24,500 31,300 36,700 42,500 57,400
14,200 20,200 24,200 29,200 33,000 36,700 45,200
12,900 19,600 24,500 31,200 36,500 42,100 56,400
134 03223000 Olentangy River at Claridon
40°34′58″ 82°59′20″ 3,110 4,690 5,950 7,780 9,330 11,100 15,900
4,090 6,240 7,740 9,650 11,100 12,500 15,800
3,130 4,760 6,050 7,910 9,480 11,200 15,900
135 03224000 Shaw Creek at Shaw-town
40°29′00″ 82°57′25″ 807 1,120 1,340 1,650 1,890 2,150 2,830
1,160 1,900 2,420 3,090 3,590 4,090 5,280
840 1,220 1,520 1,940 2,270 2,620 3,490
136 03224500 Whetstone Creek near Ashley
40°27′18″ 82°57′28″ 2,810 4,210 5,320 6,980 8,390 9,990 14,500
3,130 4,950 6,230 7,890 9,130 10,400 13,300
2,840 4,290 5,460 7,150 8,550 10,100 14,200
MapID
(fig. 1)
Stationnumber Station name Latitude Longitude
Flood-peak discharge (ft3/s) for indicated recurrence interval, in years
2 5 10 25 50 100 500

34A
Streamflow
Statistics (StreamStats) W
eb Application for O
hio
1911-1935, 1938-1951
1913 41,600
1947-1978 1959 1,050
1966-1977 1969 250
1947-1979 1973 3,670
1989-2001 1997 6,700
1939-1954, 1959
1959 23,800
1963-1973 1963 6,460
1924-1936, 1938-1973
1959 26,400
Ta[Bo pe III estimates, the middle numbers are reg et per second.]
(
Record Largest recorded discharge
s Periodused
Cal-endaryear
Magni-tude
(ft3/s)
137 03225500 Olentangy River nearDelaware40°21′18″ 83°04′02″ 7,360 10,800 13,100 16,200 18,500 20,800 26,400 39
7,880 11,700 14,300 17,700 20,200 22,700 28,400
7,390 10,900 13,300 16,400 18,700 21,100 26,700
138 03226200 Delaware Run near Delaware
40°18′28″ 83°06′35″ 340 572 741 966 1,140 1,320 1,760 32
329 530 669 846 977 1,110 1,410
340 567 730 944 1,110 1,270 1,670
139 03226850 Linworth Run near Linworth
40°06′24″ 83°02′35″ 78 163 234 337 422 514 750 12
51 92 121 159 188 217 287
71 137 184 244 290 336 452
140 03228000 Scioto Big Run at Briggsdale
39°54′56″ 83°03′55″ 1,200 1,850 2,350 3,060 3,650 4,280 5,980 33
648 1,090 1,420 1,840 2,160 2,480 3,240
1,150 1,750 2,200 2,800 3,290 3,820 5,180
141 03228300 Big Walnut Creek at Sunbury
40°14′10″ 82°51′05″ 3,970 5,470 6,360 7,400 8,110 8,770 10,200 13
2,940 4,530 5,640 7,060 8,110 9,160 11,600
3,810 5,270 6,180 7,290 8,110 8,910 10,700
142 03228500 Big Walnut Creek at Central College
40°06′13″ 82°53′03″ 7,030 10,500 12,900 16,000 18,300 20,600 26,200 17
5,210 8,150 10,200 12,900 15,000 17,000 21,800
6,790 10,100 12,300 15,100 17,200 19,400 24,500
143 03228805 Alum Creek at Africa 40°10′56″ 82°57′42″ 4,360 5,670 6,410 7,240 7,800 8,310 9,350 11
4,000 6,410 8,140 10,400 12,100 13,800 17,800
4,290 5,860 6,940 8,350 9,410 10,500 12,800
144 03229000 Alum Creek at Columbus
39°56′42″ 82°56′28″ 4,560 6,850 8,570 11,000 12,900 15,000 20,500 49
4,990 7,720 9,630 12,100 13,900 15,800 20,100
4,570 6,900 8,640 11,100 13,000 15,100 20,400
ble 5. Flood-frequency data for streamflow-gaging stations—Continuedld station numbers indicate peak streamflows at this station presently (2003) are considered regulated. For each station, the upper numbers are the log-Pearson Tyression estimates, and the lower numbers are weighted estimates. Streamflow-gaging stations are in Ohio unless indicated otherwise. Abbreviations: ft3/s, cubic fe
MapID
fig. 1)
Stationnumber Station name Latitude Longitude
Flood-peak discharge (ft3/s) for indicated recurrence interval, in years
2 5 10 25 50 100 500 Year

35
32 1913, 1922-1936,
1939-1954, 1959
1959 59,800
79 1922-1936, 1938-2001
1959 49,000
31 1947-1977 1968 3,820
21 1967-1981, 1996-2001
1968 11,600
36 1927-1935, 1938-1956,
1959, 1961-1967
1959 39,600
60 1908-1967 1913 260,000
35 1947-1981 1979 710
56 1926-1935, 1940-1956, 1959-1981, 1996-2001
1968 21,700
Table 5. Flood-frequency data for streamflow-gaging stations—Continued[Bold station numbers indicate peak streamflows at this station presently (2003) are considered regulated. For each station, the upper numbers are the log-Pearson Type III estimates, the middle numbers are regression estimates, and the lower numbers are weighted estimates. Streamflow-gaging stations are in Ohio unless indicated otherwise. Abbreviations: ft3/s, cubic feet per second.]
Record Largest recorded discharge
Years Periodused
Cal-endaryear
Magni-tude(ft3/s)
145 03229500 Big Walnut Creek at Rees
39°51′24″ 82°57′26″ 12,000 17,400 21,000 25,500 28,800 32,100 39,700
10,200 15,200 18,800 23,200 26,600 29,900 37,700
11,900 17,300 20,800 25,200 28,500 31,800 39,400
146 03230500 Big Darby Creek at Darbyville
39°42′02″ 83°06′37″ 8,380 13,100 16,800 22,100 26,500 31,300 44,300
10,300 15,300 18,700 23,200 26,500 29,800 37,500
8,410 13,200 16,900 22,100 26,500 31,200 43,700
147 03230600 Hominy Creek at Cir-cleville
39°35′26″ 82°55′25″ 606 1,010 1,350 1,880 2,350 2,890 4,520
441 779 1,030 1,360 1,620 1,870 2,490
593 981 1,300 1,770 2,180 2,630 3,910
148 03230800 Deer Creek at Mount Sterling
39°42′54″ 83°15′26″ 5,730 8,570 10,400 12,800 14,400 16,100 19,800
5,670 8,700 10,800 13,600 15,600 17,600 22,400
5,720 8,590 10,500 12,900 14,700 16,400 20,500
149 03231000 Deer Creek at Will-iamsport
39°35′09″ 83°07′22″ 8,430 15,500 21,600 31,100 39,500 49,300 77,900
7,570 11,500 14,300 17,900 20,500 23,200 29,500
8,400 15,200 20,900 29,400 36,600 44,700 67,600
150 03231500 Scioto River at Chilli-cothe
39°20′29″ 82°58′16″ 41,500 66,900 85,200 110,000 129,000 149,000 197,000
41,900 58,700 70,300 85,100 96,100 107,000 133,000
41,500 66,600 84,500 108,000 126,000 145,000 191,000
151 03231600 East Fork Paint Creek near Sedalia
39°42′36″ 83°27′48″ 213 340 432 558 656 759 1,020
266 443 568 728 848 969 1,250
217 349 449 584 690 799 1,070
152 03232000 Paint Creek near Greenfield
39°22′45″ 83°22′32″ 5,170 8,770 11,400 15,000 17,800 20,700 27,800
6,050 9,210 11,400 14,200 16,400 18,500 23,400
5,200 8,800 11,400 14,900 17,600 20,400 27,200
MapID
(fig. 1)
Stationnumber Station name Latitude Longitude
Flood-peak discharge (ft3/s) for indicated recurrence interval, in years
2 5 10 25 50 100 500

36A
Streamflow
Statistics (StreamStats) W
eb Application for O
hio
1972-1981 1979 7,550
1940-1951 1964 13,400
1922-1970 1964 56,900
1947-1977, 1992
1992 8,200
1913, 1931-1973
1937 177,000
1947-1977 1968 5,360
1977-1987 1983 1,560
1966-1982 1966 683
Ta[Bo pe III estimates, the middle numbers are reg et per second.]
(
Record Largest recorded discharge
s Periodused
Cal-endaryear
Magni-tude
(ft3/s)
153 03232300 Rattlesnake Creek atCenterfield39°19′44″ 83°28′32″ 5,170 7,140 8,320 9,670 10,600 11,500 13,300 10
5,350 8,210 10,200 12,800 14,700 16,600 21,100
5,190 7,360 8,790 10,600 11,900 13,200 16,100
154 03232500 Rocky Fork near Bar-retts Mills
39°13′06″ 83°23′08″ 6,380 9,350 11,400 14,000 16,000 18,000 22,800 12
4,160 6,550 8,250 10,400 12,100 13,700 17,600
5,950 8,610 10,400 12,600 14,300 16,100 20,300
155 03234000 Paint Creek near Bourneville
39°15′49″ 83°10′01″ 20,000 31,600 40,500 53,000 63,300 74,400 104,000 49
14,500 21,600 26,500 32,900 37,600 42,400 53,600
19,800 31,000 39,300 50,800 60,000 69,900 95,600
156 03234100 Indian Creek at Mass-ieville
39°15′42″ 82°58′08″ 1,380 2,510 3,510 5,110 6,580 8,310 13,600 32
661 1,160 1,530 2,010 2,380 2,760 3,670
1,320 2,330 3,170 4,430 5,510 6,750 10,300
157 03234500 Scioto River at Higby 39°12′44″ 82°51′50″ 47,700 77,300 100,000 133,000 161,000 191,000 271,000 43
53,100 74,400 89,100 108,000 122,000 136,000 168,000
47,900 77,100 99,300 130,000 155,000 182,000 252,000
158 03235000 Salt Creek at Tarlton 39°33′20″ 82°46′51″ 996 1,600 2,070 2,770 3,350 4,000 5,790 31
727 1,250 1,630 2,130 2,510 2,900 3,820
973 1,560 2,010 2,640 3,170 3,730 5,240
159 03235080 Bull Creek near Adelphi
39°27′11″ 82°46′46″ 348 660 928 1,340 1,700 2,120 3,310 11
282 504 670 888 1,050 1,220 1,630
334 613 832 1,140 1,380 1,640 2,330
160 03235200 Little Blackjack Branch near South Bloomingville
39°27′23″ 82°30′25″ 174 356 507 727 909 1,110 1,610 17
120 227 308 417 501 587 796
164 320 438 596 720 849 1,170
ble 5. Flood-frequency data for streamflow-gaging stations—Continuedld station numbers indicate peak streamflows at this station presently (2003) are considered regulated. For each station, the upper numbers are the log-Pearson Tyression estimates, and the lower numbers are weighted estimates. Streamflow-gaging stations are in Ohio unless indicated otherwise. Abbreviations: ft3/s, cubic fe
MapID
fig. 1)
Stationnumber Station name Latitude Longitude
Flood-peak discharge (ft3/s) for indicated recurrence interval, in years
2 5 10 25 50 100 500 Year
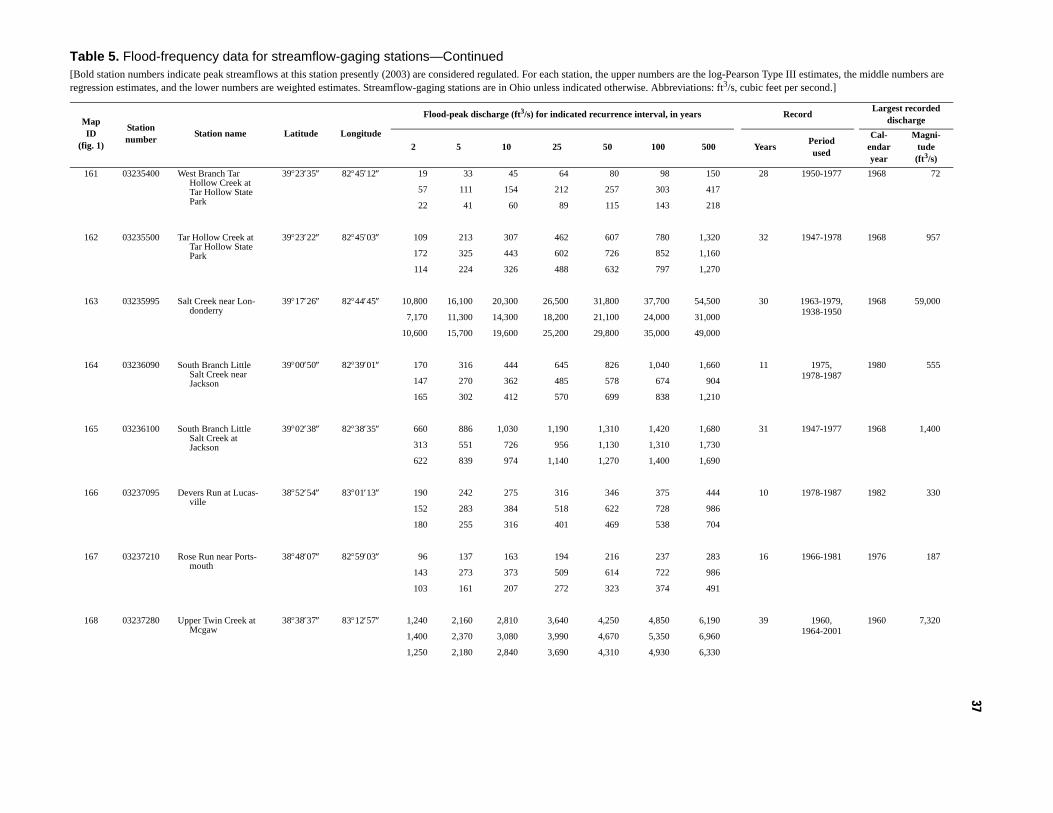
37
28 1950-1977 1968 72
32 1947-1978 1968 957
30 1963-1979, 1938-1950
1968 59,000
11 1975, 1978-1987
1980 555
31 1947-1977 1968 1,400
10 1978-1987 1982 330
16 1966-1981 1976 187
39 1960, 1964-2001
1960 7,320
Table 5. Flood-frequency data for streamflow-gaging stations—Continued[Bold station numbers indicate peak streamflows at this station presently (2003) are considered regulated. For each station, the upper numbers are the log-Pearson Type III estimates, the middle numbers are regression estimates, and the lower numbers are weighted estimates. Streamflow-gaging stations are in Ohio unless indicated otherwise. Abbreviations: ft3/s, cubic feet per second.]
Record Largest recorded discharge
Years Periodused
Cal-endaryear
Magni-tude(ft3/s)
161 03235400 West Branch Tar Hollow Creek at Tar Hollow State Park
39°23′35″ 82°45′12″ 19 33 45 64 80 98 150
57 111 154 212 257 303 417
22 41 60 89 115 143 218
162 03235500 Tar Hollow Creek at Tar Hollow State Park
39°23′22″ 82°45′03″ 109 213 307 462 607 780 1,320
172 325 443 602 726 852 1,160
114 224 326 488 632 797 1,270
163 03235995 Salt Creek near Lon-donderry
39°17′26″ 82°44′45″ 10,800 16,100 20,300 26,500 31,800 37,700 54,500
7,170 11,300 14,300 18,200 21,100 24,000 31,000
10,600 15,700 19,600 25,200 29,800 35,000 49,000
164 03236090 South Branch Little Salt Creek near Jackson
39°00′50″ 82°39′01″ 170 316 444 645 826 1,040 1,660
147 270 362 485 578 674 904
165 302 412 570 699 838 1,210
165 03236100 South Branch Little Salt Creek at Jackson
39°02′38″ 82°38′35″ 660 886 1,030 1,190 1,310 1,420 1,680
313 551 726 956 1,130 1,310 1,730
622 839 974 1,140 1,270 1,400 1,690
166 03237095 Devers Run at Lucas-ville
38°52′54″ 83°01′13″ 190 242 275 316 346 375 444
152 283 384 518 622 728 986
180 255 316 401 469 538 704
167 03237210 Rose Run near Ports-mouth
38°48′07″ 82°59′03″ 96 137 163 194 216 237 283
143 273 373 509 614 722 986
103 161 207 272 323 374 491
168 03237280 Upper Twin Creek at Mcgaw
38°38′37″ 83°12′57″ 1,240 2,160 2,810 3,640 4,250 4,850 6,190
1,400 2,370 3,080 3,990 4,670 5,350 6,960
1,250 2,180 2,840 3,690 4,310 4,930 6,330
MapID
(fig. 1)
Stationnumber Station name Latitude Longitude
Flood-peak discharge (ft3/s) for indicated recurrence interval, in years
2 5 10 25 50 100 500

38A
Streamflow
Statistics (StreamStats) W
eb Application for O
hio
1956-1977 1956 720
1927-1935, 1941-2001
1997 77,700
1975-1986 1982 790
1966-1977 1970 385
1924-1935, 1940-2001
1964 22,400
1953-1977 1959 7,920
1953-1977 1959 3,350
1953-2001 1959 14,800
Ta[Bo pe III estimates, the middle numbers are reg et per second.]
(
Record Largest recorded discharge
s Periodused
Cal-endaryear
Magni-tude
(ft3/s)
169 03237300 West Branch TurkeyRun near Win-chester
38°56′56″ 83°40′19″ 200 350 477 672 846 1,050 1,630 22
174 301 392 507 592 678 876
196 340 454 618 753 898 1,290
170 03237500 Ohio Brush Creek near West Union
38°48′13″ 83°25′16″ 20,700 30,600 38,100 48,600 57,200 66,500 91,200 70
14,700 21,800 26,500 32,500 36,900 41,200 51,100
20,500 30,100 37,300 47,100 55,000 63,400 85,500
171 03238030 Lawrence Creek near Maysville, Ky.
38°38′04″ 83°47′32″ 276 458 602 813 992 1,190 1,730 12
316 545 708 916 1,070 1,220 1,580
284 481 637 854 1,030 1,210 1,660
172 03238400 Harwood Creek near Fayetteville
39°07′50″ 83°51′00″ 133 221 286 375 445 519 701 12
157 265 339 432 501 569 725
137 233 304 398 470 542 713
173 03238500 Whiteoak Creek near Georgetown
38°51′29″ 83°55′43″ 10,200 13,900 16,300 19,300 21,500 23,600 28,700 74
9,290 13,800 16,800 20,500 23,300 26,000 32,200
10,200 13,900 16,300 19,400 21,600 23,900 29,100
174 03239000 Little Miami River near Selma
39°48′36″ 83°44′21″ 1,390 2,930 4,270 6,300 8,060 10,000 15,400 25
1,940 3,130 3,980 5,080 5,910 6,740 8,700
1,430 2,950 4,220 6,060 7,570 9,180 13,400
175 03239500 North Fork Little Miami River near Pitchin
39°49′40″ 83°46′38″ 379 842 1,310 2,150 2,980 4,040 7,630 25
1,110 1,750 2,190 2,750 3,170 3,580 4,560
409 910 1,410 2,240 3,020 3,940 6,750
176 03240000 Little Miami River near Oldtown
39°44′54″ 83°55′53″ 2,620 4,790 6,590 9,260 11,600 14,100 21,200 49
3,980 6,320 8,000 10,200 11,800 13,400 17,300
2,660 4,870 6,680 9,340 11,600 14,000 20,600
ble 5. Flood-frequency data for streamflow-gaging stations—Continuedld station numbers indicate peak streamflows at this station presently (2003) are considered regulated. For each station, the upper numbers are the log-Pearson Tyression estimates, and the lower numbers are weighted estimates. Streamflow-gaging stations are in Ohio unless indicated otherwise. Abbreviations: ft3/s, cubic fe
MapID
fig. 1)
Stationnumber Station name Latitude Longitude
Flood-peak discharge (ft3/s) for indicated recurrence interval, in years
2 5 10 25 50 100 500 Year

39
14 1955-1968 1963 3,030
14 1955-1968 1963 3,470
49 1953-2001 1959 7,300
30 1948-1977 1968 1,820
41 1926-1935, 1940-1952,
1959, 1963-1964, 1969-1983
1963 38,000
16 1966-1981 1974 880
15 1969-1983 1975 5,170
15 1969-1983 1975 5,510
Table 5. Flood-frequency data for streamflow-gaging stations—Continued[Bold station numbers indicate peak streamflows at this station presently (2003) are considered regulated. For each station, the upper numbers are the log-Pearson Type III estimates, the middle numbers are regression estimates, and the lower numbers are weighted estimates. Streamflow-gaging stations are in Ohio unless indicated otherwise. Abbreviations: ft3/s, cubic feet per second.]
Record Largest recorded discharge
Years Periodused
Cal-endaryear
Magni-tude(ft3/s)
177 03240500 North Fork Massie Creek at Cedarville
39°45′25″ 83°47′25″ 701 1,500 2,240 3,460 4,600 5,940 10,000
1,210 1,930 2,440 3,090 3,570 4,050 5,190
752 1,570 2,290 3,350 4,240 5,210 7,840
178 03241000 South Fork Massie Creek near Cedar-ville
39°44′20″ 83°45′50″ 718 1,370 1,960 2,890 3,740 4,750 7,780
816 1,310 1,660 2,110 2,450 2,780 3,560
731 1,360 1,880 2,630 3,250 3,920 5,740
179 03241500 Massies Creek at Wil-berforce
39°43′22″ 83°52′58″ 1,490 2,700 3,680 5,110 6,310 7,630 11,200
2,400 3,880 4,940 6,320 7,360 8,400 10,900
1,520 2,760 3,760 5,220 6,430 7,730 11,200
180 03241600 Shawnee Creek at Xenia
39°40′32″ 83°55′32″ 383 675 873 1,120 1,290 1,460 1,820
327 566 740 966 1,140 1,310 1,720
379 661 851 1,090 1,260 1,420 1,790
181 03242050 Little Miami River near Spring Valley
39°35′00″ 84°01′49″ 7,300 12,100 15,900 21,200 25,500 30,100 42,400
8,610 13,300 16,700 21,000 24,300 27,500 35,200
7,340 12,200 15,900 21,100 25,300 29,800 41,400
182 03242100 Wayne Creek at Waynesville
39°31′08″ 84°04′47″ 258 448 596 806 980 1,170 1,660
126 233 313 421 503 587 790
228 381 489 634 748 869 1,180
183 03242150 Caesar Creek near Xenia
39°37′25″ 83°54′09″ 3,060 3,980 4,550 5,240 5,730 6,200 7,260
2,490 3,970 5,020 6,370 7,380 8,400 10,800
2,990 3,980 4,650 5,510 6,160 6,800 8,290
184 03242200 Anderson Fork near New Burlington
39°33′59″ 83°54′10″ 2,520 3,410 3,970 4,650 5,130 5,590 6,620
2,590 4,080 5,130 6,480 7,480 8,490 10,900
2,530 3,510 4,190 5,060 5,720 6,360 7,830
MapID
(fig. 1)
Stationnumber Station name Latitude Longitude
Flood-peak discharge (ft3/s) for indicated recurrence interval, in years
2 5 10 25 50 100 500

40A
Streamflow
Statistics (StreamStats) W
eb Application for O
hio
1959, 1961-1975
1959 26,000
1939-1952, 1959,
1963-1964
1959 67,000
1953-1974 1959 25,500
1913, 1916-1917, 1926-1976
1959 84,100
1950-1953, 1959,
1961-1975, 2000
1964 19,800
1947-1977 1962 952
1913, 1916-1920,
1925-1973, 1975-1977
1964 42,400
1964, 1966-1978
1964 93,000
Ta[Bo pe III estimates, the middle numbers are reg et per second.]
(
Record Largest recorded discharge
s Periodused
Cal-endaryear
Magni-tude
(ft3/s)
185 03242300 Caesar Creek at Har-veysburg39°30′27″ 84°00′42″ 6,990 11,200 14,700 20,300 25,300 31,200 48,900 16
5,930 9,370 11,800 15,000 17,400 19,800 25,500
6,910 11,000 14,300 19,200 23,500 28,200 41,700
186 03242500 Little Miami River near Fort Ancient
39°22′42″ 84°05′32″ 19,300 31,100 39,700 51,200 60,300 69,700 92,900 17
14,600 22,700 28,500 35,900 41,500 47,200 60,600
18,900 30,100 38,000 48,300 56,300 64,400 84,400
187 03244000 Todd Fork near Roachester
39°20′07″ 84°05′12″ 10,500 16,100 20,200 25,800 30,300 35,000 47,100 22
9,240 13,700 16,700 20,500 23,300 26,000 32,300
10,400 15,800 19,700 24,800 28,800 33,000 43,300
188 03245500 Little Miami River at Milford
39°10′17″ 84°17′53″ 30,500 44,000 53,400 65,800 75,300 85,200 110,000 54
32,700 46,700 56,100 67,800 76,400 84,800 104,000
30,600 44,100 53,600 65,900 75,400 85,100 109,000
189 03246500 East Fork Little Miami River at Williams-burg
39°03′09″ 84°03′02″ 10,700 14,400 16,800 19,600 21,700 23,700 28,200 21
9,300 13,500 16,300 19,800 22,300 24,800 30,500
10,600 14,300 16,700 19,600 21,800 23,900 28,700
190 03247100 Paterson Run near Owensville
39°07′38″ 84°06′44″ 583 721 799 886 944 997 1,110 31
424 695 881 1,110 1,290 1,460 1,850
569 718 811 924 1,010 1,080 1,250
191 03247500 East Fork Little Miami River at Perintown
39°08′13″ 84°14′17″ 19,700 27,400 32,200 38,000 42,200 46,200 55,100 57
16,500 24,000 29,100 35,400 40,000 44,500 54,900
19,600 27,200 32,000 37,800 42,000 46,000 55,100
192 03248000 Little Miami River at Plainville
39°08′13″ 84°21′11″ 38,300 52,200 62,000 75,000 85,100 95,600 122,000 14
41,200 57,900 69,100 83,000 93,200 103,000 126,000
38,500 53,000 63,200 76,700 87,000 97,600 123,000
ble 5. Flood-frequency data for streamflow-gaging stations—Continuedld station numbers indicate peak streamflows at this station presently (2003) are considered regulated. For each station, the upper numbers are the log-Pearson Tyression estimates, and the lower numbers are weighted estimates. Streamflow-gaging stations are in Ohio unless indicated otherwise. Abbreviations: ft3/s, cubic fe
MapID
fig. 1)
Stationnumber Station name Latitude Longitude
Flood-peak discharge (ft3/s) for indicated recurrence interval, in years
2 5 10 25 50 100 500 Year

41
16 1968-1983 1970 20,200
53 1939-1991 1945 5,780
14 1939-1952 1947 6,310
44 1958-2001 1959 1,780
18 1958-1975 1959 2,770
89 1913-2001 1913 44,000
17 1966-1982 1981 625
31 1947-1977 1959 1,130
Table 5. Flood-frequency data for streamflow-gaging stations—Continued[Bold station numbers indicate peak streamflows at this station presently (2003) are considered regulated. For each station, the upper numbers are the log-Pearson Type III estimates, the middle numbers are regression estimates, and the lower numbers are weighted estimates. Streamflow-gaging stations are in Ohio unless indicated otherwise. Abbreviations: ft3/s, cubic feet per second.]
Record Largest recorded discharge
Years Periodused
Cal-endaryear
Magni-tude(ft3/s)
193 03254400 North Fork Grassy Creek near Piner, Ky.
38°47′31″ 84°30′50″ 2,620 4,980 7,180 10,900 14,400 18,700 32,600
1,380 2,280 2,910 3,720 4,310 4,910 6,290
2,420 4,340 5,870 8,080 9,950 12,100 18,100
194 03255500 Mill Creek at Reading 39°13′14″ 84°26′49″ 3,300 4,260 4,850 5,570 6,080 6,570 7,670
4,040 6,100 7,480 9,200 10,500 11,700 14,500
3,330 4,350 5,030 5,870 6,480 7,070 8,410
195 03258000 West Fork Mill Creek at Lockland
39°13′35″ 84°27′22″ 3,520 5,010 5,940 7,040 7,820 8,550 10,200
2,620 4,150 5,200 6,530 7,510 8,480 10,700
3,400 4,860 5,770 6,900 7,720 8,530 10,300
196 03260700 Bokengehalas Creek near De Graff
40°20′50″ 83°53′28″ 672 951 1,140 1,380 1,560 1,750 2,190
1,600 2,650 3,410 4,400 5,150 5,900 7,700
698 1,020 1,260 1,580 1,820 2,080 2,670
197 03260800 Stony Creek near De Graff
40°17′27″ 83°54′36″ 1,040 1,750 2,280 3,000 3,580 4,170 5,670
2,300 3,760 4,810 6,180 7,220 8,260 10,700
1,120 1,940 2,600 3,520 4,250 5,000 6,830
198 03261500 Great Miami River at Sidney
40°17′13″ 84°09′00″ 6,830 10,700 13,600 17,800 21,200 25,000 35,000
8,760 12,500 15,000 18,200 20,500 22,800 28,200
6,860 10,700 13,700 17,800 21,200 24,800 34,500
199 03262750 Millers Ditch at Tipp City
39°57′59″ 84°10′22″ 108 200 276 390 488 596 897
105 194 261 349 417 486 652
108 199 272 376 460 549 781
200 03263100 Poplar Creek near Vandalia
39°52′10″ 84°11′21″ 400 658 851 1,120 1,330 1,560 2,130
282 504 669 887 1,050 1,220 1,630
389 637 820 1,070 1,260 1,470 1,990
MapID
(fig. 1)
Stationnumber Station name Latitude Longitude
Flood-peak discharge (ft3/s) for indicated recurrence interval, in years
2 5 10 25 50 100 500

42A
Streamflow
Statistics (StreamStats) W
eb Application for O
hio
1947-1977 1958 754
1913, 1932-2001
1913 18,200
1913, 1917-2001
1913 51,400
1950-1977 1953 204
1947-1979 1972 2,100
1926-1931, 1940-2001
1959 8,000
1959, 1966-1995,
1999-2001
1959 18,300
1943-1959 1959 8,130
Ta[Bo pe III estimates, the middle numbers are reg et per second.]
(
Record Largest recorded discharge
s Periodused
Cal-endaryear
Magni-tude
(ft3/s)
201 03263700 Bridge Creek nearGreenville40°04′13″ 84°37′45″ 350 550 673 816 912 1,000 1,180 31
346 589 765 992 1,160 1,340 1,750
350 554 686 846 959 1,070 1,300
202 03264000 Greenville Creek near Bradford
40°06′08″ 84°25′48″ 3,070 4,790 6,060 7,820 9,240 10,800 14,700 71
4,640 7,000 8,640 10,700 12,300 13,800 17,400
3,100 4,850 6,160 7,970 9,430 11,000 14,900
203 03265000 Stillwater River at Pleasant Hill
40°03′28″ 84°21′22″ 9,840 15,100 18,800 23,900 27,800 31,800 42,000 86
10,200 15,400 19,100 23,700 27,200 30,700 38,900
9,850 15,100 18,800 23,800 27,700 31,800 41,700
204 03265100 Hog Run tributary at Laura
40°00′30″ 84°25′26″ 36 61 80 106 127 150 207 28
58 102 134 176 207 239 313
38 66 89 121 146 173 238
205 03266500 Mad River at Zanes-field
40°21′01″ 83°40′28″ 409 725 989 1,390 1,730 2,120 3,230 33
463 783 1,020 1,320 1,540 1,770 2,320
412 731 992 1,380 1,700 2,050 3,010
206 03267000 Mad River near Urbana
40°06′27″ 83°47′57″ 2,480 3,730 4,590 5,730 6,600 7,490 9,640 68
4,790 7,580 9,580 12,200 14,100 16,100 20,700
2,520 3,830 4,780 6,040 7,010 8,000 10,400
207 03267900 Mad River at St. Paris Pike at Eagle City
39°57′51″ 83°49′54″ 5,360 7,130 8,190 9,410 10,300 11,000 12,700 34
7,550 11,700 14,700 18,500 21,300 24,200 30,900
5,450 7,410 8,680 10,300 11,400 12,500 14,900
208 03268000 Buck Creek at New Moorefield
39°59′31″ 83°42′53″ 1,840 2,520 3,060 3,830 4,490 5,220 7,240 17
2,460 3,990 5,100 6,530 7,610 8,700 11,300
1,890 2,700 3,360 4,340 5,150 6,020 8,300
ble 5. Flood-frequency data for streamflow-gaging stations—Continuedld station numbers indicate peak streamflows at this station presently (2003) are considered regulated. For each station, the upper numbers are the log-Pearson Tyression estimates, and the lower numbers are weighted estimates. Streamflow-gaging stations are in Ohio unless indicated otherwise. Abbreviations: ft3/s, cubic fe
MapID
fig. 1)
Stationnumber Station name Latitude Longitude
Flood-peak discharge (ft3/s) for indicated recurrence interval, in years
2 5 10 25 50 100 500 Year

43
19 1959-1977 1959 1,000
21 1943-1959, 1973-1976
1948 4,980
56 1913, 1915-1921, 1924-1956, 1959-1973
1929 13,000
63 1904-1905, 1913-1973
1913 55,400
29 1893-1921 1913 250,000
25 1959, 1963-1986
1959 3,900
28 1939-1950, 1959,
1987-2001
1959 12,500
38 1959, 1963-1999
1959 30,300
Table 5. Flood-frequency data for streamflow-gaging stations—Continued[Bold station numbers indicate peak streamflows at this station presently (2003) are considered regulated. For each station, the upper numbers are the log-Pearson Type III estimates, the middle numbers are regression estimates, and the lower numbers are weighted estimates. Streamflow-gaging stations are in Ohio unless indicated otherwise. Abbreviations: ft3/s, cubic feet per second.]
Record Largest recorded discharge
Years Periodused
Cal-endaryear
Magni-tude(ft3/s)
209 03268300 Beaver Creek at Brighton
39°55′46″ 83°34′04″ 253 469 631 851 1,020 1,200 1,620
248 419 541 698 817 936 1,220
252 459 609 805 953 1,100 1,460
210 03268500 Beaver Creek near Springfield
39°56′26″ 83°44′56″ 1,850 2,870 3,590 4,540 5,280 6,030 7,870
1,490 2,370 3,000 3,800 4,390 4,990 6,400
1,820 2,810 3,490 4,390 5,070 5,770 7,460
211 03269000 Buck Creek at Spring-field
39°55′57″ 83°49′02″ 3,180 5,440 7,200 9,730 11,800 14,100 20,200
4,280 6,820 8,650 11,000 12,800 14,600 18,800
3,210 5,490 7,280 9,820 11,900 14,100 20,000
212 03269500 Mad River near Springfield
39°55′23″ 83°52′13″ 7,770 12,600 16,400 21,600 25,800 30,400 42,300
12,300 19,800 25,300 32,400 37,900 43,400 56,600
7,860 12,900 16,700 22,100 26,600 31,300 43,500
213 03270500 Great Miami River at Dayton
39°45′55″ 84°11′51″ 36,700 57,200 70,500 86,800 98,500 110,000 135,000
31,900 45,700 55,300 67,500 76,700 85,700 107,000
36,600 56,600 69,500 85,100 96,300 107,000 131,000
214 03270800 Wolf Creek at Trot-wood
39°47′39″ 84°18′36″ 1,570 2,410 2,960 3,650 4,160 4,670 5,810
1,800 2,840 3,550 4,440 5,100 5,740 7,230
1,590 2,460 3,050 3,800 4,360 4,910 6,170
215 03271000 Wolf Creek at Dayton 39°46′00″ 84°14′12″ 4,370 6,460 7,940 9,920 11,500 13,100 17,100
4,200 6,530 8,120 10,100 11,600 13,100 16,400
4,360 6,460 7,970 9,960 11,500 13,100 16,900
216 03271800 Twin Creek near Ingomar
39°42′28″ 84°31′30″ 7,580 10,900 13,400 17,000 20,100 23,400 32,600
8,960 13,500 16,500 20,300 23,100 25,900 32,300
7,640 11,000 13,700 17,400 20,500 23,800 32,600
MapID
(fig. 1)
Stationnumber Station name Latitude Longitude
Flood-peak discharge (ft3/s) for indicated recurrence interval, in years
2 5 10 25 50 100 500

44A
Streamflow
Statistics (StreamStats) W
eb Application for O
hio
1978-1987 1983 247
1971-2001 1989 20,200
1959, 1961-1976
1968 16,800
1966-1982 1968 409
1938-1960 1959 44,500
1907-1921 1913 352,000
1939-1940, 1942-1943, 1947-1978
1960 307
1973-1982 1979 240
Ta[Bo pe III estimates, the middle numbers are reg et per second.]
(
Record Largest recorded discharge
s Periodused
Cal-endaryear
Magni-tude
(ft3/s)
217 03272695 Trippetts Branch atCamden39°38′03″ 84°39′08″ 100 179 236 313 373 433 578 10
90 164 218 287 340 392 516
97 173 228 300 355 410 540
218 03272700 Sevenmile Creek at Camden
39°37′45″ 84°38′40″ 3,200 5,260 6,960 9,520 11,800 14,300 21,500 31
4,270 6,640 8,270 10,300 11,800 13,300 16,800
3,260 5,380 7,110 9,640 11,800 14,100 20,400
219 03272800 Sevenmile Creek at Collinsville
39°31′23″ 84°36′39″ 6,130 9,760 12,500 16,300 19,300 22,600 31,100 17
6,250 9,540 11,800 14,600 16,700 18,800 23,500
6,140 9,730 12,400 15,900 18,700 21,500 28,700
220 03272900 Collins Creek at Col-linsville
39°31′05″ 84°36′53″ 241 351 420 502 559 614 730 17
202 361 477 627 739 852 1,120
234 353 436 542 622 700 879
221 03273500 Fourmile Creek near Hamilton
39°27′30″ 84°32′50″ 14,500 21,300 25,300 29,900 33,000 35,800 41,400 23
12,500 18,700 23,000 28,300 32,200 36,000 44,900
14,400 21,000 25,000 29,600 32,800 35,800 42,100
222 03274000 Great Miami River at Hamilton
39°23′28″ 84°34′20″ 43,400 60,700 73,600 91,700 107,000 123,000 165,000 15
42,900 61,300 74,100 90,600 103,000 115,000 144,000
43,400 60,700 73,700 91,500 106,000 121,000 160,000
223 03274100 Blake Run near Reily 39°27′59″ 84°45′22″ 61 111 149 202 244 287 395 36
76 134 177 231 271 311 405
62 115 155 209 252 295 399
224 03274880 Greens Fork Tributary near Lynn, Ind.
40°01′14″ 84°56′24″ 95 167 222 299 360 426 592 10
156 270 350 453 529 605 781
107 195 266 362 437 512 691
ble 5. Flood-frequency data for streamflow-gaging stations—Continuedld station numbers indicate peak streamflows at this station presently (2003) are considered regulated. For each station, the upper numbers are the log-Pearson Tyression estimates, and the lower numbers are weighted estimates. Streamflow-gaging stations are in Ohio unless indicated otherwise. Abbreviations: ft3/s, cubic fe
MapID
fig. 1)
Stationnumber Station name Latitude Longitude
Flood-peak discharge (ft3/s) for indicated recurrence interval, in years
2 5 10 25 50 100 500 Year

45
30 1913, 1950-1978
1969 15,000
36 1966-2001 1999 16,700
17 1973-1989 1989 255
10 1973-1982 1980 1,900
17 1973-1989 1974 300
37 1952-1988 1959 8,720
55 1947-2001 1958 13,900
31 1970-2000 1985 664
Table 5. Flood-frequency data for streamflow-gaging stations—Continued[Bold station numbers indicate peak streamflows at this station presently (2003) are considered regulated. For each station, the upper numbers are the log-Pearson Type III estimates, the middle numbers are regression estimates, and the lower numbers are weighted estimates. Streamflow-gaging stations are in Ohio unless indicated otherwise. Abbreviations: ft3/s, cubic feet per second.]
Record Largest recorded discharge
Years Periodused
Cal-endaryear
Magni-tude(ft3/s)
225 03275500 East Fork Whitewater River at Rich-mond, Ind.
39°48′24″ 84°54′26″ 5,250 8,850 11,600 15,400 18,400 21,600 29,900
5,790 8,660 10,600 13,000 14,800 16,500 20,500
5,270 8,830 11,500 15,000 17,800 20,700 27,900
226 03275600 East Fork Whitewater River at Abington, Ind.
39°43′57″ 84°57′35″ 7,140 10,300 12,400 15,000 16,900 18,800 23,300
8,410 12,400 15,200 18,500 21,000 23,400 29,000
7,190 10,400 12,600 15,300 17,400 19,400 24,100
227 03275800 West Run near Liberty, Ind.
39°38′24″ 84°57′18″ 73 130 176 244 302 365 539
83 150 199 262 309 357 468
75 135 184 251 305 361 503
228 03275900 Templeton Creek near Fairfield, Ind.
39°31′20″ 84°56′51″ 387 790 1,150 1,740 2,270 2,890 4,750
623 1,020 1,290 1,630 1,890 2,140 2,710
425 846 1,200 1,700 2,100 2,520 3,610
229 03276640 Tanners Creek Tribu-tary near Lawren-ceburg, Ind.
39°09′18″ 84°52′20″ 93 164 223 308 381 462 683
75 140 188 251 298 346 459
89 158 211 285 344 406 565
230 03322500 Wabash River near New Corydon, Ind.
40°33′50″ 84°48′10″ 4,040 5,320 6,030 6,800 7,300 7,740 8,620
4,670 6,680 8,030 9,740 11,000 12,200 15,100
4,050 5,380 6,150 7,010 7,600 8,130 9,220
231 03325500 Mississinewa River near Ridgeville, Ind.
40°16′48″ 84°59′33″ 3,910 5,910 7,300 9,120 10,500 11,900 15,400
3,640 5,590 6,950 8,700 9,990 11,300 14,300
3,900 5,890 7,280 9,090 10,500 11,900 15,300
232 04096515 South Branch Hog Creek near Allen, Mich.
41°56′55″ 84°49′40″ 271 405 496 612 700 788 996
998 1,450 1,750 2,090 2,340 2,570 3,080
288 442 556 707 821 935 1,200
MapID
(fig. 1)
Stationnumber Station name Latitude Longitude
Flood-peak discharge (ft3/s) for indicated recurrence interval, in years
2 5 10 25 50 100 500

46A
Streamflow
Statistics (StreamStats) W
eb Application for O
hio
1973-1982 1981 110
1954-2000 1982 6,660
1947-1981 1972 340
1950-1975 1956 195
1970-2001 1996 1,510
1947-1996, 1998-2001
1996 10,400
1943-1978, 1980-1982
1982 2,100
1947-2001 1991 5,580
Ta[Bo pe III estimates, the middle numbers are reg et per second.]
(
Record Largest recorded discharge
s Periodused
Cal-endaryear
Magni-tude
(ft3/s)
233 04099060 Pigeon Creek. Tribu-tary near Ellis, Ind.41°37′43″ 84°54′56″ 45 77 100 134 160 189 262 10
71 115 144 179 203 227 279
50 86 114 151 179 206 271
234 04176000 River Raisin near Adrian, Mich.
41°54′15″ 83°58′50″ 2,830 3,980 4,700 5,570 6,190 6,790 8,120 47
4,890 6,620 7,700 8,980 9,870 10,700 12,600
2,870 4,060 4,820 5,750 6,420 7,060 8,460
235 04176900 Hill Ditch near Rich-ards
41°39′54″ 83°40′05″ 81 161 230 334 425 527 812 35
138 212 259 314 353 391 472
84 166 234 331 410 495 717
236 04177400 Eagle Creek tributary near Montpelier
41°35′10″ 84°40′50″ 71 110 137 173 199 227 292 26
83 128 156 189 213 235 283
72 112 140 176 202 229 290
237 04177720 Fish Creek at Hamilton, Ind.
41°31′55″ 84°54′12″ 384 574 716 914 1,070 1,250 1,700 32
779 1,130 1,340 1,600 1,780 1,950 2,330
396 601 759 976 1,150 1,330 1,790
238 04178000 St. Joseph River near Newville, Ind.
41°23′08″ 84°48′06″ 4,390 6,330 7,680 9,440 10,800 12,200 15,500 54
6,240 8,440 9,810 11,400 12,600 13,700 16,000
4,420 6,400 7,770 9,550 10,900 12,300 15,600
239 04179500 Cedar Creek at Auburn, Ind.
41°21′57″ 85°03′08″ 882 1,170 1,350 1,570 1,730 1,890 2,250 39
1,670 2,430 2,930 3,510 3,930 4,320 5,190
905 1,220 1,430 1,700 1,900 2,100 2,540
240 04180000 Cedar Creek near Cedarville, Ind.
41°13′08″ 85°04′35″ 3,250 4,160 4,690 5,300 5,710 6,090 6,900 55
3,690 5,200 6,160 7,300 8,100 8,870 10,600
3,260 4,200 4,760 5,410 5,860 6,290 7,180
ble 5. Flood-frequency data for streamflow-gaging stations—Continuedld station numbers indicate peak streamflows at this station presently (2003) are considered regulated. For each station, the upper numbers are the log-Pearson Tyression estimates, and the lower numbers are weighted estimates. Streamflow-gaging stations are in Ohio unless indicated otherwise. Abbreviations: ft3/s, cubic fe
MapID
fig. 1)
Stationnumber Station name Latitude Longitude
Flood-peak discharge (ft3/s) for indicated recurrence interval, in years
2 5 10 25 50 100 500 Year

47
27 1965-1991 1991 1,100
71 1912-1982 1913 40,000
10 1978-1987 1981 173
43 1941-1982, 2001
1982 4,900
10 1978-1987 1982 395
10 1978-1987 1985 91
70 1913, 1922-1928,
1937, 1941-2001
1982 7,800
10 1978-1987 1980 150
Table 5. Flood-frequency data for streamflow-gaging stations—Continued[Bold station numbers indicate peak streamflows at this station presently (2003) are considered regulated. For each station, the upper numbers are the log-Pearson Type III estimates, the middle numbers are regression estimates, and the lower numbers are weighted estimates. Streamflow-gaging stations are in Ohio unless indicated otherwise. Abbreviations: ft3/s, cubic feet per second.]
Record Largest recorded discharge
Years Periodused
Cal-endaryear
Magni-tude(ft3/s)
241 04182590 Harber Ditch at Fort Wayne, Ind.
41°00′27″ 85°10′58″ 688 865 969 1,090 1,170 1,250 1,410
580 860 1,040 1,250 1,400 1,540 1,840
680 865 977 1,110 1,210 1,300 1,500
242 04183500 Maumee River at Antwerp
41°11′56″ 84°44′40″ 14,000 18,200 20,900 24,400 26,900 29,500 35,600
16,300 21,500 24,800 28,700 31,400 34,000 39,600
14,100 18,300 21,100 24,600 27,200 29,800 35,900
243 04183750 Racetrack Run at Hicksville
41°18′58″ 84°46′00″ 50 93 126 173 211 251 352
31 53 68 86 99 112 140
44 77 98 123 142 161 207
244 04184500 Bean Creek at Powers 41°40′39″ 84°13′56″ 2,180 3,130 3,720 4,420 4,900 5,370 6,370
2,880 4,040 4,780 5,650 6,260 6,840 8,120
2,200 3,170 3,780 4,500 5,020 5,500 6,550
245 04184750 Spring Creek at Fay-ette
41°40′32″ 84°19′47″ 268 325 356 389 411 430 469
148 244 309 389 446 502 626
236 299 338 389 427 464 545
246 04184760 Bean Creek tributary near Fayette
41°39′08″ 84°17′34″ 58 73 81 91 98 105 119
43 71 90 114 130 147 182
54 72 85 101 113 125 150
247 04185000 Tiffin River at Stryker 41°30′16″ 84°25′47″ 3,480 4,930 5,820 6,860 7,580 8,260 9,710
5,010 6,970 8,220 9,710 10,800 11,800 13,900
3,520 5,000 5,920 7,020 7,790 8,510 10,100
248 04185150 Beaver Creek tributary near Montpelier
41°34′19″ 84°31′03″ 96 125 143 164 179 194 225
33 55 71 89 102 115 143
75 96 109 124 136 148 175
MapID
(fig. 1)
Stationnumber Station name Latitude Longitude
Flood-peak discharge (ft3/s) for indicated recurrence interval, in years
2 5 10 25 50 100 500

48A
Streamflow
Statistics (StreamStats) W
eb Application for O
hio
1986-2001 1998 1,770
1978-1987 1986 180
1922-1936, 1941-2001
1992 12,800
1966-1986 1982 167
1989-1999 1991 4,590
1924-1935, 1939,
1943-1981
1959 7,740
1978-1987 1981 280
1947-1957, 1959, 1981
1981 6,500
Ta[Bo pe III estimates, the middle numbers are reg et per second.]
(
Record Largest recorded discharge
s Periodused
Cal-endaryear
Magni-tude
(ft3/s)
249 04185440 Unnamed Tributary toLost Creek near Farmers
41°21′42″ 84°41′28″ 425 675 868 1,140 1,370 1,610 2,260 16
191 305 380 471 535 598 736
380 576 704 867 991 1,120 1,450
250 04185945 Auglaize River tribu-tary near Spencer-ville
40°42′27″ 84°19′06″ 87 135 168 210 241 272 344 10
44 76 97 123 142 160 201
73 110 133 162 182 203 251
251 04186500 Auglaize River near Fort Jennings
40°56′55″ 84°15′58″ 5,130 7,480 8,920 10,600 11,800 12,900 15,200 76
4,940 7,110 8,510 10,200 11,400 12,500 15,100
5,130 7,460 8,900 10,600 11,800 12,900 15,200
252 04186800 King Run near Harrod 40°43′56″ 83°53′47″ 94 125 145 167 183 199 232 21
48 84 108 139 161 183 232
86 116 135 158 176 193 232
253 04187100 Ottawa River at Lima 40°43′29″ 84°07′35″ 2,900 3,620 4,070 4,610 4,990 5,370 6,220 11
2,210 3,180 3,800 4,530 5,050 5,550 6,630
2,800 3,540 4,000 4,580 5,010 5,430 6,370
254 04187500 Ottawa River at Allen-town
40°45′18″ 84°11′41″ 3,110 4,470 5,310 6,290 6,970 7,620 8,990 52
2,610 3,730 4,450 5,300 5,900 6,470 7,720
3,100 4,430 5,250 6,210 6,870 7,490 8,840
255 04187945 Rattlesnake Creek near Cairo
40°49′20″ 84°04′16″ 130 188 225 268 298 326 388 10
81 130 162 201 228 254 312
118 169 200 237 264 289 346
256 04188500 Eagle Creek near Findlay
40°59′35″ 83°39′05″ 2,100 2,870 3,350 3,900 4,280 4,650 5,430 13
1,350 2,060 2,530 3,090 3,490 3,870 4,730
2,030 2,770 3,220 3,740 4,110 4,470 5,250
ble 5. Flood-frequency data for streamflow-gaging stations—Continuedld station numbers indicate peak streamflows at this station presently (2003) are considered regulated. For each station, the upper numbers are the log-Pearson Tyression estimates, and the lower numbers are weighted estimates. Streamflow-gaging stations are in Ohio unless indicated otherwise. Abbreviations: ft3/s, cubic fe
MapID
fig. 1)
Stationnumber Station name Latitude Longitude
Flood-peak discharge (ft3/s) for indicated recurrence interval, in years
2 5 10 25 50 100 500 Year
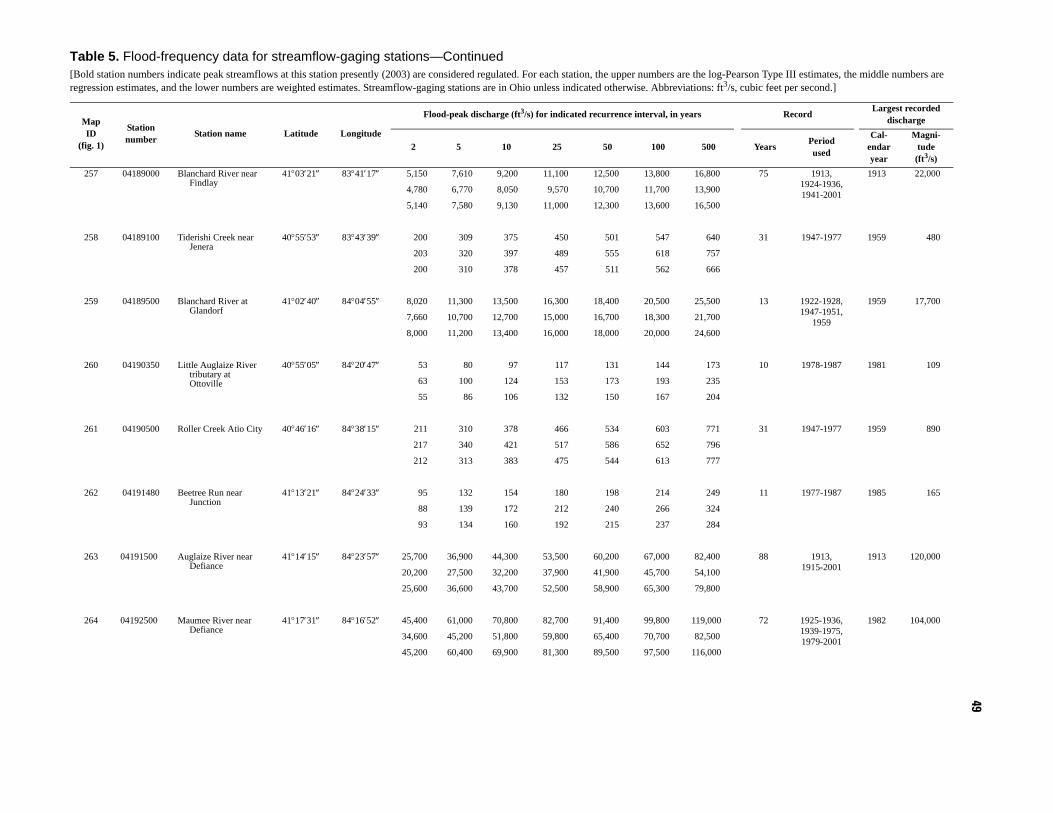
49
75 1913, 1924-1936, 1941-2001
1913 22,000
31 1947-1977 1959 480
13 1922-1928, 1947-1951,
1959
1959 17,700
10 1978-1987 1981 109
31 1947-1977 1959 890
11 1977-1987 1985 165
88 1913, 1915-2001
1913 120,000
72 1925-1936, 1939-1975, 1979-2001
1982 104,000
Table 5. Flood-frequency data for streamflow-gaging stations—Continued[Bold station numbers indicate peak streamflows at this station presently (2003) are considered regulated. For each station, the upper numbers are the log-Pearson Type III estimates, the middle numbers are regression estimates, and the lower numbers are weighted estimates. Streamflow-gaging stations are in Ohio unless indicated otherwise. Abbreviations: ft3/s, cubic feet per second.]
Record Largest recorded discharge
Years Periodused
Cal-endaryear
Magni-tude(ft3/s)
257 04189000 Blanchard River near Findlay
41°03′21″ 83°41′17″ 5,150 7,610 9,200 11,100 12,500 13,800 16,800
4,780 6,770 8,050 9,570 10,700 11,700 13,900
5,140 7,580 9,130 11,000 12,300 13,600 16,500
258 04189100 Tiderishi Creek near Jenera
40°55′53″ 83°43′39″ 200 309 375 450 501 547 640
203 320 397 489 555 618 757
200 310 378 457 511 562 666
259 04189500 Blanchard River at Glandorf
41°02′40″ 84°04′55″ 8,020 11,300 13,500 16,300 18,400 20,500 25,500
7,660 10,700 12,700 15,000 16,700 18,300 21,700
8,000 11,200 13,400 16,000 18,000 20,000 24,600
260 04190350 Little Auglaize River tributary at Ottoville
40°55′05″ 84°20′47″ 53 80 97 117 131 144 173
63 100 124 153 173 193 235
55 86 106 132 150 167 204
261 04190500 Roller Creek Atio City 40°46′16″ 84°38′15″ 211 310 378 466 534 603 771
217 340 421 517 586 652 796
212 313 383 475 544 613 777
262 04191480 Beetree Run near Junction
41°13′21″ 84°24′33″ 95 132 154 180 198 214 249
88 139 172 212 240 266 324
93 134 160 192 215 237 284
263 04191500 Auglaize River near Defiance
41°14′15″ 84°23′57″ 25,700 36,900 44,300 53,500 60,200 67,000 82,400
20,200 27,500 32,200 37,900 41,900 45,700 54,100
25,600 36,600 43,700 52,500 58,900 65,300 79,800
264 04192500 Maumee River near Defiance
41°17′31″ 84°16′52″ 45,400 61,000 70,800 82,700 91,400 99,800 119,000
34,600 45,200 51,800 59,800 65,400 70,700 82,500
45,200 60,400 69,900 81,300 89,500 97,500 116,000
MapID
(fig. 1)
Stationnumber Station name Latitude Longitude
Flood-peak discharge (ft3/s) for indicated recurrence interval, in years
2 5 10 25 50 100 500

50A
Streamflow
Statistics (StreamStats) W
eb Application for O
hio
1966-1986 1969 165
1900-1901, 1913,
1922-1936, 1939-2001
1913 180,000
1913, 1929-1935, 1940-2001
1913 17,000
1926-1935, 1939-1951,
1959, 1964-1981,
1987, 1996-2001
1959 13,500
1922-1936, 1938-1981,
2001
1959 10,000
1947-1977 1959 408
1961-2001 1991 6,700
1922-1937, 1939-1982
1937 19,000
Ta[Bo pe III estimates, the middle numbers are reg et per second.]
(
Record Largest recorded discharge
s Periodused
Cal-endaryear
Magni-tude
(ft3/s)
265 04192900 Reitz Run at Water-ville41°29′50″ 83°42′35″ 34 65 92 135 173 217 343 21
66 109 137 171 196 219 272
37 71 101 144 180 218 315
266 04193500 Maumee River at Waterville
41°30′00″ 83°42′46″ 51,700 69,900 82,300 98,200 110,000 123,000 153,000 81
38,000 49,200 56,300 64,800 70,800 76,600 89,100
51,400 69,200 81,000 96,100 108,000 119,000 147,000
267 04195500 Portage River at Woodville
41°26′58″ 83°21′41″ 6,440 8,700 10,100 11,700 12,800 13,800 16,100 70
5,670 8,040 9,560 11,400 12,700 13,900 16,600
6,430 8,680 10,100 11,700 12,800 13,800 16,100
268 04196000 Sandusky River near Bucyrus
40°48′13″ 83°00′21″ 2,600 3,920 4,890 6,230 7,310 8,460 11,500 49
1,790 2,640 3,190 3,850 4,320 4,760 5,750
2,570 3,850 4,760 6,000 6,970 7,990 10,600
269 04196500 Sandusky River near Upper Sandusky
40°51′02″ 83°15′23″ 4,770 6,760 8,000 9,480 10,500 11,500 13,700 60
4,550 6,600 7,920 9,530 10,700 11,800 14,200
4,760 6,750 7,990 9,480 10,500 11,500 13,800
270 04196700 St. James River near Upper Sandusky
40°46′51″ 83°18′12″ 208 302 358 419 460 497 570 31
234 373 464 575 653 729 897
210 309 371 443 493 540 636
271 04196800 Tymochtee Creek at Crawford
40°55′22″ 83°20′56″ 3,680 4,970 5,720 6,550 7,110 7,620 8,660 41
3,510 5,000 5,950 7,090 7,890 8,660 10,300
3,680 4,970 5,730 6,610 7,200 7,740 8,880
272 04197000 Sandusky River near Mexico
41°02′39″ 83°11′42″ 8,700 12,200 14,500 17,200 19,100 20,900 25,000 60
9,220 13,100 15,500 18,500 20,700 22,700 27,200
8,710 12,300 14,500 17,300 19,200 21,100 25,200
ble 5. Flood-frequency data for streamflow-gaging stations—Continuedld station numbers indicate peak streamflows at this station presently (2003) are considered regulated. For each station, the upper numbers are the log-Pearson Tyression estimates, and the lower numbers are weighted estimates. Streamflow-gaging stations are in Ohio unless indicated otherwise. Abbreviations: ft3/s, cubic fe
MapID
fig. 1)
Stationnumber Station name Latitude Longitude
Flood-peak discharge (ft3/s) for indicated recurrence interval, in years
2 5 10 25 50 100 500 Year

51
41 1961-2001 1981 4,400
19 1983-2001 1998 2,640
21 1961-1981 1962 4,280
15 1961-1975 1969 2,780
31 1947-1977 1956 312
76 1924-1936, 1939-2001
1978 36,500
36 1947-1982 1969 1,880
14 1924-1935, 1959, 1969
1969 22,000
Table 5. Flood-frequency data for streamflow-gaging stations—Continued[Bold station numbers indicate peak streamflows at this station presently (2003) are considered regulated. For each station, the upper numbers are the log-Pearson Type III estimates, the middle numbers are regression estimates, and the lower numbers are weighted estimates. Streamflow-gaging stations are in Ohio unless indicated otherwise. Abbreviations: ft3/s, cubic feet per second.]
Record Largest recorded discharge
Years Periodused
Cal-endaryear
Magni-tude(ft3/s)
273 04197100 Honey Creek at Mel-more
41°01′20″ 83°06′35″ 2,600 3,450 3,940 4,470 4,820 5,140 5,770
2,650 3,870 4,650 5,590 6,260 6,900 8,310
2,600 3,480 3,990 4,580 4,970 5,340 6,090
274 04197170 Rock Creek at Tiffin 41°06′49″ 83°10′06″ 1,270 1,850 2,190 2,570 2,830 3,060 3,530
953 1,460 1,790 2,190 2,480 2,750 3,360
1,230 1,780 2,100 2,470 2,730 2,970 3,480
275 04197300 Wolf Creek at Betts-ville
41°14′58″ 83°14′08″ 1,600 2,060 2,350 2,710 2,980 3,250 3,860
1,480 2,200 2,670 3,240 3,640 4,020 4,870
1,590 2,070 2,400 2,810 3,110 3,410 4,100
276 04197400 East Branch Wolf Creek at Ft Seneca
41°12′40″ 83°10′50″ 1,760 2,220 2,500 2,840 3,080 3,310 3,830
1,590 2,400 2,920 3,550 4,000 4,430 5,390
1,740 2,240 2,580 3,000 3,310 3,610 4,290
277 04197500 Havens Creek at Havens
41°17′36″ 83°11′50″ 139 207 249 299 333 365 434
176 274 336 411 464 515 626
142 213 259 315 354 392 471
278 04198000 Sandusky River near Fremont
41°18′28″ 83°09′32″ 15,500 20,800 24,000 27,600 30,100 32,500 37,400
13,300 18,700 22,200 26,400 29,300 32,200 38,500
15,400 20,700 23,900 27,600 30,100 32,400 37,500
279 04198100 Norwalk Creek near Norwalk
41°13′58″ 82°32′28″ 346 607 810 1,100 1,330 1,580 2,230
344 582 753 974 1,140 1,310 1,700
346 605 803 1,080 1,290 1,520 2,100
280 04198500 East Branch Huron River near Norwalk
41°14′58″ 82°38′52″ 2,650 4,350 5,640 7,460 8,940 10,500 14,700
2,840 4,510 5,710 7,250 8,400 9,560 12,300
2,670 4,370 5,650 7,410 8,820 10,300 14,000
MapID
(fig. 1)
Stationnumber Station name Latitude Longitude
Flood-peak discharge (ft3/s) for indicated recurrence interval, in years
2 5 10 25 50 100 500
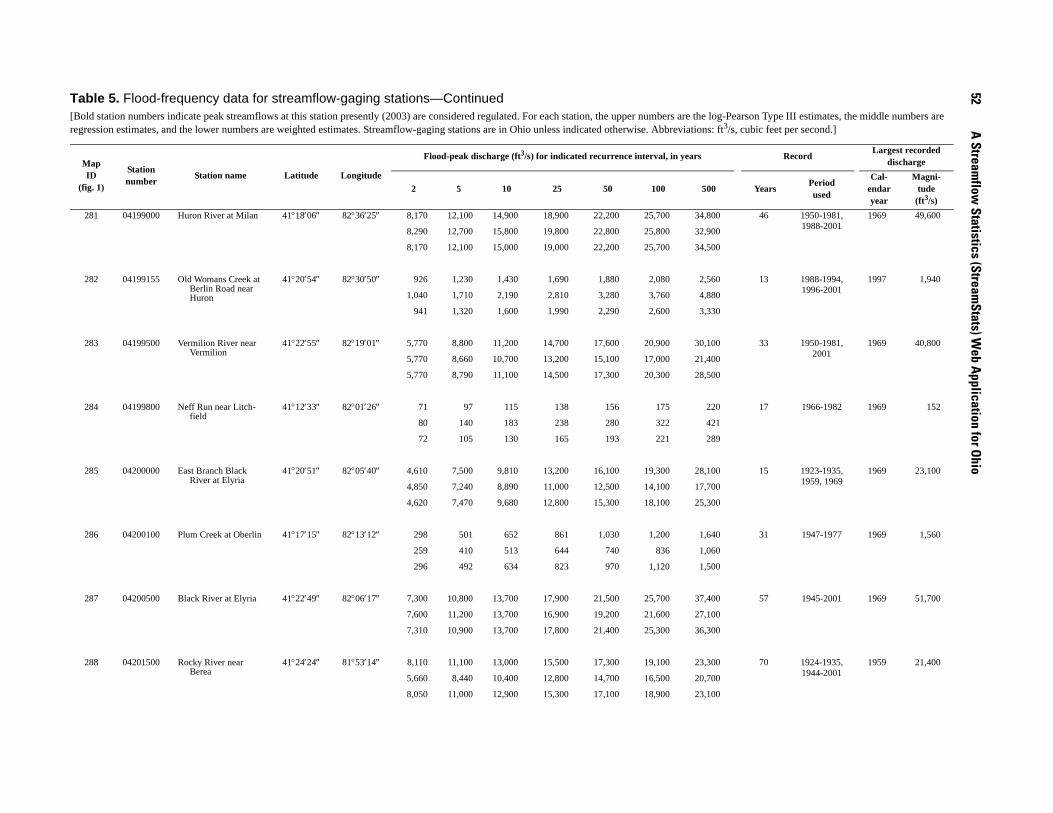
52A
Streamflow
Statistics (StreamStats) W
eb Application for O
hio
1950-1981, 1988-2001
1969 49,600
1988-1994, 1996-2001
1997 1,940
1950-1981, 2001
1969 40,800
1966-1982 1969 152
1923-1935, 1959, 1969
1969 23,100
1947-1977 1969 1,560
1945-2001 1969 51,700
1924-1935, 1944-2001
1959 21,400
Ta[Bo pe III estimates, the middle numbers are reg et per second.]
(
Record Largest recorded discharge
s Periodused
Cal-endaryear
Magni-tude
(ft3/s)
281 04199000 Huron River at Milan 41°18′06″ 82°36′25″ 8,170 12,100 14,900 18,900 22,200 25,700 34,800 468,290 12,700 15,800 19,800 22,800 25,800 32,900
8,170 12,100 15,000 19,000 22,200 25,700 34,500
282 04199155 Old Womans Creek at Berlin Road near Huron
41°20′54″ 82°30′50″ 926 1,230 1,430 1,690 1,880 2,080 2,560 13
1,040 1,710 2,190 2,810 3,280 3,760 4,880
941 1,320 1,600 1,990 2,290 2,600 3,330
283 04199500 Vermilion River near Vermilion
41°22′55″ 82°19′01″ 5,770 8,800 11,200 14,700 17,600 20,900 30,100 33
5,770 8,660 10,700 13,200 15,100 17,000 21,400
5,770 8,790 11,100 14,500 17,300 20,300 28,500
284 04199800 Neff Run near Litch-field
41°12′33″ 82°01′26″ 71 97 115 138 156 175 220 17
80 140 183 238 280 322 421
72 105 130 165 193 221 289
285 04200000 East Branch Black River at Elyria
41°20′51″ 82°05′40″ 4,610 7,500 9,810 13,200 16,100 19,300 28,100 15
4,850 7,240 8,890 11,000 12,500 14,100 17,700
4,620 7,470 9,680 12,800 15,300 18,100 25,300
286 04200100 Plum Creek at Oberlin 41°17′15″ 82°13′12″ 298 501 652 861 1,030 1,200 1,640 31
259 410 513 644 740 836 1,060
296 492 634 823 970 1,120 1,500
287 04200500 Black River at Elyria 41°22′49″ 82°06′17″ 7,300 10,800 13,700 17,900 21,500 25,700 37,400 57
7,600 11,200 13,700 16,900 19,200 21,600 27,100
7,310 10,900 13,700 17,800 21,400 25,300 36,300
288 04201500 Rocky River near Berea
41°24′24″ 81°53′14″ 8,110 11,100 13,000 15,500 17,300 19,100 23,300 70
5,660 8,440 10,400 12,800 14,700 16,500 20,700
8,050 11,000 12,900 15,300 17,100 18,900 23,100
ble 5. Flood-frequency data for streamflow-gaging stations—Continuedld station numbers indicate peak streamflows at this station presently (2003) are considered regulated. For each station, the upper numbers are the log-Pearson Tyression estimates, and the lower numbers are weighted estimates. Streamflow-gaging stations are in Ohio unless indicated otherwise. Abbreviations: ft3/s, cubic fe
MapID
fig. 1)
Stationnumber Station name Latitude Longitude
Flood-peak discharge (ft3/s) for indicated recurrence interval, in years
2 5 10 25 50 100 500 Year
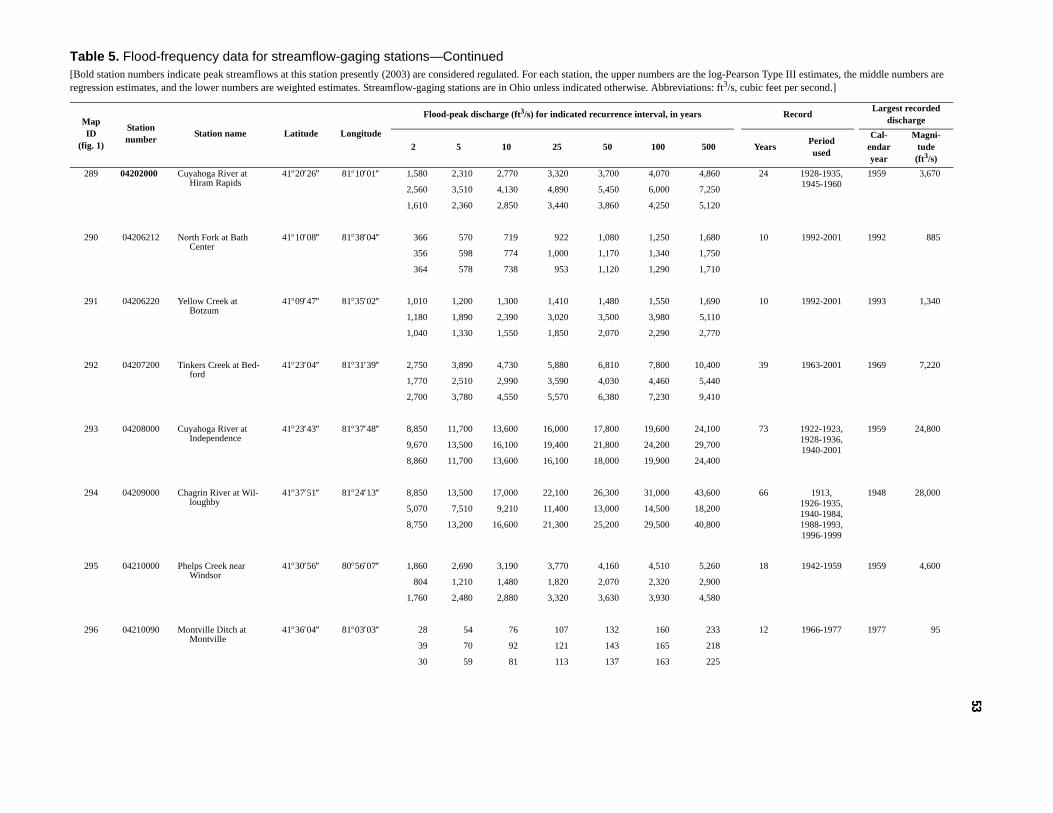
53
24 1928-1935, 1945-1960
1959 3,670
10 1992-2001 1992 885
10 1992-2001 1993 1,340
39 1963-2001 1969 7,220
73 1922-1923, 1928-1936, 1940-2001
1959 24,800
66 1913, 1926-1935, 1940-1984, 1988-1993, 1996-1999
1948 28,000
18 1942-1959 1959 4,600
12 1966-1977 1977 95
Table 5. Flood-frequency data for streamflow-gaging stations—Continued[Bold station numbers indicate peak streamflows at this station presently (2003) are considered regulated. For each station, the upper numbers are the log-Pearson Type III estimates, the middle numbers are regression estimates, and the lower numbers are weighted estimates. Streamflow-gaging stations are in Ohio unless indicated otherwise. Abbreviations: ft3/s, cubic feet per second.]
Record Largest recorded discharge
Years Periodused
Cal-endaryear
Magni-tude(ft3/s)
289 04202000 Cuyahoga River at Hiram Rapids
41°20′26″ 81°10′01″ 1,580 2,310 2,770 3,320 3,700 4,070 4,860
2,560 3,510 4,130 4,890 5,450 6,000 7,250
1,610 2,360 2,850 3,440 3,860 4,250 5,120
290 04206212 North Fork at Bath Center
41°10′08″ 81°38′04″ 366 570 719 922 1,080 1,250 1,680
356 598 774 1,000 1,170 1,340 1,750
364 578 738 953 1,120 1,290 1,710
291 04206220 Yellow Creek at Botzum
41°09′47″ 81°35′02″ 1,010 1,200 1,300 1,410 1,480 1,550 1,690
1,180 1,890 2,390 3,020 3,500 3,980 5,110
1,040 1,330 1,550 1,850 2,070 2,290 2,770
292 04207200 Tinkers Creek at Bed-ford
41°23′04″ 81°31′39″ 2,750 3,890 4,730 5,880 6,810 7,800 10,400
1,770 2,510 2,990 3,590 4,030 4,460 5,440
2,700 3,780 4,550 5,570 6,380 7,230 9,410
293 04208000 Cuyahoga River at Independence
41°23′43″ 81°37′48″ 8,850 11,700 13,600 16,000 17,800 19,600 24,100
9,670 13,500 16,100 19,400 21,800 24,200 29,700
8,860 11,700 13,600 16,100 18,000 19,900 24,400
294 04209000 Chagrin River at Wil-loughby
41°37′51″ 81°24′13″ 8,850 13,500 17,000 22,100 26,300 31,000 43,600
5,070 7,510 9,210 11,400 13,000 14,500 18,200
8,750 13,200 16,600 21,300 25,200 29,500 40,800
295 04210000 Phelps Creek near Windsor
41°30′56″ 80°56′07″ 1,860 2,690 3,190 3,770 4,160 4,510 5,260
804 1,210 1,480 1,820 2,070 2,320 2,900
1,760 2,480 2,880 3,320 3,630 3,930 4,580
296 04210090 Montville Ditch at Montville
41°36′04″ 81°03′03″ 28 54 76 107 132 160 233
39 70 92 121 143 165 218
30 59 81 113 137 163 225
MapID
(fig. 1)
Stationnumber Station name Latitude Longitude
Flood-peak discharge (ft3/s) for indicated recurrence interval, in years
2 5 10 25 50 100 500

54A
Streamflow
Statistics (StreamStats) W
eb Application for O
hio
1947-1977, 1982-1986
1959 700
1942-1966 1959 8,000
1942-1974 1959 9,810
1923-1936, 1938-1974
1959 21,100
1975-2001 1986 18,700
1925-1936, 1939-1947, 1950-1979, 1994-1996
1959 11,600
1966-1982 1969 270
1923-1936, 1950-2001
1959 17,000
Ta[Bo pe III estimates, the middle numbers are reg et per second.]
(
Record Largest recorded discharge
s Periodused
Cal-endaryear
Magni-tude
(ft3/s)
297 04210100 Hoskins Creek atHartsgrove41°36′00″ 80°57′12″ 201 324 419 553 663 783 1,100 36
219 329 402 493 559 624 774
202 324 417 547 651 762 1,050
298 04211000 Rock Creek near Rock Creek
41°39′05″ 80°50′10″ 2,510 3,670 4,420 5,340 6,010 6,670 8,160 25
1,240 1,670 1,940 2,270 2,510 2,740 3,270
2,440 3,480 4,110 4,860 5,390 5,910 7,090
299 04211500 Mill Creek near Jef-ferson
41°45′11″ 80°48′03″ 3,320 4,600 5,510 6,740 7,720 8,750 11,400 33
1,670 2,360 2,810 3,370 3,780 4,180 5,110
3,250 4,440 5,270 6,350 7,200 8,080 10,300
300 04212000 Grand River near Madison
41°44′26″ 81°02′48″ 8,780 11,600 13,300 15,500 17,100 18,700 22,300 51
6,200 7,980 9,130 10,600 11,600 12,600 14,900
8,720 11,400 13,100 15,200 16,700 18,200 21,600
301 04212100 Grand River near Painesville
41°43′08″ 81°13′41″ 12,700 15,700 17,300 19,100 20,200 21,300 23,300 27
7,540 9,880 11,400 13,300 14,700 16,100 19,200
12,500 15,300 16,800 18,400 19,500 20,500 22,700
302 04212500 Ashtabula River near Ashtabula
41°51′20″ 80°45′44″ 4,440 6,400 7,720 9,430 10,700 12,000 15,200 54
2,350 3,330 3,990 4,800 5,400 5,990 7,360
4,390 6,270 7,510 9,090 10,300 11,500 14,300
303 04212600 Hubbard Run tribu-tary at Ashtabula
41°50′38″ 80°46′42″ 105 143 170 206 235 264 341 17
81 138 180 233 273 313 409
101 142 172 213 246 280 364
304 04213000 Conneaut Creek at Conneaut
41°55′37″ 80°36′15″ 6,130 8,950 10,800 13,200 14,900 16,600 20,500 66
3,880 5,730 7,000 8,600 9,790 11,000 13,700
6,060 8,820 10,600 12,800 14,500 16,100 19,800
ble 5. Flood-frequency data for streamflow-gaging stations—Continuedld station numbers indicate peak streamflows at this station presently (2003) are considered regulated. For each station, the upper numbers are the log-Pearson Tyression estimates, and the lower numbers are weighted estimates. Streamflow-gaging stations are in Ohio unless indicated otherwise. Abbreviations: ft3/s, cubic fe
MapID
fig. 1)
Stationnumber Station name Latitude Longitude
Flood-peak discharge (ft3/s) for indicated recurrence interval, in years
2 5 10 25 50 100 500 Year

55
35 1961-1995 1969 408
Table 5. Flood-frequency data for streamflow-gaging stations—Continued[Bold station numbers indicate peak streamflows at this station presently (2003) are considered regulated. For each station, the upper numbers are the log-Pearson Type III estimates, the middle numbers are regression estimates, and the lower numbers are weighted estimates. Streamflow-gaging stations are in Ohio unless indicated otherwise. Abbreviations: ft3/s, cubic feet per second.]
Record Largest recorded discharge
Years Periodused
Cal-endaryear
Magni-tude(ft3/s)
305 04213040 Raccoon Creek near West Springfield, Pa.
41°56′42″ 80°26′51″ 131 219 284 374 445 520 708
171 283 362 463 538 613 791
133 223 292 385 459 535 723
MapID
(fig. 1)
Stationnumber Station name Latitude Longitude
Flood-peak discharge (ft3/s) for indicated recurrence interval, in years
2 5 10 25 50 100 500

56 A Streamflow Statistics (StreamStats) Web Application for Ohio
APPENDIXES
A.Statistical Techniques for Determining Confidence Intervals and Testing for ExtrapolationB. Basin Characteristics used as Regressor Variables

Appendix A—Statistical Techniques for Determining Confidence Intervals and Testing for Extrapolation 57
Appendix A—Statistical Techniques for Determining Confidence Intervals and Testing for Extrapolation
The linear model relating basin characteristics to t-year peak flows can be written in matrix form as:
Y=XB
where
Y is a column vector of logarithms of the n observed peak discharges,
X is a (n by p) matrix of consisting of p-1 basin charac-teristics augmented by a column of ones in the first column, and
B is a column vector of p regression coefficients.
For example, the matrix form of the simple equation for the 2-year peak discharge (Q2) is
where
Q2,i is the observed 2-year peak discharge for the ith gage site;
DAi is the drainage area for the ith site;R1i equals 1 if site is in region C, otherwise 0; andR2i equals 1 if site is in region A, otherwise 0.
The mean square sampling error for an ungaged site (MSEs,0) with basin characteristics given by the row vector
,
is calculated as
, (1A)
where is the (n by n) covariance matrix associated with Y. The off-diagonal elements of are the sample covariance of the estimated t-year peaks at sites i and j. The diagonal elements of are the sums of model error variance, , and the time-sampling error for each site. Appendix tables 7 and 8 list the (p by p) matrices for the simple- and full-model
equations, respectively, and appendix table 9 lists the model error variances for both models. The mean square error of a pre-diction (MSEp), in base-10 logarithmic units, at a specific ungaged site can be estimated as
. (2A)
With MSEp,0 known, the standard error of prediction, in per-cent, can be calculated as
. (3A)
Confidence limits for a predicted peak discharge, , can be calculated as
and , (4A)
where and are the upper and lower confidence limits, respectively, for the prediction, and
, (5A)
whereis Student’s t with a specified alpha ( ) level
and n-p degrees of freedom.
The applicability of the regression equations presented in this report is unknown when the basin-characteristic values associated with an ungaged site are outside a space defined by the basin characteristics of the calibration data set. This space, called a regressor variable hull (RVH), contains as many dimen-sions as there are regressor (explanatory) variables in the regression equation (Montgomery and Peck, 1982). When points defined by the basin characteristics of the ungaged site lie within or on the boundary of the RVH, then the estimation gen-erally can be determined by interpolation. If the point lies out-side of the RVH, then estimation will require extrapolation, which may lead to poor performance of the regression equation.
Tests for extrapolation can be performed by comparing the basin-characteristic values of the ungaged site to the ranges of values observed in the calibration data set for the appropriate region (table 2, in the body of this report). In addition, one can test for extrapolation by computing the mean-square sampling error for the ungaged site (MSEs,0), as described earlier in the appendix, and comparing it to the maximum mean-square sam-pling error (appendix table 9) of the calibration data set for the appropriate model and recurrence interval. If one or more basin characteristic values lies outside of the range of values of the
Q2 1,( )log
Q2 2,( )log
""Q2 305,( )log
1 DA1( )log R11 R21
1 DA2( )log R12 R22
"" "" "" ""1 DA305( )log R1305 R2305
1.840.720.440.19
=
x0 1 DA0( )log R10 R20=
MSEs 0, x0 XTΛ 1– X{ }1–x0
T=
ΛΛ
Λ γ2
XTΛ 1– X{ } 1–
MSEp 0, γ2 MSEs 0,+( )=
SEprediction 100 e5.302 MSEp 0,( )
1–⎩ ⎭⎨ ⎬⎧ ⎫
12---
=
y
yuˆ Cy= yu
ˆ 1C---- y=
yu yl
C 10tα2--- n p–,
MSEp 0,( )12---
=
tα2--- n p–,
α
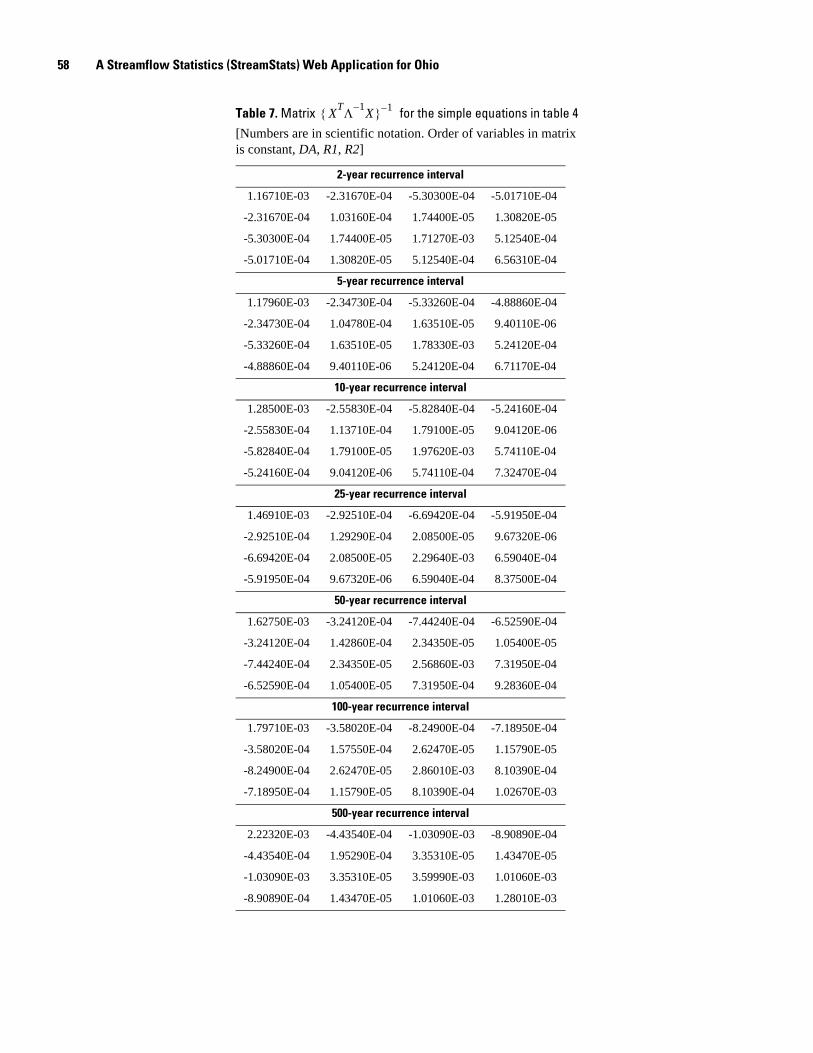
58 A Streamflow Statistics (StreamStats) Web Application for Ohio
Table 7. Matrix for the simple equations in table 4[Numbers are in scientific notation. Order of variables in matrix is constant, DA, R1, R2]
2-year recurrence interval
1.16710E-03 -2.31670E-04 -5.30300E-04 -5.01710E-04
-2.31670E-04 1.03160E-04 1.74400E-05 1.30820E-05
-5.30300E-04 1.74400E-05 1.71270E-03 5.12540E-04
-5.01710E-04 1.30820E-05 5.12540E-04 6.56310E-04
5-year recurrence interval
1.17960E-03 -2.34730E-04 -5.33260E-04 -4.88860E-04
-2.34730E-04 1.04780E-04 1.63510E-05 9.40110E-06
-5.33260E-04 1.63510E-05 1.78330E-03 5.24120E-04
-4.88860E-04 9.40110E-06 5.24120E-04 6.71170E-04
10-year recurrence interval
1.28500E-03 -2.55830E-04 -5.82840E-04 -5.24160E-04
-2.55830E-04 1.13710E-04 1.79100E-05 9.04120E-06
-5.82840E-04 1.79100E-05 1.97620E-03 5.74110E-04
-5.24160E-04 9.04120E-06 5.74110E-04 7.32470E-04
25-year recurrence interval
1.46910E-03 -2.92510E-04 -6.69420E-04 -5.91950E-04
-2.92510E-04 1.29290E-04 2.08500E-05 9.67320E-06
-6.69420E-04 2.08500E-05 2.29640E-03 6.59040E-04
-5.91950E-04 9.67320E-06 6.59040E-04 8.37500E-04
50-year recurrence interval
1.62750E-03 -3.24120E-04 -7.44240E-04 -6.52590E-04
-3.24120E-04 1.42860E-04 2.34350E-05 1.05400E-05
-7.44240E-04 2.34350E-05 2.56860E-03 7.31950E-04
-6.52590E-04 1.05400E-05 7.31950E-04 9.28360E-04
100-year recurrence interval
1.79710E-03 -3.58020E-04 -8.24900E-04 -7.18950E-04
-3.58020E-04 1.57550E-04 2.62470E-05 1.15790E-05
-8.24900E-04 2.62470E-05 2.86010E-03 8.10390E-04
-7.18950E-04 1.15790E-05 8.10390E-04 1.02670E-03
500-year recurrence interval
2.22320E-03 -4.43540E-04 -1.03090E-03 -8.90890E-04
-4.43540E-04 1.95290E-04 3.35310E-05 1.43470E-05
-1.03090E-03 3.35310E-05 3.59990E-03 1.01060E-03
-8.90890E-04 1.43470E-05 1.01060E-03 1.28010E-03
XTΛ 1– X{ } 1–

Appendix A—Statistical Techniques for Determining Confidence Intervals and Testing for Extrapolation 59
Table 8. Matrix for the full-model equations in table 3[Numbers are in scientific notation. Order of variables in matrix is the constant, DA, R1, R2, SL10-85, W]
2-year recurrence interval
5.43490E-03 -1.21280E-03 1.35390E-04 2.95600E-05 -2.55660E-03 -7.09400E-04
-1.21280E-03 3.43990E-04 -1.64750E-04 -1.11530E-04 6.23090E-04 6.50510E-06
1.35390E-04 -1.64750E-04 1.69680E-03 5.51590E-04 -4.27650E-04 1.93550E-04
2.95600E-05 -1.11530E-04 5.51590E-04 6.44850E-04 -3.03770E-04 2.45230E-05
-2.55660E-03 6.23090E-04 -4.27650E-04 -3.03770E-04 1.56490E-03 1.50660E-04
-7.09400E-04 6.50510E-06 1.93550E-04 2.45230E-05 1.50660E-04 1.24330E-03
5-year recurrence interval
5.00650E-03 -1.11020E-03 1.26980E-04 2.88540E-05 -2.35920E-03 -6.46450E-04
-1.11020E-03 3.15560E-04 -1.53760E-04 -1.02710E-04 5.73210E-04 -1.44920E-06
1.26980E-04 -1.53760E-04 1.65110E-03 5.22430E-04 -4.05020E-04 1.75010E-04
2.88540E-05 -1.02710E-04 5.22430E-04 6.10640E-04 -2.78100E-04 1.60280E-05
-2.35920E-03 5.73210E-04 -4.05020E-04 -2.78100E-04 1.46640E-03 1.25790E-04
-6.46450E-04 -1.44920E-06 1.75010E-04 1.60280E-05 1.25790E-04 1.18860E-03
10-year recurrence interval
5.22920E-03 -1.15310E-03 1.18930E-04 1.71590E-05 -2.46010E-03 -6.66980E-04
-1.15310E-03 3.27530E-04 -1.58620E-04 -1.04110E-04 5.95330E-04 -6.92150E-06
1.18930E-04 -1.58620E-04 1.78740E-03 5.54770E-04 -4.23080E-04 1.82480E-04
1.71590E-05 -1.04110E-04 5.54770E-04 6.47310E-04 -2.83670E-04 1.50820E-05
-2.46010E-03 5.95330E-04 -4.23080E-04 -2.83670E-04 1.53810E-03 1.21370E-04
-6.66980E-04 -6.92150E-06 1.82480E-04 1.50820E-05 1.21370E-04 1.26450E-03
25-year recurrence interval
5.80040E-03 -1.27200E-03 1.12240E-04 1.19220E-06 -2.72190E-03 -7.30500E-04
-1.27200E-03 3.61090E-04 -1.73050E-04 -1.11500E-04 6.56030E-04 -1.38440E-05
1.12240E-04 -1.73050E-04 2.05360E-03 6.25590E-04 -4.67110E-04 2.03450E-04
1.19220E-06 -1.11500E-04 6.25590E-04 7.28820E-04 -3.06680E-04 1.63900E-05
-2.72190E-03 6.56030E-04 -4.67110E-04 -3.06680E-04 1.70910E-03 1.23790E-04
-7.30500E-04 -1.38440E-05 2.03450E-04 1.63900E-05 1.23790E-04 1.42710E-03
XTΛ 1– X{ } 1–

60 A Streamflow Statistics (StreamStats) Web Application for Ohio
50-year recurrence interval
6.35750E-03 -1.39030E-03 1.10720E-04 -9.62360E-06 -2.97990E-03 -7.95230E-04
-1.39030E-03 3.94670E-04 -1.87980E-04 -1.19940E-04 7.16680E-04 -1.89980E-05
1.10720E-04 -1.87980E-04 2.29440E-03 6.92140E-04 -5.10660E-04 2.24210E-04
-9.62360E-06 -1.19940E-04 6.92140E-04 8.05960E-04 -3.31890E-04 1.81740E-05
-2.97990E-03 7.16680E-04 -5.10660E-04 -3.31890E-04 1.87490E-03 1.29540E-04
-7.95230E-04 -1.89980E-05 2.24210E-04 1.81740E-05 1.29540E-04 1.57940E-03
100-year recurrence interval
6.99390E-03 -1.52680E-03 1.12260E-04 -1.90370E-05 -3.27710E-03 -8.70490E-04
-1.52680E-03 4.33500E-04 -2.05610E-04 -1.30320E-04 7.86960E-04 -2.41680E-05
1.12260E-04 -2.05610E-04 2.56100E-03 7.67050E-04 -5.61250E-04 2.48060E-04
-1.90370E-05 -1.30320E-04 7.67050E-04 8.93180E-04 -3.62280E-04 2.02510E-05
-3.27710E-03 7.86960E-04 -5.61250E-04 -3.62280E-04 2.06490E-03 1.37810E-04
-8.70490E-04 -2.41680E-05 2.48060E-04 2.02510E-05 1.37810E-04 1.75130E-03
500-year recurrence interval
8.71250E-03 -1.89890E-03 1.26980E-04 -3.53530E-05 -4.09030E-03 -1.07690E-03
-1.89890E-03 5.39830E-04 -2.55190E-04 -1.60550E-04 9.80360E-04 -3.65050E-05
1.26980E-04 -2.55190E-04 3.26020E-03 9.66720E-04 -7.01460E-04 3.12890E-04
-3.53530E-05 -1.60550E-04 9.66720E-04 1.12710E-03 -4.49070E-04 2.54990E-05
-4.09030E-03 9.80360E-04 -7.01460E-04 -4.49070E-04 2.58310E-03 1.64610E-04
-1.07690E-03 -3.65050E-05 3.12890E-04 2.54990E-05 1.64610E-04 2.21160E-03
Table 9. Model error variances and maximum mean-square sampling errors for regression models
Recurrence interval(years)
Model error variance ( ) for indicated model
Maximum mean-square sampling error (MSEs) for indi-
cated model
Simple Full Simple Full
2 0.02684 0.02329 0.00211 0.00234
5 .02590 .02045 .00222 .00229
10 .02664 .02023 .00242 .00246
25 .02854 .02114 .00280 .00280
50 .03047 .02241 .00312 .00310
100 .03272 .02407 .00346 .00343
500 .03906 .02910 .00433 .00431
Table 8. Matrix for the full-model equations in table 3—Continued[Numbers are in scientific notation. Order of variables in matrix is the constant, DA, R1, R2, SL10-85, W]
XTΛ 1– X{ } 1–
γ2

References 61
calibration data set, or if the mean-square sampling error for the ungaged site is larger than the maximum mean square sampling error of the calibration data set, then the estimate is an extrapo-lation.
References
Montgomery, D.C., and Peck, E.A., 1982, Introduction to linear regression analysis: New York, Wiley, 504 p.

62 A Streamflow Statistics (StreamStats) Web Application for Ohio
Appendix B—Basin Characteristics used as Regressor Variables
DA, drainage area (square miles)—the area, measured from a USGS 7.5 minute topographic map, in a horizontal plane, that is contained within the topographic divide for a spec-ified location on a stream. Although the regression models were developed using manually-determined map-based drainage area as an explanatory variable, StreamStats uses a specially pro-cessed digital elevation model to determine drainage areas. StreamStats will compute drainage areas that are comparable to map-based determinations in most cases; however, limitations associated with DEM resolution and/or scale, as well as other possible factors, may result in erroneous drainage area determi-nations. It is the user’s responsibility to verify that the drainage boundaries (and consequently the drainage area) derived by StreamStats are correct.
SL10-85, channel slope (feet per mile)—computed by (a) determining the longest flowpath from the point of interest to a topographic divide (which generally corresponded to the basin divide), (b) determining the elevation at 10 percent of the dis-tance along the longest flowpath upstream from the point at which the flow statistic is desired (E10), (c) determining the ele-vation at 85 percent of the distance along the longest flowpath upstream from the point at which the flow statistic is desired (E85), (d) determining the length of the stream segment between points 10- and 85-percent of the distance along the longest flow-path upstream from the point at which the flow statistic is desired (L10-85), and then (e) dividing the change in elevation (E85 - E10) by L10-85.
W, percentage of the basin classified as open water and wetlands1 (percent)—determined by (1) summing the areas of the 1992 National Land Cover Dataset (NLCD) grid cells (U.S. Geological Survey, 2000) contained within the basin boundary that are classified as open water, woody wetlands, or emergent herbaceous wetlands (land-cover class codes 11, 91, and 92, respectively), (2) dividing by the area of the basin, and then (3) multiplying by 100.
References
U.S. Geological Survey, 2000, National Land Cover Dataset (version 03-16-2000): U.S. Geological Survey, accessed on June 3, 2006, at http://landcover.usgs.gov/natlland-cover.php
1The 1992 NLCD data reflect land cover characteristics during the early 1990’s. Some of the gaging stations whose data were used in this study are located on streams that are presently regulated. In many cases, the regulation resulted from completion of one or more in-chan-nel reservoirs. To better reflect land cover conditions during the unregulated period associated with the data used in this analysis, water areas used to compute W were reduced by the surface areas of in-channel reservoirs whose construction resulted in the regulated des-ignation for streamflow at a gaging station, as well as all upstream in-channel reservoirs built thereafter.