Embed Size (px)
Citation preview
agronomy
Article
Straw Application Strategy to Optimize NutrientRelease in a Southeastern China Rice Cropland
Weiqi Wang 1,2,*, Jordi Sardans 3,4,*, Chun Wang 1,2, Ting Pan 1,2, Congsheng Zeng 1,2,Derrick Y. F. Lai 5, Mireia Bartrons 3,4 and Josep Peñuelas 3,4 ID
1 Institute of Geography, Fujian Normal University, Fuzhou 350007, China; [email protected] (C.W.);[email protected] (T.P.); [email protected] (C.Z.)
2 Key Laboratory of Humid Subtropical Eco-geographical Process, Ministry of Education,Fujian Normal University, Fuzhou 350007, China
3 CSIC, Global Ecology CREAF-CSIC-UAB, Cerdanyola del Valles, 08193 Barcelona, Catalonia, Spain;[email protected] (M.B.); [email protected] (J.P.)
4 CREAF, Cerdanyola del Valles, 08193 Barcelona, Catalonia, Spain5 Department of Geography and Resource Management, and Institute of Environment, Energy and
Sustainability, The Chinese University of Hong Kong, Shatin, New Territories, Hong Kong, China;[email protected]
* Correspondence: [email protected] (W.W.); [email protected] (J.S.)
Received: 25 October 2017; Accepted: 7 December 2017; Published: 15 December 2017
Abstract: The management and improvement of paddy soils fertility are key factors for the futurecapacity of rice production. The return of rice straw to paddy soils is the best alternative to theapplication of industrial fertilizers for rice production sustainability. The best strategy for applyingrice straw to improve soil nutritional capacity during rice growth has not yet been investigated.We compared straw decomposition in the ditches and ridges in paddy fields subjected to a typicalcrop management in southeastern China. Straw spread on the ridges provided lower residual strawcarbon (C) concentration and mass, lower nitrogen:phosphorus ratio N:P, C:N, and C:P ratios, andlower soil salinity, as well as higher temperature, and higher N- and P-release capacity during the ricecrop in comparison to the straw spread in the ditches. Therefore, applying rice straw to the ridges isbetter strategy than applying it to ditches to enhance rice production.
Keywords: China; decomposition; habitats; nitrogen; nutrient release; paddy field; phosphorus;rice straw; stoichiometry
1. Introduction
Rice is one of the most important food crops globally, with more than half of the world populationfed with rice [1]. Global rice production is projected to increase from 473 million tonnes in 1990 toat least 781 million tonnes by 2020 [2]. Paddy fields in China account for 23% of all cultivated landand nearly 20% of the global rice production [3]. High doses of chemical fertilizers have been usedin rice cultivation to increase production in order to meet the increasing demand [4]. The long-termuse of chemical fertilizers, however, acidifies the soil and compromises the sustainability of paddyproduction [5]. The excessive use of fertilizers also increases the risk of pollution [6] and may generatenutrient imbalances in soils and crops, particularly between nitrogen (N) and phosphorus (P) [7].The use of green fertilizers such as farmyard manure [8] and crop straw [9] has been strongly promotedin recent years as substitutes for, or to reduce the use of, industrial fertilizers in an effort to develop amore sustainable rice production. The return of crop straw has particularly been promoted, becausestraw is an economical and important source of organic matter and nutrients [10]. The biotic and abioticdecomposition of straw cellulose and hemicellulose releases N, P, and potassium [11]. The applicationof straw can also increase soil carbon (C) storage [12] to help mitigate global climate change [13].
Agronomy 2017, 7, 84; doi:10.3390/agronomy7040084 www.mdpi.com/journal/agronomy
Agronomy 2017, 7, 84 2 of 20
Straw is currently returned to farmland soil after harvesting, but this practice of soil fertilizationand amendment can be problematic. If rice straw decomposes slowly, its residual presence can impedethe growth of rice shoots after transplantation to paddies [14] and can affect the total production ofthe paddies. Optimal strategies for straw application must thus be determined for sustaining nutrientsupplies for rice growth and for reducing the inhibition of rice seedlings [15]. Various practices ofstraw application and incorporation into the soil have been tested, including incorporation with tillageat different depths [16], various proportions of straw incorporation with conventional fertilizers [17],and straw incorporation combined with water-management strategies [10]. These practices, however,have not accounted for the different properties of paddy ridges and ditches.
Plant growth in Chinese wetlands is generally N limited [18]. Nutrient limitation is especiallysignificant in paddy fields, likely because the periodic inundation of the soil limits the access of plantsto soil nutrients by the effects of anoxia on root growth [19], the reduction of mineralization rates [20],and the increase in leaching, particularly of N [21]. Rice and vegetable crops are commonly rotated inmany provinces of China, such as Fujian, Jiangxi, and Zhejiang. Studying the relationship betweencrop rotation and the return of rice straw is thus very important. The cultivation of a vegetable cropafter a late rice harvest usually requires the construction of a ridge and ditch structure on the soilsurface, which potentially generates two different microenvironments where rice straw can be applied.The decomposition of the straw and the release of nutrients will thus likely differ between thesemicroenvironments due to potential differences in soil temperature and salinity, but these differencesare not yet known. The elucidation of these unknowns could substantially improve rice productionwith sustainable practices. In southern China, the common practice consists of growing one cropin each of three growing seasons, including two successive rice crops (early and late) followed by avegetable (lettuce) crop, with intervening periods of drainage [22]. This management is applied to 56%of the 0.3 million km2 of China rice croplands [3]. This management system with rotation systems isalso widely used in all South Asia, mainly in sites with a pronounced dry season. Thus, a change inrice straw management to improve fertilization has great potential for enhancing rice production.
This study determined (i) the changes in the C:N:P stoichiometry and mass of the residualrice straw and their relationships with other soil variables (temperature, pH, and salinity) duringdecomposition in the ridges and ditches, and (ii) the capacity of the straw applied at the beginning ofthe crop rotational cycle to release N and P in the ridges and ditches during rice growth.
2. Results
2.1. Straw Mass Remaining, Nutrient Concentration and Stoichiometry, and Soil Traits
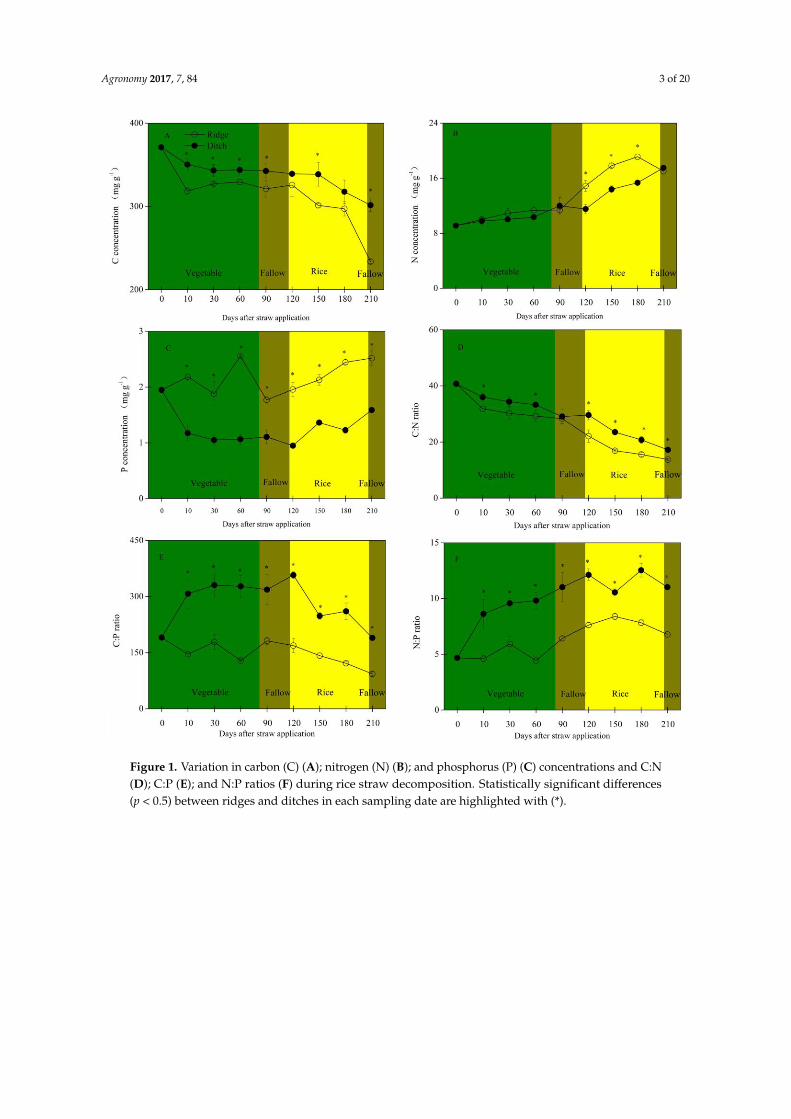
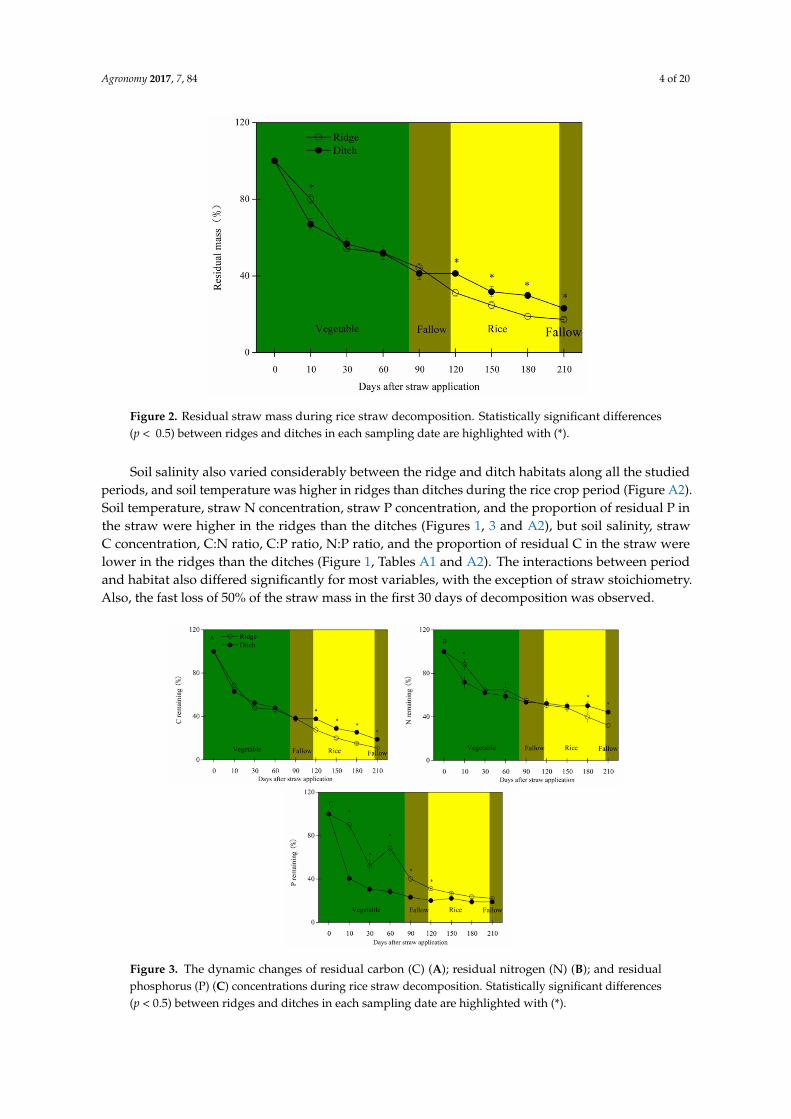
During the straw-decomposition experiment, the proportion of the mass of the straw thatremained in the nylon bag, the straw nutrient concentrations, the straw stoichiometry, the proportionof residual nutrients in the straw, and the soil traits all varied seasonally, apart from P concentrationand soil pH and salinity (Figures 1, 2 and A2, Tables A1 and A2). The rate of loss of straw mass washighest during the vegetable crop, with similar residual masses in the ridges and ditches (Figure 2).
Agronomy 2017, 7, 84 3 of 20Agronomy 2017, 7, 84 3 of 21
Figure 1. Variation in carbon (C) (A); nitrogen (N) (B); and phosphorus (P) (C) concentrations and
C:N (D); C:P (E); and N:P ratios (F) during rice straw decomposition. Statistically significant
differences (p < 0.5) between ridges and ditches in each sampling date are highlighted with (*).
Figure 1. Variation in carbon (C) (A); nitrogen (N) (B); and phosphorus (P) (C) concentrations and C:N(D); C:P (E); and N:P ratios (F) during rice straw decomposition. Statistically significant differences(p < 0.5) between ridges and ditches in each sampling date are highlighted with (*).
Agronomy 2017, 7, 84 4 of 20Agronomy 2017, 7, 84 4 of 21
Figure 2. Residual straw mass during rice straw decomposition. Statistically significant differences (p
< 0.5) between ridges and ditches in each sampling date are highlighted with (*).
Soil salinity also varied considerably between the ridge and ditch habitats along all the studied
periods, and soil temperature was higher in ridges than ditches during the rice crop period (Figure
A2). Soil temperature, straw N concentration, straw P concentration, and the proportion of residual
P in the straw were higher in the ridges than the ditches (Figures 1, 3, and A2), but soil salinity, straw
C concentration, C:N ratio, C:P ratio, N:P ratio, and the proportion of residual C in the straw were
lower in the ridges than the ditches (Figure 1, Tables A1 and A2). The interactions between period
and habitat also differed significantly for most variables, with the exception of straw stoichiometry.
Also, the fast loss of 50% of the straw mass in the first 30 days of decomposition was observed.
Figure 2. Residual straw mass during rice straw decomposition. Statistically significant differences(p < 0.5) between ridges and ditches in each sampling date are highlighted with (*).
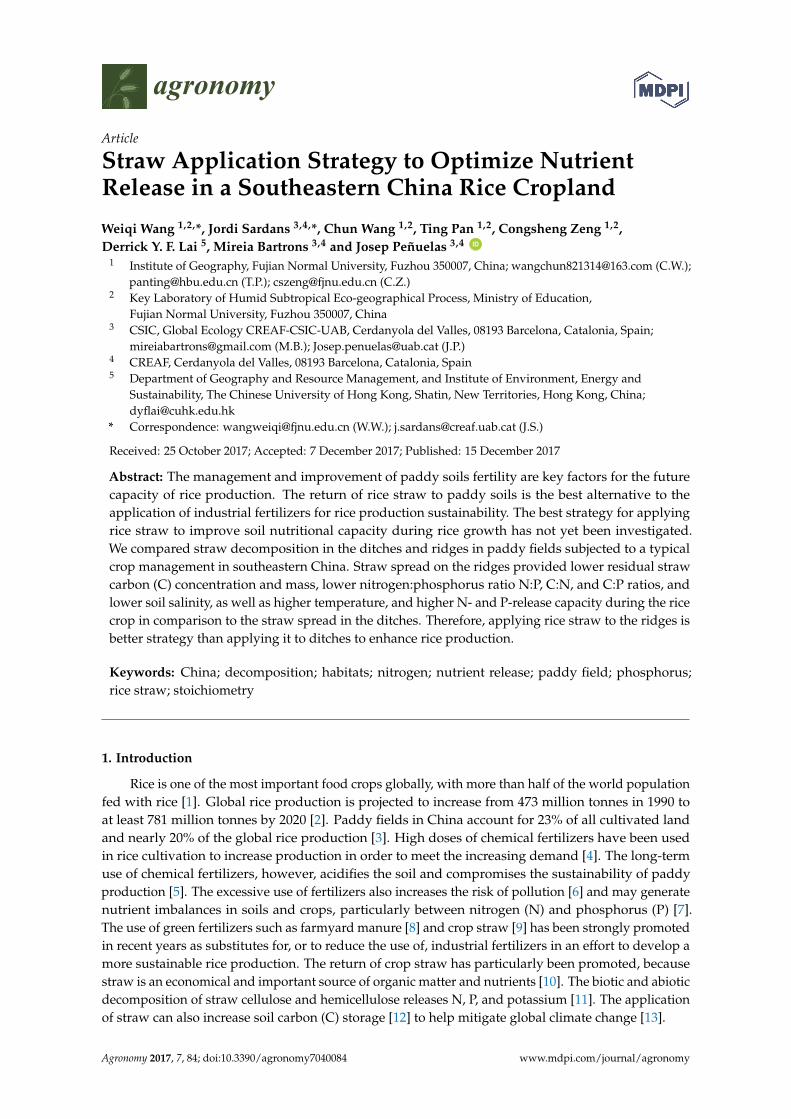
Soil salinity also varied considerably between the ridge and ditch habitats along all the studiedperiods, and soil temperature was higher in ridges than ditches during the rice crop period (Figure A2).Soil temperature, straw N concentration, straw P concentration, and the proportion of residual P inthe straw were higher in the ridges than the ditches (Figures 1, 3 and A2), but soil salinity, strawC concentration, C:N ratio, C:P ratio, N:P ratio, and the proportion of residual C in the straw werelower in the ridges than the ditches (Figure 1, Tables A1 and A2). The interactions between periodand habitat also differed significantly for most variables, with the exception of straw stoichiometry.Also, the fast loss of 50% of the straw mass in the first 30 days of decomposition was observed.Agronomy 2017, 7, 84 5 of 21
Figure 3. The dynamic changes of residual carbon (C) (A); residual nitrogen (N) (B); and residual
phosphorus (P) (C) concentrations during rice straw decomposition. Statistically significant
differences (p < 0.5) between ridges and ditches in each sampling date are highlighted with (*).
2.2. Residual Straw Mass and Nutrients, Nutrient Release, and Influencing Factors
The mass of the straw that remained in the nylon bag (% of the initial content) was correlated
negatively with soil temperature (R = −0.85, p < 0.001), straw N concentration (R = −0.88, p < 0.001),
and straw N:P ratio (R = −0.36, p = 0.006), and positively with soil salinity (R = 0.32, p = 0.014), straw
C concentration (R = 0.53, p < 0.001), straw C:N ratio (R = 0.86, p < 0.001), and straw C:P ratio (R = 0.28,
p = 0.025) (Table A3).
The proportions of residual C, N, and P in the straw (% of the initial content) were correlated
negatively with temperature (R = −0.86, p < 0.001; R = −0.72, p < 0.001; R = −0.62, p < 0.001; respectively),
straw N concentration (R = −0.90, p < 0.001; R = −0.69, p < 0.001; R = −0.51, p < 0.001; respectively), and
straw N:P ratio (R = −0.28, p = 0.025; R = −0.33, p = 0.010; R = −0.77, p < 0.001; respectively), but positively
with the proportion of residual mass (R = 0.99, p < 0.001; R = 0.93, p < 0.001; R = 0.76, p < 0.001;
respectively) and straw C:N ratio (R = 0.90, p < 0.001; R = 0.67, p < 0.001; R = 0.43, p = 0.001; respectively)
(Table A3). The proportion of residual C and N in the straw were positively correlated with soil
salinity (R = 0.35, p = 0.008; R = 0.31, p = 0.016; respectively) and straw C concentration (R = 0.62, p <
0.001; R = 0.47, p < 0.001; respectively). The proportion of residual C in the straw was negatively
correlated with straw P concentration (R = −0.23, p = 0.019). The proportion of residual N in the straw
was positively correlated with litter P concentration (R = 0.43, p = 0.001). Finally, the straw C:P ratio
was correlated positively with the proportion of residual C in the straw (R = 0.38, p = 0.004), but
negatively with the residual N in the straw (R = −0.36, p = 0.006).
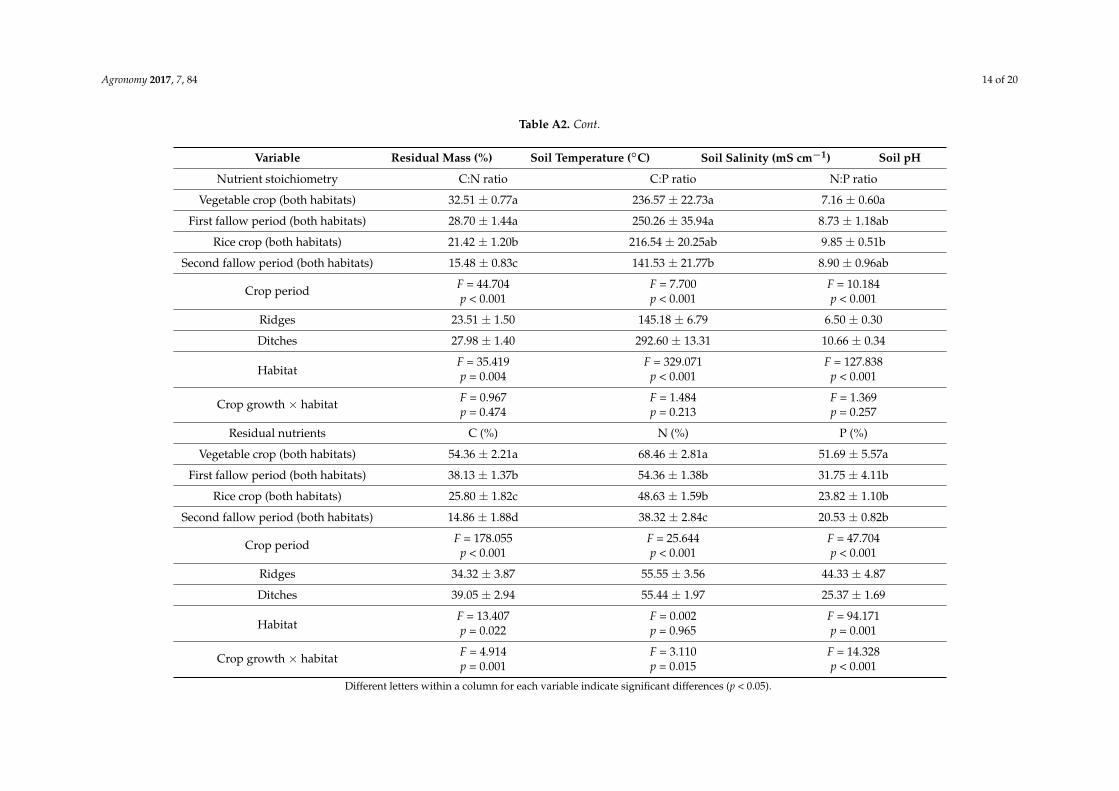
More N and P were released during the rice crop (% of the initial content) from the straw in the
ridges than from the straw in the ditches; the straw applied to the ridges released 18% of the initial
N contents and 9% of the initial P contents, whereas the straw applied to the ditches released 8% of
the initial N contents and 2% of the initial P contents (Figure 4).
Figure 3. The dynamic changes of residual carbon (C) (A); residual nitrogen (N) (B); and residualphosphorus (P) (C) concentrations during rice straw decomposition. Statistically significant differences(p < 0.5) between ridges and ditches in each sampling date are highlighted with (*).
Agronomy 2017, 7, 84 5 of 20
2.2. Residual Straw Mass and Nutrients, Nutrient Release, and Influencing Factors
The mass of the straw that remained in the nylon bag (% of the initial content) was correlatednegatively with soil temperature (R = −0.85, p < 0.001), straw N concentration (R = −0.88, p < 0.001),and straw N:P ratio (R = −0.36, p = 0.006), and positively with soil salinity (R = 0.32, p = 0.014), strawC concentration (R = 0.53, p < 0.001), straw C:N ratio (R = 0.86, p < 0.001), and straw C:P ratio (R = 0.28,p = 0.025) (Table A3).
The proportions of residual C, N, and P in the straw (% of the initial content) were correlatednegatively with temperature (R = −0.86, p < 0.001; R = −0.72, p < 0.001; R = −0.62, p < 0.001;respectively), straw N concentration (R = −0.90, p < 0.001; R = −0.69, p < 0.001; R = −0.51, p < 0.001;respectively), and straw N:P ratio (R = −0.28, p = 0.025; R = −0.33, p = 0.010; R = −0.77, p < 0.001;respectively), but positively with the proportion of residual mass (R = 0.99, p < 0.001; R = 0.93,p < 0.001; R = 0.76, p < 0.001; respectively) and straw C:N ratio (R = 0.90, p < 0.001; R = 0.67, p < 0.001;R = 0.43, p = 0.001; respectively) (Table A3). The proportion of residual C and N in the straw werepositively correlated with soil salinity (R = 0.35, p = 0.008; R = 0.31, p = 0.016; respectively) and straw Cconcentration (R = 0.62, p < 0.001; R = 0.47, p < 0.001; respectively). The proportion of residual C inthe straw was negatively correlated with straw P concentration (R = −0.23, p = 0.019). The proportionof residual N in the straw was positively correlated with litter P concentration (R = 0.43, p = 0.001).Finally, the straw C:P ratio was correlated positively with the proportion of residual C in the straw(R = 0.38, p = 0.004), but negatively with the residual N in the straw (R = −0.36, p = 0.006).
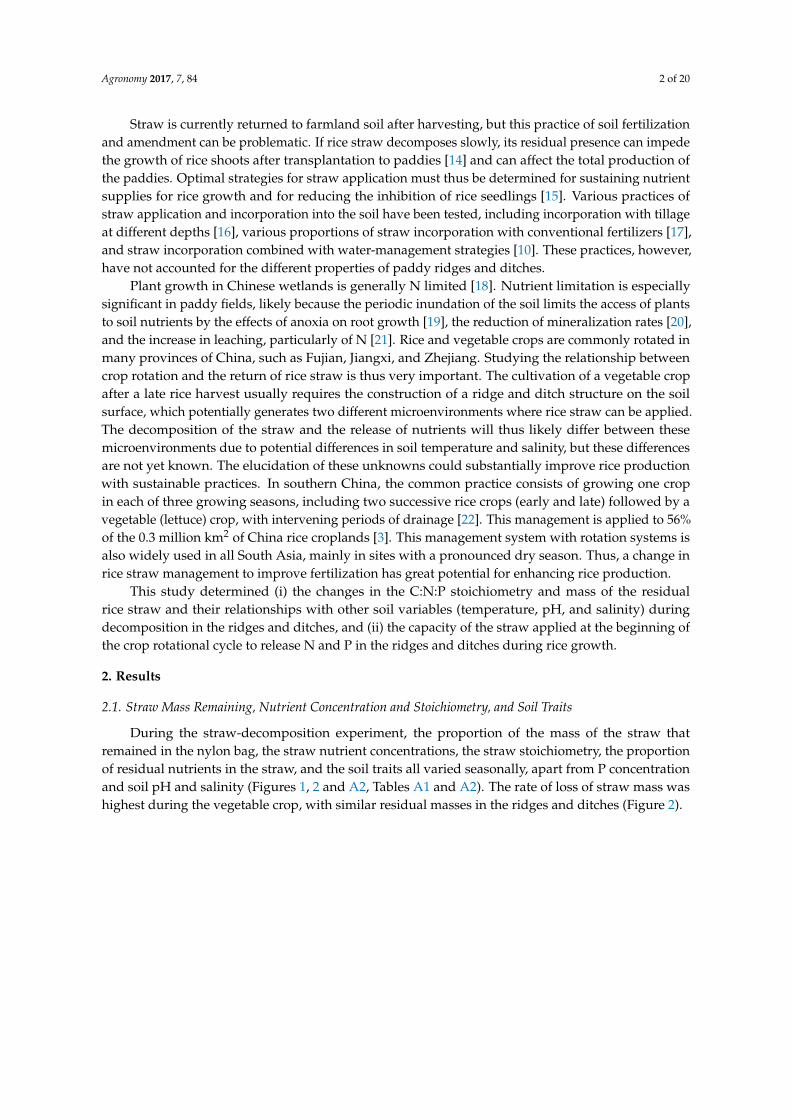
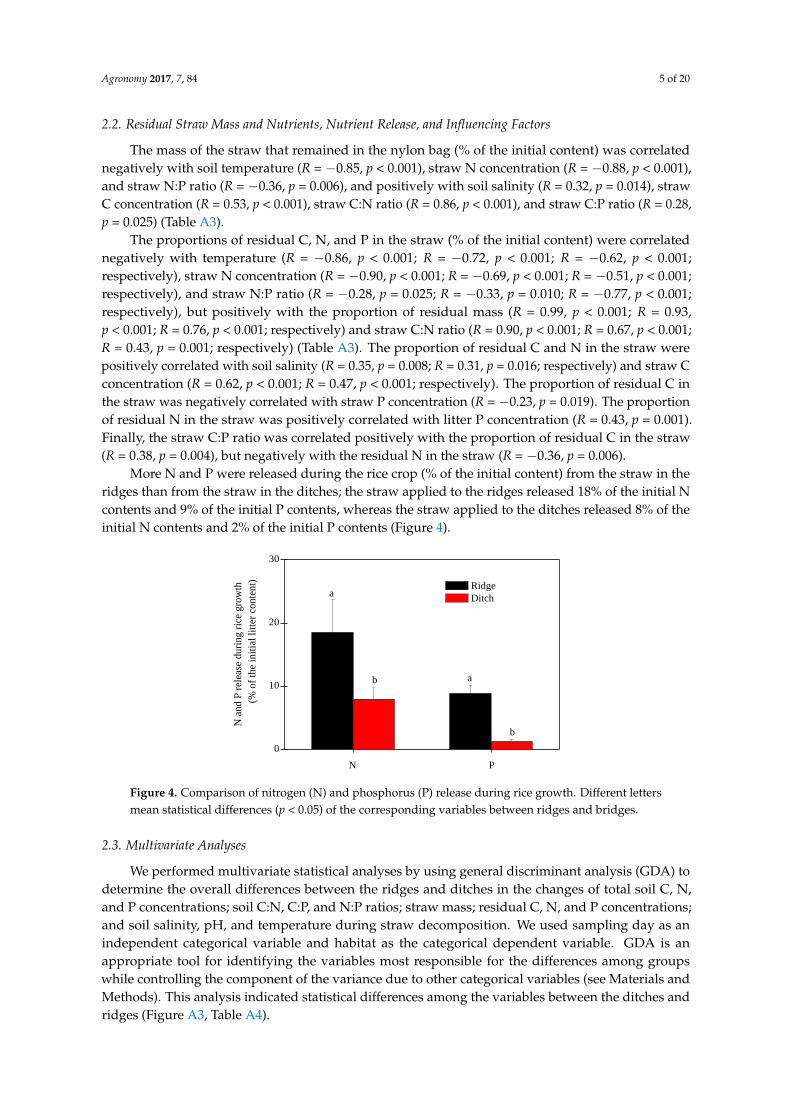
More N and P were released during the rice crop (% of the initial content) from the straw in theridges than from the straw in the ditches; the straw applied to the ridges released 18% of the initial Ncontents and 9% of the initial P contents, whereas the straw applied to the ditches released 8% of theinitial N contents and 2% of the initial P contents (Figure 4).Agronomy 2017, 7, 84 6 of 21
N P
0
10
20
30
a
b
ab
Ridge
Ditch
N a
nd P
rel
ease
duri
ng r
ice
gro
wth
(
% o
f th
e in
itia
l li
tter
conte
nt)
Figure 4. Comparison of nitrogen (N) and phosphorus (P) release during rice growth. Different letters
mean statistical differences (p < 0.05) of the corresponding variables between ridges and bridges.
2.3. Multivariate Analyses
We performed multivariate statistical analyses by using general discriminant analysis (GDA) to
determine the overall differences between the ridges and ditches in the changes of total soil C, N, and
P concentrations; soil C:N, C:P, and N:P ratios; straw mass; residual C, N, and P concentrations; and
soil salinity, pH, and temperature during straw decomposition. We used sampling day as an
independent categorical variable and habitat as the categorical dependent variable. GDA is an
appropriate tool for identifying the variables most responsible for the differences among groups
while controlling the component of the variance due to other categorical variables (see Materials and
Methods). This analysis indicated statistical differences among the variables between the ditches and
ridges (Figure A3, Table A4).
2.4. SEM
We used structural equation modeling (SEM) to analyze the factors explaining the maximum
variability of the biomass; residual straw C, N, and P concentrations; soil C, N, and P concentrations;
and C:N, C:P, and N:P ratios throughout the study period as functions of the habitat and the other
soil traits. This analysis provides information on the direct, indirect, and total effects of the variables
(see Materials and Methods). The structural model that best represented the variance of the residual
mass of straw in the litter bags contained habitat and soil temperature, through the direct and indirect
effects on either straw N:P or straw C:N (Figure 5). The best structural model for P concentration
contained habitat and soil salinity (R2 = 0.78) (Figure 6), and the best structural models for C and N
concentrations contained habitat and soil temperature (Figure 6).
Figure 4. Comparison of nitrogen (N) and phosphorus (P) release during rice growth. Different lettersmean statistical differences (p < 0.05) of the corresponding variables between ridges and bridges.
2.3. Multivariate Analyses
We performed multivariate statistical analyses by using general discriminant analysis (GDA) todetermine the overall differences between the ridges and ditches in the changes of total soil C, N,and P concentrations; soil C:N, C:P, and N:P ratios; straw mass; residual C, N, and P concentrations;and soil salinity, pH, and temperature during straw decomposition. We used sampling day as anindependent categorical variable and habitat as the categorical dependent variable. GDA is anappropriate tool for identifying the variables most responsible for the differences among groupswhile controlling the component of the variance due to other categorical variables (see Materials andMethods). This analysis indicated statistical differences among the variables between the ditches andridges (Figure A3, Table A4).
Agronomy 2017, 7, 84 6 of 20
2.4. SEM
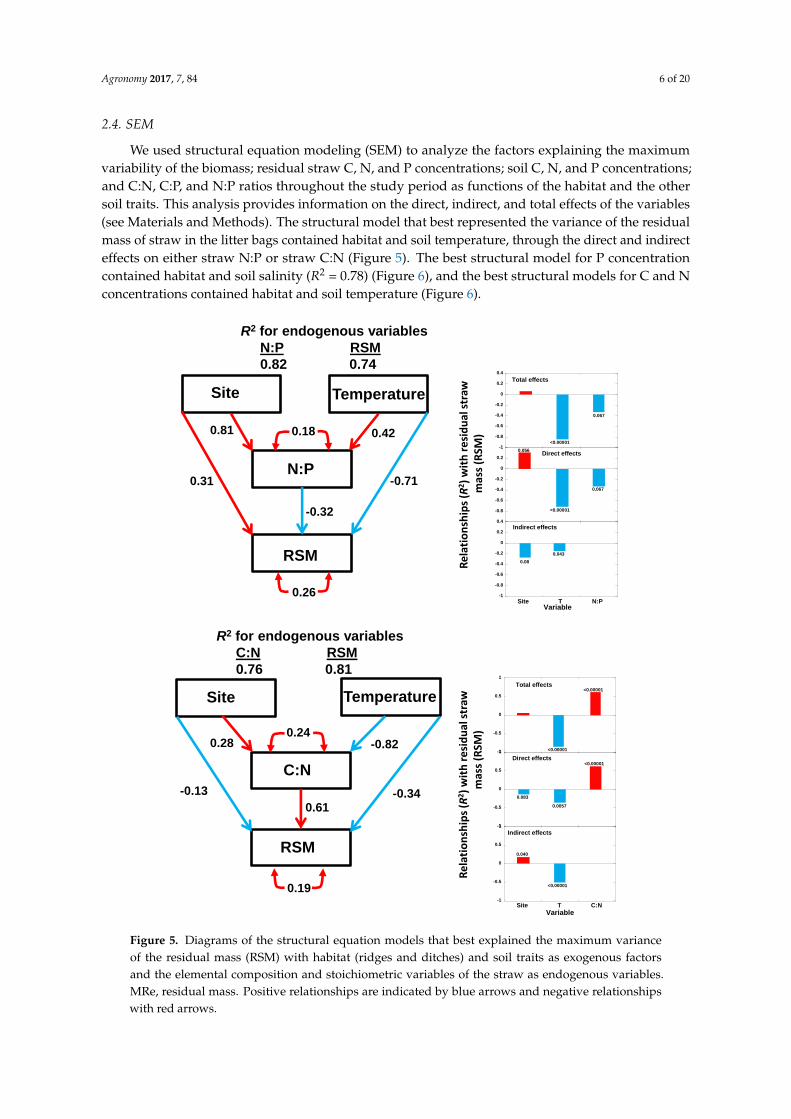
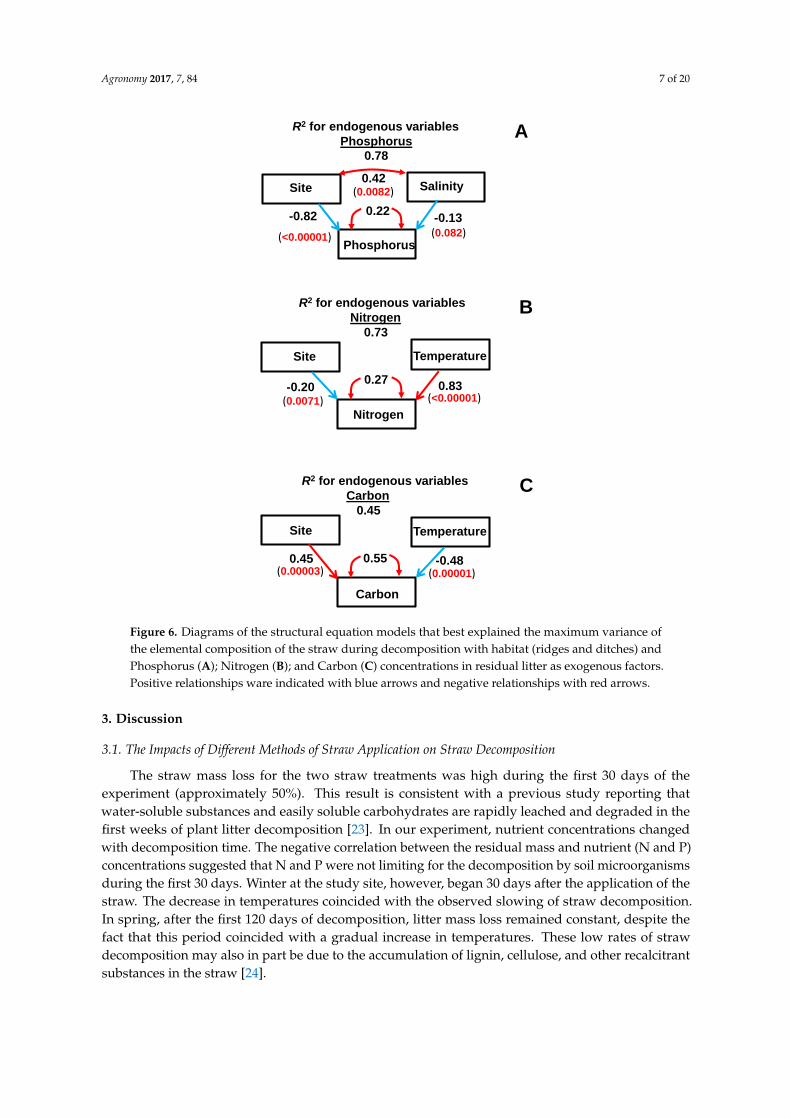
We used structural equation modeling (SEM) to analyze the factors explaining the maximumvariability of the biomass; residual straw C, N, and P concentrations; soil C, N, and P concentrations;and C:N, C:P, and N:P ratios throughout the study period as functions of the habitat and the othersoil traits. This analysis provides information on the direct, indirect, and total effects of the variables(see Materials and Methods). The structural model that best represented the variance of the residualmass of straw in the litter bags contained habitat and soil temperature, through the direct and indirecteffects on either straw N:P or straw C:N (Figure 5). The best structural model for P concentrationcontained habitat and soil salinity (R2 = 0.78) (Figure 6), and the best structural models for C and Nconcentrations contained habitat and soil temperature (Figure 6).Agronomy 2017, 7, 84 7 of 21
Figure 5. Diagrams of the structural equation models that best explained the maximum variance of
the residual mass (RSM) with habitat (ridges and ditches) and soil traits as exogenous factors and the
elemental composition and stoichiometric variables of the straw as endogenous variables. MRe,
residual mass. Positive relationships are indicated by blue arrows and negative relationships with red
arrows.
Site Temperature
N:P
RSM
0.81 0.42
-0.32
-0.710.31
R2 for endogenous variables
N:P RSM
0.82 0.74
Site Temperature
C:N
RSM
0.18
0.26
R2 for endogenous variables
C:N RSM
0.76 0.81
0.28 -0.820.24
0.19
0.61-0.34-0.13
Re
lati
on
ship
s(R
2)
wit
hre
sid
ual
str
awm
ass
(RSM
)R
ela
tio
nsh
ips
(R2)
wit
hre
sid
ual
str
awm
ass
(RSM
)
-1
-0.8
-0.6
-0.4
-0.2
0
0.2
0.4
Total effects
<0.00001
0.067
-0.8
-0.6
-0.4
-0.2
0
0.2
0.056
<0.00001
0.067
Direct effects
-1
-0.8
-0.6
-0.4
-0.2
0
0.2
0.4
Site T N:PVariable
Indirect effects
0.08
0.043
-1
-0.5
0
0.5
1
Total effects
<0.00001
<0.00001
-1
-0.5
0
0.5
1
Direct effects
0.083
0.0057
<0.00001
-1
-0.5
0
0.5
1
Site T C:N
Variable
Indirect effects
<0.00001
0.040
Figure 5. Diagrams of the structural equation models that best explained the maximum varianceof the residual mass (RSM) with habitat (ridges and ditches) and soil traits as exogenous factorsand the elemental composition and stoichiometric variables of the straw as endogenous variables.MRe, residual mass. Positive relationships are indicated by blue arrows and negative relationshipswith red arrows.
Agronomy 2017, 7, 84 7 of 20Agronomy 2017, 7, 84 8 of 21
Figure 6. Diagrams of the structural equation models that best explained the maximum variance of
the elemental composition of the straw during decomposition with habitat (ridges and ditches) and
Phosphorus (A); Nitrogen (B); and Carbon (C) concentrations in residual litter as exogenous factors.
Positive relationships ware indicated with blue arrows and negative relationships with red arrows.
3. Discussion
3.1. The Impacts of Different Methods of Straw Application on Straw Decomposition
The straw mass loss for the two straw treatments was high during the first 30 days of the
experiment (approximately 50%). This result is consistent with a previous study reporting that water-
soluble substances and easily soluble carbohydrates are rapidly leached and degraded in the first
weeks of plant litter decomposition [23]. In our experiment, nutrient concentrations changed with
decomposition time. The negative correlation between the residual mass and nutrient (N and P)
concentrations suggested that N and P were not limiting for the decomposition by soil
microorganisms during the first 30 days. Winter at the study site, however, began 30 days after the
application of the straw. The decrease in temperatures coincided with the observed slowing of straw
decomposition. In spring, after the first 120 days of decomposition, litter mass loss remained constant,
despite the fact that this period coincided with a gradual increase in temperatures. These low rates
of straw decomposition may also in part be due to the accumulation of lignin, cellulose, and other
recalcitrant substances in the straw [24].
The straw decomposition rate was higher in the ditches than the ridges during the first 10 days,
which may have been due to the initial higher impacts on the ridges of the plastic sheeting covering
the ridges at the beginning of the vegetable crop.
Site Salinity
Phosphorus
Site Temperature
Nitrogen
Site Temperature
Carbon
-0.130.22-0.82
0.42
0.83-0.200.27
0.55 -0.480.45
(0.0082)
(0.082)(<0.00001)
(0.0071) (<0.00001)
(0.00003) (0.00001)
R2 for endogenous variables
Phosphorus
0.78
R2 for endogenous variables
Nitrogen
0.73
R2 for endogenous variables
Carbon
0.45
A
B
C
Figure 6. Diagrams of the structural equation models that best explained the maximum variance ofthe elemental composition of the straw during decomposition with habitat (ridges and ditches) andPhosphorus (A); Nitrogen (B); and Carbon (C) concentrations in residual litter as exogenous factors.Positive relationships ware indicated with blue arrows and negative relationships with red arrows.
3. Discussion
3.1. The Impacts of Different Methods of Straw Application on Straw Decomposition
The straw mass loss for the two straw treatments was high during the first 30 days of theexperiment (approximately 50%). This result is consistent with a previous study reporting thatwater-soluble substances and easily soluble carbohydrates are rapidly leached and degraded in thefirst weeks of plant litter decomposition [23]. In our experiment, nutrient concentrations changedwith decomposition time. The negative correlation between the residual mass and nutrient (N and P)concentrations suggested that N and P were not limiting for the decomposition by soil microorganismsduring the first 30 days. Winter at the study site, however, began 30 days after the application of thestraw. The decrease in temperatures coincided with the observed slowing of straw decomposition.In spring, after the first 120 days of decomposition, litter mass loss remained constant, despite thefact that this period coincided with a gradual increase in temperatures. These low rates of strawdecomposition may also in part be due to the accumulation of lignin, cellulose, and other recalcitrantsubstances in the straw [24].
Agronomy 2017, 7, 84 8 of 20
The straw decomposition rate was higher in the ditches than the ridges during the first 10 days,which may have been due to the initial higher impacts on the ridges of the plastic sheeting coveringthe ridges at the beginning of the vegetable crop.
3.2. The Variability of C, N, and P Concentrations and C:N:P Stoichiometry during Straw Decomposition
Several studies have also shown that the N:P ratio is an important factor during litterdecomposition and can provide information on the most limiting nutrient [25]. The relative demand ofa nutrient during decomposition, such as C, N, and P, may control the stoichiometric C:N:P dynamicsin decomposing litter [26]. In our study, the residual straw mass was not significantly correlated with Pconcentration, but was negatively and significantly correlated with the N:P ratio. This result suggestedthat straw decomposition is N limited in this area, consistent with the low N:P ratios of soils at thisstudy site, around 1.1 in mass basis, when the global average reported by Cleveland and Liptzin [27]is 5.9, and further suggesting a general N limitation in this ecosystem that may be associated withhigher N than P uptake by decomposers. Soil total N and P concentrations at this site were reported as1.2 and 1.1 mg g−1, respectively [28].
Wang et al. [29] also reported a similar molar N:P ratio of 2.42 in the soils of other ecosystems inthe same wetland where the studied rice crop was located. This ratio is much lower than the averageof 28 for various wetlands around the world [30], providing strong evidence of the N limitation of thiswetland. Moreover, the P concentration in the straw varied more than the C and N concentrationsduring decomposition, similar to the litter decomposition in a natural wetland in the same area [31].Indeed, changes in nutrient levels during litter decomposition have been associated with a largevariation in microbial P contents [32].
The N and especially the P concentrations of the straw located on ridges tended to be higher inridges than in ditches during the first 120 days of decompositions. In the more aerobic environmentof ridges, P is proportionally more retained than N in straw in comparison with the more anaerobicenvironment of ditches. The application of straw on ridges thus tended to release decompositionproducts with a higher N:P ratio than the application of straw in ditches. This result was consistentwith the proposal that organisms in a medium poor in N should invest more effort to take up thelimiting element to maintain a more equilibrated N:P ratio [33]. Organisms will release or absorbnutrients to or from the environment to maintain an optimum stoichiometry of C, N, P, and otherelements [33]. The rate of litter decomposition in the first 120 days was higher in the well-oxygenatedand warmer ridge habitats than in the ditch habitats. The ridges had more favorable environmentalconditions (temperature, oxygen, and salinity) for increasing the nutrient-use efficiency, carbon use,and respiration, so more C can be used without the need for as much N and P [34]. Water conditionswere quite different between ridges and ditches during vegetable growth; the decomposition of ricestraw was more aerobic in the ridges than in the ditches. Water conditions (time of flooding andsoil water content) were also underlying the differences in temperature and salinity between ridgesand ditches. So, the differences in straw decomposition observed in the study may mainly resultfrom the different water status between ridges and ditches. The higher temperatures of the ridgeswere in fact correlated with lower litter C:N ratios and higher N concentrations. This trend wasnot observed for litter P concentration, which, in contrast, was negatively correlated with salinity.Similar results have been reported in the decomposition of Kandelia candel litter under different salinityconditions in laboratory experiments, with lower litter P concentrations occurring under conditionsof high salinity [35]. Consistent with these results and within the framework of the Growth RateHypothesis [33], environments with high salinity should favor microbial communities with high N:Pdemands, so P should be released from litter more slowly than other nutrients, such as C and N.The evolution of C and N concentrations and contents in litter during decomposition should thus bemore dependent than litter P concentration on environmental factors such as temperature or salinitythat affect soil microorganisms.
Agronomy 2017, 7, 84 9 of 20
The straw in the ridges thus had lower C:N and C:P ratios and less residual mass at the beginningof the rice crop (120 days after straw application). These results were consistent with the higherrelease of N and P during the rice crop (120–210 days of decomposition), because the highest ratesof decomposition and soil respiration of organic matter are correlated with lower C:N and C:P ratiosunder the same environmental conditions [36]. The C:N and C:P ratios of the straw in the ridgesduring the rice crop, however, tended to converge with those of straw in the ditches, which werecorrelated with the higher release of N and P from straw in the ridges. These results are consistentwith the long-term decomposition of different types of litter under similar environmental conditionsreported by a previous study [37].
In summary, the release of nutrients from the straw differed between the ridges and ditches dueto the different environmental conditions of these two habitats. Carbon release was higher, whereas Nand P release and released C:N, C:P and N:P ratios from straw were lower in the ridges than in theditches at the beginning of the decomposition period during the vegetable crop and the first fallowperiod. The straw in the ridges thereafter released more N and P during the rice crop. The applicationof straw on the ridges thus allowed a better release of N and P during the rice crop and produced lessresidual straw mass than the application of straw in the ditches. Both of these factors can enhancerice growth.
4. Materials and Methods
4.1. Study Site
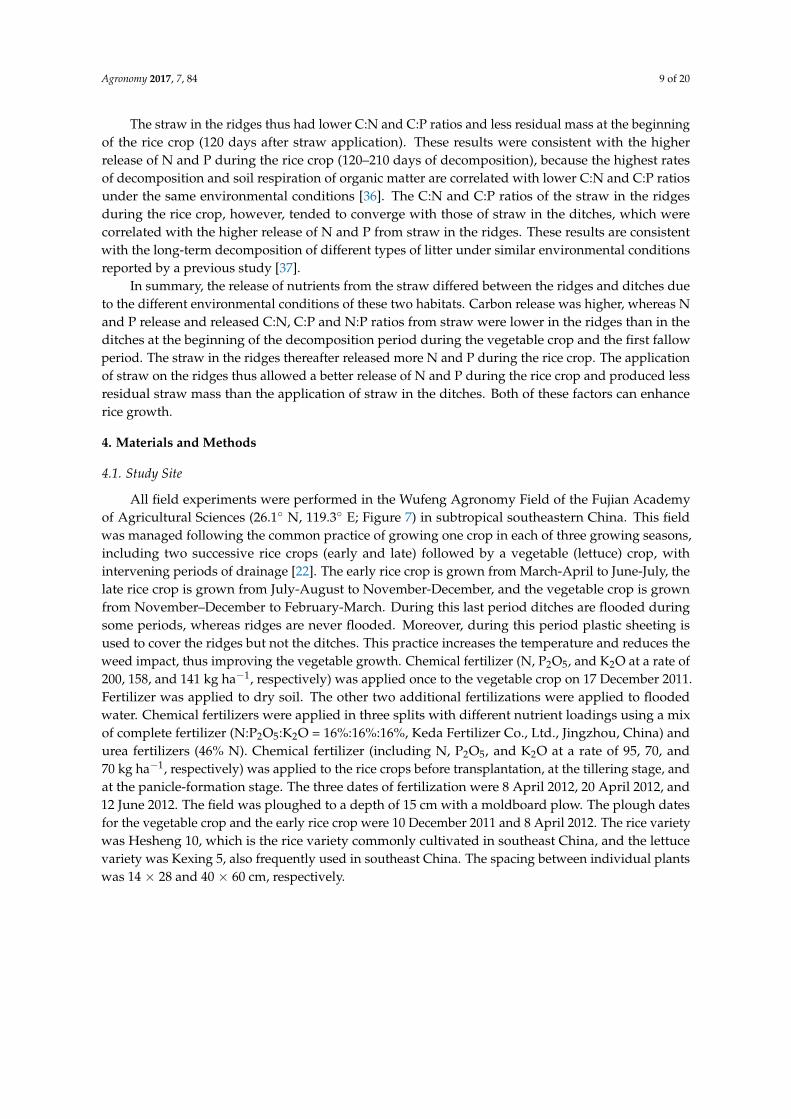
All field experiments were performed in the Wufeng Agronomy Field of the Fujian Academyof Agricultural Sciences (26.1◦ N, 119.3◦ E; Figure 7) in subtropical southeastern China. This fieldwas managed following the common practice of growing one crop in each of three growing seasons,including two successive rice crops (early and late) followed by a vegetable (lettuce) crop, withintervening periods of drainage [22]. The early rice crop is grown from March-April to June-July, thelate rice crop is grown from July-August to November-December, and the vegetable crop is grownfrom November–December to February-March. During this last period ditches are flooded duringsome periods, whereas ridges are never flooded. Moreover, during this period plastic sheeting isused to cover the ridges but not the ditches. This practice increases the temperature and reduces theweed impact, thus improving the vegetable growth. Chemical fertilizer (N, P2O5, and K2O at a rate of200, 158, and 141 kg ha−1, respectively) was applied once to the vegetable crop on 17 December 2011.Fertilizer was applied to dry soil. The other two additional fertilizations were applied to floodedwater. Chemical fertilizers were applied in three splits with different nutrient loadings using a mixof complete fertilizer (N:P2O5:K2O = 16%:16%:16%, Keda Fertilizer Co., Ltd., Jingzhou, China) andurea fertilizers (46% N). Chemical fertilizer (including N, P2O5, and K2O at a rate of 95, 70, and70 kg ha−1, respectively) was applied to the rice crops before transplantation, at the tillering stage, andat the panicle-formation stage. The three dates of fertilization were 8 April 2012, 20 April 2012, and12 June 2012. The field was ploughed to a depth of 15 cm with a moldboard plow. The plough datesfor the vegetable crop and the early rice crop were 10 December 2011 and 8 April 2012. The rice varietywas Hesheng 10, which is the rice variety commonly cultivated in southeast China, and the lettucevariety was Kexing 5, also frequently used in southeast China. The spacing between individual plantswas 14 × 28 and 40 × 60 cm, respectively.
Agronomy 2017, 7, 84 10 of 20Agronomy 2017, 7, 84 11 of 21
Figure 7. The location of the study area and sampling site in Fujian province, southeastern China.
The soil of the paddy field was moist, poorly drained, and had a sand:silt:clay content of 28:60:12
[28]. The bulk density of the soil prior to this study was 1.1 g cm−3. The soil pH (1:5 with H2O) was
6.5, and the concentrations of organic carbon, total N, and total P were 18.1, 1.2, and 1.1 g kg−1,
respectively [28]. The water level was maintained at 5–7 cm above the soil surface in the rice crops
before the late tillering stage, and then drained for the control of non-productive tillering [38]. After
about one week, the paddy field was re-flooded, kept alternately wet and dry, and then drained again
two weeks before rice harvest.
4.2. Experimental Design
The rice straw used in the experiment was collected from the late rice crop. The straw-
decomposition experiment used nylon-mesh bags [39]. Each bag was 20 × 20 cm with a pore size of 1
mm and contained 13 g of straw, and the bags were placed on top of the soil. The experiment began
on 17 December 2011 during the vegetable crop season. The field contained two microhabitats during
this period, the ditches and ridges, which provided the two treatments of this decomposition
experiment (Figure A1), with three replicates each. The ridges were 40 cm apart with heights and
widths of 15 cm, which is typical for this area. Straw samples were collected 10, 30, and 60 days after
straw application during the vegetable crop (17 December 2011 to 8 March 2012); 90 days after straw
application during the first fallow period (8 March to 11 April 2012); 120, 150, and 180 days after
straw application during the early rice crop (11 April to 13 July 2012); and 210 days after straw
application during the second fallow period (13 July to 31 July 2012). The experiment thus consisted
of two treatments (habitats) × eight sampling times × three replicates = 48 sample bags.
4.3. Sample Collection and Analysis
Three samples (one from each replicate) were randomly collected from each treatment on each
sampling date. The litter from each nylon bag was gently washed with water and subsequently oven-
dried to a constant mass (65 °C for 24–36 h) and weighed. These dried and cleaned samples were then
finely ground in a ball mill. The C and N concentrations of the dried litter were determined using a
Vario EL III Elemental Analyzer (Elemental Scientific Instruments, Hanau, Germany). The P
concentration of the litter was measured using the molybdate-blue reaction [40] with a UV-2450
spectrophotometer (Shimadzu Scientific Instruments, Kyoto, Japan).
Figure 7. The location of the study area and sampling site in Fujian province, southeastern China.
The soil of the paddy field was moist, poorly drained, and had a sand:silt:clay content of 28:60:12 [28].The bulk density of the soil prior to this study was 1.1 g cm−3. The soil pH (1:5 with H2O) was 6.5, and theconcentrations of organic carbon, total N, and total P were 18.1, 1.2, and 1.1 g kg−1, respectively [28].The water level was maintained at 5–7 cm above the soil surface in the rice crops before the late tilleringstage, and then drained for the control of non-productive tillering [38]. After about one week, thepaddy field was re-flooded, kept alternately wet and dry, and then drained again two weeks beforerice harvest.
4.2. Experimental Design
The rice straw used in the experiment was collected from the late rice crop. The straw-decompositionexperiment used nylon-mesh bags [39]. Each bag was 20 × 20 cm with a pore size of 1 mm andcontained 13 g of straw, and the bags were placed on top of the soil. The experiment began on17 December 2011 during the vegetable crop season. The field contained two microhabitats during thisperiod, the ditches and ridges, which provided the two treatments of this decomposition experiment(Figure A1), with three replicates each. The ridges were 40 cm apart with heights and widths of 15 cm,which is typical for this area. Straw samples were collected 10, 30, and 60 days after straw applicationduring the vegetable crop (17 December 2011 to 8 March 2012); 90 days after straw application duringthe first fallow period (8 March to 11 April 2012); 120, 150, and 180 days after straw applicationduring the early rice crop (11 April to 13 July 2012); and 210 days after straw application duringthe second fallow period (13 July to 31 July 2012). The experiment thus consisted of two treatments(habitats) × eight sampling times × three replicates = 48 sample bags.
4.3. Sample Collection and Analysis
Three samples (one from each replicate) were randomly collected from each treatment on eachsampling date. The litter from each nylon bag was gently washed with water and subsequentlyoven-dried to a constant mass (65 ◦C for 24–36 h) and weighed. These dried and cleaned sampleswere then finely ground in a ball mill. The C and N concentrations of the dried litter were determinedusing a Vario EL III Elemental Analyzer (Elemental Scientific Instruments, Hanau, Germany). The P
Agronomy 2017, 7, 84 11 of 20
concentration of the litter was measured using the molybdate-blue reaction [40] with a UV-2450spectrophotometer (Shimadzu Scientific Instruments, Kyoto, Japan).
Soil salinity (mS cm−1), pH, and temperature were measured in situ on each sampling date at adepth of 20 cm. Soil pH and temperature were measured with a pH/temperature meter (IQ ScientificInstruments, Carlsbad, CA, USA), and soil salinity was measured using a 2265FS EC Meter (SpectrumTechnologies Inc., Paxinos, PA, USA).
4.4. Statistical Analyses
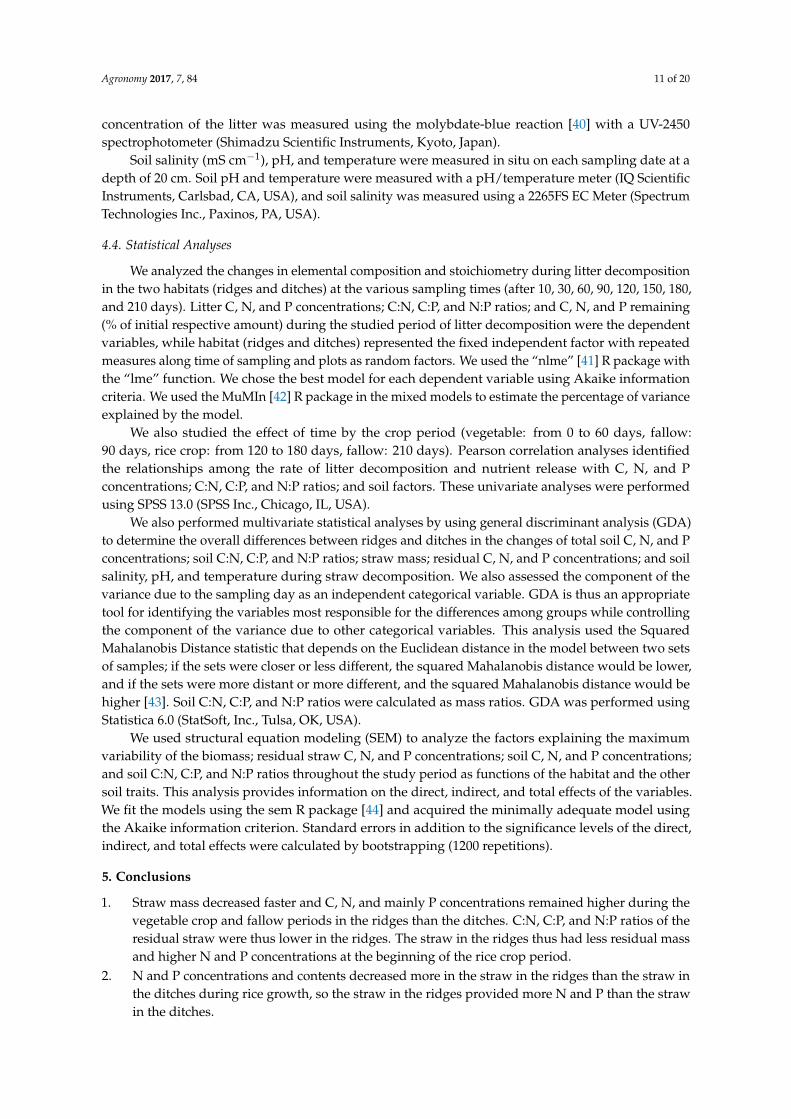
We analyzed the changes in elemental composition and stoichiometry during litter decompositionin the two habitats (ridges and ditches) at the various sampling times (after 10, 30, 60, 90, 120, 150, 180,and 210 days). Litter C, N, and P concentrations; C:N, C:P, and N:P ratios; and C, N, and P remaining(% of initial respective amount) during the studied period of litter decomposition were the dependentvariables, while habitat (ridges and ditches) represented the fixed independent factor with repeatedmeasures along time of sampling and plots as random factors. We used the “nlme” [41] R package withthe “lme” function. We chose the best model for each dependent variable using Akaike informationcriteria. We used the MuMIn [42] R package in the mixed models to estimate the percentage of varianceexplained by the model.
We also studied the effect of time by the crop period (vegetable: from 0 to 60 days, fallow:90 days, rice crop: from 120 to 180 days, fallow: 210 days). Pearson correlation analyses identifiedthe relationships among the rate of litter decomposition and nutrient release with C, N, and Pconcentrations; C:N, C:P, and N:P ratios; and soil factors. These univariate analyses were performedusing SPSS 13.0 (SPSS Inc., Chicago, IL, USA).
We also performed multivariate statistical analyses by using general discriminant analysis (GDA)to determine the overall differences between ridges and ditches in the changes of total soil C, N, and Pconcentrations; soil C:N, C:P, and N:P ratios; straw mass; residual C, N, and P concentrations; and soilsalinity, pH, and temperature during straw decomposition. We also assessed the component of thevariance due to the sampling day as an independent categorical variable. GDA is thus an appropriatetool for identifying the variables most responsible for the differences among groups while controllingthe component of the variance due to other categorical variables. This analysis used the SquaredMahalanobis Distance statistic that depends on the Euclidean distance in the model between two setsof samples; if the sets were closer or less different, the squared Mahalanobis distance would be lower,and if the sets were more distant or more different, and the squared Mahalanobis distance would behigher [43]. Soil C:N, C:P, and N:P ratios were calculated as mass ratios. GDA was performed usingStatistica 6.0 (StatSoft, Inc., Tulsa, OK, USA).
We used structural equation modeling (SEM) to analyze the factors explaining the maximumvariability of the biomass; residual straw C, N, and P concentrations; soil C, N, and P concentrations;and soil C:N, C:P, and N:P ratios throughout the study period as functions of the habitat and the othersoil traits. This analysis provides information on the direct, indirect, and total effects of the variables.We fit the models using the sem R package [44] and acquired the minimally adequate model usingthe Akaike information criterion. Standard errors in addition to the significance levels of the direct,indirect, and total effects were calculated by bootstrapping (1200 repetitions).
5. Conclusions
1. Straw mass decreased faster and C, N, and mainly P concentrations remained higher during thevegetable crop and fallow periods in the ridges than the ditches. C:N, C:P, and N:P ratios of theresidual straw were thus lower in the ridges. The straw in the ridges thus had less residual massand higher N and P concentrations at the beginning of the rice crop period.
2. N and P concentrations and contents decreased more in the straw in the ridges than the straw inthe ditches during rice growth, so the straw in the ridges provided more N and P than the strawin the ditches.
Agronomy 2017, 7, 84 12 of 20
3. Temperature played a key role in the changes of straw C and N concentrations duringdecomposition, whereas soil salinity had more of an effect on the changes of straw P concentrations.
4. The application of straw in the ridges thus allowed a better release of N and P during the ricecrop period and produced less residual straw mass than the application of straw in the ditches.Both processes can enhance rice yield in the subtropical rice croplands of China and southeastAsia that use this management system.
Acknowledgments: The authors would like to thank Yongyue Ma, Linmei Ouyang, and Xianbiao Linfor their assistance with field sampling. Funding was provided by the National Science Foundation ofChina (41571287; 31000209), Natural Science Foundation Key Programs of Fujian Province (2018R1101006-1),Fujian Provincial Outstanding Young Scientists Program (2017), and by the Spanish Government grantCGL2013-48074-P, the Catalan Government grant SGR 2014-274, and the European Research Council Synergygrant ERC-SyG-2013-610028, IMBALANCE-P.
Author Contributions: W.W. and C.Z. designed the experiment; W.W. and C.W. performed the experiment;W.W., J.S., provided data analyses; and W.W., J.S., M.B., T.P., D.Y.F.L. and J.P. co-wrote the paper.
Conflicts of Interest: The authors declare no conflict of interest.
Appendix A
Table A1. Results of the mixed repeated measures (time) models with habitat (ridges versus ditches)as the fixed independent variable, plot the as random variable, and the different litter and soilstudied variables.
Variable Model Type R2 Model
lme (Variable~Site * Day, Data = Dades,Random = ~1|Day/Plot, Method = “REML”)
Site (Fixed) Time (Repeat) Site ˆ Time
Mass remaining (% of initial) lme 0.94F = 6.86 F = 59.8 F = 18.6p = 0.016 p = 0.0002 p = 0.0003
Carbon remaining (% of initial) lme 0.95F = 0.906 F = 94.8 F = 16.0p = 0.35 p = 0.0001 p = 0.0006
Nitrogen remaining (% of initial) lme 0.89F = 20.3 F = 19.3 F = 27.8
p = 0.0002 p = 0.0046 p < 0.0001
Phosporus remaining (% of initial) lme 0.88F = 118 F = 4.70 F = 47.9
p < 0.0001 p = 0.073 p < 0.0001
Carbon concentration in litter lme 0.76F = 2.43 F = 5.71 F = 4.60p = 0.13 p = 0.054 p = 0.043
Nitrogen concentration in litter lme 0.85F = 0.695 F = 56.4 F = 2.34p = 0.41 p = 0.0003 p = 0.14
Phosphorus concentration in litter lme 0.87F = 79.7 F = 2.82 F = 0.036
p < 0.0001 p = 0.14 p = 0.85
Litter C:N ratio lme 0.88F = 7.36 F = 120 F = 0.33p = 0.13 p < 0.0001 p = 0.57
Litter C:P ratio lme 0.85F = 87.6 F = 10.4 F = 4.06
p < 0.0001 p = 0.018 p = 0.056
Litter N:P ratio lme 0.84F = 54.9 F = 8.06 F = 0.075
p < 0.0001 p = 0.030 p = 0.79
Soil pH lme 0.83F = 1.52 F = 0.827 F = 1.27p = 0.23 p = 0.40 p = 0.27
Soil salinity lme 0.90F = 37.7 F = 0.967 F = 4.61p < 0.001 p = 0.363 p = 0.043
Soil temperature lme 0.98F = 0.638 F = 32.6 F = 0.015p = 0.43 p = 0.0012 p = 0.91
(*) Represents the fact that the model contained the effects of both independent factor and also their interaction.ˆ Represents the interaction between the two dependent factors in the model.
Agronomy 2017, 7, 84 13 of 20
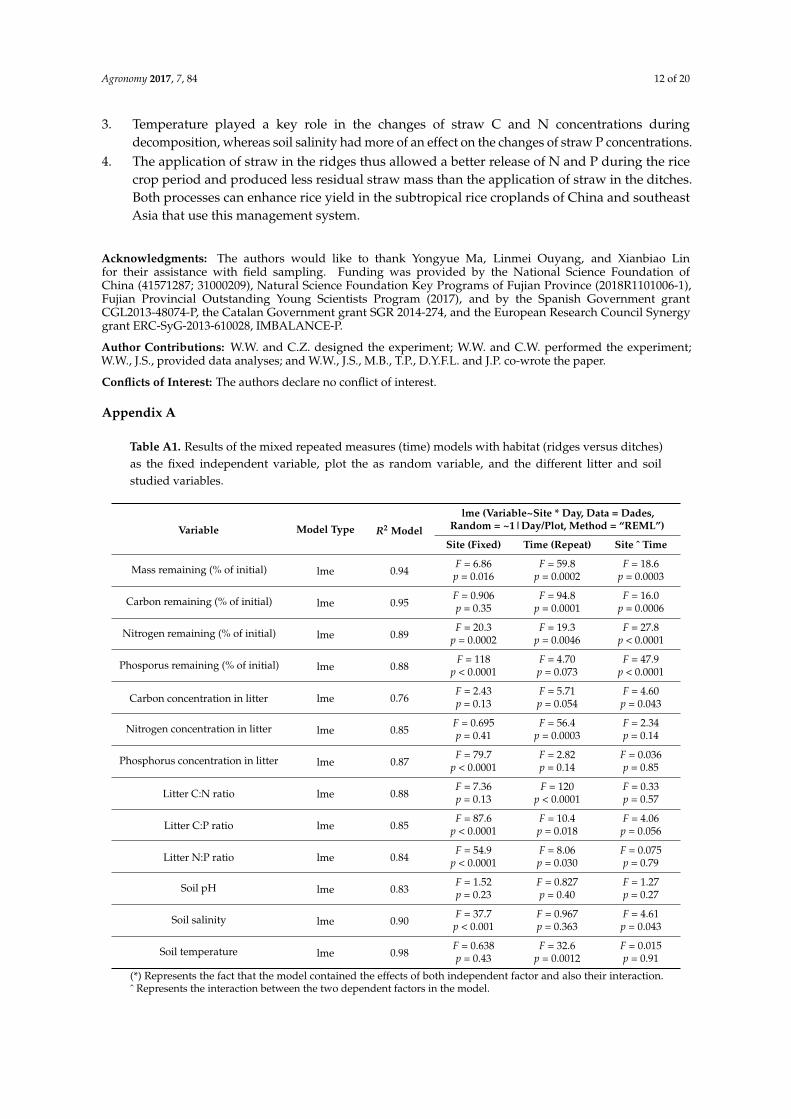
Table A2. Residual mass, nutrient characteristics of the straw, and physical soil traits (mean ± SE) in each crop period.
Variable Residual Mass (%) Soil Temperature (◦C) Soil Salinity (mS cm−1) Soil pH
Residual mass and soil properties
Vegetable crop (both habitats) 60.29 ± 2.63a 12.70 ± 0.32a 0.36 ± 0.05a 6.33 ± 0.05a
First fallow period (both habitats) 42.78 ± 1.90b 22.07 ± 0.41b 0.23 ± 0.06ab 6.00 ± 0.03a
Rice crop (both habitats) 29.62 ± 1.77c 27.81 ± 0.44c 0.40 ± 0.04ac 6.22 ± 0.16a
Second fallow period (both habitats) 20.22 ± 1.48d 29.80 ± 0.28d 0.25 ± 0.02a 6.17 ± 0.05a
Crop period F = 141.319 F = 2643.159 F = 61.305 F = 37.587p < 0.001 p < 0.001 p < 0.001 p < 0.001
Ridges 40.34 ± 4.24 21.90 ± 1.57 0.27 ± 0.04 6.21 ± 0.10
Ditches 42.84 ± 2.97 21.46 ± 1.51 0.42 ± 0.03 6.24 ± 0.07
HabitatF = 3.401 F = 11.646 F = 2245.267 F = 0.159p = 0.139 p = 0.027 p < 0.001 p = 0.711
Crop period × habitat F = 6.809 F = 48.211 F = 5.733 F = 2.418p < 0.001 p < 0.001 p < 0.001 p = 0.045
Nutrient concentration C (mg g−1) N (mg g−1) P (mg g−1)
Vegetable crop (both habitats) 335.47 ± 3.25a 10.40 ± 0.21a 1.65 ± 0.15a
First fallow period (both habitats) 331.90 ± 7.58ab 11.69 ± 0.58a 1.44 ± 0.16a
Rice crop (both habitats) 319.99 ± 5.39b 15.52 ± 0.62b 1.68 ± 0.13a
Second fallow period (both habitats) 267.66 ± 15.56c 17.27 ± 0.21c 2.05 ± 0.22a
Crop period F = 18.234 F = 62.068 F = 9.660p < 0.001 p < 0.001 p < 0.001
Ridges 306.81 ± 6.55 14.06 ± 0.72 2.18 ± 0.07
Ditches 334.67 ± 4.18 12.61 ± 0.58 1.19 ± 0.05
HabitatF = 29.715 F = 31.669 F = 623.082p = 0.006 p = 0.005 p < 0.001
Crop period × habitat F = 2.710 F = 5.286 F = 3.439p = 0.028 p = 0.001 p = 0.009
Agronomy 2017, 7, 84 14 of 20
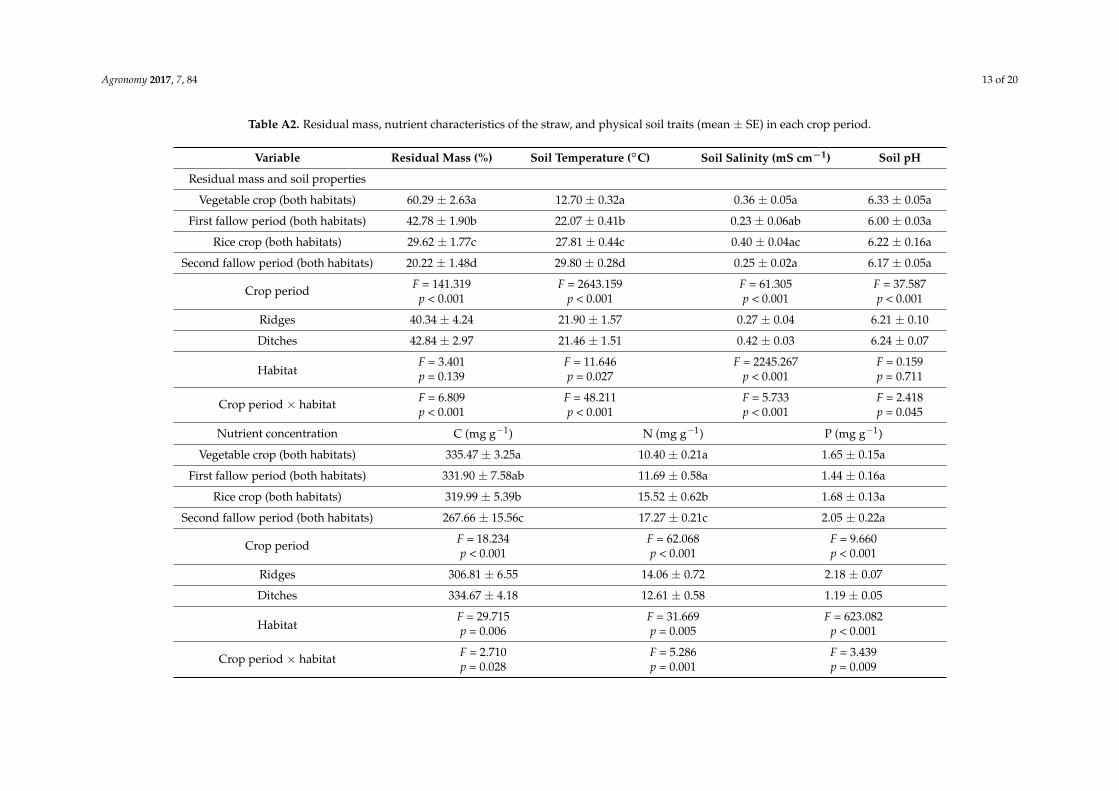
Table A2. Cont.
Variable Residual Mass (%) Soil Temperature (◦C) Soil Salinity (mS cm−1) Soil pH
Nutrient stoichiometry C:N ratio C:P ratio N:P ratio
Vegetable crop (both habitats) 32.51 ± 0.77a 236.57 ± 22.73a 7.16 ± 0.60a
First fallow period (both habitats) 28.70 ± 1.44a 250.26 ± 35.94a 8.73 ± 1.18ab
Rice crop (both habitats) 21.42 ± 1.20b 216.54 ± 20.25ab 9.85 ± 0.51b
Second fallow period (both habitats) 15.48 ± 0.83c 141.53 ± 21.77b 8.90 ± 0.96ab
Crop period F = 44.704 F = 7.700 F = 10.184p < 0.001 p < 0.001 p < 0.001
Ridges 23.51 ± 1.50 145.18 ± 6.79 6.50 ± 0.30
Ditches 27.98 ± 1.40 292.60 ± 13.31 10.66 ± 0.34
HabitatF = 35.419 F = 329.071 F = 127.838p = 0.004 p < 0.001 p < 0.001
Crop growth × habitat F = 0.967 F = 1.484 F = 1.369p = 0.474 p = 0.213 p = 0.257
Residual nutrients C (%) N (%) P (%)
Vegetable crop (both habitats) 54.36 ± 2.21a 68.46 ± 2.81a 51.69 ± 5.57a
First fallow period (both habitats) 38.13 ± 1.37b 54.36 ± 1.38b 31.75 ± 4.11b
Rice crop (both habitats) 25.80 ± 1.82c 48.63 ± 1.59b 23.82 ± 1.10b
Second fallow period (both habitats) 14.86 ± 1.88d 38.32 ± 2.84c 20.53 ± 0.82b
Crop period F = 178.055 F = 25.644 F = 47.704p < 0.001 p < 0.001 p < 0.001
Ridges 34.32 ± 3.87 55.55 ± 3.56 44.33 ± 4.87
Ditches 39.05 ± 2.94 55.44 ± 1.97 25.37 ± 1.69
HabitatF = 13.407 F = 0.002 F = 94.171p = 0.022 p = 0.965 p = 0.001
Crop growth × habitat F = 4.914 F = 3.110 F = 14.328p = 0.001 p = 0.015 p < 0.001
Different letters within a column for each variable indicate significant differences (p < 0.05).
Agronomy 2017, 7, 84 15 of 20
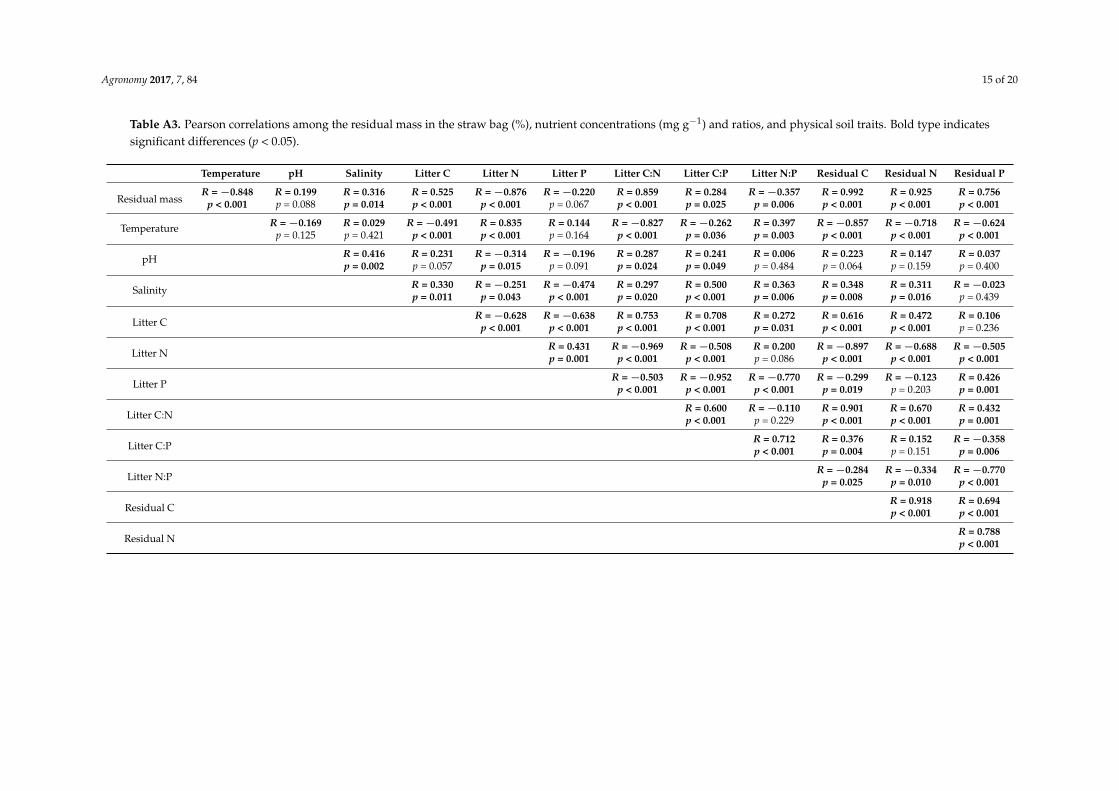
Table A3. Pearson correlations among the residual mass in the straw bag (%), nutrient concentrations (mg g−1) and ratios, and physical soil traits. Bold type indicatessignificant differences (p < 0.05).
Temperature pH Salinity Litter C Litter N Litter P Litter C:N Litter C:P Litter N:P Residual C Residual N Residual P
Residual massR = −0.848 R = 0.199 R = 0.316 R = 0.525 R = −0.876 R = −0.220 R = 0.859 R = 0.284 R = −0.357 R = 0.992 R = 0.925 R = 0.756
p < 0.001 p = 0.088 p = 0.014 p < 0.001 p < 0.001 p = 0.067 p < 0.001 p = 0.025 p = 0.006 p < 0.001 p < 0.001 p < 0.001
Temperature R = −0.169 R = 0.029 R = −0.491 R = 0.835 R = 0.144 R = −0.827 R = −0.262 R = 0.397 R = −0.857 R = −0.718 R = −0.624p = 0.125 p = 0.421 p < 0.001 p < 0.001 p = 0.164 p < 0.001 p = 0.036 p = 0.003 p < 0.001 p < 0.001 p < 0.001
pH R = 0.416 R = 0.231 R = −0.314 R = −0.196 R = 0.287 R = 0.241 R = 0.006 R = 0.223 R = 0.147 R = 0.037p = 0.002 p = 0.057 p = 0.015 p = 0.091 p = 0.024 p = 0.049 p = 0.484 p = 0.064 p = 0.159 p = 0.400
Salinity R = 0.330 R = −0.251 R = −0.474 R = 0.297 R = 0.500 R = 0.363 R = 0.348 R = 0.311 R = −0.023p = 0.011 p = 0.043 p < 0.001 p = 0.020 p < 0.001 p = 0.006 p = 0.008 p = 0.016 p = 0.439
Litter CR = −0.628 R = −0.638 R = 0.753 R = 0.708 R = 0.272 R = 0.616 R = 0.472 R = 0.106
p < 0.001 p < 0.001 p < 0.001 p < 0.001 p = 0.031 p < 0.001 p < 0.001 p = 0.236
Litter NR = 0.431 R = −0.969 R = −0.508 R = 0.200 R = −0.897 R = −0.688 R = −0.505p = 0.001 p < 0.001 p < 0.001 p = 0.086 p < 0.001 p < 0.001 p < 0.001
Litter PR = −0.503 R = −0.952 R = −0.770 R = −0.299 R = −0.123 R = 0.426
p < 0.001 p < 0.001 p < 0.001 p = 0.019 p = 0.203 p = 0.001
Litter C:NR = 0.600 R = −0.110 R = 0.901 R = 0.670 R = 0.432p < 0.001 p = 0.229 p < 0.001 p < 0.001 p = 0.001
Litter C:PR = 0.712 R = 0.376 R = 0.152 R = −0.358p < 0.001 p = 0.004 p = 0.151 p = 0.006
Litter N:PR = −0.284 R = −0.334 R = −0.770
p = 0.025 p = 0.010 p < 0.001
Residual CR = 0.918 R = 0.694p < 0.001 p < 0.001
Residual NR = 0.788p < 0.001
Agronomy 2017, 7, 84 16 of 20
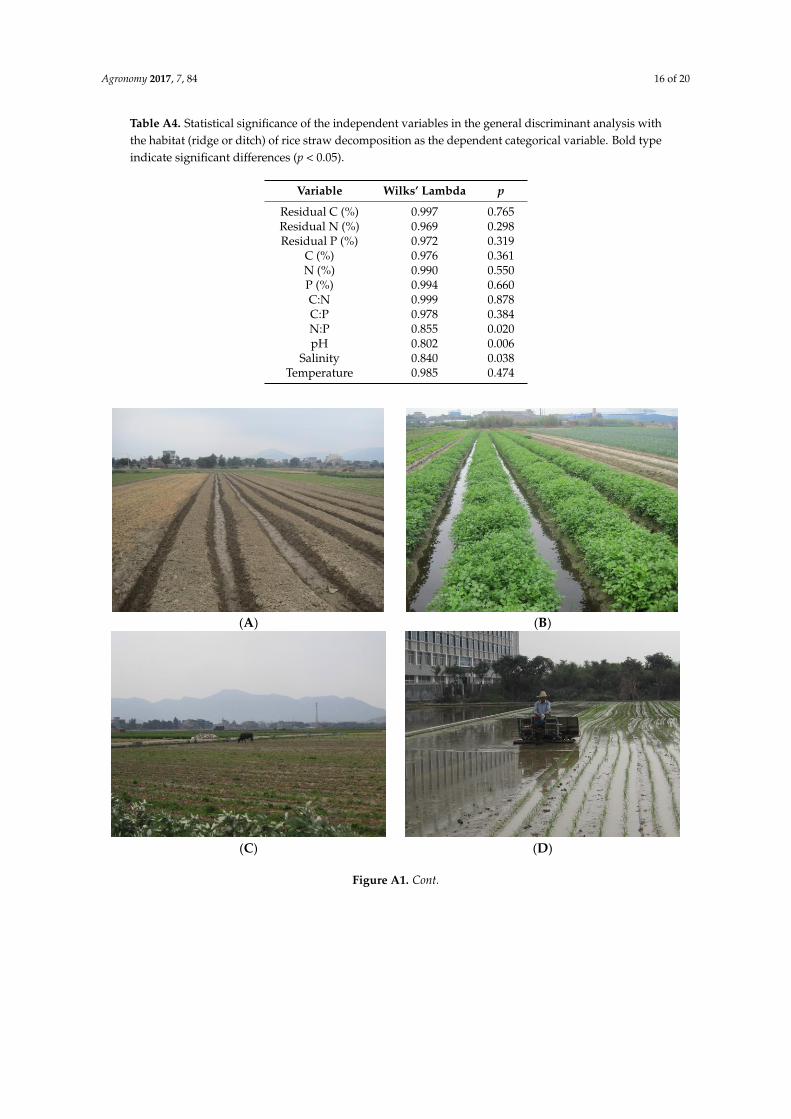
Table A4. Statistical significance of the independent variables in the general discriminant analysis withthe habitat (ridge or ditch) of rice straw decomposition as the dependent categorical variable. Bold typeindicate significant differences (p < 0.05).
Variable Wilks’ Lambda p
Residual C (%) 0.997 0.765Residual N (%) 0.969 0.298Residual P (%) 0.972 0.319
C (%) 0.976 0.361N (%) 0.990 0.550P (%) 0.994 0.660C:N 0.999 0.878C:P 0.978 0.384N:P 0.855 0.020pH 0.802 0.006
Salinity 0.840 0.038Temperature 0.985 0.474
Agronomy 2017, 7, 84 17 of 21
Table A4. Statistical significance of the independent variables in the general discriminant analysis
with the habitat (ridge or ditch) of rice straw decomposition as the dependent categorical variable.
Bold type indicate significant differences (p < 0.05).
Variable Wilks’ Lambda p
Residual C (%) 0.997 0.765
Residual N (%) 0.969 0.298
Residual P (%) 0.972 0.319
C (%) 0.976 0.361
N (%) 0.990 0.550
P (%) 0.994 0.660
C:N 0.999 0.878
C:P 0.978 0.384
N:P 0.855 0.020
pH 0.802 0.006
Salinity 0.840 0.038
Temperature 0.985 0.474
(A) (B)
(C) (D)
Figure A1. Cont.
Agronomy 2017, 7, 84 17 of 20
Agronomy 2017, 7, 84 18 of 21
(E) (F)
Figure A1. Photographs of the paddy field at various periods of the crop-rotation system (A)
preparation of vegetable beds; (B) vegetable growth; (C) fallow after vegetable harvest; (D)
preparation of rice beds and transplantation; (E) rice growth; and (F) fallow after rice harvest.
Figure A2. The dynamic changes of soil pH (A); temperature (B); and salinity (C) during rice straw
decomposition. Statistically significant differences (p < 0.5) between the ridges and ditches in each
sampling date are highlighted with (*).
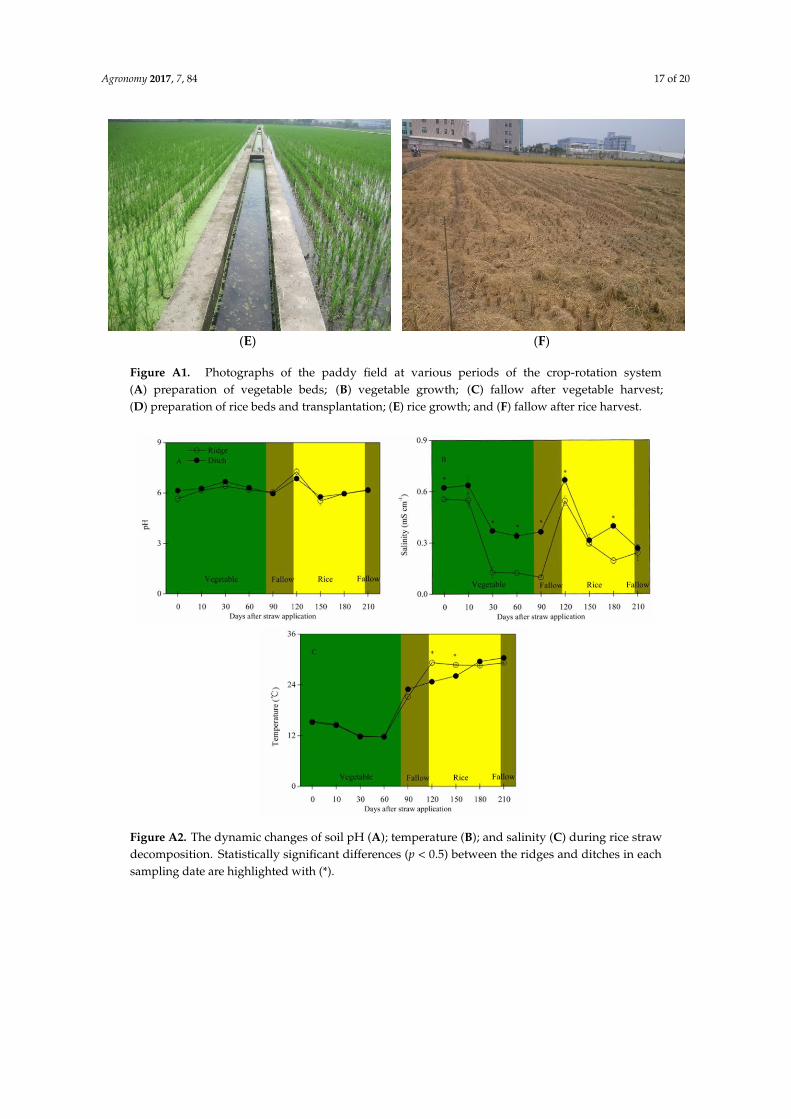
Figure A1. Photographs of the paddy field at various periods of the crop-rotation system(A) preparation of vegetable beds; (B) vegetable growth; (C) fallow after vegetable harvest;(D) preparation of rice beds and transplantation; (E) rice growth; and (F) fallow after rice harvest.
Agronomy 2017, 7, 84 18 of 21
(E) (F)
Figure A1. Photographs of the paddy field at various periods of the crop-rotation system (A)
preparation of vegetable beds; (B) vegetable growth; (C) fallow after vegetable harvest; (D)
preparation of rice beds and transplantation; (E) rice growth; and (F) fallow after rice harvest.
Figure A2. The dynamic changes of soil pH (A); temperature (B); and salinity (C) during rice straw
decomposition. Statistically significant differences (p < 0.5) between the ridges and ditches in each
sampling date are highlighted with (*).
Figure A2. The dynamic changes of soil pH (A); temperature (B); and salinity (C) during rice strawdecomposition. Statistically significant differences (p < 0.5) between the ridges and ditches in eachsampling date are highlighted with (*).
Agronomy 2017, 7, 84 18 of 20Agronomy 2017, 7, 84 19 of 21
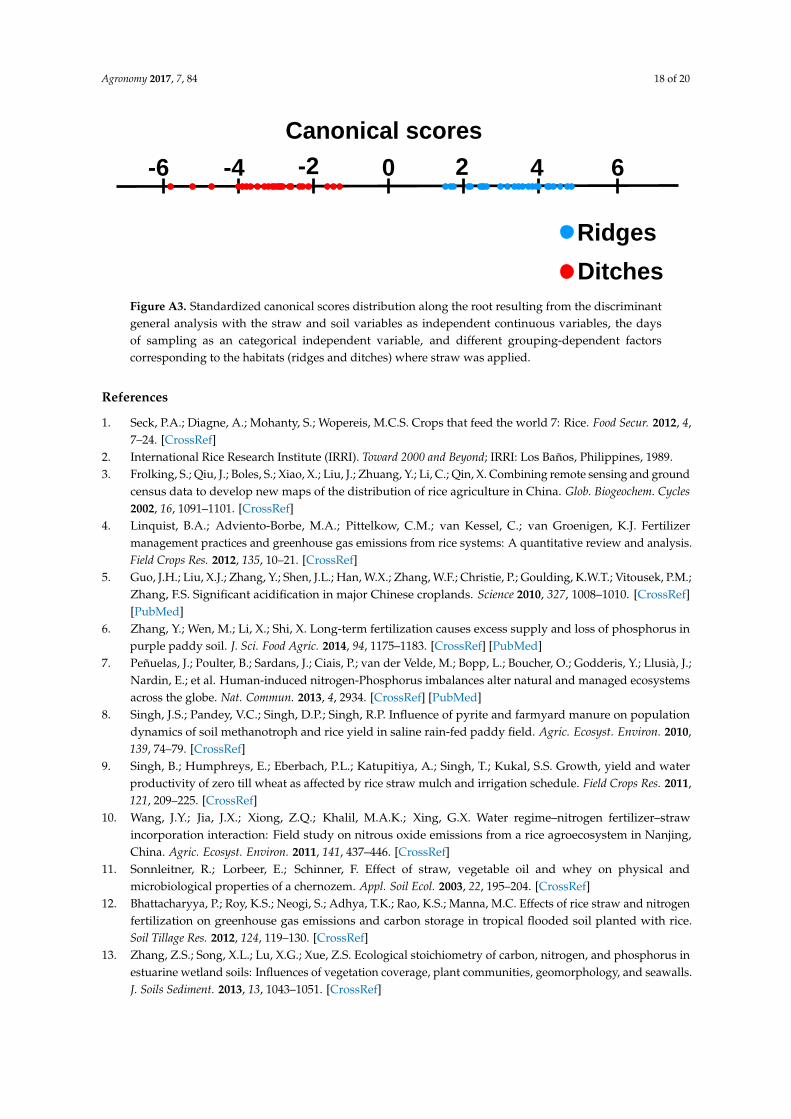
Figure A3. Standardized canonical scores distribution along the root resulting from the discriminant
general analysis with the straw and soil variables as independent continuous variables, the days of
sampling as an categorical independent variable, and different grouping-dependent factors
corresponding to the habitats (ridges and ditches) where straw was applied.
References
1. Seck, P.A.; Diagne, A.; Mohanty, S.; Wopereis, M.C.S. Crops that feed the world 7: Rice. Food Secur. 2012, 4,
7–24.
2. International Rice Research Institute (IRRI). Toward 2000 and Beyond; IRRI: Los Baños, Philippines, 1989.
3. Frolking, S.; Qiu, J.; Boles, S.; Xiao, X.; Liu, J.; Zhuang, Y.; Li, C.; Qin, X. Combining remote sensing and
ground census data to develop new maps of the distribution of rice agriculture in China. Glob. Biogeochem.
Cycles 2002, 16, 1091–1101.
4. Linquist, B.A.; Adviento-Borbe, M.A.; Pittelkow, C.M.; van Kessel, C.; van Groenigen, K.J. Fertilizer
management practices and greenhouse gas emissions from rice systems: A quantitative review and
analysis. Field Crops Res. 2012, 135, 10–21.
5. Guo, J.H.; Liu, X.J.; Zhang, Y.; Shen, J.L.; Han, W.X.; Zhang, W.F.; Christie, P.; Goulding, K.W.T.; Vitousek,
P.M.; Zhang, F.S. Significant acidification in major Chinese croplands. Science 2010, 327, 1008–1010.
6. Zhang, Y.; Wen, M.; Li, X.; Shi, X. Long‐term fertilization causes excess supply and loss of phosphorus in
purple paddy soil. J. Sci. Food Agric. 2014, 94, 1175–1183.
7. Peñuelas, J.; Poulter, B.; Sardans, J.; Ciais, P.; van der Velde, M.; Bopp, L.; Boucher, O.; Godderis, Y.; Llusià,
J.; Nardin, E.; et al. Human-induced nitrogen-Phosphorus imbalances alter natural and managed
ecosystems across the globe. Nat. Commun. 2013, 4, 2934.
8. Singh, J.S.; Pandey, V.C.; Singh, D.P.; Singh, R.P. Influence of pyrite and farmyard manure on population
dynamics of soil methanotroph and rice yield in saline rain-fed paddy field. Agric. Ecosyst. Environ. 2010,
139, 74–79.
9. Singh, B.; Humphreys, E.; Eberbach, P.L.; Katupitiya, A.; Singh, T.; Kukal, S.S. Growth, yield and water
productivity of zero till wheat as affected by rice straw mulch and irrigation schedule. Field Crops Res. 2011,
121, 209–225.
10. Wang, J.Y.; Jia, J.X.; Xiong, Z.Q.; Khalil, M.A.K.; Xing, G.X. Water regime–nitrogen fertilizer–straw
incorporation interaction: Field study on nitrous oxide emissions from a rice agroecosystem in Nanjing,
China. Agric. Ecosyst. Environ. 2011, 141, 437–446.
11. Sonnleitner, R.; Lorbeer, E.; Schinner, F. Effect of straw, vegetable oil and whey on physical and
microbiological properties of a chernozem. Appl. Soil Ecol. 2003, 22, 195–204.
12. Bhattacharyya, P.; Roy, K.S.; Neogi, S.; Adhya, T.K.; Rao, K.S.; Manna, M.C. Effects of rice straw and
nitrogen fertilization on greenhouse gas emissions and carbon storage in tropical flooded soil planted with
rice. Soil Tillage Res. 2012, 124, 119–130.
13. Zhang, Z.S.; Song, X.L.; Lu, X.G.; Xue, Z.S. Ecological stoichiometry of carbon, nitrogen, and phosphorus
in estuarine wetland soils: Influences of vegetation coverage, plant communities, geomorphology, and
seawalls. J. Soils Sediment. 2013, 13, 1043–1051.
14. Pan, T. The Effect of Straw Application on Soil Carbon Pool, Methane and Nitrous Oxide Emissions in the
Paddy Fields of Fuzhou. Ph.D. Thesis, Fujian Normal University, Fuzhou, China, 2014.
15. Sommer, R.; Ryan, J.; Masri, S.; Singh, M.M.; Diekmann, J. Effect of shallow tillage, moldboard plowing,
straw management and compost addition on soil organic matter and nitrogen in a dryland barley/wheat-
vetch rotation. Soil Tillage Res. 2011, 115, 39–46.
6420-2-4-6
Canonical scores
Ridges
Ditches
Figure A3. Standardized canonical scores distribution along the root resulting from the discriminantgeneral analysis with the straw and soil variables as independent continuous variables, the daysof sampling as an categorical independent variable, and different grouping-dependent factorscorresponding to the habitats (ridges and ditches) where straw was applied.
References
1. Seck, P.A.; Diagne, A.; Mohanty, S.; Wopereis, M.C.S. Crops that feed the world 7: Rice. Food Secur. 2012, 4,7–24. [CrossRef]
2. International Rice Research Institute (IRRI). Toward 2000 and Beyond; IRRI: Los Baños, Philippines, 1989.3. Frolking, S.; Qiu, J.; Boles, S.; Xiao, X.; Liu, J.; Zhuang, Y.; Li, C.; Qin, X. Combining remote sensing and ground
census data to develop new maps of the distribution of rice agriculture in China. Glob. Biogeochem. Cycles2002, 16, 1091–1101. [CrossRef]
4. Linquist, B.A.; Adviento-Borbe, M.A.; Pittelkow, C.M.; van Kessel, C.; van Groenigen, K.J. Fertilizermanagement practices and greenhouse gas emissions from rice systems: A quantitative review and analysis.Field Crops Res. 2012, 135, 10–21. [CrossRef]
5. Guo, J.H.; Liu, X.J.; Zhang, Y.; Shen, J.L.; Han, W.X.; Zhang, W.F.; Christie, P.; Goulding, K.W.T.; Vitousek, P.M.;Zhang, F.S. Significant acidification in major Chinese croplands. Science 2010, 327, 1008–1010. [CrossRef][PubMed]
6. Zhang, Y.; Wen, M.; Li, X.; Shi, X. Long-term fertilization causes excess supply and loss of phosphorus inpurple paddy soil. J. Sci. Food Agric. 2014, 94, 1175–1183. [CrossRef] [PubMed]
7. Peñuelas, J.; Poulter, B.; Sardans, J.; Ciais, P.; van der Velde, M.; Bopp, L.; Boucher, O.; Godderis, Y.; Llusià, J.;Nardin, E.; et al. Human-induced nitrogen-Phosphorus imbalances alter natural and managed ecosystemsacross the globe. Nat. Commun. 2013, 4, 2934. [CrossRef] [PubMed]
8. Singh, J.S.; Pandey, V.C.; Singh, D.P.; Singh, R.P. Influence of pyrite and farmyard manure on populationdynamics of soil methanotroph and rice yield in saline rain-fed paddy field. Agric. Ecosyst. Environ. 2010,139, 74–79. [CrossRef]
9. Singh, B.; Humphreys, E.; Eberbach, P.L.; Katupitiya, A.; Singh, T.; Kukal, S.S. Growth, yield and waterproductivity of zero till wheat as affected by rice straw mulch and irrigation schedule. Field Crops Res. 2011,121, 209–225. [CrossRef]
10. Wang, J.Y.; Jia, J.X.; Xiong, Z.Q.; Khalil, M.A.K.; Xing, G.X. Water regime–nitrogen fertilizer–strawincorporation interaction: Field study on nitrous oxide emissions from a rice agroecosystem in Nanjing,China. Agric. Ecosyst. Environ. 2011, 141, 437–446. [CrossRef]
11. Sonnleitner, R.; Lorbeer, E.; Schinner, F. Effect of straw, vegetable oil and whey on physical andmicrobiological properties of a chernozem. Appl. Soil Ecol. 2003, 22, 195–204. [CrossRef]
12. Bhattacharyya, P.; Roy, K.S.; Neogi, S.; Adhya, T.K.; Rao, K.S.; Manna, M.C. Effects of rice straw and nitrogenfertilization on greenhouse gas emissions and carbon storage in tropical flooded soil planted with rice.Soil Tillage Res. 2012, 124, 119–130. [CrossRef]
13. Zhang, Z.S.; Song, X.L.; Lu, X.G.; Xue, Z.S. Ecological stoichiometry of carbon, nitrogen, and phosphorus inestuarine wetland soils: Influences of vegetation coverage, plant communities, geomorphology, and seawalls.J. Soils Sediment. 2013, 13, 1043–1051. [CrossRef]

Agronomy 2017, 7, 84 19 of 20
14. Pan, T. The Effect of Straw Application on Soil Carbon Pool, Methane and Nitrous Oxide Emissions in thePaddy Fields of Fuzhou. Ph.D. Thesis, Fujian Normal University, Fuzhou, China, 2014.
15. Sommer, R.; Ryan, J.; Masri, S.; Singh, M.M.; Diekmann, J. Effect of shallow tillage, moldboard plowing, strawmanagement and compost addition on soil organic matter and nitrogen in a dryland barley/wheat-vetchrotation. Soil Tillage Res. 2011, 115, 39–46. [CrossRef]
16. Yao, S.; Teng, X.; Zhang, B. Effects of rice straw incorporation and tillage depth on soil puddlability andmechanical properties during rice growth period. Soil Tillage Res. 2015, 146, 125–132. [CrossRef]
17. Qiu, S.J.; Peng, P.Q.; Li, L.; He, P.; Liu, Q.; Wu, J.S.; Christie, P.; Ju, X.T. Effects of applied urea and straw onvarious nitrogen fractions in two Chinese paddy soils with differing clay mineralogy. Biol. Fertil. Soils 2012,48, 161–172. [CrossRef]
18. Zhang, B.; Pang, C.; Qin, J.; Liu, K.; Li, H. Rice straw incorporation in winter with fertilizer-N applicationimproves soil fertility and reduces global warming potential from a double rice paddy field. Biol. Fertil. Soils2013, 49, 1039–1052. [CrossRef]
19. Amlin, N.A.; Rood, S.B. Inundation tolerances of riparian willows and cottonwoods. J. Am. Water Resour. Assoc.2001, 37, 1709–1720. [CrossRef]
20. Adame, M.F.; Virdi, B.; Lovelock, C.E. Effect of geomorphological setting and rainfall on nutrient exchangein mangroves during tidal inundation. Mar. Freshw. Res. 2010, 61, 1197–1206. [CrossRef]
21. Kobayashi, T.; Ryder, D.S.; Gordon, G.; Shannon, I.; Ingleton, T.; Carpenter, M.; Jacobs, S.J. Short-termresponse of nutrients, carbon and planktonic microbial communities to floodplain wetland inundation.Aquat. Ecol. 2009, 43, 843–858. [CrossRef]
22. Sheng, L.X.; Huang, D.Y.; Xia, H.A.; Xiao, S.Y. The effect of applying economic green manure crops in thepaddy field with succession cropping system. Chin. J. Eco-Agric. 2004, 12, 109–111.
23. Valiela, I.; Teal, J.M.; Allen, S.D.; Van Etten, R.; Goehringer, D.; Volkmann, S. Decomposition in salt marshecosystems: The phases and major factors affecting disappearance of above-ground organic matter. J. Exp.Mar. Biol. Ecol. 1985, 89, 29–54. [CrossRef]
24. Talbot, J.M.; Treseder, K.K. Interactions among lignin, cellulose, and nitrogen drive litter chemistry-decayrelationships. Ecology 2012, 93, 345–354. [CrossRef] [PubMed]
25. Güsewell, S.; Verhoeven, J.T.A. Litter N:P ration indicate whether N or P limits the decomposability ofgraminoid leaf litter. Plant Soil 2006, 287, 131–143. [CrossRef]
26. Manzoni, S.; Trofymow, J.A.; Jackson, R.B.; Porporato, A. Stoichiometric controls on carbon, nitrogen, andphosphorus dynamics in decomposing litter. Ecol. Monogr. 2010, 80, 89–106. [CrossRef]
27. Cleveland, C.C.; Liptzin, D. C:N:P stoichiometry in soil: Is there a “Redfield ratio” for the microbial biomass?Biogeochemistry 2007, 85, 235–252. [CrossRef]
28. Wang, W.; Lai, D.Y.F.; Li, S.; Kim, P.J.; Zeng, C.; Li, P.; Liang, Y. Steel slag amendment reduces methaneemission and increases rice productivity in subtropical paddy fields in China. Wetl. Ecol. Manag. 2014, 22,683–691. [CrossRef]
29. Wang, W.; Sardans, J.; Zeng, C.; Zhong, C.; Li, Y.; Peñuelas, J. Responses of soil nutrient concentrations andstoichiometry to different human land uses in a subtropical tidal wetland. Geoderma 2014, 232, 459–470.[CrossRef] [PubMed]
30. Xu, X.; Thornton, P.E.; Post, W.M. A global analysis of soil microbial biomass carbon, nitrogen, andphosphorus in terrestrial ecosystems. Glob. Ecol. Biogeogr. 2013, 22, 737–749. [CrossRef]
31. Tong, C.; Liu, B.G. Litter decomposition and nutrient dynamics in different tidal water submergenceenvironments of estuarine tidal wetland. Geogr. Res. 2009, 28, 118–128.
32. Richardson, A.E.; Simpson, R.J. Soil microorganisms mediating phosphorus availability update on microbialphosphorus. Plant Physiol. 2011, 156, 989–996. [CrossRef] [PubMed]
33. Sterner, R.W.; Elser, J.J. Ecological Stoichimetry: The Biology of Elements from Molecules to Biosphere; PrincetonUniversity Press: Princeton, NJ, USA, 2002.
34. Sieger, S.M.; Kristensen, B.K.; Robson, C.A.; Amirsadeghi, S.; Eng, E.W.Y.; Abdel-Mesih, A.; Møller, L.M.;Vanlerberghe, G.C. The role of alternative oxidase in modulating carbon use efficiency and growth duringmacronutrient stress in tobacco cells. J. Exp. Bot. 2005, 56, 1499–1515. [CrossRef] [PubMed]
35. Hu, H.Y.; Zhang, Z.C.; Li, X. Influences of salinity on mass and energy dynamics during decomposition ofKandelia candel leaf litter. Chin. J. Plant Ecol. 2010, 34, 1377–1385.
Agronomy 2017, 7, 84 20 of 20
36. Mu, Z.J.; Huang, A.Y.; Ni, J.P.; Xie, D.T. Linking anual N2O emission in organic soils to mineral nitrogeninputs as estimated by heterotrophic respiration and soil C/N ratio. PLoS ONE 2014, 9, e96572. [CrossRef][PubMed]
37. Moore, T.R.; Trofymow, J.A.; Prescott, C.E.; Titus, D.B. Nature and nurture in the dynamics of C, N and Pduring litter decomposition in Canadian forest. Plant Soil 2011, 339, 163–175. [CrossRef]
38. Peng, S.; Luo, Y.; Xu, J.; Khan, S.; Jiao, X.; Wang, W. Integrated irrigation and drainage practices to enhancewater productivity and reduce pollution in a rice production system. Irrig. Drain. 2012, 61, 285–293.[CrossRef]
39. Ocio, J.A.; Brookes, P.C.; Jenkinson, D.S. Field incorporation of straw and its effects on soil microbial biomassand soil inorganic N. Soil Biol. Biochem. 1991, 23, 171–176. [CrossRef]
40. Lu, R.K. Analysis Methods of Soil Science and Agricultural Chemistry; Agricultural Science and TechnologyPress: Beijing, China, 1999.
41. Pinheiro, J.; Bates, D.; DebRoy, S.; Sarkar, D.; Core, T.R. Nlme: Linear and Nonlinear Mixed Effects Models.R Package Version 3.1-126. Available online: http://CRAN (accessed on 12 June 2016).
42. Barton, K. MuMIn: Multi-Model Inference. Available online: https://cran.r-project.org/package=MuMIn(accessed on 12 June 2017).
43. De Maesschalck, R.; Jouan-Rimbaud, D.; Massart, D.L. The Mahalanobis distance. Chemom. Intell. Lab. 2000,50, 1–18. [CrossRef]
44. Epskamp, S. semPlot: Unified Visualizations of Structural Equation Models. Struct. Equ. Model. A Multidiscip. J.2000, 22, 474–483. [CrossRef]
© 2017 by the authors. Licensee MDPI, Basel, Switzerland. This article is an open accessarticle distributed under the terms and conditions of the Creative Commons Attribution(CC BY) license (http://creativecommons.org/licenses/by/4.0/).