Embed Size (px)
Citation preview
Rice Cultivation
Project Protocol (RCPP)
Workgroup Meeting #2 May 11, 2011
12 PM - 2 PM PDT
Purpose
Update on progress
Review research to date on performance standards
– Discuss options and identify directions for research
Review DNDC Model Uncertainty Analysis Results
Discuss Options for Project Aggregation
Discuss Wildlife Habitat Impacts and Options
Next Steps
2
3
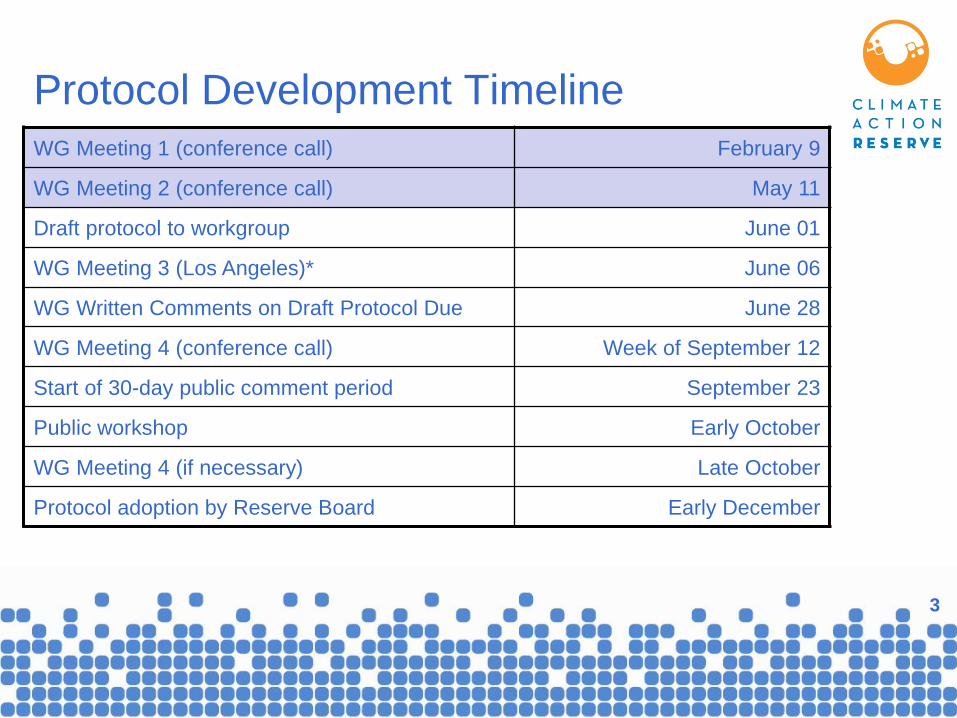
Protocol Development Timeline
WG Meeting 1 (conference call) February 9
WG Meeting 2 (conference call) May 11
Draft protocol to workgroup June 01
WG Meeting 3 (Los Angeles)* June 06
WG Written Comments on Draft Protocol Due June 28
WG Meeting 4 (conference call) Week of September 12
Start of 30-day public comment period September 23
Public workshop Early October
WG Meeting 4 (if necessary) Late October
Protocol adoption by Reserve Board Early December
Update on Progress
Draft Protocol from EDF project - Undergoing VCS
Validation?
Background work on Performance Standards - near
completion
DNDC Uncertainty Analysis - near completion
First Draft CAR Protocol will build off of the above
milestones (expected end of this month)
4
Standardized Additionality
Projects must:
– Meet start date criteria
– Be in an eligible location
– Exceed any existing regulatory requirements
– Meet a performance standard
– Attest to being implemented voluntarily
5
Performance Standards for Rice
Cultivation
For each rice growing region, would like to assess common practice, adoption rates, trends, for: – water management,
– residue management,
– seeding
– other potential project activities (e.g. fertilizer application, cultivars)
Agricultural practices are often highly variable due to numerous drivers (weather, prices, water availability etc.) – More difficult to standardize (e.g. winter flooding in California)
– May be open to some degree of project-specific additionality assessment
6
Rice Water Management
3 dominant in season flooding systems: – continuous flood – from seeding to just before harvest
– pinpoint flood – same as continuous, except short drain (3-5 days) for seeds to “peg”
– delayed flood – dry seeded system with irrigation for germination followed by flooding at 4,5 or 6 leaf stage
Winter flooding – for straw decomposition, waterfowl habitat or crawfish production (LA)
GHG Impact: flood duration impacts CH4 production, draining from saturated soil to aerobic soil can lead to peaks in N2O
CA Water Management
Overwhelming majority (~97%) of continuous flooding – Drain for herbicide application is common in early season, but soils
remain saturated.
Small fraction use delayed flood for drill seeding (estimated to be less than 3%)
Pinpoint flooding is not used in California – Need to verify with Paul and Cass
Winter flooding: used extensively for straw decomposition and waterfowl habitat. – Total fraction varies year to year. Variation due to timing of harvest,
availability of water, grower management…
– Need quantitative survey…see remote sensing analysis…next slides
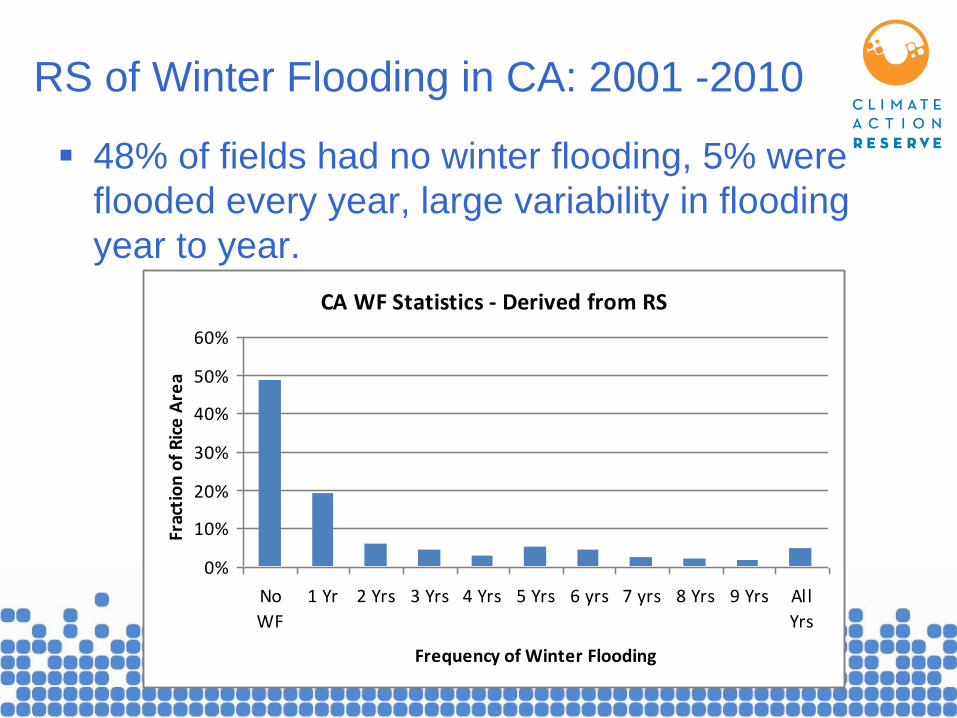
RS of Winter Flooding in CA: 2001 -2010
48% of fields had no winter flooding, 5% were
flooded every year, large variability in flooding
year to year.
CA WF Statistics - Derived from RS
0%
10%
20%
30%
40%
50%
60%
No
WF
1 Yr 2 Yrs 3 Yrs 4 Yrs 5 Yrs 6 yrs 7 yrs 8 Yrs 9 Yrs All
Yrs
Frequency of Winter Flooding
Frac
tio
n o
f R
ice
Are
a
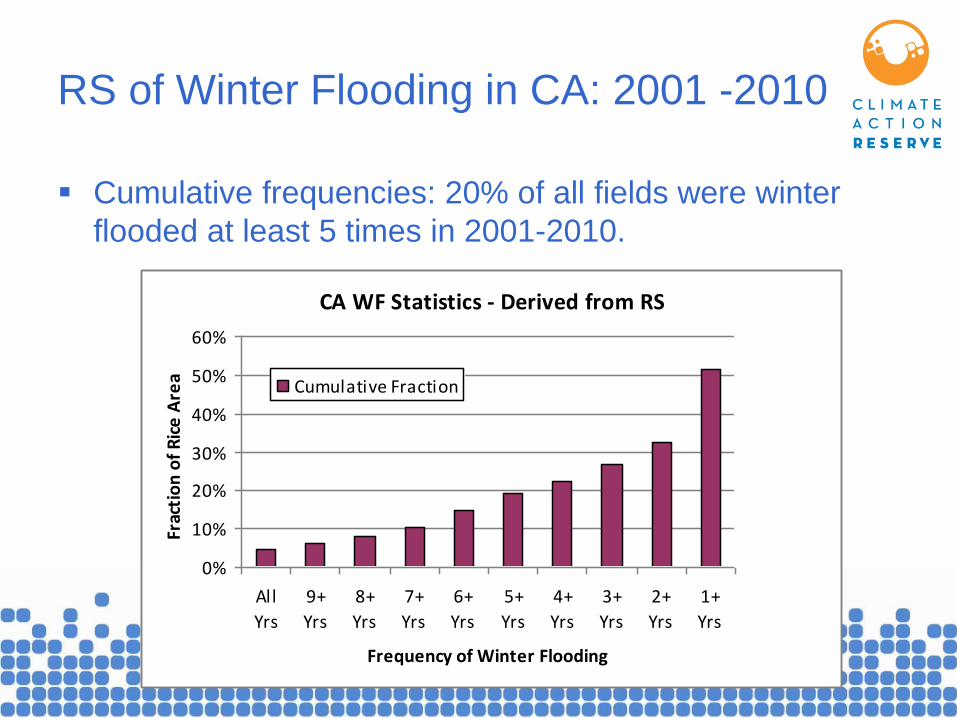
RS of Winter Flooding in CA: 2001 -2010
Cumulative frequencies: 20% of all fields were winter
flooded at least 5 times in 2001-2010.
CA WF Statistics - Derived from RS
0%
10%
20%
30%
40%
50%
60%
All
Yrs
9+
Yrs
8+
Yrs
7+
Yrs
6+
Yrs
5+
Yrs
4+
Yrs
3+
Yrs
2+
Yrs
1+
Yrs
Frequency of Winter Flooding
Frac
tio
n o
f R
ice
Are
a
Cumulative Fraction
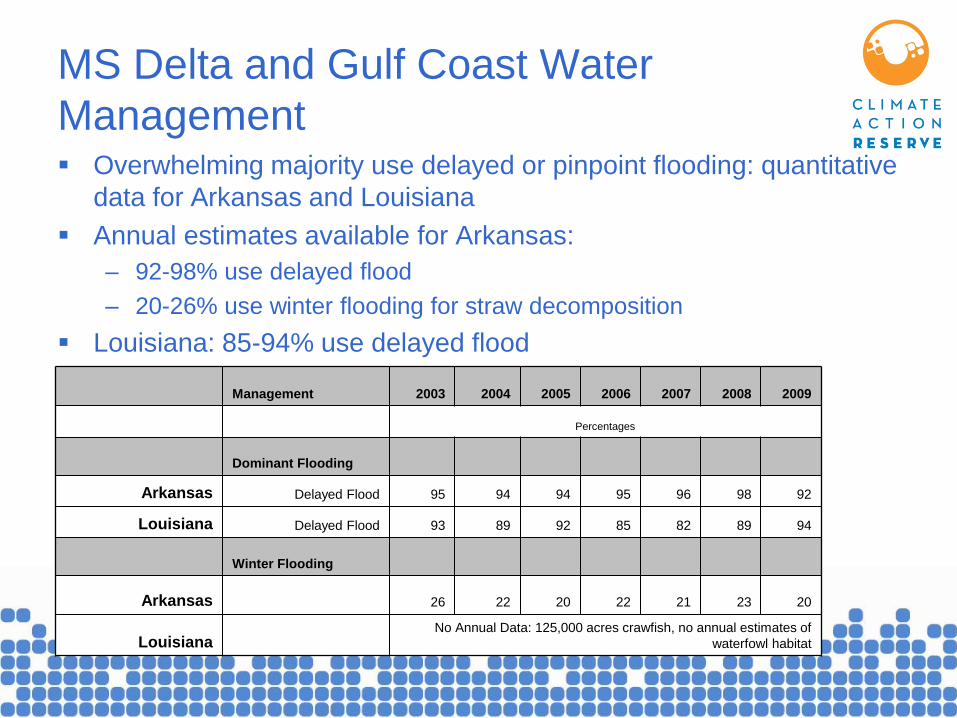
MS Delta and Gulf Coast Water
Management Overwhelming majority use delayed or pinpoint flooding: quantitative
data for Arkansas and Louisiana
Annual estimates available for Arkansas:
– 92-98% use delayed flood
– 20-26% use winter flooding for straw decomposition
Louisiana: 85-94% use delayed flood
Management 2003 2004 2005 2006 2007 2008 2009
Percentages
Dominant Flooding
Arkansas Delayed Flood 95 94 94 95 96 98 92
Louisiana Delayed Flood 93 89 92 85 82 89 94
Winter Flooding
Arkansas 26 22 20 22 21 23 20
Louisiana No Annual Data: 125,000 acres crawfish, no annual estimates of
waterfowl habitat
Rice Water Management:
Issues and Questions for WG
What drives farmers decisions to winter flood one
year to the next?
Do farmers rotate flooding across their fields?
– E.g. always flood a portion of their fields but rotate which
fields year to year…
Are there quantitative data for TX, MO, MS?
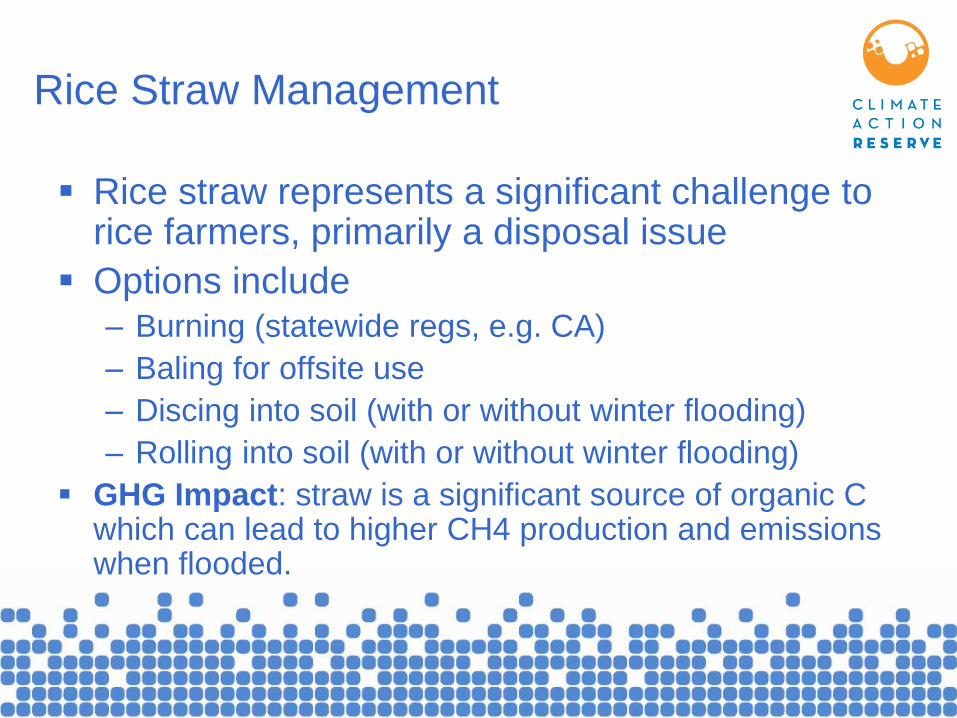
Rice Straw Management
Rice straw represents a significant challenge to rice farmers, primarily a disposal issue
Options include – Burning (statewide regs, e.g. CA)
– Baling for offsite use
– Discing into soil (with or without winter flooding)
– Rolling into soil (with or without winter flooding)
GHG Impact: straw is a significant source of organic C which can lead to higher CH4 production and emissions when flooded.
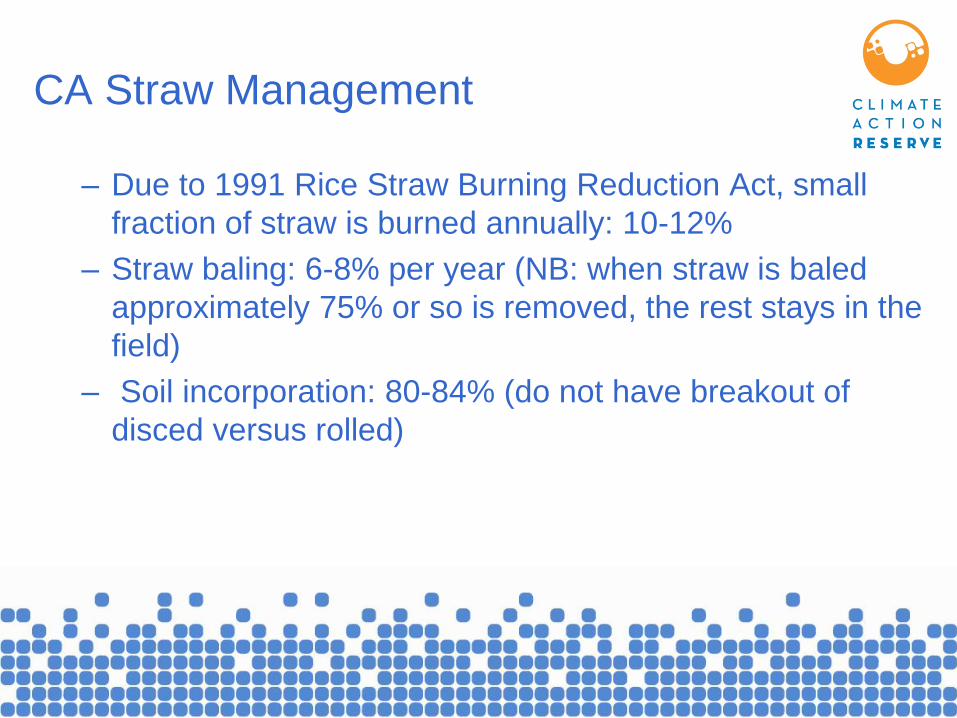
CA Straw Management
– Due to 1991 Rice Straw Burning Reduction Act, small
fraction of straw is burned annually: 10-12%
– Straw baling: 6-8% per year (NB: when straw is baled
approximately 75% or so is removed, the rest stays in the
field)
– Soil incorporation: 80-84% (do not have breakout of
disced versus rolled)
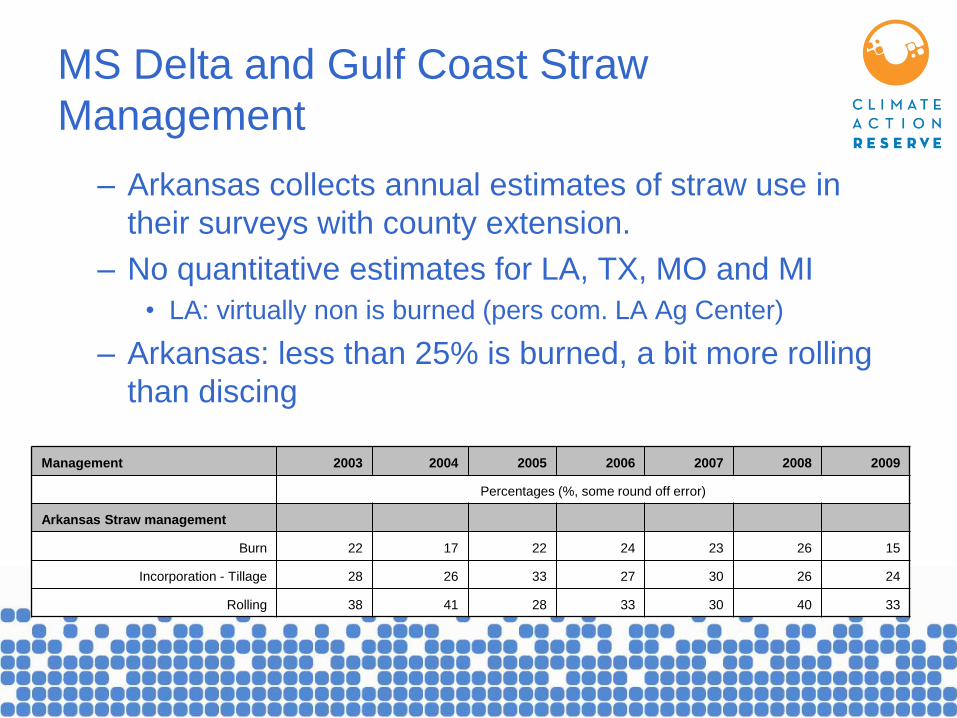
MS Delta and Gulf Coast Straw
Management
– Arkansas collects annual estimates of straw use in
their surveys with county extension.
– No quantitative estimates for LA, TX, MO and MI
• LA: virtually non is burned (pers com. LA Ag Center)
– Arkansas: less than 25% is burned, a bit more rolling
than discing
Management 2003 2004 2005 2006 2007 2008 2009
Percentages (%, some round off error)
Arkansas Straw management
Burn 22 17 22 24 23 26 15
Incorporation - Tillage 28 26 33 27 30 26 24
Rolling 38 41 28 33 30 40 33
Rice Straw Management:
Issues and Questions for WG
Are there quantitative data for LA, TX, MO, MS?
Are there policy regulations that currently do or will
impact rice straw management decisions in MS
Delta and Gulf Coast regions? New policies in CA?
Rice Crop Rotations
Market and economic drivers on decision to plant
continuous rice versus rice-soybean rotation
Crop rotations impact management decisions:
e.g. straw management
GHG Impacts: legacies from previous crop can alter GHG
emissions in crop rotation. For example, ratoon rice has 2-
3 times the CH4 emissions than non-ratoon rice…
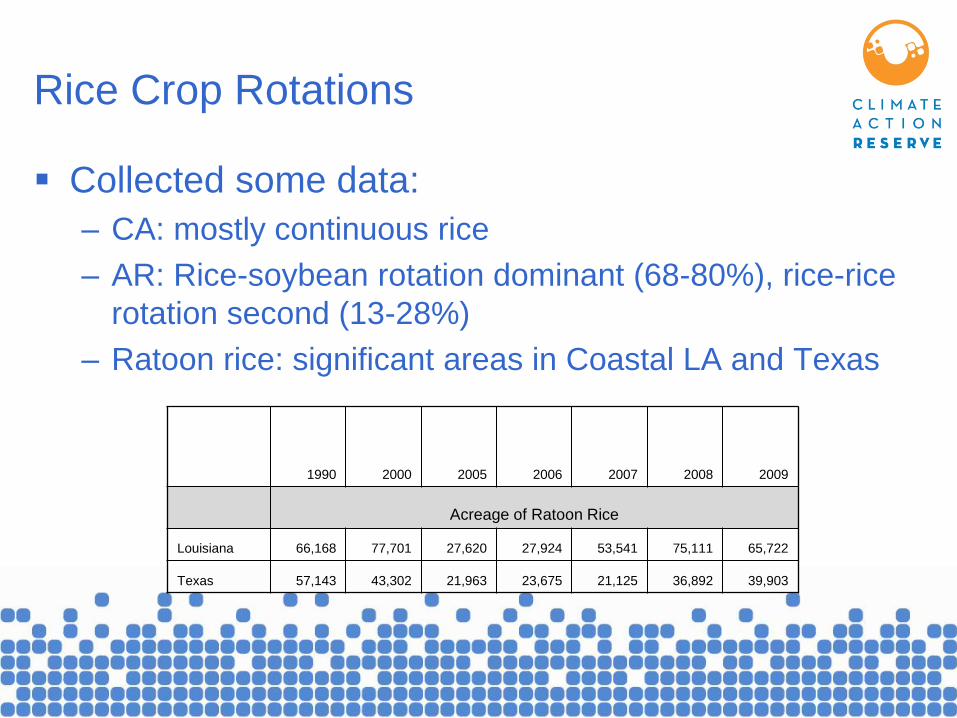
Rice Crop Rotations
Collected some data:
– CA: mostly continuous rice
– AR: Rice-soybean rotation dominant (68-80%), rice-rice
rotation second (13-28%)
– Ratoon rice: significant areas in Coastal LA and Texas
1990 2000 2005 2006 2007 2008 2009
Acreage of Ratoon Rice
Louisiana 66,168 77,701 27,620 27,924 53,541 75,111 65,722
Texas 57,143 43,302 21,963 23,675 21,125 36,892 39,903
Rice Crop Rotation:
Issues and Questions for WG
How much are decisions of crop rotations
influenced by weather (e.g. ratoon rice)?
How much are decisions on crop rotations driven
by market forces (rice prices, ethanol, etc).
Is it worth compiling better data on crop rotations?
Ratoon rice: opportunity for large reductions, issues
of leakage.
Rice Crop Seedling and Tillage
Various approaches for creating rice seedbeds:
– conventional (tillage after harvest and again in spring),
– Fall stale seedbed (prepare seedbed in fall, no spring
tillage),
– Spring stale seedbed (prepare seedbed in Spring
several weeks before planting) and
– No-till
GHG Impacts: impacts soil carbon dynamics, potential
impact on methane and nitrous oxide as well.
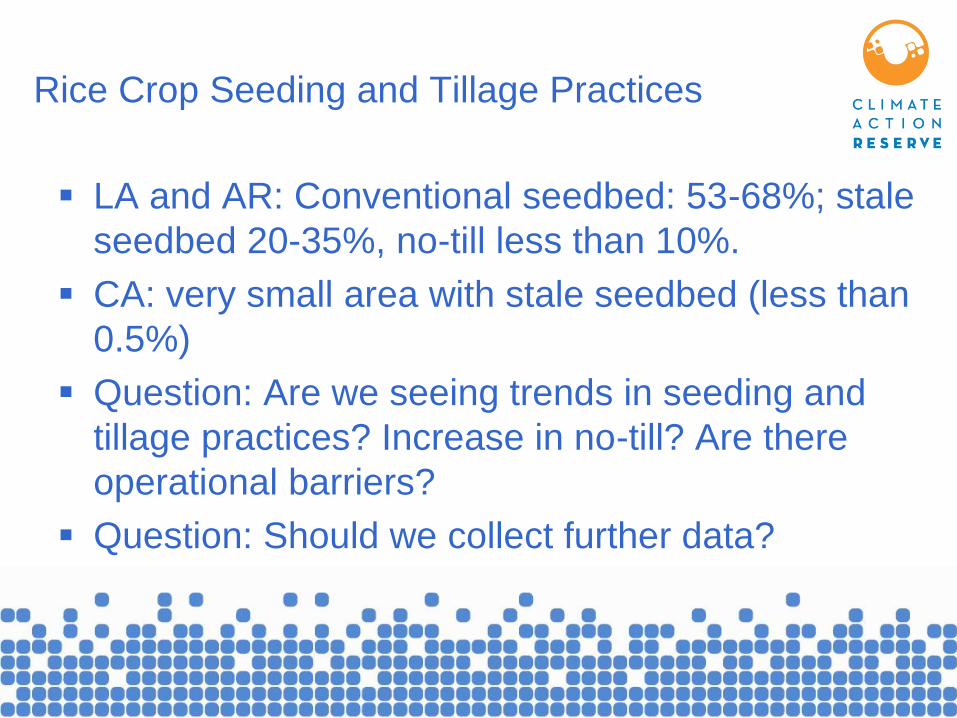
Rice Crop Seeding and Tillage Practices
LA and AR: Conventional seedbed: 53-68%; stale
seedbed 20-35%, no-till less than 10%.
CA: very small area with stale seedbed (less than
0.5%)
Question: Are we seeing trends in seeding and
tillage practices? Increase in no-till? Are there
operational barriers?
Question: Should we collect further data?
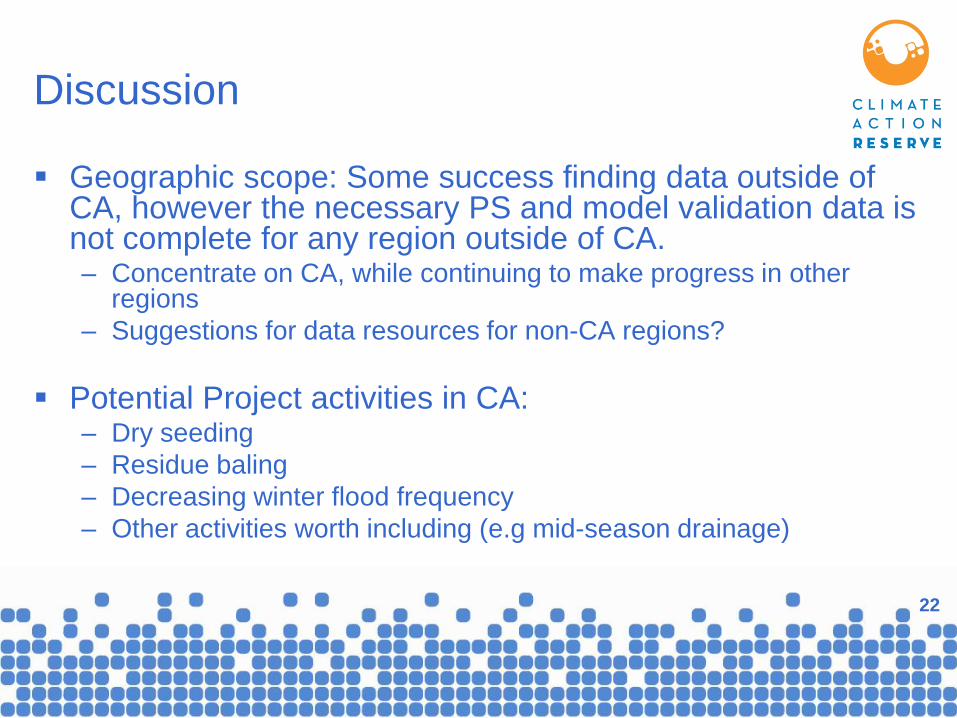
Discussion
Geographic scope: Some success finding data outside of CA, however the necessary PS and model validation data is not complete for any region outside of CA. – Concentrate on CA, while continuing to make progress in other
regions
– Suggestions for data resources for non-CA regions?
Potential Project activities in CA: – Dry seeding
– Residue baling
– Decreasing winter flood frequency
– Other activities worth including (e.g mid-season drainage)
22
DNDC Model Uncertainty Analysis
Uncertainty of model performance comes from
two sources:
(1) Scientific structure (processes and
parameterization);
(2) Input data.
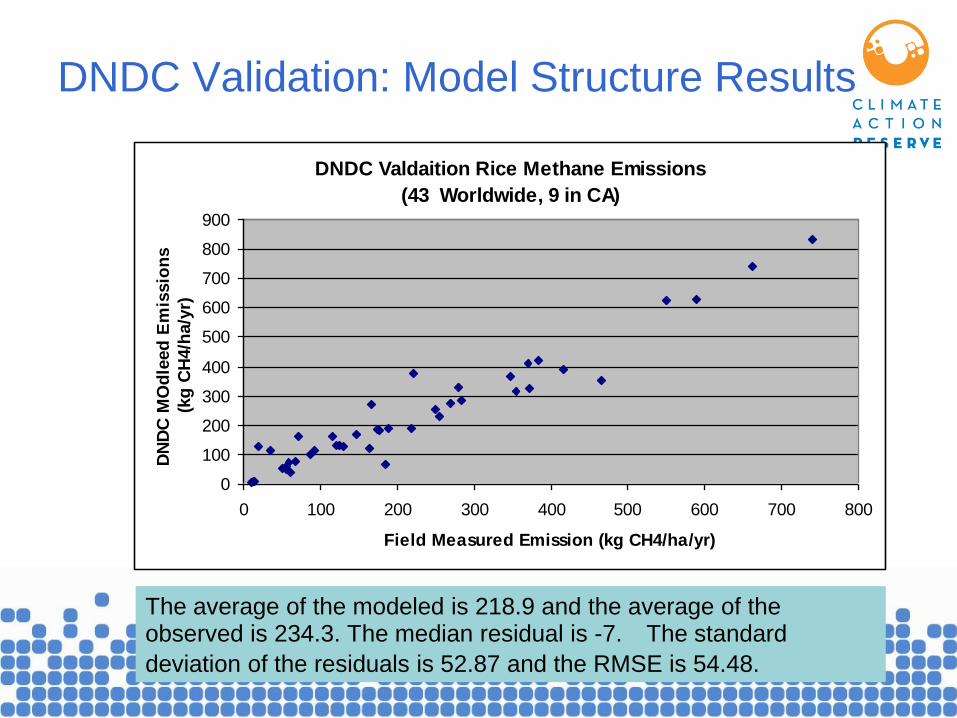
DNDC Validation: Model Structure Results
DNDC Valdaition Rice Methane Emissions
(43 Worldwide, 9 in CA)
0
100
200
300
400
500
600
700
800
900
0 100 200 300 400 500 600 700 800
Field Measured Emission (kg CH4/ha/yr)
DN
DC
MO
dle
ed
Em
issio
ns
(kg
CH
4/h
a/y
r)
The average of the modeled is 218.9 and the average of the observed is 234.3. The median residual is -7.
The standard
deviation of the residuals is 52.87 and the RMSE is 54.48.
DNDC Validation Results
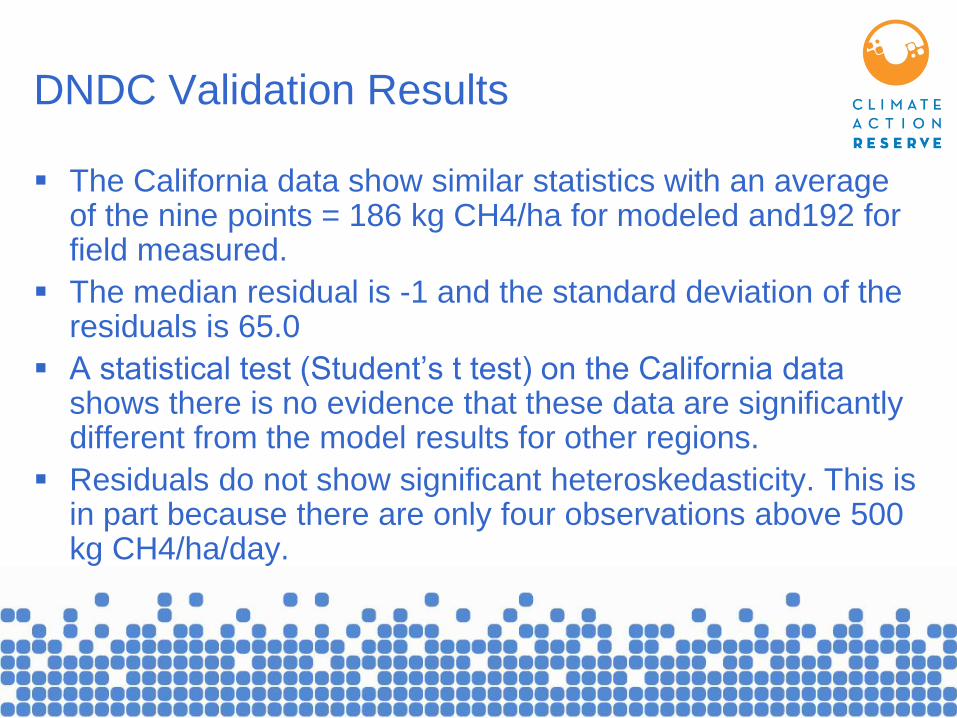
The California data show similar statistics with an average of the nine points = 186 kg CH4/ha for modeled and192 for field measured.
The median residual is -1 and the standard deviation of the residuals is 65.0
A statistical test (Student‟s t test) on the California data shows there is no evidence that these data are significantly different from the model results for other regions.
Residuals do not show significant heteroskedasticity. This is in part because there are only four observations above 500 kg CH4/ha/day.
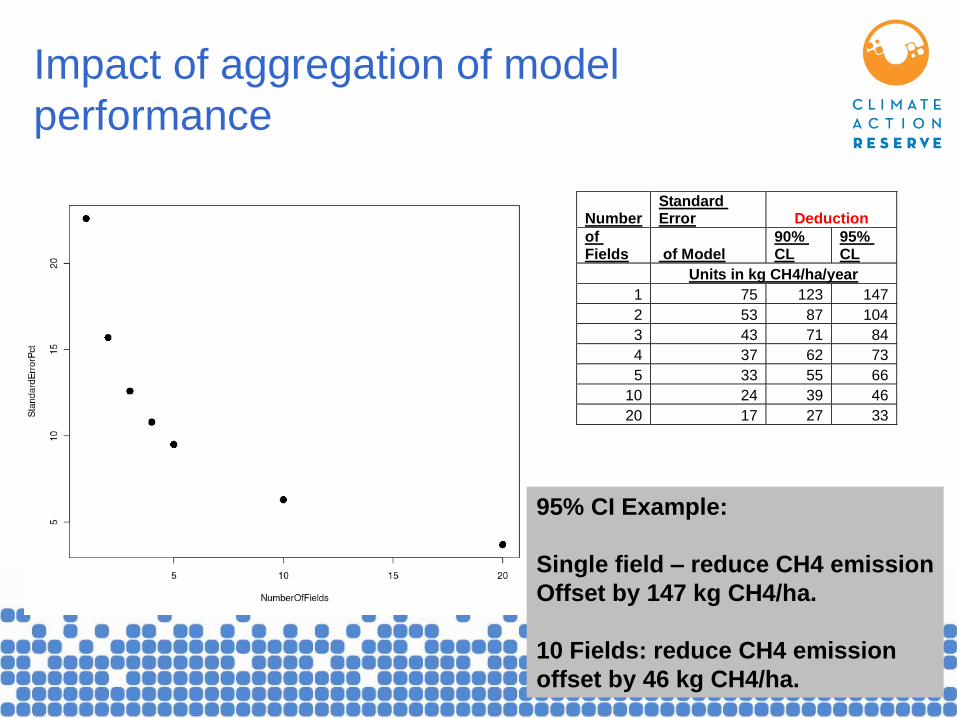
Impact of aggregation of model
performance
Number Standard Error Deduction
of Fields of Model
90% CL
95% CL
Units in kg CH4/ha/year
1 75 123 147
2 53 87 104
3 43 71 84
4 37 62 73
5 33 55 66
10 24 39 46
20 17 27 33
95% CI Example:
Single field – reduce CH4 emission
Offset by 147 kg CH4/ha.
10 Fields: reduce CH4 emission
offset by 46 kg CH4/ha.
Project Aggregation - Overview
Protocol needs to have guidance for aggregation
– Who can serve as the aggregator
– How do the „projects‟ enter, or leave aggregates
– What are requirements for setting baselines, performing
calculations, verification and site visits
– Registration and Credit Issuance
• Do projects need Reserve accounts, or just aggregator
• CRTs issued to aggregator, or to each project separately
27
Project Aggregation - Forests
Forest Protocol has aggregation guidelines: – All forest „projects‟ have to be submitted separately and have
separate accounts on Reserve
– Projects under certain size can join aggregates
– Projects Must Undergo Onsite Verification Prior To Joining An Aggregate
– Aggregator: May Be Any Individual, Municipality, Or Validly Incorporated Business Entity
• Must Act As Agents In Conducting CRT Transactions
• Not Official Agents; Forest Owners Still Ultimately Responsible For Complying With FPP
– Verifiers annually audit a „sample‟ of reports
– Successful verification results with CRT issuance to all projects in aggregate
28
Project Aggregation - Options
Forest Rules form good starting point, may be
simplified for non-sequestration projects
Open to WG suggestions
May be helpful for WG to review forest aggregation
guidelines for starting point
29
Wildlife Habitats
Flooded rice fields provide much-needed habitat for wildlife
in all three rice growing regions of the US
– waterfowl (e.g. ducks), migratory birds, shorebirds, wading birds,
mammals, amphibians, and reptiles
Ricelands are considered a leading example of integrating
agricultural and natural resource management
– USDA „Legacy of Conservation‟ Award to USA Rice
Due to the Reserve‟s “Do No Environmental Harm” Policy,
project impacts on ricelands as wildlife habitat must be
considered.
30
Wildlife Habitats
Flooded riceland habitats serve as:
– Primarily, foraging and resting grounds during fall and
winter (i.e. coinciding with bird migration)
– Also, breeding grounds for certain species during the
growing season (e.g. mallards)
Residual rice, weed seeds, and invertebrates
provide an excellent food source, particularly for
avian species
31
Wildlife Habitat - Regions
In California, rice lands are used by 230 species of wildlife,
including:
– 187 species of birds, 27 of mammals, 16 of reptiles and amphibians
– ~7 million waterfowl (~10% of North American waterfowl)
– Several hundred thousand shorebirds and wading birds
– At least one endangered species (e.g. Giant Garter Snakes)
– California is located in the Pacific Flyway
Significantly less data is available for MAV and Gulf Coast
regions, though both regions also intersect with migratory
bird flyways (Mississippi and Central Flyways, respectively)
32
Wildlife Habitats: Behaviors
Studies indicate the highest species richness and conservation value at
depths of 10-15cm, but note that a variety of depth is necessary to
support habitats of the wide range of species
– Wide range of species preferring different flood-water depths and management
practices
Typically, waterbirds exhibit “flocking” behavior
– Rotating winter flooding across fields might not have detrimental impact for
waterbirds
33
Wildlife Habitat Loss – Mitigation
Options
Limits on how much winter flooding can be reduced
(by area and time) compared to the project‟s
baseline
– Do we need similar measures for mid-season drainage (if
we include this activity)
Suggestions of other measures to consider?
– Providing natural habitat on „edges‟ of fields
Last resort: Exclude winter flooding as a creditable
project activity
34
Next Steps
Continue to develop performance standard options
Targeted research on wildlife habitat issues
Development of Aggregation Guidelines
Develop DNDC calculation guidelines GHG Assessment Boundary, Monitoring requirements
First draft of Rice
Cultivation Project
Protocol (RCPP) to WG
by June 1
In-person meeting to
discuss draft on June 6
WG Written Comments
on draft due June 28
35
36
Thank You
Syd Partridge – Staff Lead
213-542-0294
Kathryn (Katie) Goldman – Agricultural
program lead
213-213-1239
Teresa Lang – research support
213-891-6932
Heather Raven - coordinator
213-542-0282
Reserve Technical Consultant
Dr. William Salas, Applied Geosolutions LLC