Embed Size (px)
Citation preview

Strategic Approaches to Integrated Management of Land, Strategic Approaches to Integrated Management of Land, Water and Livelihoods along an Aridity Gradient: Water and Livelihoods along an Aridity Gradient:
Southern Tunisia siteSouthern Tunisia site
Regional Knowledge Exchange on Decision-support Tools and Models to Project Improved Strategies for Integrated Management of Land, Water and Livelihoods
22-27 September, 2013, Djerba, Tunisia

TeamTeamBiophysical Socio-Economic
H. Khatteli M. Sghaier
M. Ouessar M. Abdeladhim
K. Nagaz R. Bechir
M. Ben Zaied
A. Zerrim
F. El Mokh
A. Hachani

S1 (North): Tunis (semi arid)
S2 (Centre): Sidi Bouzid/Kasserine (semi arid)
S3 (South) : Medenine/Tataouine (arid)
Study sites in TunisiaS1
S2
S3

Wadi Hallouf/Oum Zessar watersheds, Medenine
•Transect stretching from Plateau of Dhahar to the Gulf of Gabès (Mediterranean sea): 3 main basins: wadis of Hallouf, Oum Oum Zessar, Oum Ettamr). • Area: around 1500 km2.• Rainfall ranges between 160 mm (east, plain of Jeffara) , 200 mm (central part, mountain of Beli Khedache) and less than 100 mm (west, plateau of Dhahar).• Land use: East: olives, small scale irrigation; Central: fruit trees behind water harvesting structures; West: rangelands.• Population: around 50000 inhabitants

MODELLING OLIVE GROVES MODELLING OLIVE GROVES VULNERABILITYVULNERABILITY
TO CCTO CC
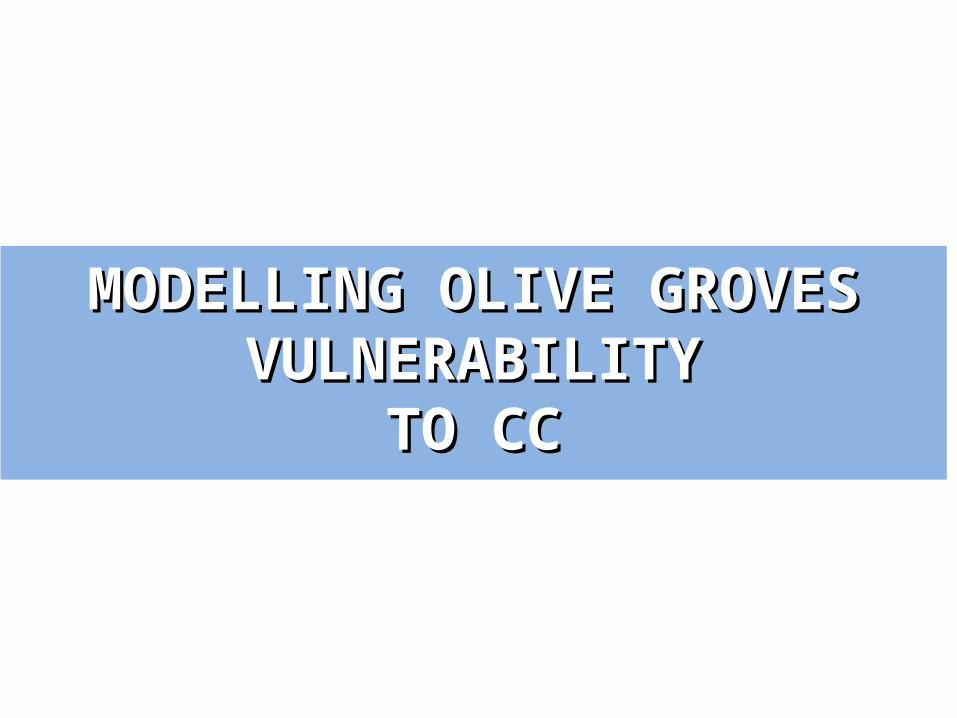
Images Landsat 5 and
7 Soil map
Land use map
HidroMOREHidroMORE
NDVINDVI
Conceptuel Model Conceptuel Model
Geométric and atmospheric correction
climatic data: Baseline period, until 2030 and until 2090
collecting data collecting data TreatementTreatement
9
41
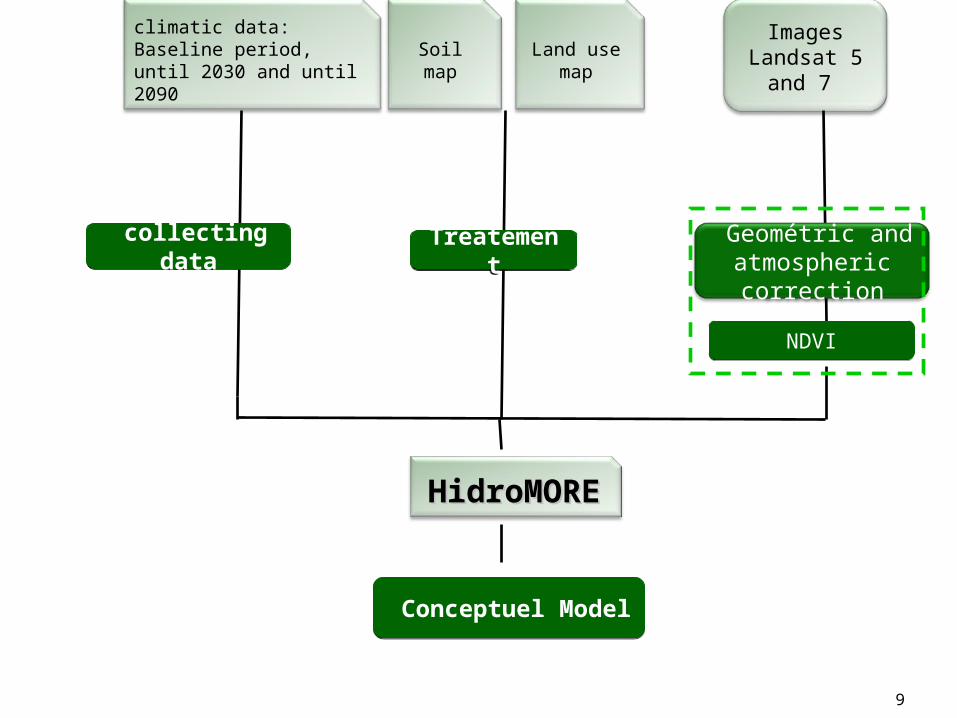
Slightly suitable
Moderately suitable suitable
Baseline period 28% 46% 26%
Horizon 2030 19% 68% 13%
Horizon 2090 24% 76% 0
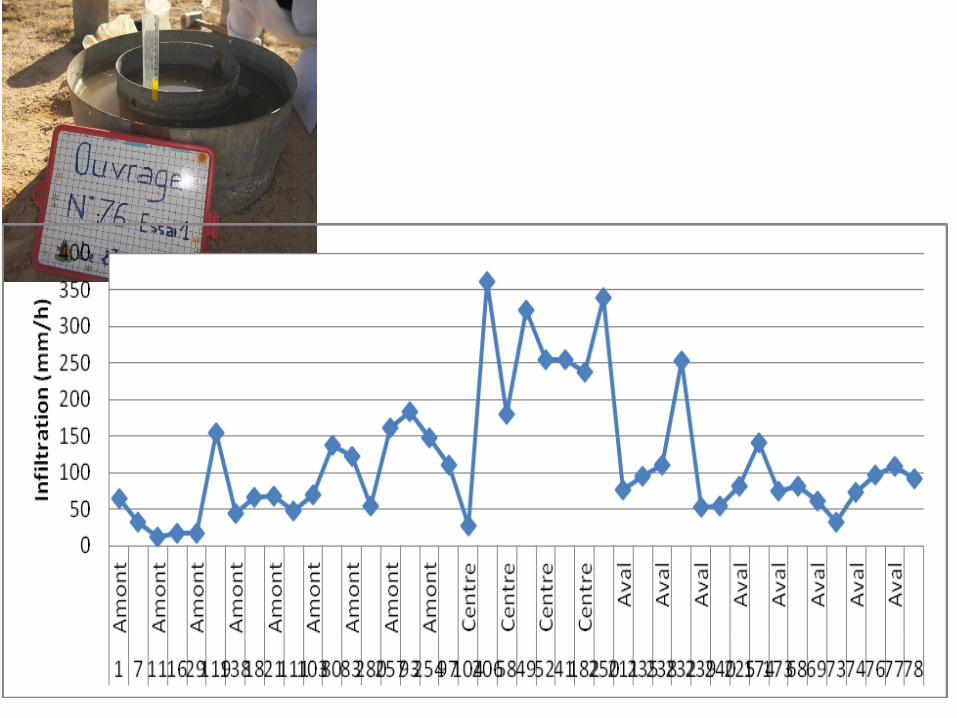
GABION CHECK DAMS EFFICIENCYGABION CHECK DAMS EFFICIENCY

WATER MANAGEMENT IN THE WATER MANAGEMENT IN THE IRRIGATED AREAIRRIGATED AREA
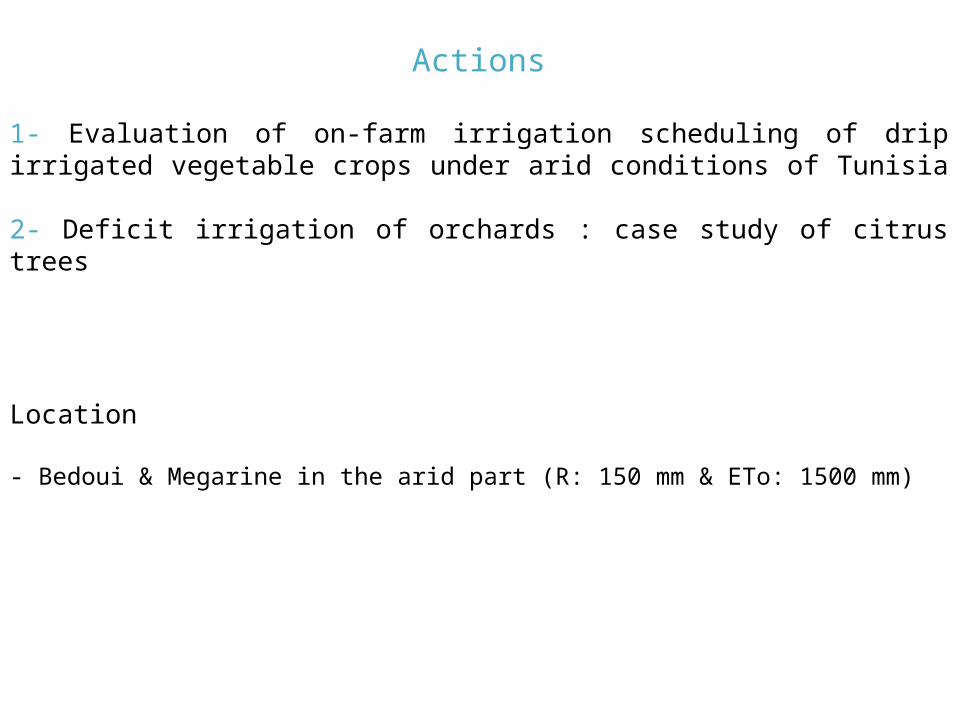
Actions
1- Evaluation of on-farm irrigation scheduling of drip irrigated vegetable crops under arid conditions of Tunisia
2- Deficit irrigation of orchards : case study of citrus trees
Location
- Bedoui & Megarine in the arid part (R: 150 mm & ETo: 1500 mm)
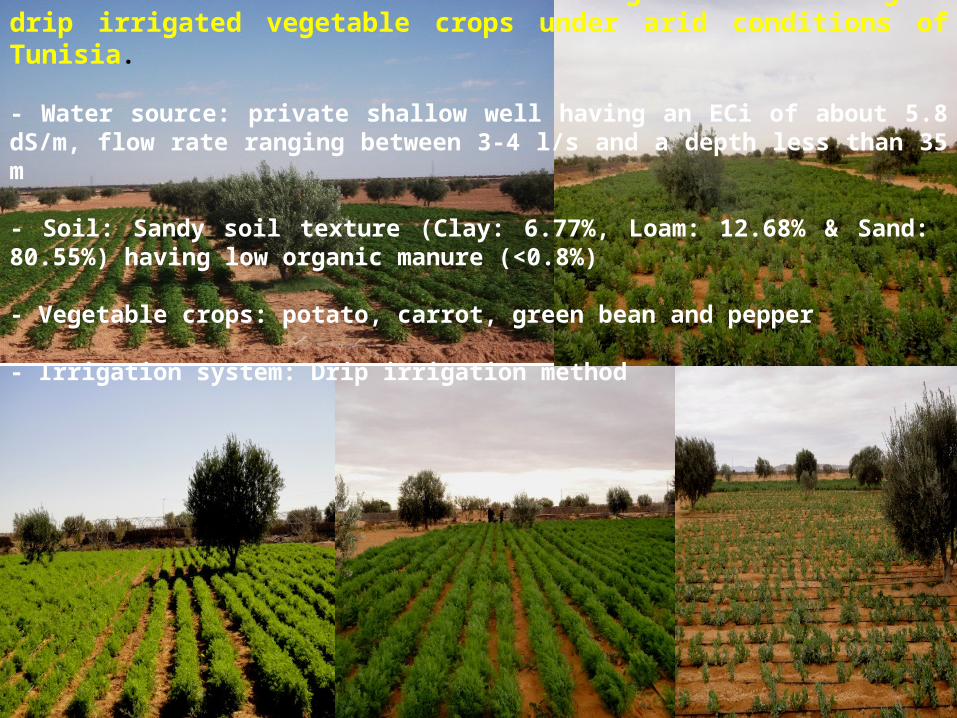
Pilot site: Evaluation of on-farm irrigation scheduling of drip irrigated vegetable crops under arid conditions of Tunisia.
- Water source: private shallow well having an ECi of about 5.8 dS/m, flow rate ranging between 3-4 l/s and a depth less than 35 m
- Soil: Sandy soil texture (Clay: 6.77%, Loam: 12.68% & Sand: 80.55%) having low organic manure (<0.8%)
- Vegetable crops: potato, carrot, green bean and pepper
- Irrigation system: Drip irrigation method
Irrigation scheduling methods
Two irrigation treatments based on the use SWB to estimate irrigation amounts and timing were compared to traditional farmer practice.
Field monitoring
• Soil salinity and water content • Ground canopy cover, stomatal conductance
• Yield and its components at physiological maturity
• Water supplies (I+R) (using water meter and rain gauge)
• Water productivity (WP) WP (kg/m3) = Yield (kg/ha) / irrigation water (m3/ha)

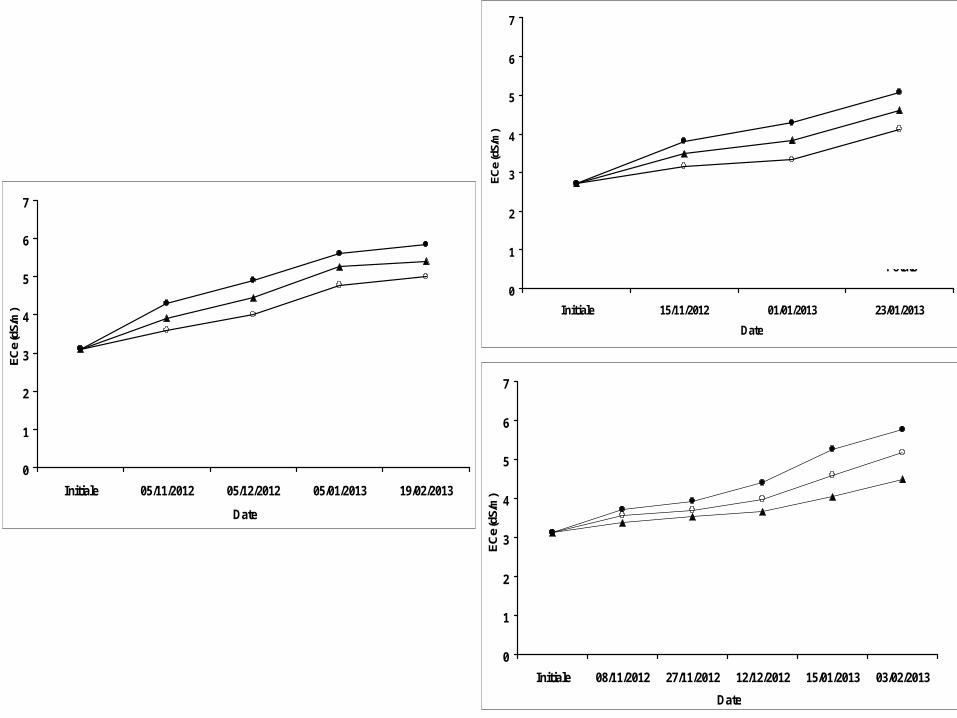
Results
First year of experimentData collected on Potato, carrot & green bean,Pepper experiment is still in progress
0
1
2
3
4
5
6
7
Initiale 15/11/2012 01/01/2013 23/01/2013
Date
EC
e (d
S/m
)
FMDI70
SWB100
Potato
0
1
2
3
4
5
6
7
Initiale 05/11/2012 05/12/2012 05/01/2013 19/02/2013
Date
EC
e (d
S/m
)
FMDI70
SWB100
Carrot
0
1
2
3
4
5
6
7
Initiale 08/11/2012 27/11/2012 12/12/2012 15/01/2013 03/02/2013
Date
EC
e (d
S/m
)
FMDI70
SWB100
Green bean

0
5
10
15
20
25
30
SW
B1
00
DI7
0
FM
SW
B1
00
DI7
0
FM
SW
B1
00
DI7
0
FM
SW
B1
00
DI7
0
FM
Potato Carrot Green bean (Luz diotono)
Green bean (Local)
Treatments
Yie
ld (
t/h
a)
23%
37%
14%24%
7%7%20%
18%
YieldLSD (5%)
Carrot, 3.627Potato, 3,224
Green bean Luz, 4.698Geen bean L, 4.749

0
100
200
300
400
500
600
SW
B1
00
DI7
0
FM
SW
B1
00
DI7
0
FM
SW
B1
00
DI7
0
FM
Potato Carrot Green bean
Treatments
Irri
ga
tio
n s
up
ply
(m
m)
14%
18%
12,5%
Water applied
30%

0
2
4
6
8
10
12
SW
B1
00
DI7
0
FM
SW
B1
00
DI7
0
FM
SW
B1
00
DI7
0
FM
SW
B1
00
DI7
0
FM
Potato Carrot Green bean (Luz diotono)
Green bean (Local)
Treatments
WP
(kg
/m3
)
Water productivity LSD (5%)Carrot, 1.578Potato, 1.797
Green bean Luz, 2.002Geen bean L, 2.037
DI WPCarrot, 22%Potato, 9.9%
Green bean, 32%
FM WP Carrot, 35%Potato, 44%
Green bean, 28%

• Pilot site Megarine:
Irrigated field (55ha) with relatively fresh water (1-1.5 g/l) from a tube well.
Pilot site serve testing technical itinerary for fruit trees
Field experiments on improved water productivity by deficit irrigation and irrigation scheduling: Implications for saving water in citrus orchards
Experiments in a drip irrigated citrus orchards are actually launched in the zone of Megarine, Médenine. (12 years-old ‘Meski Maltaise trees grafted on Bigaradier with tree
spacing of 7x6 m)
Four drip emitters per tree (4 l/h) connected to a double drip line, two per side of the tree, are used in the experiment

Pilot site: Improved water productivity by deficit irrigation and irrigation scheduling: Implications for saving water in citrus orchards
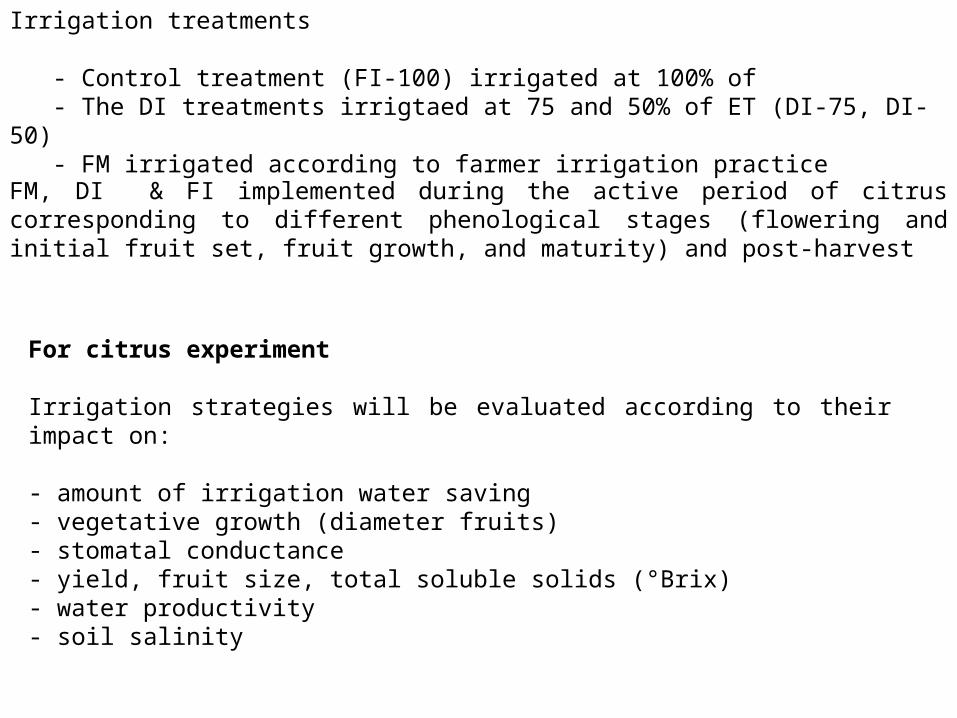
Irrigation treatments
- Control treatment (FI-100) irrigated at 100% of - The DI treatments irrigtaed at 75 and 50% of ET (DI-75, DI-50) - FM irrigated according to farmer irrigation practice
FM, DI & FI implemented during the active period of citrus corresponding to different phenological stages (flowering and initial fruit set, fruit growth, and maturity) and post-harvest
For citrus experiment
Irrigation strategies will be evaluated according to their impact on:
- amount of irrigation water saving- vegetative growth (diameter fruits) - stomatal conductance- yield, fruit size, total soluble solids (°Brix) - water productivity- soil salinity
MPDELLING CLIMATE CHANGE MPDELLING CLIMATE CHANGE IMPACT AND ADAPTATION IMPACT AND ADAPTATION
STRATEGY ASSESSMENT ON CROP STRATEGY ASSESSMENT ON CROP PRODUCTION PRODUCTION

- Selected crop : potato- Model selection: Aqacrop
- Meteorological data Médenine station Climate scenarios Minimum and maximum temperature and rainfall projections will be used as input for t the AquaCrop model and to estimate the future ETo using the FAO tool EToCalculator.
- Modelling the impact of climate change on crop yield
- Calibration and Validation of AquaCrop for Potato • Field experiments (2001-2004) in Médenine region • Calibration and validation of the model • Collection of weather data, soil characteristics and management inputs • Calibration on basis of observed soil water content, biomass, yield and canopy cover • Calibration by adjusting the crop input file
Model validation is in progress
- Model simulation
After model calibration and validation, the model will be used to determine the impact of climate change through simulation of biomass and yields over periods.
-

- Modelling the impact of climate change on crop yield
Input data for AquaCrop obtained from the mean minimum and maximum air temperatures and total rainfall data from the downscaled GCM data sets, and reference
evapotranspiration values).
The AquaCrop model to predict potato yields under the following conditions:
• Current situation (simulate actual yields) (2000-2010)
• Impact (2010-2100): Projected climate for three time periods of ten years: 2020-2030, 2050 - 2060 and 2090-2100 (simulate yields under climate change scenarios)
• Adaptation scenarios (2010-2100): Projected climate using recommended adaptation strategy i.e. DI/SI using the AquaCrop model

AGRO-SOCIO-ECONOMICSAGRO-SOCIO-ECONOMICS


Thany youThany you