Embed Size (px)
Citation preview

Simulated differences in 21st century aridity dueto different scenarios of greenhouse gases and aerosols
L. Lin1,2 & A. Gettelman2 & Q. Fu1,3 & Y. Xu2
Received: 30 June 2015 /Accepted: 24 January 2016 /Published online: 3 February 2016# The Author(s) 2016. This article is published with open access at Springerlink.com
Abstract Aridity, defined as the ratio of precipitation (P) to potential evapotranspira-tion (PET) over land, is critical to natural ecosystems and agricultural production.Global climate models project global decreases of P/PET (drying) in the 21st century.We examine the uncertainty of aridity projections due to scenarios of greenhousegases (GHGs) and aerosols with three sets of ensemble simulations from a singleclimate model, the Community Earth System Model (CESM1). Ensembles consist oftwo Radiative Concentration Pathways (RCPs) and a scenario with RCP-like GHGsbut with aerosol precursor emissions and atmospheric oxidants fixed at the year 2005level. Under a high GHGs emission scenario (RCP8.5), global land P/PET decreases(drying) by 6.4 ± 0.8 % in 2060–2080 relative to 1985–2005. A GHG mitigationscenario (RCP4.5) would reduce the drying (P/PET decrease) to 3.7 ± 0.6 %.Although future aerosol emissions reduction would increase P, we find that it haslittle impact on global aridity due to offsetting effects on PET. Regionally, deceasingaerosols can have significant effects and aerosol-induced P/PET changes are due todifferent factors across different regions. When normalized by global mean tempera-ture response, GHGs decrease global land P/PET by 2.7 ± 0.6 %/°C and surfacetemperature changes dominate GHG-induced P/PET change.
Climatic Change (2018) 146:407–422DOI 10.1007/s10584-016-1615-3
This article is part of a Special Issue on BBenefits of Reduced Anthropogenic Climate ChangE (BRACE)^ editedby Brian O’Neill and Andrew Gettelman.
Electronic supplementary material The online version of this article (doi:10.1007/s10584-016-1615-3)contains supplementary material, which is available to authorized users.
* L. [email protected]
1 College of Atmospheric Sciences, Lanzhou University, Lanzhou, China2 National Center for Atmospheric Research, Boulder, CO, USA3 Department of Atmospheric Sciences, University of Washington, Seattle, USA

1 Introduction
Recent global warming has led to concern about future water cycle changes critical toagricultural production and stability of ecosystems. Aridity, or ratio of precipitation (P) topotential evapotranspiration (PET) over land is a function of precipitation (P) and meteoro-logical variables through PET. The variables that describe PET include the surface airtemperature (SAT), available energy (Rn - G), relative humidity (RH), and wind speed at2 m (u2) (Penman 1948). Previous studies (e.g., Nastos et al. 2013) sometimes used adefinition of aridity employing PET that responds only to changes in temperature (e.g.,Thornthwaite 1948). However, this PET is not suited to climate change studies [Sheffieldet al., 2012]. So following Sherwood and Fu (2014)we will define P/PET by deriving PETfrom the physically-based Penman-Monteith algorithm (Shuttleworth 1993)to quantify thedryness of terrestrial climate.
Studies by Sherwood and Fu (2014) and Fu and Feng (2014) suggest that terrestrial climateoverall will become drier in the future, despite an increase of precipitation in a warmingclimate. Based on global climate model output from the phase 5 of the Coupled ModelIntercomparison Projected (CMIP5) (Taylor et al., 2012), Feng and Fu (2013), Dai (2013),Cook et al. (2014), Scheff and Frierson (2015), Lin et al. (2015) and Huang et al. (2015)projected drying over land in the 21st century with high greenhouse gas (GHG) emissions(Representative Concentration Pathway (RCP) 8.5) (Riahi et al., 2011). Feng and Fu (2013)found a smaller drying trend with a lower GHG level (RCP4.5) (Clarke et al., 2007). The CO2
concentration at 2100 is 540 parts-per-million in RCP4.5 and 940 parts-per-million in RCP8.5.Four RCP scenarios with different GHG levels all assume a sharp reduction in aerosol
emissions during the 21st century due to mitigation of aerosol emissions. However, futureaerosol emissions are highly uncertain as they are strongly influenced by economic activitiesand emissions controls. For example, SO2 emissions in Western Europe and the United Statesare now 75–90 % below their peak in the 1970s due to emissions regulations (Smith et al.,2011). However, without significant current mitigation policies for SO2 emissions, Asian SO2
emissions have continued to rise after the 1970’s (Klimont et al., 2013). Thus, aerosolemissions are an anthropogenic radiative forcing, currently subject to mitigation policies inmany developed countries, and likely to be mitigated in developing countries. Several studieshave attempted to use idealized experiments to isolate climate impact of aerosols. Zhao et al.(2014) studied how dust aerosols impact global arid and semi-arid regions. As part of thisspecial issue, Xu et al. (2015) estimated the aerosol impact on future heat extremes.
Here we focus on climate simulations from a single CMIP5 model, the Community EarthSystem Model (CESM1), under RCP8.5 and RCP4.5 to understand the avoided aridityimpacts of lower GHG emissions. We also examine a scenario with RCP8.5 GHG emissionsbut constant (non-declining) aerosol emissions to better understand the effect of aerosolchanges. We explore the roles of GHGs and aerosols in future projection of aridity andother key climate variables, and focus on understanding the extent to which future ariditydiffers between RCP8.5 and 4.5. Emission reductions that lower forcing from 8.5 to 4.5 W/m2can be accomplished in different ways, with different mixes of GHG and aerosol reductions.RCP8.5 and RCP4.5 each imply a specific mix of GHG/aerosol differences. One way to testthe generality of the results to other emission reductions is to test whether the forcing changesdue to aerosols vs. GHGs make a difference to avoiding impacts from changes in aridity. Linet al. (2015) concerns projections of future aridity under RCP8.5, focused on the uncertainty ofinternal variability. Here we focus on distinguishing effects between greenhouse gases and
408 Climatic Change (2018) 146:407–422
aerosols, and distinguishing effects between different greenhouse gas scenarios, including amitigation scenario. Details of the simulated responses of terrestrial aridity to black carbon andsulfate aerosols separately are treated by Lin et al. (2016). Finally, pre-industrial changes interrestrial aridity for the period 850–2080 are discussed by Fu at al., (Changes in terrestrialaridity for the period 850–2080 from the Community Earth System Model, submitted toJournal of Geophysical Research: Atmospheres).
All simulations are from the same model (CESM) to eliminate model uncertainty due toinitial conditions, and from multiple ensembles to sample internal variability uncertainty. Weuse a large ensemble of simulations to fully explore internal climate variability. Methods aredescribed in Section 2. Future projections across scenarios are compared in Section 3 with thephysical mechanisms explained in Section 4. We discuss the implications and conclusions inSection 5.
2 Methods
2.1 Global climate model
The Community Earth System Model (CESM1) is an earth system model consisting ofatmosphere, land, ocean and sea-ice components that are linked though a coupler for exchang-ing state information and fluxes (Hurrell et al., 2013). The 21st century climate simulationusing CESM1 are described in Meehl et al. (2013). CESM1 can reasonably reproduceobserved temporal and spatial variability of aridity in the 20th century (Lin et al., 2015).Notably, the atmosphere component, the Community Atmosphere model (CAM) (Neale et al.,2010) now includes a comprehensive modal aerosol model (Liu et al., 2012), as well as a two-moment microphysics scheme (Morrison and Gettelman, 2008), which represents the directand indirect effects of aerosols on clouds (Gettelman et al., 2010). Monthly data is used in thisstudy.
2.2 Model simulations
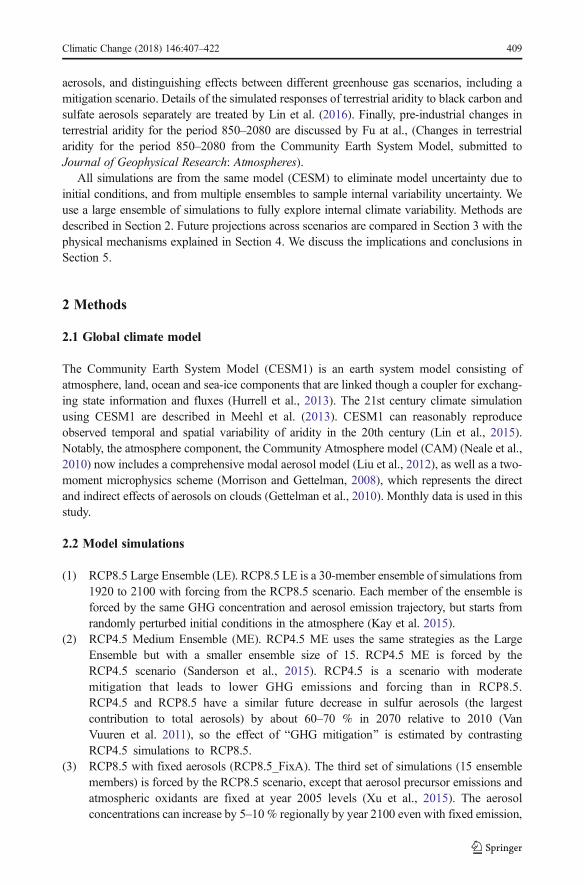
(1) RCP8.5 Large Ensemble (LE). RCP8.5 LE is a 30-member ensemble of simulations from1920 to 2100 with forcing from the RCP8.5 scenario. Each member of the ensemble isforced by the same GHG concentration and aerosol emission trajectory, but starts fromrandomly perturbed initial conditions in the atmosphere (Kay et al. 2015).
(2) RCP4.5 Medium Ensemble (ME). RCP4.5 ME uses the same strategies as the LargeEnsemble but with a smaller ensemble size of 15. RCP4.5 ME is forced by theRCP4.5 scenario (Sanderson et al., 2015). RCP4.5 is a scenario with moderatemitigation that leads to lower GHG emissions and forcing than in RCP8.5.RCP4.5 and RCP8.5 have a similar future decrease in sulfur aerosols (the largestcontribution to total aerosols) by about 60–70 % in 2070 relative to 2010 (VanVuuren et al. 2011), so the effect of BGHG mitigation^ is estimated by contrastingRCP4.5 simulations to RCP8.5.
(3) RCP8.5 with fixed aerosols (RCP8.5_FixA). The third set of simulations (15 ensemblemembers) is forced by the RCP8.5 scenario, except that aerosol precursor emissions andatmospheric oxidants are fixed at year 2005 levels (Xu et al., 2015). The aerosolconcentrations can increase by 5–10% regionally by year 2100 even with fixed emission,
Climatic Change (2018) 146:407–422 409

as a result of climatic change. However, the aerosol optical depth change in theRCP8.5_FixA simulations between 2006 and 2080 is not significant in most regions(see supplement), therefore aerosol forcing is largely fixed in this simulation.
These three sets of simulation are utilized in three ways in this study. Firstly, by contrastingRCP8.5 simulations with RCP8.5_FixA, the effects of the sharp aerosol reduction from present-daylevel in RCP8.5 can be estimated. Secondly, climate differences between early and late 21st centurydecades in RCP8.5_FixA are purely due to GHG forcing since aerosol emissions are fixed. Finally,the difference between the RCP8.5 and the RCP4.5 illustrates the impact of mitigation on aridity.
2.3 PET calculation
We obtain PET by the Penman-Monteith algorithm (Shuttleworth, 1993; Allen et al., 1998),
PET ¼ Rn−Gð ÞΔ SATð Þ þ ρaCpe* SATð Þ 1−RHð ÞCHu2Δ SATð Þ þ γ 1þ rsCHu2ð Þ
.Lv ð1Þ
where Rn is the net downward broadband radiation, G is the heat flux into ground, Δ is the slopeof the saturation vapor pressure curve, ρa is the surface air density, Cp is the specific heat of air,e* is the saturated water vapor pressure, CH is the bulk transfer coefficient, rs is the bulk stomatalresistance under well-watered conditions, LV is the latent heat of vaporization for water, γ ispsychrometric constant. We use a CH of 4.8 × 10⁻³ and a rs of 70 s/m, corresponding to a grass-like surface (Allen et al. 1998). From climate model output, we use the sum of sensible heat(SH) and latent heat (LH) to replace Rn - G (Scheff and Frierson, 2014). We adjust the CESMoutput wind speed from 10 m height to 2 m height using the equation of Allen et al. (1998).
a b
c d
Fig. 1 Temporal variations of annual mean average Surface Air Temperature (SAT), Precipitation (P), PotentialEvapotranspiration (PET) and P/PET anomalies in global land based on RCP8.5 (black), RCP4.5 (red) andRCP8.5_FixA (blue). The grey, red and blue shading denotes two standard deviation from 30 RCP8.5, 15RCP4.5 and 15 RCP8.5_FixA simulations
410 Climatic Change (2018) 146:407–422

3 Scenario dependence of aridity projections
Figure 1 shows the future projections of SAT, P, PET and P/PET. All values are annual meanarea-weighted averages over land between 60°S and 90°N (including Greenland). CESM1projects a strong global warming (2–4 °C) by 2060–2080 from present-day (1985–2005) underall three scenarios (Fig. 1a). The analysis ends in 2080 because the RCP4.5 ME ends in 2080.In addition to global land, we select seven regions for further analysis: Eastern USA, Europe,Eastern China, Eastern Brazil, Southern Africa, Northern Australia and India (domains shownin boxes of Fig. 3). Figure 2 shows the regional averages of projected changes in SAT, P, PETand P/PET over land for 2060–2080 relative to 1985–2005. The changes of P, PET and P/PETare shown as a percentage change.
All three scenarios project decreases in global P/PET (i.e. drying, Fig. 1d), as the increases inPET dominate the increases in precipitation. The drying in RCP4.5 (4 % by 2060–2080) is lesssevere than RCP8.5 (7 %). The ensemble mean P/PET change under RCP4.5 and RCP8.5 issignificantly different at the 95% level based on estimating the difference in two sample means of2060–2080 average, and using each ensemble member to estimate the standard deviation ofdecadal means for a two-sided t-test. The standard deviation of the decadal means is much smallerthan the standard deviation of each year shown in Fig. 1. Similar avoided impacts on global P/PET have been seen in previous studies (Feng and Fu, 2013) using the entire CMIP5 ensemble.
The GHG mitigation from RCP8.5 to RCP4.5 (i.e., moving from the black curve to the redcurve in Fig. 1) lowers the temperature projection due to smaller GHGs radiative forcing.Fixing present-day aerosols in RCP8.5 (black to blue) lowers the temperature projection due toa larger negative forcing from constant present-day aerosols. Quantitatively, RCP8.5 projects a4.1 ± 0.1 °C increase in SAT over global land for 2060–2080 relative to 1985–2005, whileRCP4.5 projects 2.4 ± 0.1 °C and RCP8.5_FixA 3.3 ± 0.1 °C (Fig. 2a). Xu et al. (2015)discussed the implications of such avoided warming on heat extremes. Precipitation generallyincreases more in RCP8.5 than RCP4.5 (Fig. 1b). But the changes of precipitation are notconsistent across regions as with temperature, which is a consequence of different precipitationtrends in the high latitudes, tropics and sub-tropics (Stocker et al., 2013). Increases in PET inRCP4.5 (Fig. 1c), similar to temperature, are only about half in RCP8.5, since PET is mostlydefined by temperature and humidity.
A major finding of this study is that there is no notable difference in P/PET projectionbetween RCP8.5 and RCP8.5_FixA (Fig. 1d). This is due to compensation effects: aerosolsinduce a stronger suppression of precipitation than with GHG mitigation (Fig. 1b), but theyalso have a less cooling effect (Fig. 1a). Also Rn decreases, thus reducing PET (details insection 4.2.1). Although aerosols have no significant impact global mean P/PET (Fig. 1d), theregional impact can be significant (Fig. 2d), especially over Europe and Southern Africa.Regionally, GHG mitigation has a stronger impact than present-day aerosols on SAT over allselected regions (Fig. 2a), especially over Southern Hemisphere (SH) regions where present-day aerosol emissions are already low.
Globally, both GHG mitigation and present-day aerosols damp the future precipitationincreases (Fig. 2b, i.e. 5.7 ± 0.5 % under RCP4.5 and 4.6 ± 0.6 % under RCP8.5_FixAwhile8.1 ± 0.7 % under RCP8.5, by 2060–2080 relative to 1985–2005). The reduction is robustacross all ensemble members. However, this comparison is somewhat arbitrary, since themagnitude of the change is specific to the size of the GHG and aerosol forcing perturbation.The real issue is what is the sensitivity per unit of forcing, or more relevant perhaps, per unitglobal mean temperature change, which we will further examine in section 4.
Climatic Change (2018) 146:407–422 411

a
b
c
d
412 Climatic Change (2018) 146:407–422

Present-day aerosols induce a larger precipitation reduction than GHG mitigation (Fig. 1b),despite a smaller cooling effect (Fig. 1a). This is illustrated as a larger hydrological sensitivity(% of precipitation change per degree of warming) in Fig. 3b due to aerosols (See section 4).The larger sensitivity due to aerosols is consistent with previous studies (Ramanathan et al.,2001; Shiogama et al., 2010). Present-day aerosol suppression of precipitation is strong overmost Northern Hemisphere land, but weak in SH regions (Fig. 2b). The cooling from GHGmitigation in general damps precipitation changes. However, RCP4.5 has a larger precipitationincrease than RCP8.5 over some regions (Eastern China, Eastern Brazil and Southern Africa)(Fig. 2b), which could be related to the regional precipitation changes due to small differencesin aerosol levels between RCP8.5 and RCP4.5 (see Supplements of Xu et al., 2015).
GHG mitigation and present-day aerosols tend to damp projected increases in PET(Fig. 1c). Globally, RCP8.5 simulations project 15.4 ± 0.3 % increases in PET, 9.8 ± 0.2 %for RCP4.5 and 11.8 ± 0.2 % for RCP8.5_FixA (2060–2080 relative to 1985–2005).Regionally, present-day aerosols reduce PET less than GHG-mitigation except in Europeand Eastern China (Fig. 2c). In Section 4, we examine in details the physical parameters thatcontribute to PET changes.
Both RCP8.5 and RCP8.5_FixA ensembles have a 6.4 % decrease in global average P/PETfor 2060–2080 relative to 1985–2005. Over the same period, the RCP4.5 ensemble has a 4 %decrease in P/PET (Fig. 2d). The aerosol impact on P/PET is minimal due to a cancellation ofthe precipitation reduction and PET reduction. The GHG mitigation slows down the projectedincreasing aridity (decreasing P/PET) under RCP8.5 due to a smaller reduction in P than PET(Fig. 2b and 2c). GHGs mitigation reduces drying in most land regions and has a strongerimpact than present-days aerosols in the five of seven study areas (Fig. 2d). Present-dayaerosols tend to decrease P/PET in India (Fig. 2d), because aerosols change PET slightly inIndia but suppress the precipitation.
In next section, we contrast the regional distributions and mechanisms between GHGs andaerosols.
4 Normalized change in SAT, P, PET and P/PET due to GHGs and aerosols
Since the absolute value of temperature response is larger for GHGs mitigation than present-day aerosols (1.7 vs. 0.8 °C ), we normalize the climate response with respect to the globalmean SAT change with each case. Thus, we can contrast the contributions to PET and P/PETdue to the difference in GHG and aerosols. Note that aerosol emissions are regional and willdepend on the scenario, but they have known source regions. Thus, the aerosol sensitivities arelikely to be only weakly dependent on the scenario since most aerosol scenarios have similarreductions in similar regions (van Vuuren et al., 2011).
We also investigated GHG-induced changes alone by contrasting the averages of theRCP8.5_FixA for the years 2030–2050 and 2060–2080. This yields the climate changespurely due to GHGs. Fu and Feng (2014) showed using 1 %/year CO2 increase CMIP5experiments (multi-model mean) that the increase in P averaged over land is 1.4 %/°C, while
Fig. 2 Area average of Projected changes in Surface Air Temperature (SAT), Precipitation (P), PotentialEvapotranspiration (PET) and P/PET for 2060–2080 relative 1985–2005 from RCP8.5 (black), RCP4.5 (red)and RCP8.5_FixA (blue). The black, red and blue error bar denotes two standard deviation of RCP8.5, RCP4.5and RCP8.5_FixA ensembles. The eight selected regions are the Eastern USA, Europe, Eastern China, EasternBrazil, Southern Africa, India, Northern Australia and Global Land (see the boxes of Fig. 3)
R
Climatic Change (2018) 146:407–422 413

PET increased at 4.6 %/°C, leading to an P/PET decrease (i.e., drying) by 2.9 %/°C. We find1.7 %/°C for P and 4.9 %/°C for PET, yielding a P/PET decrease of 2.7 %/°C very similar tothe normalized changes due to CO2 alone shown in Fu and Feng (2014). Aerosol reductionsimpact P (6.1 %/°C) and PET (6.4 %/°C) more than GHG changes, thus aerosols impact the P/PET much less than GHGs (0.1 %/°C for aerosols, while −2.7 %/°C for GHGs).
4.1 Regional patterns
Figure 3 shows the global distributions of normalized changes in SAT, P, PET and P/PET dueto GHGs and aerosol reductions. The spatial pattern of changes in P, PET and P/PET due toGHGs (Fig. 3c, e and g) is similar to the multi-model mean patterns in Fu and Feng (2014)(Fig. 2) forced by CO2 alone. Per degree of global mean temperature change, the land warmsby 1.5 ± 0.1 °C due to aerosol reductions and 1.3 ± 0.03 °C due to GHGs. Relative to GHGs,
a b
c d
e f
g h
Fig. 3 The change of Surface Air Temperature (SAT), Precipitation (P), Potential Evapotranspiration (PET) andP/PET due to GHGs (contrasting the averages of the RCP8.5_FixA for the years 2030–2050 and 2060–2080) andAerosols (taken as the differences between the averages RCP8.5_FixA and RCP8.5 for the years 2060–2080),scaled by global mean surface air temperature changes. Gray regions do not have statistically significant changesbased on a 95 % confidence interval from a two-sided t-test
414 Climatic Change (2018) 146:407–422

aerosol reductions cause more warming in the NH mid-latitudes, and less warming in the SH(Fig. 3a and b).
The patterns of precipitation change caused by GHGs and aerosol reductions arequite different. The spatial heterogeneity of precipitation response to aerosols arisesfrom several factors. Aerosols serve as cloud condensation nuclei and thus have asubstantial effect on cloud droplet formation and eventually precipitation production(Rosenfeld et al., 2008; Huang et al., 2014). Small variations or changes in theamount, altitude, physical thickness, and/or microphysical properties of clouds dueto human influences can then alter the hydrological cycle (Huang et al., 2006a,2006b). Overall, aerosols appear to induce larger P change per degree of warming(blue area in Fig 3d). Lambert and Allen (2009) also found greater sensitivity of P toaerosols than GHGs. Note that large and significant percentage changes occur oversome regions with low precipitation (i.e. the Sahara).
The PET pattern due to GHGs is more spatially uniform (Fig. 3.e) than that due toaerosol reductions (Fig. 3.f). Aerosol reductions suppress the increasing PET overparts of Africa and India, despite warming temperatures there. GHGs induce drying(Fig. 3.g) over most land regions except Africa and Northeastern Asia, while aerosolshave a larger impact on Eastern Brazil, Europe, Northern Africa, Southern Africa,Southern China and Western Northern Australia (Fig. 3.h). Opposite signs of P/PETchange occur between GHGs and aerosol reductions in northern Eastern Brazil andIndia, but for different reasons. For Eastern Brazil, P/PET changes are due to differentsign in precipitation change between GHGs and aerosol reductions. For India, P/PETchanges are due to different sign in PET changes. In the reduced aerosol case, evenover places with decreasing P/PET, P/PET decreases can be caused by either decreas-ing P (Northern Australia) or increasing PET with a small P increase (e.g. parts ofChina).
Figure 4 summarizes the normalized changes over selected regions in Fig. 3.Normalized changes of SAT and PET due to GHGs are of the same sign and similarmagnitude across regions (red bars). Even though the precipitation change in SouthernAfrica is negative, the aridity change there is similar to other regions. Normalizedchanges due to aerosol reductions (blue bars in Fig. 4) have different magnitudesacross these regions, especially between the NH and SH. NH temperature changesfaster than the global mean (except India). The NH temperature change is notable inthe reduced aerosol case. Aerosol reductions induce positive precipitation changesover NH regions but negative precipitation changes over the SH (Fig. 4.b). This shiftis in addition to the larger total rainfall change. The PET changes due to aerosols arelarger than from GHGs over the NH (e.g., 20 % larger over Europe and EasternChina) except over India (near zero). P/PET changes due to GHGs are of the samesign, but not the same magnitude in seven study areas (e.g. -0.2 ± 3.8 %/°C overNorthern Australia but −5.0 ± 2.6 %/°C over Europe). Aerosol reductions cause largernormalized P/PET change than GHGs over these seven regions and cause positive P/PET change in India while negative change over the other six regions (Fig. 4d). Thenear-zero global aridity change due to aerosols is mainly driven by increasing P/PETover northern Africa (Fig. 3h).
In summary, the normalized change of T, P, PET and P/PET due to GHGs are morehomogeneous in space than those due to aerosols. Despite of having minimal impact on globalaridity, aerosols cause more regional normalized P/PET change than GHGs.
Climatic Change (2018) 146:407–422 415

a
b
c
d
416 Climatic Change (2018) 146:407–422

4.2 Physical factors determining different normalized change due to GHGsand aerosols
4.2.1 Changes in PET
To explore how GHGs and aerosols impact PET differently, we use equation (1) to quantify therelative contributions of changes in SAT, relative humidity (RH), wind speed (u2) and availableenergy (Rn - G) to the total percentage changes in PETover global land. See Appendix A of Fuand Feng (2014) for details on the method of deriving the individual contributions. The changein PET due to GHGs is dominated by SAT changes (64.2 ± 1.6 %), while the changes in RHand available energy also make appreciable contributions (14.5 ± 2.3 % and 19.7 ± 1.5 %,respectively). The partitioning of relative contributions broadly agrees with Fu and Feng(2014), except for a larger contribution of u2 of 1.5 ± 0.8 % (0 % in Fu and Feng (2014)).This also supports Scheff and Frierson (2014), which showed warmer temperature increasesPET due to increasing vapor pressure deficit and the Clausius–Clapeyron slope. The largersensitivity to SAT for the GHG case holds in all selected regions.
For the aerosol case, the available energy contribution to global PETchange is as large as theSAT contribution (41.3 ± 5.8 % and 58.0 ± 2.6 %, respectively). The available energycontribution can be even larger than the SAT contribution in NH regions with high aerosolloading. The available energy contribution is mainly caused by net shortwave radiation at thesurface. RH and u2 do not impact PET significantly at the global scale (0.4 ± 7.6 % and0.3 ± 1.3 %, respectively), but regionally RH or/and u2 make appreciable contributions overEurope, Eastern Brazil, Southern Africa, Northern Australia and India. In India, aerosol effect toPET through SATcancel out that through RH (not shown), leading to minimal changes in PET.
4.2.2 Changes in P/PET
Similarly, we provide the details in Appendix A of this study on the method of deriving theindividual contributions of changes in SAT, RH, u2, Rn - G and P to total percentage changesin P/PET globally and over the seven study areas.
Figure 5 shows the relative contributions of changes in SAT, RH, u2, Rn - G and P to thetotal percentage changes in P/PET over the seven study areas and global land. To highlight thedifferent magnitudes, all relative contributions are displayed as positive numbers in Fig. 5,regardless of the actual sign. The change in P/PETover global land due to GHGs is dominatedby SAT change (47.9 ± 3.2 %), while the changes in P, RH and Rn - G contribute(26.0 ± 6.6 %, 10.4 ± 2.6 %, 14.5 ± 0.8 %, respectively). Fu and Feng (2014) showed thatSAT changes dominate the global aridity changes in CO2 only case. Regional responses toglobal temperature change, however, could be different. Precipitation causes the largest ariditychange due to GHGs in Eastern China and Northern Australia, although temperaturedominates in the other five study areas except India. Similarly, Gao et al. (2015) argued thatprecipitation changes dominate GHG induced aridity change in Tibetan Plateau.
Fig. 4 Area average of normalized changes of Surface Air Temperature (SAT), Precipitation (P), PotentialEvapotranspiration (PET) and P/PET due to GHGs (contrasting the averages of the RCP8.5_FixA for the years2030–2050 and 2060–2080) and Aerosols (taken as the differences between the averages RCP8.5_FixA andRCP8.5 for the years 2060–2080). The red (blue) error bar denotes two standard deviation of GHGs (Aerosols)
R
Climatic Change (2018) 146:407–422 417
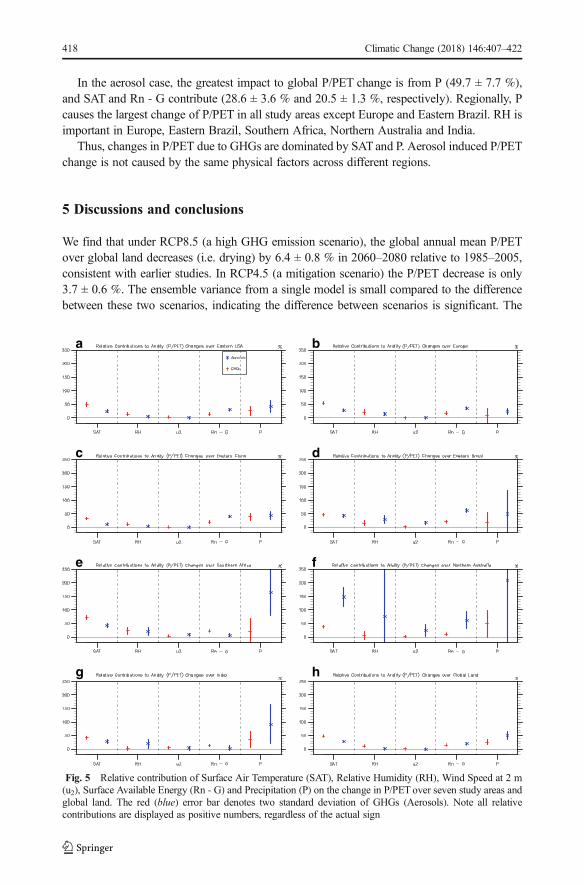
In the aerosol case, the greatest impact to global P/PET change is from P (49.7 ± 7.7 %),and SAT and Rn - G contribute (28.6 ± 3.6 % and 20.5 ± 1.3 %, respectively). Regionally, Pcauses the largest change of P/PET in all study areas except Europe and Eastern Brazil. RH isimportant in Europe, Eastern Brazil, Southern Africa, Northern Australia and India.
Thus, changes in P/PET due to GHGs are dominated by SATand P. Aerosol induced P/PETchange is not caused by the same physical factors across different regions.
5 Discussions and conclusions
We find that under RCP8.5 (a high GHG emission scenario), the global annual mean P/PETover global land decreases (i.e. drying) by 6.4 ± 0.8 % in 2060–2080 relative to 1985–2005,consistent with earlier studies. In RCP4.5 (a mitigation scenario) the P/PET decrease is only3.7 ± 0.6 %. The ensemble variance from a single model is small compared to the differencebetween these two scenarios, indicating the difference between scenarios is significant. The
a b
c d
e f
g h
Fig. 5 Relative contribution of Surface Air Temperature (SAT), Relative Humidity (RH), Wind Speed at 2 m(u2), Surface Available Energy (Rn - G) and Precipitation (P) on the change in P/PET over seven study areas andglobal land. The red (blue) error bar denotes two standard deviation of GHGs (Aerosols). Note all relativecontributions are displayed as positive numbers, regardless of the actual sign
418 Climatic Change (2018) 146:407–422

larger ensemble spread at regional scale is associated with the high variance of regionalprecipitation patterns, but all regions except Northern Australia and India have a significantly(larger than ensemble spread) smaller drying in the mitigation scenario (RCP4.5).
Reduction of aerosols is another forcing to future global change with a different time scalethan GHG forcing. Four RCP scenarios all assume aerosol emissions decreases, whichenhance the future GHG warming and increase precipitation. Here we show that aerosolchanges have little impact on global land aridity, but may have significant effects at regionalscale. This result has broad implication, because previous work has suggested that Bvolcanic^(geo-engineering) and dust aerosol changes would lead to global drought (Tilmes et al., 2013).In our model simulations, aerosols indeed lead to strong suppression of precipitation (Fig. 3d).However, aerosols induce a similar amount of PET and precipitation change over land,canceling out any change in P/PET.
In our simulations, aerosol decline contributes nearly a full degree of warming by 2100 inRCP8.5 and nearly half of the total increase in precipitation. These non-negligible aerosoleffects on future temperature and precipitation have been noted by previous studies (e.g. Levyet al., 2013). To the best of our knowledge, however, the effects of GHG increases and aerosoldecreases on future global P/PET have not been separated out before. Previous studiessuggesting that future predicted climates are more arid (defined by P/PET) focused only onGHG effects.
The physical mechanism of GHG induced P/PET is mainly temperature-based (e.g. theevaporation rate increases with temperature and other factors do not compensate). Based onthis mechanism, one would expect an aerosol-driven cooling to have similar effects on P/PETas a GHG-driven one, just with the opposite sign. Surprisingly, our study fails to detect anysignificant net impact of aerosol changes on P/PET, suggesting that future changes of P/PET inthe model are entirely attributable to GHGs even though the temperature and precipitationchange are not all due to GHGs. This result contradicts previous claims that aerosols will leadto aridity increases, which consider only the impact on precipitation and ignore that onevaporation. Our study is consistent with a previous study by Zhao et al. (2014) that lookedat the impact of dust aerosols over semi-arid regions.
The sensitivity of T, P, PET and P/PET due to GHGs is consistent in sign and magnitudeacross regions, while the sensitivity due to aerosols varies between regions, because of theregional nature of the response to short-lived aerosol effects (Shindell et al., 2015). Therefore,conclusions focusing on the sensitivity of aridity to GHGs may not be applicable in NHregions of high aerosol loading and large aerosol perturbations.
There is relatively larger land warming (1.5 ± 0.1 °C/°C) due to aerosols than due to GHGs(1.3 ± 0.03 °C /°C), due to larger aerosol loading over land. Since large land warming is thefundamental reason behind land P/PET decreases under GHG warming (Sherwood and Fu,2014), the 25 % larger land warming due to aerosols partly explains the larger PET sensitivity.Another contributor to larger PET sensitivity due to aerosols is the surface energy budgetperturbation (Rn - G), which is mainly from short-wave clear-sky changes. Because aerosolsdecrease surface temperature and also heat the atmosphere through direct absorption, aerosolslead to a reduction of precipitation. Over NH regions except India, the contribution throughthis energy term is even larger than that temperature. Part of this is coming from absorbingaerosols, which warm the surface (increasing PET) but block solar radiation reaching thesurface (decreasing PET).
Overall, GHG mitigation may significantly reduce the projected drying. Mitigation ofaerosols tends to lead to enhanced warming, which in turn generally increases PET. But it
Climatic Change (2018) 146:407–422 419

also leads to enhanced precipitation, so the net global effect on P/PET is small. Temperatureterm dominates the response to GHGs, while the response to aerosols is more complicated, andcan vary regionally, due to differences in both P and PET. In this work, we have not exploredthe impact of different types of aerosols. Zhao et al. (2014) found the effects of dust aerosolsare indiscernible in the expansion of arid and semi-arid areas on a global scale. In CESM1,most of aerosol effects on liquid clouds are due to SO4 (Gettelman et al., 2010), so it is likelySO4 is the major component of the aerosol impact we have analyzed. Although our largeensemble approach can quantify uncertainty due to model internal variability, the uncertaintyassociated with the model structure need further study.
Acknowledgments We thank three anonymous reviewers for their helpful comments. This study is in partsupported by the NSFC Grants 41521004, 41275070 and 41405010, National Basic Research Program of China(2012CB955303), and the Fundamental Research Funds for the Central Universities (lzujbky-2015-k02). Y.X.was supported by a postdoctoral fellowship from the Advanced Study Programme (ASP) of National Center forAtmospheric Research (NCAR) and by the Regional and Global Climate Modeling Program (RGCM) of the U.S.Department of Energy’s Office of Science (BER), Cooperative Agreement DE-FC02-97ER62402. Computingresources (ark:/85065/d7wd3xhc) were provided by the Climate Simulation Laboratory at NCAR’s Computa-tional and Information Systems Laboratory, sponsored by the National Science Foundation (NSF) and otheragencies. The National Center for Atmospheric Research is supported by the U. S. National Science Foundation.
Appendix A: Change in P/PETand contributions from changes in SAT, RH,u2, Rn - G and P
Here we define P/PET = g(SAT, RH, u2, Rn - G, P) (i.e. P over equation(1)), the subscripts B0^and B1^ to represent the mean values for the different simulations, respectively.
To SAT: Δ(P/PET)_SAT = g(SAT1, RH0, u20, Rn - G0, P0) - g(SAT0, RH0, u20, Rn - G0,P0). The same method treat to RH, u2, Rn - G.
To P: Δ(P/PET)_P = g(SAT1, RH1, u21, Rn - G1, P1) - g(SAT1, RH1, u21, Rn - G1, P0).Note the effects of precipitation on P/PET is positive number when the other variablesnegative, so here we define the relative contribution by |xi|/Σ|xi|, not xi/Σxi.
References
Allen RG, Pereira LS, Raes D, Smith M (1998) Crop evapotranspiration-guidelines for computing crop waterrequirements-FAO irrigation and drainage paper 56. FAO, Rome 300:6541
Clarke, L., Edmonds, J., Jacoby, H., Pitcher, H., Reilly, J., & Richels, R. (2007). Scenarios of greenhouse gasemissions and atmospheric concentrations. US Department of Energy Publications, 6
Cook, B. I., Smerdon, J. E., Seager, R., & Coats, S. (2014). Global warming and 21st century drying. ClimDyn, 1-21Dai A (2013) Increasing drought under global warming in observations and models (vol 3, pg 52, 2013). Nat
Clim Chang 3(2):171–171. doi:10.1038/nclimate1811Feng S, Fu Q (2013) Expansion of global drylands under a warming climate. Atmos Chem Phys 13(19):10081–
10094. doi:10.5194/acp-13-10081-2013Fu Q, Feng S (2014) Responses of terrestrial aridity to global warming. J Geophys Res-Atmos 119(13). doi:10.
1002/2014jd021608Gao Y, Li X, Leung LR, Chen D, Xu J (2015) Aridity changes in the Tibetan plateau in a warming climate.
Environ Res Lett 10(3):034013Gettelman A, Liu X, Ghan SJ, Morrison H, Park S, Conley AJ, Li JLF (2010) Global simulations of ice
nucleation and ice supersaturation with an improved cloud scheme in the community atmosphere model. J ofGeophys Res-Atmos:115. doi:10.1029/2009jd013797
420 Climatic Change (2018) 146:407–422

Huang, J., Yu, H., Guan, X., Wang, G., & Guo, R. (2015). Accelerated dryland expansion under climate change.Nat Clim Chan
Huang J, Lin B, Minnis P, Wang T, Wang X, Hu Y, Ayers JK (2006a) Satellite-based assessment of possible dustaerosols semi-direct effect on cloud water path over east Asia. Geophys Res Lett 33(19). doi:10.1029/2006gl026561
Huang J, Wang T, Wang W, Li Z, Yan H (2014) Climate effects of dust aerosols over east Asian arid and semiaridregions. J Geophys Res-Atmos 119(19):11398–11416. doi:10.1002/2014jd021796
Huang JP, Minnis P, Lin B, Wang TH, Yi YH, Hu YX, Ayers K (2006b) Possible influences of Asian dustaerosols on cloud properties and radiative forcing observed from MODIS and CERES. Geophys Res Lett33(6). doi:10.1029/2005gl024724
Hurrell JW, Holland MM, Gent PR, Ghan S, Kay JE, Kushner PJ, Marshall S (2013) The community earthsystem model a framework for collaborative research. Bull Am Meteorol Soc 94(9):1339–1360. doi:10.1175/bams-d-12-00121.1
Kay JE, Deser C, Phillips A, Mai A, Hannay C, Strand G, Arblaster JM, Bates SC, Danabasoglu G, Edwards J,Holland M, Kushner P, Lamarque J-F, Lawrence D, Lindsay K, Middleton A, Munoz E, Neale R, Oleson K,Polvani L, Vertenstein M (2015) The Community Earth System Model (CESM) Large Ensemble Project: Acommunity resource for studying climate change in the presence of internal climate variability. Bull AmMeteorol Soc 96:1333–1349. doi:10.1175/BAMS-D-13-00255.1
Klimont Z, Smith SJ, Cofala J (2013) The last decade of global anthropogenic sulfur dioxide: 2000–2011emissions. Env Res Lett 8(014003). doi:10.1088/1748-9326/8/1/014003
Lambert FH, Allen MR (2009) Are changes in global precipitation constrained by the tropospheric energybudget? J Clim 22(3):499–517
Levy H, Horowitz LW, Schwarzkopf MD, Ming Y, Golaz JC, Naik V, Ramaswamy V (2013) The roles of aerosoldirect and indirect effects in past and future climate change. J of Geophys Res: Atmos 118(10):4521–4532
Lin L, Gettelman A, Feng S, Fu Q (2015) Simulated climatology and evolution of aridity in the 21st century. JGeophys Res Atmos 120. doi:10.1002/2014JD022912
Lin L, Gettelman A, Xu Y, Fu Q (2016) Simulated responses of terrestrial aridity to black carbon and sulfateaerosols. J Geophys Res Atmos 121. doi:10.1002/2015JD024100
Liu X, Easter RC, Ghan SJ, et al. (2012) Toward a minimal representation of aerosols in climate models:description and evaluation in the community atmosphere model CAM5[J]. Geosci Model Dev 5:709–739
Meehl GA, Washington WM, Arblaster JM, et al. (2013) Climate change projections in CESM1 (CAM5)compared to CCSM4[J]. J Clim 26(17):6287–6308
Morrison H, Gettelman A (2008) A new two-moment bulk stratiform cloud microphysics scheme in the communityatmosphere model, version 3 (CAM3). part I: description and numerical tests. J Clim 21(15):3642–3659
Nastos PT, Politi N, Kapsomenakis J (2013) Spatial and temporal variability of the aridity index in Greece.Atmos Res 119:140–152
Neale, R. B., Chen, C.-C., Gettelman, A., Lauritzen, P. H., Park, S., Williamson, D. L., Lamarque, J.-F. (2010).Description of the NCAR community atmosphere model (CAM 5.0). NCARTech. Note NCAR/TN-486+ STR
Penman HL (1948) Natural evaporation from open water, bare soil and grass. Proc R Soc Lond 193A:120–145.doi:10.1098/rspa.1948.0037
Ramanathan V, Crutzen P, Kiehl J, Rosenfeld D (2001) Aerosols, climate, and the hydrological cycle. Sci294(5549):2119–2124
Riahi K, Rao S, Krey V, Cho C, Chirkov V, Fischer G, Rafaj P (2011) RCP 8.5-a scenario of comparatively highgreenhouse gas emissions. Clim Chang 109(1–2):33–57. doi:10.1007/s10584-011-0149-y
Rosenfeld D, Lohmann U, Raga GB, O’Dowd CD, Kulmala M, Fuzzi S, Andreae MO (2008) Flood or drought:how do aerosols affect precipitation? Science 321(5894):1309–1313
Sanderson BM, Oleson KW, Strand WG, Lehner F, O’Neill BC (2015) A new ensemble of GCM simulations toassess avoided impacts in a climate mitigation scenario. Clim. Chang:1–16
Scheff J, Frierson DMW (2014) Scaling potential evapotranspiration with greenhouse warming. J Clim 27(4):1539–1558. doi:10.1175/jcli-d-13-00233.1
Scheff J, Frierson DM (2015) Terrestrial aridity and its response to greenhouse warming across CMIP5 climatemodels. J Clim 28:5583–5600. doi:10.1175/JCLI-D-14-00480.1
Sheffield J, Wood EF, Roderick ML (2012) Little change in global drought over the past 60 years. Nat491(7424):435–438
Sherwood S, Fu Q (2014) A drier future? Sci 343(6172):737–739Shindell DT, Faluvegi G, Rotstayn L, Milly G (2015) Spatial patterns of radiative forcing and surface temperature
response. Atmospheres, Journal of Geophysical ResearchShiogama H, Hanasaki N, Masutomi Y, Nagashima T, Ogura T, Takahashi K, Emori S (2010) Emission scenario
dependencies in climate change assessments of the hydrological cycle. Clim Chang 99(1–2):321–329. doi:10.1007/s10584-009-9765-1
Climatic Change (2018) 146:407–422 421

Shuttleworth WJ (1993) Evaporation. In: DR m (ed) handbook of hydrology, vol 4. McGraw-Hill Inc, pp. 1–4.53Smith SJ, van Aardenne J, Klimont Z, Andres RJ, Volke A, Arias SD (2011) Anthropogenic sulfur dioxide
emissions: 1850-2005. Atmos Chem Phys 11(3):1101–1116. doi:10.5194/acp-11-1101-2011Stocker TF, Qin D, Plattner GK, Tignor M, Allen SK, Boschung J, Nauels A, Xia Y, Bex B, Midgley BM (2013)
IPCC, 2013: climate change 2013: the physical science basis. Contribution of working group I to the fifthassessment report of the intergovernmental panel on climate change. Cambridge University Press
Taylor KE, Stouffer RJ, Meehl GA (2012) AN OVERVIEW OF CMIP5 AND THE EXPERIMENT DESIGN.Bull Am Meteorol Soc 93(4):485–498. doi:10.1175/bams-d-11-00094.1
Thornthwaite CW (1948) An approach toward a rational classification of climate. Geogr Rev:55–94Tilmes, Simone, et al. (2013). The hydrological impact of geoengineering in the Geoengineering Model
Intercomparison Project (GeoMIP). J of Geophys Res: Atmos 118.19 (2013): 11–036Van Vuuren DP, Edmonds J, Kainuma M, Riahi K, Thomson A, Hibbard K, et al. (2011) The representative
concentration pathways: an overview. Clim Chang 109:5–31Xu Y, Lamarque JF, Sanderson BM (2015) The importance of aerosol scenarios in projections of future heat
extremes. Clim Chang 1-14Zhao, S., Zhang, H., Feng, S., & Fu, Q. (2014). Simulating direct effects of dust aerosol on arid and semi-arid
regions using an aerosol–climate coupled system. Int J of Climatol
422 Climatic Change (2018) 146:407–422