Embed Size (px)
Citation preview
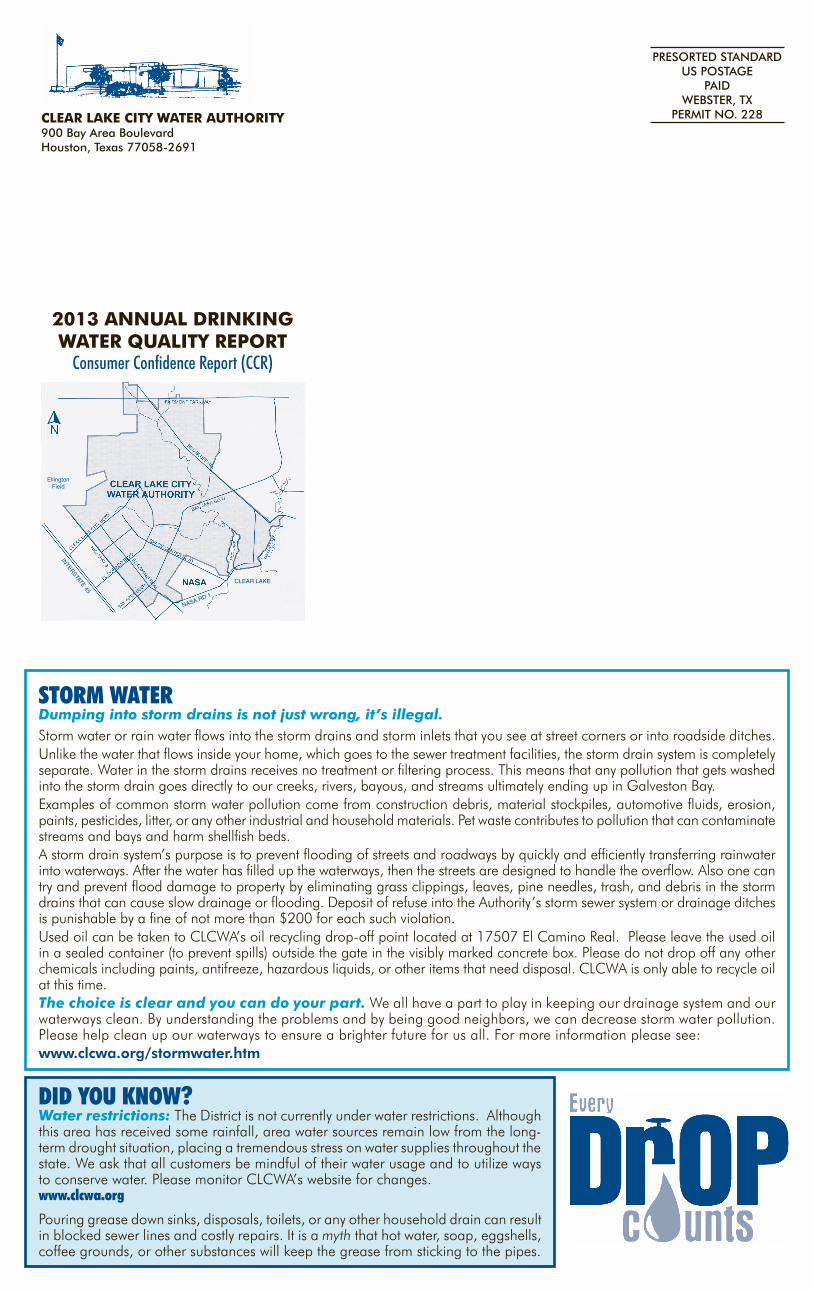
CLEAR LAKE CITY WATER AUTHORITY900 Bay Area BoulevardHouston, Texas 77058-2691
PRESORTED STANDARDUS POSTAGE
PAIDWEBSTER, TX
PERMIT NO. 228
2013 ANNUAL DRINKINGWATER QUALITY REPORT
Consumer Confidence Report (CCR)
INTERSTATE 45
EllingtonField
NASA RD 1
CLEAR LAKE
STORM WATER Dumping into storm drains is not just wrong, it’s illegal.Storm water or rain water flows into the storm drains and storm inlets that you see at street corners or into roadside ditches.Unlike the water that flows inside your home, which goes to the sewer treatment facilities, the storm drain system is completely separate. Water in the storm drains receives no treatment or filtering process. This means that any pollution that gets washed into the storm drain goes directly to our creeks, rivers, bayous, and streams ultimately ending up in Galveston Bay. Examples of common storm water pollution come from construction debris, material stockpiles, automotive fluids, erosion, paints, pesticides, litter, or any other industrial and household materials. Pet waste contributes to pollution that can contaminate streams and bays and harm shellfish beds.A storm drain system’s purpose is to prevent flooding of streets and roadways by quickly and efficiently transferring rainwater into waterways. After the water has filled up the waterways, then the streets are designed to handle the overflow. Also one can try and prevent flood damage to property by eliminating grass clippings, leaves, pine needles, trash, and debris in the storm drains that can cause slow drainage or flooding. Deposit of refuse into the Authority’s storm sewer system or drainage ditches is punishable by a fine of not more than $200 for each such violation.Used oil can be taken to CLCWA’s oil recycling drop-off point located at 17507 El Camino Real. Please leave the used oil in a sealed container (to prevent spills) outside the gate in the visibly marked concrete box. Please do not drop off any other chemicals including paints, antifreeze, hazardous liquids, or other items that need disposal. CLCWA is only able to recycle oil at this time.The choice is clear and you can do your part. We all have a part to play in keeping our drainage system and our waterways clean. By understanding the problems and by being good neighbors, we can decrease storm water pollution. Please help clean up our waterways to ensure a brighter future for us all. For more information please see: www.clcwa.org/stormwater.htm
DID YOU KNOW?Water restrictions: The District is not currently under water restrictions. Although this area has received some rainfall, area water sources remain low from the long-term drought situation, placing a tremendous stress on water supplies throughout the state. We ask that all customers be mindful of their water usage and to utilize ways to conserve water. Please monitor CLCWA’s website for changes.www.clcwa.org
Pouring grease down sinks, disposals, toilets, or any other household drain can result in blocked sewer lines and costly repairs. It is a myth that hot water, soap, eggshells, coffee grounds, or other substances will keep the grease from sticking to the pipes.
Published June 2014
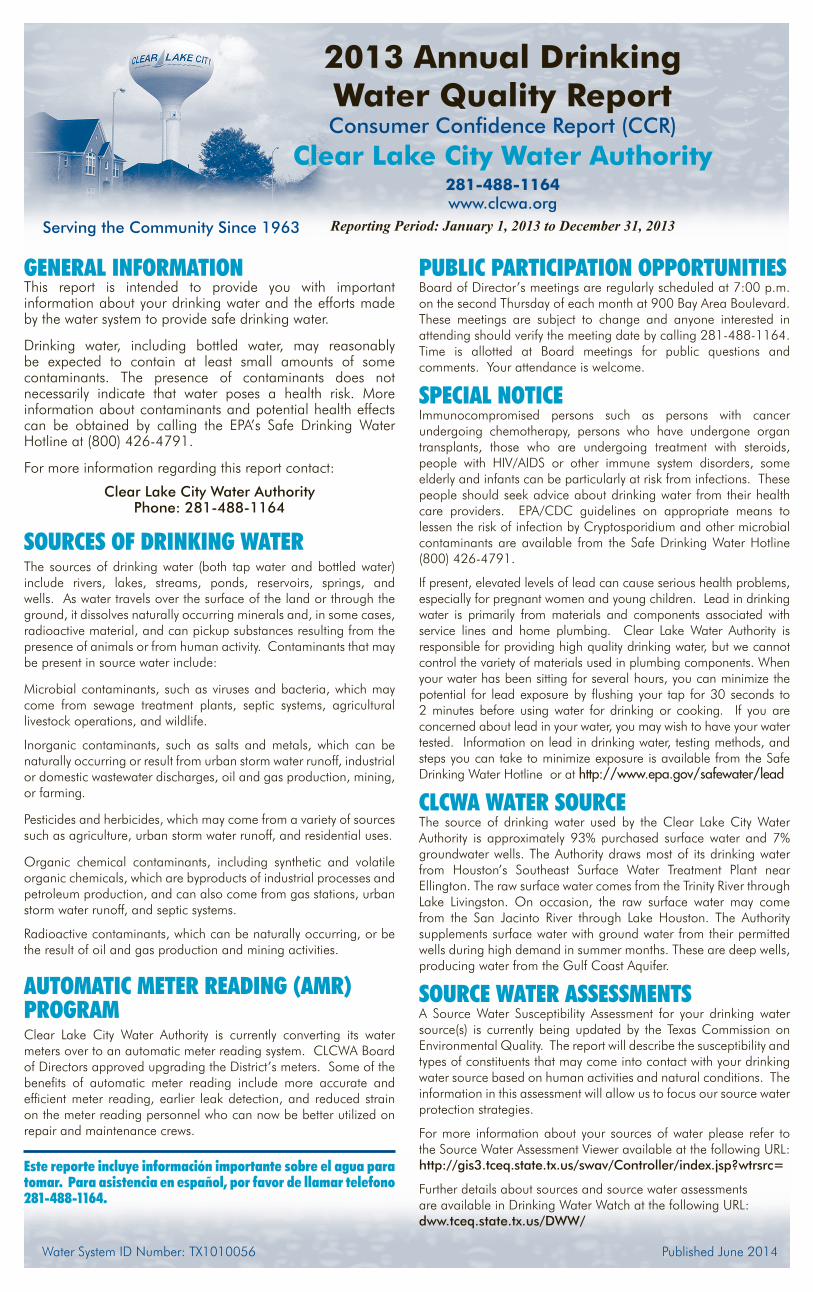
2013 Annual DrinkingWater Quality ReportConsumer Confidence Report (CCR)
Clear Lake City Water Authority281-488-1164www.clcwa.org
Serving the Community Since 1963
GENERAL INFORMATIONThis report is intended to provide you with important information about your drinking water and the efforts made by the water system to provide safe drinking water.
Drinking water, including bottled water, may reasonably be expected to contain at least small amounts of some contaminants. The presence of contaminants does not necessarily indicate that water poses a health risk. More information about contaminants and potential health effects can be obtained by calling the EPA’s Safe Drinking Water Hotline at (800) 426-4791.
For more information regarding this report contact:
Clear Lake City Water AuthorityPhone: 281-488-1164
SOURCES OF DRINKING WATERThe sources of drinking water (both tap water and bottled water) include rivers, lakes, streams, ponds, reservoirs, springs, and wells. As water travels over the surface of the land or through the ground, it dissolves naturally occurring minerals and, in some cases, radioactive material, and can pickup substances resulting from the presence of animals or from human activity. Contaminants that may be present in source water include:
Microbial contaminants, such as viruses and bacteria, which may come from sewage treatment plants, septic systems, agricultural livestock operations, and wildlife.
Inorganic contaminants, such as salts and metals, which can be naturally occurring or result from urban storm water runoff, industrial or domestic wastewater discharges, oil and gas production, mining, or farming.
Pesticides and herbicides, which may come from a variety of sources such as agriculture, urban storm water runoff, and residential uses.
Organic chemical contaminants, including synthetic and volatile organic chemicals, which are byproducts of industrial processes and petroleum production, and can also come from gas stations, urban storm water runoff, and septic systems.
Radioactive contaminants, which can be naturally occurring, or be the result of oil and gas production and mining activities.
AUTOMATIC METER READING (AMR) PROGRAMClear Lake City Water Authority is currently converting its water meters over to an automatic meter reading system. CLCWA Board of Directors approved upgrading the District’s meters. Some of the benefits of automatic meter reading include more accurate and efficient meter reading, earlier leak detection, and reduced strain on the meter reading personnel who can now be better utilized on repair and maintenance crews.
Este reporte incluye información importante sobre el agua para tomar. Para asistencia en español, por favor de llamar telefono 281-488-1164.
Reporting Period: January 1, 2013 to December 31, 2013
PUBLIC PARTICIPATION OPPORTUNITIESBoard of Director’s meetings are regularly scheduled at 7:00 p.m. on the second Thursday of each month at 900 Bay Area Boulevard. These meetings are subject to change and anyone interested in attending should verify the meeting date by calling 281-488-1164. Time is allotted at Board meetings for public questions and comments. Your attendance is welcome.
SPECIAL NOTICEImmunocompromised persons such as persons with cancer undergoing chemotherapy, persons who have undergone organ transplants, those who are undergoing treatment with steroids, people with HIV/AIDS or other immune system disorders, some elderly and infants can be particularly at risk from infections. These people should seek advice about drinking water from their health care providers. EPA/CDC guidelines on appropriate means to lessen the risk of infection by Cryptosporidium and other microbial contaminants are available from the Safe Drinking Water Hotline (800) 426-4791.
If present, elevated levels of lead can cause serious health problems, especially for pregnant women and young children. Lead in drinking water is primarily from materials and components associated with service lines and home plumbing. Clear Lake Water Authority is responsible for providing high quality drinking water, but we cannot control the variety of materials used in plumbing components. When your water has been sitting for several hours, you can minimize the potential for lead exposure by flushing your tap for 30 seconds to 2 minutes before using water for drinking or cooking. If you are concerned about lead in your water, you may wish to have your water tested. Information on lead in drinking water, testing methods, and steps you can take to minimize exposure is available from the Safe Drinking Water Hotline or at http://www.epa.gov/safewater/lead
CLCWA WATER SOURCEThe source of drinking water used by the Clear Lake City Water Authority is approximately 93% purchased surface water and 7% groundwater wells. The Authority draws most of its drinking water from Houston’s Southeast Surface Water Treatment Plant near Ellington. The raw surface water comes from the Trinity River through Lake Livingston. On occasion, the raw surface water may come from the San Jacinto River through Lake Houston. The Authority supplements surface water with ground water from their permitted wells during high demand in summer months. These are deep wells, producing water from the Gulf Coast Aquifer.
SOURCE WATER ASSESSMENTSA Source Water Susceptibility Assessment for your drinking water source(s) is currently being updated by the Texas Commission on Environmental Quality. The report will describe the susceptibility and types of constituents that may come into contact with your drinking water source based on human activities and natural conditions. The information in this assessment will allow us to focus our source water protection strategies.
For more information about your sources of water please refer to the Source Water Assessment Viewer available at the following URL: http://gis3.tceq.state.tx.us/swav/Controller/index.jsp?wtrsrc=
Further details about sources and source water assessments are available in Drinking Water Watch at the following URL: dww.tceq.state.tx.us/DWW/
Water System ID Number: TX1010056

DefinitionsThe following tables contain scientific terms and measures, some of whichmay require explanation.
Maximum Contaminant Level Goal (MCLG):The level of a contaminant in drinking water below which there is no known or expected risk to health. MCLGs allow for a margin of safety.
Maximum Contaminant Level (MCL):The highest permissible level of acontaminant that is allowed in drinkingwater. MCLs are set as close to the MCLGs as feasible using the bestavailable treatment technology.
Maximum Residual Disinfectant Level Goal (MRDLG):The level of a drinking water disinfectant below which there is no known or expect-ed risk to health. MRDLGs do not reflect the benefits of the use of disinfectants to control microbial contamination.
Maximum Residual Disinfectant Level (MRDL):The highest level of a disinfectantallowed in drinking water. There is convincing evidence that addition of a disinfectant is necessary for control of microbial contaminants.
Avg: Regulatory compliance with some MCLs are based on running annualaverage of monthly samples.
ppm: Milligrams per liter or parts per million — or one ounce in 7,350 gallons of water.
ppb: Milligrams per liter or parts perbillion — or one ounce in 7,350,000gallons of water.
na: Not applicable.
Action Level Goal (ALG):The level of a contaminant in drinkingwater below which there is no knownor expected risk to health. ALGs allowfor a margin of safety.
Action Level (AL):The concentration of a contaminant which, if exceeded, triggers treatmentor other requirements which a watersystem must follow.
About The Following TablesThe following tables list all of the federally regulated or monitored contaminants which have been found in your drinking water. The U.S. EPA requires water systems to test up to 97 contaminants. If a contaminant was reported in a prior year’s report, but is not detected in this year’s samples, that contaminant has been removed from the list.
Inorganic ContaminantsCollection
DateContaminant Highest
LevelDetected
Range of Levels Detected
MCLG MCL Unit ofMeasure
Violation Likely Source of Contaminant
2011 Arsenic 2 <2.0 na 10 ppb No Erosion of natural deposits;runoff from orchards; runoff from glass and electronics production wastes.
This arsenic MCL became effective January 23, 2006. In the event of a violation, you will be notified.
2011 Barium 0.125 0.052-0.125 2 2 ppm No
Discharge of drilling wastes;discharge from metal refineries;erosion of natural deposits.
2013 Fluoride 0.55 0.55-0.55 4 4 ppm No
Erosion of natural deposits;water additive which promotes strong teeth; discharge fromfertilizer and aluminum factories.
2013 Nitrate 0.85 0.03-0.85 10 10 ppm NoRunoff from fertilizer use; leach-ing from septic tanks, sewage; erosion of natural deposits.
2013 Nitrite 0.23 0.01-0.23 1 1 ppm NoRunoff from fertilizer use; leach-ing from septic tanks, sewage; erosion of natural deposits.
Synthetic Organic Contaminants including Pesticides and HerbicidesCollection
DateContaminant Highest
LevelDetected
Range of Levels Detected
MCLG MCL Unit ofMeasure
Violation Likely Source of Contaminant
2013 Simazine 0.14 0.09-0.14 4 4 ppb No Herbicide runoff.
2013 Atrazine 0.83 0.17-0.83 3 3 ppb No Runoff from herbicide used on row crops.
Radioactive ContaminantsCollection
DateContaminant Highest
LevelDetected
Range of Levels Detected
MCLG MCL Unit ofMeasure
Violation Likely Source of Contaminant
2011 Beta/photonemitters 4.4 4.0-4.4 0 50* pCi/L No Decay of natural and
man-made deposits.
2011Combined
Radium226 & 228
1.0 1.0-1.0 0 5 pCi/L No Erosion of natural deposits.
2011 Gross Alpha 2.0 2.0-2.0 0 15 pCi/L No Erosion of natural deposits.
*The MCL for beta particles is 4 mrem/year; however, there is no simple conversion from mrem/year to pCi/L. The EPA considers 50 pCi/L to be the level of concern for beta particles.
Abbreviationsmrem/year Millirems per year (a measure of radiation absorbed by the body)
NTU Nephelometric Turbidity Units
pCi/L picocuries per liter (a measure of radioactivity)
ppm parts per million, or milli- grams per liter (mg/L)
ppb parts per billion, or micro- grams per liter (µg/L)
ppt parts per trillion, or nanograms per liter
Disinfectants and Disinfection ByproductsCollection
DateContaminant Highest
LevelDetected
Range of Levels
Detected
MCLG MCL Unit ofMeasure
Violation Likely Source of Contaminant
2013 Total Haloacetic Acids (HAA5) 32.1 6.2-32.1 na 60 ppb No Byproduct of drinking water
disinfection.
2013 Total Trihalo-methanes (TTHM) 47.3 15.2-47.3 na 80 ppb No Byproduct of drinking water
disinfection.
Total Coliform BacteriaName of
MicrobiologicalContaminant
Total Coliform Max Contaminant
Level
Total Coliform Percentage of
Positive Samples
Highest Monthly Percentage of
Positive Samples
Total No. of Positive E.Coli or Fecal
Coliform Samples
Violation Likely Source of Contaminant
TotalColiformBacteria
Percentage of Coliform Bacteria
in more than 5% of Monthly
Samples
0
There were no TCR detections
for this system in this CCR period.
0 NoNaturally present in the environment.
Maximum Residual Disinfectant LevelCollection
DateDisinfectant Average
LevelDetected
Range of Levels
Detected
MRDLG MRDL Unit ofMeasure
Violation Likely Source of Chemical
2013 ChloramineResidual 2.79 1.0-4.0 4 4 ppm No Disinfectant used to control
microbes.

Unregulated ContaminantsThere is no maximum contaminant level for these chemicals at the entry point to distribution. Unregulated contaminants are those for which EPA has not established drinking water standards. The purpose of unregulated contaminant monitoring is to assist EPA in determining the occurrence of unregulated contaminants in drinking water and whether future regulation is warranted.
CollectionDate
Contaminant HighestLevel
Detected
Range of Levels
Detected
MCLG MCL Unitof
Measure
Likely Source of Contaminant
2011 Dibromomethane 1.0 1.0-1.0 na na ppb Byproduct of drinking water disinfection.
2013 Chloroform 23.2 8.0-23.2 na na ppb Byproduct of drinking water disinfection.
2013 Bromoform 4.2 1.0-4.2 na na ppb Byproduct of drinking water disinfection.
2013 Bromodichloromethane 16.2 5.2-16.2 na na ppb Byproduct of drinking water disinfection.
2013 Dibromochloromethane 9.5 1.8-9.5 na na ppb Byproduct of drinking water disinfection.
TurbidityTurbidity has no health effects. However, turbidity can interfere with disinfection and provide a medium for microbial growth. Turbidity may indicate the presence of disease-causing organisms. These organisms include bacteria, viruses, and parasites that can cause symptoms such as nausea, cramps, diarrhea and associated headaches.
CollectionDate
Contaminant Highest SingleMeasurement
Lowest Monthly% of SamplesMeeting Limits
Turbidity Limits
Unit ofMeasure
Likely Source of Contaminant
2013 Turbidity 0.10 100.00 0.3 NTU Soil runoff.
CLCWA WebsiteClear Lake City Water Authorityinvites you to visit its website:
www.clcwa.orgThe Drinking Water Quality
Report (Consumer Confidence Report) for years 2002 through 2012 can be accessed at the
Authority website.In addition, we have posted the Authority’s Drought Contingency Plan for the Delivery of Water to Residential (Retail) Customers. This plan, approved by TCEQ,
outlines the Authority’sregulations and restrictions onthe delivery and consumptionof water during times of water shortage or other emergency
water supply conditions.
Secondary ConstituentsMany constituents (such as calcium, sodium, or iron) which are often found in drinking water, can cause taste and odor problems. The taste and odor constituents are called secondary constituents and are regulated by the State of Texas, not the EPA. These constituents are not causes for health concern. Therefore, secondaries are not required to be reported in this document but they may greatly affect the appearance and taste of your water.
WATER CONSERVATION
QUICK WATER SAVING TIPS: Run dishwasher only when full and use the shortest cycle
necessary.
Don’t let water run continuously while washing dishes.
Scrape dishes rather than rinse.
Run the washing machine only when full and use the lowest, coolest water setting possible.
Consider high efficiency models when replacing appliances. Some washing machines can use 50-60%
less electricity, 40-50% less water, and are more effective in cleaning action. Also, up to 30% more water is removed in the spinning, reducing the drying time and saving energy.
Running water down the drain while it gets hot is a waste. Capture the cool water for plant watering, to refill pet water bowls or heat it on the stove or in a microwave.
Take short showers rather than a bath. A four minute shower uses about 8 gallons of water, while a full bath uses about 50 gallons of water.
Install reduced-flow showerheads that average 2.5 gallons a minute. The older types can average using 5-10 gallons per minute.
If you bathe, fill bathtub ½ full. You can save 18 to 25 gallons per bath.
Brushing teeth can take up to 2 gallons of water if the tap is left running during the brushing versus 1 pint to wet brush, turn off faucet, and rinse briefly.
A leaky toilet tank can waste lots of water. Put a little food coloring into the tank; if the color trickles into the bowl, repair the leak.
Check your sprinkler system often for leaks and broken sprinkler heads.
Water the yard early in the morning or in the evening to give the grass time to absorb as much as possible rather than evaporate in the heat of the mid-day.
Lead and CopperCollection
DateContaminant MCLG Action Level
(AL)The 90thPercentile
# of Sites Over AL
Unit ofMeasure
Violation Likely Source of Contaminant
2012 Lead 0 15 2.76 1 ppb NoCorrosion of household plumbing systems; erosion of natural deposits.
2012 Copper 1.3 1.3 0.442 0 ppm No
Corrosion of household plumb-ing systems; erosion of natural deposits; leaching from wood preservatives.