Embed Size (px)
Citation preview
Earnings Cash Flow Book Value
Sales Ebitda
1
51
101
151
201
Nov 12 Mar 13 Jul 13 Nov 13 Mar 14 Jul 14
Margin of Safety
-30%
-10%
10%
30%
50%
Nov 12 Mar 13 Jul 13 Nov 13 Mar 14 Jul 14
Discount / Premium to FV
Discount/Premium to FV Median DFV
-3%
22%
Sep 13 Jan 14 May 14 Sep 14
0%
25%
50%
75%
100%
Historic D
FV
FV R
ange
58.9
78.9
98.9
118.9
138.9
158.9
Optim
. / Pessim.
Margin of Safety
25
45
65
85
105
Nov-12 Mar-13 Jul-13 Nov-13 Mar-14 Jul-14
Fair Value
Price Fair Value
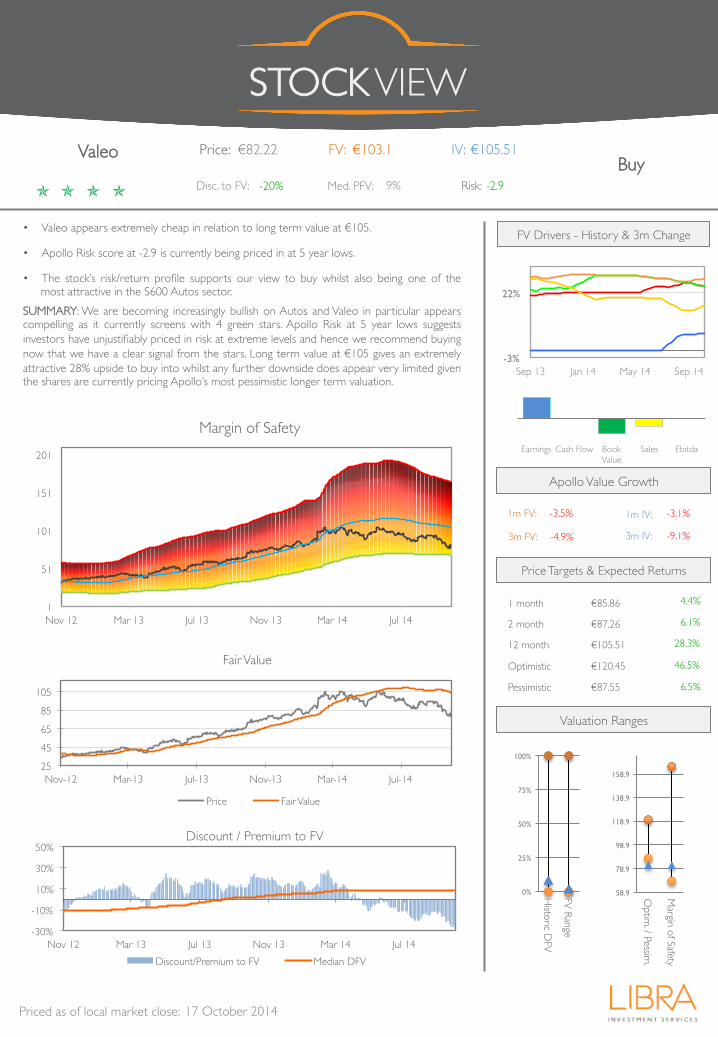
SUMMARY: We are becoming increasingly bullish on Autos and Valeo in particular appears compelling as it currently screens with 4 green stars. Apollo Risk at 5 year lows suggests investors have unjustifiably priced in risk at extreme levels and hence we recommend buying now that we have a clear signal from the stars. Long term value at €105 gives an extremely attractive 28% upside to buy into whilst any further downside does appear very limited given the shares are currently pricing Apollo’s most pessimistic longer term valuation.
17 October 2014
Price Targets & Expected Returns
Apollo Value Growth
FV Drivers - History & 3m Change • Valeo appears extremely cheap in relation to long term value at €105. • Apollo Risk score at -2.9 is currently being priced in at 5 year lows.
• The stock’s risk/return profile supports our view to buy whilst also being one of the most attractive in the S600 Autos sector.
ó ó ó ó
STOCK VIEW
€82.22 Price: €103.1 FV: €105.51 IV:
Disc. to FV: -20% Med. PFV: 9% -2.9 Risk:
1 month
2 month
Optimistic
Pessimistic
12 month
€85.86
€87.26
€120.45
€87.55
€105.51
4.4%
6.1%
46.5%
6.5%
28.3%
Valuation Ranges
1m FV:
3m FV:
-3.5%
-4.9%
1m IV:
3m IV: -9.1%
-3.1%
Buy Valeo
Priced as of local market close:
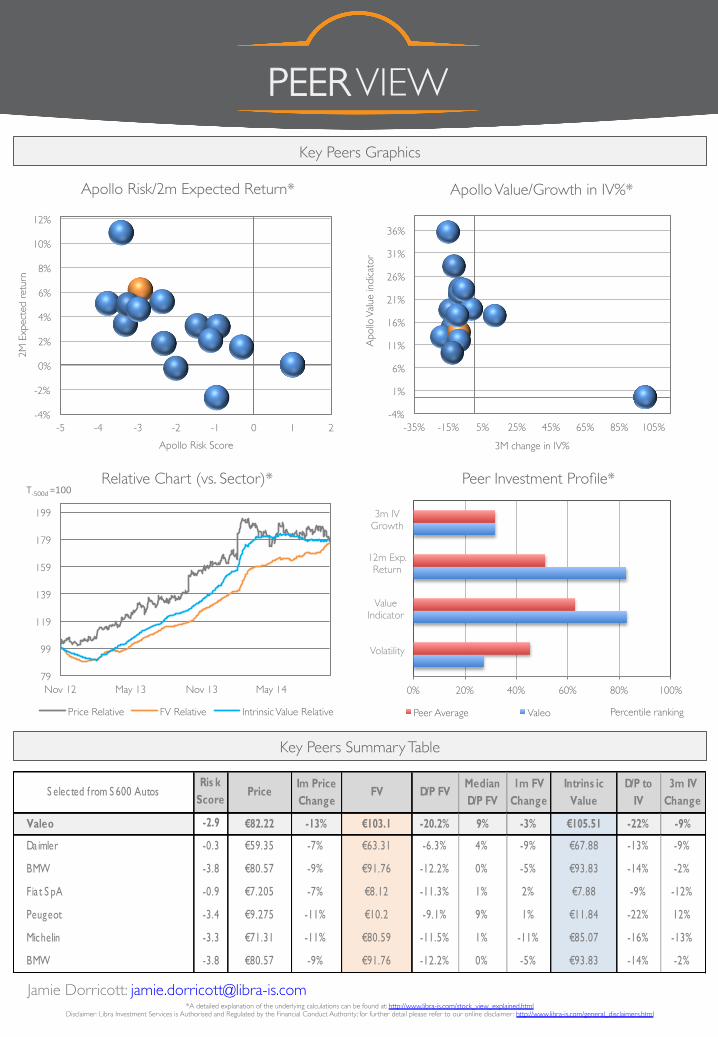
S elected f rom S 600 Autos PriceIm Price Change
FV D/P FVMedian D/P FV
1m FV Change
Intrins ic Value
D/P to IV
3m IV Change
Valeo €82.22 -13% €103.1 -20.2% 9% -3% €105.51 -22% -9%
Daimler €59.35 -7% €63.31 -6.3% 4% -9% €67.88 -13% -9%
BMW €80.57 -9% €91.76 -12.2% 0% -5% €93.83 -14% -2%
Fia t S pA €7.205 -7% €8.12 -11.3% 1% 2% €7.88 -9% -12%
Peugeot €9.275 -11% €10.2 -9.1% 9% 1% €11.84 -22% 12%
Michelin €71.31 -11% €80.59 -11.5% 1% -11% €85.07 -16% -13%
BMW €80.57 -9% €91.76 -12.2% 0% -5% €93.83 -14% -2%-3.8
Ris k Score
-2.9
-0.3
-3.8
-0.9
-3.4
-3.3
0% 20% 40% 60% 80% 100%
Percentile ranking
Peer Investment Profile*
Peer Average Valeo
79
99
119
139
159
179
199
Nov 12 May 13 Nov 13 May 14
T-‐500d =100 Relative Chart (vs. Sector)*
Price Relative FV Relative Intrinsic Value Relative
-4%
1%
6%
11%
16%
21%
26%
31%
36%
-35% -15% 5% 25% 45% 65% 85% 105%
Apo
llo V
alue
indi
cato
r
3M change in IV%
Apollo Value/Growth in IV%*
-4%
-2%
0%
2%
4%
6%
8%
10%
12%
-5 -4 -3 -2 -1 0 1 2
2M E
xpec
ted
retu
rn
Apollo Risk Score
Apollo Risk/2m Expected Return*
*A detailed explanation of the underlying calculations can be found at: http://www.libra-is.com/stock_view_explained.html Disclaimer: Libra Investment Services is Authorised and Regulated by the Financial Conduct Authority; for further detail please refer to our online disclaimer: http://www.libra-is.com/general_disclaimers.html
PEER VIEW
Key Peers Summary Table
Key Peers Graphics
3m IV Growth
12m Exp. Return
Value Indicator
Volatility
Jamie Dorricott: [email protected]