Embed Size (px)
Citation preview

Munich Personal RePEc Archive
Stock market integration and
diversification possibilities during
financial crises: Evidence from Balkan
countries
Zdravkovski, Aleksandar
one.Vip
23 June 2016
Online at https://mpra.ub.uni-muenchen.de/72182/
MPRA Paper No. 72182, posted 25 Jun 2016 16:00 UTC

Stock market integration and diversification possibilities during financial crises:
Evidence from Balkan countries
Aleksandar Zdravkovski
Controlling specialist
one.Vip, Skopje
email: [email protected]
June 2016
Abstract
This paper investigates the short- and long-term linkage among the Macedonian, Croatian,
Slovenian, Serbian, and Bulgarian equity markets during the period of 4 October 2005 to 31
December 2015. In order to assess the impact of the recent financial crises on the
interconnection among the examined Balkan stock markets, the studied period is segmented
into pre-, during, and post-crisis period. Johansen cointegration test finds no evidence of
cointegration during the pre- and post-crisis periods. However, during the latest financial crises,
the empirical findings support the existence of three cointegration vectors. This means that the
recent global financial crisis and the subsequent euro crisis strengthened the connection
between the investigated stock markets, thus decreasing the diversification possibilities that can
be acquired in these markets. Furthermore, innovation accounting analysis reveals that during
periods of financial turmoil, the Macedonian stock market is positively and actively influenced
by the Croatian and Serbian markets. A significant implication of these results is that the
integration between Balkan stock markets tends to alter over time, particularly during stages of
financial disturbances.
Keywords: Balkan stock markets, Diversification, Financial crises, Cointegration, Innovation
accounting
JEL classification: C51, G01, G11, G15

2
1. Introduction
The recent introduction of the SEE link platform with the aim of creating a regional
infrastructure for trading of securities listed on the regional Balkan stock markets inevitably
raises the question whether the Macedonian investors can really gain diversification benefits of
investing their savings in the companies that are listed on the other participating stock markets.
If a group of stock market indexes is cointegrated, there will not be any real benefits of holding
a portfolio of stocks in these countries, compared to holding stocks in just one country. This
cointegration methodology first time introduced by Engle and Granger (1987) and Johansen
(1988) has been widely used in order to study the long-term relationship between international
equity markets. A great percent of these studies have primarily concentrated on the advanced
economies and there is little or no research on the less developed Balkan countries. This paper
tries to fill this gap by examining five Balkan countries (Macedonia, Croatia, Slovenia, Serbia,
and Bulgaria) during the period of 4 October 2005 to 31 December 2015. In order to study the
impacts that the global financial crisis and the subsequent euro crisis had on the
interconnection between investigated stock markets, in the paper the studied period is divided
into three sub-periods, namely the pre-crisis, during crisis, and post-crisis period. The long-term
interdependence between considered markets is tested with the help of the Johansen
cointegration technique. Furthermore, in order to scrutinize the short-term effects that the rest
studied markets have on the Macedonian stock market, impulse responses and variance
decomposition analysis are applied.
This paper tries to examine the following three questions: First, it analyses the potential
diversification benefits that Macedonian investors can acquire by investing savings in the
Balkan stock market; Second, this paper investigates whether the long-run relationship
between Balkan equity markets changed during and after the global financial crisis and the
following euro crisis; Finally, it explores how the Macedonian stock market reacts on the short-
term to the shocks in the other four studied markets. The rest of the research paper is
structured as follows. The next section elaborates the relevant empirical literature about the
interconnection between international stock markets. Section 3 describes the data used in this

3
analysis. Section 4 explains the empirical methodology and presents the empirical results. The
final section gives conclusion remarks.
2. Review of literature
Many researchers have studied the interdependence among worldwide financial
markets. The primary focus of the earliest empirical research has been the connection between
developed equity markets. Jeon and Chiang (1991) examine the world’s four largest stock
exchanges and imply that these stock markets share one long-run equilibrium relationship. Kasa
(1992) finds evidence that a single common stochastic trend lies behind the long-run
comovement of the equity markets in the United States (US), Japan, England, Germany, and
Canada. Blackman et al. (1994) analyze the stock markets of 17 countries and record that
financial deregulation and technological changes that had happened in the early 1980s
contributed to a stronger connection among these markets in the late 1980s compared to
1970s. Masih and Masih (2001) point out to significant interdependencies between the
established OECD and the emerging Asian markets. In the following years, this research topic
has also extended on investigating the behavior of the Central and Eastern European countries.
Voronkova (2004) shows that the stock markets of Hungary, Poland, and the Czech Republic are
linked by a single, common long-run relation. In addition, she implied to the existence of
significant cointegrating relationships between these three emerging markets and each of the
developed capital markets of Britain, France, Germany, and US. This cointegration relation
between the emerging Central European countries (Poland, Czech Republic, Hungary, Slovakia)
and developed markets (Germany, US) was further confirmed by Syriopoulos (2007) in both the
pre-EMU and post-EMU period. Moreover, Syriopoulos (2011) studies six Balkan countries and
finds that both domestic and external forces affect these equity markets and shape their long-
run equilibrium path. Kenourgios and Samitas (2011) using the Johansen cointegration test
prove that the stock markets of the five examined Balkan emerging countries, US, Germany,
United Kingdom, and Greece are cointigrated. Several studies have also demonstrated that the
integration among stock markets tends to change over time, especially in times of financial
turmoil. Arshanapalli and Doukas (1993) suggest that the link between the major stock

4
exchanges has been very weak before the stock market crash that happened in October 1987,
but has substantially increased after this period. Sheng and Tu (2000) imply that there is no
cointegration relationship between the Asian-Pacific countries in the period before the Asian
financial crisis, but they found one cointegration relationship among the analyzed stock indexes
during the period of this crisis. Ratanapakorn and Sharma (2002) using cointegration analysis,
Granger causality tests, and innovation accounting analysis investigated the relationships
among stock indexes of the US, Latin America, Europe, Asia, and Eastern Europe–Middle East
for the pre-Asian crisis period and during the crisis period. They conclude that during the crisis
period, a long-run relationship is observed among these indexes and thus the regional market
efficiency hypothesis is violated during this period. Majid and Kassim (2009) focus on the
connection of the emerging Asian markets with the developed stock markets during the 2007
global financial crisis and find that the analyzed stock markets have become increasingly
cointegrated at the time of this financial crisis. Cheung et al. (2010) investigate the impact of
the 2007–2009 global financial crisis on the interrelationships among global stock markets and
document that the linkage between the US market and other global markets, both the short-
term causal relationship and long-term cointegrating equilibrium, strengthened during the
global financial crisis.
3. The data
The data sample considered in this research paper consists of daily closing prices of five
Balkan stock markets (Macedonia, Croatia, Slovenia, Serbia, and Bulgaria) for the period of 4
October 2005 to 31 December 2015, including 2655 observations. The indexes, transformed in
natural logarithms, used in the analysis are: MBI10 for Macedonian, CROBEX for Croatia,
SBITOP for Slovenia, BELEX15 for Serbia, and SOFIX for Bulgaria. A range of descriptive statistics
for the data set, which was collected from the official web sites of the analyzed stock
exchanges, is presented in the Table 1. When a national stock exchange was closed due to a
national holiday, the index level was assumed to remain the same as that on the previous
working day and all of the evaluated indexes are expressed in the national currencies.

5
Table 1. Descriptive statistics
MBI10 CROBEX SBITOP BELEX15 SOFIX
Pre-crisis period
Mean 8,209 8,007 7,190 7,322 6,947
Median 8,226 8,040 7,156 7,158 6,852
Maximum 9,019 8,545 7,855 8,103 7,384
Minimum 7,656 7,584 6,754 6,906 6,684
Standard dev. 0,387 0,302 0,290 0,395 0,202
Skewness 0,534 0,249 0,438 0,705 0,446
Kurtosis 2,123 1,858 2,233 1,962 1,660
Jarque-Bera 37,899 30,779 26,867 60,821 51,405
Probability 0,000 0,000 0,000 0,000 0,000
Observations 476 476 476 476 476
During crisis period
Mean 8,010 7,744 6,916 6,681 6,220
Median 7,837 7,633 6,802 6,504 6,013
Maximum 9,216 8,593 7,892 7,976 7,577
Minimum 7,377 7,141 6,236 5,870 5,560
Standard dev. 0,472 0,353 0,450 0,538 0,574
Skewness 1,146 1,075 0,764 1,097 1,173
Kurtosis 3,006 2,925 2,623 3,021 2,888
Jarque-Bera 283,338 249,834 133,721 259,860 297,696
Probability 0,000 0,000 0,000 0,000 0,000
Observations 1295 1295 1295 1295 1295
Post-crisis period
Mean 7,458 7,487 6,538 6.361 6,130
Median 7,455 7,480 6,540 6.360 6,149
Maximum 7,579 7,613 6,733 6,616 6,434
Minimum 7,350 7,407 6,217 6,063 5,746
Standard dev. 0,048 0,042 0,127 0,134 0,177
Skewness 0,019 0,788 -0,293 -0,404 -0,586
Kurtosis 2,125 3,394 2,218 2,404 2,629
Jarque-Bera 28,249 97,296 35,174 37,175 55,696
Probability 0,000 0,000 0,000 0,000 0,000
Observations 884 884 884 884 884
Notes: MBI10 represents the Macedonian stock market; CROBEX represents the Croatian stock market; SBITOP represents the Slovenian stock
market; BELEX15 represents the Serbian stock market; SOFIX represents the Bulgarian stock market; all of the index values are transformed into
natural logarithms
Expressing stock price indexes in domestic currencies restricts their variations exclusively to
stock price movements and avoids potential distortions induced by devaluations of the
respective exchange rates. This same method was also used in Voronkova (2004) and Kenogori
(2011). Furthermore, because most of the markets are operating in the same time zones, the
issue of non-overlapping trading hours does not considerably arise. In order to analyze the
impact of the global financial crisis and the subsequent euro crisis on the interconnection
among the analyzed equity markets, in the research paper, the examined time period is divided
into three sub-samples. The first sub-sample representing the pre-crisis period contains data
from 4 October 2005 to 6 August 2007, since it is commonly held that the first disruption of the

6
credit markets, which has happened as a result of the US sub-prime mortgage crisis, occurred
on 7 August 2007, when the French bank BNP Paribas suspended redemption of shares held in
some of its money market funds (Mishkin, 2011). The second sub-period exploring the during
crisis period spans from 7 August 2007 to 1 August 2012 when the acute phase of the euro
crisis came to an end with the introduction of the Outright Monetary Transactions program by
the Governing Council of the European Central Bank on the following day (Eichengreen, 2015).
The third sub-sample elaborates the post-crisis stage, incorporating the time period from 2
August 2012 to the end of the study period on 31 December 2015. This organizing of the data
into the above-mentioned three sub-periods is done in order to see whether the
interdependence among the stock markets has changed because of the most recent global
financial crises.
4. Methodology and empirical results
4.1. Unit root test results
In order to test the existence of stochastic non-stationarity in the data, the integration
of the individual time series is examined using two unit root tests, the Augmented Dickey-Fuller
(ADF) test, and the Phillips and Perron (PP) test. The ADF test takes the following form:
∑ (1)
Where Δ indicates the first differences of the series, Dt is a vector of deterministic terms
(constant, trend etc.), and εt is the white noise term. The null hypothesis suggests that Δyt is
I(0), which implies that π = 0, on the other hand rejection of the null hypothesis implies a
stationary series. The optimal number of lags of the dependent variable in the test regression is
based on the Schward criterion. The PP unit root test differs from the ADF test mainly in how it
deals with the serial correlation and heteroskedasticity in the error term, and its regression is
given by the following equation:
(2)
7
Notes: (1) represents model with constant (2) represents model with constant and trend; ADF-PP Critical values - with constant -3,444 at 1%,
-2,867 at 5%, -2,570 at 10%; with constant and trend -3,978 at 1%, -3,419 at 5%, -3,132 at 10%; *indicates significance at 5% significance level
Table 2 summarizes the results from the ADF and PP tests in levels as well as in first differences
of the each of the examined national stock market indexes. Panels A, B, and C of the Table 2
show the test results for the pre-crisis, during crisis, and post-crisis period, respectively. The
reported results indicate that the null hypothesis of a unit root in each of the five Balkan stock
indexes cannot be rejected. However, there is no indication to support the existence of a unit
root in first differences of the stock price indexes. In other words, the null hypothesis of a unit
root in the equity indexes is rejected at the 5% significance level by both tests for all of the
analyzed sub-periods. This finding is consistent with the widely held assumption that the
national stock index series are individually integrated of order one, I(1).
4.2. Johansen cointegration test results
Cointegration method is often used to investigate the dynamic interdependence
between financial time series. If the examined stock indexes are found to be cointegrated, then
stationary linear combinations of these variables may exist even though the variables
themselves are individually non-stationary. In other words, contegration will allow us to
Table 2. Unit root tests
ADF Test PP Test
Level First differences Level First differences
(1) (2) (1) (2) (1) (2) (1) (2)
Panel A
MBI10 1,182 -2,177 -12,058* -11,692* 1,313 -1,973 -11,891* -11,864*
CROBEX 0,812 -3,222 -19,088* -19,165* 0,616 -3,002 -19,433* -19,476*
SBITOP 1,673 -0,762 -15,827* -15,976* 2,082 -0.614 -16.624* -16,736*
BELEX15 0,410 -1,796 -15,335* -15,383* 0,605 -1,616 -15,135* -15,172*
SOFIX 1,283 -2,150 -17,870* -18,064* 1,294 -2,164 -18,072* -18,171*
Panel B
MBI10 -1,924 -1,496 -23,504* -23,543* -1,870 -1,515 -25,507* -25,236*
CROBEX -2,053 -1,627 -18,950* -18,997* -2,025 -1,586 -32,736* -32,727*
SBITOP -1,528 -1,847 -31,161* -31,170* -1,516 -1,689 -30,930* -30,924*
BELEX15 -2,257 -1,747 -25,730* -25,782* -2,248 -1,734 -25,730* -25,863*
SOFIX -1,848 -1,217 -13,922* -13,996* -1,910 -1,231 -33,447* -33,263*
Panel C
MBI10 -2,387 -2,249 -23,905* -23,919* -2,168 -2,046 -23,880* -23,888*
CROBEX -1,774 -2,388 -28,485* -28,507* -2,084 -2,626 -28,726* -28,690*
SBITOP -2,342 -1,763 -26,061* -26,129* -2,263 -1,592 -25,915* -25,946*
BELEX15 -1,892 -1,551 -25,247* -25,285* -1,956 -1,720 -25,651* -25,559*
SOFIX -2,343 -0,964 -28,286* -28,490* -2,332 -0,964 -28,263* -28,478*

8
determine whether the five Balkan stock indexes move together over the long-run, while
providing for the possibility of short-run divergence. Alternatively, the absence of cointegration
will suggest that the stock indexes involved have no long-run interdependence and can drift
arbitrarily away from each other. In order to study the long-run relationships among the
variables in the model, in the research paper is employed the Johansen multivariate
cointegration test. The Johansen procedure is based on Vector Error Correction Model (VECM)
to examine whether there is at least one long-run relationship between variables, and the
VECM is described by the subsequent equation:
(3)
where
( ) (i 1 … k-1), (4)
and
( ) (5)
The matrix Γi comprises the short-term adjustment parameters, and matrix Π contains the long-
term equilibrium relationship information between the X variables. Π is defined as the product
of two matrices, α and β’. The matrix β gives the cointegrating vectors, while α gives the
amount of each cointegrating vector entering each equation of the VECM, also known as the
“adjustment parameters”. Johansen specified two tests of the hypothesis that there are at most
r cointegrating relationships, the trace statistics (λtrace) and the maximum eigenvalue statistics
(λmax). The λtrace tests the null hypothesis of r = 0 against the alternative that r > 0. On the other
hand, the λmax test the null hypothesis that the number of cointegrating vectors is r against the
specific alternative of r + 1 cointegrating vectors. The optimal lag-length was determined by
Akaike Information Criterion (AIC). According to this test the most appropriate number of lags
for the pre-crisis period is two, for the during crisis period is three, and for the post-crisis period
is two. Next, impulse responses and variance decompositions analysis are applied. Impulse
responses trace out the responsiveness of the dependent variables in the vector autoregression
(VAR) model to shocks to each of the variables. On the other hand, variance decomposition
gives the proportion of the movements in the dependent variables that are due to their “own”
shocks, versus shocks to the other variables.

9
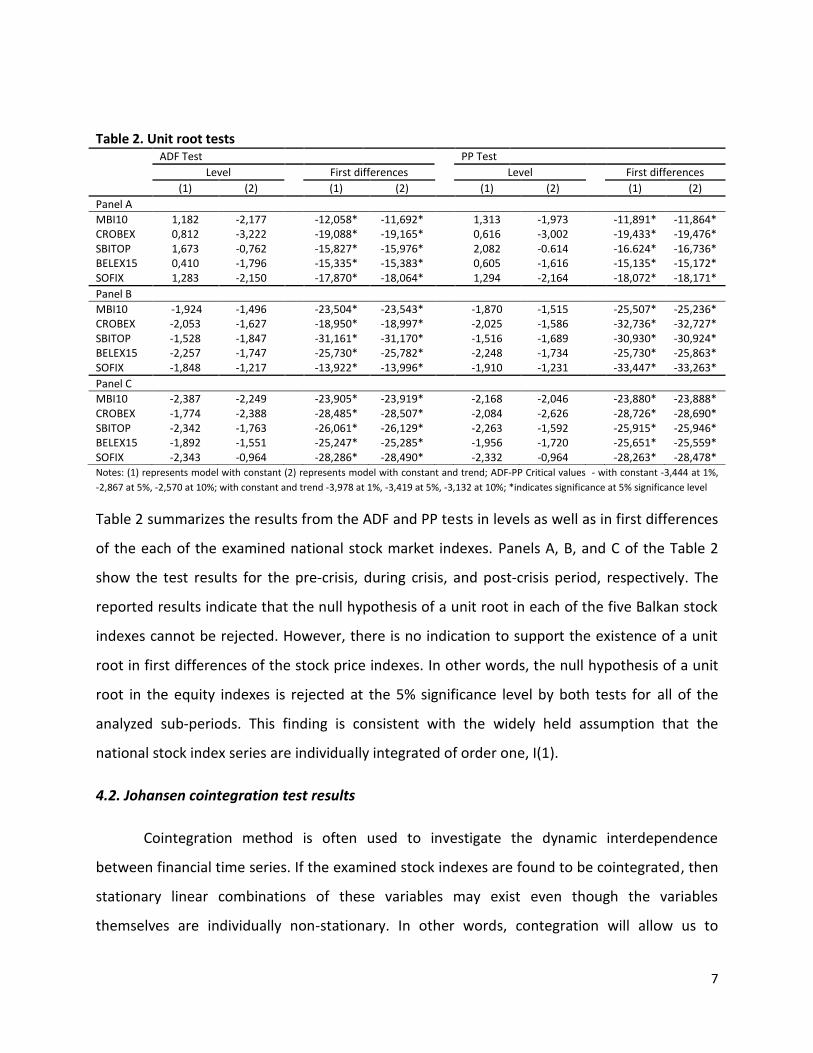
Notes: *indicates significance at 5% significance level
Because all of the analyzed time series were found to be integrated of order one, the
analysis could proceed with the Johansen test of cointegration. The results of this test are
presented in the Table 3. Panel A of the Table 3 summarizes the findings for the pre-crisis
period. As it is shown in the table, both the λtrace test and λmax test performed on the five
examined markets failed to detect cointegration during this period, since the null hypothesis of
no cointegration cannot be rejected at 5% significance level. However, during the crisis period
the null hypothesis that the Macedonian, Croatian, Slovenian, Serbian, and Bulgarian stock
markets are not cointegrated against the alternative hypothesis that there is one or more
cointegrating vectors is rejected at the 5% significance level, because the λtrace test statistics
exceeds the critical values at this level. Furthermore, this result is also confirmed by the λmax
test. Both tests also showed that there are three cointegrating vectors during this period. This
finding has serious implications from the international diversification perspective. During
periods of financial turmoil, Balkan stock markets tend to move more closely together and the
long-term benefits from the possibility of diversification by investing in these markets is
seriously mitigated. But, still there is an opportunity to exercise short-term gains by investing in
these markets. This conclusion is in line with the earlier findings, showing that at the times of
financial crises, regional stock markets lean to move together (Sheng and Tu, 2000; Majid and
Kassim, 2009). The last part of the Table 3 presents the results for the post-crisis period. In the
Table 3. Johansen cointegration test
Null Eigenvalue λtrace test Critical values Null λmax test Critical values
Panel A
r=0 0,042 54,665 69,819 r=0 20,423 33,877
r≤1 0,033 34,242 47,856 r=1 16,013 27,584
r≤2 0,023 18,229 29,797 r=2 10,825 21,132
r≤3 0,013 7,404 15,495 r=3 6,162 14,265
r≤4 0,003 1,242 3,841 r=4 1,242 3,841
Panel B
r=0 0,039 124,333* 69,819 r=0 51,612* 33,877
r≤1 0,028 72,721* 47,856 r=1 36,665* 27,584
r≤2 0,024 36,056* 29,797 r=2 30,736* 21,132
r≤3 0,004 5,320 15,495 r=3 4,967 14,265
r≤4 0,000 0,353 3,841 r=4 0,353 3,841
Panel C
r=0 0,037 65,546 69,819 r=0 33,055 33,877
r≤1 0,018 32,490 47,856 r=1 16,068 27,584
r≤2 0,009 16,422 29,797 r=2 8,018 21,132
r≤3 0,007 8,403 15,495 r=3 6,039 14,265
r≤4 0,003 2,365 3,841 r=4 2,365 3,841

10
post-crisis period the long-term relationship that thrived during the crisis period seems to
disappear, as the null hypothesis of no cointegration cannot be rejected at the 5% significance
level.
4.3. Innovation accounting analysis
In the following part of the research paper, the results from the short-term relationship
between MBI10 and the other four studied stock markets during the period of the latest
financial crises are presented. First, the outcome of the variance decomposition analysis is
exhibited. This test gives information about the percent of the forecasted error variance of
MBI10 that can be attributed to the changes in the other four Balkan stock indexes. Table 4
summarizes the findings of the conducted variance decomposition analysis. As it can be
concluded from the table, at the 6 day time horizon, 88,31% of the Macedonian stock index
variance can be attributed to its own movements. This percent gradually declines, and after 24
days the Macedonian stock index accounts for 64,34% of its own changes. Furthermore, at this
time period, a substantial fraction of the MBI10 variance is associated with CROBEX and
BELEX15 innovations, meaning that these stock markets actively influenced the Macedonian
stock market during the period of the global financial crisis and the following euro crisis.
Impulse responses pursue the reaction of the dependent variables in the VAR to shocks
to each of the variables. So, for each variable from each equation separately, a unit shock is
applied to the error, and the effects upon the VAR system over time are noted (Brooks, 2014).
The test results of the impulse responses functions of Croatian, Slovenian, Serbian, and
Bulgarian stock markets on the Macedonian stock market during the examined financial crises
are exposed in the Figure 1. During this period, the impact of a shock of the
Table 4. Variance decomposition analysis
Horizon (days) Percentage of forecast error variance by innovations in:
MBI10 CROBEX SBITOP BELEX15 SOFIX
6 88,305 9,905 0,062 1,521 0,207
12 80,527 13,149 0,376 5,135 0,813
18 72,470 15,134 1,088 9,680 1,627
24 64,336 16,739 2,039 14,307 2,579

11
MBI10 has immediate and consistent positive effect that does not die away even after the 24
day time horizon. A disruption to the both CROBEX and BELEX15 has positive and constant
influence on the MBI10. At the beginning, a shock to SBITOP as well as to SOFIX does not have a
steady impact on the MBI10, but after 11 days this effect translates into a positive impact. Also,
all of the shocks in the system are constant during the whole analyzed 24 day time frame.
Figure 1. Impulse responses analysis in the during crisis period
Response of MBI10 to MBI10 Response of MBI10 to CROBEX
Response of MBI10 to SBITOP Response of MBI10 to BELEX 15
Response of MBI10 to SOFIX

12
5. Conclusion
This research paper scrutinizes the short- and long-term relationship among the
Macedonian, Croatian, Slovenian, Serbian, and Bulgarian equity markets. In order to investigate
the possible consequences that the global financial crisis and the subsequent euro crisis might
have on the linkage among the considered stock markets, the investigated time frame is divided
into three sub-periods, particularly, the pre-crisis, during crisis, and post-crisis period. Next, the
Johansen cointegration test is employed to inquiry the long-run comovement between the
examined Balkan stock markets. This test fails to find evidences of cointegration relationships
among the markets during the pre- and post-crisis stages. However, there are evidences of
cointegration among Macedonian, Croatian, Slovenian, Serbian, and Bulgarian stock markets
during the crisis period. So, during periods of financial turbulences these Balkan stock markets
tend to become more integrated and the market efficiency hypothesis is seriously put into
question. From a perspective of Macedonian investors, this means that there possibilities to
gain diversification benefits of investing savings in the other four investigated stock markets are
vigorously diminished. Furthermore, during periods of financial disturbances a considerable
fraction of the MBI10 forecasted error variance can be attributed to innovations in CROBEX and
BELEX15. In other words, on the short-term Macedonian stock markets is considerably
influenced by the Croatian and Serbian equity markets. Also, at times of financial crisis, shocks
to CROBEX and BELEX15 have positive and constant influence on the MBI10. These results
further strengthen the hypothesis that during periods of financial crises, regional markets
become increasingly integrated with each other.

13
References
Arshanapalli, A., & Doukas, J., 1993. International stock market linkages: Evidence from the pre-
and post-October 1987 period. Journal of Banking and Finance, 17, 193–208.
Blackman, S.C., Holden, K., & Thomas, W.A., 1994. Long-term relationships between
international share prices. Applied Financial Economics, 4, 297–304
Brooks, C., 2014. Introductory Econometrics for Finance. 3rd edition. Cambridge University
Press
Cheung, W., Fung, S., & Tsai, S.-C., 2010. Global capital market interdependence and spillover
effect of credit risk: evidence from the 2007-2009 global financial crisis. Applied Financial
Economics, 20(1), 85–103
Eichengreen, B., 2015. How the euro crisis ends: Not with a bang but a whimper. Journal of
Policy Modeling, 37(3), 415-422
Engle, R. F., & Granger, C. W. J., 1987. Co-integration and error correction: Representation,
estimation and testing. Econometrica, 55, 251– 276
Jeon, B.N., & Chiang, T.C., 1991. A system of stock prices in world stock exchanges: Common
stochastic trends for 1975–1990? Journal of Economics and Business, 43, 329–338
Johansen, S., 1988. Statistical analysis of cointegration vectors. Journal of Economic Dynamics
and Control, 12, 231–254
Johansen, S., & Juselius, K., 1990. Maximum likelihood estimation and inference on
cointegration with application to the demand for money. Oxford Bulletin of Economics and
Statistics, 52, 169-210
Kasa, K., 1992. Common stochastic trends in international stock markets. Journal of Monetary
Economics, 95–124
Kenourgios, D., & Samitas, A., 2011. Equity Market Integration in Emerging Balkan Markets.
Research in International Business and Finance, 25, 296–307
Majid, A. M. S., & Kassim, S. H., 2009. Impact of the 2007 US financial crisis on the emerging
equity markets. International Journal of Emerging Markets, 4(4), 341-357
Masih, R., & Masih, A. M. M., 2001. Long and short term dynamic causal transmission amongst
international stock markets. Journal of International Money and Finance, 20, 563-587

14
Mishkin, F., 2011. Over the cliff: from the subprime to the global financial crisis. Journal of
Economic Perspectives, 25(1), 49-70
Ratanapakorna, O., & Sharma, S. C., 2002. Interrelationships among Regional Stock Indices.
Review of Financial Economics, 11, 91–108
Sheng, H., & Tu, A., 2000. A study of cointegration and variance decomposition among national
equity indices before and during the period of the Asian financial crisis. Journal of Multinational
Financial Management, 10, 345-365
Syriopoulos, T., 2007. Dynamic linkages between emerging European and developed stock
markets: has the EMU any impact? International Review of Financial Analysis, 16, 41-60
Syriopoulos, T., 2011. Financial integration and portfolio investments to emerging Balkan equity
markets. Journal of Multinational Financial Management, 21, 40-54
Voronkova, S., 2004. Equity market integration in Central European emerging markets: a
cointegration analysis with shifting regimes. International Review of Financial Analysis, 13, 633–647