Embed Size (px)
Citation preview
ORIGINALARTICLE
When are adaptive radiations replicatedin areas? Ecological opportunity andunexceptional diversification in WestIndian dipsadine snakes (Colubridae:Alsophiini)
Frank T. Burbrink1,2*, Sara Ruane1,2 and R. Alexander Pyron3
1Department of Biology, The Graduate School
and University Center, The City University of
New York, 365 5th Avenue, New York, NY
10016, USA, 2Department of Biology, The
College of Staten Island, The City University of
New York, 2800 Victory Boulevard, Staten
Island, NY 10314, USA, 3Department of
Biological Sciences, The George Washington
University, 2023 G Street NW, Washington,
DC, 20052, USA
*Correspondence: Frank T. Burbrink, Biology
Department, 6S-143, 2800 Victory Boulevard,
College of Staten Island/CUNY, Staten Island,
NY 10314, USA.
E-mail: [email protected]
ABSTRACT
Aim We examine diversification in Caribbean alsophiine snakes and hypothesize
that, given the ecological opportunity presented by colonization of the West
Indies, alsophiines should show the signature of an early burst of diversification
and associated low within-clade ecological and morphological disparification. We
also test whether changes in morphology and ecology are associated with changes
in diversification rate, as trait-dependent diversification is hypothesized to affect
historical inferences of diversification and disparification. Finally, as replicated
radiations are found across the West Indies in the anoles, we test for significant
differences in ecological and morphological assemblages and rates among the
major island groups.
Location The West Indies.
Methods A time-calibrated phylogeny produced from six genes using relaxed
clock methods in beast was constructed to estimate ancestral areas using
Lagrange. Maximum body size and ecological niche were scored for all species
in the phylogeny, and comparative phylogenetic methods in R using geiger,
laser, ape and our own code were used to examine diversification through time,
disparification and trait-dependent diversification from this dated phylogeny.
Results The pattern of species diversification did not differ significantly from the
Yule model of diversification. Morphology and ecology fitted a Brownian and
white noise model of diversification, respectively. Although not significantly
different, morphological disparification was lower than the Brownian null model,
whereas ecological disparification was significantly greater than the null. Trait-
dependent diversification analyses suggested that the constant null models
provided the best fit to these data. There was no significant signal of rate variation
among the major island groups for size, but moderate evidence for niche.
Main conclusions Although ecological opportunity was similarly present for
alsophiines as it was for anoles, the snakes fail to show an early burst of
speciation. Potential reasons for this include the young age of the group, and
staggered diversification due to waiting times between island colonization. In
turn, ecological and morphological disparities do not necessarily follow
predictable patterns related to species diversification. Thus, the presence of
ecological opportunity alone is not necessarily sufficient to trigger replicated
adaptive radiations in areas.
Keywords
Adaptive radiation, Alsophiini, Colubridae, ecological opportunity, island
biogeography, snakes, West Indies.
Journal of Biogeography (J. Biogeogr.) (2012) 39, 465–475
ª 2011 Blackwell Publishing Ltd http://wileyonlinelibrary.com/journal/jbi 465doi:10.1111/j.1365-2699.2011.02621.x
INTRODUCTION
An adaptive radiation is identified as the rapid diversification
of descendants from a common ancestor into open niche
space. This is typically thought to be triggered when a lineage
encounters significant ecological opportunity generated by: (1)
the colonization of new areas, (2) the extinction of compet-
itors, or (3) the development of a key innovation (Simpson,
1953; Schluter, 2000; Losos, 2010; Yoder et al., 2010). Many of
the most famous examples of adaptive radiation come from
islands, such as finches in the Galapagos, or Anolis lizards in
the West Indies, where invasion of an island system has led to
the development of numerous species with different eco-
morphologies, each with adaptations to exploit various
habitats and trophic niches along gradients of ecological space
(Losos & Ricklefs, 2009). One particular insight gained from
studying diversification on islands in anoles is that a distinct
set of ecomorphs is replicated on major islands, having evolved
in situ on each from a single colonization event (Losos et al.,
1998). This suggests that deterministic processes may drive
adaptive radiations, at least in part, yielding similar outcomes
when similar niches are invaded in geographically distinct
areas (Schluter, 2000).
The specific outcome of an adaptive radiation, such as the
particular Anolis ecomorphs, may be unique to those individ-
ual groups (Losos, 2009). However, the general pattern of
rapid radiation yielding a variety of species and ecomorphs
may be general to a region given ecological opportunity, even if
different groups produce different kinds of ecomorphs. Thus,
for any area where ecological opportunity is present, we can
ask if multiple groups in that region show characteristic signs
of adaptive radiation. If unrelated groups demonstrate similar
patterns of adaptive radiation, this suggests that these patterns
may be commonly replicated in areas containing similar
spectra of open niche space, providing a general biogeograph-
ical outline for exceptional speciation. However, there have
been relatively few tests of adaptive radiation across multiple
unrelated groups in regions known to present significant
ecological opportunity. Rigorous tests on the tempo and mode
of diversification through time regarding speciation, morphol-
ogy and ecological niche are therefore required across groups
inhabiting the same region in order to understand the
generality of ecological opportunity.
If ecological opportunity was present at the origin of the
group, the rate of diversification is likely to be elevated early
and to decrease later as niches become saturated with
competitors (Rabosky & Lovette, 2008a). In taxa that experi-
ence early bursts of diversification, the partitioning of mor-
phological disparity through time, also known as
disparification (Evans et al., 2009), is likely to be low,
indicating that individuals within subclades are similar to
each other, yet distinct from those of other clades (Harmon
et al., 2003, 2008a; Kozak et al., 2005; Burbrink & Pyron,
2010). Ecological disparification should show similar patterns,
as morphological adaptations often correspond to ecological
diversification (Luxbacher & Knouft, 2009). In the West
Indies, Anolis lizards represent the classic scenario, whereby
ecological opportunity resulting from island colonization
resulted in early bursts of diversification and morphological
disparification, replicated on the major island groups (Har-
mon et al., 2003; Losos, 2009). Here, we examine diversifica-
tion and disparification in another diverse Caribbean squamate
group – the alsophiine snakes (Henderson & Powell, 2009;
Pyron et al., 2011) – to determine if they show a similar
pattern to Anolis, indicative of broad-scale geographical
replication in the forces leading to adaptive radiation in the
West Indies.
Alsophiines are a monophyletic clade of snakes found
throughout the West Indies, including both the Greater and
the Lesser Antilles (Maglio, 1970; Hedges et al., 2009), and are
part of the larger subfamily Dipsadinae, the largest snake
radiation in the world (Pyron & Burbrink, 2011; Pyron et al.,
2011). They are represented by at least 43 morphologically
diverse species that range in maximum size from 207 to
2000 mm, and almost all exhibit striking morphological
adaptations to a slender ground-, tree-, or bush-dwelling
racer-form body shape (Henderson & Powell, 2009). The
dipsadines are likely to have originated in the Oligocene, and
the alsophiines diversified after the mid-Miocene (Burbrink &
Pyron, 2008; Hedges et al., 2009).
The colonization of the West Indies by alsophiines therefore
occurred after the break-up of the hypothesized mid-Cenozoic
Aves Ridge (c. 33–35 Ma) or earlier proto-Antillean land
masses of the Cretaceous. This suggests a strong role for
dispersal throughout the isolated islands of the Greater Antilles
and the volcanic islands comprising the Lesser Antilles
(Hedges, 2006; Iturralde-Vinent, 2006). For alsophiine snakes,
the Caribbean as a whole thus represents a massive, ecolog-
ically diverse region, comprising 230,000 km2 of land area
(Woods & Sergile, 2001) with almost no competition from
other colubrids, which are naturally absent from the Greater
Antilles and restricted to a few species in the Lesser Antilles
(Henderson & Powell, 2009). Thus, the alsophiines probably
encountered significant ecological opportunity, which is asso-
ciated with adaptive radiation in anoles and numerous other
squamates (Harmon et al., 2003; Burbrink & Pyron, 2010).
Here, we address several of the main questions relating to
diversification and disparification in order to examine the
potential impact of ecological opportunity on the alsophiines.
We ask whether, given the possibility of ecological opportu-
nity, alsophiines show the typical pattern of an early burst of
diversification. Arising from this, we also ask whether this
pattern of diversification is associated with low morphological
and ecological disparity. Following from these questions, we
determine whether changes in morphology or ecology are
associated with changes in diversification rate, as trait-depen-
dent diversification may alternately affect historical inferences
of diversification and disparification. Finally, as replicated
radiations are found across the Caribbean islands in the anoles,
we test for significant differences in ecological and morpho-
logical assemblages and rates among the major island groups.
In contrast to the case for Anolis, there is little evidence to
F. T. Burbrink et al.
466 Journal of Biogeography 39, 465–475ª 2011 Blackwell Publishing Ltd
suggest that the alsophiines show any exceptional patterns of
diversification in the West Indies, or any differences among the
major island groups. This study supplies crucial evidence
regarding patterns of diversification in the Caribbean with
respect to the ties between morphological/ecological disparity
and patterns of species diversification, providing an interesting
null model for the study of adaptive radiation through
ecological opportunity in island regions.
MATERIALS AND METHODS
Phylogeny, divergence times and ancestral area
estimation
To estimate the phylogeny and divergence times, we
re-analysed the DNA sequence dataset from Hedges et al.
(2009). Of the 43 described alsophiine species, our dataset
includes DNA sequences from 35 (81%), and we note that four
taxa have gone extinct in modern times (Henderson & Powell,
2009). In addition, our dataset includes the dipsadine
outgroups Leptodeira annulata and Heterodon platirhinos,
and the colubrine Coluber constrictor (see Appendix S1 in the
Supporting Information). Models of substitution were chosen
using Bayesian information criterion (BIC) in jModelTest
(Posada, 2008) for the following genes used in this study: 12S
(313 bp; HKY+C+I), 16S (382 bp; GTR+C+I), cytochrome b
(cyt b) (609 bp; GTR+C+I), ND2 (735 bp; GTR+C+I), ND4
(678 bp; GTR+C+I) and RAG2 (678 bp; GTR+C). The final
matrix was 3423 bp in length, and all genes represented at least
34 (90%) species, yielding little missing data.
We used the relaxed phylogenetic method implemented in
beast 1.6.1 to infer a time-calibrated tree with node support
(Drummond et al., 2006; Drummond & Rambaut, 2007). Two
analyses were run for 25 million generations using an
uncorrelated lognormal rate distribution under a birth–death
process. This yielded an estimated sample size (ESS) > 200
(indicating stationarity; Drummond et al., 2006) for all
parameters after discarding the first 2.5 million generations
as burn-in and combining the runs, for a total of 45 million
generations. The XML code for the phylogenetic and diver-
gence dating analyses are available from Dryad: doi:10.5061/
dryad.03kb7.
To produce a chronogram, we used two calibrations with
lognormal distribution priors, one at the root of the tree, and
the other at the stem-group age of the monophyletic clade of
Hypsirhynchus from Jamaica (Hedges et al., 2009). The first
was set at a mean of 33 Ma (lognormal = 3.496) and with a
lognormal standard deviation (SD) of 0.4 [95% prior credible
interval (PCI) = 15–72 Ma], which yields a range equivalent
to the likely time horizon of the family Colubridae (Burbrink
& Pyron, 2008; Vidal et al., 2009). The second calibration,
with a mean of 10 Ma (lognormal = 2.3) and SD of 0.5 (95%
PCI = 3.74–26.58), corresponds to the earliest possible emer-
gence of Jamaica (Iturralde-Vinent, 2006; Hedges et al., 2009).
These priors are equivalent to previous analyses (Hedges et al.,
2009). To better understand the progression of the coloniza-
tion of islands, we used Lagrange 2.01 (Ree et al., 2005; Ree
& Smith, 2008) to estimate ancestral areas across the time-
calibrated tree. Species were coded to one of six regions: Cuba,
Hispaniola, Jamaica, Puerto Rico, the Lesser Antilles and the
mainland (for the outgroup species only). The root was fixed
at the mainland, ancestral areas and dispersal probabilities
were unconstrained, and rates of dispersal and extinction were
constant and equal among areas (but see Rabosky & Glor,
2010 for a discussion of more complex biogeographical
models).
Species diversification through time
We used the time-calibrated tree to test for the signal of early
explosive diversification in the alsophiines. Using the R
packages (R Development Core Team, 2011) ape, geiger
and laser (Paradis et al., 2004; Rabosky, 2006; Harmon et al.,
2008b), we calculated a number of statistics associated with
tree shape. We first generated a lineage-through-time (LTT)
plot, and calculated the lineage diversification index (LDI)
indicating the deviation of the empirical LTT line from the
expectation under a pure-birth process (Harmon et al., 2003).
We also generated the 95% confidence intervals (CIs) for the
LTT line under the empirical pure-birth process to determine
if the observed LDI was significant through time (e.g. Rabosky
& Lovette, 2008a). The code for performing these analyses in R
is available on request from R.A.P. While these analyses do not
explicitly account for the missing taxa in the group, they
provide a rough estimate for assessing deviations from a pure-
birth process based on the sampled species (see Burbrink &
Pyron, 2010).
Second, we calculated Pybus and Harvey’s c (Pybus &
Harvey, 2000) to test for explosive early diversification. This
statistic measures the density of ordered inter-node distances
on a phylogeny, to determine if they are evenly distributed
(c = 0; pure-birth), clustered early (negative c; early burst), or
clustered late (positive c; late burst or high early extinction).
As the tree represents an incompletely sampled phylogeny
(n = 35; see Cusimano & Renner, 2010), we applied the
Monte Carlo randomization in the laser package (mccr-
Test.rd) to generate 5000 null phylogenies produced under a
Yule process with the total number of alsophiine taxa
(n = 43). This will allow us to determine if the value of cfrom the incomplete tree differs significantly from the null
expectation compared to the randomized values generated by
trimming fully sampled trees. Errors can also arise from
under-parameterized models of sequence evolution (Revell
et al., 2005), but we have accounted for this here through
rigorous model-testing.
In addition, we determined the empirical distribution of
c-values from the completely sampled phylogeny by randomly
placing the missing taxa within the clade of affiliated genera.
The mccrTest.rd procedure in laser assumes that the place-
ment of taxa throughout the tree is random and does not take
into account phylogenetic affinities (see discussion in Brock
et al., 2011), here determined by inclusion into existing genera.
Diversification in West Indian dipsadines
Journal of Biogeography 39, 465–475 467ª 2011 Blackwell Publishing Ltd
Our strategy places each missing taxon onto a branch within its
genus. For instance, given one missing species of Arrhyton
from our analysis, Arrhyton ainictum, our code would
randomly place it on a branch within the clade of existing
Arrhyton, with the probability of placement weighted by
branch length, including the stem group. This procedure was
conducted 100 times simultaneously for all missing taxa:
Alsophis antiguae, Alsophis sanctonum, Arrhyton ainictum,
Borikenophis sanctaecrucis, Hypsirhynchus ater, Hypsirhynchus
melanichnus, Ialtris agyrtes and Ialtris parishi. The value of cwas then calculated for all 100 trees, and a distribution was
constructed to determine if the 95% CI included significantly
negative values. The code for performing this procedure in R is
available on request from R.A.P.
We also determined if the rate of diversification remained
constant over time (Yule process), changed over time accord-
ing to a two- or three-rate Yule process, or decreased in
accordance with either of the two diversity-dependent models
(DDL = linear decrease, DDX = exponential decrease), by
fitting these models in laser. We also simulated 1000
completely sampled trees under a Yule model and produced
a distribution of the differences between the values of the
Akaike information criterion corrected for small sample size
(AICc) of the best rate-constant and best rate-variable models.
Our values of these differences were compared with the 95%
CI of this distribution to determine if the difference in AIC
between our rate-constant and rate-variable models were
significantly larger than the distribution of differences pro-
duced under the null Yule model (Rabosky & Lovette, 2008a).
Finally, we tested three models of diversification using laser:
SPVAR permits speciation to vary over time, EXVAR permits
extinction to vary over time, and BOTHVAR allows both to
vary over time (Rabosky & Lovette, 2008b). However, without
additional external information about extinction, results from
these models must be interpreted cautiously (Rabosky, 2010).
Morphological and ecological disparification
Ecomorphologically diverse groups of snakes tend to show the
greatest difference on a size axis as measured by snout–vent
length, SVL (Vitt, 1987; Pyron & Burbrink, 2009a). As snakes
have indeterminate growth, we used log-transformed maxi-
mum SVL in all species of alsophiine, following values
presented in Henderson & Powell (2009). These snakes range
in maximum SVL from the miniature Arrhyton vittatum
(207 mm) in Cuba to the massive Haitiophis anomalus
(2000 mm) in Hispaniola.
For ecological data, we extracted climatic data from the
WorldClim dataset, which comprises the 19 BioClim variables
that describes averages and seasonal variation in temperature
and precipitation at 30-s resolution (Hijmans et al., 2005),
from 401 points of all 35 sampled species throughout the West
Indies. Occurrences were obtained from museum or published
records, primarily from the HerpNet database. Points with
GPS data were used ‘as is’; all other records were georeferenced
to the locality provided. All localities were examined for
concordance with known localities and ranges for the species
from the CaribHerp database (http://www.caribherp.org/) and
are available in Appendix S1. We performed principal com-
ponents analysis (PCA) to reduce ecological variation to its
primary components (Pyron & Burbrink, 2009b). We used
phylogenetically corrected PCA (Revell, 2009) on the correla-
tion matrix of the species means to remove evolutionary
dependence from the principal components, excluding BIO3
and BIO7, which are linear combinations of other variables
and thus multicollinear.
First, we determined the optimal model of trait evolution
for size and niche (PC1) by fitting a series of increasingly
complex models (sensu Harmon et al., 2010). We tested
Brownian motion, Ornstein–Uhlenbeck and early burst mod-
els, the most commonly tested models for species trait data
(see Harmon et al., 2010). As a null model to test for the
potential existence of niche conservatism, we also used a white
noise model, a non-phylogenetic model in which all species
values are drawn from a single multivariate normal distribu-
tion with shared mean and variance across species (Sheets &
Mitchell, 2001; Hunt, 2007; Kozak & Wiens, 2010). Finally, we
implemented a special case of the AC/DC model, which allows
Brownian motion rates to increase or decrease exponentially
through time (Blomberg et al., 2003). The early burst model is
an AC/DC submodel (derived in Harmon et al., 2010) that
allows rates to decrease exponentially through time (negative
rate parameter r); here, we implemented a model in which
rates increase exponentially (positive r), producing a ‘late
burst’ model of trait evolution. For both size and niche, we
chose the model with the lowest AICc value. The code for
testing the late burst model in R is available in Appendix S2.
Second, we examined morphological and ecological dispar-
ity partitioning through time (DTT) by modifying the code in
geiger (Harmon et al., 2008b). Disparity was calculated using
the average squared Euclidean distance among all pairs of
points in our trees for log-transformed SVL and PC1 of
ecological niche. The values from our estimated tree were
compared with a null model composed of 1000 simulations
under multivariate Brownian motion. The trend for alsoph-
iines was compared against this null model by calculating the
morphological (or ecological) disparity index (MDI/EDI). This
provides a measure of divergence from the median line of the
null model, with positive values indicating that disparity is
greater than expected and negative values indicating that
disparity is less than expected. Negative disparity indicates that
morphological and ecological variation is partitioned among
subclades, each of which occupies a distinct island in state
space. Disparity values significantly greater than the null
suggest that subclades overlap, and all contain a significant
proportion of variation found throughout the entire group at a
given time. The code was altered to derive 95% CIs from the
null simulations around the median estimates, and to calculate
the 95% CI from the posterior distribution of trees (100
samples). This permits us to determine if DTT is significantly
higher or lower than the null model, as well as whether the
variability in the posterior distribution represents a significant
F. T. Burbrink et al.
468 Journal of Biogeography 39, 465–475ª 2011 Blackwell Publishing Ltd
portion of the total variance. The code for performing this test
is available on request from R.A.P.
Third, to determine if different island groups produce
significantly different morphological or ecological assemblages,
we used SVL and ecological niche (PC1) data to conduct a
phylogenetic ANOVA, where the grouping variable was defined
as the five major West Indies island groups defined in the
ancestral area analyses (Garland et al., 1993; Harmon et al.,
2008b). This method reduces inflated degrees of freedom by
accounting for phylogenetic history and producing a null test
distribution based on 1000 simulated sets of dependent
variables under a Brownian motion model. If island groups
differed significantly, this would indicate that the island groups
of different area, and presumably varying niche space, pro-
duced different ecomorphological assemblages, as is observed
in the anoles (Losos et al., 1998; Losos & Schluter, 2000).
We also tested for significant differences in rates of evolution
in size and niche among the major island groups. We present a
simple test for biogeographical variation in rates, analogous to
the censored-rates test of BROWNIE (O’Meara et al., 2006).
We created pruned subtrees containing only the taxa in each of
the five major island groups (Cuba, Hispaniola, Jamaica, Lesser
Antilles and Puerto Rico), and fit separate Brownian motion
models for size and niche to each subtree. The likelihoods for
these subtrees were summed and compared with the single-rate
Brownian motion model for each trait using AICc. This test
compares a model in which rates vary among regions with a
model in which they are biogeographically invariant. The code
for this test is available in Appendix S2.
Trait-dependent diversification
Finally, we tested for trait-dependent diversification related to
body size and ecological niche in the alsophiines using the
recently developed Quantitative State Speciation and Extinc-
tion (QuaSSE) algorithm (FitzJohn, 2010), implemented in the
R package diversitree. This algorithm takes a phylogeny and
set of trait measurements for the tip species, and fits a series of
birth–death models in which the speciation and extinction
probabilities vary along branches as a function of the trait
values. This allows for a comparison of models in which
diversification and trait evolution are independent with those
in which rates of diversification are directly affected by trait
values. We used the log-transformed measurements of max-
imum body size (SVL) and ecological niche (PC1) for the 35
alsophiine species, with a generic SD of 1/20 (see FitzJohn,
2010), and the proportion of sampled species (0.81), to
account for missing taxa. We fitted models in which speciation
rates were a constant, linear, sigmoidal, and hump-shaped
function of body size and niche. These were compared using
AIC values to determine the best-fit model for the data.
Starting values for optimizations were the maximum likelihood
(ML) estimates of initial rates and parameters, and mean trait
values. Given issues with power for detecting and estimating
extinction from molecular phylogenies (FitzJohn, 2010; Rab-
osky, 2010), we did not test extinction-variable models.
RESULTS
Phylogeny, divergence times and ancestral areas
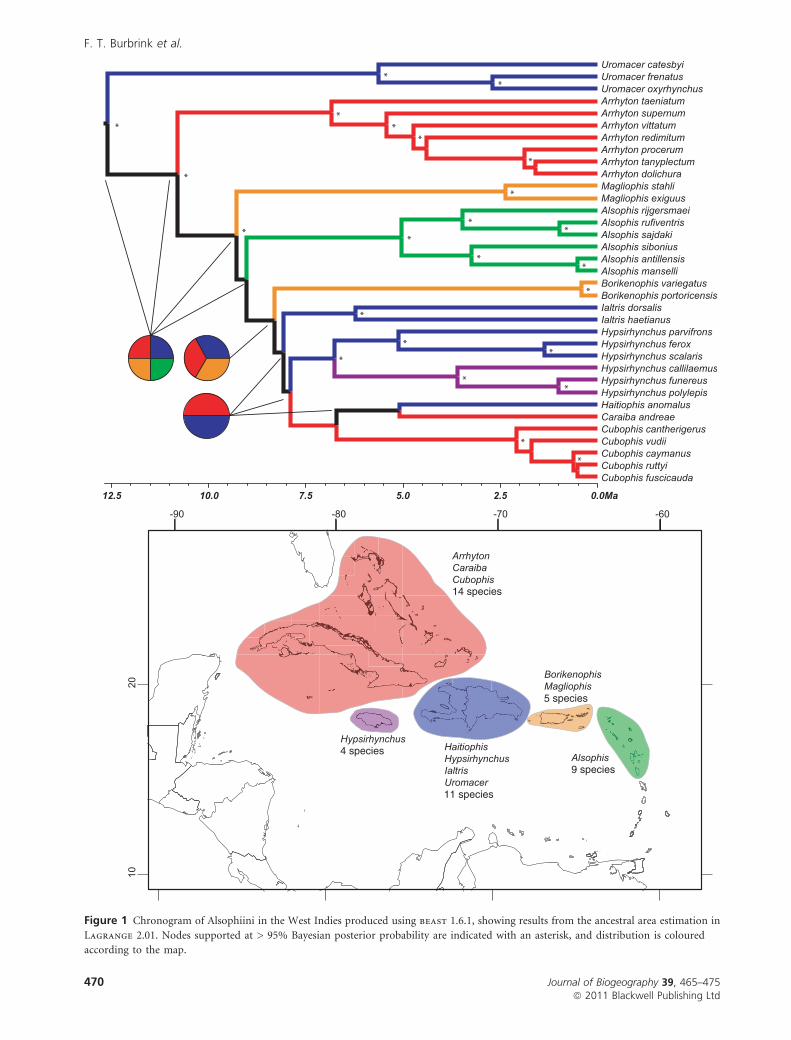
The tree topology, support and dates are all highly concor-
dant with previous analyses (Hedges et al., 2009), which
justifies previous taxonomic conclusions (Fig. 1). The origin
and diversification of the alsophiines in the West Indies
occurred from the mid-Miocene to the Pleistocene. Ancestral
area results yielded a log likelihood of )lnL = 43.73 at the
root node, with dispersal and extinction probabilities of
0.005745 and 0.00692, respectively. The most likely ancestral
areas at the deepest nodes include (or are equivocal regard-
ing) most areas in the West Indies except Jamaica, which was
apparently colonized by Hypsirhynchus only after that island
emerged in the late Miocene (Fig. 1). For nodes with more
than one reconstructed area, it is difficult to determine
without external evidence from our phylogeny (e.g. fossils,
geology) if a widespread ancestor occupied more than one
major island, or whether the phylogeny simply lacks signal for
resolving the range. It appears that Hispaniola, Cuba and
Puerto Rico were all colonized more than once, and it seems
very likely that the Lesser Antilles and Jamaica were each
colonized only once.
Species diversification through time
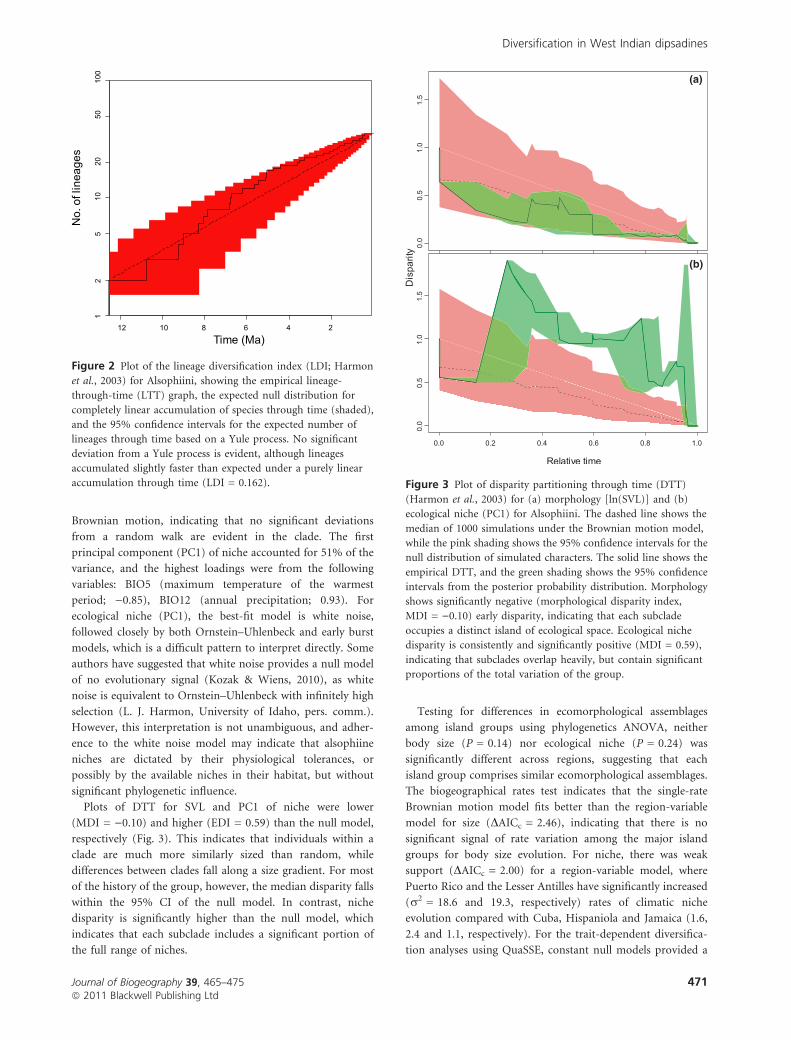
The LTT plot indicates a slight early accumulation of species
relative to the pure-birth expectation (LDI = 0.16), although
this does not appear to be significant based on the 95% CI
under the null Yule model (Fig. 2). The c-value from our
tree was )1.54 (Fig. 2). From the 5000 simulations including
the eight missing taxa produced under a pure-birth model
using the mccrTest (Rabosky, 2006), the critical value that
indicates a bias towards early diversification is )1.70, and
our empirical value is thus not significantly negative
(P = 0.065). Furthermore, our tests using the random
placement of the missing taxa within their appropriate
genera yielded a range of c from )2.0 to )0.5, which
encompasses the significance threshold of )1.70, but cannot
reject much lower values. The difference in AIC between the
best rate-constant (Yule) and rate-variable (DDL) models of
diversification for our tree was 1.43. This is not significantly
different from the distribution of AIC differences between
rate-constant and rate-variable models simulated under a
Yule model (P = 0.11). Finally, the lowest AIC among
models that consider variable speciation and extinction was
SPVAR (AIC = 0.28), indicating decreasing speciation with
constant extinction. These lines of evidence suggest that
diversification in alsophiines approximately followed a pure-
birth (Yule) process (see Appendix S3).
Morphological and ecological evolution
Species data and model fitting results are given in Appen-
dix S3. The best-fit trait model for body size (SVL) is
Diversification in West Indian dipsadines
Journal of Biogeography 39, 465–475 469ª 2011 Blackwell Publishing Ltd
*
*
**
**
*
*
*
**
*
**
*
*
*
**
*
**
*
*
9 species
11 species
5 species
4 species
14 species
Figure 1 Chronogram of Alsophiini in the West Indies produced using beast 1.6.1, showing results from the ancestral area estimation in
Lagrange 2.01. Nodes supported at > 95% Bayesian posterior probability are indicated with an asterisk, and distribution is coloured
according to the map.
F. T. Burbrink et al.
470 Journal of Biogeography 39, 465–475ª 2011 Blackwell Publishing Ltd
Brownian motion, indicating that no significant deviations
from a random walk are evident in the clade. The first
principal component (PC1) of niche accounted for 51% of the
variance, and the highest loadings were from the following
variables: BIO5 (maximum temperature of the warmest
period; )0.85), BIO12 (annual precipitation; 0.93). For
ecological niche (PC1), the best-fit model is white noise,
followed closely by both Ornstein–Uhlenbeck and early burst
models, which is a difficult pattern to interpret directly. Some
authors have suggested that white noise provides a null model
of no evolutionary signal (Kozak & Wiens, 2010), as white
noise is equivalent to Ornstein–Uhlenbeck with infinitely high
selection (L. J. Harmon, University of Idaho, pers. comm.).
However, this interpretation is not unambiguous, and adher-
ence to the white noise model may indicate that alsophiine
niches are dictated by their physiological tolerances, or
possibly by the available niches in their habitat, but without
significant phylogenetic influence.
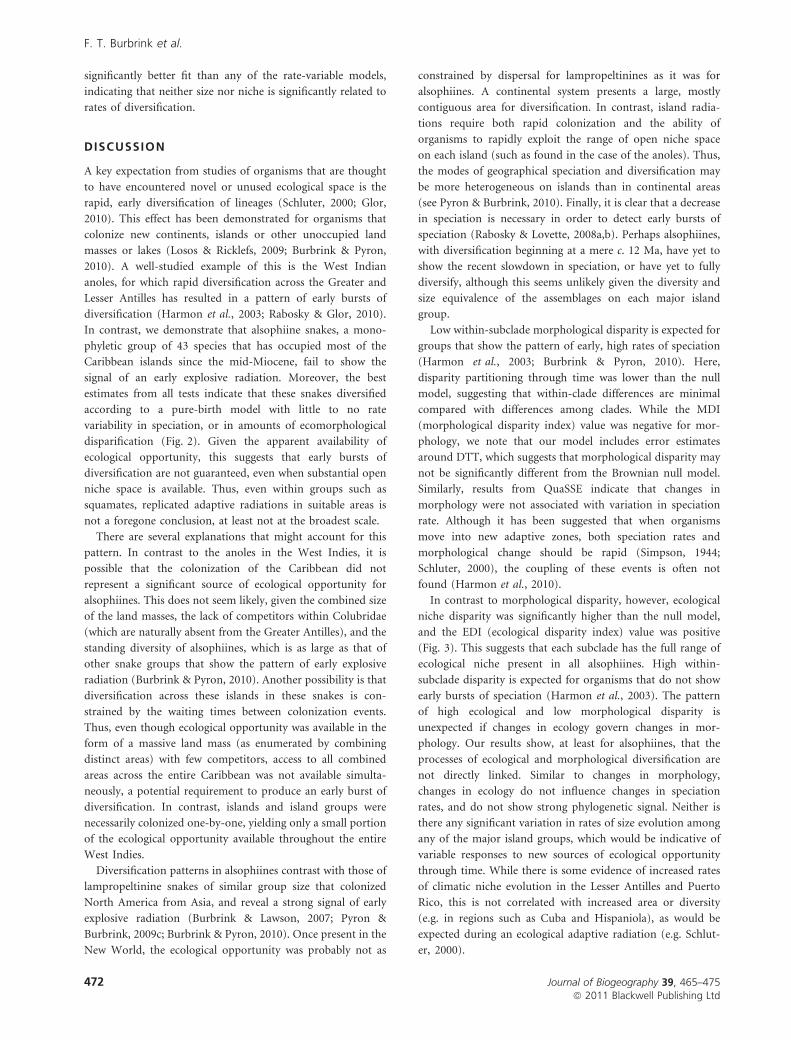
Plots of DTT for SVL and PC1 of niche were lower
(MDI = )0.10) and higher (EDI = 0.59) than the null model,
respectively (Fig. 3). This indicates that individuals within a
clade are much more similarly sized than random, while
differences between clades fall along a size gradient. For most
of the history of the group, however, the median disparity falls
within the 95% CI of the null model. In contrast, niche
disparity is significantly higher than the null model, which
indicates that each subclade includes a significant portion of
the full range of niches.
Testing for differences in ecomorphological assemblages
among island groups using phylogenetics ANOVA, neither
body size (P = 0.14) nor ecological niche (P = 0.24) was
significantly different across regions, suggesting that each
island group comprises similar ecomorphological assemblages.
The biogeographical rates test indicates that the single-rate
Brownian motion model fits better than the region-variable
model for size (DAICc = 2.46), indicating that there is no
significant signal of rate variation among the major island
groups for body size evolution. For niche, there was weak
support (DAICc = 2.00) for a region-variable model, where
Puerto Rico and the Lesser Antilles have significantly increased
(r2 = 18.6 and 19.3, respectively) rates of climatic niche
evolution compared with Cuba, Hispaniola and Jamaica (1.6,
2.4 and 1.1, respectively). For the trait-dependent diversifica-
tion analyses using QuaSSE, constant null models provided a
Figure 2 Plot of the lineage diversification index (LDI; Harmon
et al., 2003) for Alsophiini, showing the empirical lineage-
through-time (LTT) graph, the expected null distribution for
completely linear accumulation of species through time (shaded),
and the 95% confidence intervals for the expected number of
lineages through time based on a Yule process. No significant
deviation from a Yule process is evident, although lineages
accumulated slightly faster than expected under a purely linear
accumulation through time (LDI = 0.162).
(a)
(b)
Figure 3 Plot of disparity partitioning through time (DTT)
(Harmon et al., 2003) for (a) morphology [ln(SVL)] and (b)
ecological niche (PC1) for Alsophiini. The dashed line shows the
median of 1000 simulations under the Brownian motion model,
while the pink shading shows the 95% confidence intervals for the
null distribution of simulated characters. The solid line shows the
empirical DTT, and the green shading shows the 95% confidence
intervals from the posterior probability distribution. Morphology
shows significantly negative (morphological disparity index,
MDI = )0.10) early disparity, indicating that each subclade
occupies a distinct island of ecological space. Ecological niche
disparity is consistently and significantly positive (MDI = 0.59),
indicating that subclades overlap heavily, but contain significant
proportions of the total variation of the group.
Diversification in West Indian dipsadines
Journal of Biogeography 39, 465–475 471ª 2011 Blackwell Publishing Ltd
significantly better fit than any of the rate-variable models,
indicating that neither size nor niche is significantly related to
rates of diversification.
DISCUSSION
A key expectation from studies of organisms that are thought
to have encountered novel or unused ecological space is the
rapid, early diversification of lineages (Schluter, 2000; Glor,
2010). This effect has been demonstrated for organisms that
colonize new continents, islands or other unoccupied land
masses or lakes (Losos & Ricklefs, 2009; Burbrink & Pyron,
2010). A well-studied example of this is the West Indian
anoles, for which rapid diversification across the Greater and
Lesser Antilles has resulted in a pattern of early bursts of
diversification (Harmon et al., 2003; Rabosky & Glor, 2010).
In contrast, we demonstrate that alsophiine snakes, a mono-
phyletic group of 43 species that has occupied most of the
Caribbean islands since the mid-Miocene, fail to show the
signal of an early explosive radiation. Moreover, the best
estimates from all tests indicate that these snakes diversified
according to a pure-birth model with little to no rate
variability in speciation, or in amounts of ecomorphological
disparification (Fig. 2). Given the apparent availability of
ecological opportunity, this suggests that early bursts of
diversification are not guaranteed, even when substantial open
niche space is available. Thus, even within groups such as
squamates, replicated adaptive radiations in suitable areas is
not a foregone conclusion, at least not at the broadest scale.
There are several explanations that might account for this
pattern. In contrast to the anoles in the West Indies, it is
possible that the colonization of the Caribbean did not
represent a significant source of ecological opportunity for
alsophiines. This does not seem likely, given the combined size
of the land masses, the lack of competitors within Colubridae
(which are naturally absent from the Greater Antilles), and the
standing diversity of alsophiines, which is as large as that of
other snake groups that show the pattern of early explosive
radiation (Burbrink & Pyron, 2010). Another possibility is that
diversification across these islands in these snakes is con-
strained by the waiting times between colonization events.
Thus, even though ecological opportunity was available in the
form of a massive land mass (as enumerated by combining
distinct areas) with few competitors, access to all combined
areas across the entire Caribbean was not available simulta-
neously, a potential requirement to produce an early burst of
diversification. In contrast, islands and island groups were
necessarily colonized one-by-one, yielding only a small portion
of the ecological opportunity available throughout the entire
West Indies.
Diversification patterns in alsophiines contrast with those of
lampropeltinine snakes of similar group size that colonized
North America from Asia, and reveal a strong signal of early
explosive radiation (Burbrink & Lawson, 2007; Pyron &
Burbrink, 2009c; Burbrink & Pyron, 2010). Once present in the
New World, the ecological opportunity was probably not as
constrained by dispersal for lampropeltinines as it was for
alsophiines. A continental system presents a large, mostly
contiguous area for diversification. In contrast, island radia-
tions require both rapid colonization and the ability of
organisms to rapidly exploit the range of open niche space
on each island (such as found in the case of the anoles). Thus,
the modes of geographical speciation and diversification may
be more heterogeneous on islands than in continental areas
(see Pyron & Burbrink, 2010). Finally, it is clear that a decrease
in speciation is necessary in order to detect early bursts of
speciation (Rabosky & Lovette, 2008a,b). Perhaps alsophiines,
with diversification beginning at a mere c. 12 Ma, have yet to
show the recent slowdown in speciation, or have yet to fully
diversify, although this seems unlikely given the diversity and
size equivalence of the assemblages on each major island
group.
Low within-subclade morphological disparity is expected for
groups that show the pattern of early, high rates of speciation
(Harmon et al., 2003; Burbrink & Pyron, 2010). Here,
disparity partitioning through time was lower than the null
model, suggesting that within-clade differences are minimal
compared with differences among clades. While the MDI
(morphological disparity index) value was negative for mor-
phology, we note that our model includes error estimates
around DTT, which suggests that morphological disparity may
not be significantly different from the Brownian null model.
Similarly, results from QuaSSE indicate that changes in
morphology were not associated with variation in speciation
rate. Although it has been suggested that when organisms
move into new adaptive zones, both speciation rates and
morphological change should be rapid (Simpson, 1944;
Schluter, 2000), the coupling of these events is often not
found (Harmon et al., 2010).
In contrast to morphological disparity, however, ecological
niche disparity was significantly higher than the null model,
and the EDI (ecological disparity index) value was positive
(Fig. 3). This suggests that each subclade has the full range of
ecological niche present in all alsophiines. High within-
subclade disparity is expected for organisms that do not show
early bursts of speciation (Harmon et al., 2003). The pattern
of high ecological and low morphological disparity is
unexpected if changes in ecology govern changes in mor-
phology. Our results show, at least for alsophiines, that the
processes of ecological and morphological diversification are
not directly linked. Similar to changes in morphology,
changes in ecology do not influence changes in speciation
rates, and do not show strong phylogenetic signal. Neither is
there any significant variation in rates of size evolution among
any of the major island groups, which would be indicative of
variable responses to new sources of ecological opportunity
through time. While there is some evidence of increased rates
of climatic niche evolution in the Lesser Antilles and Puerto
Rico, this is not correlated with increased area or diversity
(e.g. in regions such as Cuba and Hispaniola), as would be
expected during an ecological adaptive radiation (e.g. Schlut-
er, 2000).
F. T. Burbrink et al.
472 Journal of Biogeography 39, 465–475ª 2011 Blackwell Publishing Ltd
Although ecological opportunity might be expected to yield
predictable patterns across many organisms in the same
region, we show that deterministic patterns within areas may
not be the general rule. Whether this particular case is due to
a lack of deterministic processes driving adaptive radiations
in areas or to various historical contingencies is unclear.
While the anoles of the West Indies represent the gold
standard for examining adaptive radiation and show the
defining signal of early bursts of speciation, this pattern is not
replicated among another diverse group of squamates,
alsophiine snakes, even though ecological opportunity was
likely to have been present and has been shown to trigger
rapid diversification in similar assemblages (Burbrink &
Pyron, 2010). Thus, the question is: will additional compar-
ative studies of diverse groups in similar regions yield similar
signals of diversification, or do historical contingencies and
the peculiarities of the biology of each organism (e.g.
dispersal ability, range size, competition) preclude a unified
pattern from occurring across groups? Further comparative
study in a geographical and ecological context is needed to
understand the general deterministic processes governing the
interaction between adaptive radiations and ecological oppor-
tunity among areas.
ACKNOWLEDGEMENTS
We thank R. Glor for discussions about Caribbean biogeog-
raphy and divergence dating in the region, and J. Sadler, M.
Ebach, L. Harmon and one anonymous referee for comments
that substantially improved this paper. We also thank F.
Iommi, T. Butler, J. Osbourne and W. Ward for inspiration.
This research was funded in part by US NSF grant DBI-
0905765 awarded to R.A.P.
REFERENCES
Blomberg, S.P., Garland, T. & Ives, A.R. (2003) Testing for
phylogenetic signal in comparative data: behavioral traits are
more labile. Evolution, 57, 717–745.
Brock, C.D., Harmon, L.J. & Alfaro, M.E. (2011) Testing for
temporal variation in diversification rates when sampling is
incomplete and nonrandom. Systematic Biology, 60, 410–
419.
Burbrink, F.T. & Lawson, R. (2007) How and when did Old
World ratsnakes disperse into the New World? Molecular
Phylogenetics and Evolution, 43, 173–189.
Burbrink, F.T. & Pyron, R.A. (2008) The taming of the skew:
estimating proper confidence intervals for divergence dates.
Systematic Biology, 57, 317–328.
Burbrink, F.T. & Pyron, R.A. (2010) How does ecological
opportunity influence rates of speciation, extinction, and
morphological diversification in New World ratsnakes (tribe
Lampropeltini)? Evolution, 64, 934–943.
Burbrink, F.T. & Pyron, R.A. (2011) The impact of gene-tree/
species-tree discordance on diversification rate estimation.
Evolution, 65, 1851–1861.
Cusimano, N. & Renner, S.S. (2010) Slowdowns in diversifi-
cation rates from real phylogenies may not be real. Sys-
tematic Biology, 59, 458–464.
Drummond, A.J. & Rambaut, A. (2007) BEAST: Bayesian
evolutionary analysis by sampling trees. BMC Evolutionary
Biology, 7, 214.
Drummond, A.J., Ho, S.Y.W., Phillips, M.J. & Rambaut, A.
(2006) Relaxed phylogenetics and dating with confidence.
PLoS Biology, 4, 699–710.
Evans, M.E.K., Smith, S.A., Flynn, R.S. & Donoghue, M.J.
(2009) Climate, niche evolution, and diversification of the
‘‘bird-cage’’ evening primroses (Oenothera, sections Anogra
and Kleinia). The American Naturalist, 173, 225–240.
FitzJohn, R.G. (2010) Quantitative traits and diversification.
Systematic Biology, 59, 619–633.
Garland, T., Dickerman, A.W., Janis, C.M. & Jones, J.A. (1993)
Phylogenetic analysis of covariance by computer simulation.
Systematic Biology, 42, 265–292.
Glor, R.E. (2010) Phylogenetic insights on adaptive radiation.
Annual Review of Ecology, Evolution, and Systematics, 41,
251–270.
Harmon, L.J., Schulte, J.A., Larson, A. & Losos, J.B. (2003)
Tempo and mode of evolutionary radiation in iguanian
lizards. Science, 301, 961–964.
Harmon, L.J., Melville, J., Larson, A. & Losos, J.B. (2008a) The
role of geography and ecological opportunity in the diver-
sification of day geckos (Phelsuma). Systematic Biology, 57,
562–573.
Harmon, L.J., Weir, J.T., Brock, C.D., Glor, R.E. & Challenger,
W. (2008b) GEIGER: investigating evolutionary radiations.
Bioinformatics, 24, 129–131.
Harmon, L.J., Losos, J.B., Davies, T.J., Gillespie, R.G., Gittle-
man, J.L., Jennings, W.B., Kozak, K.H., McPeek, M.A.,
Moreno-Roark, F., Near, T.J., Purvis, A., Ricklefs, R.E.,
Schluter, D., Schulte, J.A., II, Seehausen, O., Sidlauskas, B.L.,
Torres-Carvajal, O., Weir, J.T. & Mooers, A.O. (2010) Early
bursts of body size and shape evolution are rare in com-
parative data. Evolution, 64, 2385–2396.
Hedges, S.B. (2006) Paleogeography of the antilles and origin
of West Indian terrestrial vertebrates. Annals of the Missouri
Botanical Garden, 93, 231–244.
Hedges, S.B., Couloux, A. & Vidal, N. (2009) Molecular phy-
logeny, classification, and biogeography of West Indian
racer snakes of the tribe Alsophiini (Squamata, Dipsadidae,
Xenodontinae). Zootaxa, 2067, 1–28.
Henderson, R.W. & Powell, R. (2009) Natural history of West
Indian reptiles and amphibians. University Press of Florida,
Gainesville, FL.
Hijmans, R.J., Cameron, S.E., Parra, J.L., Jones, P.G. & Jarvis,
A. (2005) Very high resolution interpolated climate surfaces
for global land areas. International Journal of Climatology,
25, 1965–1978.
Hunt, G. (2007) The relative importance of directional change,
random walks, and stasis in the evolution of fossil lineages.
Proceedings of the National Academy of Sciences USA, 104,
18,404–18,408.
Diversification in West Indian dipsadines
Journal of Biogeography 39, 465–475 473ª 2011 Blackwell Publishing Ltd
Iturralde-Vinent, M.A. (2006) Meso-Cenozoic Caribbean
paleogeography: implications for the historical biogeogra-
phy of the region. International Geology Review, 48, 791–827.
Kozak, K.H. & Wiens, J.J. (2010) Niche conservatism drives
elevational diversity patterns in Appalachian salamanders.
The American Naturalist, 176, 40–54.
Kozak, K.H., Larson, A.A., Bonett, R.M. & Harmon, L.J. (2005)
Phylogenetic analysis of ecomorphological divergence,
community structure, and diversification rates in dusky
salamanders (Plethodontidae: Desmognathus). Evolution, 59,
2000–2016.
Losos, J.B. (2009) Lizards in an evolutionary tree: the ecology of
adaptive radiation in anoles. University of California Press,
Berkeley, CA.
Losos, J.B. (2010) Adaptive radiation, ecological opportunity,
and evolutionary determinism. The American Naturalist,
175, 623–639.
Losos, J.B. & Ricklefs, R.E. (2009) Adaptation and diversifi-
cation on islands. Nature, 457, 830–836.
Losos, J.B. & Schluter, D. (2000) Analysis of an evolutionary
species–area relationship. Nature, 408, 847–850.
Losos, J.B., Jackman, T.R., Larson, A., de Queiroz, K. &
Rodriguez-Schettino, L. (1998) Contingency and determin-
ism in replicated adaptive radiations of island lizards. Sci-
ence, 279, 2115–2118.
Luxbacher, A.M. & Knouft, J.H. (2009) Assessing concurrent
patterns of environmental niche and morphological evolu-
tion among species of horned lizards (Phrynosoma). Journal
of Evolutionary Biology, 22, 1669–1678.
Maglio, V.J. (1970) West Indian xenodontine colubrid snakes:
their probable origin, phylogeny, and zoogeography. Bulletin
of the Museum of Comparative Zoology, 141, 1–54.
O’Meara, B.C., Ane, C., Sanderson, M.J. & Wainwright, P.C.
(2006) Testing for different rates of continuous trait evo-
lution using likelihood. Evolution, 60, 922–933.
Paradis, E., Claude, J. & Strimmer, K. (2004) APE: analyses of
phylogenetics and evolution in R language. Bioinformatics,
20, 289–290.
Posada, D. (2008) jModelTest: phylogenetic model averaging.
Molecular Biology and Evolution, 25, 1253–1256.
Pybus, O.G. & Harvey, P.H. (2000) Testing macro-evolution-
ary models using incomplete molecular phylogenies.
Proceedings of the Royal Society B: Biological Sciences, 267,
2267–2272.
Pyron, R.A. & Burbrink, F.T. (2009a) Body size as a primary
determinant of ecomorphological diversification and the
evolution of mimicry in the lampropeltinine snakes (Ser-
pentes: Colubridae). Journal of Evolutionary Biology, 22,
2057–2067.
Pyron, R.A. & Burbrink, F.T. (2009b) Can the tropical con-
servatism hypothesis explain temperate species richness
patterns? An inverse latitudinal biodiversity gradient in the
New World snake tribe Lampropeltini. Global Ecology and
Biogeography, 18, 406–415.
Pyron, R.A. & Burbrink, F.T. (2009c) Neogene diversification
and taxonomic stability in the snake tribe Lampropeltini
(Serpentes: Colubridae). Molecular Phylogenetics and Evo-
lution, 52, 524–529.
Pyron, R.A. & Burbrink, F.T. (2010) Hard and soft allopatry:
physically and ecologically mediated modes of geographic
speciation. Journal of Biogeography, 37, 2005–2015.
Pyron, R.A. & Burbrink, F.T. (2011) Extinction, ecological
opportunity, and the origins of global snake diversity. Evo-
lution, 64, 934–943.
Pyron, R.A., Burbrink, F.T., Colli, G.R., Montes De Oca, A.N.,
Vitt, L.J., Kuczynski, C.A. & Wiens, J.J. (2011) The phy-
logeny of advanced snakes (Colubroidea), with discovery of
a new subfamily and comparison of support methods for
likelihood trees. Molecular Phylogenetics and Evolution, 58,
329–342.
R Development Core Team (2011) R: a language and envi-
ronment for statistical computing. R Foundation for Statis-
tical Computing, Vienna, Austria. Available at: http://
www.R-project.org/.
Rabosky, D.L. (2006) LASER: a maximum likelihood toolkit
for detecting temporal shifts in diversification rates from
molecular phylogenies. Evolutionary Bioinformatics, 2, 247–
250.
Rabosky, D.L. (2010) Extinction rates should not be estimated
from molecular phylogenies. Evolution, 64, 1816–1824.
Rabosky, D.L. & Glor, R.E. (2010) Equilibrium speciation
dynamics in a model adaptive radiation of island lizards.
Proceedings of the National Academy of Sciences USA, 107,
22,178–22,183.
Rabosky, D.L. & Lovette, I.J. (2008a) Density-dependent
diversification in North American wood warblers. Proceed-
ings of the Royal Society B: Biological Sciences, 275, 2363–
2371.
Rabosky, D.L. & Lovette, I.J. (2008b) Explosive evolutionary
radiations: decreasing speciation or increasing extinction
through time? Evolution, 62, 1866–1875.
Ree, R.H. & Smith, S.A. (2008) Maximum likelihood inference
of geographic range evolution by dispersal, local extinction,
and cladogenesis. Systematic Biology, 57, 4–14.
Ree, R.H., Moore, B.R., Webb, C.O. & Donoghue, M.J. (2005)
A likelihood framework for inferring the evolution of geo-
graphic range on phylogenetic trees. Evolution, 59, 2299–
2311.
Revell, L.J. (2009) Size-correction and principal components
for interspecific comparative studies. Evolution, 63, 3258–
3268.
Revell, L.J., Harmon, L.J. & Glor, R.E. (2005) Underparame-
terized model of sequence evolution leads to bias in the
estimation of diversification rates from molecular phyloge-
nies. Systematic Biology, 54, 973–983.
Schluter, D. (2000) The ecology of adaptive radiation. Oxford
University Press, Oxford.
Sheets, H.D. & Mitchell, C.E. (2001) Why the null matters:
statistical tests, random walks and evolution. Genetica, 112–
113, 105–125.
Simpson, G.G. (1944) Tempo and mode in evolution. Columbia
University Press, New York.
F. T. Burbrink et al.
474 Journal of Biogeography 39, 465–475ª 2011 Blackwell Publishing Ltd
Simpson, G.G. (1953) The major features of evolution.
Columbia University Press, New York.
Vidal, N., Rage, J.-C., Couloux, A. & Hedges, S.B. (2009)
Snakes (Serpentes). The timetree of life (ed. by S.B. Hedges
and S. Kumar), pp. 390–397. Oxford University Press, New
York.
Vitt, L. J. (1987) Snake communities. Snakes: ecology and
evolutionary biology (ed. by R. A. Seigel, J. T. Collins and S.
S. Novak), pp. 335–365. Macmillan Publishing Co, New
York.
Woods, C.A. & Sergile, F.E. (2001) Biogeography of the West
Indies: patterns and perspectives. CRC Press, Boca Raton, FL.
Yoder, J.B., Clancey, E., Des Roches, S., Eastman, J.M., Gentry,
L., Godsoe, W., Hagey, T.J., Jochimsen, D., Oswald, B.P.,
Robertson, J., Sarver, B.a.J., Schenk, J.J., Spear, S.F. &
Harmon, L.J. (2010) Ecological opportunity and the origin
of adaptive radiations. Journal of Evolutionary Biology, 23,
1581–1596.
SUPPORTING INFORMATION
Additional supporting information may be found in the online
version of this article:
Appendix S1 GenBank accession numbers for the 35
alsophiine and three outgroup taxa (Table S1), species data
for the 35 alsophiine taxa (Table S2), and localities for the 35
alsophiine taxa (Table S3).
Appendix S2 Code for fitting the late burst model in R.
Appendix S3 Model-fitting results for phylogenetic diversi-
fication models (Table S4), trait evolution models (Table S5),
and trait-dependent diversification models (Table S6).
As a service to our authors and readers, this journal provides
supporting information supplied by the authors. Such mate-
rials are peer-reviewed and may be re-organized for online
delivery, but are not copy-edited or typeset. Technical support
issues arising from supporting information (other than
missing files) should be addressed to the authors.
BIOSKETCHES
Frank Burbrink examines all aspects of snake evolution with
respect to population genetics, phylogeography, speciation,
diversification, higher-level phylogenetic relationships, bioge-
ography and adaptive radiation.
Sara Ruane has broad interests in the fields of herpetology
and evolutionary biology, with a focus on the molecular
phylogenetics and phylogeography of snakes.
Alex Pyron studies the molecular systematics and paleontol-
ogy of reptiles and amphibians, statistical phylogenetics and
evolutionary theory.
Editor: Malte Ebach
Diversification in West Indian dipsadines
Journal of Biogeography 39, 465–475 475ª 2011 Blackwell Publishing Ltd


![[Linguistics] - Yule, George - Pragmatics](https://img.pdfslide.us/doc/110x75/5531e747550346dd568b4bb0/linguistics-yule-george-pragmatics.jpg)