Embed Size (px)
Citation preview
STEP 4: ESTIMATE LOSSES
4-1STEP 4: ESTIMATE LOSSES
4OVERVIEWThe fourth step in the risk assessment process involves running the HAZUS-MH loss estimation models. For this step, you will run HAZUS-MH loss estimation models and scenarios, and evaluate your hazard events and inventory results for your study region. In addition, you will be introduced to the Risk Assessment Tool (RAT), a companion software tool to HAZUS-MH that will help you to expedite the preparation of your risk assessment outputs, and to the Flood Wizard, a companion software tool to HAZUS-MH that will quickly assess inventory exposure and loss for a study region. Figure 4-1 provides the tasks and outputs for this step.
TASKS:4.1 Integrate Hazard Profi le Data for
HAZUS-MH Level 24.2 Run HAZUS-MH Scenarios4.3 Run the Risk Assessment Tool4.4 Calculate Exposure for Hazards Not
Included in HAZUS-MH4.5 Evaluate the Results of Your Risk
Assessment
Step 5: Consider Mitigation Options
Step 3: Inventory Assets
Step 4: Estimate Losses
Step 2: Profi le Hazards
Step 1: Identify Hazards
OUTPUTS:• HAZUS-MH Loss Estimate Tables, Maps,
and Summary Reports(Worksheets 4-1 and 4-2)
• Flood Wizard and Risk Assessment Tool Outputs (Worksheet 4-2)
Figure 4-1 Step 4 tasks and outputs
4-2 STEP 4: ESTIMATE LOSSES
HAZUS-MH includes loss estimation models for earthquake, fl ood, and hurricane hazards. Task 4.1 involves setting up your scenarios to obtain loss estimates. Task 4.2 explains how to run the HAZUS-MH models. Task 4.3 involves preparing and documenting a risk assessment
using the RAT, a companion software tool to HAZUS-MH. Task 4.4 addresses how HAZUS-MH can support the identifi cation of assets exposed to hazards other than earthquakes, fl oods, and hurricanes. Task 4.5 involves reviewing
and evaluating the estimates generated during Tasks 4.1, 4.2, 4.3, and 4.4 to assess their completeness, compare risks, and evaluate acceptability.
Deterministic and Probabilistic Scenarios in HAZUS-MHTo obtain loss estimation results, HAZUS-MH runs deterministic and probabilistic scenarios. For the purpose of this How-To Guide, probabilistic scenarios are identifi ed as the best option for the following reasons:
❍ The estimated losses are the average expected value of loss in any one year.
❍ An average of expected value of losses can help decision-makers to plan cost-effective budgets to address high priority natural hazard concerns.
❍ The average annualized losses can help to identify cost-effective mitigation measures.
❍ Cost-effective mitigation measures can produce savings (avoided losses) and help to address budgetary needs and constraints.
The Risk Assessment Tool
FEMA has developed a companion software tool to HAZUS-MH called the HAZUS-MH Risk Assessment Tool (RAT) to help you produce your risk assessment outputs for earthquakes, fl oods, and hurricanes. This tool was developed as a third-party model to support HAZUS-MH and is used to display the outputs from the HAZUS-MH risk assessment in an easy-to-use format.
HAZUS-MH Loss Estimate Terms
Loss – Structural loss, content loss, and function loss
Functional downtime – The average time (in days) during which a function (business or service) is unavailable to provide its services because of a hazard event
Displacement time – The average time (in days) that a building’s occupants must operate from a temporary location because of building damage resulting from a hazard event
Function loss – Functional downtime costs + displacement time costs
Casualties – Impacts on humans (ranging from low impact to severe injury and death)
Return period loss – The average loss over a certain period of time for all hazard events
Exposure
Although it is not used in this context in HAZUS-MH, the term “exposure” is insurance parlance for the dollar value of the risk portfolio and is thus applicable to discussions of loss estimation as well as general inventory identifi cation.
4-3STEP 4: ESTIMATE LOSSES
Probabilistic analyses can be used to develop estimates of average yearly losses (“annualized losses”) as well as the expected distribution of losses (“return period losses”). These estimates refl ect the full spectrum of potential events that can occur in a particular region. The probabilistic approach allows the user to generate estimates of damage and loss based on probabilistic hazards for fi ve (fl ood), seven (hurricane), or eight (earthquake) return periods.
Deterministic analysis relies on the laws of physics or on correlations developed through experience or testing to predict the outcome of a particular hazard scenario. In the deterministic approach, one or more possible scenarios can be developed that represent the worst possible credible events. In this approach, the frequency of possible occurrence needs to be evaluated.
Probabilistic analysis evaluates the statistical likelihood that a specifi c event will occur and what losses and consequences will result. The probabilistic approach may use both statistics and historical information. This How-To Guide focuses on probabilistic analysis. The HAZUS-MH User Manuals contain instructions concerning both scenarios.
Using HAZUS-MH provided data or local data already incorporated into the software, proceed to run HAZUS-MH. Preliminary results will take the form of standardized hazard outputs. These outputs estimate damages and losses, including direct losses, induced losses, social losses, and business interruption.
Developing the loss estimates in HAZUS-MH will require fi ve activities:
❍ Integrate hazard profi le data for HAZUS-MH Level 2
❍ Run HAZUS-MH scenarios
❍ Run the RAT
HAZUS-MH Annualized Losses
HAZUS-MH allows you to estimate annualized losses. Annualized loss is the estimated long-term value of losses to the general building stock averaged on an annual basis for a specifi c hazard type. Annualized loss considers all future losses for a specifi c hazard type resulting from possible hazard events with different magnitudes and return periods averaged on a “per year” basis. Like other loss estimates, annualized loss is an estimate based on available data and models. Therefore, the actual loss in any given year can be substantially higher or lower than the estimated annualized loss.
Refer to Chapter 15 of the Earthquake Technical Manual for more details.
Points To Keep In Mind When Estimating Losses
HAZUS-MH estimates aggregate impacts on buildings and other structures and on general areas. It is an estimation tool and does not identify which specifi c buildings might be impacted. The loss estimation results are estimates of overall impacts that are intended to guide overall mitigation efforts. However, due to the limited history of observations for some hazards (e.g., hurricanes), limited knowledge of actual building characteristics, modeling simplifi cations, and other factors, the user may encounter some variation in the results produced by a probabilistic analysis.
4-4 STEP 4: ESTIMATE LOSSES
❍ Calculate exposure for hazards not included in HAZUS-MH
❍ Evaluate the results of the risk assessment
These activities are detailed below, for the three major hazards addressed by HAZUS-MH.
Integrate Hazard Profile Data for HAZUS-MH Level 2 (Task 4.1)Data integration is required if you have collected local data as part of Task 2.3 to supplement the HAZUS-MH provided data. Local hazard data integration is discussed below for the earthquake, flood, and hurricane hazards.
Earthquakes There are two techniques in the earthquake module to update the hazard assumptions and data provided with HAZUS-MH. The first method involves changing the soil type, landslide, liquefaction, and water depth values for the study region as a whole. The second method involves importing a GIS layer into HAZUS-MH and using the values found in the attribute table of that layer to update the soil type, liquefaction, landslide, and water depth values.
To update the assumptions for the study region, follow the directions below.
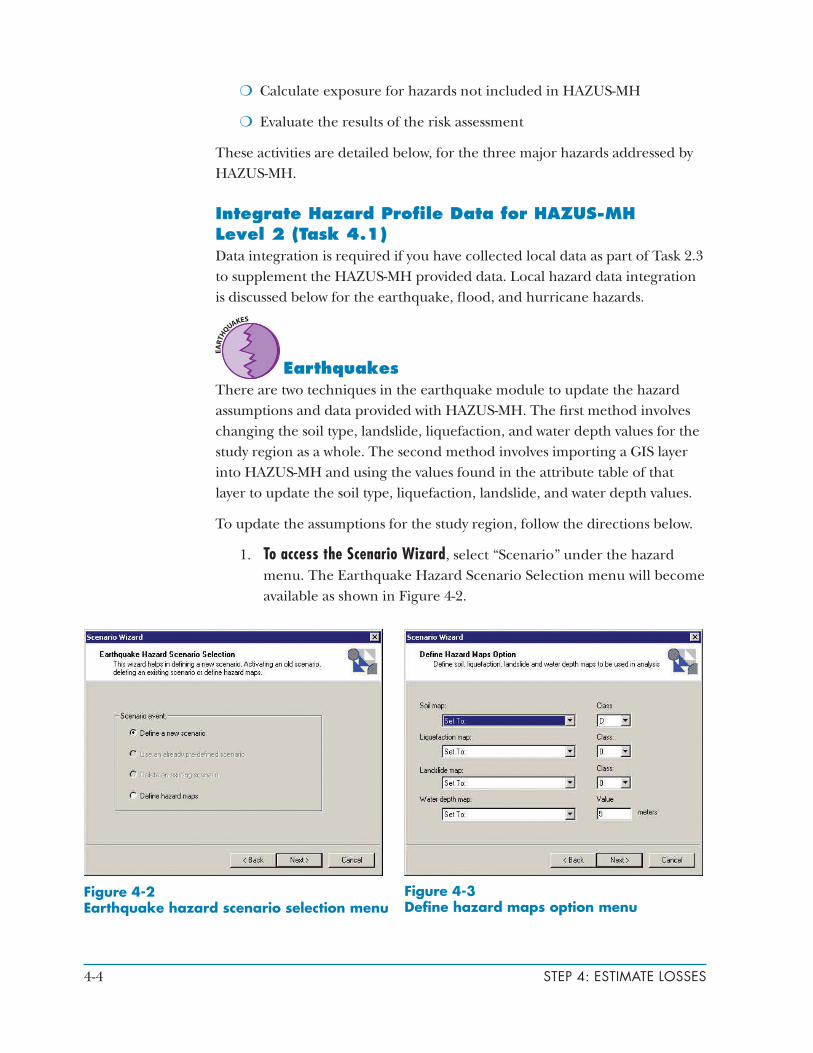
1. To access the Scenario Wizard, select “Scenario” under the hazard menu. The Earthquake Hazard Scenario Selection menu will become available as shown in Figure 4-2.
Figure 4-2 Earthquake hazard scenario selection menu
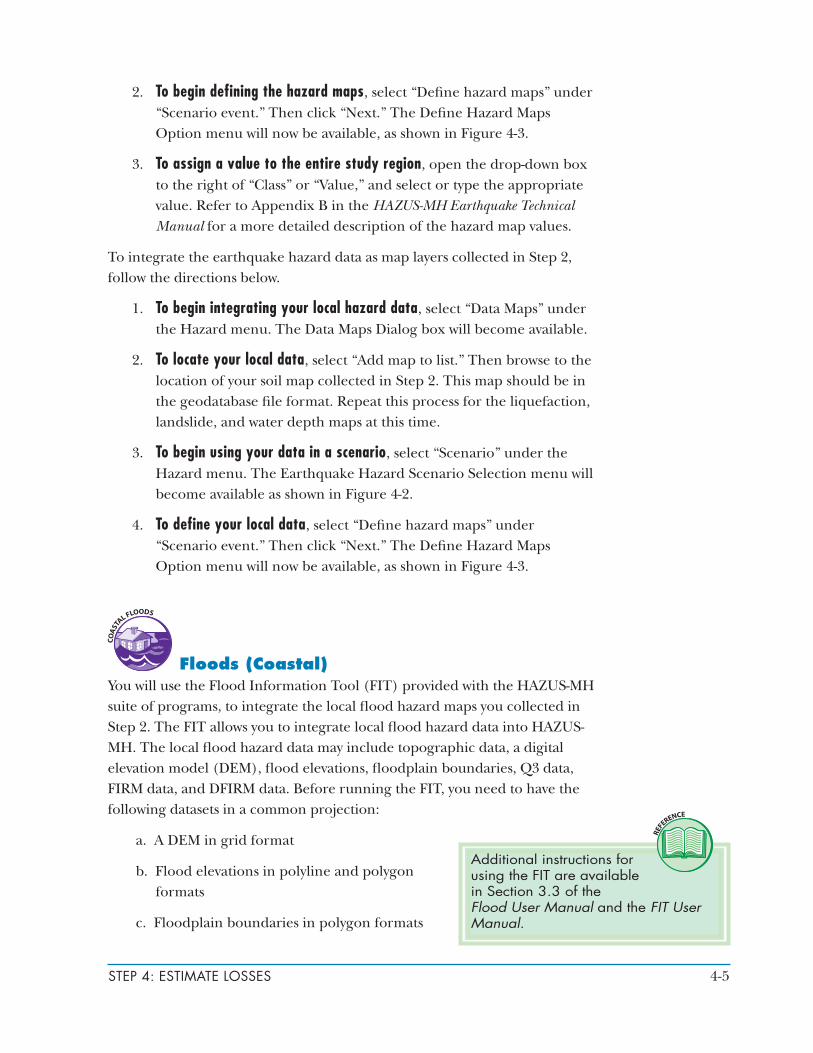
Figure 4-3 Define hazard maps option menu
4-5STEP 4: ESTIMATE LOSSES
2. To begin defining the hazard maps, select “Defi ne hazard maps” under “Scenario event.” Then click “Next.” The Defi ne Hazard Maps Option menu will now be available, as shown in Figure 4-3.
3. To assign a value to the entire study region, open the drop-down box to the right of “Class” or “Value,” and select or type the appropriate value. Refer to Appendix B in the HAZUS-MH Earthquake Technical Manual for a more detailed description of the hazard map values.
To integrate the earthquake hazard data as map layers collected in Step 2, follow the directions below.
1. To begin integrating your local hazard data, select “Data Maps” under the Hazard menu. The Data Maps Dialog box will become available.
2. To locate your local data, select “Add map to list.” Then browse to the location of your soil map collected in Step 2. This map should be in the geodatabase fi le format. Repeat this process for the liquefaction, landslide, and water depth maps at this time.
3. To begin using your data in a scenario, select “Scenario” under the Hazard menu. The Earthquake Hazard Scenario Selection menu will become available as shown in Figure 4-2.
4. To define your local data, select “Defi ne hazard maps” under “Scenario event.” Then click “Next.” The Defi ne Hazard Maps Option menu will now be available, as shown in Figure 4-3.
Floods (Coastal)You will use the Flood Information Tool (FIT) provided with the HAZUS-MH suite of programs, to integrate the local fl ood hazard maps you collected in Step 2. The FIT allows you to integrate local fl ood hazard data into HAZUS-MH. The local fl ood hazard data may include topographic data, a digital elevation model (DEM), fl ood elevations, fl oodplain boundaries, Q3 data, FIRM data, and DFIRM data. Before running the FIT, you need to have the following datasets in a common projection:
a. A DEM in grid format
b. Flood elevations in polyline and polygon formats
c. Floodplain boundaries in polygon formats
Additional instructions for using the FIT are available in Section 3.3 of the Flood User Manual and the FIT User Manual.
4-6 STEP 4: ESTIMATE LOSSES
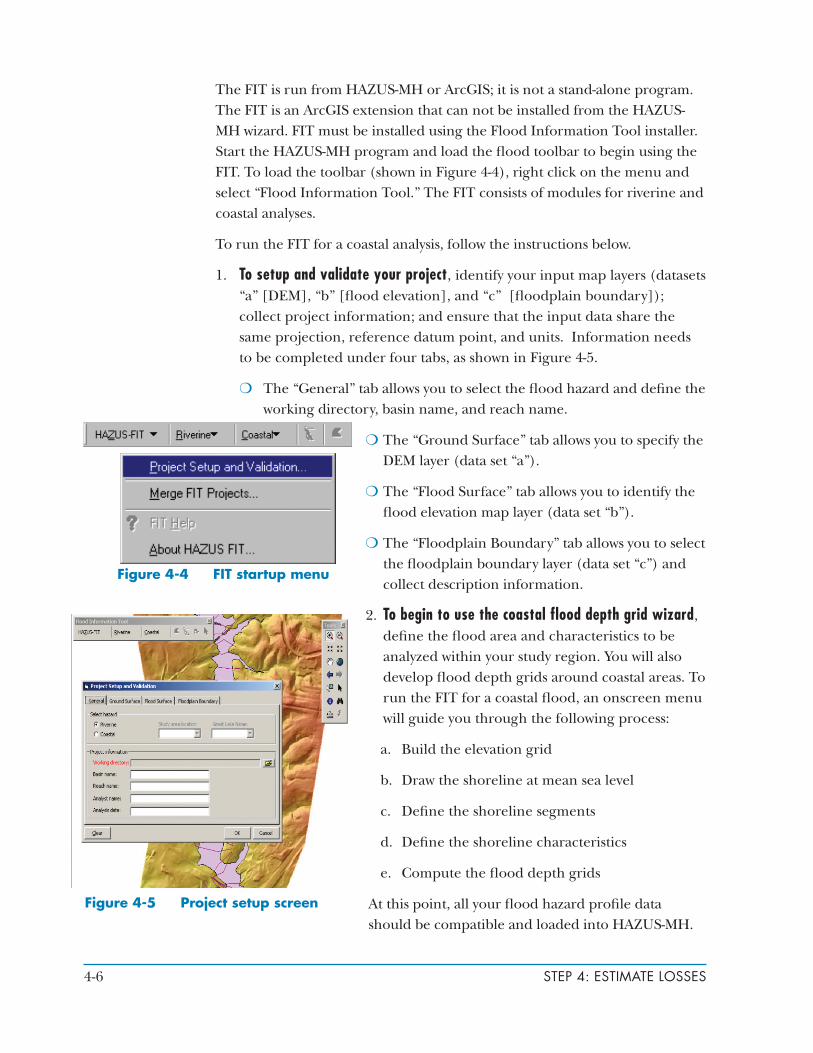
The FIT is run from HAZUS-MH or ArcGIS; it is not a stand-alone program. The FIT is an ArcGIS extension that can not be installed from the HAZUS-MH wizard. FIT must be installed using the Flood Information Tool installer. Start the HAZUS-MH program and load the flood toolbar to begin using the FIT. To load the toolbar (shown in Figure 4-4), right click on the menu and select “Flood Information Tool.” The FIT consists of modules for riverine and coastal analyses.
To run the FIT for a coastal analysis, follow the instructions below.
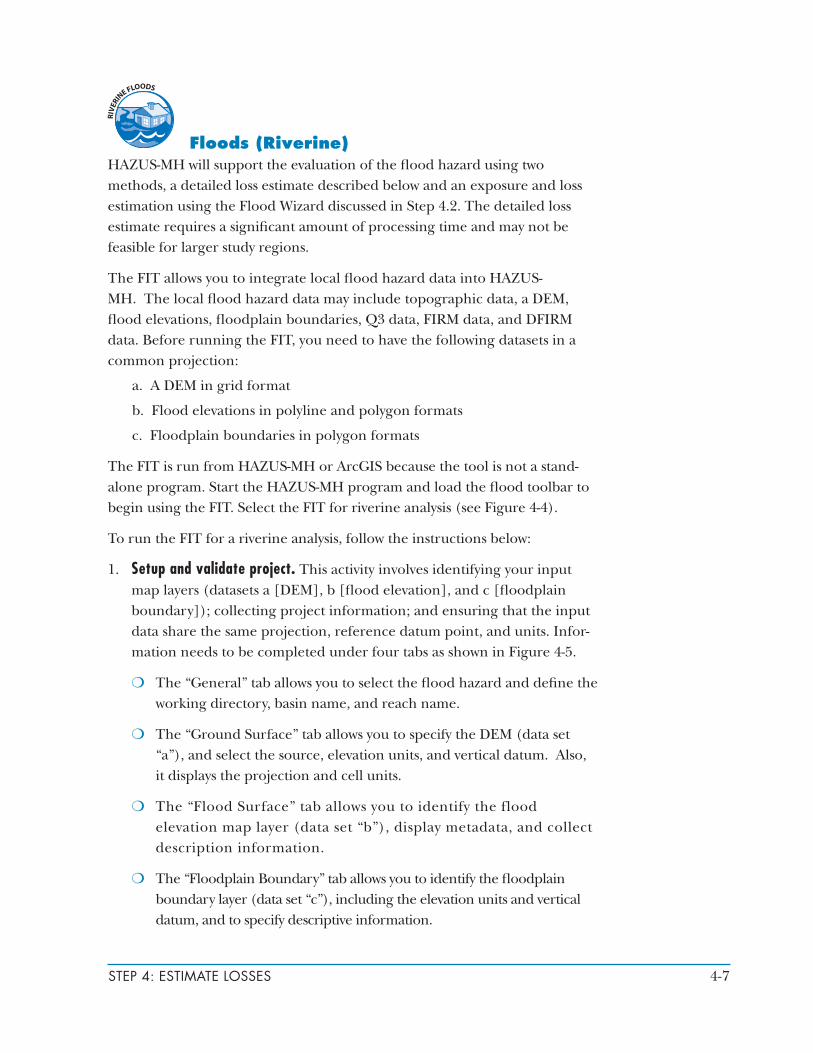
1. To setup and validate your project, identify your input map layers (datasets “a” [DEM], “b” [flood elevation], and “c” [floodplain boundary]); collect project information; and ensure that the input data share the same projection, reference datum point, and units. Information needs to be completed under four tabs, as shown in Figure 4-5.
❍ The “General” tab allows you to select the flood hazard and define the working directory, basin name, and reach name.
❍ The “Ground Surface” tab allows you to specify the DEM layer (data set “a”).
❍ The “Flood Surface” tab allows you to identify the flood elevation map layer (data set “b”).
❍ The “Floodplain Boundary” tab allows you to select the floodplain boundary layer (data set “c”) and collect description information.
2. To begin to use the coastal flood depth grid wizard, define the flood area and characteristics to be analyzed within your study region. You will also develop flood depth grids around coastal areas. To run the FIT for a coastal flood, an onscreen menu will guide you through the following process:
a. Build the elevation grid
b. Draw the shoreline at mean sea level
c. Define the shoreline segments
d. Define the shoreline characteristics
e. Compute the flood depth grids
At this point, all your flood hazard profile data should be compatible and loaded into HAZUS-MH.
Figure 4-4 FIT startup menu
Figure 4-5 Project setup screen
4-7STEP 4: ESTIMATE LOSSES
Floods (Riverine)HAZUS-MH will support the evaluation of the flood hazard using two methods, a detailed loss estimate described below and an exposure and loss estimation using the Flood Wizard discussed in Step 4.2. The detailed loss estimate requires a significant amount of processing time and may not be feasible for larger study regions.
The FIT allows you to integrate local flood hazard data into HAZUS-MH. The local flood hazard data may include topographic data, a DEM, flood elevations, floodplain boundaries, Q3 data, FIRM data, and DFIRM data. Before running the FIT, you need to have the following datasets in a common projection:
a. A DEM in grid format
b. Flood elevations in polyline and polygon formats
c. Floodplain boundaries in polygon formats
The FIT is run from HAZUS-MH or ArcGIS because the tool is not a stand-alone program. Start the HAZUS-MH program and load the flood toolbar to begin using the FIT. Select the FIT for riverine analysis (see Figure 4-4).
To run the FIT for a riverine analysis, follow the instructions below:
1. Setup and validate project. This activity involves identifying your input map layers (datasets a [DEM], b [flood elevation], and c [floodplain boundary]); collecting project information; and ensuring that the input data share the same projection, reference datum point, and units. Infor-mation needs to be completed under four tabs as shown in Figure 4-5.
❍ The “General” tab allows you to select the flood hazard and define the working directory, basin name, and reach name.
❍ The “Ground Surface” tab allows you to specify the DEM (data set “a”), and select the source, elevation units, and vertical datum. Also, it displays the projection and cell units.
❍ The “Flood Surface” tab allows you to identify the flood elevation map layer (data set “b”), display metadata, and collect description information.
❍ The “Floodplain Boundary” tab allows you to identify the floodplain boundary layer (data set “c”), including the elevation units and vertical datum, and to specify descriptive information.
4-8 STEP 4: ESTIMATE LOSSES
2. Use the riverine flood depth grid wizard. This activity involves defining the flood area to be analyzed within your study region. You will also develop flood depth grids around rivers and backwater areas and merge these grids. To develop and merge your flood depth grids, an onscreen menu will guide you through the following process:
a. Select the upstream and downstream limits of your analysis areas
b. Define the width of your analysis areas
c. Adjust the buffer zone to balance inclusion of flooded areas and processing time
d. Define flood elevation attribute fields
e. Draw polygons around backwater areas
f. Assign elevations to backwater areas
g. Merge all flood depth grids
At this point, your local flood hazard profile data should be compatible and integrated into HAZUS-MH.
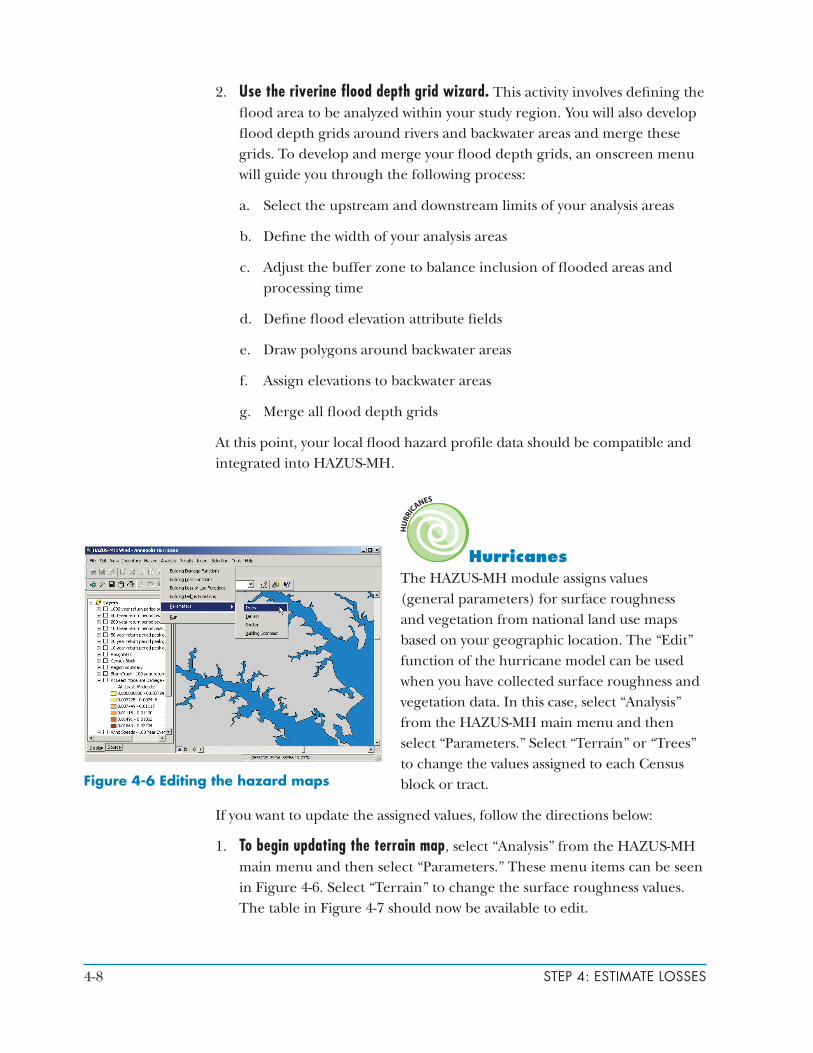
HurricanesThe HAZUS-MH module assigns values (general parameters) for surface roughness and vegetation from national land use maps based on your geographic location. The “Edit” function of the hurricane model can be used when you have collected surface roughness and vegetation data. In this case, select “Analysis” from the HAZUS-MH main menu and then select “Parameters.” Select “Terrain” or “Trees” to change the values assigned to each Census block or tract.
If you want to update the assigned values, follow the directions below:
1. To begin updating the terrain map, select “Analysis” from the HAZUS-MH main menu and then select “Parameters.” These menu items can be seen in Figure 4-6. Select “Terrain” to change the surface roughness values. The table in Figure 4-7 should now be available to edit.
Figure 4-6 Editing the hazard maps
4-9STEP 4: ESTIMATE LOSSES
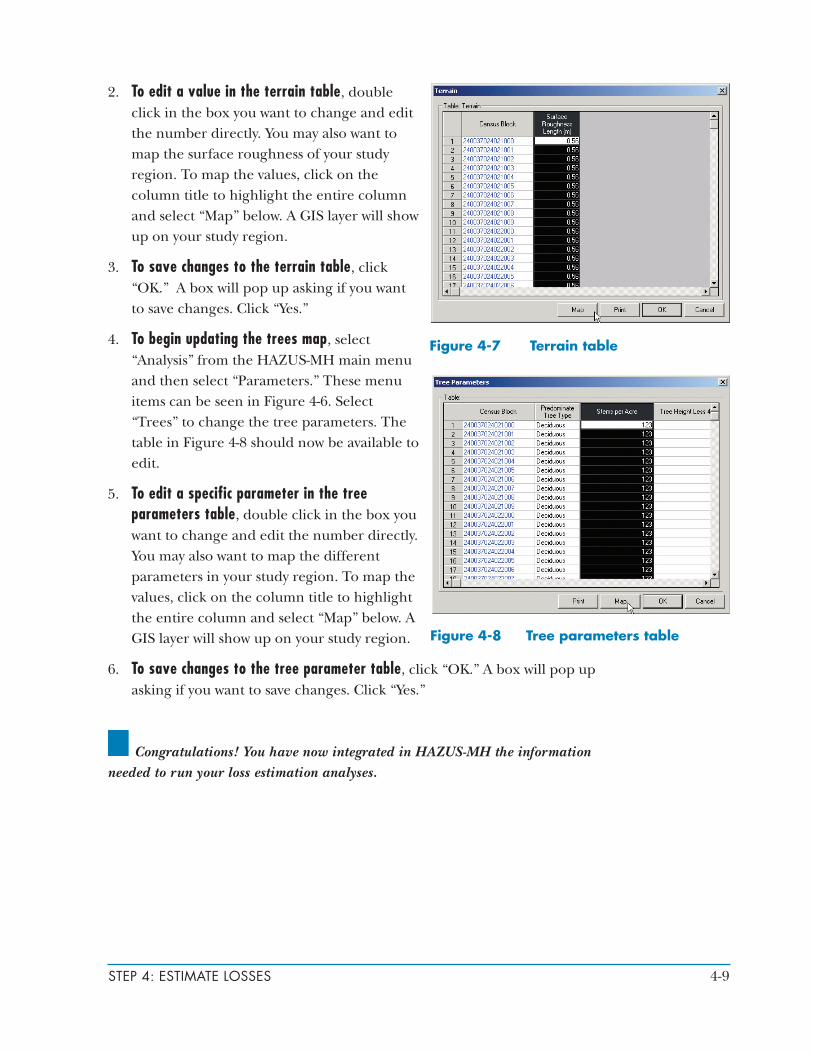
2. To edit a value in the terrain table, double click in the box you want to change and edit the number directly. You may also want to map the surface roughness of your study region. To map the values, click on the column title to highlight the entire column and select “Map” below. A GIS layer will show up on your study region.
3. To save changes to the terrain table, click “OK.” A box will pop up asking if you want to save changes. Click “Yes.”
4. To begin updating the trees map, select “Analysis” from the HAZUS-MH main menu and then select “Parameters.” These menu items can be seen in Figure 4-6. Select “Trees” to change the tree parameters. The table in Figure 4-8 should now be available to edit.
5. To edit a specific parameter in the tree parameters table, double click in the box you want to change and edit the number directly. You may also want to map the different parameters in your study region. To map the values, click on the column title to highlight the entire column and select “Map” below. A GIS layer will show up on your study region.
6. To save changes to the tree parameter table, click “OK.” A box will pop up asking if you want to save changes. Click “Yes.”
Congratulations! You have now integrated in HAZUS-MH the information needed to run your loss estimation analyses.
Figure 4-7 Terrain table
Figure 4-8 Tree parameters table
4-10 STEP 4: ESTIMATE LOSSES
Run HAZUS-MH Scenarios (Task 4.2)HAZUS-MH scenarios can be run for the earthquake, flood, and hurricane hazards. The steps to run these scenarios are discussed below. Worksheet 4-1 will help you document the results.
Run an Earthquake ScenarioTo run a probabilistic earthquake scenario, follow the instructions below:
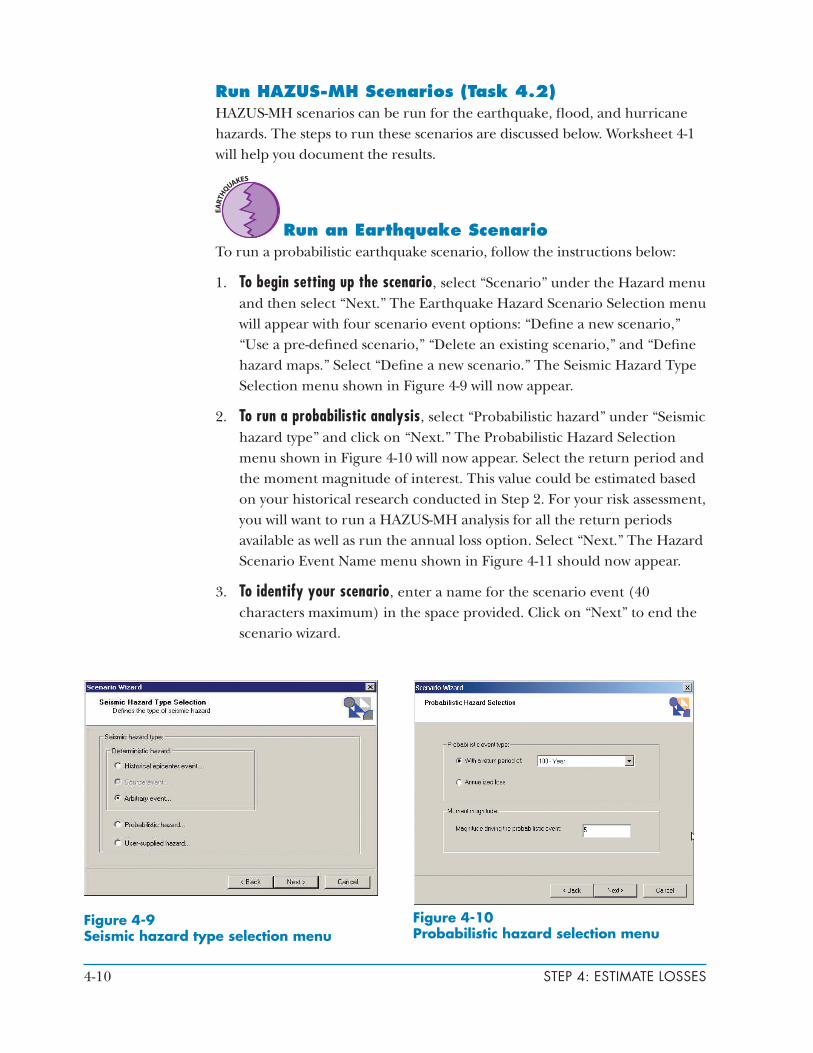
1. To begin setting up the scenario, select “Scenario” under the Hazard menu and then select “Next.” The Earthquake Hazard Scenario Selection menu will appear with four scenario event options: “Define a new scenario,” “Use a pre-defined scenario,” “Delete an existing scenario,” and “Define hazard maps.” Select “Define a new scenario.” The Seismic Hazard Type Selection menu shown in Figure 4-9 will now appear.
2. To run a probabilistic analysis, select “Probabilistic hazard” under “Seismic hazard type” and click on “Next.” The Probabilistic Hazard Selection menu shown in Figure 4-10 will now appear. Select the return period and the moment magnitude of interest. This value could be estimated based on your historical research conducted in Step 2. For your risk assessment, you will want to run a HAZUS-MH analysis for all the return periods available as well as run the annual loss option. Select “Next.” The Hazard Scenario Event Name menu shown in Figure 4-11 should now appear.
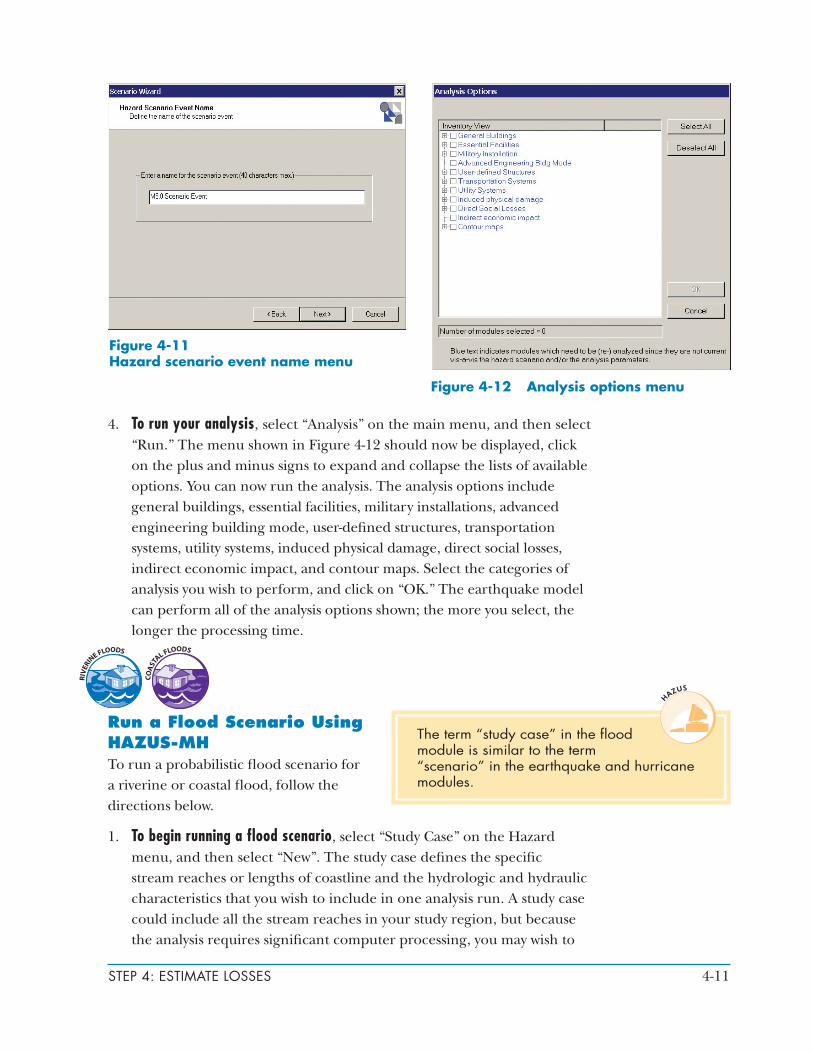
3. To identify your scenario, enter a name for the scenario event (40 characters maximum) in the space provided. Click on “Next” to end the scenario wizard.
Figure 4-9 Seismic hazard type selection menu
Figure 4-10 Probabilistic hazard selection menu
4-11STEP 4: ESTIMATE LOSSES
4. To run your analysis, select “Analysis” on the main menu, and then select “Run.” The menu shown in Figure 4-12 should now be displayed, click on the plus and minus signs to expand and collapse the lists of available options. You can now run the analysis. The analysis options include general buildings, essential facilities, military installations, advanced engineering building mode, user-defi ned structures, transportation systems, utility systems, induced physical damage, direct social losses, indirect economic impact, and contour maps. Select the categories of analysis you wish to perform, and click on “OK.” The earthquake model can perform all of the analysis options shown; the more you select, the longer the processing time.
Run a Flood Scenario Using HAZUS-MHTo run a probabilistic fl ood scenario for a riverine or coastal fl ood, follow the directions below.
1. To begin running a flood scenario, select “Study Case” on the Hazard menu, and then select “New”. The study case defi nes the specifi c stream reaches or lengths of coastline and the hydrologic and hydraulic characteristics that you wish to include in one analysis run. A study case could include all the stream reaches in your study region, but because the analysis requires signifi cant computer processing, you may wish to
Figure 4-11 Hazard scenario event name menu
Figure 4-12 Analysis options menu
The term “study case” in the fl ood module is similar to the term “scenario” in the earthquake and hurricane modules.
4-12 STEP 4: ESTIMATE LOSSES
divide your study region into several smaller study cases. When the “Run Hydrology” option on the Hazard menu is enabled, you will be able to perform the hydrologic and hydraulic analyses.
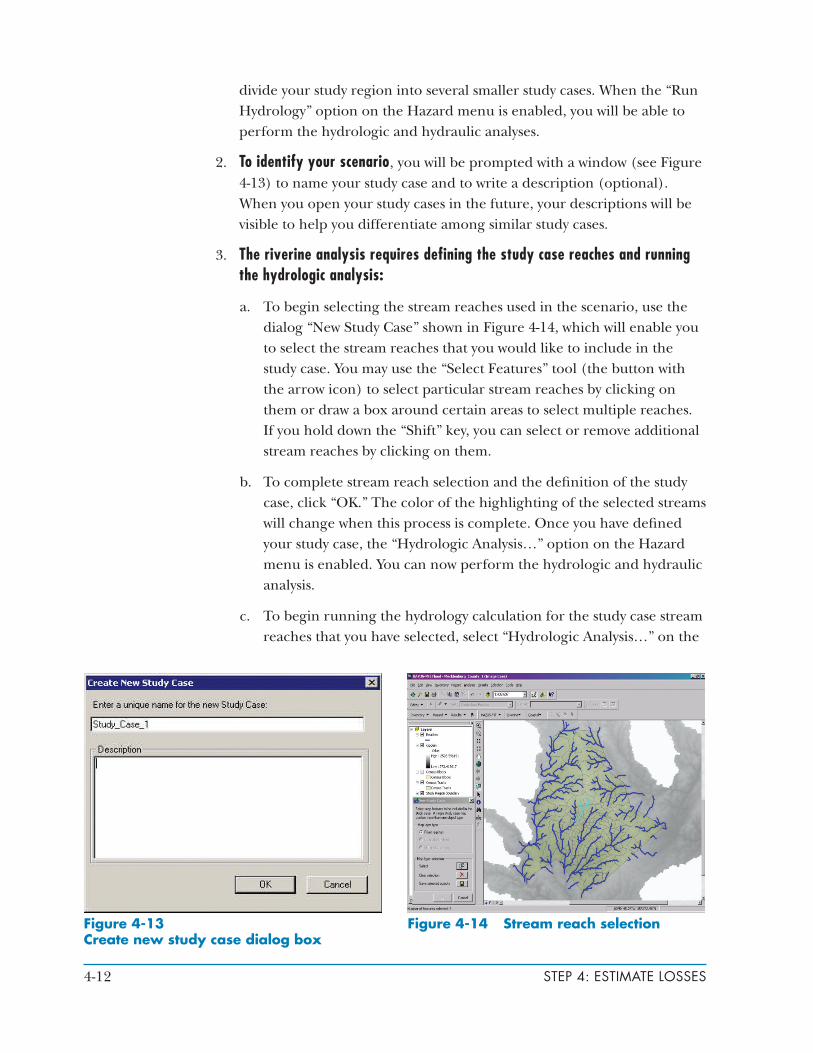
2. To identify your scenario, you will be prompted with a window (see Figure 4-13) to name your study case and to write a description (optional). When you open your study cases in the future, your descriptions will be visible to help you differentiate among similar study cases.
3. The riverine analysis requires defining the study case reaches and running the hydrologic analysis:
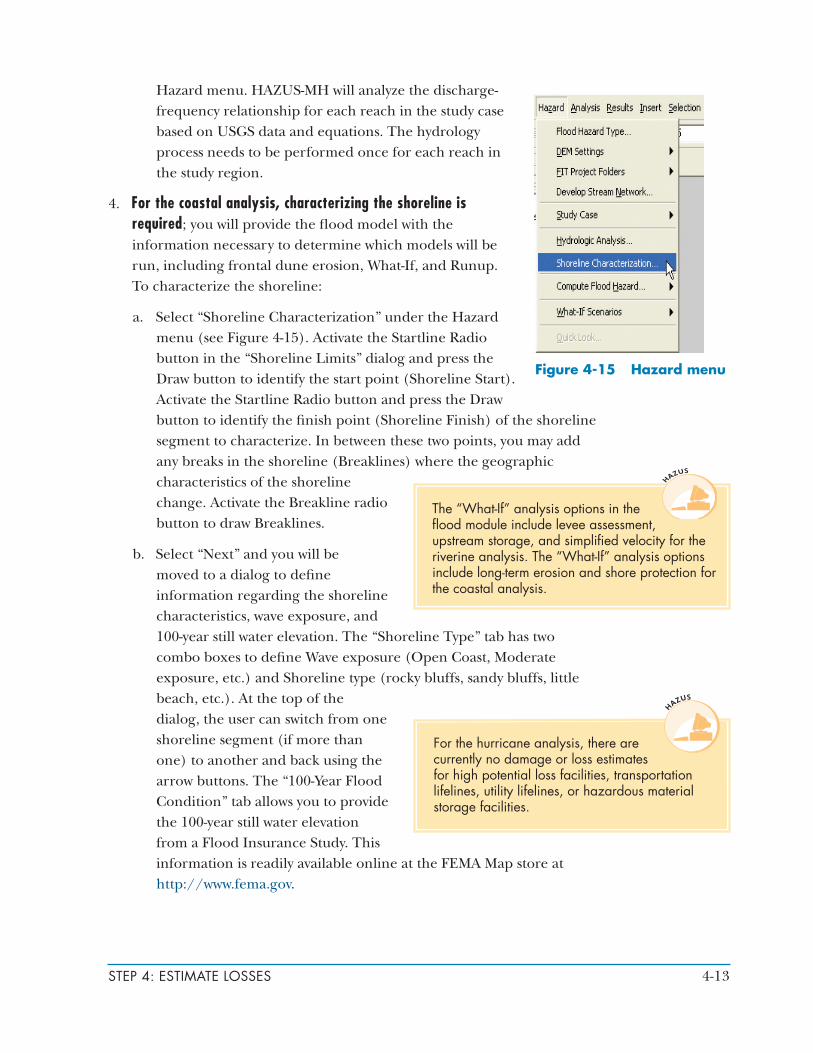
a. To begin selecting the stream reaches used in the scenario, use the dialog “New Study Case” shown in Figure 4-14, which will enable you to select the stream reaches that you would like to include in the study case. You may use the “Select Features” tool (the button with the arrow icon) to select particular stream reaches by clicking on them or draw a box around certain areas to select multiple reaches. If you hold down the “Shift” key, you can select or remove additional stream reaches by clicking on them.
b. To complete stream reach selection and the definition of the study case, click “OK.” The color of the highlighting of the selected streams will change when this process is complete. Once you have defined your study case, the “Hydrologic Analysis…” option on the Hazard menu is enabled. You can now perform the hydrologic and hydraulic analysis.
c. To begin running the hydrology calculation for the study case stream reaches that you have selected, select “Hydrologic Analysis…” on the
Figure 4-13 Create new study case dialog box
Figure 4-14 Stream reach selection
4-13STEP 4: ESTIMATE LOSSES
Hazard menu. HAZUS-MH will analyze the discharge-frequency relationship for each reach in the study case based on USGS data and equations. The hydrology process needs to be performed once for each reach in the study region.
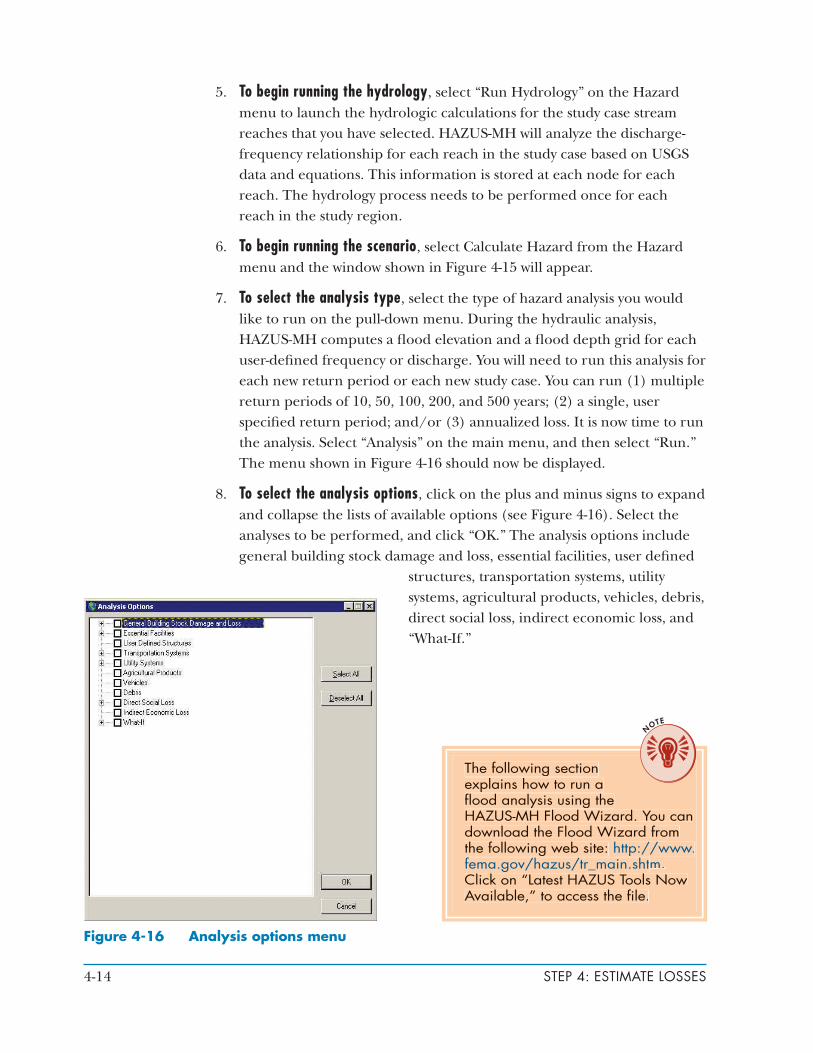
4. For the coastal analysis, characterizing the shoreline is required; you will provide the fl ood model with the information necessary to determine which models will be run, including frontal dune erosion, What-If, and Runup. To characterize the shoreline:
a. Select “Shoreline Characterization” under the Hazard menu (see Figure 4-15). Activate the Startline Radio button in the “Shoreline Limits” dialog and press the Draw button to identify the start point (Shoreline Start). Activate the Startline Radio button and press the Draw button to identify the fi nish point (Shoreline Finish) of the shoreline segment to characterize. In between these two points, you may add any breaks in the shoreline (Breaklines) where the geographic characteristics of the shoreline change. Activate the Breakline radio button to draw Breaklines.
b. Select “Next” and you will be moved to a dialog to defi ne information regarding the shoreline characteristics, wave exposure, and 100-year still water elevation. The “Shoreline Type” tab has two combo boxes to defi ne Wave exposure (Open Coast, Moderate exposure, etc.) and Shoreline type (rocky bluffs, sandy bluffs, little beach, etc.). At the top of the dialog, the user can switch from one shoreline segment (if more than one) to another and back using the arrow buttons. The “100-Year Flood Condition” tab allows you to provide the 100-year still water elevation from a Flood Insurance Study. This information is readily available online at the FEMA Map store at http://www.fema.gov.
Figure 4-15 Hazard menu
The “What-If” analysis options in the fl ood module include levee assessment, upstream storage, and simplifi ed velocity for the riverine analysis. The “What-If” analysis options include long-term erosion and shore protection for the coastal analysis.
For the hurricane analysis, there are currently no damage or loss estimates for high potential loss facilities, transportation lifelines, utility lifelines, or hazardous material storage facilities.
4-14 STEP 4: ESTIMATE LOSSES
5. To begin running the hydrology, select “Run Hydrology” on the Hazard menu to launch the hydrologic calculations for the study case stream reaches that you have selected. HAZUS-MH will analyze the discharge-frequency relationship for each reach in the study case based on USGS data and equations. This information is stored at each node for each reach. The hydrology process needs to be performed once for each reach in the study region.
6. To begin running the scenario, select Calculate Hazard from the Hazard menu and the window shown in Figure 4-15 will appear.
7. To select the analysis type, select the type of hazard analysis you would like to run on the pull-down menu. During the hydraulic analysis, HAZUS-MH computes a fl ood elevation and a fl ood depth grid for each user-defi ned frequency or discharge. You will need to run this analysis for each new return period or each new study case. You can run (1) multiple return periods of 10, 50, 100, 200, and 500 years; (2) a single, user specifi ed return period; and/or (3) annualized loss. It is now time to run the analysis. Select “Analysis” on the main menu, and then select “Run.” The menu shown in Figure 4-16 should now be displayed.
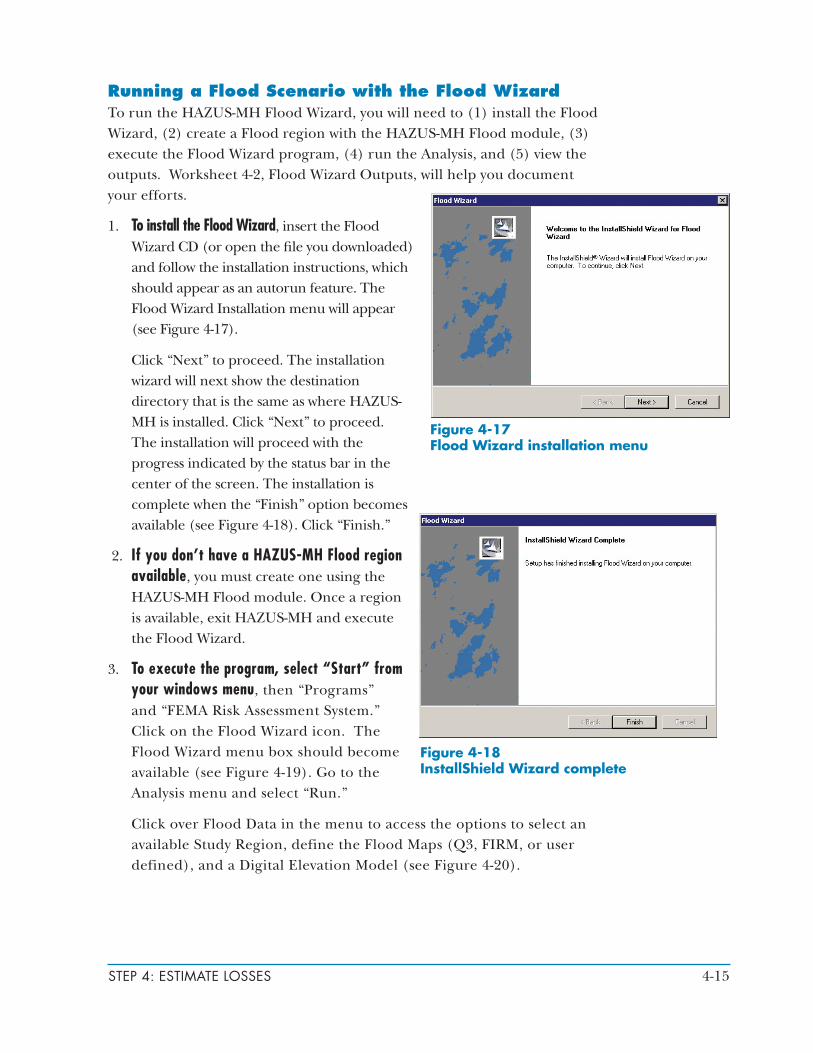
8. To select the analysis options, click on the plus and minus signs to expand and collapse the lists of available options (see Figure 4-16). Select the analyses to be performed, and click “OK.” The analysis options include general building stock damage and loss, essential facilities, user defi ned
structures, transportation systems, utility systems, agricultural products, vehicles, debris, direct social loss, indirect economic loss, and “What-If.”
Figure 4-16 Analysis options menu
The following section explains how to run a fl ood analysis using the HAZUS-MH Flood Wizard. You can download the Flood Wizard from the following web site: http://www.fema.gov/hazus/tr_main.shtm. Click on “Latest HAZUS Tools Now Available,” to access the fi le.
4-15STEP 4: ESTIMATE LOSSES
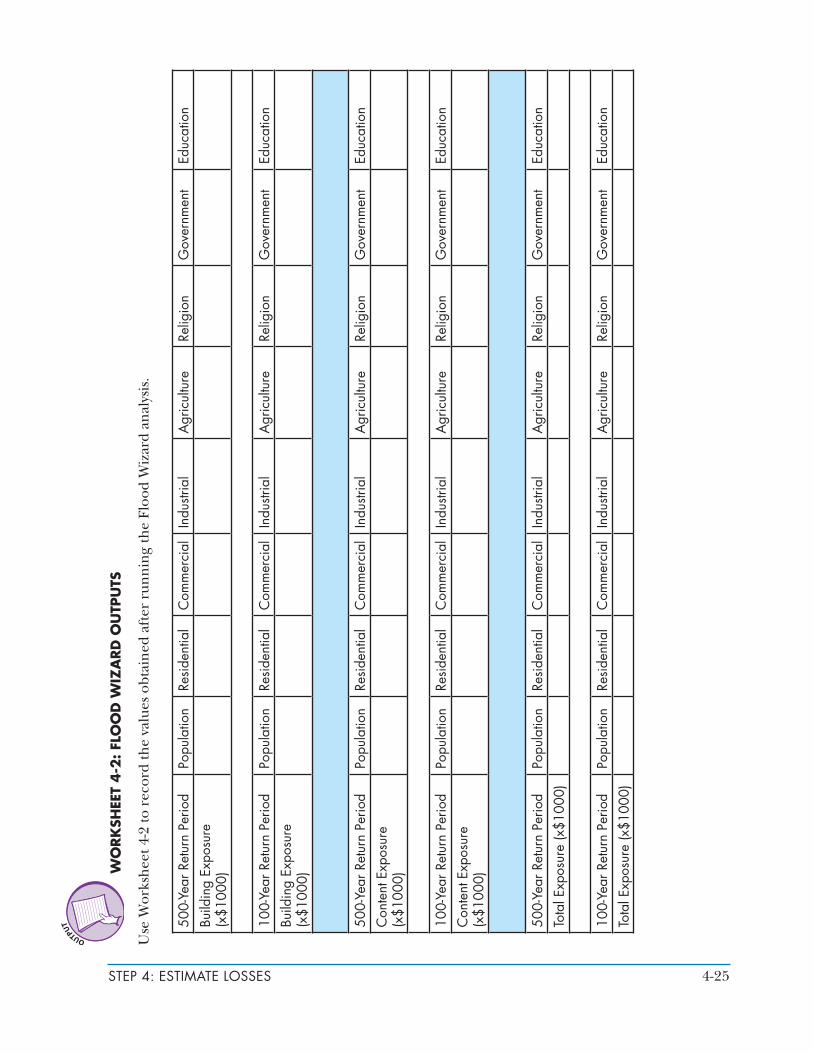
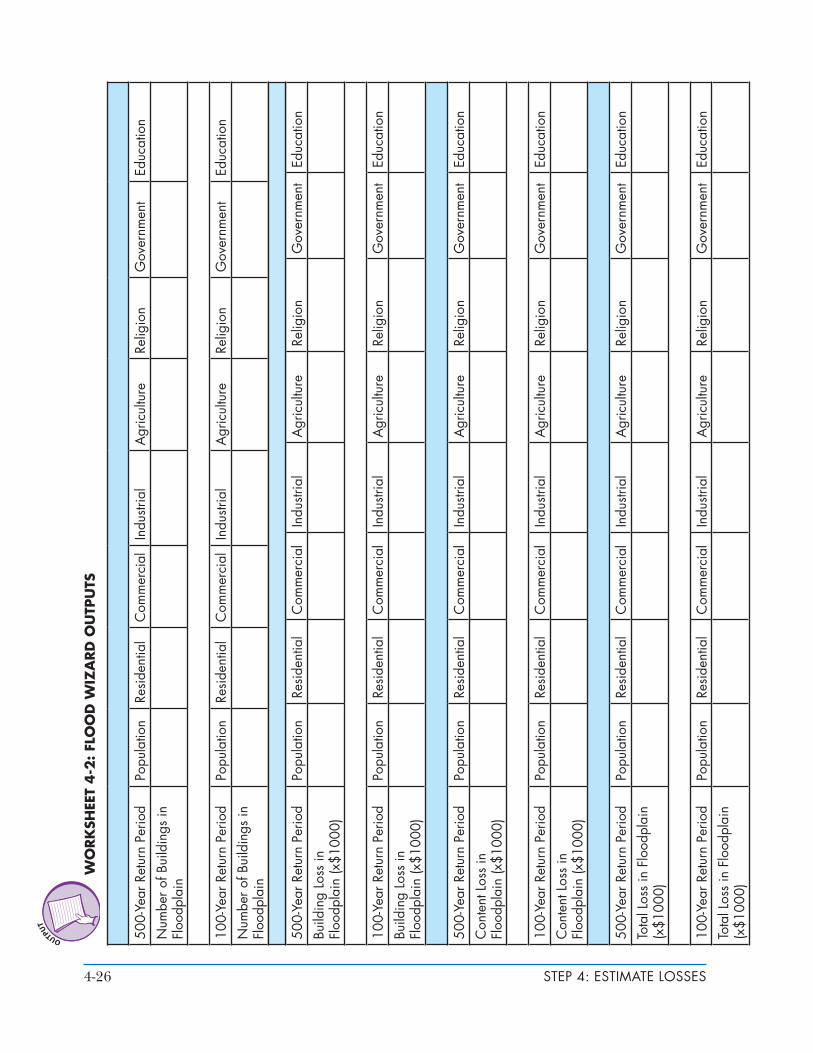
Running a Flood Scenario with the Flood WizardTo run the HAZUS-MH Flood Wizard, you will need to (1) install the Flood Wizard, (2) create a Flood region with the HAZUS-MH Flood module, (3) execute the Flood Wizard program, (4) run the Analysis, and (5) view the outputs. Worksheet 4-2, Flood Wizard Outputs, will help you document your efforts.
1. To install the Flood Wizard, insert the Flood Wizard CD (or open the file you downloaded) and follow the installation instructions, which should appear as an autorun feature. The Flood Wizard Installation menu will appear (see Figure 4-17).
Click “Next” to proceed. The installation wizard will next show the destination directory that is the same as where HAZUS-MH is installed. Click “Next” to proceed. The installation will proceed with the progress indicated by the status bar in the center of the screen. The installation is complete when the “Finish” option becomes available (see Figure 4-18). Click “Finish.”
2. If you don’t have a HAZUS-MH Flood region available, you must create one using the HAZUS-MH Flood module. Once a region is available, exit HAZUS-MH and execute the Flood Wizard.
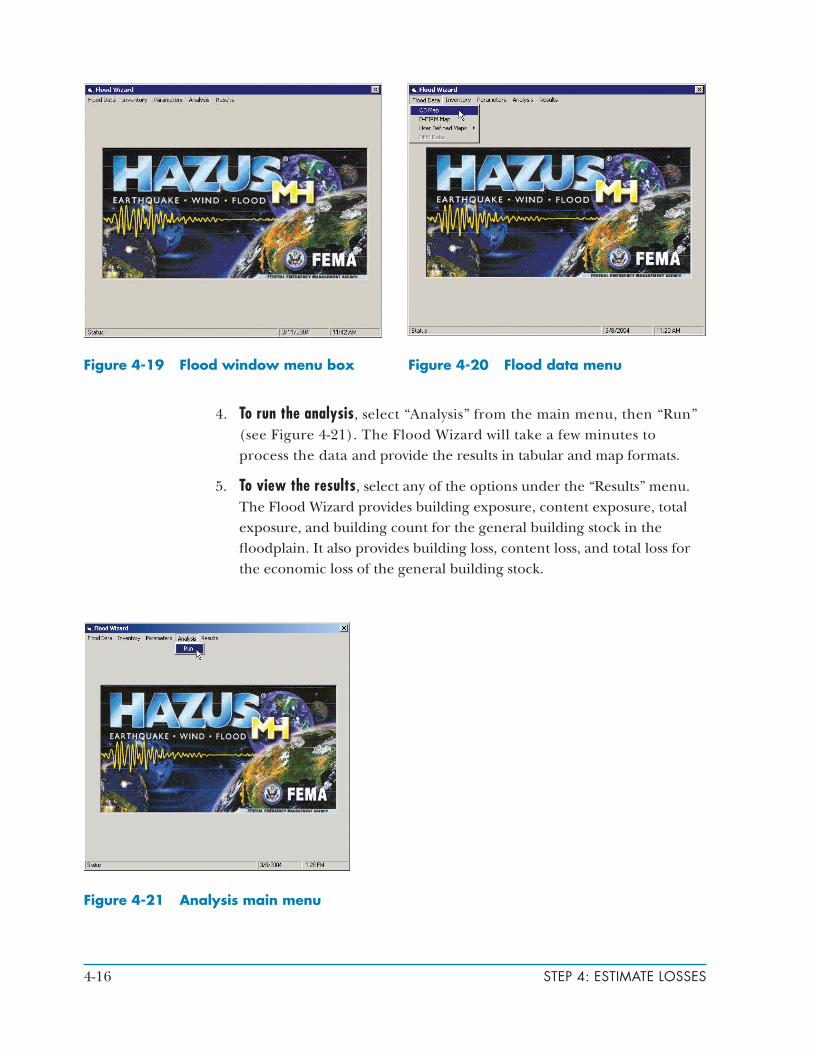
3. To execute the program, select “Start” from your windows menu, then “Programs” and “FEMA Risk Assessment System.” Click on the Flood Wizard icon. The Flood Wizard menu box should become available (see Figure 4-19). Go to the Analysis menu and select “Run.”
Click over Flood Data in the menu to access the options to select an available Study Region, define the Flood Maps (Q3, FIRM, or user defined), and a Digital Elevation Model (see Figure 4-20).
Figure 4-17 Flood Wizard installation menu
Figure 4-18 InstallShield Wizard complete
4-16 STEP 4: ESTIMATE LOSSES
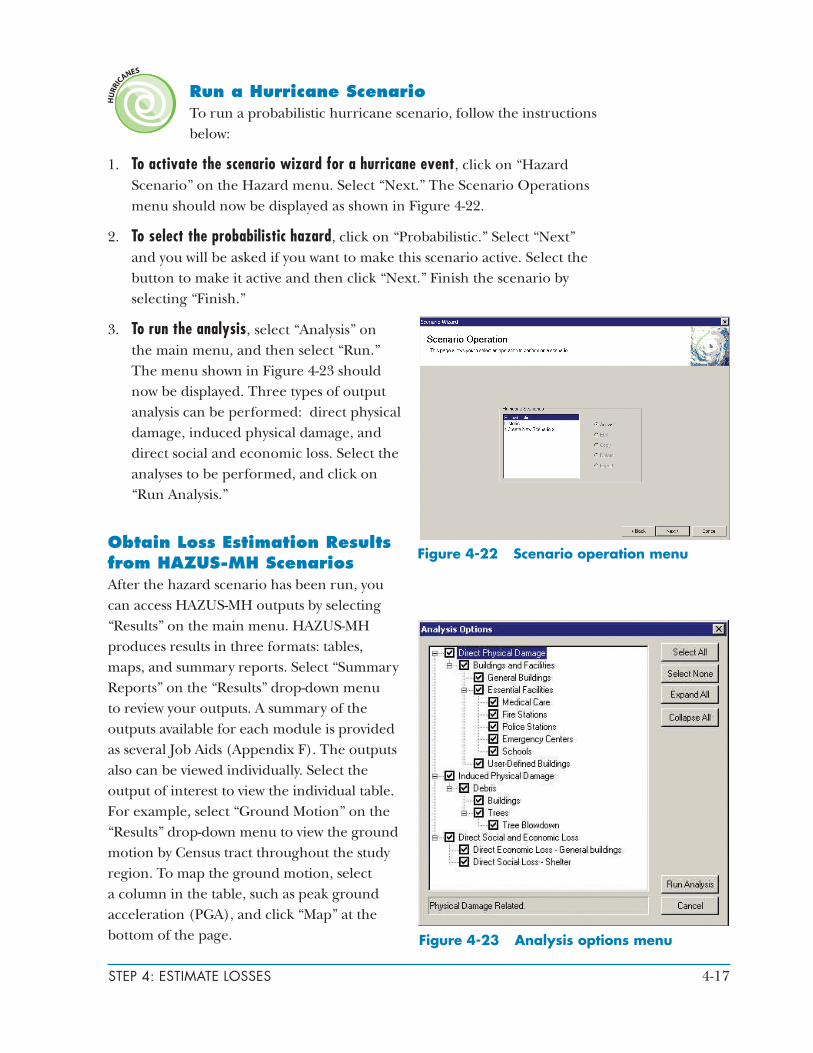
4. To run the analysis, select “Analysis” from the main menu, then “Run” (see Figure 4-21). The Flood Wizard will take a few minutes to process the data and provide the results in tabular and map formats.
5. To view the results, select any of the options under the “Results” menu. The Flood Wizard provides building exposure, content exposure, total exposure, and building count for the general building stock in the floodplain. It also provides building loss, content loss, and total loss for the economic loss of the general building stock.
Figure 4-19 Flood window menu box Figure 4-20 Flood data menu
Figure 4-21 Analysis main menu
4-17STEP 4: ESTIMATE LOSSES
Run a Hurricane ScenarioTo run a probabilistic hurricane scenario, follow the instructions below:
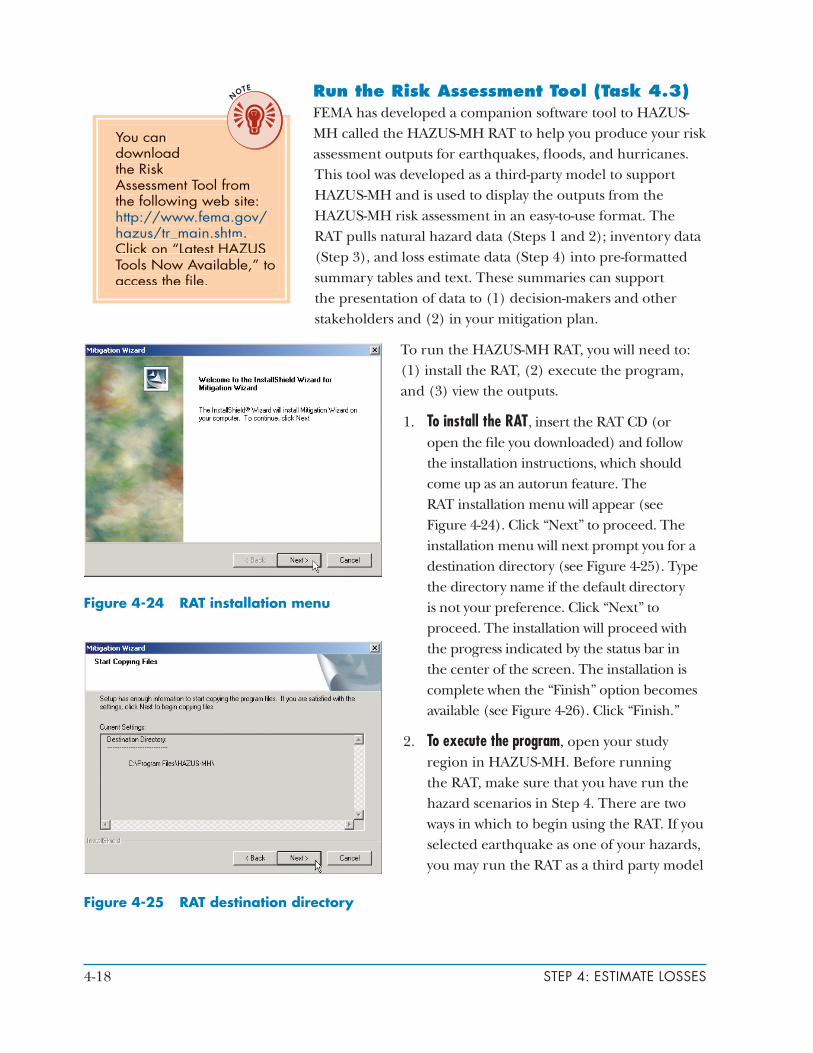
1. To activate the scenario wizard for a hurricane event, click on “Hazard Scenario” on the Hazard menu. Select “Next.” The Scenario Operations menu should now be displayed as shown in Figure 4-22.
2. To select the probabilistic hazard, click on “Probabilistic.” Select “Next” and you will be asked if you want to make this scenario active. Select the button to make it active and then click “Next.” Finish the scenario by selecting “Finish.”
3. To run the analysis, select “Analysis” on the main menu, and then select “Run.” The menu shown in Figure 4-23 should now be displayed. Three types of output analysis can be performed: direct physical damage, induced physical damage, and direct social and economic loss. Select the analyses to be performed, and click on “Run Analysis.”
Obtain Loss Estimation Results from HAZUS-MH ScenariosAfter the hazard scenario has been run, you can access HAZUS-MH outputs by selecting “Results” on the main menu. HAZUS-MH produces results in three formats: tables, maps, and summary reports. Select “Summary Reports” on the “Results” drop-down menu to review your outputs. A summary of the outputs available for each module is provided as several Job Aids (Appendix F). The outputs also can be viewed individually. Select the output of interest to view the individual table. For example, select “Ground Motion” on the “Results” drop-down menu to view the ground motion by Census tract throughout the study region. To map the ground motion, select a column in the table, such as peak ground acceleration (PGA), and click “Map” at the bottom of the page.
Figure 4-22 Scenario operation menu
Figure 4-23 Analysis options menu
4-18 STEP 4: ESTIMATE LOSSES
Run the Risk Assessment Tool (Task 4.3) FEMA has developed a companion software tool to HAZUS-MH called the HAZUS-MH RAT to help you produce your risk assessment outputs for earthquakes, fl oods, and hurricanes. This tool was developed as a third-party model to support HAZUS-MH and is used to display the outputs from the HAZUS-MH risk assessment in an easy-to-use format. The RAT pulls natural hazard data (Steps 1 and 2); inventory data (Step 3), and loss estimate data (Step 4) into pre-formatted summary tables and text. These summaries can support the presentation of data to (1) decision-makers and other stakeholders and (2) in your mitigation plan.
To run the HAZUS-MH RAT, you will need to: (1) install the RAT, (2) execute the program, and (3) view the outputs.
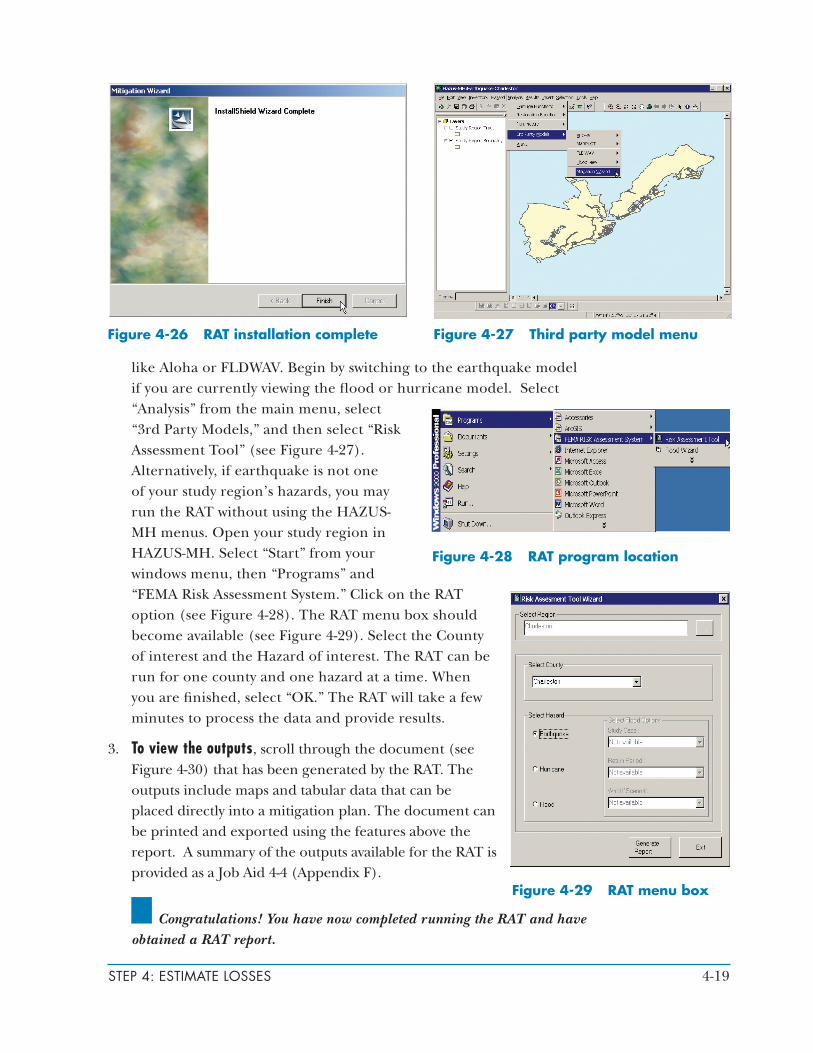
1. To install the RAT, insert the RAT CD (or open the fi le you downloaded) and follow the installation instructions, which should come up as an autorun feature. The RAT installation menu will appear (see Figure 4-24). Click “Next” to proceed. The installation menu will next prompt you for a destination directory (see Figure 4-25). Type the directory name if the default directory is not your preference. Click “Next” to proceed. The installation will proceed with the progress indicated by the status bar in the center of the screen. The installation is complete when the “Finish” option becomes available (see Figure 4-26). Click “Finish.”
2. To execute the program, open your study region in HAZUS-MH. Before running the RAT, make sure that you have run the hazard scenarios in Step 4. There are two ways in which to begin using the RAT. If you selected earthquake as one of your hazards, you may run the RAT as a third party model
Figure 4-25 RAT destination directory
Figure 4-24 RAT installation menu
You can download the Risk Assessment Tool from the following web site: http://www.fema.gov/hazus/tr_main.shtm. Click on “Latest HAZUS Tools Now Available,” to access the fi le.
4-19STEP 4: ESTIMATE LOSSES
like Aloha or FLDWAV. Begin by switching to the earthquake model if you are currently viewing the flood or hurricane model. Select “Analysis” from the main menu, select “3rd Party Models,” and then select “Risk Assessment Tool” (see Figure 4-27). Alternatively, if earthquake is not one of your study region’s hazards, you may run the RAT without using the HAZUS-MH menus. Open your study region in HAZUS-MH. Select “Start” from your windows menu, then “Programs” and “FEMA Risk Assessment System.” Click on the RAT option (see Figure 4-28). The RAT menu box should become available (see Figure 4-29). Select the County of interest and the Hazard of interest. The RAT can be run for one county and one hazard at a time. When you are finished, select “OK.” The RAT will take a few minutes to process the data and provide results.
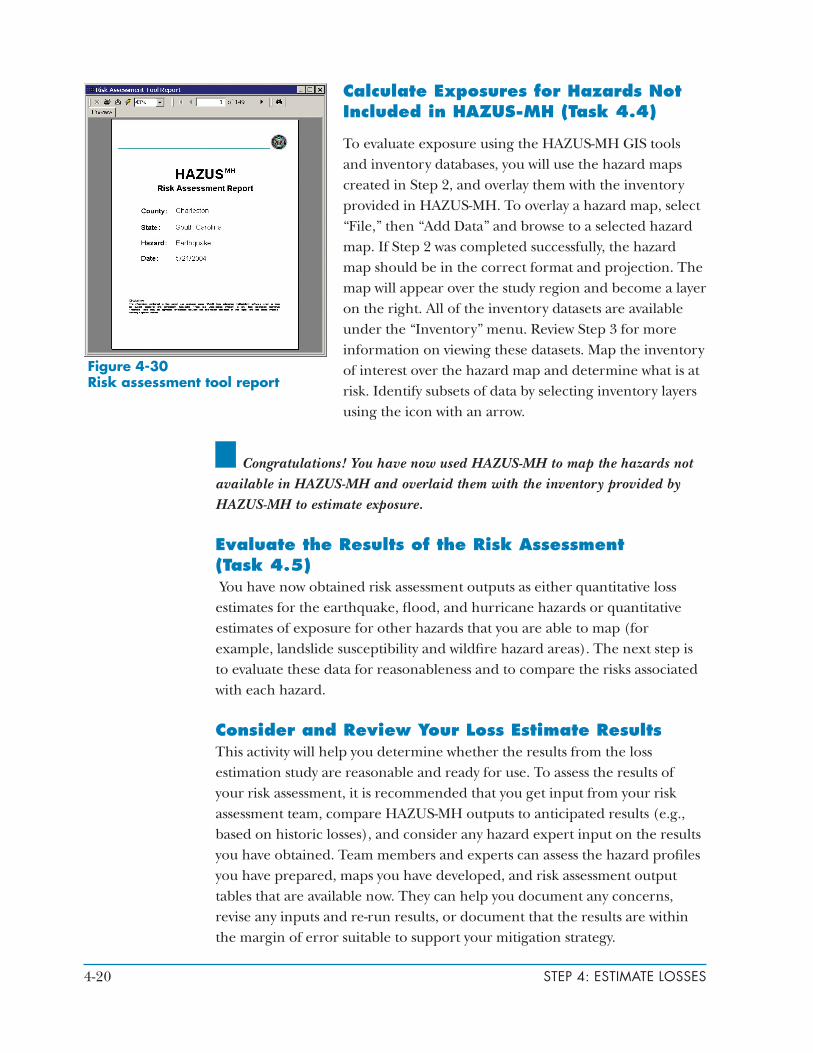
3. To view the outputs, scroll through the document (see Figure 4-30) that has been generated by the RAT. The outputs include maps and tabular data that can be placed directly into a mitigation plan. The document can be printed and exported using the features above the report. A summary of the outputs available for the RAT is provided as a Job Aid 4-4 (Appendix F).
Congratulations! You have now completed running the RAT and have
obtained a RAT report.
Figure 4-26 RAT installation complete Figure 4-27 Third party model menu
Figure 4-28 RAT program location
Figure 4-29 RAT menu box
4-20 STEP 4: ESTIMATE LOSSES
Calculate Exposures for Hazards Not Included in HAZUS-MH (Task 4.4)
To evaluate exposure using the HAZUS-MH GIS tools and inventory databases, you will use the hazard maps created in Step 2, and overlay them with the inventory provided in HAZUS-MH. To overlay a hazard map, select “File,” then “Add Data” and browse to a selected hazard map. If Step 2 was completed successfully, the hazard map should be in the correct format and projection. The map will appear over the study region and become a layer on the right. All of the inventory datasets are available under the “Inventory” menu. Review Step 3 for more information on viewing these datasets. Map the inventory of interest over the hazard map and determine what is at risk. Identify subsets of data by selecting inventory layers using the icon with an arrow.
Congratulations! You have now used HAZUS-MH to map the hazards not available in HAZUS-MH and overlaid them with the inventory provided by HAZUS-MH to estimate exposure.
Evaluate the Results of the Risk Assessment (Task 4.5) You have now obtained risk assessment outputs as either quantitative loss estimates for the earthquake, flood, and hurricane hazards or quantitative estimates of exposure for other hazards that you are able to map (for example, landslide susceptibility and wildfire hazard areas). The next step is to evaluate these data for reasonableness and to compare the risks associated with each hazard.
Consider and Review Your Loss Estimate ResultsThis activity will help you determine whether the results from the loss estimation study are reasonable and ready for use. To assess the results of your risk assessment, it is recommended that you get input from your risk assessment team, compare HAZUS-MH outputs to anticipated results (e.g., based on historic losses), and consider any hazard expert input on the results you have obtained. Team members and experts can assess the hazard profiles you have prepared, maps you have developed, and risk assessment output tables that are available now. They can help you document any concerns, revise any inputs and re-run results, or document that the results are within the margin of error suitable to support your mitigation strategy.
Figure 4-30 Risk assessment tool report
4-21STEP 4: ESTIMATE LOSSES
To consider and review the results of your risk assessment, take the following steps.
1. Use professional judgment. You can use the professional judgment of your risk assessment team to evaluate if the results are within a range of the value you expected or within a margin of error that you feel is acceptable for risk assessment purposes.
2. Review available technical documentation. You also may want to review the documentation of each model provided with the HAZUS-MH user and technical manuals.
3. Ask stakeholder experts for input. It is a good idea to involve appropriate stakeholder experts during all phases of the mitigation planning process. For example, if you are running a risk assessment for a flood, review the HAZUS-MH results with the floodplain manager for the study region. Such experts can assist in data collection, data evaluation, and output consideration. They also can help you “ground-truth” the results of your loss estimation based on their knowledge of past events and their ongoing efforts regarding the hazard of concern. These experts also may support your text regarding the hazard profiles, risk assessment outputs, and long-term data needs to refine your analyses.
4. Consider if development or other factors are impacting your study region. A Level 1 analysis is based on HAZUS-MH provided data. These data include assumptions regarding the hazard characteristics in your area, which may require refinement (Step 2, Identify Hazards) and inventory data that is based on national and regional databases (Step 3, Inventory Assets). If your local conditions change or vary significantly from the HAZUS-MH provided data and you have completed a Level 1 analysis, you may identify areas of your risk assessment that require additional explanation or refinement. Some of these refinements may be feasible for this portion of your risk assessment. Other refinements may become part of your long-term data management or improvement efforts and may warrant a mitigation strategy goal or action to help improve data and assumptions for hazards that are of interest and concern in your community.
5. Revisit your risk assessment, as necessary. If items 1 through 4 raise concerns that you feel must be addressed, you may want to revisit Steps 2, 3, and 4 (especially, hazard characterization inputs and inventory inputs). If you feel that the results are reasonable for your purposes, you can continue forward to use your risk assessment outputs.
After completing your evaluation of results and making adjustments as needed to your hazard and inventory data, you can rerun HAZUS-MH,
4-22 STEP 4: ESTIMATE LOSSES
as necessary, to obtain revised results and outputs. Remember that these evaluation activities can be continued as your mitigation planning efforts evolve and as local data and hazard-specific knowledge improves.
After you complete your first risk assessment effort, it is important to keep your asset inventory and hazard data current so that you are ready when you need to update your risk assessment (e.g., after a major hazard event or to comply with the schedules provided in DMA 2000). Data maintenance and integrity are critical to successful HAZUS-MH implementation.
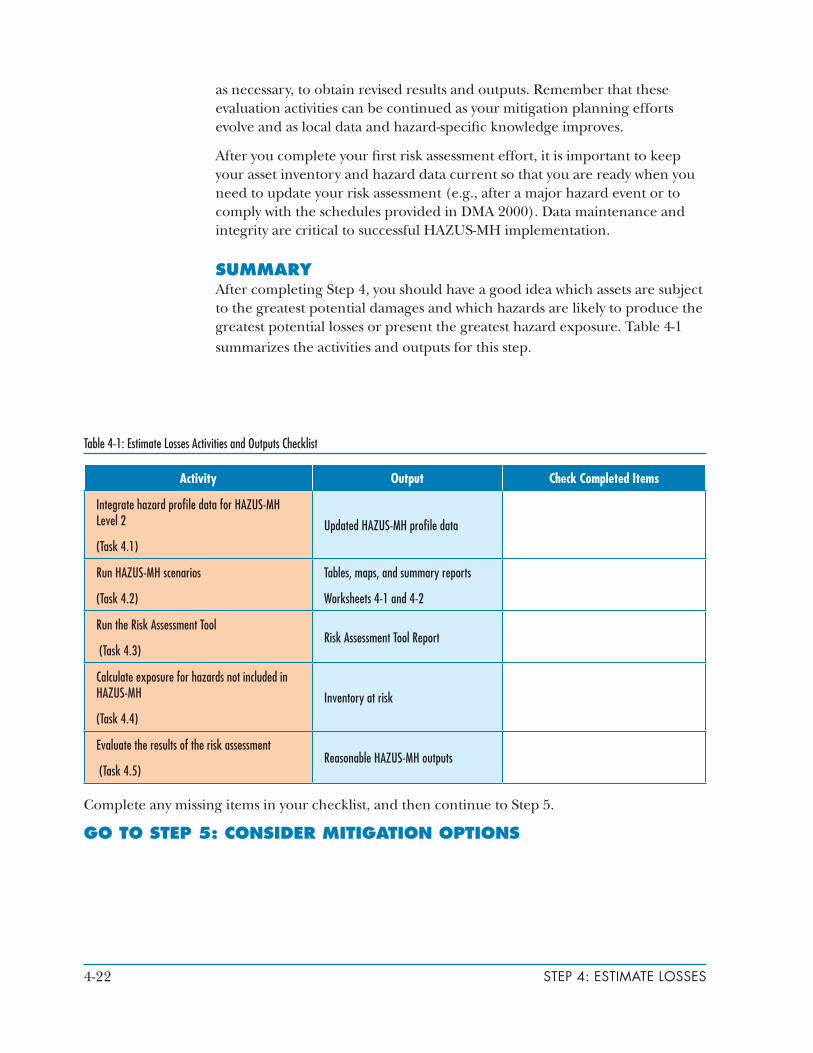
SUMMARYAfter completing Step 4, you should have a good idea which assets are subject to the greatest potential damages and which hazards are likely to produce the greatest potential losses or present the greatest hazard exposure. Table 4-1 summarizes the activities and outputs for this step.
Table 4-1: Estimate Losses Activities and Outputs Checklist
Activity Output Check Completed Items
Integrate hazard profile data for HAZUS-MH Level 2
(Task 4.1)
Updated HAZUS-MH profile data
Run HAZUS-MH scenarios
(Task 4.2)
Tables, maps, and summary reports
Worksheets 4-1 and 4-2
Run the Risk Assessment Tool
(Task 4.3)Risk Assessment Tool Report
Calculate exposure for hazards not included in HAZUS-MH
(Task 4.4)
Inventory at risk
Evaluate the results of the risk assessment
(Task 4.5)Reasonable HAZUS-MH outputs
Complete any missing items in your checklist, and then continue to Step 5.
GO TO STEP 5: CONSIDER MITIGATION OPTIONS
4-23STEP 4: ESTIMATE LOSSES
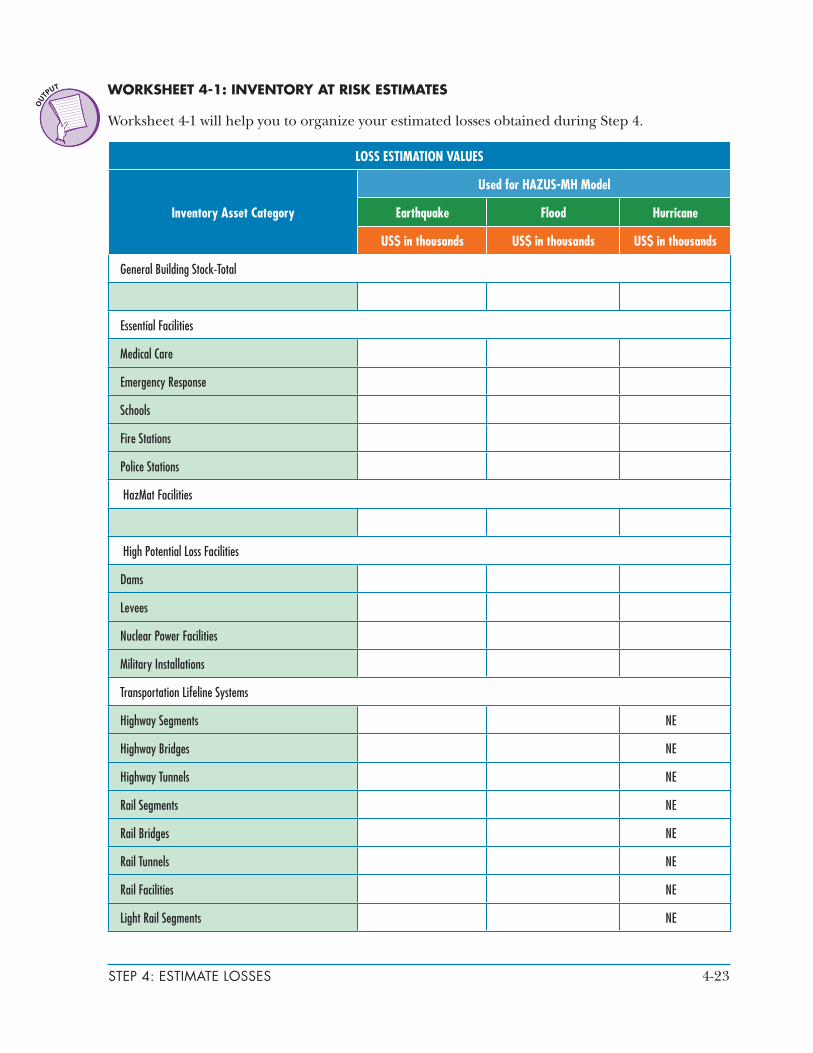
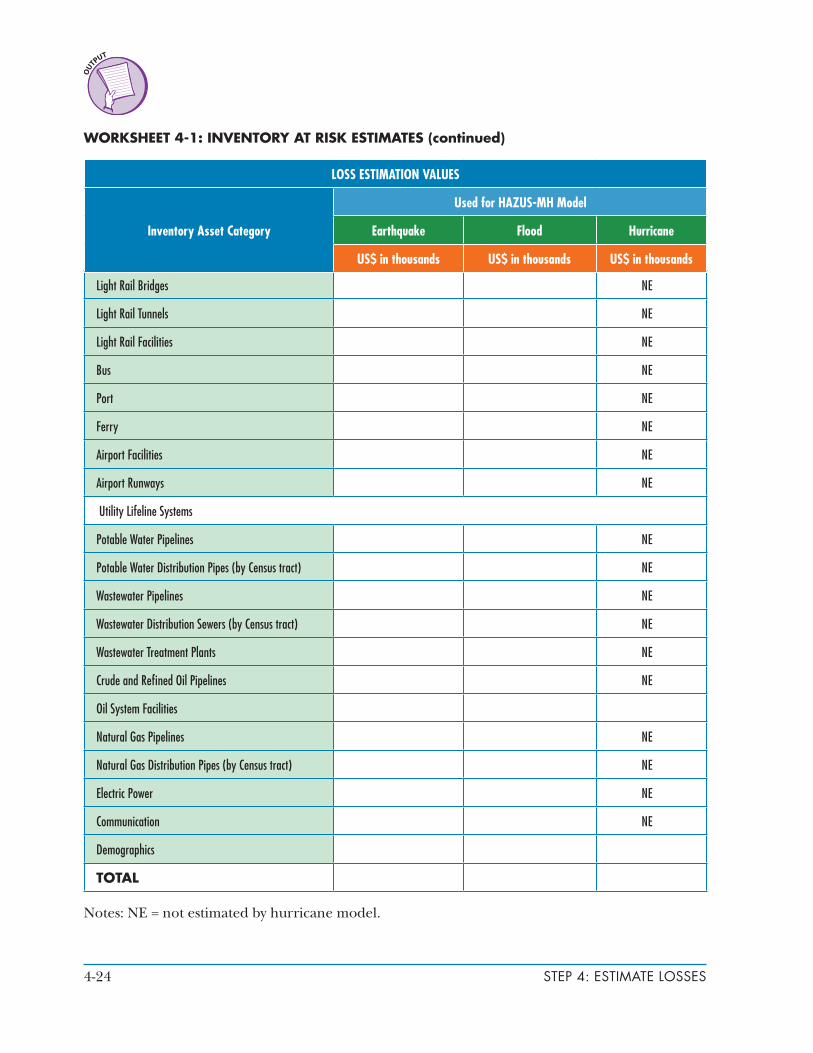
WORKSHEET 4-1: INVENTORY AT RISK ESTIMATES
Worksheet 4-1 will help you to organize your estimated losses obtained during Step 4.
LOSS ESTIMATION VALUES
Inventory Asset Category
Used for HAZUS-MH Model
Earthquake Flood Hurricane
US$ in thousands US$ in thousands US$ in thousands
General Building Stock-Total
Essential Facilities
Medical Care
Emergency Response
Schools
Fire Stations
Police Stations
HazMat Facilities
High Potential Loss Facilities
Dams
Levees
Nuclear Power Facilities
Military Installations
Transportation Lifeline Systems
Highway Segments NE
Highway Bridges NE
Highway Tunnels NE
Rail Segments NE
Rail Bridges NE
Rail Tunnels NE
Rail Facilities NE
Light Rail Segments NE
4-24 STEP 4: ESTIMATE LOSSES
Light Rail Bridges NE
Light Rail Tunnels NE
Light Rail Facilities NE
Bus NE
Port NE
Ferry NE
Airport Facilities NE
Airport Runways NE
Utility Lifeline Systems
Potable Water Pipelines NE
Potable Water Distribution Pipes (by Census tract) NE
Wastewater Pipelines NE
Wastewater Distribution Sewers (by Census tract) NE
Wastewater Treatment Plants NE
Crude and Refined Oil Pipelines NE
Oil System Facilities
Natural Gas Pipelines NE
Natural Gas Distribution Pipes (by Census tract) NE
Electric Power NE
Communication NE
Demographics
TOTAL
Notes: NE = not estimated by hurricane model.
LOSS ESTIMATION VALUES
Inventory Asset Category
Used for HAZUS-MH Model
Earthquake Flood Hurricane
US$ in thousands US$ in thousands US$ in thousands
WORKSHEET 4-1: INVENTORY AT RISK ESTIMATES (continued)
4-25STEP 4: ESTIMATE LOSSES
500-
Year
Ret
urn
Perio
dPo
pula
tion
Resi
dent
ial
Com
mer
cial
Indu
stria
lA
gric
ultu
reRe
ligio
nG
over
nmen
tEd
ucat
ion
Build
ing
Expo
sure
(x
$100
0)
100-
Year
Ret
urn
Perio
dPo
pula
tion
Resi
dent
ial
Com
mer
cial
Indu
stria
lA
gric
ultu
reRe
ligio
nG
over
nmen
tEd
ucat
ion
Build
ing
Expo
sure
(x
$100
0)
500-
Year
Ret
urn
Perio
dPo
pula
tion
Resi
dent
ial
Com
mer
cial
Indu
stria
lA
gric
ultu
reRe
ligio
nG
over
nmen
tEd
ucat
ion
Con
tent
Exp
osur
e (x
$100
0)
100-
Year
Ret
urn
Perio
dPo
pula
tion
Resi
dent
ial
Com
mer
cial
Indu
stria
lA
gric
ultu
reRe
ligio
nG
over
nmen
tEd
ucat
ion
Con
tent
Exp
osur
e (x
$100
0)
500-
Year
Ret
urn
Perio
dPo
pula
tion
Resi
dent
ial
Com
mer
cial
Indu
stria
lA
gric
ultu
reRe
ligio
nG
over
nmen
tEd
ucat
ion
Tota
l Exp
osur
e (x
$100
0)
100-
Year
Ret
urn
Perio
dPo
pula
tion
Resi
dent
ial
Com
mer
cial
Indu
stria
lA
gric
ultu
reRe
ligio
nG
over
nmen
tEd
ucat
ion
Tota
l Exp
osur
e (x
$100
0)
WO
RK
SHEE
T 4
-2: FL
OO
D W
IZA
RD
OU
TPU
TS
Use
Wor
kshe
et 4
-2 to
rec
ord
the
valu
es o
btai
ned
afte
r ru
nnin
g th
e Fl
ood
Wiz
ard
anal
ysis
.
4-26 STEP 4: ESTIMATE LOSSES
500-
Year
Ret
urn
Perio
dPo
pula
tion
Resi
dent
ial
Com
mer
cial
Indu
stria
lA
gric
ultu
reRe
ligio
nG
over
nmen
tEd
ucat
ion
Num
ber o
f Bui
ldin
gs in
Fl
oodp
lain
100-
Year
Ret
urn
Perio
dPo
pula
tion
Resi
dent
ial
Com
mer
cial
Indu
stria
lA
gric
ultu
reRe
ligio
nG
over
nmen
tEd
ucat
ion
Num
ber o
f Bui
ldin
gs in
Fl
oodp
lain
500-
Year
Ret
urn
Perio
dPo
pula
tion
Resi
dent
ial
Com
mer
cial
Indu
stria
lA
gric
ultu
reRe
ligio
nG
over
nmen
tEd
ucat
ion
Build
ing
Loss
in
Floo
dpla
in (x
$100
0)
100-
Year
Ret
urn
Perio
dPo
pula
tion
Resi
dent
ial
Com
mer
cial
Indu
stria
lA
gric
ultu
reRe
ligio
nG
over
nmen
tEd
ucat
ion
Build
ing
Loss
in
Floo
dpla
in (x
$100
0)
500-
Year
Ret
urn
Perio
dPo
pula
tion
Resi
dent
ial
Com
mer
cial
Indu
stria
lA
gric
ultu
reRe
ligio
nG
over
nmen
tEd
ucat
ion
Con
tent
Los
s in
Fl
oodp
lain
(x$1
000)
100-
Year
Ret
urn
Perio
dPo
pula
tion
Resi
dent
ial
Com
mer
cial
Indu
stria
lA
gric
ultu
reRe
ligio
nG
over
nmen
tEd
ucat
ion
Con
tent
Los
s in
Fl
oodp
lain
(x$1
000)
500-
Year
Ret
urn
Perio
dPo
pula
tion
Resi
dent
ial
Com
mer
cial
Indu
stria
lA
gric
ultu
reRe
ligio
nG
over
nmen
tEd
ucat
ion
Tota
l Los
s in
Flo
odpl
ain
(x$1
000)
100-
Year
Ret
urn
Perio
dPo
pula
tion
Resi
dent
ial
Com
mer
cial
Indu
stria
lA
gric
ultu
reRe
ligio
nG
over
nmen
tEd
ucat
ion
Tota
l Los
s in
Flo
odpl
ain
(x$1
000)
WO
RK
SHEE
T 4
-2: FL
OO
D W
IZA
RD
OU
TPU
TS
4-27STEP 4: ESTIMATE LOSSES
EXAMPLE 4-1: ESTIMATE LOSSES
HURRICANE LOSS ESTIMATE FOR AUSTIN, TEXASThe hurricane hazard loss estimate is presented below.
Risk Assessment Data Collection. HAZUS-MH provided inventory data were augmented for Austin-critical facilities. Therefore, the “critical facilities” considered in this risk assessment included Austin-critical facilities, essential facilities, special facilities, HazMat facilities, transportation lifeline systems, and utility lifeline systems, as shown in the table below. Population data were taken from the HAZUS-MH provided data, which is based on the most recent Census conducted in 2000; local data correlated closely to the HAZUS-MH Census data.
Hazard Model Development. Because this hazard was analyzed using the HAZUS-MH software, additional model development efforts were not required. No local hazard data to update the model components were identifi ed as necessary or available.
Risk Assessment Methodology. The hurricane module of HAZUS-MH was used and provided loss estimations for: General building stock and critical facilities. Other loss estimates included displaced households and shelter requirements. The 100- and 500-year mean return period (MRP) events were analyzed. Annualized losses also were estimated.
Estimated Damages and Losses. Property damage due to the hurricane hazard was summarized by occupancy class in the table below. The total estimated loss for a hurricane with a severity equal to a 500-year MRP was approximately $1.4 billion. Residential buildings accounted for about 86 percent of the total losses for this event. Because of differences in building construction, residential structures were more susceptible to wind damage than commercial and industrial structures. The damage counts included buildings damaged at all severity levels from slight damage to total destruction. The total dollar damage represented the overall impact to individual buildings at an aggregate level.
4-28 STEP 4: ESTIMATE LOSSES
EXAMPLE 4-1 (continued)
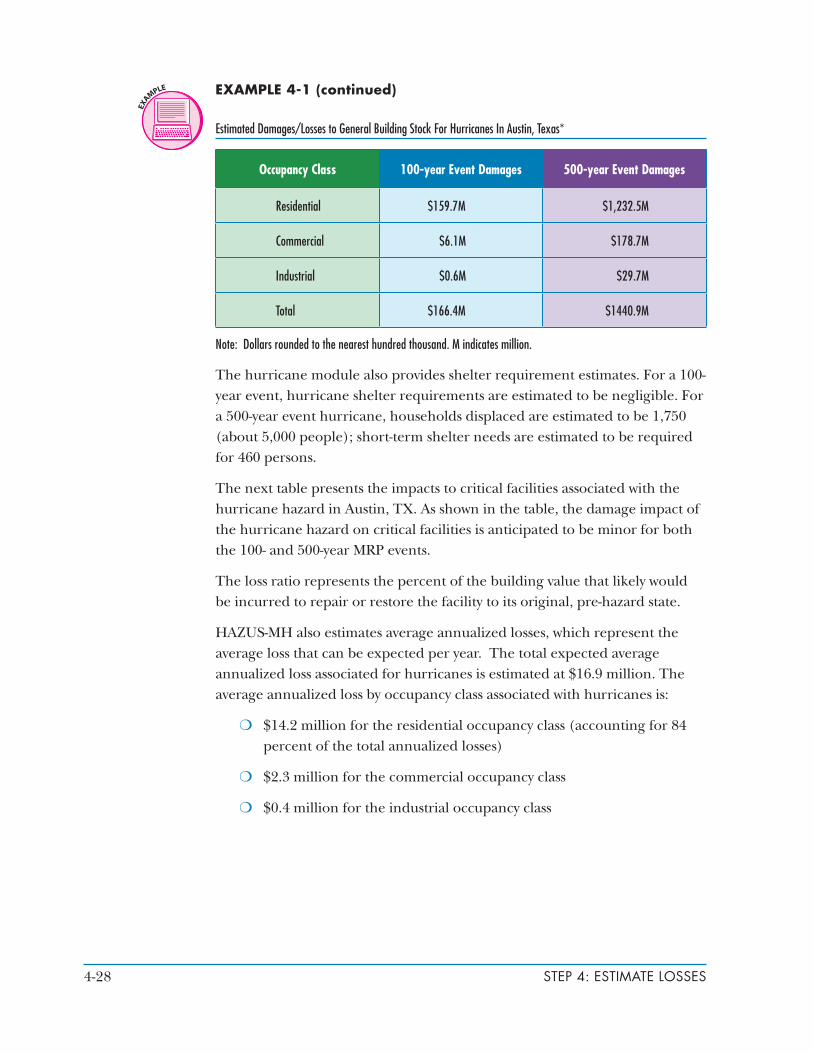
Estimated Damages/Losses to General Building Stock For Hurricanes In Austin, Texas*
Occupancy Class 100-year Event Damages 500-year Event Damages
Residential $159.7M $1,232.5M
Commercial $6.1M $178.7M
Industrial $0.6M $29.7M
Total $166.4M $1440.9M
Note: Dollars rounded to the nearest hundred thousand. M indicates million.
The hurricane module also provides shelter requirement estimates. For a 100-year event, hurricane shelter requirements are estimated to be negligible. For a 500-year event hurricane, households displaced are estimated to be 1,750 (about 5,000 people); short-term shelter needs are estimated to be required for 460 persons.
The next table presents the impacts to critical facilities associated with the hurricane hazard in Austin, TX. As shown in the table, the damage impact of the hurricane hazard on critical facilities is anticipated to be minor for both the 100- and 500-year MRP events.
The loss ratio represents the percent of the building value that likely would be incurred to repair or restore the facility to its original, pre-hazard state.
HAZUS-MH also estimates average annualized losses, which represent the average loss that can be expected per year. The total expected average annualized loss associated for hurricanes is estimated at $16.9 million. The average annualized loss by occupancy class associated with hurricanes is:
❍ $14.2 million for the residential occupancy class (accounting for 84 percent of the total annualized losses)
❍ $2.3 million for the commercial occupancy class
❍ $0.4 million for the industrial occupancy class
4-29STEP 4: ESTIMATE LOSSES
EXAMPLE 4-1 (continued)
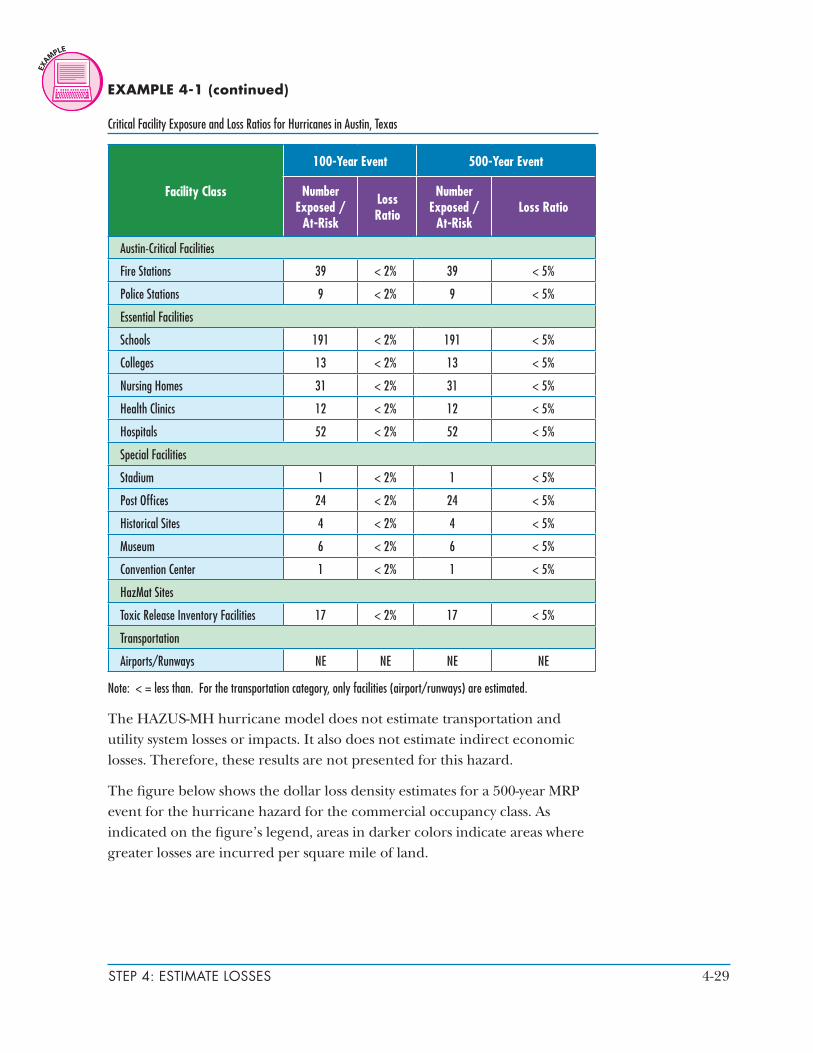
Critical Facility Exposure and Loss Ratios for Hurricanes in Austin, Texas
Facility Class
100-Year Event 500-Year Event
Number Exposed /
At-Risk
Loss Ratio
Number Exposed /
At-RiskLoss Ratio
Austin-Critical Facilities
Fire Stations 39 < 2% 39 < 5%
Police Stations 9 < 2% 9 < 5%
Essential Facilities
Schools 191 < 2% 191 < 5%
Colleges 13 < 2% 13 < 5%
Nursing Homes 31 < 2% 31 < 5%
Health Clinics 12 < 2% 12 < 5%
Hospitals 52 < 2% 52 < 5%
Special Facilities
Stadium 1 < 2% 1 < 5%
Post Offices 24 < 2% 24 < 5%
Historical Sites 4 < 2% 4 < 5%
Museum 6 < 2% 6 < 5%
Convention Center 1 < 2% 1 < 5%
HazMat Sites
Toxic Release Inventory Facilities 17 < 2% 17 < 5%
Transportation
Airports/Runways NE NE NE NE
Note: < = less than. For the transportation category, only facilities (airport/runways) are estimated.
The HAZUS-MH hurricane model does not estimate transportation and utility system losses or impacts. It also does not estimate indirect economic losses. Therefore, these results are not presented for this hazard.
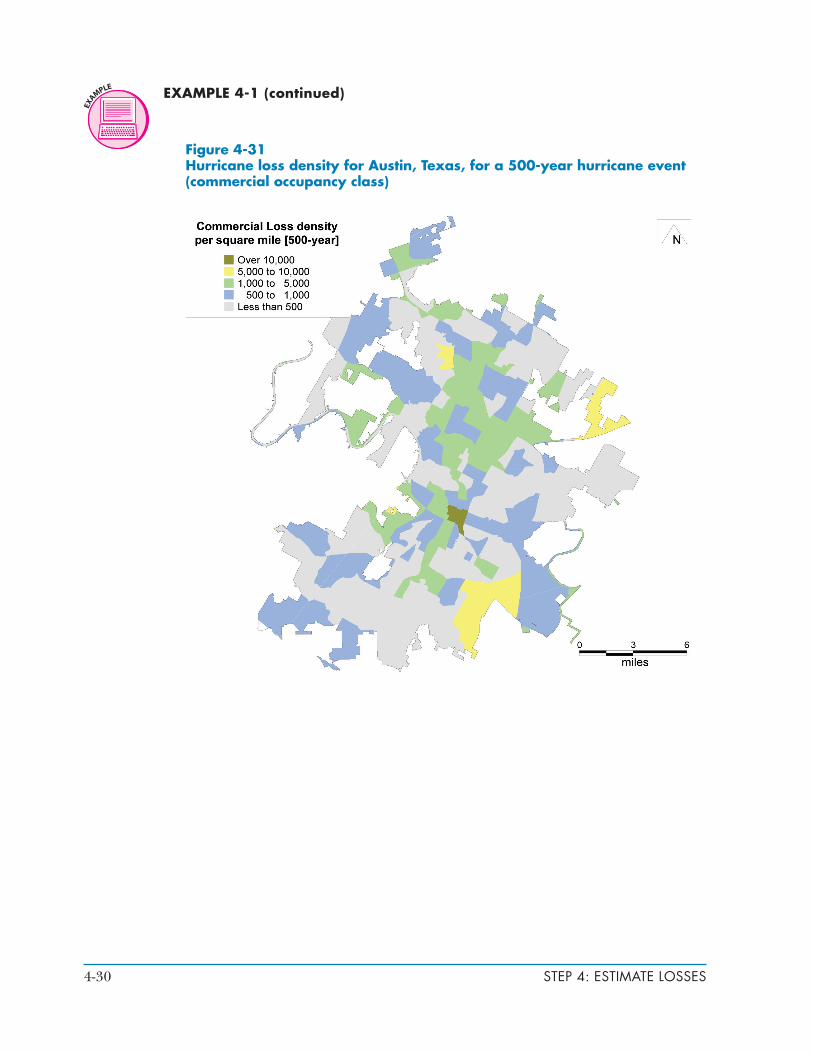
The figure below shows the dollar loss density estimates for a 500-year MRP event for the hurricane hazard for the commercial occupancy class. As indicated on the figure’s legend, areas in darker colors indicate areas where greater losses are incurred per square mile of land.
4-30 STEP 4: ESTIMATE LOSSES
Figure 4-31 Hurricane loss density for Austin, Texas, for a 500-year hurricane event (commercial occupancy class)
EXAMPLE 4-1 (continued)