Embed Size (px)
Citation preview


NUCLEAR ENERGY AROUND US
J. Turło, K. Służewski, Z. Turło
The Institute of Physics, Nicholas Copernicus University in Torun

Introduction1896 - Henri Bequerel - discovery of radioactivity1898 - M. Sklodowska-Curie - discovery of polonium1900 - Friedrich Ernst Dorn - discovery of radon (niton)1923 - niton named radon
Maria Skłodowska – Curie in laboratory

STEDE (2001-2004)
(Science Teacher Education Development in Europe)
Group 10a: The use of distance learning in science teachers education.
Członkowie grupy
Ellermeijer A.L. University of Amsterdam NL
Dorenbos Vincent University of Amsterdam NL
Demkanin Peter Comenius University SK
Pisut J an Comenius University SK
Lang Manf red University of Kiel DE
Turło J ózefina Nicholas Copernicus University PL
Służewski Krzysztof Nicholas Copernicus University PL
Karbowski Andrzej Nicholas Copernicus University PL
Pinto Roser Universitat Autònoma de Barcelona ES
MacGourthy Frank University of Limerick, Castletroy I E
Meleady Sindy University of Limerick, Castletroy I E
I snes Anders University of Oslo NO
J orde Doris University of Oslo NO
Pata Kai University of Tartu EE
Laane Tiiu University of Tartu EE


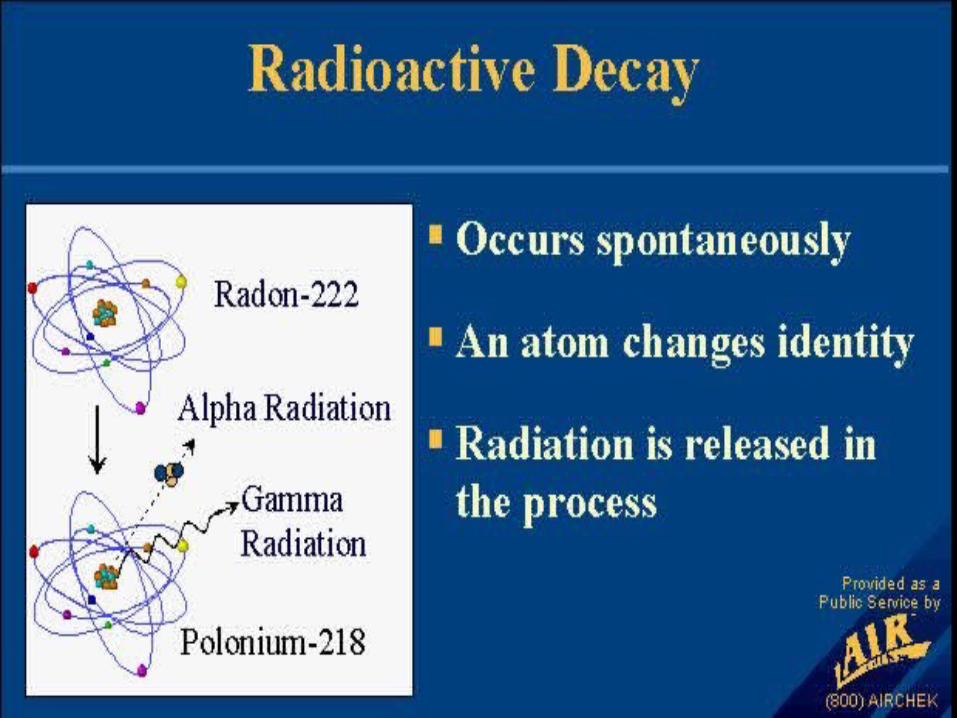

Radioactive decay of 238U
238U
222Rn
4.5*109 lat
4.2MeV
234U
234Pa
234Th 230Th
3.8 dni
5.5MeV

What are the sources of radon?
• soil and rocks,
• ground and running water,
• natural gas,
• building materials,
• tobacco (cigarettes),
• geothermal sources.

RADON IN OUR HOMES
cavities in wallsgaps in florboats
construction joints
cracks in walls
cracks in solid floor
graps around service pipes
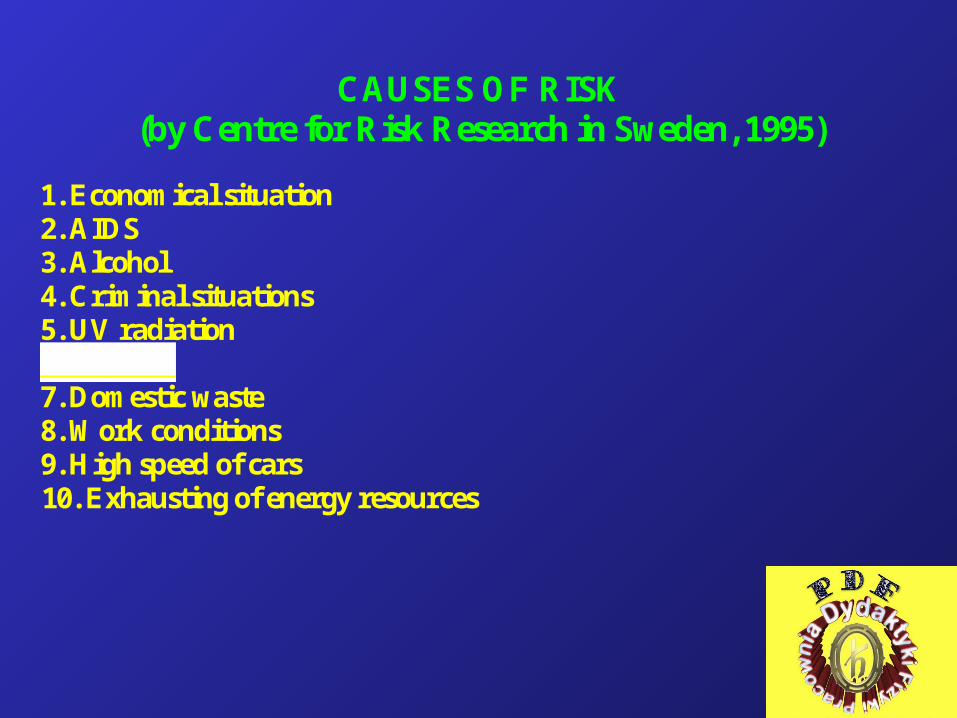
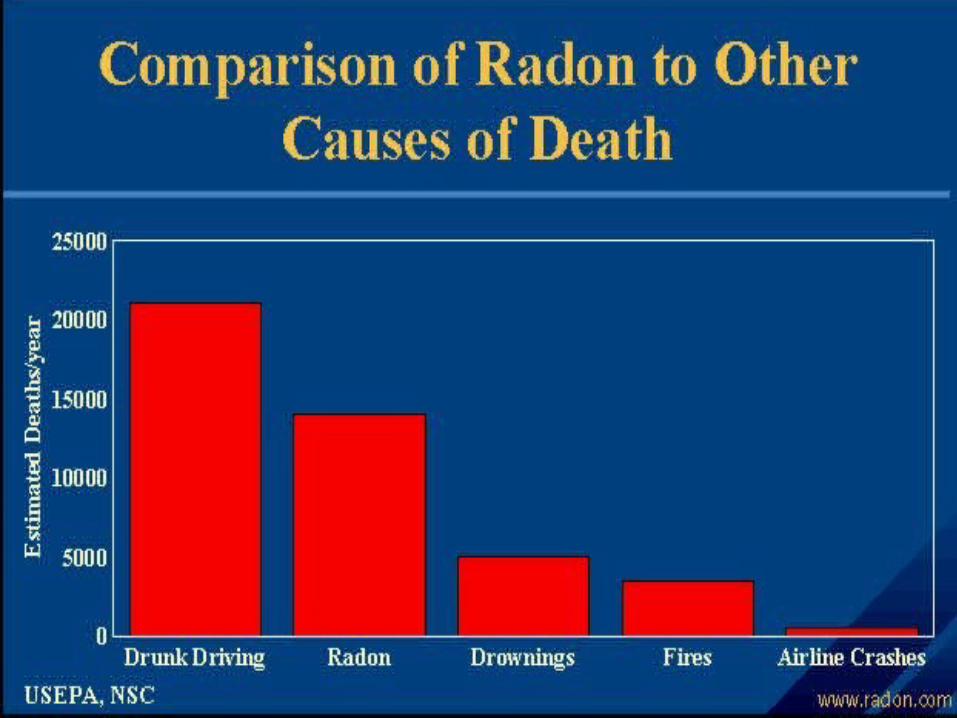
CAUSES OF RISK(by Centre for Risk Research in Sweden, 1995)
1. Economical situation2. AIDS3. Alcohol4. Criminal situations5. UV radiation6. RADON 7. Domestic waste8. Work conditions9. High speed of cars10. Exhausting of energy resources
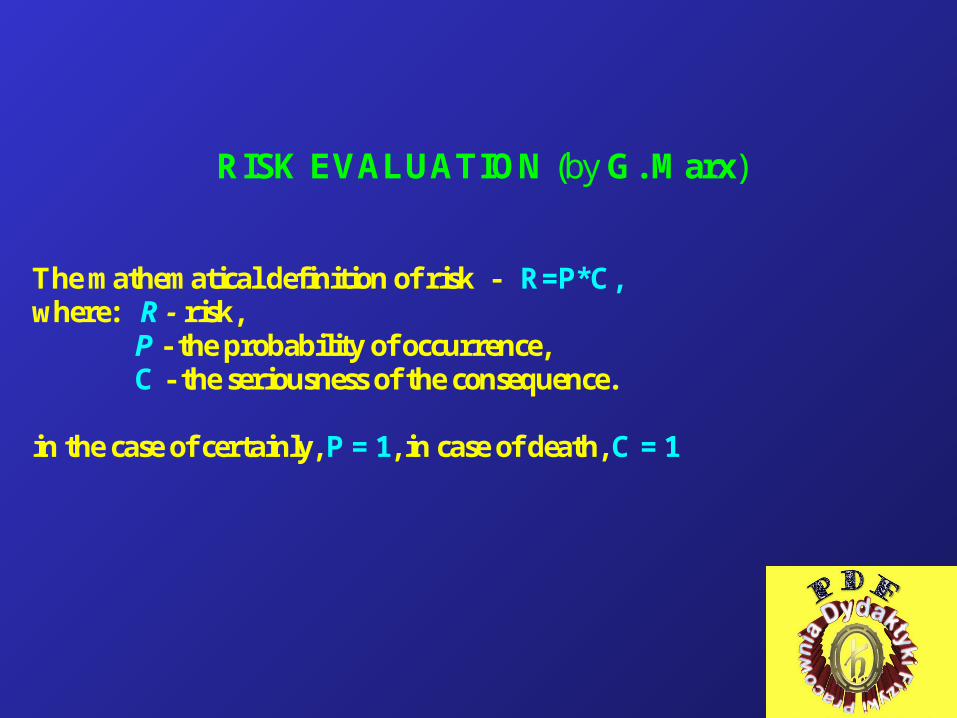
RISK EVALUATION (by G. Marx)
The mathematical definition of risk - R=P*C,where: R - risk,
P - the probability of occurrence, C - the seriousness of the consequence.
in the case of certainly, P = 1, in case of death, C = 1

Microrisk - 1 in a million i.e. as a risk through which 1 in a millionpeople exposed may be killed
International experience indicates that one microrisk is incurred when: travelling 2500 km by train, flying 2000 km by plane, travelling 80 km by bus, driving a car for 65 km, bicycling for 12 km, smoking 1 cigarette, living 2 weeks with a smoker, drinking half a litre of wine, breathing in any polluted city for 3 days.
A dose equivalent of 1 mSv increases the risk of lethal leukemia and cancer byabout 50 microrisks

I. RADONET PROJECT for teachers and their students
1. Educational objectives of the project
Students have to realise, that there are probable correlations between the concentration ofradon in homes and cancer and leukaemia diseases, which require to develop their: skills of making individual science investigations, ability of logical thinking and making rational decisions based on the evidence, skills of using information presented in different forms (tables, diagrams etc.) and from
different sources (encyclopaedias, multimedia, including foreign literature, Internetinformation)
ability to co-operate with medicine and environmental centres in town and with otherstudents.
ability to integrate knowledge and skills from physics, chemistry, biology, medicine andhealth education.

I. RADONET PROJECT for teachers and their students
2. Method of studies - passive - TASTRAK detectors
3. Time - 3 lessons
4. Students’ tasks
5. Tasks for the teacher
6. Appendix

I. RADONET PROJECT for teacher and their students
4. Students’ tasks:1. Take part in a discussion on radioactivity.2. Through group discussion, put forward your plan to investigate
the radon levels in your home and be able to compare this with theresults of others.
3. Determine the radon concentration levels in your home.4. Determine the microrisk and put forward suggestions as to whether
this risk is acceptable.5. Comment on actions that can be taken where the risks are not
acceptable.6. Comment the fact that people choose to tolerate the substantial risks
posed by radon while taking action to reduce other risks that are notso great.

I. RADONET PROJECT for teacher and their students
5. Tasks for the Teacher1. To get acquainted with the problems of ionising radiation and radon.2. To interest students in problems related to radioactive gas radon in the environment.3. To organise and supervise the experiment performance.4. To collect students' data, compare the results and drawn the
conclusions.5. To discuss the results.6. To realise the risks of radon penetration to the human body and
possibility of diseases caused by the high radioactivity doses.7. To talk over the possibilities to solve problems connected with risk
caused by the high radon concentration in homes.
I. RADONET PROJECT for teacher and their students
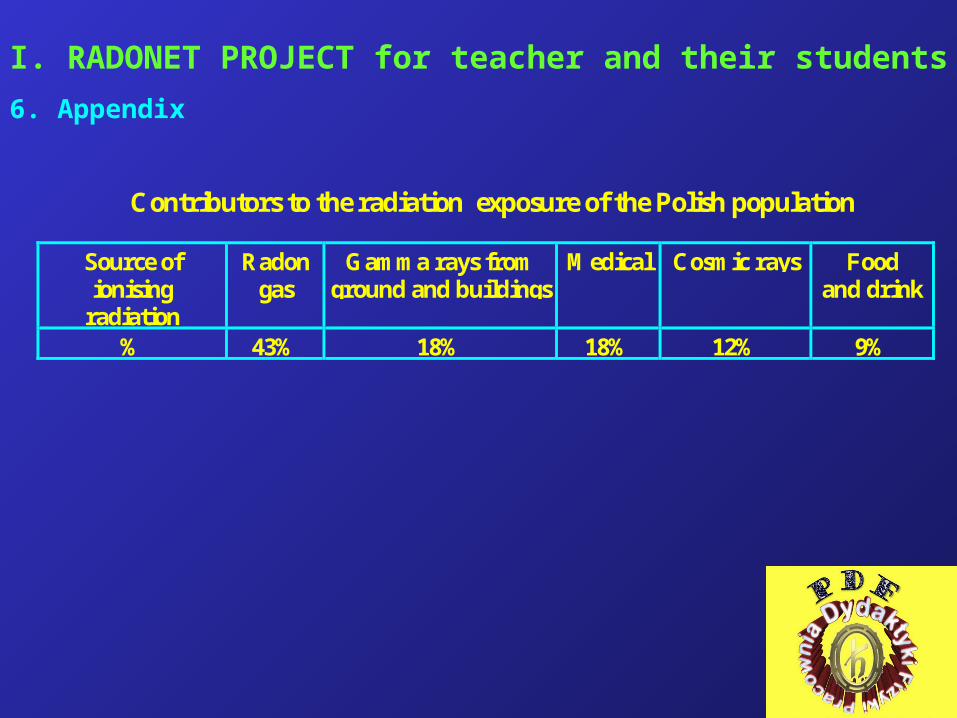
6. Appendix
Contributors to the radiation exposure of the Polish population
Source ofionising
radiation
Radongas
Gamma rays fromground and buildings
Medical Cosmic rays Foodand drink
% 43% 18% 18% 12% 9%
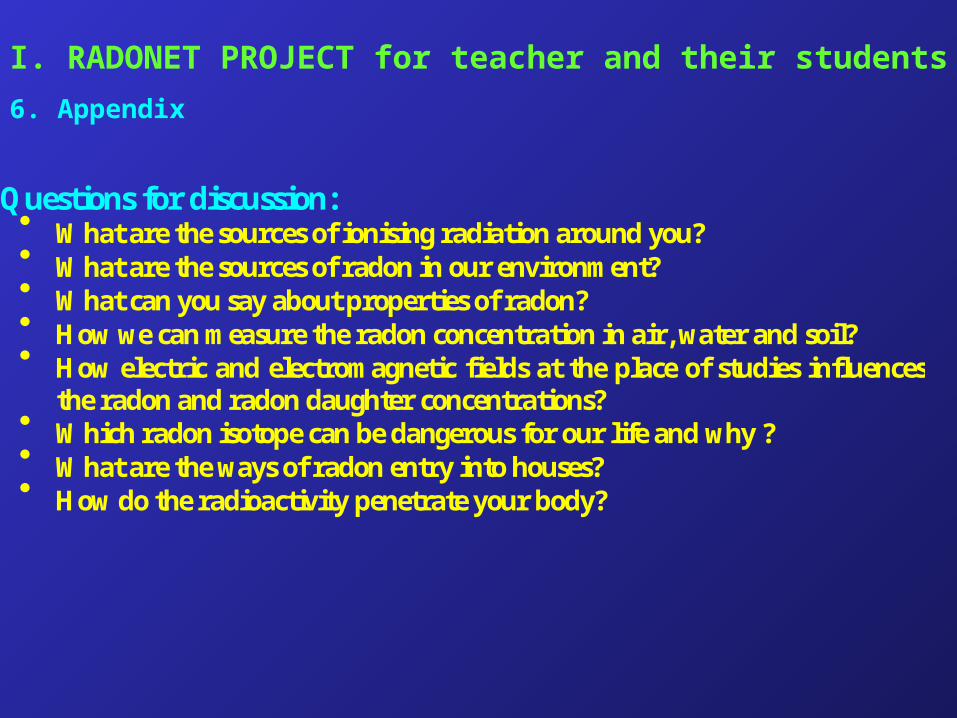
I. RADONET PROJECT for teacher and their students
6. Appendix
Questions for discussion: What are the sources of ionising radiation around you? What are the sources of radon in our environment? What can you say about properties of radon? How we can measure the radon concentration in air, water and soil? How electric and electromagnetic fields at the place of studies influences
the radon and radon daughter concentrations? Which radon isotope can be dangerous for our life and why ? What are the ways of radon entry into houses? How do the radioactivity penetrate your body?
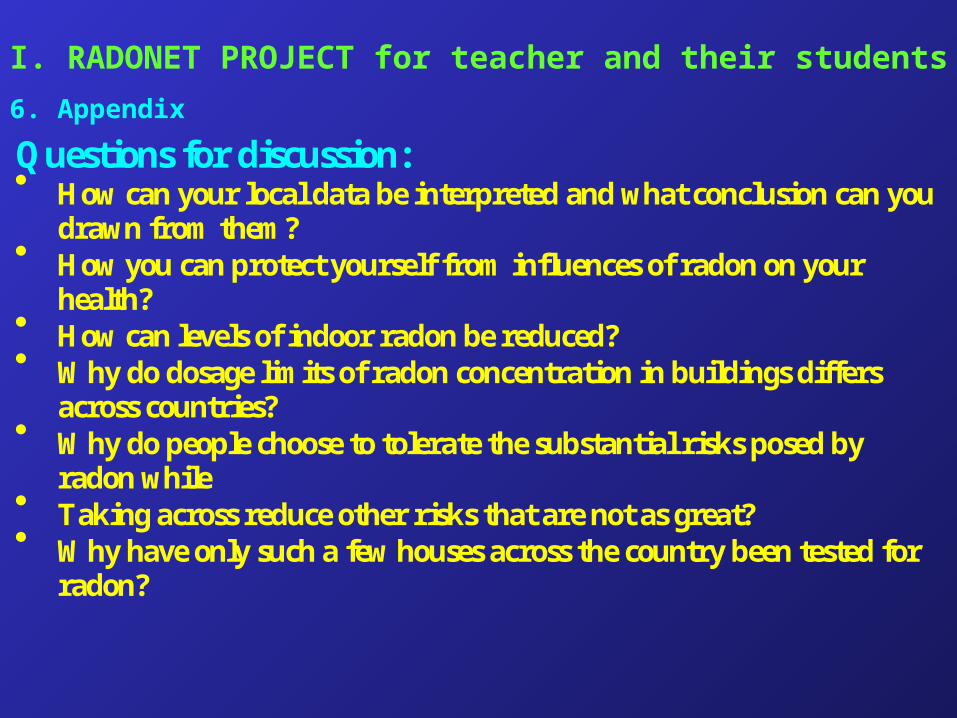
Questions for discussion: How can your local data be interpreted and what conclusion can you
drawn from them? How you can protect yourself from influences of radon on your
health? How can levels of indoor radon be reduced? Why do dosage limits of radon concentration in buildings differs
across countries? Why do people choose to tolerate the substantial risks posed by
radon while Taking across reduce other risks that are not as great? Why have only such a few houses across the country been tested for
radon?
I. RADONET PROJECT for teacher and their students
6. Appendix
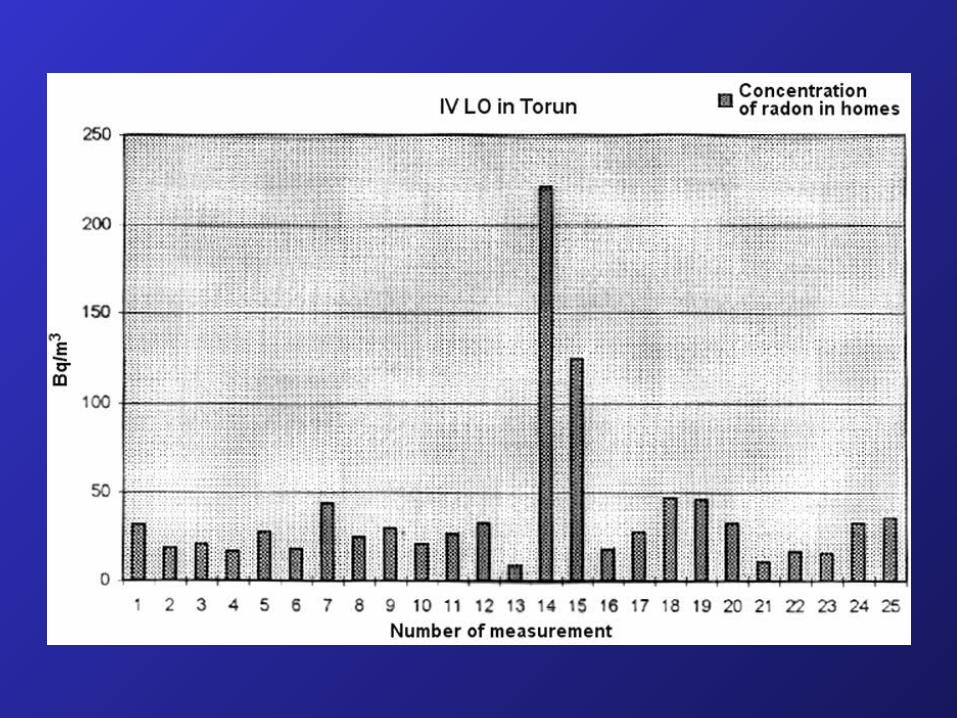

„Radon map” of Torun

Radon in our homes
13
81
92 95
7872
58
38
1913
72 1
0
20
40
60
80
100
0-10 21-30 41-50 61-70 81-90 151-250 351-690Bq/m3
Number of measurements

Map of radon concentration in different regions of Poland
Legend:0 [Bq/m3] - no data1-50 - Bydgoszcz, Torun, Włocławek regions,51-100 - Częstochowa, Gorzow, Pila, Przemysl, Warszawa,
Jeleniogora, Walbrzych regions,101-150 - Olsztyn, Wrocław regions,151-220 - Krakow region.

II. Ionising radiation of radon and his daughter in electric and electromagnetic fields
1. Introduction Investigations of Henshow (Bristol) attraction of radon daughter to
everyday sources of E-H - fields and high voltage power lines.
Measurements of radon daughter concentrations at TV and computermonitor screens, at traffic, at cemetery, etc.
Investigations in high electric and electromagnetic fields as a function of: electric field lines distribution, distance from the source of field, geometry of the source and his polarisation, humidity.

2. Experimental setup
The scheme of experimental setup

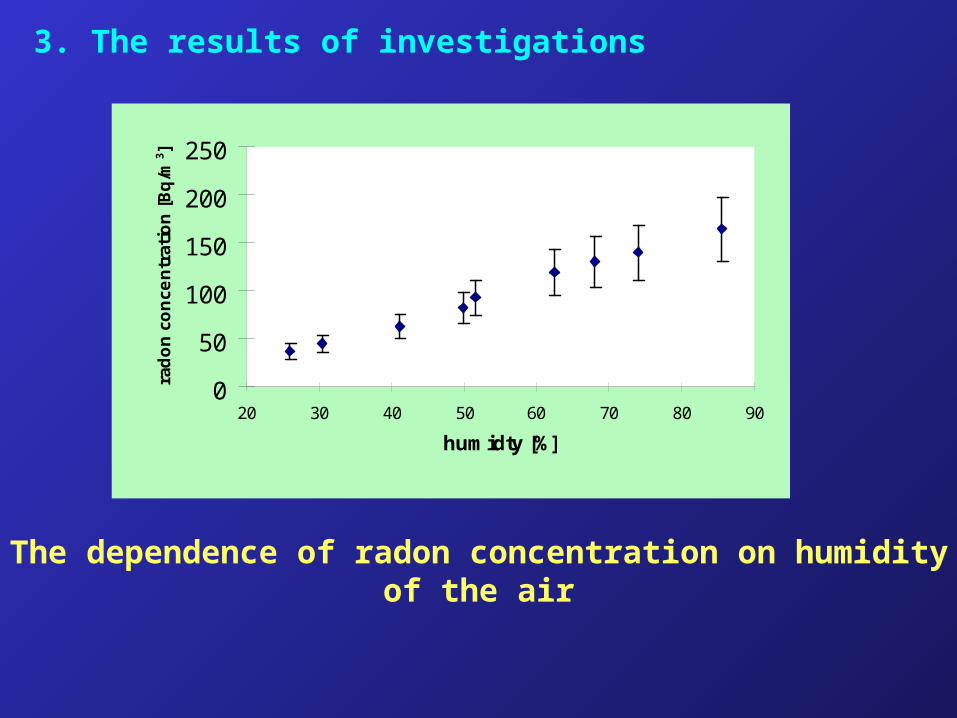
3. The results of investigations
10
12
14
16
18
20
22
24
26
28
30
Time of measurements
Rad
on
co
nce
ntr
atio
n [B
q/m
3 ]
Plac Rapackiego Grudziądzka Cmentarz
Comparison of radon concentration in different places in Torun

3. The results of investigations
TASTRAK plates exposed to high electric fields with different electric field line distribution

3. The results of investigations
0
2000
4000
6000
8000
10000
12000
14000
16000
0 5 10 15 20 25 30Distance from the source of electric field [cm]
S/S
t [j.w
.]
3000V 5000V 7000V 9000V
The dependence of radon/radon daughters concentrations as the function of distance from the source of positive polarised electric fields
3000, 5000, 7000 and 9000 V
3. The results of investigations
0
50
100
150
200
250
20 30 40 50 60 70 80 90
humidty [%]
rad
on
co
nce
ntr
atio
n [
Bq
/m3]
The dependence of radon concentration on humidity of the air