Embed Size (px)
Citation preview
University of Nebraska - LincolnDigitalCommons@University of Nebraska - LincolnNutrition and Health Sciences -- FacultyPublications Nutrition and Health Sciences, Department of
11-2017
Stature, Body Mass, and BMI in High SchoolAmerican Football Players: Appropriatedeterminants of obesity prevalence?Alegra I. MendezUniversity of Nebraska-Lincoln
Amelia A. MiramontiUniversity of Nebraska-Lincoln
Zachary M. GillenUniversity of Nebraska-Lincoln
Brianna D. McKayUniversity of Nebraska-Lincoln
Todd J. LeutzingerUniversity of Nebraska-Lincoln
See next page for additional authors
Follow this and additional works at: http://digitalcommons.unl.edu/nutritionfacpub
Part of the Human and Clinical Nutrition Commons, Molecular, Genetic, and BiochemicalNutrition Commons, and the Other Nutrition Commons
This Article is brought to you for free and open access by the Nutrition and Health Sciences, Department of at DigitalCommons@University ofNebraska - Lincoln. It has been accepted for inclusion in Nutrition and Health Sciences -- Faculty Publications by an authorized administrator ofDigitalCommons@University of Nebraska - Lincoln.
Mendez, Alegra I.; Miramonti, Amelia A.; Gillen, Zachary M.; McKay, Brianna D.; Leutzinger, Todd J.; and Cramer, Joel T., "Stature,Body Mass, and BMI in High School American Football Players: Appropriate determinants of obesity prevalence?" (2017). Nutritionand Health Sciences -- Faculty Publications. 103.http://digitalcommons.unl.edu/nutritionfacpub/103

AuthorsAlegra I. Mendez, Amelia A. Miramonti, Zachary M. Gillen, Brianna D. McKay, Todd J. Leutzinger, and Joel T.Cramer
This article is available at DigitalCommons@University of Nebraska - Lincoln: http://digitalcommons.unl.edu/nutritionfacpub/103

Journal of Strength and Conditioning Research Publish Ahead of PrintDOI: 10.1519/JSC.0000000000002347
Stature, Body Mass, and BMI in High School American Football Players:
Appropriate determinants of obesity prevalence?
Short Running Title: BMI in High School in American Football Players
Alegra I. Mendez, Amelia A. Miramonti, Zachary M. Gillen, Brianna D. McKay, Todd J.
Leutzinger,
Joel T. Cramer
Department of Nutrition and Health Sciences, University of Nebraska-Lincoln
Correspondence To: Joel T. Cramer
University of Nebraska, Lincoln
Room 211 Leverton Hall
1700 N. 35th St.
Lincoln, NE 68583-0806
Phone Number: (402) 472-7533
E-mail Address: [email protected]

ABSTRACT
The purpose of this study was to evaluate stature (HT), weight (WT), body mass index
(BMI), and obesity prevalence based on BMI categories in a large sample (n = 7,175) of high
school American football players enrolled as freshmen, sophomores, or juniors. Players were
categorized by their positions: offensive linemen (OL), defensive linemen (DL), tight end (TE),
defensive end (DE), linebacker (LB), running back (RB), quarterback (QB), defensive back (DB),
and wide receiver (WR). HT, WT, and BMI increased as grade increased among all positions. OL
and DL had the greatest HT, WT, and BMI (p≤0.05). Obesity prevalence was greatest in OL and
DL. When accounting for age-related increases in BMI, WT increased to a greater degree than
HT. If HT is an indirect indicator of skeletal size, while WT is more influenced by soft tissue, then
the age-related BMI increases in the present study may be largely accounted for by soft tissue
changes rather than skeletal growth. Even though obesity prevalence in OL (94.5%) and DL
(78.4%) positions was greater than all other positions as determined from BMI, it is impossible
to know the allocations of fat-free and fat mass—particularly in American football athletes. If
obesity continues to be defined as an unhealthy accumulation of fat, then athletes who may
have a greater relative proportion of lean soft tissue should not be classified as obese using BMI
(WT÷HT²). More sophisticated, reliable, and sensitive measure of body composition, such as
skinfolds, may be more appropriate field measurements.
Key Words: athlete, health, fat-free mass

BMI in High School American Football Players 2
INTRODUCTION
High school American football has the highest participation numbers in the United
States, with over one million high school participants in the 2015-2016 season; 99.8% of
participants being males (27). American football players may also have a greater prevalence of
obesity than players of other sports, including soccer, basketball, baseball, and wrestling when
only considering BMI (37). This is concerning since obesity is associated with orthopedic,
endocrinal, gastroenterological, pulmonary, neurological, and psychological consequences (6,
26). Obesity is also a risk factor for diseases such as type II diabetes and coronary heart disease
(26, 37).
Obesity is conceptually defined as an unhealthy accumulation of fat (9). Yet the Centers
for Disease Control and Prevention (CDC) define obesity as a body mass index (BMI, kg/m²) of
30 or greater for adults, and as a BMI above the 95th
percentile for that age and gender for
youth (9). Counterintuitively, BMI calculations only include height (HT) and weight (WT)
measurements with no direct measurement of fat mass. Simple measurements of HT and WT,
while convenient, are incapable of determining fat-free and fat mass. Despite BMI being
criticized as an invalid indicator of obesity (33), it continues to be used as the predominant
marker of obesity.
The development of BMI as a way to determine obesity started with analyses of data
from life insurance companies that contained standard values of height and weight that were
considered “normal” (2). Based on the formula devised by the statistician Adolphe Quetelet:
��� = ��
��

BMI in High School American Football Players 3
Ancel Keys named the formula the “body mass index” and attempted to develop more globally-
representative reference values to which individual BMI values could be compared by sampling
men from the USA, South Africa, Italy, Finland, and Japan (2, 18). The majority of men sampled
were business and professional men, not primarily athletes, suggesting that they likely had
lower fat-free mass than American football players or other athletes (18). Furthermore, the
references that Keys analyzed to determine the accuracy of the BMI formula included only
adult men and did not study women or children (14). As children grow, their body proportions
change at varying rates depending on their age, until adulthood when body proportions are
more consistent (1). Since the development of Keys’ reference, different organizations,
including the World Health Organization (WHO), International Obesity Taskforce (IOTF), and
CDC have created their own references for different ages and genders and developed cut-offs
for underweight, normal weight, overweight, and obese values (1). Thus, if BMI was originally
developed and analyzed using adult men without considering athletes, women, or children, the
validity of using BMI for classifying obesity in these populations may be questionable.
The BMIs of collegiate (3, 5, 28, 30) and professional (11, 19, 30) American football
players have been previously reported. In collegiate American football athletes, offensive
linemen (OL) and defensive linemen (DL) are reported to have the highest BMIs, which has
been interpreted as a higher prevalence of obesity compared to other positions. In a cross-
sectional study of collegiate American football players, Mathews et al. reported that linemen
(OL and DL) are classified as obese by BMI, waist circumference, and percent body fat (24).
Similarly, Bosch et al. concluded that all American football positions had healthy percentages of
body fat except for OL and DL (3). Buell et al. examined anthropometric measures and blood
BMI in High School American Football Players 4
samples of collegiate linemen and found that 49% had exhibited risk factors associated with the
metabolic syndrome (5). Noel et al. showed that OL, DL, and tight ends (TE) have greater than
25% body fat and are considered borderline obese by body fat percentage (28). A meta-analysis
of both collegiate and professional players by Pincivero et al. (30) also found that OL and DL
have the greatest body fat percentages. Similar results have been reported for professional
American football athletes (11, 19). Kraemer et al. reported the body fat percentage of OL and
DL to be significantly greater than all other positions (19). Dengel et al. (11) concluded that all
positions were considered lean by body fat percentage, except for OL and DL, which were
classified as obese. Thus, it has been consistently demonstrated that OL and DL collegiate
athletes have greater body fat percentages that other positions. While the findings of collegiate
and professional American football athletes are consistent, less is known about younger
American football athletes.
A few studies have examined stature (HT), weight (WT), and BMI characteristics and
obesity prevalence in youth American football players as compared to their collegiate and
professional counterparts. When using BMI, Malina et al. (23) found that the rate of obesity is
45% among all the positions, and OL and DL have the greatest risk for being obese in youth
American football players (9 – 14 years). Laurson et al. (21) examined BMIs of high school
American football linemen and reported that 45% had a BMI above the 95th
percentile for their
age. However, Laurson et al. (21) examined 3,683 high school linemen (OL, DL), but no other
positions. The results by Malina et al. (23) and Laurson et al. (21) show a lower prevalence of
obesity in young players compared to collegiate and professional American football players
using BMI, but BMI may not be appropriate for assessing obesity. To illustrate, Etchison et al.
BMI in High School American Football Players 5
(13) examined 33,896 youth athletes and found that BMI classifications overestimate the
prevalence of obesity. In fact, 62% of the subjects classified as obese by BMI were not
considered obese by skinfold measurements. Mathews et al. (24) found that BMI also
overestimates the prevalence of obesity in collegiate American football athletes, and Lambert
et al. (20) showed that BMI overestimated body fatness and the overestimation is greater in
athletes than the general population. Furthermore, the authors (20) reported that collegiate
American football athletes have an average of 16 kg more fat-free mass (FFM) than matched
comparison nonathletes (20). Similarly, Quiterio (31) found that adolescent boys in high-impact
sports have greater total body FFM than non-athlete boys. Thus, not only is BMI unable to
account for the difference between FFM and fat mass, but is also incapable of emphasizing the
significant difference in FFM between athletes and non-athletes. Overall, these data suggest
that BMI may incorrectly classify athletes as obese when they simply have greater FFM.
What remains unclear is whether HT, WT, or BMI, and the subsequent BMI-classified
obesity prevalence are uniquely different among each player position in young American
football players across different high school grades. Therefore, the purpose of this study is to
further examine grade and position-specific HT, WT, and BMI in a large sample of elite high
school American football athletes, while the secondary purpose is to better understand how
and why these data may be inappropriate for characterizing obesity prevalence or drawing
health-related conclusions in athletes.

BMI in High School American Football Players 6
METHODS
Experimental Approach to the Problem
A cross-sectional study design was used to examine grade- and position-related
differences in HT, WT, and BMI. The prevalence of obesity in high school American football
players was also calculated. Independent variables included grade level (freshmen, sophomore,
junior) and position (offensive lineman [OL], defensive lineman [DL], hybrid [XX], running back
[RB], quarterback [QB], defensive back [DB], and wide receiver [WR]). Dependent variables
included HT, WT, and BMI.
Subjects
A database containing n = 7,888 elite high school aged male American football players
containing juniors (n= 3365; height: 1.79 ± 0.07 m; mass: 88.1 ± 19.2 kg), sophomores (n=2706;
height: 1.80 ± 0.08 m; mass: 85.5 ± 18.7 kg), and freshmen (n=1277; height: 1.77 ± 0.07 m;
mass: 79.7 ± 17.8 kg) was transferred to the University of Nebraska-Lincoln from Zybek Sports
(Boulder, CO). Seniors were excluded due to small sample size (n = 66). Participants for whom
HT and/or WT were missing were excluded. Thus, only n = 7,175 male American high school
football players were included in the final analysis. The database included measurements of
stature (HT), body mass (WT), graduating class, and self-reported playing position. Each subject
had participated in one of nine American football recruiting combines hosted by Zybek Sports
between March and May 2015 in Baltimore, MD, Birmingham, AL, Austin, TX, San Diego, CA,
Phoenix, AZ, Nashville, TN, Tampa, FL, Detroit, MI, and Piscataway, NJ. There were no fees to
participate in any combine but the players were responsible for their own travel expenses.

BMI in High School American Football Players 7
Birthdates were not reported; therefore, participants were categorized by high school grade
level from their graduating class. The Institutional Review Board at the University of Nebraska-
Lincoln determined that this analysis did not constitute human subjects research (IRB
communication, February 26th
, 2016).
Initially, positions were categorized as OL, DL, TE, DE, LB, RB, QB, DB, and WR.
Subsequently, however, the TE, DE, and LB position groups were combined into a hybrid group
(XX) based on the procedure described in the Statistical Analyses section.
Procedures
BMI was calculated as the mass in kilograms divided by the height in meters squared
(kg/m²). Based on BMI, players were categorized as not obese (<95th
percentile) or obese (≥95th
percentile) according to BMI-for-age chart published by the Centers for Disease Control and
Prevention (CDC) (8). Because birthdates were not reported, it was assumed that juniors were
17 years old, sophomores were 16 years old, and freshmen were 15 years old, which aligns with
data from the United States Census Bureau (34). Obesity prevalence, per BMI, was calculated
with the following equation for each position at each grade level.
obesityprevalence(%) = #obeseathletes
#totalathletes
Statistical Analyses
All statistical analyses were performed using SPSS Statistics v.22 (Chicago, IL) and an
alpha of p ≤ 0.05 was considered significant for all analyses. Descriptive statistics including
mean and standard deviation were calculated for each position and each grade as well as the
total sample. Three separate two-way (3 × 7) factorial analyses of variance (ANOVA) (grade
[freshman, sophomore, junior] × position group [OL, DL, XX, RB, QB, DB, WR]) were used to
BMI in High School American Football Players 8
analyze HT, WT, and BMI. When appropriate, Tukey’s Honestly Significant Difference (HSD) post
hoc tests were used. Percent changes from freshmen to sophomore and from sophomore to
junior were calculated for HT, WT, and BMI. Prevalence was calculated and reported
descriptively.
The initial analysis showed that the BMIs of the position groups with the smallest
sample sizes (TE and DE, n ≤ 135) were not different from the LB position (n = 1,049), therefore
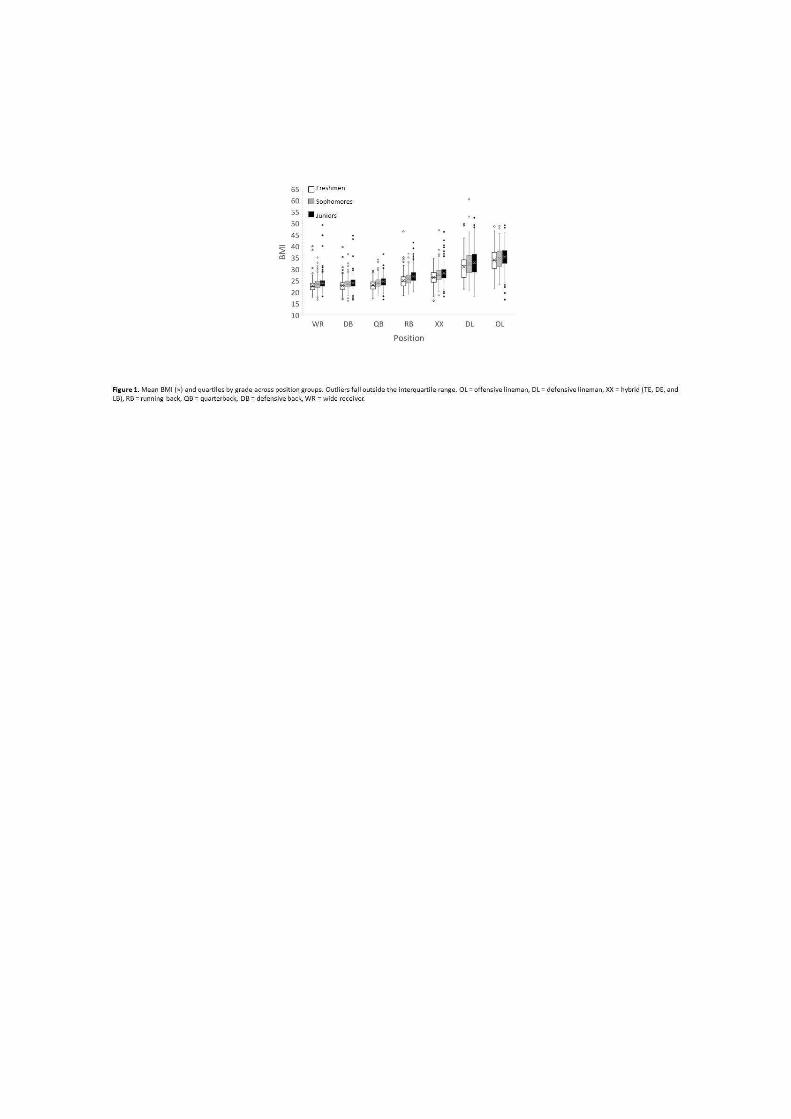
these three position groups were merged into a hybrid group (XX). The outliers shown in Figure
1 represent the data that are greater than 1.5 × interquartile range.
RESULTS
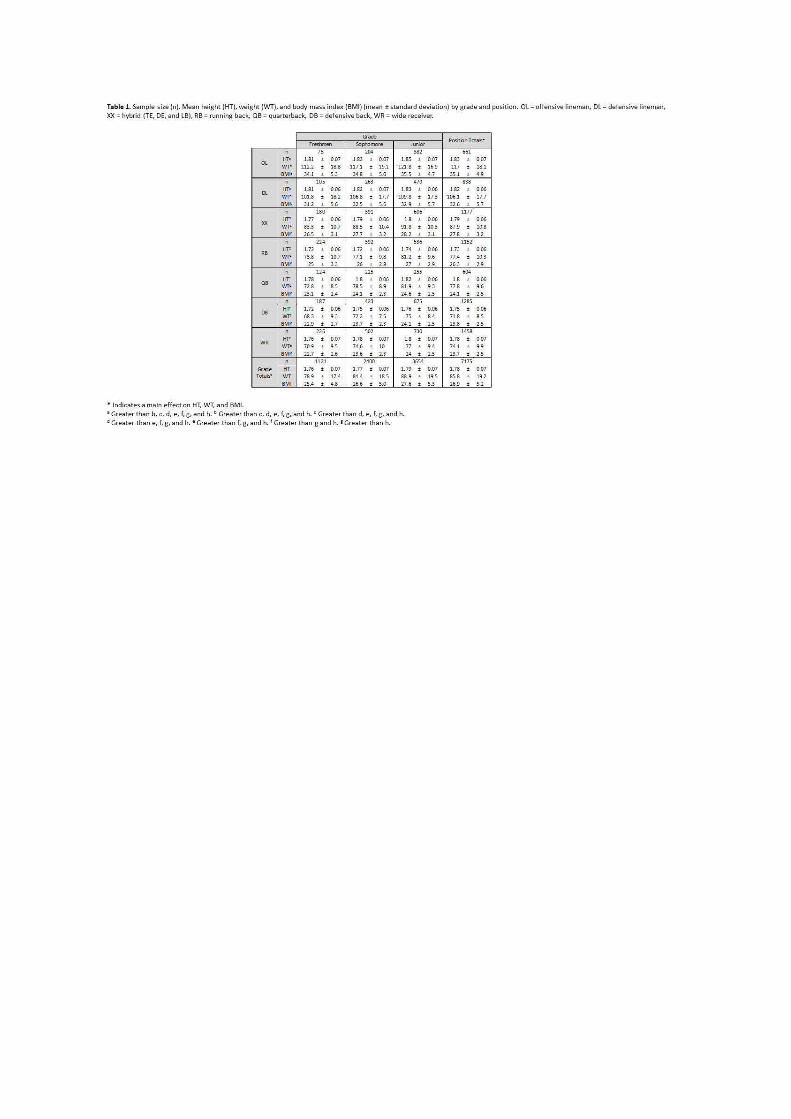
Means and standard deviations (mean ± SD) by grade and position are reported in Table
1. There were no two-way (grade × position) interactions for HT, WT, or BMI (p > 0.05);
however, there were main effects for grade and position for HT, WT, and BMI (p < 0.001).
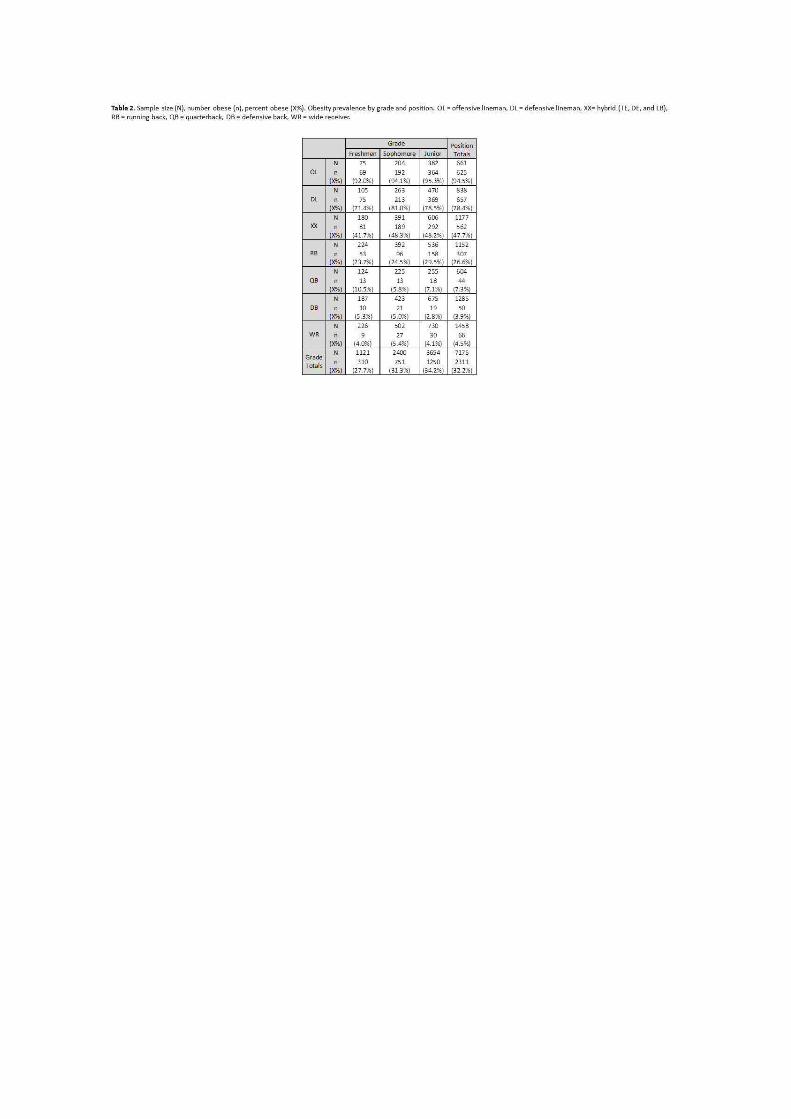
Significant differences are individually reported in Table 1. Obesity prevalence by grade and
position is reported in Table 2. Figure 1 displays quartiles and outliers by grade and position for
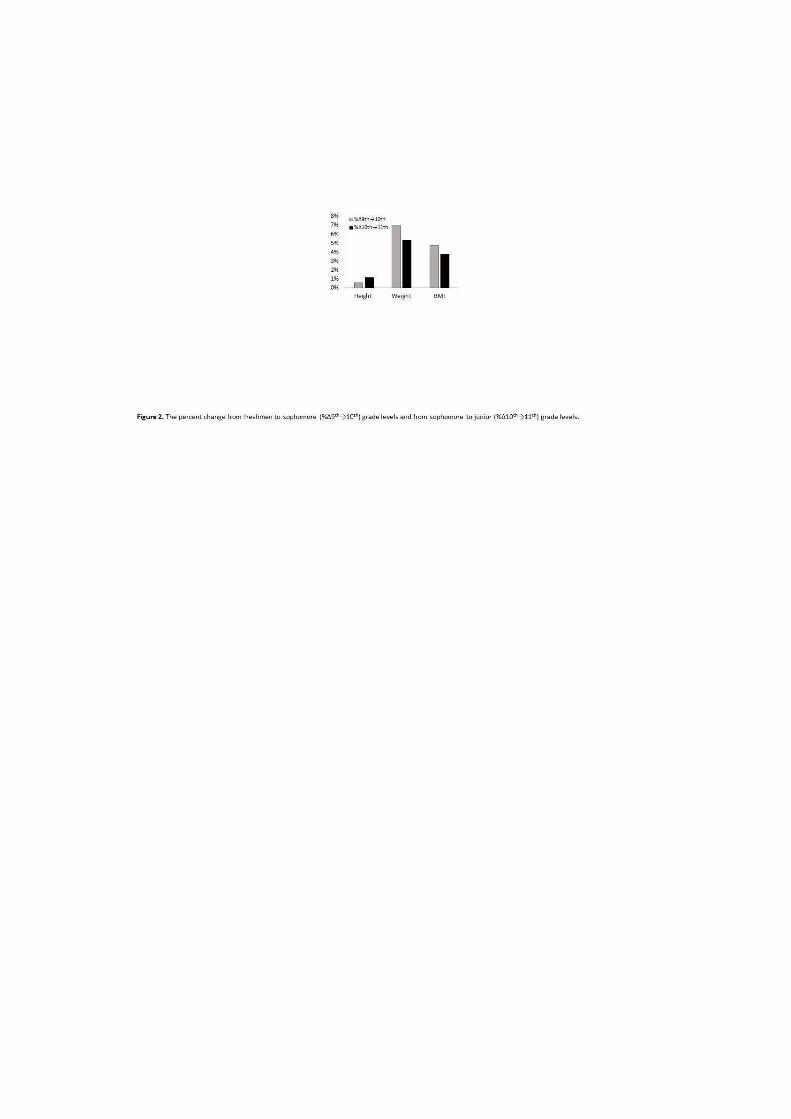
BMI. Percent differences in HT, WT, and BMI from freshmen to sophomore and from
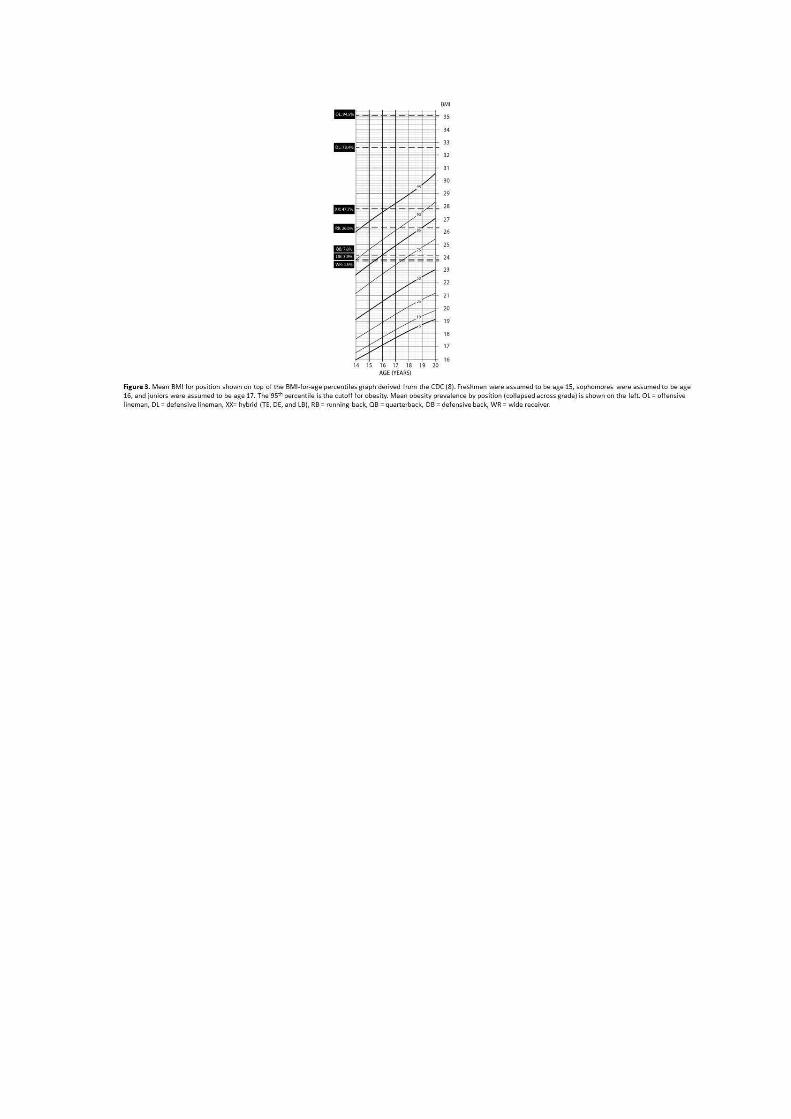
sophomore to junior grade levels are shown in Figure 2. Figure 3 shows the mean BMI for each
position compared to the BMI-for-age percentiles chart from the CDC (8).
BMI in High School American Football Players 9
DISCUSSION
The primary findings of this study were that the relationships between BMI and position
were consistent across grades. HT, WT, and BMI increased as grade increased among all
position groups, and HT, WT, and BMI varied by position group. Independent of grade, the OL
and DL groups had significantly greater BMI than all other positions. These findings are
consistent with previous studies in youth (23), high school (21), collegiate (3, 5, 24), and
professional American football players (11, 19). While several studies have investigated BMI in
collegiate (3, 5, 20, 24, 28, 30) and professional (3, 19, 30) American football players, our study
adds to the limited literature available for high school American football players. Although
Malina et al. (23) and Laurson et al. (21) examined youth American football players, Malina et
al. (23) studied a sample of younger children (age = 9 to 14), while Laurson et al. (21) studied
only OL and DL player positions (age = 14.5 to 18.5). The strengths of our study are the
examination of elite high school American football athletes and the consideration of all the
player positions. Furthermore, these data are from a large, nationally-representative sample.
When determining obesity using BMI, it is important to consider the reference database
to be used. The three most prominent reference databases include the CDC, International
Obesity Taskforce (IOTF), and World Health Organization (WHO). The present study used the
CDC guidelines and found the overall prevalence of obesity in our sample to be 32% based on
BMI. The IOTF references are based on international data, and are linked to mortality rates,
suggesting that IOTF cutoffs are more epidemiologically meaningful (25, 32). The IOTF
guidelines define obesity according to centiles which correspond to an adult BMI of 30.
According to the IOTF cutoffs, the overall prevalence of obesity in our sample would be 26%

BMI in High School American Football Players 10
(10). The WHO guidelines define obesity as a BMI greater than or equal to two standard
deviations above the WHO growth standard median. According to the WHO cutoffs, the
prevalence of obesity in our sample would be 30% (36). Monasta et al. (25) recommended that
the IOTF reference may be best to identify obesity at individual and population levels in pre-
school children. Keke et al. (17) also found the IOTF system to be the best reference for
population studies. Nevertheless, all of these references define obesity by BMI, which does not
distinguish between fat and fat-free mass. Therefore, while these high rates of obesity may
appear concerning, these findings should be interpreted with caution.
The greater increases in WT relative to HT as grade increases (Figure 1) suggest that
increases in BMI may be primarily associated with increases in WT, and affected minimally by
HT. If HT is predominantly reflective of skeletal size, while WT is most reflective of soft-tissue
mass, our findings suggest that increases in soft tissue mass may contribute more to BMI
increases across grade level. In a collegiate population (age = 19 to 25 years), Lambert et al. (20)
compared the FFM of American football athletes (81.3 kg) to age- and gender-matched
comparisons (65.3 kg) and found that the athletes had 16 kg more FFM than the non-athletes.
In adolescent males (age = 9 to 18 years), Quiterio et al. (31) found that athletes in high-impact
sports have greater FFM than non-athletes by an average of 8.1 kg. Mathews et al. (24) showed
that when using BMI, 67% of collegiate American football players with a healthy body fat were
miscategorized as overweight or obese, and 54% of overweight players were miscategorized as
obese. This evidence suggests that the greater amount of FFM in American football athletes
artificially inflates obesity prevalence by skewing the BMI calculations. Our indirect finding

BMI in High School American Football Players 11
supports the influence of soft tissue mass on BMI calculations in elite high school American
football players as well.
It is possible that linemen have higher BMIs due to coaches selecting players with larger
body sizes and greater strength to fill those positions. Furthermore, the prevalence of high
BMIs in these groups could be additionally impacted by physiological adaptations to their
specific playing demands. Bosch et al. (3) reports that OL players typically cover less distance in
a game than other positions, do not need to be as fast, and are very strong, all of which are
factors that contribute to a greater BMI (3).
We found the prevalence of obesity, as characterized by BMI, in the OL and DL groups
(94.5% and 78.4%, respectively) was greater than all other positions (XX = 47.7%, RB = 26.6%,
QB = 7.3%, DB = 3.9%, WR = 4.5%). Many studies have also found that OL and DL position
groups have the greatest obesity prevalence as determined by BMI in middle school (23), high
school (21), collegiate (3, 24, 30) and National Football League (NFL) (11, 19, 30) athletes.
However, because these studies rely on BMI to determine obesity, it is likely the prevalence of
obesity is overestimated. Body fat percentage has also been used to characterize obesity in
collegiate (3, 24, 28, 30) and NFL (11, 19, 30) athletes across all the position groups. These
studies also found OL and DL positions to have unhealthy amounts of body fat and rates of
obesity higher than any other position groups, and that all other position groups had healthy
amounts of body fat (3, 11, 19, 24, 28, 30). The high prevalence of obesity, as characterized by
body fat percentage, in the OL and DL position groups suggest that players in these position
groups may be at a higher risk of having unfavorable body composition. Buell et al. (5) found
that more than 50% of the collegiate offensive and defensive linemen displayed metabolic
BMI in High School American Football Players 12
syndrome and other adverse biomarkers, further suggesting that players in the OL and DL
position groups may exhibit health risks. Since the data from studies using percent body fat to
determine obesity indicate that OL and DL still have high obesity rates, OL and DL positions are
at risk for being obese, and that the higher rates of obesity indicated by BMI are real, regardless
of the flaws of using BMI to indicate obesity. Further research should consider the use of
allometric scaling to account for the inherent size differences among position groups to better
understand unfavorable body composition without the confounding effects of larger body sizes.
In large scale studies BMI has been shown to have error rates comparable to other
methods of determining body composition, such as skinfolds and bioelectrical impedance
analysis (12). While BMI may be an imperfect indicator of fatness on an individual basis, there is
some support for the continued use of BMI as an indicator of body fatness and to classify
obesity in the general population as some studies have found BMI and percent body fat are
strongly associated (7, 15, 29). However, a number of other studies have found BMI to be a less
accurate measure of body fatness than direct methods, such as dual x-ray absorptiometry
(DXA) (3, 11, 20), skinfolds (4, 13), air displacement plethysmography (19), bioelectrical
impedance analysis (24), hydrostatic weighing (28), and waist circumference (24). Coupled with
previously stated results showing that BMI overestimates body fatness and the overestimation
is greater in athletes than in non-athletes (20, 24), these collective results suggest that BMI is
not an appropriate indicator of body fatness, particularly in athletic populations. Furthermore,
Etchison et al. (13) found that 62% of the subjects classified as obese by BMI were false
positives. It is likely, therefore, that the obesity rates reported in the present study were higher
than they would be if determined from body fat measurements. For example, if the obesity

BMI in High School American Football Players 13
rates in the OL and DL groups were 62% false positives, as suggested by the results of Etchison
et al. (13), the adjusted obesity rates would be approximately 36% for OL and 30% for DL. This
gross adjustment would influence the potential health-related implications for approximately n
= 1,433 athletes, which is 20% of the sample. Even though this adjusted rate is lower, it is still
high and may be cause for concern regarding the risk of obesity in youth high school American
football athletes, particularly in the OL and DL position groups.
The results of this study indicate that as the grade of the players increases, so does the
average BMI. Our findings are supported by numerous studies that have compared BMI among
age groups (12, 29) or followed subjects over time (7, 15, 16). While these cross-sectional and
longitudinal studies examined subjects from the general population and did not specifically
examine athletes or differentiate between athletes and non-athletes, our results indicate that
the same trend holds true for athletes.
Two unique aspects of our study are the population studied and the between-player
differences examined. Elite high school American football players have not been studied to the
same extent as collegiate and professional players. Additionally, analyzing the differences in
body size among football players by position contributes to a better understanding of the
player positions in elite youth American football. Furthermore, the recruiting combines took
place in nine large cities across the US, making it an unusually large and nationally
representative sample. By comparison, Mathews et al. (24), Kraemer et al. (19), Noel et al. (28),
and Buell et al. (5) all had sample sizes of less than 100 participants. Malina et al. (23), Lambert
et al. (20), Bosch et al. (3), and Dengel et al. (11) had sample sizes of less than 1,000
participants. With sample sizes of 3,683 and 33,986, respectively, Laurson et al. (21) and
BMI in High School American Football Players 14
Etchison et al. (13) had large sample sizes, but the sample of Laurson et al. was solely from
Iowa, while the sample of Etchison et al. was solely from Georgia and Alabama. With a sample
of 7,175 participants collected in 9 different cities across the U.S., our sample may be
considered more nationally representative.
PRACTICAL APPLICATIONS
American football coaches should be aware of the potentially misleading nature of BMI
as an indicator of health. Based on our estimates, it is possible that 20% of elite high school
American football athletes in this sample were not obese, despite being categorized as obese
by BMI. This would change their perceived health status and recommendations. When
considering the health implications of obesity in high school American football players, coaches
should measure body composition in lieu of BMI. The criterion method of measuring body
composition is hydrostatic weighing, and DXA has similar errors as hydrostatic weighing (22).
However, assessing obesity using skinfold measurement may be a viable, practical, and less-
expensive alternative, which would constitute a direct measurement of fat mass unlike BMI.
While many health concerns that are raised for American football athletes are based on the
BMI calculations, coaches should be aware of the potential obesity risks for OL and DL players
and the adverse health consequences of obesity.
ACKNOWLEDGEMENTS
These data were provided from a data transfer agreement through Mike Weinstein, who is the
owner and CEO of Zybek Sports (Boulder, CO).

References
1. Akrout, M, Rolland-Cachera, MF, and Pneau, S. History and Meaning of the Body Mass Index.
Interest of Other Anthropometric Measurements.
2. Blackburn, H, and Jacobs Jr, D. Commentary: Origins and Evolution of Body Mass Index (BMI):
Continuing Saga. Int J Epidemiol 43: 665-669, 2014.
3. Bosch, TA, Carbuhn, A, Stanforth, PR, Oliver, JM, Keller, KA, and Dengel, DR. Body
Composition and Bone Mineral Density of Division 1 Collegiate Football Players, a Consortium
of College Athlete Research (C-CAR) Study. J Strength Cond Res , 2017.
4. Bryan, CL, Solmon, MA, Zanovec, MT, and Tuuri, G. Body Mass Index and Skinfold Thickness
Measurements as Body Composition Screening Tools in Caucasian and African American Youth.
Res Q Exerc Sport 82: 345-349, 2011.
5. Buell, JL, Calland, D, Hanks, F, Johnston, B, Pester, B, Sweeney, R, and Thorne, R. Presence of
Metabolic Syndrome in Football Linemen. J Athl Train 43: 608-616, 2008.
6. Carpenter, KM, Hasin, DS, Allison, DB, and Faith, MS. Relationships Between Obesity and
DSM-IV Major Depressive Disorder, Suicide Ideation, and Suicide Attempts: Results from a
General Population Study. Am J Public Health 90: 251, 2000.
7. Casey, VA, Dwyer, JT, Coleman, KA, and Valadian, I. Body Mass Index from Childhood to
Middle Age: A 50-y Follow-up. Am J Clin Nutr 56: 14-18, 1992.
8. Centers for Disease Control and Prevention. Growth Charts - Data Table of BMI-for-age
Charts. 2016, 2000.
9. Centers for Disease Control and Prevention. Overweight and Obesity. 2016, 2016.
10. Cole, TJ, Bellizzi, MC, Flegal, KM, and Dietz, WH. Establishing a standard definition for child
overweight and obesity worldwide: international survey. BMJ 320: 1240, 2000.
11. Dengel, DR, Bosch, TA, Burruss, TP, Fielding, KA, Engel, BE, Weir, NL, and Weston, TD. Body
Composition and Bone Mineral Density of National Football League Players. J Strength Cond Res
28: 1-6, 2014.
12. Deurenberg, P, Weststrate, JA, and Seidell, JC. Body Mass Index as a Measure of Body
Fatness: Age-and Sex-Specific Prediction Formulas. Br J Nutr 65: 105-114, 1991.
13. Etchison, WC, Bloodgood, EA, Minton, CP, Thompson, NJ, Collins, MA, Hunter, SC, and Dai,
H. Body Mass Index and Percentage of Body Fat as Indicators for Obesity in an Adolescent
Athletic Population. Sports Health 3: 249-252, 2011.

BMI in High School American Football Players 16
14. Flegal, KM, and Ogden, CL. Childhood Obesity: Are We All Speaking the Same Language?
Adv Nutr 2: 166S, 2011.
15. Guo, SS, Roche, AF, Chumlea, WC, Gardner, JD, and Siervogel, RM. The Predictive Value of
Childhood Body Mass Index Values for Overweight at Age 35 y. Am J Clin Nutr 59: 810-819,
1994.
16. Guo, SS, Wu, W, Chumlea, WC, and Roche, AF. Predicting Overweight and Obesity in
Adulthood from Body Mass Index Values in Childhood and Adolescence. Am J Clin Nutr 76: 653-
658, 2002.
17. Keke, LM, Samouda, H, Jacobs, J, di Pompeo, C, Lemdani, M, Hubert, H, Zitouni, D, and
Guinhouya, BC. Body mass index and childhood obesity classification systems: A comparison of
the French, International Obesity Task Force (IOTF) and World Health Organization (WHO)
references. Rev Epidemiol Sante Publique 63: 173-182, 2015.
18. Keys, A, Fidanza, F, Karvonen, MJ, Kimura, N, and Taylor, HL. Indices of Relative Weight and
Obesity. Int J Epidemiol : 655-665, 2014.
19. Kraemer, WJ, Torine, JC, Silvestre, R, French, DN, Ratamess, NA, Spiering, BA, Hatfield, DL,
Vingren, JL, and Volek, JS. Body Size and Composition of National Football League Players. J
Strength Cond Res 19: 485-489, 2005.
20. Lambert, BS, Oliver, JM, Katts, GR, Green, JS, Martin, SE, and Crouse, SF. DEXA or BMI:
Clinical Considerations for Evaluating Obesity in Collegiate Division IA American Football
Athletes. J Sports Med 22: 436-438, 2012.
21. Laurson, KR, and Eisenmann, JC. Prevalence of Overweight among High School Football
Linemen. JAMA 297: 359-364, 2007.
22. Lockner, DW, Heyward, VH, Baumgartner, RN, and Jenkins, KA. Comparison of Air-
Displacement Plethysmography, Hydrodensitometry, and Dual X-ray Absorptiometry for
Assessing Body Composition of Children 10 to 18 Years of Age. Ann NY Acad Sci 904: 72-78,
2000.
23. Malina, RM, Morano, PJ, Barron, M, Miller, SJ, Cumming, SP, Kontos, AP, and Little, BB.
Overweight and Obesity among Youth Participants in American Football. J Pediatr 151: 378-382,
2007.
24. Mathews, EM, and Wagner, DR. Prevalence of Overweight and Obesity in Collegiate
American Football Players, by Position. J Am Coll Health 57: 33-38, 2008.

BMI in High School American Football Players 17
25. Monasta, L, Lobstein, T, Cole, TJ, Vignerová, J, and Cattaneo, A. Defining overweight and
obesity in pre-school children: IOTF reference or WHO standard? Obesity Reviews 12: 295-300,
2011.
26. Must, A, and Strauss, RS. Risks and Consequences of Childhood and Adolescent Obesity. Int
J Obes Relat Metab Disord 23, 1999.
27. National Federation of State High School Associations. 2015-16 High School Athletics
Participation Survey Results. 2017, 2016.
28. Noel, MB, Vanheest, JL, Zaneteas, P, and Rodgers, CD. Body Composition in Division I
Football Players. J Strength Cond Res 17: 228-237, 2003.
29. Pietrobelli, A, Faith, MS, Allison, DB, Gallagher, D, Chiumello, G, and Heymsfield, SB. Body
Mass Index as a Measure of Adiposity among Children and Adolescents: A Validation Study. J
Pediatr 132: 204-210, 1998.
30. Pincivero, DM, and Bompa, TO. A Physiological Review of American Football. Sports Med 23:
247-260, 1997.
31. Quiterio, ALD, Carnero, EA, Baptista, FM, and Sardinha, LB. Skeletal Mass in Adolescent
Male Athletes and Nonathletes: Relationships with High-Impact Sports. J Strength Cond Res 25:
3439-3447, 2011.
32. Rolland-Cachera, MF. Childhood obesity: current definitions and recommendations for their
use. Int J Pediatr Obes 6: 325-331, 2011.
33. Rothman, KJ. BMI-Related Errors in the Measurement of Obesity. Int J Obes 32: S59, 2008.
34. United States Census Bureau. CPS October 2015 - Detailed Tables. 2017, 2017.
35. World Health Organization. Overweight/Obesity. 2017, 2016.
36. World Health Organization. Childhood Overweight and Obesity. 2017, 2017.
37. Yard, E, and Comstock, D. Injury Patterns by Body Mass Index in US High School Athletes. J
Phys Act Health 8: 182-191, 2011.

BMI in High School American Football Players 18
FIGURE LEGENDS
Figure 1.
Mean BMI (×) and quartiles by grade across position groups. Outliers fall outside the interquartile range.
OL = offensive lineman, DL = defensive lineman, XX = hybrid (TE, DE, and LB), RB = running back, QB =
quarterback, DB = defensive back, WR = wide receiver.
Figure 2.
The percent change from freshmen to sophomore (%Δ9th
→10th
) grade levels and from sophomore to
junior (%Δ10th
→11th
) grade levels.
Figure 3.
Mean BMI for position shown on top of the BMI-for-age percentiles graph derived from the CDC (8).
Freshmen were assumed to be age 15, sophomores were assumed to be age 16, and juniors were
assumed to be age 17. The 95th
percentile is the cutoff for obesity. Mean obesity prevalence by position
(collapsed across grade) is shown on the left. OL = offensive lineman, DL = defensive lineman, XX= hybrid
(TE, DE, and LB), RB = running back, QB = quarterback, DB = defensive back, WR = wide receiver.
Table 1.
Sample size (n). Mean height (HT), weight (WT), and body mass index (BMI) (mean ± standard deviation)
by grade and position. OL = offensive lineman, DL = defensive lineman, XX = hybrid (TE, DE, and LB), RB =
running back, QB = quarterback, DB = defensive back, WR = wide receiver.
Table 2.
Sample size (N), number obese (n), percent obese (X%). Obesity prevalence by grade and position. OL =
offensive lineman, DL = defensive lineman, XX= hybrid (TE, DE, and LB), RB = running back, QB =
quarterback, DB = defensive back, WR = wide receiver.