Embed Size (px)
Citation preview
Statistics of Alor Regency 2014 i
STATISTIKKABUPATEN ALOR
Statistics of Alor Regency2014

ii Statistik Kabupaten Alor 2014
STATISTIK KABUPATEN ALOR 2014STATISTICS OF ALOR REGENCY 2014
ISSN : 2355-9799
Katalog BPS : 1102001.5307BPS’s Catalogue
Ukuran Buku : 21 cm x 15 cmBook Size
Jumlah Halaman : 335+iiiTotal Pages
Naskah : Bappeda Kabupaten AlorManuscript : Bappeda of Alor Regency
Penyunting : Bappeda Kabupaten AlorEditor : Bappeda of Alor Regency
Gambar Kulit : Bappeda Kabupaten AlorCover Design : Bappeda of Alor Regency
Diterbitkan oleh : Bappeda Kabupaten AlorPublished by : Bappeda of Alor Regency
Boleh dikutip dengan menyebutkan sumbernyaMay be cited with reference to the source
Statistics of Alor Regency 2014 iii
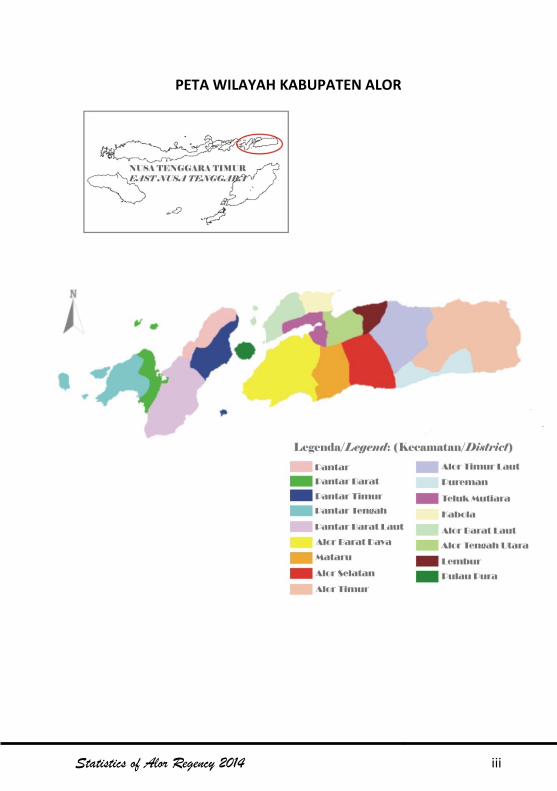
PETA WILAYAH KABUPATEN ALOR
Statistics of Alor Regency 2014 iii
PETA WILAYAH KABUPATEN ALOR
iv Statistik Kabupaten Alor 2014
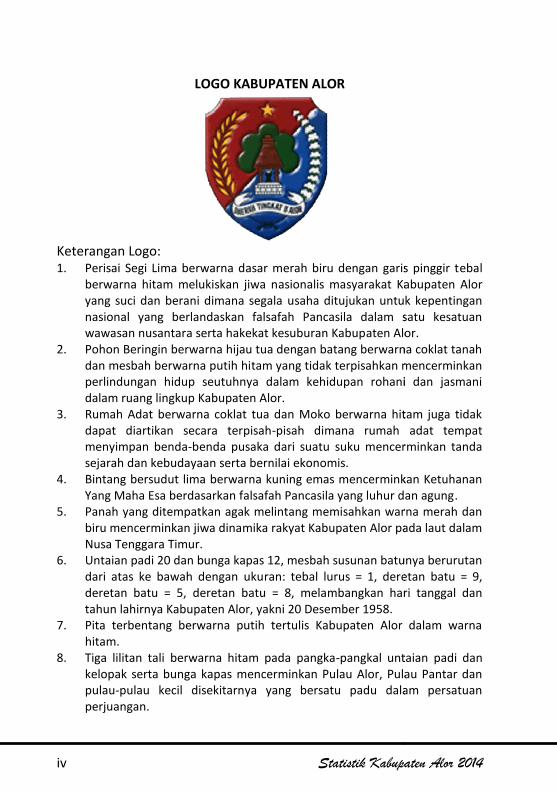
LOGO KABUPATEN ALOR
Keterangan Logo:1. Perisai Segi Lima berwarna dasar merah biru dengan garis pinggir tebal
berwarna hitam melukiskan jiwa nasionalis masyarakat Kabupaten Aloryang suci dan berani dimana segala usaha ditujukan untuk kepentingannasional yang berlandaskan falsafah Pancasila dalam satu kesatuanwawasan nusantara serta hakekat kesuburan Kabupaten Alor.
2. Pohon Beringin berwarna hijau tua dengan batang berwarna coklat tanahdan mesbah berwarna putih hitam yang tidak terpisahkan mencerminkanperlindungan hidup seutuhnya dalam kehidupan rohani dan jasmanidalam ruang lingkup Kabupaten Alor.
3. Rumah Adat berwarna coklat tua dan Moko berwarna hitam juga tidakdapat diartikan secara terpisah-pisah dimana rumah adat tempatmenyimpan benda-benda pusaka dari suatu suku mencerminkan tandasejarah dan kebudayaan serta bernilai ekonomis.
4. Bintang bersudut lima berwarna kuning emas mencerminkan KetuhananYang Maha Esa berdasarkan falsafah Pancasila yang luhur dan agung.
5. Panah yang ditempatkan agak melintang memisahkan warna merah danbiru mencerminkan jiwa dinamika rakyat Kabupaten Alor pada laut dalamNusa Tenggara Timur.
6. Untaian padi 20 dan bunga kapas 12, mesbah susunan batunya berurutandari atas ke bawah dengan ukuran: tebal lurus = 1, deretan batu = 9,deretan batu = 5, deretan batu = 8, melambangkan hari tanggal dantahun lahirnya Kabupaten Alor, yakni 20 Desember 1958.
7. Pita terbentang berwarna putih tertulis Kabupaten Alor dalam warnahitam.
8. Tiga lilitan tali berwarna hitam pada pangka-pangkal untaian padi dankelopak serta bunga kapas mencerminkan Pulau Alor, Pulau Pantar danpulau-pulau kecil disekitarnya yang bersatu padu dalam persatuanperjuangan.
iv Statistik Kabupaten Alor 2014
LOGO KABUPATEN ALOR
Keterangan Logo:1. Perisai Segi Lima berwarna dasar merah biru dengan garis pinggir tebal
berwarna hitam melukiskan jiwa nasionalis masyarakat Kabupaten Aloryang suci dan berani dimana segala usaha ditujukan untuk kepentingannasional yang berlandaskan falsafah Pancasila dalam satu kesatuanwawasan nusantara serta hakekat kesuburan Kabupaten Alor.
2. Pohon Beringin berwarna hijau tua dengan batang berwarna coklat tanahdan mesbah berwarna putih hitam yang tidak terpisahkan mencerminkanperlindungan hidup seutuhnya dalam kehidupan rohani dan jasmanidalam ruang lingkup Kabupaten Alor.
3. Rumah Adat berwarna coklat tua dan Moko berwarna hitam juga tidakdapat diartikan secara terpisah-pisah dimana rumah adat tempatmenyimpan benda-benda pusaka dari suatu suku mencerminkan tandasejarah dan kebudayaan serta bernilai ekonomis.
4. Bintang bersudut lima berwarna kuning emas mencerminkan KetuhananYang Maha Esa berdasarkan falsafah Pancasila yang luhur dan agung.
5. Panah yang ditempatkan agak melintang memisahkan warna merah danbiru mencerminkan jiwa dinamika rakyat Kabupaten Alor pada laut dalamNusa Tenggara Timur.
6. Untaian padi 20 dan bunga kapas 12, mesbah susunan batunya berurutandari atas ke bawah dengan ukuran: tebal lurus = 1, deretan batu = 9,deretan batu = 5, deretan batu = 8, melambangkan hari tanggal dantahun lahirnya Kabupaten Alor, yakni 20 Desember 1958.
7. Pita terbentang berwarna putih tertulis Kabupaten Alor dalam warnahitam.
8. Tiga lilitan tali berwarna hitam pada pangka-pangkal untaian padi dankelopak serta bunga kapas mencerminkan Pulau Alor, Pulau Pantar danpulau-pulau kecil disekitarnya yang bersatu padu dalam persatuanperjuangan.
Statistics of Alor Regency 2014 v
SYMBOL OF ALOR REGENCY
Explanation of symbol:
1 Shielding Aspects Five blue red base color with a thick black outline depicts thenationalist community spirit Alor holy and brave in which all efforts aimed at nationalinterest based on the philosophy of Pancasila in a single unit as well insight into thenature of fertility archipelago Alor.
2 Dark green banyan tree with a brown trunk and ground black white altar integralprotection reflect a full life in the spiritual and physical life in Alor scope.
3 Traditional House in dark brown and black Moko also can not be interpreted inisolation where indigenous home store heirlooms of a sign reflecting the tribe's historyand culture as well as economic value.
4 star five-pointed golden yellow reflect on God based on the philosophy of Pancasilanoble and glorious.
5. arrows are placed somewhat transverse separating red and blue colors reflect thedynamics of people's lives at sea Alor in East Nusa Tenggara.
6 Strands of 20 rice and cotton flowers 12 stone altar arrangement from top to bottomwith size: thick, straight = 1, row = 9 stone, stone row = 5, a row of stone = 8, representsthe date and year of birth of Alor District, ie December 20, 1958.
7 white ribbon stretched Alor written in black.
8 Three black strap loops on Pangka-base strands of rice and cotton flower petals andreflects the island of Alor, Pantar Island and the surrounding small islands that cometogether in a united struggle.
vi Statistik Kabupaten Alor 2014
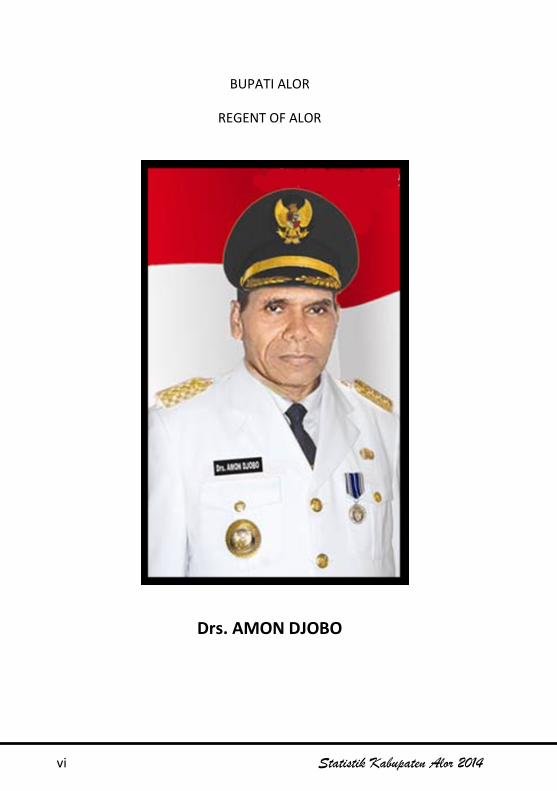
BUPATI ALOR
REGENT OF ALOR
Drs. AMON DJOBO
Statistics of Alor Regency 2014 vii
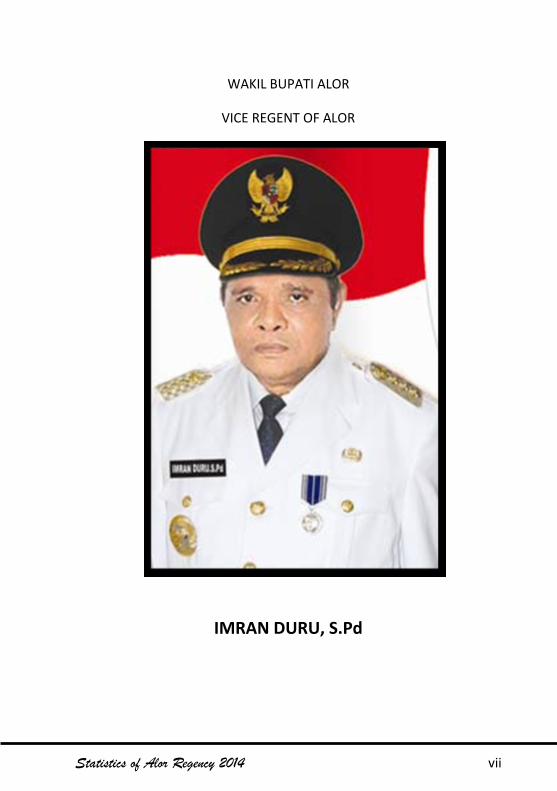
WAKIL BUPATI ALOR
VICE REGENT OF ALOR
IMRAN DURU, S.Pd

viii Statistik Kabupaten Alor 2014
BUPATI KABUPATEN ALOR
SAMBUTAN
Deskripsi mengenai realitas keadaan di suatu wilayah dalam konteksotonomi daerah merupakan kebutuhan yang relevan dengan kondisi saat ini.Pemahaman ini didasari oleh makna peranan informasi dalam prosespengelolaan pembangunan. Informasi mengenai karakteristik wilayah yangdibutuhkan, sebaiknya mencakup seluruh aspek kehidupan yang meliputiaspek lingkungan alam, sosial, ekonomi dan budaya.
Relevansi dengan argumentasi tersebut, saya menyambut gembiraupaya yang telah dilakukan oleh Badan Pusat Statistik Kabupaten Alor untukmenerbitkan buku “ALOR DALAM ANGKA 2014”. Penerbitan buku inimempunyai nilai strategis karena selain memberikan informasi secaramenyeluruh mengenai kondisi sumber daya yang dimiliki, juga sebagai salahsatu bentuk pertanggungjawaban kepada publik mengenai hasil-hasilpembangunan yang telah dicapai.
Kepada Badan Pusat Statistik Kabupaten Alor, saya harapkan untukterus meningkatkan kerja samanya, sehingga kualitas publikasi baik yangmenyangkut cakupan materi maupun tampilannya meningkat. Kepada semuainstansi pemerintah dan swasta serta seluruh lapisan masyarakat di wilayahKabupaten Alor, saya mengharapkan agar membantu Badan Pusat StatistikKabupaten Alor dengan cara memberikan data yang benar dan wajar, sehinggadata statistik yang disajikan akan sesuai dengan keadaan sesungguhnya.
Akhirnya, kiranya publikasi ini dapat digunakan sesuai peruntukannya.Semoga Tuhan Yang Maha Kuasa memberkati kita sekalian
Kalabahi, Agustus 2014Bupati Alor
Drs. Amon Djobo
Statistics of Alor Regency 2014 ix
REGENT OF ALOR
FOREWORD
Descriptions of the real condition of a region in the regionalautonomous context are a relevant requirement with the now days condition.This understanding is based on the meaning of information role in course ofdevelopment management. The information about the characteristic of aregion that required is better to cover all aspects of life such as theenvironment aspect, the social and economy aspect, and also the cultureaspect.
Relevant with the argument, I receive with open arms about the effortwhich have been conducted by the Statistical Office of Alor to publish the ALORIN FIGURES 2014. The make of the book is have a strategic value because itsgive the information that covering all aspect about the owned resources andalso as a form of responsibility to public of concerning development whichhave been made.
To Statistical Office, I expect to improve the cooperation in order toimprove the quality of the coverage of items and also its appearance. To allgovernmental institution and private sector and also all the society in AlorRegency, I expect the cooperative act to assisting the Statistical Office of Alorby giving real and correct data, so that the statistical data will present thecondition as the reality.
Finally, hopefully this publishing can be used according to itsallotment. Hope God will bless us all.
Kalabahi, August 2014Regent of Alor
Drs. Amon Djobo
x Statistik Kabupaten Alor 2014
BADAN PUSAT STATISIK KABUPATEN ALOR
KATA PENGANTAR
Alor Dalam Angka 2014 merupakan publikasi tahunan yang diterbitkanBadan Pusat Statistik (BPS) Kabupaten Alor. Publikasi ini merupakan lanjutantahun sebelumnya yang memuat berbagai macam infomasi tentang keadaangeografis dan ciri-ciri sosial ekonomi penduduk Kabupaten Alor secaramenyeluruh.
Untuk menjaga kesinambungan data, maka bentuk dan jenis table yangdisajikan sebagian besar tetap dipertahankan. Begitu juga untuk sektor-sektoryang datanya belum tersedia, maka yang disajikan data keadaan tahunsebelumnya.
Kami menyadari bahwa walaupun publikasi ini telah disajikan dengansebaik-baiknya, namun masih terdapat kekurangan dan kesalahan. Olehkarena itu saran dari semua pihak demi perbaikan publikasi ini sangat kamiharapkan.
Akhirnya kepada semua pihak yang telah memberikan bantuan sampaiterwujudnya publikasi ini, kami sampaikan terima kasih yang sebesar-besarnyadengan harapan semoga kerja sama serupa dapat lebih ditingkatkan lagi dimasa yang akan datang.
Kalabahi, Agustus 2014Kepala Badan Pusat Statistik
Kabupaten Alor
Ramly K.T. Kusumo, SP.M.APNIP. 19690709 199402 1 001

Statistics of Alor Regency 2014 xi
BPS – STATISTICS OF ALOR REGENCY
PREFACE
Alor in Figures 2014 is the annual publication that published by BPS -Statistics of Alor Regency. This publication represents the continuity from theprevious publication where its content is about the geographical condition andsocio economic affairs of the resident of Alor Regency.
To manage the data continuity, the form and type of the table thatpresented on this publication is based on previous publication. For the sectorswhich the data is unavailable are represented by the previous data.
Finally, we submit many thanks to those who have given aid for thispublication with expectation that this cooperation will improve in the future.
Kalabahi, August 2014Statistic Office of Alor
Chief
Ramly K.T. Kusumo, SP,M.APNIP. 19690709 199402 1 001
xii Statistik Kabupaten Alor 2014
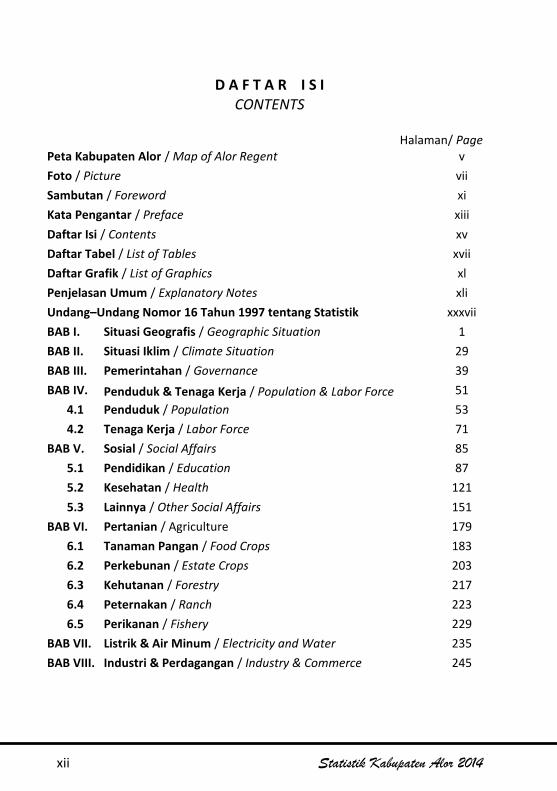
D A F T A R I S ICONTENTS
Halaman/ PagePeta Kabupaten Alor / Map of Alor Regent vFoto / Picture viiSambutan / Foreword xiKata Pengantar / Preface xiiiDaftar Isi / Contents xvDaftar Tabel / List of Tables xviiDaftar Grafik / List of Graphics xlPenjelasan Umum / Explanatory Notes xliUndang–Undang Nomor 16 Tahun 1997 tentang Statistik xxxviiBAB I. Situasi Geografis / Geographic Situation 1BAB II. Situasi Iklim / Climate Situation 29BAB III. Pemerintahan / Governance 39BAB IV. Penduduk & Tenaga Kerja / Population & Labor Force 51
4.1 Penduduk / Population 534.2 Tenaga Kerja / Labor Force 71
BAB V. Sosial / Social Affairs 855.1 Pendidikan / Education 875.2 Kesehatan / Health 1215.3 Lainnya / Other Social Affairs 151
BAB VI. Pertanian / Agriculture 1796.1 Tanaman Pangan / Food Crops 1836.2 Perkebunan / Estate Crops 2036.3 Kehutanan / Forestry 2176.4 Peternakan / Ranch 2236.5 Perikanan / Fishery 229
BAB VII. Listrik & Air Minum / Electricity and Water 235BAB VIII. Industri & Perdagangan / Industry & Commerce 245
Statistics of Alor Regency 2014 xiii
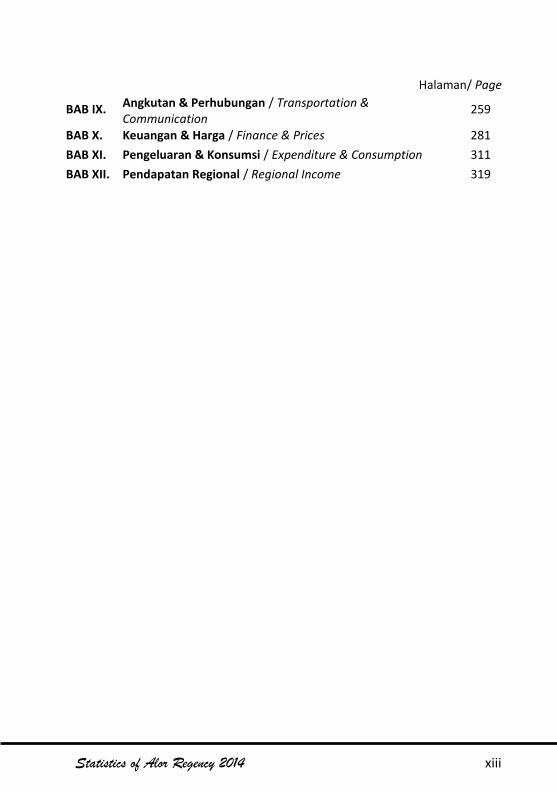
Halaman/ Page
BAB IX. Angkutan & Perhubungan / Transportation &Communication
259
BAB X. Keuangan & Harga / Finance & Prices 281BAB XI. Pengeluaran & Konsumsi / Expenditure & Consumption 311BAB XII. Pendapatan Regional / Regional Income 319
xiv Statistik Kabupaten Alor 2014
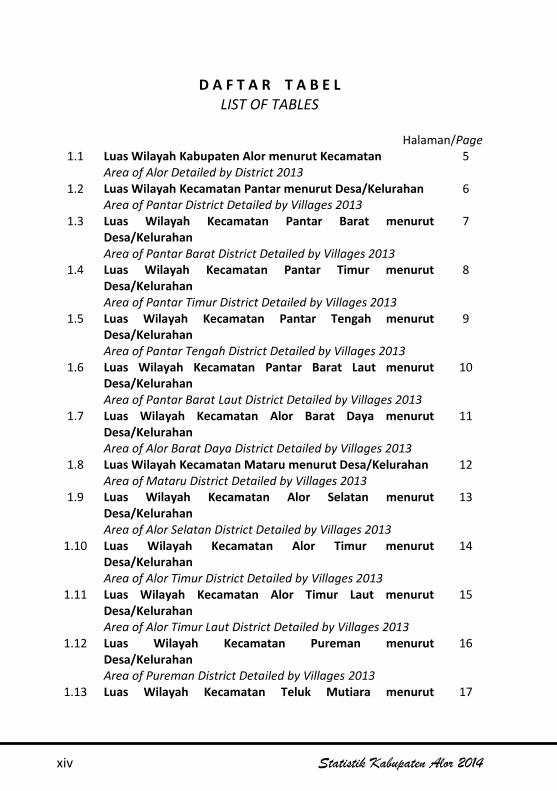
D A F T A R T A B E LLIST OF TABLES
Halaman/Page1.1 Luas Wilayah Kabupaten Alor menurut Kecamatan
Area of Alor Detailed by District 20135
1.2 Luas Wilayah Kecamatan Pantar menurut Desa/KelurahanArea of Pantar District Detailed by Villages 2013
6
1.3 Luas Wilayah Kecamatan Pantar Barat menurutDesa/KelurahanArea of Pantar Barat District Detailed by Villages 2013
7
1.4 Luas Wilayah Kecamatan Pantar Timur menurutDesa/KelurahanArea of Pantar Timur District Detailed by Villages 2013
8
1.5 Luas Wilayah Kecamatan Pantar Tengah menurutDesa/KelurahanArea of Pantar Tengah District Detailed by Villages 2013
9
1.6 Luas Wilayah Kecamatan Pantar Barat Laut menurutDesa/KelurahanArea of Pantar Barat Laut District Detailed by Villages 2013
10
1.7 Luas Wilayah Kecamatan Alor Barat Daya menurutDesa/KelurahanArea of Alor Barat Daya District Detailed by Villages 2013
11
1.8 Luas Wilayah Kecamatan Mataru menurut Desa/KelurahanArea of Mataru District Detailed by Villages 2013
12
1.9 Luas Wilayah Kecamatan Alor Selatan menurutDesa/KelurahanArea of Alor Selatan District Detailed by Villages 2013
13
1.10 Luas Wilayah Kecamatan Alor Timur menurutDesa/KelurahanArea of Alor Timur District Detailed by Villages 2013
14
1.11 Luas Wilayah Kecamatan Alor Timur Laut menurutDesa/KelurahanArea of Alor Timur Laut District Detailed by Villages 2013
15
1.12 Luas Wilayah Kecamatan Pureman menurutDesa/KelurahanArea of Pureman District Detailed by Villages 2013
16
1.13 Luas Wilayah Kecamatan Teluk Mutiara menurut 17
Statistics of Alor Regency 2014 xv
Desa/KelurahanArea of Teluk Mutiara District Detailed by Villages 2013
1.14 Luas Wilayah Kecamatan Kabola menurut Desa/KelurahanArea of Kabola District Detailed by Villages 2013
18
1.15 Luas Wilayah Kecamatan Alor Barat Laut menurutDesa/KelurahanArea of Alor Barat Laut District Detailed by Villages 2013
19
1.16 Luas Wilayah Kecamatan Alor Tengah Utara menurutDesa/KelurahanArea of Alor Tengah Utara District Detailed by Villages 2013
20
1.17 Luas Wilayah Kecamatan Lembur menurut Desa/KelurahanArea of Lembur District Detailed by Villages 2013
21
1.18 Luas Wilayah Kecamatan Pulau Pura menurutDesa/KelurahanArea of Pulau Pura District Detailed by Villages 2013
22
1.19 Banyaknya Pulau yang Dihuni menurut Nama, JumlahKecamatan dan Desa, serta LuasNumber of Island that Dwelt by Resident According to Name,Number of District and Village and also The Area 2013
23
1.20 Banyaknya Pulau yang Tidak Dihuni menurut Nama, Letakdan LuasNumber of Island that Not Dwelt According to Name, Placeand The Area 2013
24
1.21 Keadaan Tanah menurut Kemiringan dan PersentaseTerhadap Luas WilayahGeographical Condition According to Inclination and theInclination Percentage 2013
25
1.22 Jarak Kota Kalabahi dengan Ibukota Kecamatan diKabupaten AlorThe Distance from Kalabahi to the Capital of District in Alor2013
26
2.1 Rata-rata Temperatur Udara dan Rata-Rata PenyinaranMatahari di Kota Kalabahi Dirinci PerbulanAverage Temperature and Sunshine in Kalabahi by Month2013
33
2.2 Persentase Kelembaban, Tekanan Udara dan Arah &Kecepatan Angin di Kota Kalabahi Dirinci PerbulanPercentage of Humidity, Pressure Atmosphere and WindDirection & Velocity in Kalabahi by Month 2013
34
xvi Statistik Kabupaten Alor 2014
2.3 Persentase Penyinaran Matahari di Kota Kalabahi DirinciTiap BulanPercentage of Sunshine in Kalabahi by Month 2008 - 2013
35
2.4 Rata-Rata Temperatur Udara di Kota Kalabahi per BulanAverage Temperature in Kalabahi by Month 2008 - 2013
36
2.5 Curah Hujan di Kota Kalabahi per BulanRainfall Rate in Kalabahi by Month 2008 - 2013
37
3.1 Wilayah Adminitratif Kabupaten AlorAdministrasi Area in Alor 2013
43
3.2 Banyaknya Desa / Kelurahan, Dusun / Lingkungan, RW / RK,RT dan RumahtanggaNumber of Village by Dusun, RW / RK, RT and Household2013
44
3.3 Jumlah Pegawai Negeri Sipil Daerah Kabupaten Alormenurut Jabatan dan Jenis Kelamin 2013Number of civil servants in Alor Regency by position andgender 2013
45
3.4 Jumlah Pegawai Negeri Sipil Daerah kabupaten Alormenurut Pangkat / Golongan dan Jenis Kelamin 2013Number of civil servants in Alor Regency by class/ rank andgender 2013
46
3.5 Jumlah Pegawai Negeri Sipil Daerah Kabupaten Alormenurut ijazah terakhir yang dimiliki dan Jenis Kelamin2013Number of civil servants in Alor Regency by education degreeand gender 2013
47
3.6 Jumlah Anggota Dewan Perwakilan Rakyat DaerahKabupaten Alor menurut Partai Politik dan Jenis Kelamin2013Number of Alor regional parliament’s members by politicalparty and gender 2013
48
3.7 Jumlah Anggota Dewan Perwakilan Rakyat DaerahKabupaten Alor Tiga Periode Terakhir menurut JenisKelaminNumber of Alor regional parliament’s members three lastperiode by gender
49
4.1.1 Jumlah Penduduk, Luas Wilayah dan Kepadatan PendudukPopulation, Area and Population Density 2013
57
4.1.2 Penduduk menurut Kecamatan dan Rasio Jenis Kelamin 58
Statistics of Alor Regency 2014 xvii
Population by District and Sex Ratio 20134.1.3 Jumlah Penduduk, Rumahtangga, Rata-rata Anggota
Rumahtangga dan Kepadatan Penduduk MenurutKecamatanNumber of Population, Household, Average HouseholdMember, and Population Density According to District 2013
59
4.1.4 Banyaknya Rumahtangga dan Penduduk menurutKecamatan dan KewarganegaraanNumber of Household and Population by District andCitizenship 2013
60
4.1.5 Jumlah Penduduk menurut Kecamatan danKewarganegaraanNumber of Population by District and Citizenship 2013
61
4.1.6 Penduduk menurut Golongan Umur dan Jenis KelaminPopulation by Age Group and Sex Ratio 2013
63
4.1.7 Rasio Ketergantungan Penduduk AlorDependency Ratio of Population in Alor 2003 - 2013
64
4.1.8 Pulau yang Dihuni menurut Nama, Jumlah Penduduk danJumlah Kepala Keluarga (KK)The Island that Dwelt by Resident According to Name,Number of Population and Number of Family 2013
65
4.1.9 Jumlah Penduduk dan Pertumbuhan Penduduk AlorSum of Population and Population Growth Alor 1990-2000,2000-2010
66
4.1.10 Jumlah Migrasi Penduduk di Kabupaten AlorNumber of Population Migration in Alor 2008-2013
67
4.1.11 Jumlah Penduduk Usia 10 tahun ke atas menurut StatusPerkawinanPopulation over 10 years by Marriage Status 2013
68
4.1.12 Jumlah Wanita 10 tahun ke atas yang Pernah Kawinmenurut Usia Perkawinan PertamaFemale Population Over 10 years that have been MarriedAccording to Age from the First Marriage
69
4.2.1 Penduduk Berumur 15 Tahun Keatas menurut KegiatanUtama dan Jenis Kelamin Selama Seminggu yang LaluPopulation Over 15 Years by Type of Activity and GenderDuring the Previous Week 2013
75
4.2.2 Penduduk Berumur 15 Tahun Keatas yang bekerja menurutLapangan Usaha Utama dan Jenis Kelamin
76

xviii Statistik Kabupaten Alor 2014
Population Over 15 Years and Over by Work Field and Gender2013*)
4.2.3 Penduduk Berumur 15 Tahun Keatas yang Bekerja menurutStatus Pekerjaan Utama dan Jenis KelaminPopulation Over 15 Years that Working by Main EmploymentStatus and Gender 2013*)
77
4.2.4 Penduduk Berumur 15 Tahun Keatas yang Bekerja menurutJenis Pekerjaan Utama dan Jenis Kelamin Selama Semingguyang LaluPopulation Over 15 Years by Type of Main Occupation andGender During the Previous 2013*)
78
4.2.5 Jumlah Pengusaha menurut Jenis Usaha EkonomiNumber of Entrepeneur by Type of Economical Activity 2013
79
4.2.6 Jumlah Pekerja Anak menurut Jenis Usaha EkonomiNumber of Under-age Employee by Type of EconomicalActivity 2013
80
4.2.7 Jumlah dan Persentase Penduduk Berumur 15 TahunKeatas yang Bekerja Selama Seminggu yang lalu menurutJumlah Jam KerjaNumber and Percentage of Population Aged 15 years Old andover who Worked during the Previous Week by Total HoursWorked 2013
81
4.2.8 Jumlah Angkatan Kerja di Alor menurut Jenis KelaminNumber of Labor Force in Alor by Sex 2013
82
4.2.9 Tingkat Partisipasi Angkatan Kerja di Nusa Tenggara Timurmenurut Kabupaten dan Jenis KelaminLabor Force Participation Rate in Nusa Tenggara Timur ByRegency and Gender 2013
83
4.2.10 Tingkat Pengangguran Terbuka Nusa Tenggara Timurmenurut Kabupaten dan Jenis KelaminOpen Unemployment Rate in Nusa Tenggara Timur byRegency and Sex 2013
84
5.1.1 Banyaknya Sekolah menurut Status dan Tingkat PendidikanDirinci tiap KecamatanNumber of Schools According to Status and Education LevelDetailed by District 2013
91
5.1.2 Banyaknya Sekolah menurut Tingkat Pendidikan Dirinci tiapPulau di Kabupaten AlorNumber of School According to Education Level Detailed by
92
Statistics of Alor Regency 2014 xix
Island in Alor 20135.1.3 Banyaknya Ruangan Belajar menurut Tingkat Pendidikan
Dirinci tiap KecamatanNumber of Class Room According to Education Level Detailedby District 2013
93
5.1.4 Banyaknya Gedung, Ruang Kelas dan Kondisi Ruang KelasSD Dirinci tiap KecamatanNumber of Building, Class Room and the Condition ofElementary School Detailed by District 2013
94
5.1.5 Banyaknya Gedung, Ruang Kelas dan Kondisi Ruang KelasSMP Dirinci tiap KecamatanNumber of Building, Class Room and Condition of SMPDetailed by District 2013
95
5.1.6 Banyaknya Gedung, Ruang Kelas dan Kondisi Ruang KelasSMA Dirinci tiap KecamatanNumber of Building, Class Room and Condition of SMADetailed by District 2013
96
5.1.7 Banyaknya Guru, Murid dan Rasio Murid Terhadap Gurumenurut Tingkat Pendidikan Dirinci tiap KecamatanNumber of Teachers, Pupil and Pupil Ratio to TeacherAccording to Education Level Detailed by District 2013
97
5.1.8 Banyaknya Murid Sekolah menurut Jenis Kelamin danTingkat Pendidikan Dirinci tiap KecamatanNumber of Pupil According to Sex and Education LevelDetailed by District 2013
99
5.1.9 Banyaknya Murid SD menurut Tingkat / Kelas Dirinci tiapKecamatanNumber of Elementary Pupil According to Class Detailed byDistrict 2013
101
5.1.10 Banyaknya Murid SMP dan SMA menurut Tingkat / KelasDirinci tiap KecamatanNumber of Junior and Senior High School Pupil According toClass Detailed by District 2013
102
5.1.11 Banyaknya Murid SD yang Putus Sekolah menurut Tingkat /Kelas Dirinci tiap KecamatanNumber of Broken Elementary Pupil According to ClassDetailed by District 2012/2013
103
5.1.12 Banyaknya Murid SMP dan SMA yang Putus Sekolahmenurut Tingkat / Kelas Dirinci tiap Kecamatan
104
xx Statistik Kabupaten Alor 2014
Number of Broken Elementary Pupil According to ClassDetailed by District 2012/2013
5.1.13 Banyaknya Siswa yang Mengulang dan Putus Sekolahmenurut Tingkat Pendidikan dan Jenis Kelamin Dirinci tiapKecamatanNumber of failed and Start Over and also drop out Pupil byEducation level and ex 2012/2013
105
5.1.14 Banyaknya Peserta Ujian Akhir Nasional (UAN) dan LulusanMurid SD Dirinci tiap KecamatanNumber of Final Exam Testee and Graduated Pupil ofElementary School Detailed by District 2012/2013
106
5.1.15 Banyaknya Peserta Ujian Akhir Nasional (UAN) dan LulusanMurid SMP Dirinci tiap KecamatanNumber of Final Exam Testee and Graduated Pupil of JuniorHigh School Detailed by District 2012/2013
107
5.1.16 Banyaknya Peserta Ujian Akhir Nasional (UAN) dan LulusanMurid SMA Dirinci tiap KecamatanNumber of Final Exam Testee and Graduated Pupil of SeniorHigh School Detailed by District 2012/2013
108
5.1.17 Banyaknya Murid Sekolah Dasar menurut Kelompok UmurDirinci tiap KecamatanNumber of Elementary Students According to Age GroupDetailed by District 2013
109
5.1.18 Banyaknya Murid SMP menurut Kelompok Umur Dirincitiap KecamatanNumber of Junior high School Students According to AgeGroup Detailed by District 2013
110
5.1.19 Banyaknya Murid SMA menurut Kelompok Umur Dirincitiap KecamatanNumber of Senior High School Students According to AgeGroup Detailed by District 2013
111
5.1.20 Jumlah Penduduk Usia Sekolah menurut Jenis KelaminNumber of School Age Population Age Group and Sex 2013
112
5.1.21 Banyaknya Guru SD menurut Tingkat Pendidikan yangditamatkan dirinci tiap KecamatanNumber of Elementary School Teacher According toEducation Level Detailed by District 2013
113
5.1.22 Banyaknya Guru SMP menurut Tingkat Pendidikan yangditamatkan dirinci tiap Kecamatan
114
Statistics of Alor Regency 2014 xxi
Number of Junior High School Teacher According toEducation Level Detailed by District 2013
5.1.23 Banyaknya Guru SMA menurut Tingkat Pendidikan yangditamatkan dirinci tiap KecamatanNumber of Senior High School School Teacher According toEducation Level Detailed by District 2013
115
5.1.24 Penduduk Berumur 10 Tahun Ke Atas menurut StatusSekolah dan Jenis KelaminPopulation Over 10 Years by School Status and Sex 2013
116
5.1.25 Banyaknya Penduduk yang Berumur 10 tahun Keatasmenurut Jenis Kelamin dan IjasahTertinggi yang DimilikiNumber of Population Aged 10 Years and Over by Sex andEducational Attainment 2013
117
5.1.26 Banyaknya Penduduk yang Berumur 10 tahun Ke Atasmenurut Jenis Kelamin dan Kepandaian Membaca danMenulisNumber of Population 10 Year and Over According toLiteracy and Sex 2013
118
5.1.27 Banyaknya Sekolah yang memiliki Usaha KesehatanSekolah Dirinci per KecamatanNumber of School that Provide School Clinic at SchoolDetailed by District 2013
119
5.2.1 Banyaknya Fasilitas Kesehatan menurut KecamatanNumber of Public Health Service Facilities by District 2013
125
5.2.2 Jumlah Fasilitas Kesehatan menurut KondisinyaNumber of public Health Facilities According to its condition2013
127
5.2.3 Banyaknya Tenaga Medis Dirinci tiap KecamatanNumber of Medical Worker According to Type Detailed byDistrict 2013
128
5.2.4 Banyaknya Tenaga Medis menurut Jenis KelaminNumber of Medical Worker by Sex 2013
129
5.2.5 Jumlah Fasilitas Kesehatan yang Melayani KesehatanReproduksi dan Kesehatan Reproduksi Remaja (KRR) sertaPMS / HIV / AIDSNumber of Public Health Facilities that Serves Reproductionand the Adolescent Reproduction Health and also PMS / HIV/ AIDS 2013
130
5.2.6 Banyaknya Persalinan dan Penolongnya Dirinci tiap 131
xxii Statistik Kabupaten Alor 2014
KecamatanNumber of Born and its Benefactor Detailed by District 2013
5.2.7 Banyaknya Persalinan menurut Penolong KelahiranPertamaNumber of Birth and First Birth Benefactor 2013
132
5.2.8 Jumlah Sarana Kesehatan yang Melayani PersalinanNumber of Public Health Facilities that Serves Maternity2013
133
5.2.9 Jumlah Tempat Tidur, BOR, LOS, TOI, BTO di RSUDKabupaten AlorNumber of Bed, BOR, LOS, TOI, BTO in Regional PublicHospital of Alor 2012 - 2013
134
5.2.10 Jumlah Puskesmas dan Kunjungan menurut KecamatanNumber of Puskesmas and Check-up Detailed by District2013
135
5.2.11 Jumlah Wanita Usia 10 tahun ke atas yang Pernah Kawinmenurut Anak Lahir Hidup dan Anak Lahir Masih HidupNumber of Female between 15 – 49 years Old that have beenMarry According to the Born-Alive Child and the Born-Still-Alive Child 2013
136
5.2.12 Jumlah Kematian Ibu menurut Sebab Kematian danKecamatanNumber of Death Mother Population by Death Cause andDistrict 2013
137
5.2.13 10 Penyakit dengan Penderita Terbanyak menurut JenisPenyakitTop 10 Disease with the most Patient by Type of Disease2013
138
5.2.14 Kasus Luar Biasa (KLB) menurut Jenis dan Jumlah KasusExtraordinary Cases by Type and Number of Cases 2013
139
5.2.15 Jumlah Balita (umur 0 – 5 tahun) menurut Tingkatan GiziBalitaNumber of Baby (0 – 5 years) by the Baby Nutrient Level2008
140
5.2.16 Cakupan Imunisasi Balita menurut Jenisnya Dirinci tiapKecamatanThe Coverage of Baby Immunitation by Type of ImmunitationDetailed by District 2013
141
5.2.17 Persentase Cakupan pelayanan KIA, Bumil, Imunisasi TT 1 142
Statistics of Alor Regency 2014 xxiii
dan TT2 Dirinci tiap KecamatanThe Percentage of Service Coverage of KIA, Bumil(Pregnancy), Immunize TT 1 and TT 2 Detailed by District2013
5.2.18 Banyaknya Posyandu, PUS dan Akseptor Aktif Dirinci tiapKecamatanThe number of Posyandu, Active Acceptor and PUS Detailedby District 2013
143
5.2.19 Jumlah Cakupan K1, Cakupan K4 dan Kunjungan NeonatusDirinci tiap KecamatanCoverage of K1, Coverage of K4 and Neonatus Check-upDetailed by District 2013
144
5.2.20 Jumlah Petugas Lapangan Keluarga Berencana (KB) Dirincitiap KecamatanNumber of the Prosper-Family-Planning Outfield WorkerDetailed by District 2013
145
5.2.21 Banyaknya Akseptor Aktif menurut Alat Kontrasepsi yangDigunakan dan Akseptor Aktif yang Berhenti Menggunakan(Drop Out) Dirinci tiap KecamatanThe number of Active Acceptor according to ContraceptionMethod and the Number of Active Acceptor that Drop OutDetailed by District 2013
146
5.2.22 Jumlah Persedian Alat Kontrasepsi menurut JenisnyaSupplies of Contraception Appliance by its Type 2013
148
5.2.23 Jumlah Penderita PMS, IMS, HIV, dan AIDS serta JumlahKasus yang DitanganiNumber of Patient of PMS, IMS, HIV and AIDS and alsoNumber of Handled Cases 2013
149
5.2.24 Jumlah Pengguna Napza / Narkoba serta Jumlah Kasus yangDitanganiNumber of Drugs Consumer and also Number of HandledCases 2008 – 2013
150
5.3.1.1 Banyaknya Tempat Ibadah menurut KecamatanNumber of Religious Service Place by District 2013
155
5.3.1.2 Banyaknya Pemeluk Agama dan Aliran KepercayaanLainnya Dirinci tiap KecamatanNumber of Religion Follower Detailed by District 2013
156
5.3.2.1 Penghuni Lembaga Permasyarakatan dan Status dalamLembaga menurut Jenis Kejahatan / Pelanggaran dan Jenis
157
xxiv Statistik Kabupaten Alor 2014
KelaminPrisoner and the Status in Prison According to Crime /Collision and Sex 2013
5.3.2.2 Tambahan Narapidana Berdasarkan Putusan Pengadilanmenurut Lamanya Hukuman Tiap BulanAdditional Prisoner and Settled by Court by Type of Verdictper Monthly 2013
159
5.3.2.3 Tambahan Narapidana Berdasarkan Putusan Pengadilanmenurut Kelompok UmurAdditional Prisoner and Settled by Court by Group of Age2013
160
5.3.2.4 Jumlah Pelaku Kriminal menurut Lama Hukuman dan JenisKelaminNumber of Criminal by Type of Verdict and Sex 2013
161
5.3.2.5 Jumlah Pelaku Kriminal menurut Jenis KelaminNumber of Criminal by Sex 2008 – 2013
162
5.3.2.6 Jumlah Korban Kekerasan terhadap Perempuan dan JumlahKasus Trafficking Perempuan dan AnakNumber of Crime-to-womans Victims and Number of Womanand Child Trafficking Case 2008 – 2013
163
5.3.2.7 Jumlah Laporan Korban Kekerasan terhadap Perempuandirinci menurut Jenis KekerasanNumber of Crime-to-womansVictims Report detailed by Kindsof Crime 2013
164
5.3.3.1 Banyaknya Kasus yang Diselesaikan Pengadilan Negerimenurut Sikap Terhadap PutusanThe Number of Case that Finished by District Court accordingto Attitude on the Decision 2013
165
5.3.3.2 Banyaknya Kasus yang Diselesaikan Pengadilan Negerimenurut Jenis Pidana / HukumanThe Number of Case that Finished by District Court Accordingto Crime Type 2008 - 2013
166
5.3.4.1 Banyaknya Rumahtangga menurut Luas Lantai (M2)Number of Household by Area of Floor (M2) 2013
167
5.3.4.2 Banyaknya Rumahtangga menurut Jenis Lantai TerluasNumber of Household by Primary Floor 2013
168
5.3.4.3 Banyaknya Rumahtangga menurut Jenis Dinding TerluasNumber of Household by Primary Wall 2013
169
5.3.4.4 Banyaknya Rumahtangga menurut Jenis Atap Terluas 170

Statistics of Alor Regency 2014 xxv
Number of Household by Primary Roof 20135.3.4.5 Banyaknya Rumahtangga menurut Sumber Penerangan
Number of Household by Source of Lighting 2013171
5.3.4.6 Banyaknya Rumahtangga menurut Sumber Air MinumNumber of Household by Source of Water 2013
172
5.3.5.1 Jumlah Rumahtangga Miskin dan Anggota RumahtanggaMiskin Dirinci Tiap KecamatanNumber of Impecunious Household and The Member ofImpecunious Household Detailed by District
173
5.3.5.2 Jumlah dan Penghuni Panti Asuhan berdasarkan JenisKelaminNumber of Orphanage and The Orphanage by sex 2013
174
5.3.5.3 Jumlah Anak Berkebutuhan Khusus Menurut Jenis KelaminNumber of Child with Special Needs by Sex 2013
175
5.3.5.4 Indeks Pembangunan Manusia di Nusa Tenggara TimurMenurut KabupatenHuman Development Index in East Nusa TenggaraBy Regency 2010 - 2013
176
6.1.1 Luas Tanah Sawah Menurut Jenis Pengairan dan KecamatanRice Field Land by Type of Irrigation and District 2013
185
6.1.2 Luas Tanah Kering Menurut Penggunaannya danKecamatanArea Dry Land by Kind of Utilization and District 2013
187
6.1.3 Luas Panen, Rata–rata Hasil dan Produksi Padi Dirinci tiapKecamatanArea Harvested, Yield Rate and Rice Production Detailed byDistrict 2013
190
6.1.4 Luas Panen, Rata–rata Hasil dan Produksi Padi SawahMenurut KecamatanArea Harvested, Yield Rate and Production of Wetland rice byDistrict 2013
191
6.1.5 Luas Panen, Rata–rata Hasil dan Produksi Padi LadangMenurut KecamatanArea Harvested, Yield Rate and Production of Dry Land Riceby District 2013
192
6.1.6 Luas Panen, Rata–rata Hasil dan Produksi Jagung Dirincitiap KecamatanArea Harvested, Yield Rate and Production of Maize Detailedby District 2013
193
xxvi Statistik Kabupaten Alor 2014
6.1.7 Luas Panen, Rata–rata Hasil dan Produksi Ubi KayuMenurut KecamatanArea Harvested, Yield Rate and Production of Cassava byDistrict 2013
194
6.1.8 Luas Panen, Rata–rata Hasil dan Produksi Ubi Jalar MenurutKecamatanArea Harvested, Yield Rate and Production of Sweet Potatoesby District 2013
195
6.1.9 Luas Panen, Rata–rata Hasil dan Produksi Kacang Tanahmenurut KecamatanArea Harvested, Yield Rate and Production of Peanuts byDistrict 2013
196
6.1.10 Luas Panen, Rata–rata Hasil dan Produksi Kacang Hijaumenurut KecamatanArea Harvested, Yield Rate and Production of Green Peas byDistrict 2013
197
6.1.11 Luas Panen, Rata–rata Hasil dan Produksi Kacang Kedelaimenurut KecamatanArea Harvested, Yield Rate and Production of Soybean byDistrict 2013
198
6.2.1 Luas Areal dan Produksi Tanaman Perkebunan Kelapamenurut KecamatanCoconut Planting Area and Production of Estate by District2013
201
6.2.2 Luas Areal dan Produksi Tanaman Perkebunan Kopimenurut KecamatanCoffee Planting Area and Production of Estate by District2013
202
6.2.3 Luas Areal dan Produksi Tanaman Perkebunan Kapukmenurut KecamatanKapok Planting Area and Production of Estate by District2013
203
6.2.4 Luas Areal dan Produksi Tanaman Perkebunan JambuMente menurut KecamatanCashew Planting Area and Production of Estate by District2013
204
6.2.5 Luas Areal dan Produksi Tanaman Perkebunan Cengkehmenurut KecamatanClove Planting Area and Production of Estate by District 2013
205

Statistics of Alor Regency 2014 xxvii
6.2.6 Luas Areal dan Produksi Tanaman Perkebunan Kemirimenurut KecamatanWalnut Planting Area and Production of Estate by District2013
206
6.2.7 Luas Areal dan Produksi Tanaman Perkebunan Pinangmenurut KecamatanAreca Planting Area and Production of Estate by District 2013
207
6.2.8 Luas Areal dan Produksi Tanaman Perkebunan Panilimenurut KecamatanVanilla Planting Area and Production of Estate by District2013
208
6.2.9 Luas Areal dan Produksi Tanaman Perkebunan Kakaomenurut KecamatanCacao Planting Area and Production of Estate by District2013
209
6.2.10 Luas Areal dan Produksi Tanaman Perkebunan Palamenurut KecamatanNutmeg Planting Area and Production of Estate by District2013
210
6.2.11 Luas Areal dan Produksi Tanaman Perkebunan Ladamenurut KecamatanPepper Planting Area and Production of Estate by District2013
211
6.3.1 Luas Hutan menurut Jenis Hutan dan KecamatanArea Forestry by Kind of Forest and District 2013
215
6.3.2 Luas Hutan menurut Jenis Hutan dan KecamatanArea Forestry by Kind of Wood and District 2013
216
6.3.3 Populasi Cendana dan Luas Areal menurut KecamatanProduction and Area of Cendana Wood Detailed by District2013
217
6.4.1 Populasi Ternak Besar di Kabupaten Alor menurut JenisnyaLarge Livestock Population by Kind and Detailed by District2009–2013
221
6.4.2 Populasi Ternak Besar menurut Jenis Ternak danKecamatanLarge Livestock Population by Kind and Detailed by District2013
222
6.4.3 Populasi Ternak Kecil menurut Jenis Ternak dan KecamatanSmall Livestock Population by Kind and Detailed by District
223
xxviii Statistik Kabupaten Alor 2014
20136.5.1 Jumlah Rumahtangga Usaha Perikanan Laut menurut
Kategori Usaha dan KecamatanNumber of Marine Household by District and Categories2013
227
6.5.2 Jumlah Alat Penangkap Ikan, Usaha Perikanan menurutJenis Alat dan KecamatanNumber of Marine Fishing Gear by Type of Gear and District2013
228
6.5.3 Produksi Perikanan menurut Sektor dan KecamatanFisheries Production by Fisheries Group and District 2013
230
7.1.1 Banyaknya Pelanggan, Pemakaian dan Nilai PemakaianListrik PLN Dirinci tiap Cabang PLNNumber of Customer, Usage, and Usage Value of ElectricsDetailed by Branch of PLN 2013
235
7.1.2 Banyaknya Tenaga Listrik yang Dibangkitkan danPenggunaannyaNumber of Generated Electricity and the Usage 2013
236
7.2.1 Banyaknya Pelanggan, Pemakaian Air dan Nilai PemakaianAir Minum Dirinci tiap KecamatanNumber of Costumers, Water Usage and Usage ValueDetailed by District 2013
237
7.2.2 Realisasi Pemakaian Distribusi Air Minum menurut TempatPenyaluranNumber of Consumption Distribution Water by ChannelingPlace 2013
238
7.2.3 Banyaknya Air Minum yang Diproduksi dan PenggunaannyaNumber of Produced Water and the Usage 2013
239
8.1.1 Banyaknya Unit Usaha dan Tenaga Kerja menurut JenisIndustri Dirinci per KecamatanNumber of Economic Unit and Labor According To IndustrialType Detailed Per District 2013
245
8.2.1 Volume Bongkar Barang di Pelabuhan Kalabahi menurutJenis KomoditiGood Unload Volume in Kalabahi Port According toCommodity Type 2012–2013
250
8.2.2 Volume Muat Barang di Pelabuhan Kalabahi menurut JenisKomoditiGood Load Volume in Kalabahi Port According to Commodity
251
Statistics of Alor Regency 2014 xxix
Type 2012–20138.3.1 Banyaknya Hotel / Losmen, Kamar dan Tempat Tidur Dirinci
per KecamatanNumber of Hotel / Lodgings, Rooms and Beds by District2013
252
8.3.2 Banyaknya Tamu Asing dan Tamu Indonesia Menginap diHotel / Losmen Dirinci tiap BulanNumber of Foreign Guest and Local Guest that Lodge in Hotel/ Lodgings Detailed by Month 2012-2013
253
9.1.1 Jumlah SIM yang Dikeluarkan menurut Jenisnya per BulanNumber of Driving License Issued by Type per Month 2013
259
9.1.2 Banyaknya Pelanggaran Dirinci per BulanNumber of Delinquency Detailedt by Month 2013
260
9.1.3 Banyaknya Kecelakaan Lalu Lintas Dirinci BanyaknyaKorban dan Nilai KerugianNumber of Traffic Accident Detailed by People and FinancialValue 2005-2013
261
9.1.4 Banyaknya Kendaraan Bermotor Dirinci menurut JenisNumber of Motor Vehicles by Type of Motor Vehicles 2013
262
9.1.5 Banyaknya Kendaraan Bermotor Penumpang Umum Dirincimenurut JenisNumber of Public Motor Vehicles by Type of Motor Vehicles2013
263
9.2.1 Panjang Jalan menurut Kondisi JalanLength of Road by Road Condition 2008-2013
264
9.2.2 Panjang Jalan menurut Jenis PermukaanLength of Road by Type of Surface 2008-2013
265
9.2.3 Panjang Jalan menurut Status JalanLength of Road by Status Road 2008–2013
266
9.2.4 Jumlah dan Panjang Jembatan menurut Status JembatanNumber and Length of Bridge by Status of Bridge 2008–2013
267
9.3.1 Banyaknya Pesawat dan Penumpang yang Datang danBerangkat Lewat Bandar Udara Mali Dirinci tiap BulanNumber of Incoming Passenger and Plane that Arrive andDepart Through the Mali Airport Detailed by Month 2013
268
9.3.2 Volume Bongkar Muat Barang dan Bagasi Melalui BandarUdara Mali Dirinci per BulanVolume of Goods and Baggage Loading and UnloadingThrough Mali Airport Detailed by Month 2013
269
xxx Statistik Kabupaten Alor 2014
9.3.3 Volume Bongkar Muat Barang Pos Paket Melalui BandarUdara Mali Dirinci tiap BulanVolume of Loading and Unloading of Goods of Packet Post inMali Airport Detailed by Month 2013
270
9.4.1 Banyaknya Penumpang Kapal Laut Lewat PelabuhanKalabahi Dirinci per BulanNumber of Boat Passenger Pass the Kalabahi Port DetailedPer Month 2013
271
9.4.2 Kunjungan Kapal Laut di Pelabuhan Kalabahi Dirinci perBulanNumber of Boat Visit in Kalabahi Port Detailed per Month2013
272
9.4.3 Volume Bongkar Muat Barang dan Hewan di PelabuhanKalabahi Dirinci per BulanCargo Loaded / Unloaded and Cattle in Kalabahi Port perMonth 2013
273
9.5.1 Banyaknya Kantor Pos menurut KecamatanNumber of Post Office by District 2013
274
9.6.1 Jumlah Pelanggan Telepon Pemerintah dan SwastaNumber of Telephone Customers 2013
275
10.1.1 Realisasi Pendapatan Daerah Otonomi Tingkat II KabupatenAlor menurut Jenis Pendapatan pada Tahun AnggaranActual Second Stage Autonomous Regional Receipts of Aloron Fiscal Year 2013
281
10.1.2 Realisasi Pengeluaran Daerah Otonomi Kabupaten Alormenurut Jenis Pengeluaran pada Tahun AnggaranActual Second Stage Autonomous Regional Expenditure ofAlor on Fiscal Years 2013
282
10.2.1 Rekapitulasi Penerimaan Pajak-pajak Dati I NTT pada UPDTWilkab AlorRecapitulations of NTT Tax Income from Alor Regency 2013
284
10.3.1 Banyaknya KUD dan Koperasi Lainnya menurut StatusDirinci tiap KecamatanNumber of Village Unit Cooperative and Other Cooperativeby Status Detailed by District 2013
285
10.3.2 Banyaknya Anggota KUD dan Koperasi Lainnya menurutStatus Dirinci tiap KecamatanNumber of Member Village Unit Cooperative and OtherCooperative by Status Detailed by District 2013
280
Statistics of Alor Regency 2014 xxxi
10.3.3 Banyaknya Koperasi menurut Jenis per KecamatanNumber of Public Cooperative Service by Type and District2013
287
10.3.4 Banyaknya Bank Dirinci menurut Kecamatan di KabupatenAlorNumber of Bank in Alor Detailed by District 2013
288
10.4.1 Rata–rata Harga Eceran Sembilan bahan Pokok dan BahanStrategis Lainnya di Kota Kalabahi Dirinci per BulanAverage Retail Price of 9 Essential Commodities and OthersStrategies Commodities at Regional Capital Cities in Kalabahiby Month 2013
289
10.4.2 Harga Konsumen Komoditas di Ibu Kota Kabupaten AlorConsumer Prices Commodities at Regional Capital Cities inAlor 2013
292
11.1 Rata-rata Pengeluaran per Kapita Sebulan menurut JenisPengeluaranAverage Expenditure per Capita in a Month by ExpenditureItems 2013
311
11.2 Golongan Pengeluaran per Kapita SebulanExpenditure Classes per Capita in a Month 2013
313
12.1 Produk Domestik Regional Bruto Kabupaten Alor AtasDasar Harga Berlaku menurut Lapangan UsahaGross Regional Product of Alor by Current Market Prices byIndustrial Origin 2011–2013
319
12.2 Produk Domestik Regional Bruto Kabupaten Alor AtasDasar Harga Konstan menurut Lapangan UsahaGross Regional Product of Alor by Constant Market Prices byIndustrial Origin 2011–2013
321
12.3 Distribusi Persentase Produk Domestik Regional BrutoKabupaten Alor Usaha Atas Dasar Harga Berlaku menurutLapanganPercentage Distribution of Gross Regional Product of Alor atCurrent Market Prices by Industrial Origin 2011–2013
323
12.4 Distribusi Persentase Produk Domestik Regional BrutoKabupaten Alor Atas Dasar Harga Konstan 2000 menurutLapangan UsahaPercentage Distribution of Gross Regional Product of Alor atConstant 2000 Market Prices by Industrial Origin 2011–2013
325
12.5 Pendapatan Regional dan Angka per Kapita Kabupaten Alor 327
xxxii Statistik Kabupaten Alor 2014
Regional Income and per Capita Income Alor 2011–201312.6 Pertumbuhan Ekonomi (PDRB) pada Periode Perkembangan
Annually Economic Growth on Development Period 2005–2013
329
Statistics of Alor Regency 2014 xxxiii
D A F T A R G R A F I KLIST OF GRAPHIC
Halaman/Page1.1 Persentase Luas Kecamatan di Kabupaten Alor
Percentage of the District Area in Alor 201327
5.1 Komponen Indeks Pembangunan Manusia Kabupaten Alor2008-2013Component of Human Development Indeks in Alor Regency2008-2013
177
5.2 Indeks Pembanguna Manusia Kabupaten Alor 2008-2013Human Development Indeks in Alor Regency 2008-2013
178
xxxiv Statistik Kabupaten Alor 2014
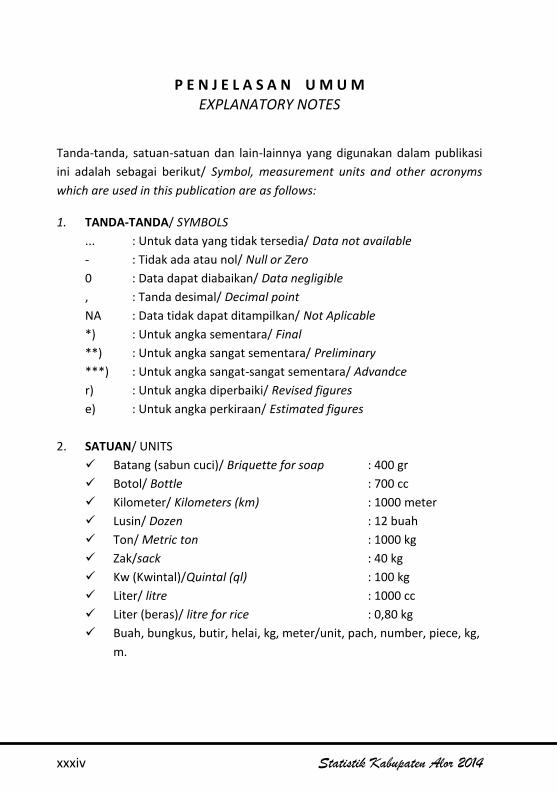
P E N J E L A S A N U M U MEXPLANATORY NOTES
Tanda-tanda, satuan-satuan dan lain-lainnya yang digunakan dalam publikasiini adalah sebagai berikut/ Symbol, measurement units and other acronymswhich are used in this publication are as follows:
1. TANDA-TANDA/ SYMBOLS... : Untuk data yang tidak tersedia/ Data not available- : Tidak ada atau nol/ Null or Zero0 : Data dapat diabaikan/ Data negligible, : Tanda desimal/ Decimal pointNA : Data tidak dapat ditampilkan/ Not Aplicable*) : Untuk angka sementara/ Final**) : Untuk angka sangat sementara/ Preliminary***) : Untuk angka sangat-sangat sementara/ Advandcer) : Untuk angka diperbaiki/ Revised figurese) : Untuk angka perkiraan/ Estimated figures
2. SATUAN/ UNITS Batang (sabun cuci)/ Briquette for soap : 400 gr Botol/ Bottle : 700 cc Kilometer/ Kilometers (km) : 1000 meter Lusin/ Dozen : 12 buah Ton/ Metric ton : 1000 kg Zak/sack : 40 kg Kw (Kwintal)/Quintal (ql) : 100 kg Liter/ litre : 1000 cc Liter (beras)/ litre for rice : 0,80 kg Buah, bungkus, butir, helai, kg, meter/unit, pach, number, piece, kg,
m.
Statistics of Alor Regency 2014 xxxv
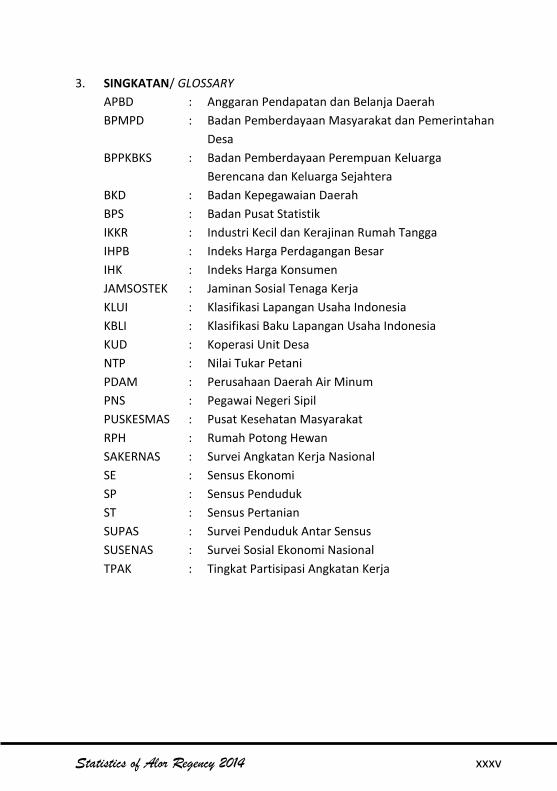
3. SINGKATAN/ GLOSSARYAPBD : Anggaran Pendapatan dan Belanja DaerahBPMPD : Badan Pemberdayaan Masyarakat dan Pemerintahan
DesaBPPKBKS : Badan Pemberdayaan Perempuan Keluarga
Berencana dan Keluarga SejahteraBKD : Badan Kepegawaian DaerahBPS : Badan Pusat StatistikIKKR : Industri Kecil dan Kerajinan Rumah TanggaIHPB : Indeks Harga Perdagangan BesarIHK : Indeks Harga KonsumenJAMSOSTEK : Jaminan Sosial Tenaga KerjaKLUI : Klasifikasi Lapangan Usaha IndonesiaKBLI : Klasifikasi Baku Lapangan Usaha IndonesiaKUD : Koperasi Unit DesaNTP : Nilai Tukar PetaniPDAM : Perusahaan Daerah Air MinumPNS : Pegawai Negeri SipilPUSKESMAS : Pusat Kesehatan MasyarakatRPH : Rumah Potong HewanSAKERNAS : Survei Angkatan Kerja NasionalSE : Sensus EkonomiSP : Sensus PendudukST : Sensus PertanianSUPAS : Survei Penduduk Antar SensusSUSENAS : Survei Sosial Ekonomi NasionalTPAK : Tingkat Partisipasi Angkatan Kerja
xxxvi Statistik Kabupaten Alor 2014
DEWAN PERWAKILAN RAKYAT
REPUBLIK INDONESIA
UNDANG-UNDANG REPUBLIK INDONESIA
NOMOR 16 TAHUN 1997
TENTANG
STATISTIK
DENGAN RAHMAT TUHAN YANG MAHA ESA
PRESIDEN REPUBLIK INDONESIA
Menimbang : a. bahwa statistik penting artinya bagi perencanaan,pelaksanaan, pemantauan, dan evaluasipenyelenggaraan berbagai kegiatan di segenapaspek kehidupan bermasyarakat, berbangsa, danbernegara dalam pembangunan nasional sebagaipengamalan Pancasila, untuk memajukankesejahteraan rakyat dalam rangka mencapai cita-cita bangsa sebagaimana tercantum dalamPembukaan Undang-Undang Dasar 1945;
b. bahwa dengan memperhatikan pentingnya perananstatistik tersebut, diperlukan langkah-langkah untukmengatur penyelenggaraan statistik nasionalterpadu dalam rangka mewujudkan Sistem StatistikNasional yang andal, efektif, dan efisien;
Statistics of Alor Regency 2014 xxxvii
c. bahwa Undang-undang Nomor 6 Tahun 1960tentang Sensus dan Undang-undang Nomor 7 tahun1960 tentang Statistik pada saat ini tidak sesuai lagidengan perkembangan keadaan, tuntutanmasyarakat, dan kebutuhan pembangunan nasional;
d. bahwa berdasarkan pertimbangan sebagaimandimaksud dalam huruf a, b, c, di atas, dipandangperlu membentuk Undang-undang tentang Statistikyang baru;
Mengingat : Pasal 5 ayat (1) dan Pasal 20 ayat (1) Undang-undangDasar 1945;
Dengan Persetujuan
DEWAN PERWAKILAN RAKYAT INDONESIA
MEMUTUSKAN
Menetapkan : UNDANG-UNDANG TENTANG STATISTIK
xxxviii Statistik Kabupaten Alor 2014
BAB I
KETENTUAN UMUM
Pasal 1
Dalam Undang-undang ini yang dimaksud dengan :
1. Statistik adalah data yang diperoleh dengan cara pengumpulan,pengolahan, penyajian, dan analisis serta sebagai sistem yangmengatur keterkaitan antar unsur dalam penyelenggaraan statistik.
2. Data adalah informasi yang berupa angka tentang karakteristik(ciri-ciri khusus) suatu populasi.
3. Sistem Statistik Nasional adalah suatu tatanan yang terdiri atasunsur-unsur yang secara teratur saling berkaitan sehinggamembentuk totalitas dalam penyelenggaraan statistik.
4. Kegiatan statistik adalah tindakan yang meliputi upaya penyediaandan penyebarluasan data, upaya pengembangan ilmu statistik, danupaya yang mengarah pada berkembangnya Sistem StatistikNasional
5. Statistik dasar adalah statistik yang pemanfaatannya ditujukanuntuk keperluan yang bersifat luas, baik bagi pemerintah maupunmasyarakat, yang memiliki ciri-ciri lintas sektoral, berskala nasional,makro, dan yang penyelenggaraannya menjadi tanggung jawabBadan.
6. Statistik sektoral adalah statistik yang pemanfaatannya ditujukanuntuk memenuhi kebutuhan instansi tertentu dalam rangkapenyelenggaraan tugas-tugas pemerintahan dan pembangunanyang merupakan tugas pokok instansi bersangkutan.
7. Statistik khusus adalah statistik yang pemanfaatannya ditujukanuntuk memenuhi kebutuhan spesifik dunia usaha, pendidikan,sosial budaya, dan kepentingan lain dalam kehidupan masyarakat,yang penyelenggaraannya dilakukan oleh lembaga, organisasi,perorangan, dan atau unsur manyarakat lainnya.
Statistics of Alor Regency 2014 xxxix
8. Sensus adalah cara pengumpulan data yang dilakukan melaluipencacahan semua unit populasi di seluruh wilayah RepublikIndonesia untuk memperoleh karakteristik suatu populasi padasaat tertentu.
9. Survei adalah cara pengumpulan data yang dilakukan melalupencacahan sampel untuk memperkirakan karakteristik suatupopulasi pada saat tertentu.
10. Kompilasi produk administrasi adalah cara pengumpulan,pengolahan, penyajian, dan analisis data yang didasrkan padacatatan administrasi yang ada pada pemerintah dan ataumasyarakat.
11. Badan adalah Badan Pusat Statistik.
12. Populasi adalah keseluruhan unit yang menjadi objek kegiatanstatistik baik yang berupa kegiatan instansi pemerintahan,lembaga, organisasi, orang, benda maupun objek lainnya.
13. Sampel adalah sebagian unit populasi yang menjadi objekpenelitian untuk memperkirakan karakteristik suatu populasi.
14. Sinopsis adalah suatu ikhtisar penyelenggaraan statistik.
15. Penyelenggara kegiatan statistik adalah instansi pemerintah,lembaga, organisasi, perorangan, dan atau unsur masyarakatlainnya.
16. Petugas statistik adalah orang yang diberi tugas olehpenyelenggara kegiatan statistik untuk melaksanakanpengumpulan data, baik melalui wawancara, pengukuran,maunpun cara lain terhadap objek kegiatan statistik.
17. Responden adalah instansi pemerintah, lembaga, organisasi, orang,dan atau unsur masyarakat lainnya yang ditentukan sebagai objekkegiatan statistik.

xl Statistik Kabupaten Alor 2014
BAB II
ASAS, ARAH, DAN TUJUAN
Pasal 2
Selain berlandaskan asas-asas pembangunan nasional, Undang-undangini juga berasaskan :
a. keterpaduan;b. keakuratan; danc. kemuktahiran.
Pasal 3
Kegiatan statistik diarahkan untuk :
a. mendukung pembangunan nasional;b. mengembangkan Sistem Statistik Nasional yang andal, efektif, dan
efisien;c. meningkatkan kesadaran masyarakat akan arti dan kegunaan
statsitik; dand. mendukung pengembangan ilmu pengetahuan dan teknologi.
Pasal 4
Kegiatan statistik bertujuan untuk menyediakan data statistik yanglengkap, akurat, dan muktahir dalam rangka mewujudkan SistemStatistik Nasional yang andal, efektif, dan efisien guna mendukungpembangunan nasional.
BAB III
JENIS STATISTIK DAN CARA PENGUMPULAN DATA
Bagian Pertama
Jenis Statistik
Statistics of Alor Regency 2014 xli
Pasal 5
Berdasarkan tujuan pemanfaatannya, jenis statistik terdiri atas :
a. statistik dasar;b. statistik sektoral; danc. statistik khusus.
Pasal 6
(1) Statistik dasar dan statistik sektoral terbuka pemanfaatannya untukumum, kecuali ditentukan lain oleh peraturan perundang-undangan yang berlaku.
(2) Setiap orang memiliki kesempatan yang sama untuk mengetahuidan memanfaatkan statistik khusus dengan tetap memperhatikanhak seseorang atau lembaga yang dlindungi undang-undang.
Bagian Kedua
Cara Pengumpulan Data
Pasal 7
Statistik diselenggarakan melalui pengumpulan data yang dilakukansecara :
a. Sensus;b. survei;c. kompilasi produk administrasi; dand. cara lain sesuai dengan perkembangan ilmu pengetahuan dan
teknologi.
Pasal 8
(1) Sensus sebagaimana dimaksud dalam pasal 7 huruf adiselenggarakan sekurang-kurangnya sekali dalam 10 (sepuluh)tahun oleh Badan, yang meliputi :a. sensus penduduk;
xlii Statistik Kabupaten Alor 2014
b. sensus pertanian: danc. sensus ekonomi.
(2) Penetapan tahun penyelenggaraan dan perubahan jenis sensussebagaimana dimaksud dalam ayar (1), diatur lebih lanjut denganPeraturan Pemerintah.
Pasal 9
(1) Survei sebagaimana dimaksud dalam pasal 7 huruf bdiselenggarakan secara berkala dan sewaktu-waktu untukmemperoleh data yang rinci.
(2) Survei antarsensus dilakukan pada pertengahan 2 (dua) sensussejenis untuk menjembatani 2 (dua) sensus sejenis tersebut.
Pasal 10
(1) Kompilasi produk administrasi sebagaiman dimaksud dalam pasal 7huruf c dilaksanakan dengan memanfaatkan berbagai dokumenproduk administrasi.
(2) Hasil kompilasi peroduk administrasi milik instansi pemerintahterbuka pemanfaatannya untuk umum, kecuali ditentukan lain olehperaturan perundang-undangan yang berlaku.
(3) Setiap orang mempunyai kesempatan yang sama untukmengetahui dan memanfaatkan hasil kompilasi produkadministrasi milik lembaga, organisasi, perorangan, dan atau unsurmasyarakat lainnya dengan tetap memperhatikan hak seseorangatau lembaga yang dilindungi undang-undang.
Statistics of Alor Regency 2014 xliii
BAB IV
PENYELENGGARAAN STATISTIK
Bagian Pertama
Statistik Dasar
Pasal 11
(1) Statistik dasar diselenggarakan oleh Badan
(2) Dalam menyelenggarakan statistik dasar sebagaimana dimaksuddalam ayat (1), Badan memperoleh data dengan cara:a. sensus;b. survei;c. kompilasi produk administrasi; dand. cara lain sesuai dengan perkembangan ilmu pengetahuan dan
teknologi
Bagian Kedua
Statistik Sektoral
Pasal 12
(1) Statistik sektoral diselenggarakan oleh instansi pemerintah sesuailingkup tugas dan fungsinya secara mandiri atau bersama denganBadan.
(2) Dalam menyelenggarakan statistik sektoral, instansi pemerintahmemperoleh data dengan cara:a. surveib. kompilasi produk administrasic. cara lain sesuai dengan perkembangan ilmu pengetahuan dan
teknologi.
(3) Statistik sektoral harus diselenggarakan bersama dengan Badanapabila statistik tersebut hanya dapat diperoleh dengan carasensus dan jangkauan populasi berskala nasional.
xliv Statistik Kabupaten Alor 2014
(4) Hasil statistik sektoral yang diselenggarakan sendiri oleh instansipemerintah wajib diserahkan kepada Badan.
Bagian Ketiga
Statistik Khusus
Pasal 13
(1) Statistik khusus diselenggarakan oleh masyarakat baik lembaga,organisasi, perorangan, maupun unsur masyarakat lainnya secaramandiri ata bersama dengan Badan.
(2) Dalam menyelenggarakan statistik khusus sebagaimana dimaksuddalam ayat (1), masyarakat memperoleh data dengan cara :a. Survei;b. kompilasi produk administrasi; danc. cara lain sesuai dengan perkembangan ilmu pengetahuan dan
teknologi.
Pasal 14
(1) Dalam rangka pengembangan Sistem Statistik Nasional, masyarakatsebagaimana dimaksud dalam Pasal 13 ayat (1) wajibmemberitahukan sinopsis kegiatan statistik yang telah selesaidiselenggarakannya kepada Badan.
(2) Sinopsis sebagaimana dimaksud dalam ayat (1) memuat:a. judul;b. wilayah kegiatan statistik;c. objek populasi;d. jumlah responden;e. waktu pelaksanaan;f. metode statistik;g. nama dan alamat pennyelenggara; danh. abstrak.
Statistics of Alor Regency 2014 xlv
(3) Penyampaian pemberitahuan sinopsis dapat dilakukan melalui pos,jaringan komunikasi data, atau cara penyampaian lainnya yangdianggap mudah bagi penyelenggara kegiatan statistik.
(4) Kewajiban memberitahukan sinopsis sebagaimana dimaksud dalamayat (1), tidak berlaku bagi statistik yang digunakan untukmemenuhi kebutuhan intern.
BAB V
PENGUMUMAN DAN PENYEBARLUASAN
Pasal 15
(1) Badan berwenang mengumumkan hasil statistik yangdiselenggarakannya.
(2) Pengumuman hasil statistik dimuat dalam Berita Resmi Statistik.
Pasal 16
Badan menyebarluaskan hasil statistik yang diselenggarakannya.
BAB VI
KOORDINASI DAN KERJASAMA
Pasal 17
(1) Koordinasi dan kerjasama penyelenggara statistik dilakukan olehBadan dengan instansi pemerintah dan masyarakat, di tingkatpusat dan daerah.
(2) Dalam rangka mewujudkan dan mengembangkan Sistem StatistikNasional, Badan bekerjasama dengan instansi pemerintah danmasyarakat untuk membangun pembakuan konsep, definisi,klasifikasi, dan ukuran-ukuran.
(3) Koordinasi dan kerjasama sebagaimana dimaksud dalam ayat (1)dilaksanakan atas dasar kemitraan dan dengan tetap
xlvi Statistik Kabupaten Alor 2014
mengantisipasi serta menerpkan perkembangan ilmu pengetahuandan teknologi.
(4) Ketentuan mengenai tata cara dan lingkup koordinasi dankerjasama penyelenggara statistik antara Badan, instansipemerintah, dan masyarakat diatur lebih lanjut dengan KeputusanPresiden.
Pasal 18
(1) Kerjasama penyelenggaraan statistik dapat juga dilakukan olehBadan, instansi pemerintah, dan atau masyarakat dengam lembagainternasional, negara asing, atau lembaga swasta asing sesuaidengan peraturan perundang-undangan yang berlaku.
(2) Kerjasama penyelenggaraan statistik sebagaimana dimaksud dalampasal (1) didasarkan pada prinsip bahwa penyelenggara utamaadalah Badan, instansi pemerintah, atau masyarakat Indonesia.
BAB VII
HAK DAN KEWAJIBAN
Bagian Pertama
Penyelenggaraan Kegiatan Statistik
Pasal 19
Penyelenggara kegiatan statistik berhak memperoleh keterangan dariresponden mengenai karakteristik setiap unit populasi yang menjadiobjek.
Pasal 20
Penyelenggara kegiatan statistik wajib memberikan kesempatan yangsama kepada masyarakat untuk mengetahui dan memperoleh manfaatdari statistik yang tersedia, sesuai dengan ketentuan peraturanperundang-undangan yang berlaku.
Statistics of Alor Regency 2014 xlvii
Pasal 21
Penyelenggara kegiatan statistik wajib menjamin kerahasiaanketerangan yang diperoleh dari responden.
Bagian Kedua
Petugas Statistik
Pasal 22
Setiap petugas statistik Badan berhak memasuki wilayah kerja yangtelah ditentukan untuk memperoleh keterangan yang diperlukan.
Pasal 23
Setiap petugas statistik wajib menyampaikan hasil pelaksanaan statistiksebagaimana adanya.
Pasal 24
Ketentuan mengenai jaminan kerahasiaan keterangan sebagaimandimaksud dalam Pasal 21 berlaku juga bagi petugas statistik.
Pasal 25
Setiap petugas statistik harus memperlihatkan surat tugas dan atautanda pengenal, serta wajib memperhatikan nilai-nilai agama, adatistiadat setempat, tata krama, dan ketertiban umum.
Bagian Ketiga
Responden
Pasal 26
(1) Setiap orang berhak menolak untuk dijadikan responden, kecualidan penyelenggaraan statistik dasar oleh Badan
xlviii Statistik Kabupaten Alor 2014
(2) Setiap responden berhak menolak petugas statistik yang tidakdapat memenuhi ketentuan sebagaimana dimaksud dalam Pasal 25
Pasal 27
Setiap responden wajib memberikan keterangan yang diperlukandalam penyelenggaraan statistik dasar oleh Badan.
BAB VIII
KELEMBAGAAN
Pasal 28
(1) Pemerintah membentuk badan yang berada di bawah danbertanggung jawab langsung kepada Presiden.
(2) Badan mempunyai perwakilan wilayah di Daerah yang merupakaninstansi vertikal.
(3) Ketentuan mengenai tugas, fungsi, susunan organisasi, dan tatakerja Badan, sebagaimana dimaksud dalam ayat (1) dan ayat (2),diatur lebih lanjut dengan Keputusan Presiden.
Pasal 29
(1) Pemerintah membentuk Forum Masyarakat Statistik yang bertugasmemberikan saran dan pertimbangan di bidang statistik kepadaBadan.
(2) Forum sebagaiman dimaksud dalam ayat (1) bersifat nostrukturaldan independen, yang anggotanya terdiri atas unsur pemerintah,pakar, praktisi, dan tokoh masyarakat.
Pasal 30
(1) Instansi pemerintah dapat membentuk satuan organisasi dilingkungannya untuk melaksanakan statistik sektoral.
Statistics of Alor Regency 2014 xlix
(2) Ketentuan mengenai tugas, fungsi, susunan organisasi, dan tatakerja satuan organisasi sebagaimana dimaksud dalam ayat (1)diatur oleh instansi yang bersangkutan berdasarkan peraturanperundang-undangan yang berlaku.
(3) Dalam menyelenggarakan statistik sektoral, suatu organisasisebagaimana dimaksud dalam ayat (1) harus mengadakankoodinasi dengan Badan untuk menerapkan penggunaan konsep,definisi, klasifikasi, dan ukuran-ukuran yang telah dibakukan dalamrangka pengembangan Sistem Statistik Nasional.
BAB IX
PEMBINAAN
Pasal 31
Badan bekerja sama dengan instansi pemerintah dan unsur masyarakatmelakukan pembinaan terhadap penyelenggaraan kegiatan statistikdan masyarakat, agar lebih meningkatkan kontribusi dan apresiasimasyarakat terhadap statistik, mengembangkan Sistem StatistikNasional, dan mendukung pembangunan nasional.
Pasal 32
Dalam rangka pembinaan sebagaimana dimaksud dalam Pasal 31,Badan melakukan upaya-upaya sebagai berikut:
a. meningkatkan kemampuan sumber daya manusia dalampenyelenggaraan statistik;
b. mengembangkan statistik sebagai ilmu;c. meningkatkan penguasaan ilmu pengetahuan dan teknologi yang
dapat mendukung penyelenggaraan statistik;d. mewujudkan kondisi yang mendukung terbentuknya pembakuan
dan pengembangan konsep, definisi, klasifikasi, dan ukuran-ukurandalam rangka semangat kerja sama dengan para penyelenggarakegiatan statistik lainnya;

l Statistik Kabupaten Alor 2014
e. mengembangkan sistem informasi statistik;f. meningkatkan penyebarluasan informasi statistik;g. meningkatkan kemampuan penggunaan dan pemanfaatan hasil
statistik untuk mendukung pembangunan nasional; danh. meningkatkan kesadaran masyarakat akan arti dan kegunaan
statistik
Pasal 33
Pelaksanaan pembinaan sebagaimana dimaksud dalam pasal 31 diaturlebih lanjut dengan Peraturan Pemerintah.
BAB X
KETENTUAN PIDANA
Pasal 34
Setiap orang yang tanpa hak menyelenggarakan sensus sebagaimanadimaksud dalam pasal 11 ayat (2) huruf a, dipidana dengan pidananpenjara paling lama 2 (dua) tahun dan dengan paling banyakRp.50.000.000,00 (lima puluh juta rupiah)
Pasal 35
Setiap orang yang dengan sengaja melanggar ketentuan sebagaimanadimaksud dalam Pasal 14 ayat (1) dipidana dengan pidana kurunganpaling lama 1 (satu) tahun. Atau denda pailng banyak Rp.25.000.000,00(dua puluh lima juta rupiah)
Pasal 36
(1) Penyelenggara kegiatan statistik yang dengan sengaja dan tanpaalasan yang sah tidak memenuhi kewajiban sebagaimana dimaksuddalam Pasal 20, dipidana dengan pidana kurungan paling lama 1(satu) tahun atau denda paling banyak Rp. 25.000.000,00 (duapuluh lima juta rupiah).
Statistics of Alor Regency 2014 li
(2) Penyelenggara kegiatan statistik yang dengan sengaja melanggarketentuan sebagaimana dimaksud dalam pasal 21, dipidana denganpidana penjara paling lama 5 (lima) tahun dan denda paling banyakRp. 100.000.000,00 (seratus juta rupiah).
Pasal 37
Petugas statistik yang dengan sengaja melanggar ketentuansebagaimana dimaksud dalam Pasal 24, dipidana dengan pidanapenjara paling lama 1 (satu) tahun 6 (enam) bulan dan denda palingbanyak Rp. 15.000.000,00 (lima belas juta rupiah).
Pasal 38
Responden yang dengan sengaja melanggar ketentuan sebagaimanadimaksud dalam Pasal 27, dipidana dengan pidana penjara paling lama1 (satu) tahun 6 (enam) bulan dan denda paling banyak Rp.25.000.000,00 (dua puluh lima juta rupiah).
Pasal 39
Setiap orang yang sengaja dan tanpa alasan yang sah mencegah,menghalang-halangi, atau menggagalkan jalannya penyelenggaraanstatistik yang dilakukan oleh penyelenggara kegiatan statistik dasar danatau statistik sektoral, dipidana dengan pidana penjara paling lama 5(lima) tahun dan denda paling banyak Rp. 100.000.000,00 (seratus jutarupiah).
Pasal 40
(1) Tindakan pidana sebagaimana dimaksud dalam Pasal 34, Pasal 36ayat (2), Pasal 37, Pasal 38, dan Pasal 39 adalah kejahatan.
(2) Tindak pidana sebagaimana dimaksud dalam Pasal 35 dan Pasal 36ayat (1) adalah pelanggaran.
lii Statistik Kabupaten Alor 2014
BAB XI
KETENTUAN PERALIHAN
Pasal 41
Semua peraturan pelaksanaan Undang-undang Nomor 6 Tahun 1960tentang Sensus dan Undang-undang Nomor 7 tentang Statistikdinyatakan tetap berlaku sepanjang tidak bertentangan atau belumdiganti dengan yang baru berdasarkan Undang-undang ini.
BAB XII
PENUTUP
Pasal 42
Pada saat mulai berlakunya Undang-undang ini, maka Undang-undangNomor 6 Tahun 1960 tentang Sensus dan Undang-undang Nomor 7tahun 1960 tentang Statistik dinyatakan tidak berlaku.
Statistics of Alor Regency 2014 liii
Pasal 43
Undang-undang ini mulai berlaku pada tanggal diundangkan.
Agar setiap orang dapat mengetahuinya, memerintahkanpengundangan Undang-undang ini dengan penempatannya dalamLemabaran Negara Republik Indonesia.
LEMBARAN NEGARA REPUBLIK INDONESIA TAHUN 1997 NOMOR 39
Disahkan di Jakartapada tanggal 19 Mei 1997
PRESIDEN REPUBLIK INDONESIA
ttd
SOEHARTO
Diundangkan di Jakarta
pada tanggal 19 Mei 1997
MENTERI NEGARA SEKRETARISNEGARA REPUBLIK INDONESIA
ttd
MOERDIONO

liv Statistik Kabupaten Alor 2014
Geographic Situation
Statistics of Alor Regency 2014 1
BAB ISITUASI GEOGRAFI
Geographic Situation
Situasi Geografi
2 Statistik Kabupaten Alor 2014

Geographic Situation
Statistics of Alor Regency 2014 3
Penjelasan Tekniks Technical Notes
1. Kabupaten Alor merupakansalah satu kabupaten di PropinsiNusa Tenggara Timur yangterletak di bagian timur laut.Kabupaten Alor terdiri dari tigapulau besar dan enam pulaukecil yang saat ini adapenghuninya.
2. Secara astronomis, KabupatenAlor terletak antara: Timur : 125º - 48º BT Barat : 123º - 48º BT Utara : 8º - 6º LS Selatan : 8º - 36º LS
3. Berdasarkan wilayahnya, batas-batas Kabupaten Alor adalah: Timur : Pulau-pulau di
Maluku. Barat : Selat Lomblen
Lembata Utara : Laut Flores Selatan :Selat Ombay dan
Timor Leste
4. Alor yang memiliki luas ..........Km2 terdiri dari ..... Kecamatan.Secara geografis, kondisidaerah ini merupakan daerahpegunungan tinggi yangdikelilingi oleh lembah-lembahdan jurang-jurang. .... dariwilayah di Kabupaten Alormerupakan daerah dengankemiringan lebih dari 40 o.
The Regency of Alor is part of theProvince of East Nusa Tenggarawhich located in north east of theprovince. The Regency of Alorconsists of three main islands andsix isles dwelt.
Astronomically, the Regency of Aloris located between:
East : 125º - 48º EastLongitude
West : 123º - 48º EastLongitude
North : 8º - 6º South Latitude South : 8º - 36º South Latitude
Base on its territory, the border ofthe Regency of Alor are:
East : Island of MalukuProvince
West : Lomblen Strait ofLembata
North : Sea of Flores South : Ombay Strait and
Timor Leste
Alor with ......... Km2 of total area isconsist of 17 district. Geographically,the condition of the area arerepresented with high mountainencircled by dales and creavasses........ of area in Alor is the area ofinclination more than 40 o.
Situasi Geografi
4 Statistik Kabupaten Alor 2014
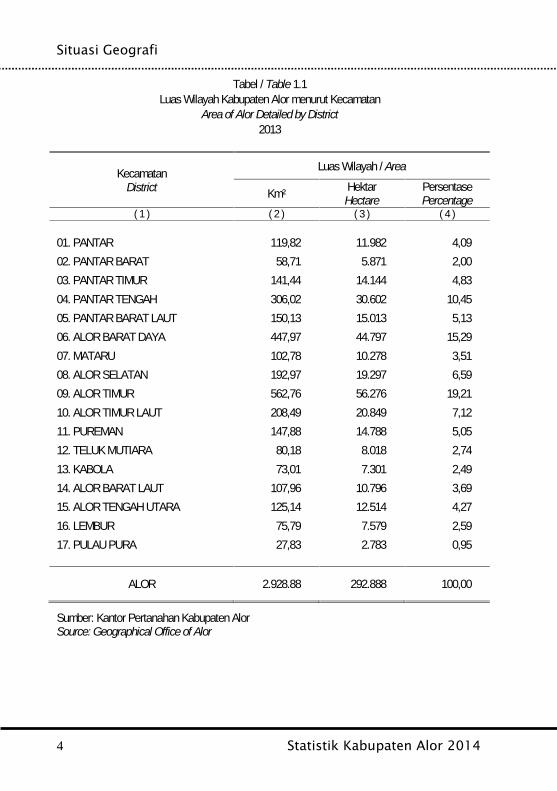
Tabel / Table 1.1Luas Wilayah Kabupaten Alor menurut Kecamatan
Area of Alor Detailed by District2013
KecamatanDistrict
Luas Wilayah / Area
Km² HektarHectare
PersentasePercentage
( 1 ) ( 2 ) ( 3 ) ( 4 )
01. PANTAR 119,82 11.982 4,0902. PANTAR BARAT 58,71 5.871 2,0003. PANTAR TIMUR 141,44 14.144 4,8304. PANTAR TENGAH 306,02 30.602 10,4505. PANTAR BARAT LAUT 150,13 15.013 5,1306. ALOR BARAT DAYA 447,97 44.797 15,2907. MATARU 102,78 10.278 3,5108. ALOR SELATAN 192,97 19.297 6,5909. ALOR TIMUR 562,76 56.276 19,2110. ALOR TIMUR LAUT 208,49 20.849 7,1211. PUREMAN 147,88 14.788 5,0512. TELUK MUTIARA 80,18 8.018 2,7413. KABOLA 73,01 7.301 2,4914. ALOR BARAT LAUT 107,96 10.796 3,6915. ALOR TENGAH UTARA 125,14 12.514 4,2716. LEMBUR 75,79 7.579 2,5917. PULAU PURA 27,83 2.783 0,95
ALOR 2.928.88 292.888 100,00
Sumber: Kantor Pertanahan Kabupaten AlorSource: Geographical Office of Alor
Geographic Situation
Statistics of Alor Regency 2014 5
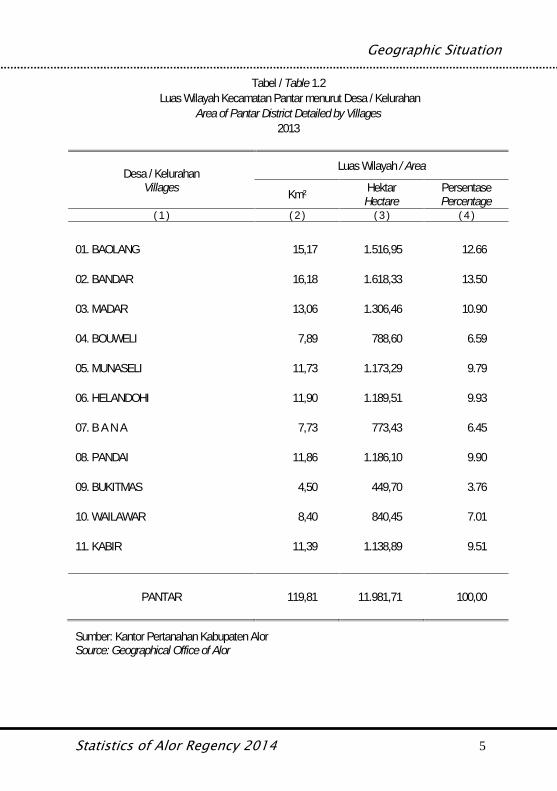
Tabel / Table 1.2Luas Wilayah Kecamatan Pantar menurut Desa / Kelurahan
Area of Pantar District Detailed by Villages2013
Desa / KelurahanVillages
Luas Wilayah / Area
Km² HektarHectare
PersentasePercentage
( 1 ) ( 2 ) ( 3 ) ( 4 )
01. BAOLANG 15,17 1.516,95 12.66
02. BANDAR 16,18 1.618,33 13.50
03. MADAR 13,06 1.306,46 10.90
04. BOUWELI 7,89 788,60 6.59
05. MUNASELI 11,73 1.173,29 9.79
06. HELANDOHI 11,90 1.189,51 9.93
07. B A N A 7,73 773,43 6.45
08. PANDAI 11,86 1.186,10 9.90
09. BUKITMAS 4,50 449,70 3.76
10. WAILAWAR 8,40 840,45 7.01
11. KABIR 11,39 1.138,89 9.51
PANTAR 119,81 11.981,71 100,00
Sumber: Kantor Pertanahan Kabupaten AlorSource: Geographical Office of Alor
Situasi Geografi
6 Statistik Kabupaten Alor 2014
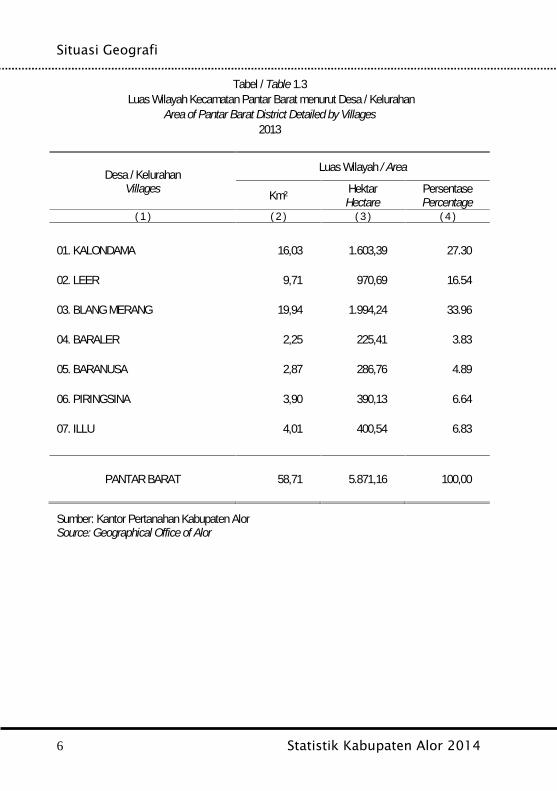
Tabel / Table 1.3Luas Wilayah Kecamatan Pantar Barat menurut Desa / Kelurahan
Area of Pantar Barat District Detailed by Villages2013
Desa / KelurahanVillages
Luas Wilayah / Area
Km² HektarHectare
PersentasePercentage
( 1 ) ( 2 ) ( 3 ) ( 4 )
01. KALONDAMA 16,03 1.603,39 27.30
02. LEER 9,71 970,69 16.54
03. BLANG MERANG 19,94 1.994,24 33.96
04. BARALER 2,25 225,41 3.83
05. BARANUSA 2,87 286,76 4.89
06. PIRINGSINA 3,90 390,13 6.64
07. ILLU 4,01 400,54 6.83
PANTAR BARAT 58,71 5.871,16 100,00
Sumber: Kantor Pertanahan Kabupaten AlorSource: Geographical Office of Alor
Geographic Situation
Statistics of Alor Regency 2014 7
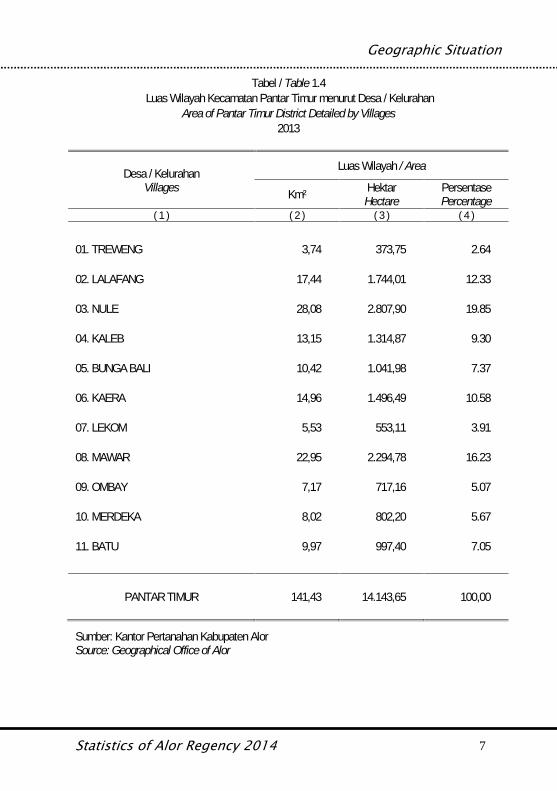
Tabel / Table 1.4Luas Wilayah Kecamatan Pantar Timur menurut Desa / Kelurahan
Area of Pantar Timur District Detailed by Villages2013
Desa / KelurahanVillages
Luas Wilayah / Area
Km² HektarHectare
PersentasePercentage
( 1 ) ( 2 ) ( 3 ) ( 4 )
01. TREWENG 3,74 373,75 2.64
02. LALAFANG 17,44 1.744,01 12.33
03. NULE 28,08 2.807,90 19.85
04. KALEB 13,15 1.314,87 9.30
05. BUNGA BALI 10,42 1.041,98 7.37
06. KAERA 14,96 1.496,49 10.58
07. LEKOM 5,53 553,11 3.91
08. MAWAR 22,95 2.294,78 16.23
09. OMBAY 7,17 717,16 5.07
10. MERDEKA 8,02 802,20 5.67
11. BATU 9,97 997,40 7.05
PANTAR TIMUR 141,43 14.143,65 100,00
Sumber: Kantor Pertanahan Kabupaten AlorSource: Geographical Office of Alor
Situasi Geografi
8 Statistik Kabupaten Alor 2014
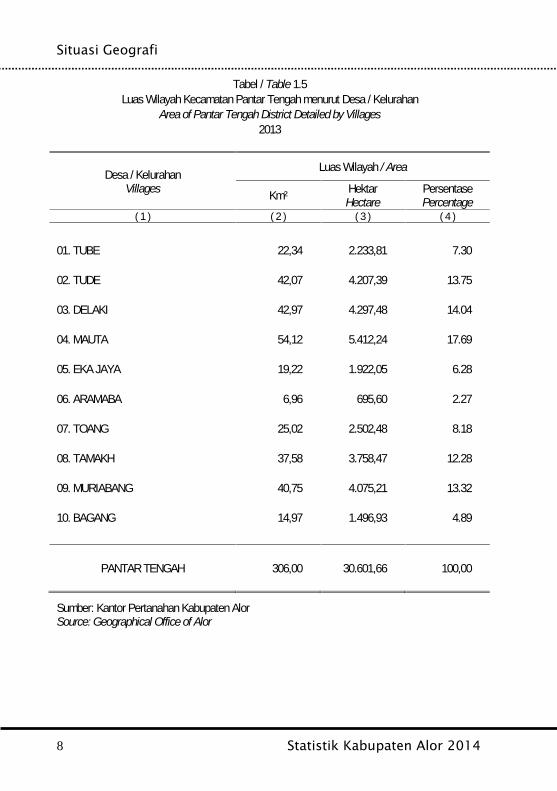
Tabel / Table 1.5Luas Wilayah Kecamatan Pantar Tengah menurut Desa / Kelurahan
Area of Pantar Tengah District Detailed by Villages2013
Desa / KelurahanVillages
Luas Wilayah / Area
Km² HektarHectare
PersentasePercentage
( 1 ) ( 2 ) ( 3 ) ( 4 )
01. TUBE 22,34 2.233,81 7.30
02. TUDE 42,07 4.207,39 13.75
03. DELAKI 42,97 4.297,48 14.04
04. MAUTA 54,12 5.412,24 17.69
05. EKA JAYA 19,22 1.922,05 6.28
06. ARAMABA 6,96 695,60 2.27
07. TOANG 25,02 2.502,48 8.18
08. TAMAKH 37,58 3.758,47 12.28
09. MURIABANG 40,75 4.075,21 13.32
10. BAGANG 14,97 1.496,93 4.89
PANTAR TENGAH 306,00 30.601,66 100,00
Sumber: Kantor Pertanahan Kabupaten AlorSource: Geographical Office of Alor
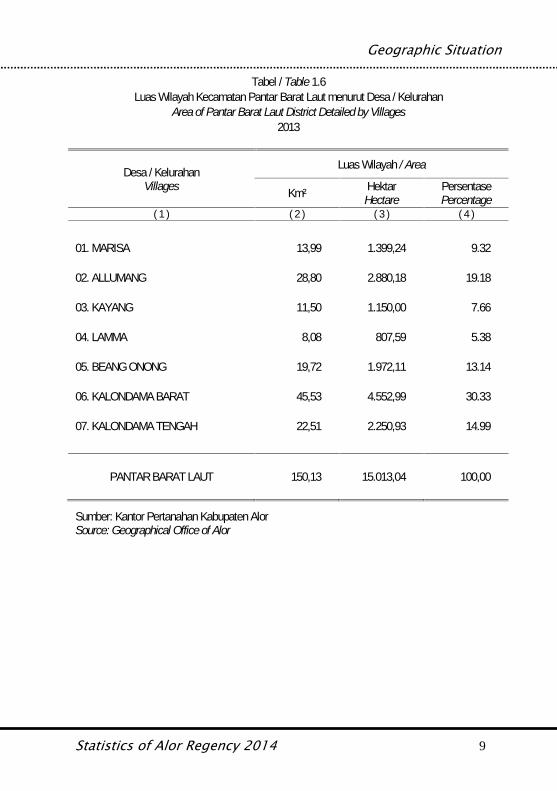
Geographic Situation
Statistics of Alor Regency 2014 9
Tabel / Table 1.6Luas Wilayah Kecamatan Pantar Barat Laut menurut Desa / Kelurahan
Area of Pantar Barat Laut District Detailed by Villages2013
Desa / KelurahanVillages
Luas Wilayah / Area
Km² HektarHectare
PersentasePercentage
( 1 ) ( 2 ) ( 3 ) ( 4 )
01. MARISA 13,99 1.399,24 9.32
02. ALLUMANG 28,80 2.880,18 19.18
03. KAYANG 11,50 1.150,00 7.66
04. LAMMA 8,08 807,59 5.38
05. BEANG ONONG 19,72 1.972,11 13.14
06. KALONDAMA BARAT 45,53 4.552,99 30.33
07. KALONDAMA TENGAH 22,51 2.250,93 14.99
PANTAR BARAT LAUT 150,13 15.013,04 100,00
Sumber: Kantor Pertanahan Kabupaten AlorSource: Geographical Office of Alor
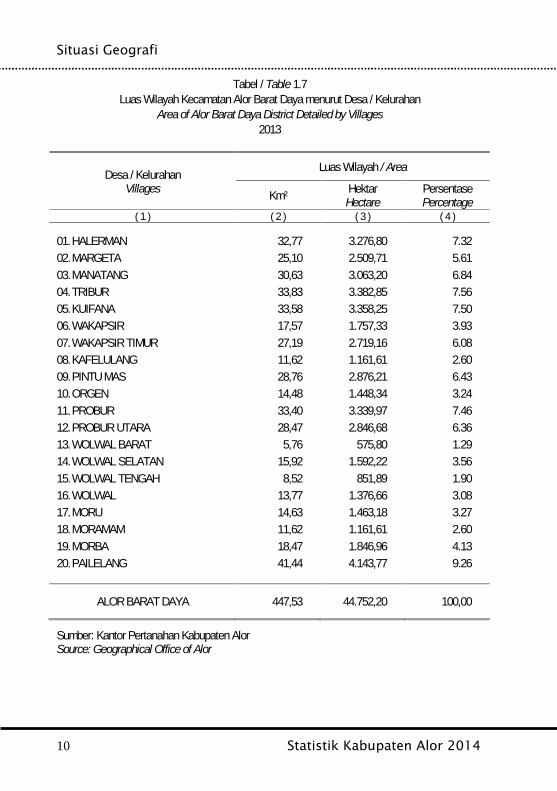
Situasi Geografi
10 Statistik Kabupaten Alor 2014
Tabel / Table 1.7Luas Wilayah Kecamatan Alor Barat Daya menurut Desa / Kelurahan
Area of Alor Barat Daya District Detailed by Villages2013
Desa / KelurahanVillages
Luas Wilayah / Area
Km² HektarHectare
PersentasePercentage
( 1 ) ( 2 ) ( 3 ) ( 4 )
01. HALERMAN 32,77 3.276,80 7.3202. MARGETA 25,10 2.509,71 5.6103. MANATANG 30,63 3.063,20 6.8404. TRIBUR 33,83 3.382,85 7.5605. KUIFANA 33,58 3.358,25 7.5006. WAKAPSIR 17,57 1.757,33 3.9307. WAKAPSIR TIMUR 27,19 2.719,16 6.0808. KAFELULANG 11,62 1.161,61 2.6009. PINTU MAS 28,76 2.876,21 6.4310. ORGEN 14,48 1.448,34 3.2411. PROBUR 33,40 3.339,97 7.4612. PROBUR UTARA 28,47 2.846,68 6.3613. WOLWAL BARAT 5,76 575,80 1.2914. WOLWAL SELATAN 15,92 1.592,22 3.5615. WOLWAL TENGAH 8,52 851,89 1.9016. WOLWAL 13,77 1.376,66 3.0817. MORU 14,63 1.463,18 3.2718. MORAMAM 11,62 1.161,61 2.6019. MORBA 18,47 1.846,96 4.1320. PAILELANG 41,44 4.143,77 9.26
ALOR BARAT DAYA 447,53 44.752,20 100,00
Sumber: Kantor Pertanahan Kabupaten AlorSource: Geographical Office of Alor
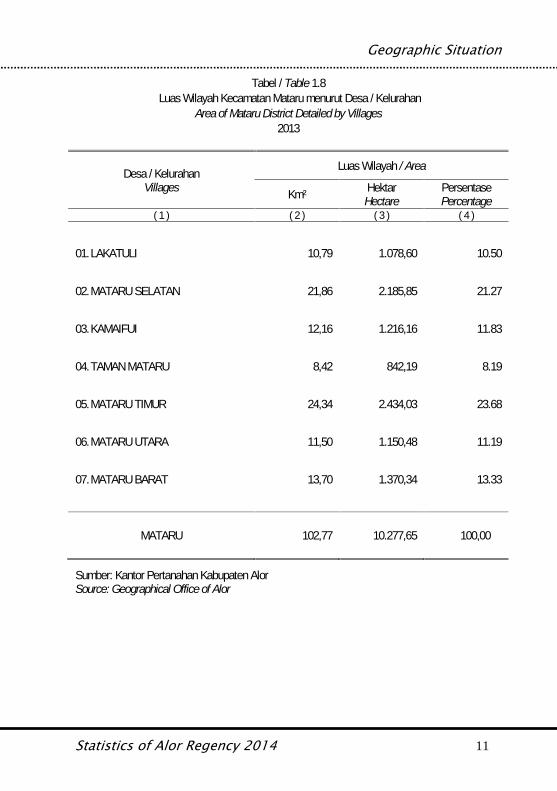
Geographic Situation
Statistics of Alor Regency 2014 11
Tabel / Table 1.8Luas Wilayah Kecamatan Mataru menurut Desa / Kelurahan
Area of Mataru District Detailed by Villages2013
Desa / KelurahanVillages
Luas Wilayah / Area
Km² HektarHectare
PersentasePercentage
( 1 ) ( 2 ) ( 3 ) ( 4 )
01. LAKATULI 10,79 1.078,60 10.50
02. MATARU SELATAN 21,86 2.185,85 21.27
03. KAMAIFUI 12,16 1.216,16 11.83
04. TAMAN MATARU 8,42 842,19 8.19
05. MATARU TIMUR 24,34 2.434,03 23.68
06. MATARU UTARA 11,50 1.150,48 11.19
07. MATARU BARAT 13,70 1.370,34 13.33
MATARU 102,77 10.277,65 100,00
Sumber: Kantor Pertanahan Kabupaten AlorSource: Geographical Office of Alor

Situasi Geografi
12 Statistik Kabupaten Alor 2014
Tabel / Table 1.9Luas Wilayah Kecamatan Alor Selatan menurut Desa / Kelurahan
Area of Alor Selatan District Detailed by Villages2013
Desa / KelurahanVillages
Luas Wilayah / Area
Km² HektarHectare
PersentasePercentage
( 1 ) ( 2 ) ( 3 ) ( 4 )
01. PADANG ALANG 16,06 1.605,67 8.32
02. MAIKANG 15,32 1.532,19 7.94
03. SIDABUI 10,89 1.089,01 5.64
04. KIRAMAN 29,52 2.952,34 15.30
05. KUNEMAN 22,77 2.276,68 11.80
06. LELLA 5,89 588,88 3.05
07. MANMAS 9,53 953,06 4.94
08. SILAIPUI 4,88 487,77 2.53
09. TAMANAPUI 10,22 1.022,35 5.30
10. KELAISI TIMUR 11,75 1.174,80 6.09
11. S U B O 5,02 501,87 2.60
12. KALAISI TENGAH 16,91 1.691,12 8.76
13. KELAISI BARAT 18,15 1.814,60 9.41
14. MALAIPEA 16,07 1.606,77 8.33
ALOR SELATAN 192,98 19.297,11 100,00
Sumber: Kantor Pertanahan Kabupaten AlorSource: Geographical Office of Alor

Geographic Situation
Statistics of Alor Regency 2014 13
Tabel / Table 1.10Luas Wilayah Kecamatan Alor Timur menurut Desa / Kelurahan
Area of Alor Timur District Detailed by Villages2013
Desa / KelurahanVillages
Luas Wilayah / Area
Km² HektarHectare
PersentasePercentage
( 1 ) ( 2 ) ( 3 ) ( 4 )
01. ELOK 33,20 3.319,89 5.90
02. MARITAING 32,16 3.215,55 5.71
03. KOLANA SELATAN 127,38 12.738,00 22.63
04. KOLANA UTARA 77,70 7.770,50 13.81
05. MAUSAMANG 90,94 9.093,53 16.16
06. TANGLAPUI TIMUR 45,48 4.548,39 8.08
07. TANGLAPUI 45,13 4.512,59 8.02
08. BELEMANA 11,32 1.132,17 2.01
09. PADANG PANJANG 59,80 5.980,44 10.63
10. MAUKURU 39,65 3,964,95 7.05
ALOR TIMUR 562,76 52.311,06 100,00
Sumber: Kantor Pertanahan Kabupaten AlorSource: Geographical Office of Alor
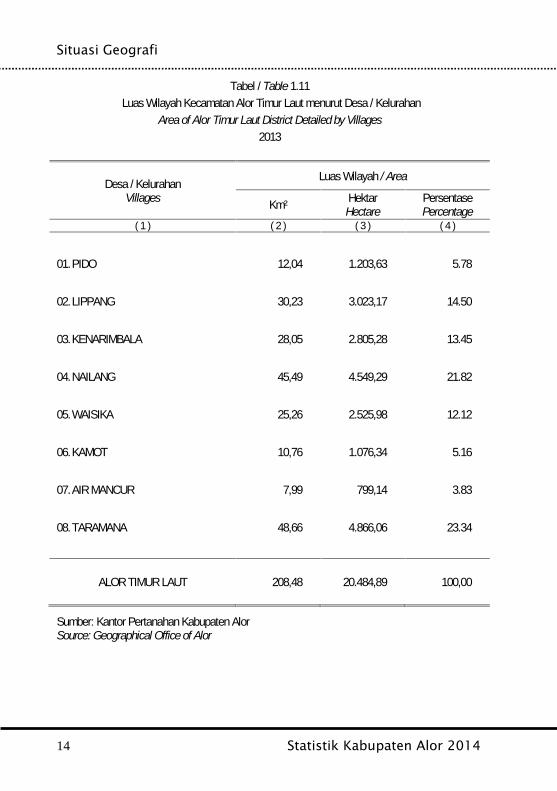
Situasi Geografi
14 Statistik Kabupaten Alor 2014
Tabel / Table 1.11Luas Wilayah Kecamatan Alor Timur Laut menurut Desa / Kelurahan
Area of Alor Timur Laut District Detailed by Villages2013
Desa / KelurahanVillages
Luas Wilayah / Area
Km² HektarHectare
PersentasePercentage
( 1 ) ( 2 ) ( 3 ) ( 4 )
01. PIDO 12,04 1.203,63 5.78
02. LIPPANG 30,23 3.023,17 14.50
03. KENARIMBALA 28,05 2.805,28 13.45
04. NAILANG 45,49 4.549,29 21.82
05. WAISIKA 25,26 2.525,98 12.12
06. KAMOT 10,76 1.076,34 5.16
07. AIR MANCUR 7,99 799,14 3.83
08. TARAMANA 48,66 4.866,06 23.34
ALOR TIMUR LAUT 208,48 20.484,89 100,00
Sumber: Kantor Pertanahan Kabupaten AlorSource: Geographical Office of Alor
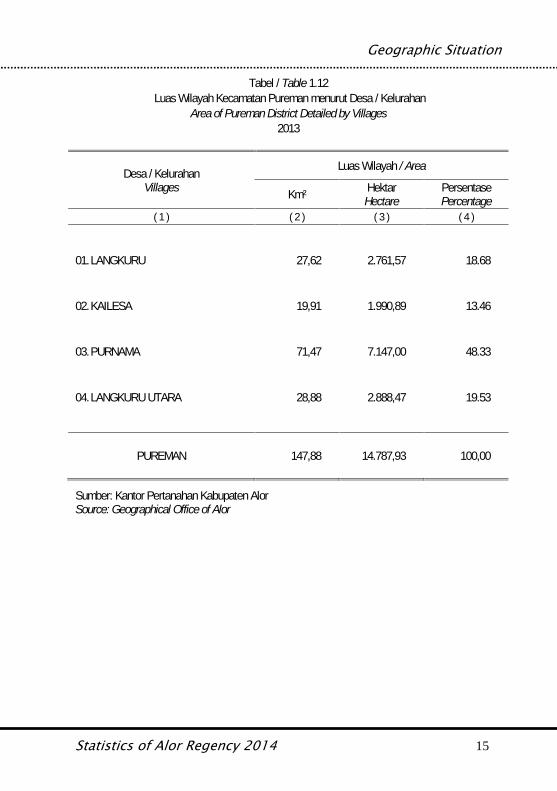
Geographic Situation
Statistics of Alor Regency 2014 15
Tabel / Table 1.12Luas Wilayah Kecamatan Pureman menurut Desa / Kelurahan
Area of Pureman District Detailed by Villages2013
Desa / KelurahanVillages
Luas Wilayah / Area
Km² HektarHectare
PersentasePercentage
( 1 ) ( 2 ) ( 3 ) ( 4 )
01. LANGKURU 27,62 2.761,57 18.68
02. KAILESA 19,91 1.990,89 13.46
03. PURNAMA 71,47 7.147,00 48.33
04. LANGKURU UTARA 28,88 2.888,47 19.53
PUREMAN 147,88 14.787,93 100,00
Sumber: Kantor Pertanahan Kabupaten AlorSource: Geographical Office of Alor
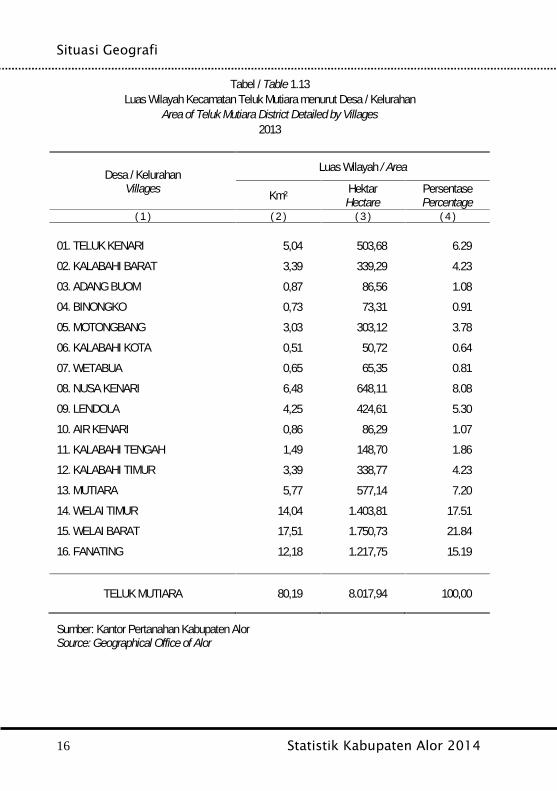
Situasi Geografi
16 Statistik Kabupaten Alor 2014
Tabel / Table 1.13Luas Wilayah Kecamatan Teluk Mutiara menurut Desa / Kelurahan
Area of Teluk Mutiara District Detailed by Villages2013
Desa / KelurahanVillages
Luas Wilayah / Area
Km² HektarHectare
PersentasePercentage
( 1 ) ( 2 ) ( 3 ) ( 4 )
01. TELUK KENARI 5,04 503,68 6.2902. KALABAHI BARAT 3,39 339,29 4.2303. ADANG BUOM 0,87 86,56 1.0804. BINONGKO 0,73 73,31 0.9105. MOTONGBANG 3,03 303,12 3.7806. KALABAHI KOTA 0,51 50,72 0.6407. WETABUA 0,65 65,35 0.8108. NUSA KENARI 6,48 648,11 8.0809. LENDOLA 4,25 424,61 5.3010. AIR KENARI 0,86 86,29 1.0711. KALABAHI TENGAH 1,49 148,70 1.8612. KALABAHI TIMUR 3,39 338,77 4.2313. MUTIARA 5,77 577,14 7.2014. WELAI TIMUR 14,04 1.403,81 17.5115. WELAI BARAT 17,51 1.750,73 21.8416. FANATING 12,18 1.217,75 15.19
TELUK MUTIARA 80,19 8.017,94 100,00
Sumber: Kantor Pertanahan Kabupaten AlorSource: Geographical Office of Alor
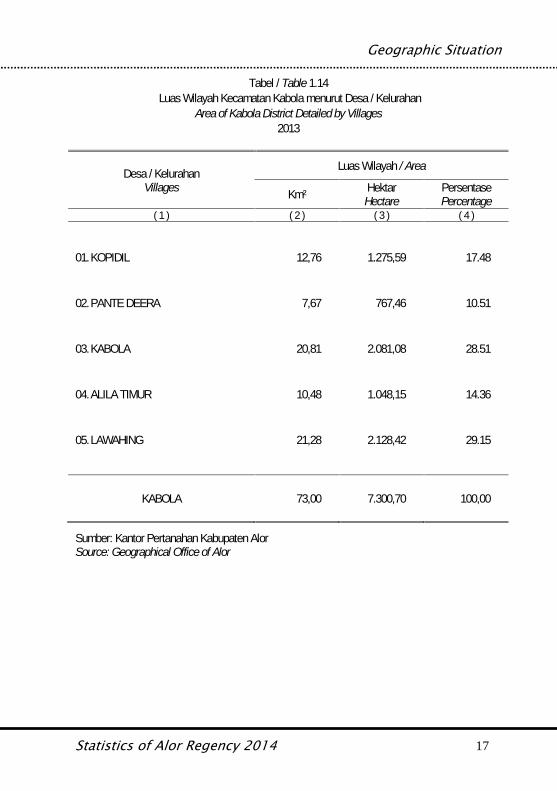
Geographic Situation
Statistics of Alor Regency 2014 17
Tabel / Table 1.14Luas Wilayah Kecamatan Kabola menurut Desa / Kelurahan
Area of Kabola District Detailed by Villages2013
Desa / KelurahanVillages
Luas Wilayah / Area
Km² HektarHectare
PersentasePercentage
( 1 ) ( 2 ) ( 3 ) ( 4 )
01. KOPIDIL 12,76 1.275,59 17.48
02. PANTE DEERA 7,67 767,46 10.51
03. KABOLA 20,81 2.081,08 28.51
04. ALILA TIMUR 10,48 1.048,15 14.36
05. LAWAHING 21,28 2.128,42 29.15
KABOLA 73,00 7.300,70 100,00
Sumber: Kantor Pertanahan Kabupaten AlorSource: Geographical Office of Alor
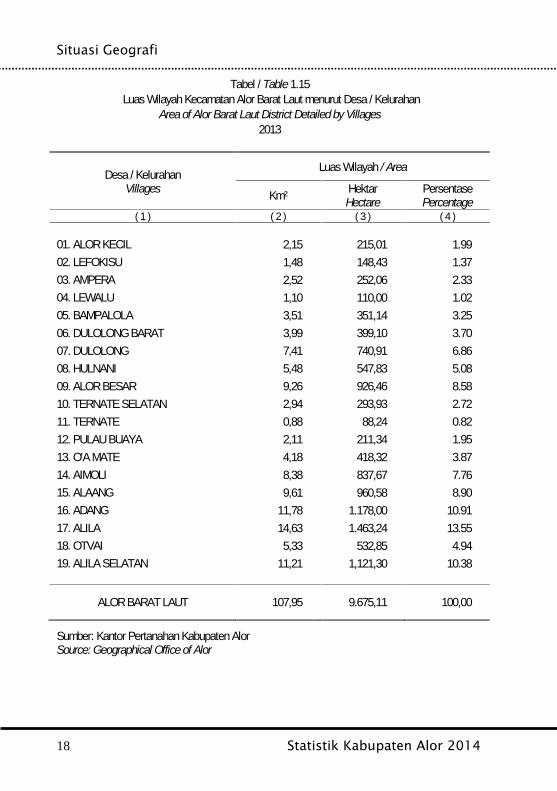
Situasi Geografi
18 Statistik Kabupaten Alor 2014
Tabel / Table 1.15Luas Wilayah Kecamatan Alor Barat Laut menurut Desa / Kelurahan
Area of Alor Barat Laut District Detailed by Villages2013
Desa / KelurahanVillages
Luas Wilayah / Area
Km² HektarHectare
PersentasePercentage
( 1 ) ( 2 ) ( 3 ) ( 4 )
01. ALOR KECIL 2,15 215,01 1.9902. LEFOKISU 1,48 148,43 1.3703. AMPERA 2,52 252,06 2.3304. LEWALU 1,10 110,00 1.0205. BAMPALOLA 3,51 351,14 3.2506. DULOLONG BARAT 3,99 399,10 3.7007. DULOLONG 7,41 740,91 6.8608. HULNANI 5,48 547,83 5.0809. ALOR BESAR 9,26 926,46 8.5810. TERNATE SELATAN 2,94 293,93 2.7211. TERNATE 0,88 88,24 0.8212. PULAU BUAYA 2,11 211,34 1.9513. O'A MATE 4,18 418,32 3.8714. AIMOLI 8,38 837,67 7.7615. ALAANG 9,61 960,58 8.9016. ADANG 11,78 1.178,00 10.9117. ALILA 14,63 1.463,24 13.5518. OTVAI 5,33 532,85 4.9419. ALILA SELATAN 11,21 1,121,30 10.38
ALOR BARAT LAUT 107,95 9.675,11 100,00
Sumber: Kantor Pertanahan Kabupaten AlorSource: Geographical Office of Alor
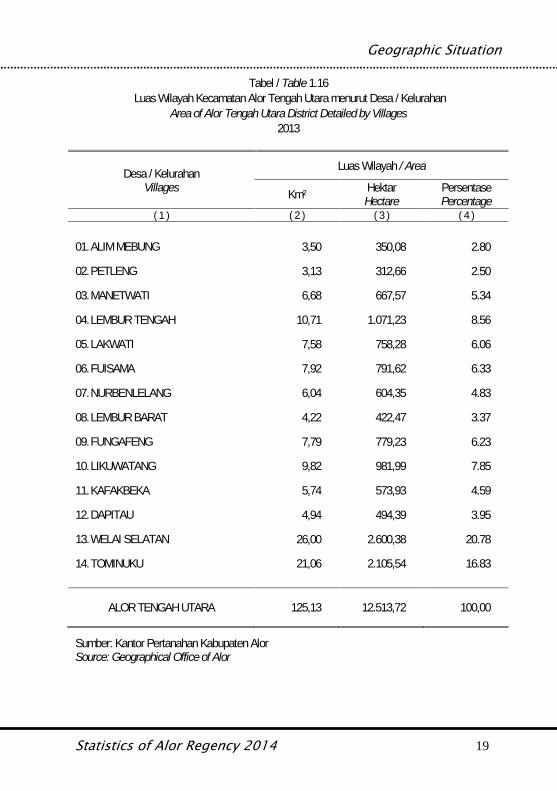
Geographic Situation
Statistics of Alor Regency 2014 19
Tabel / Table 1.16Luas Wilayah Kecamatan Alor Tengah Utara menurut Desa / Kelurahan
Area of Alor Tengah Utara District Detailed by Villages2013
Desa / KelurahanVillages
Luas Wilayah / Area
Km² HektarHectare
PersentasePercentage
( 1 ) ( 2 ) ( 3 ) ( 4 )
01. ALIM MEBUNG 3,50 350,08 2.80
02. PETLENG 3,13 312,66 2.50
03. MANETWATI 6,68 667,57 5.34
04. LEMBUR TENGAH 10,71 1.071,23 8.56
05. LAKWATI 7,58 758,28 6.06
06. FUISAMA 7,92 791,62 6.33
07. NURBENLELANG 6,04 604,35 4.83
08. LEMBUR BARAT 4,22 422,47 3.37
09. FUNGAFENG 7,79 779,23 6.23
10. LIKUWATANG 9,82 981,99 7.85
11. KAFAKBEKA 5,74 573,93 4.59
12. DAPITAU 4,94 494,39 3.95
13. WELAI SELATAN 26,00 2.600,38 20.78
14. TOMINUKU 21,06 2.105,54 16.83
ALOR TENGAH UTARA 125,13 12.513,72 100,00
Sumber: Kantor Pertanahan Kabupaten AlorSource: Geographical Office of Alor
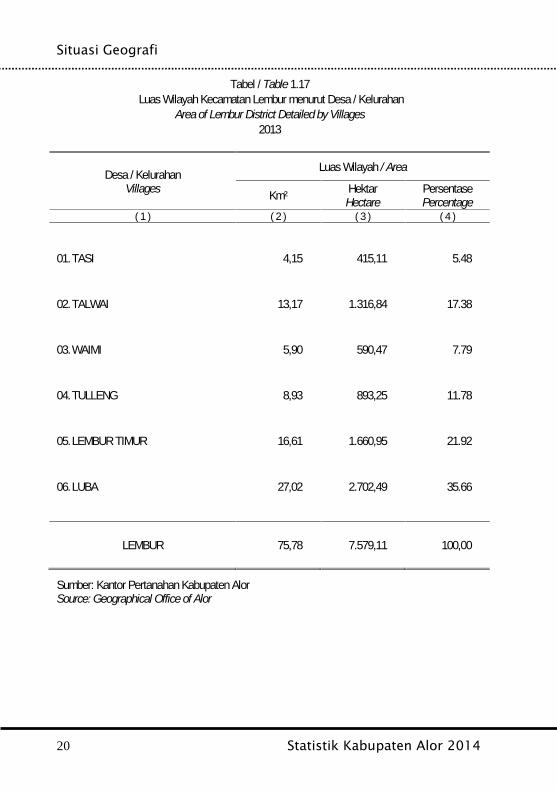
Situasi Geografi
20 Statistik Kabupaten Alor 2014
Tabel / Table 1.17Luas Wilayah Kecamatan Lembur menurut Desa / Kelurahan
Area of Lembur District Detailed by Villages2013
Desa / KelurahanVillages
Luas Wilayah / Area
Km² HektarHectare
PersentasePercentage
( 1 ) ( 2 ) ( 3 ) ( 4 )
01. TASI 4,15 415,11 5.48
02. TALWAI 13,17 1.316,84 17.38
03. WAIMI 5,90 590,47 7.79
04. TULLENG 8,93 893,25 11.78
05. LEMBUR TIMUR 16,61 1.660,95 21.92
06. LUBA 27,02 2.702,49 35.66
LEMBUR 75,78 7.579,11 100,00
Sumber: Kantor Pertanahan Kabupaten AlorSource: Geographical Office of Alor
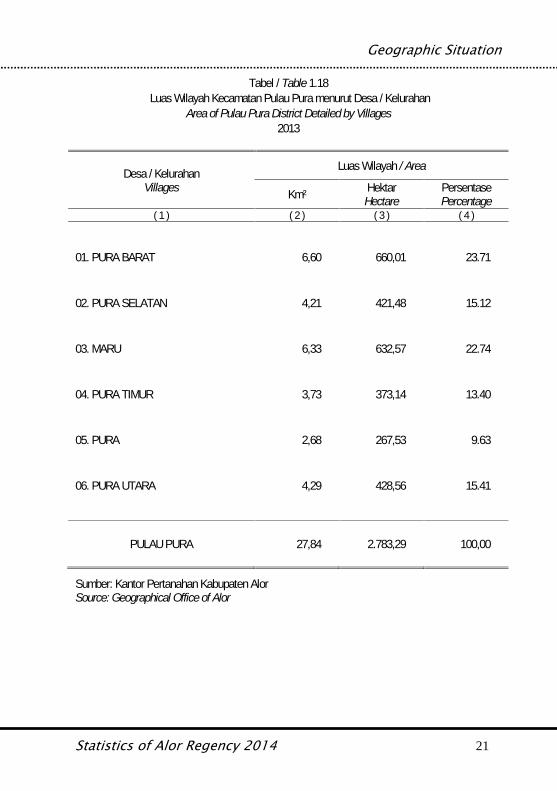
Geographic Situation
Statistics of Alor Regency 2014 21
Tabel / Table 1.18Luas Wilayah Kecamatan Pulau Pura menurut Desa / Kelurahan
Area of Pulau Pura District Detailed by Villages2013
Desa / KelurahanVillages
Luas Wilayah / Area
Km² HektarHectare
PersentasePercentage
( 1 ) ( 2 ) ( 3 ) ( 4 )
01. PURA BARAT 6,60 660,01 23.71
02. PURA SELATAN 4,21 421,48 15.12
03. MARU 6,33 632,57 22.74
04. PURA TIMUR 3,73 373,14 13.40
05. PURA 2,68 267,53 9.63
06. PURA UTARA 4,29 428,56 15.41
PULAU PURA 27,84 2.783,29 100,00
Sumber: Kantor Pertanahan Kabupaten AlorSource: Geographical Office of Alor
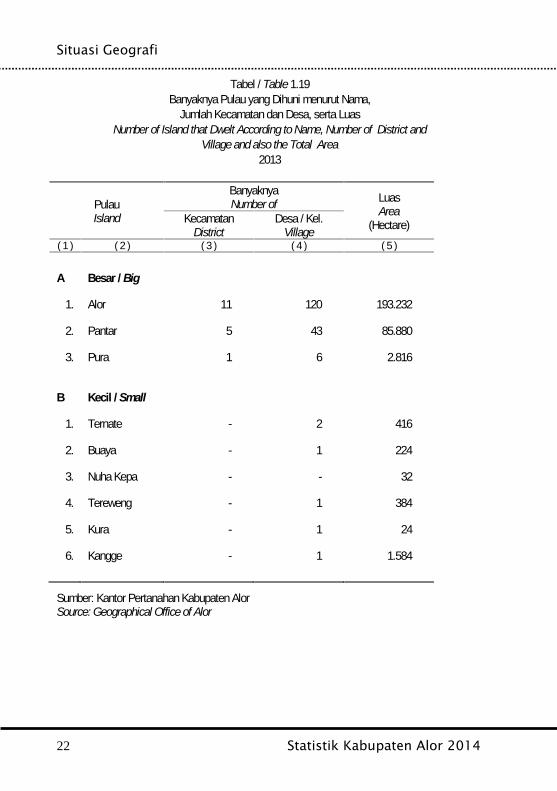
Situasi Geografi
22 Statistik Kabupaten Alor 2014
Tabel / Table 1.19Banyaknya Pulau yang Dihuni menurut Nama,
Jumlah Kecamatan dan Desa, serta LuasNumber of Island that Dwelt According to Name, Number of District and
Village and also the Total Area2013
PulauIsland
BanyaknyaNumber of Luas
Area(Hectare)Kecamatan
DistrictDesa / Kel.
Village( 1 ) ( 2 ) ( 3 ) ( 4 ) ( 5 )
A Besar / Big
1. Alor 11 120 193.232
2. Pantar 5 43 85.880
3. Pura 1 6 2.816
B Kecil / Small
1. Ternate - 2 416
2. Buaya - 1 224
3. Nuha Kepa - - 32
4. Tereweng - 1 384
5. Kura - 1 24
6. Kangge - 1 1.584
Sumber: Kantor Pertanahan Kabupaten AlorSource: Geographical Office of Alor
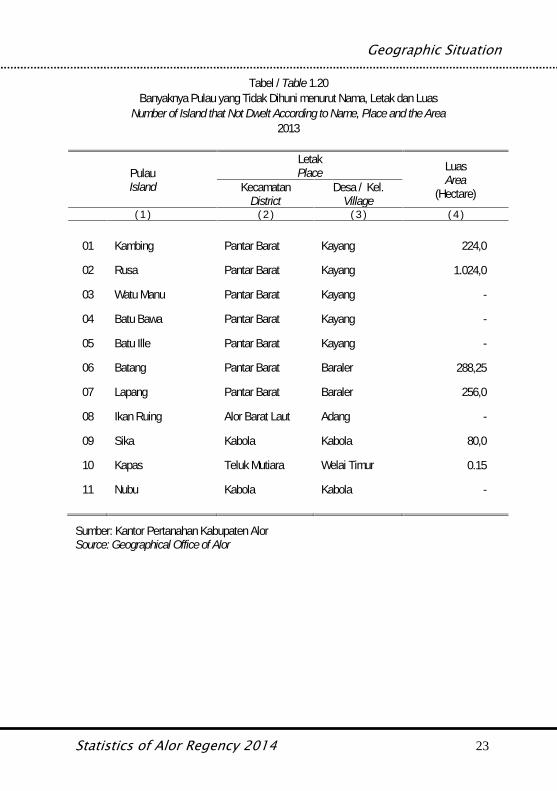
Geographic Situation
Statistics of Alor Regency 2014 23
Tabel / Table 1.20Banyaknya Pulau yang Tidak Dihuni menurut Nama, Letak dan Luas
Number of Island that Not Dwelt According to Name, Place and the Area2013
PulauIsland
LetakPlace Luas
Area(Hectare)Kecamatan
DistrictDesa / Kel.
Village( 1 ) ( 2 ) ( 3 ) ( 4 )
01 Kambing Pantar Barat Kayang 224,0
02 Rusa Pantar Barat Kayang 1.024,0
03 Watu Manu Pantar Barat Kayang -
04 Batu Bawa Pantar Barat Kayang -
05 Batu Ille Pantar Barat Kayang -
06 Batang Pantar Barat Baraler 288,25
07 Lapang Pantar Barat Baraler 256,0
08 Ikan Ruing Alor Barat Laut Adang -
09 Sika Kabola Kabola 80,0
10 Kapas Teluk Mutiara Welai Timur 0.15
11 Nubu Kabola Kabola -
Sumber: Kantor Pertanahan Kabupaten AlorSource: Geographical Office of Alor
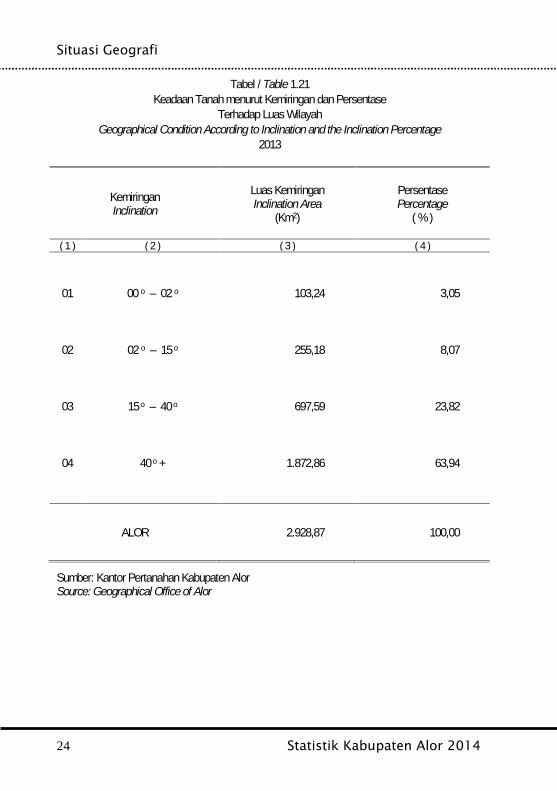
Situasi Geografi
24 Statistik Kabupaten Alor 2014
Tabel / Table 1.21Keadaan Tanah menurut Kemiringan dan Persentase
Terhadap Luas WilayahGeographical Condition According to Inclination and the Inclination Percentage
2013
KemiringanInclination
Luas KemiringanInclination Area
(Km2)
PersentasePercentage
( % )
( 1 ) ( 2 ) ( 3 ) ( 4 )
01 00 o – 02 o 103,24 3,05
02 02 o – 15 o 255,18 8,07
03 15 o – 40 o 697,59 23,82
04 40 o + 1.872,86 63,94
ALOR 2.928,87 100,00
Sumber: Kantor Pertanahan Kabupaten AlorSource: Geographical Office of Alor
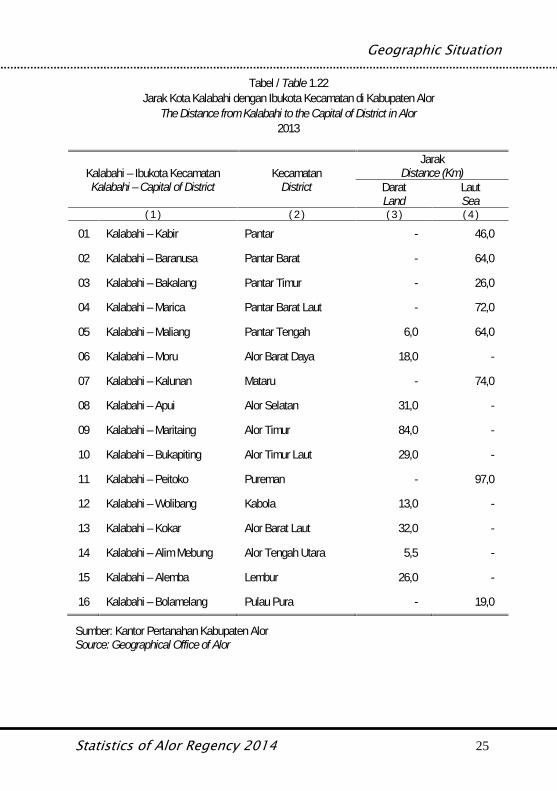
Geographic Situation
Statistics of Alor Regency 2014 25
Tabel / Table 1.22Jarak Kota Kalabahi dengan Ibukota Kecamatan di Kabupaten Alor
The Distance from Kalabahi to the Capital of District in Alor2013
Kalabahi – Ibukota KecamatanKalabahi – Capital of District
KecamatanDistrict
JarakDistance (Km)
DaratLand
LautSea
( 1 ) ( 2 ) ( 3 ) ( 4 )
01 Kalabahi – Kabir Pantar - 46,0
02 Kalabahi – Baranusa Pantar Barat - 64,0
03 Kalabahi – Bakalang Pantar Timur - 26,0
04 Kalabahi – Marica Pantar Barat Laut - 72,0
05 Kalabahi – Maliang Pantar Tengah 6,0 64,0
06 Kalabahi – Moru Alor Barat Daya 18,0 -
07 Kalabahi – Kalunan Mataru - 74,0
08 Kalabahi – Apui Alor Selatan 31,0 -
09 Kalabahi – Maritaing Alor Timur 84,0 -
10 Kalabahi – Bukapiting Alor Timur Laut 29,0 -
11 Kalabahi – Peitoko Pureman - 97,0
12 Kalabahi – Wolibang Kabola 13,0 -
13 Kalabahi – Kokar Alor Barat Laut 32,0 -
14 Kalabahi – Alim Mebung Alor Tengah Utara 5,5 -
15 Kalabahi – Alemba Lembur 26,0 -
16 Kalabahi – Bolamelang Pulau Pura - 19,0
Sumber: Kantor Pertanahan Kabupaten AlorSource: Geographical Office of Alor
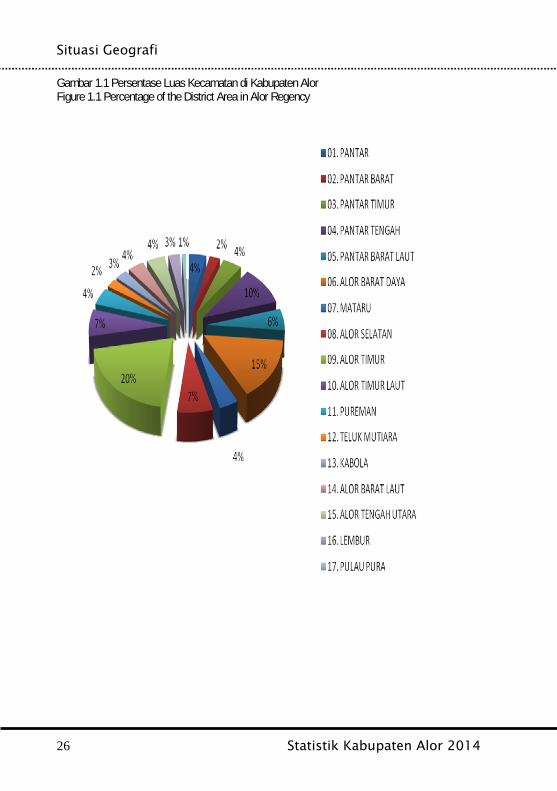
Situasi Geografi
26 Statistik Kabupaten Alor 2014
Gambar 1.1 Persentase Luas Kecamatan di Kabupaten AlorFigure 1.1 Percentage of the District Area in Alor Regency
Geographic Situation
Statistics of Alor Regency 2014 27

Situasi Geografi
28 Statistik Kabupaten Alor 2014
Climate Situation
Statistics of Alor Regency 2014 29
BAB IISITUASI IKLIMClimate Situation

Situasi Iklim
30 Statistik Kabupaten Alor 2014
Climate Situation
Statistics of Alor Regency 2014 31
Penjelasan Tekniks Technical Notes
1. Iklim yang tidak menentu di KabupatenAlor merupakan masalah yang cukupklasik. Dalam setahun musim penghujanrelatif lebih pendek dari pada musimkemarau.
2. Pada tahun 2013 temperatur udaraterendah adalah 19,20 º C yang terjadipada bulan Agustus sedangkantemperatur tertinggi adalah 33,20 º C padabulan September. Curah hujan tertinggiadalah 371,10 mm pada bulan Januari,lebih tinggi dari tahun sebelumnya. Semuaukuran adalah untuk kota Kalabahi,ibukota Kabupaten Alor, yang dapatdijadikan gambaran umum untukKabupaten Alor.
1. Uncertain climate in Alor is a classicproblem. The rain season relativelyshorten than the dry season in one year.
2. In 2013 the lowest temperature is 19,20ºCwhich is happen in August and the highestis 33,20º C in September. The highestrainfall rate is 371,10 mm in January,higher than last year. All measurement isfor Kalabahi, the capital of Alor, which canrepresent the general condition of Alor.
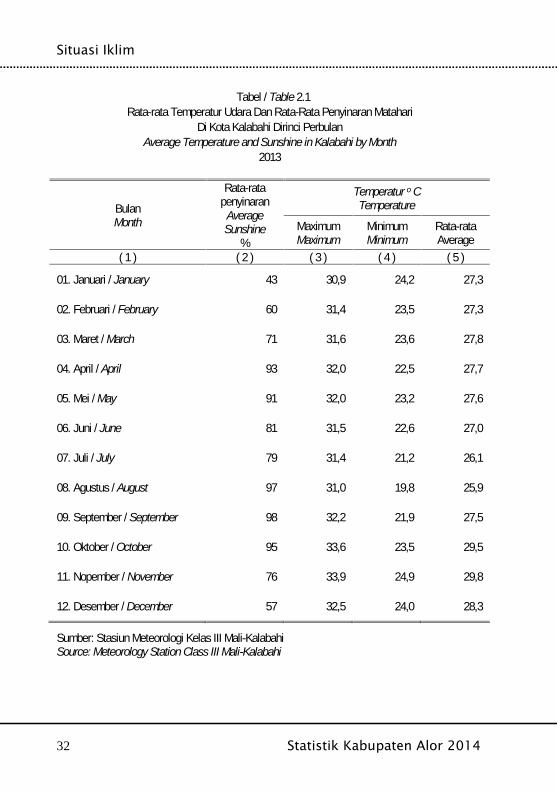
Situasi Iklim
32 Statistik Kabupaten Alor 2014
Tabel / Table 2.1Rata-rata Temperatur Udara Dan Rata-Rata Penyinaran Matahari
Di Kota Kalabahi Dirinci PerbulanAverage Temperature and Sunshine in Kalabahi by Month
2013
BulanMonth
Rata-ratapenyinaran
AverageSunshine
%
Temperatur o CTemperature
MaximumMaximum
MinimumMinimum
Rata-rataAverage
( 1 ) ( 2 ) ( 3 ) ( 4 ) ( 5 )
01. Januari / January 43 30,9 24,2 27,3
02. Februari / February 60 31,4 23,5 27,3
03. Maret / March 71 31,6 23,6 27,8
04. April / April 93 32,0 22,5 27,7
05. Mei / May 91 32,0 23,2 27,6
06. Juni / June 81 31,5 22,6 27,0
07. Juli / July 79 31,4 21,2 26,1
08. Agustus / August 97 31,0 19,8 25,9
09. September / September 98 32,2 21,9 27,5
10. Oktober / October 95 33,6 23,5 29,5
11. Nopember / November 76 33,9 24,9 29,8
12. Desember / December 57 32,5 24,0 28,3
Sumber: Stasiun Meteorologi Kelas III Mali-KalabahiSource: Meteorology Station Class III Mali-Kalabahi
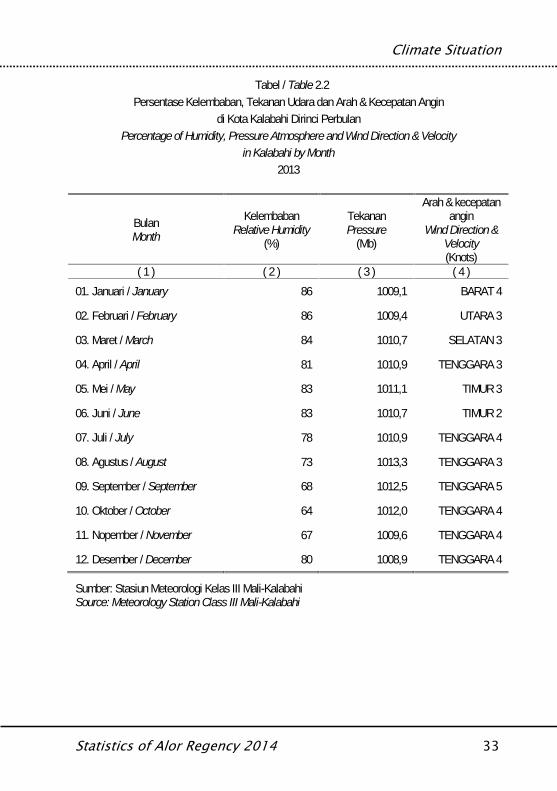
Climate Situation
Statistics of Alor Regency 2014 33
Tabel / Table 2.2Persentase Kelembaban, Tekanan Udara dan Arah & Kecepatan Angin
di Kota Kalabahi Dirinci PerbulanPercentage of Humidity, Pressure Atmosphere and Wind Direction & Velocity
in Kalabahi by Month2013
BulanMonth
KelembabanRelative Humidity
(%)
TekananPressure
(Mb)
Arah & kecepatanangin
Wind Direction &Velocity(Knots)
( 1 ) ( 2 ) ( 3 ) ( 4 )01. Januari / January 86 1009,1 BARAT 4
02. Februari / February 86 1009,4 UTARA 3
03. Maret / March 84 1010,7 SELATAN 3
04. April / April 81 1010,9 TENGGARA 3
05. Mei / May 83 1011,1 TIMUR 3
06. Juni / June 83 1010,7 TIMUR 2
07. Juli / July 78 1010,9 TENGGARA 4
08. Agustus / August 73 1013,3 TENGGARA 3
09. September / September 68 1012,5 TENGGARA 5
10. Oktober / October 64 1012,0 TENGGARA 4
11. Nopember / November 67 1009,6 TENGGARA 4
12. Desember / December 80 1008,9 TENGGARA 4
Sumber: Stasiun Meteorologi Kelas III Mali-KalabahiSource: Meteorology Station Class III Mali-Kalabahi
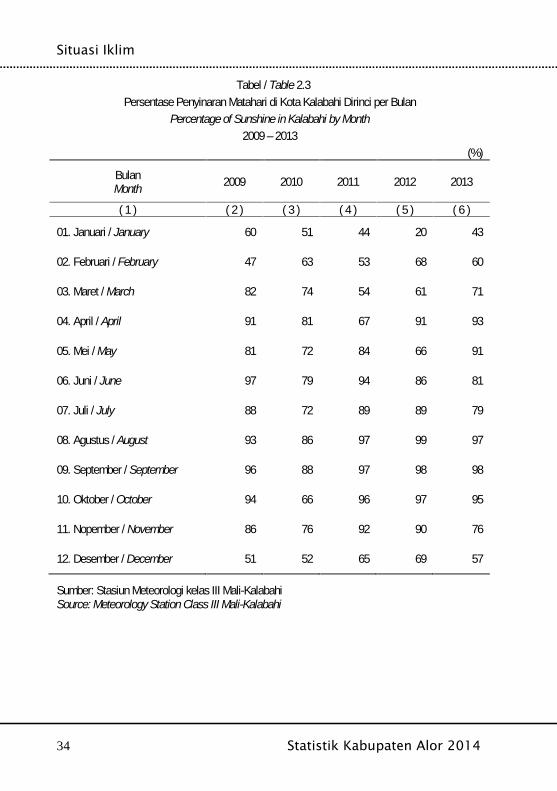
Situasi Iklim
34 Statistik Kabupaten Alor 2014
Tabel / Table 2.3Persentase Penyinaran Matahari di Kota Kalabahi Dirinci per Bulan
Percentage of Sunshine in Kalabahi by Month2009 – 2013
(%)
BulanMonth 2009 2010 2011 2012 2013
( 1 ) ( 2 ) ( 3 ) ( 4 ) ( 5 ) ( 6 )
01. Januari / January 60 51 44 20 43
02. Februari / February 47 63 53 68 60
03. Maret / March 82 74 54 61 71
04. April / April 91 81 67 91 93
05. Mei / May 81 72 84 66 91
06. Juni / June 97 79 94 86 81
07. Juli / July 88 72 89 89 79
08. Agustus / August 93 86 97 99 97
09. September / September 96 88 97 98 98
10. Oktober / October 94 66 96 97 95
11. Nopember / November 86 76 92 90 76
12. Desember / December 51 52 65 69 57
Sumber: Stasiun Meteorologi kelas III Mali-KalabahiSource: Meteorology Station Class III Mali-Kalabahi
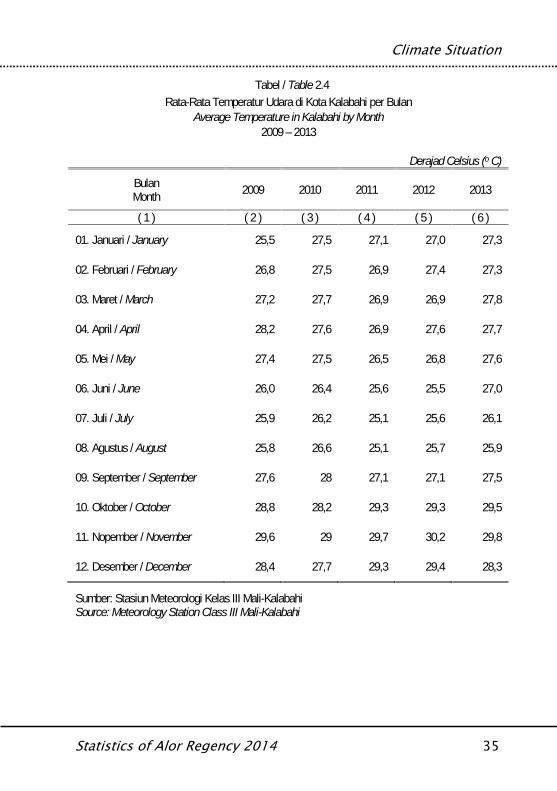
Climate Situation
Statistics of Alor Regency 2014 35
Tabel / Table 2.4Rata-Rata Temperatur Udara di Kota Kalabahi per Bulan
Average Temperature in Kalabahi by Month2009 – 2013
Derajad Celsius (o C)
BulanMonth 2009 2010 2011 2012 2013
( 1 ) ( 2 ) ( 3 ) ( 4 ) ( 5 ) ( 6 )
01. Januari / January 25,5 27,5 27,1 27,0 27,3
02. Februari / February 26,8 27,5 26,9 27,4 27,3
03. Maret / March 27,2 27,7 26,9 26,9 27,8
04. April / April 28,2 27,6 26,9 27,6 27,7
05. Mei / May 27,4 27,5 26,5 26,8 27,6
06. Juni / June 26,0 26,4 25,6 25,5 27,0
07. Juli / July 25,9 26,2 25,1 25,6 26,1
08. Agustus / August 25,8 26,6 25,1 25,7 25,9
09. September / September 27,6 28 27,1 27,1 27,5
10. Oktober / October 28,8 28,2 29,3 29,3 29,5
11. Nopember / November 29,6 29 29,7 30,2 29,8
12. Desember / December 28,4 27,7 29,3 29,4 28,3
Sumber: Stasiun Meteorologi Kelas III Mali-KalabahiSource: Meteorology Station Class III Mali-Kalabahi
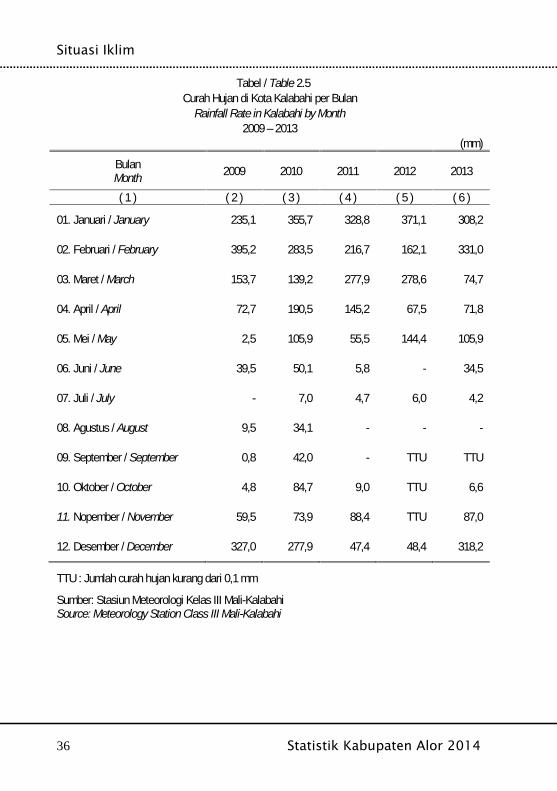
Situasi Iklim
36 Statistik Kabupaten Alor 2014
Tabel / Table 2.5Curah Hujan di Kota Kalabahi per Bulan
Rainfall Rate in Kalabahi by Month2009 – 2013
(mm)
BulanMonth 2009 2010 2011 2012 2013
( 1 ) ( 2 ) ( 3 ) ( 4 ) ( 5 ) ( 6 )
01. Januari / January 235,1 355,7 328,8 371,1 308,2
02. Februari / February 395,2 283,5 216,7 162,1 331,0
03. Maret / March 153,7 139,2 277,9 278,6 74,7
04. April / April 72,7 190,5 145,2 67,5 71,8
05. Mei / May 2,5 105,9 55,5 144,4 105,9
06. Juni / June 39,5 50,1 5,8 - 34,5
07. Juli / July - 7,0 4,7 6,0 4,2
08. Agustus / August 9,5 34,1 - - -
09. September / September 0,8 42,0 - TTU TTU
10. Oktober / October 4,8 84,7 9,0 TTU 6,6
11. Nopember / November 59,5 73,9 88,4 TTU 87,0
12. Desember / December 327,0 277,9 47,4 48,4 318,2
TTU : Jumlah curah hujan kurang dari 0,1 mm
Sumber: Stasiun Meteorologi Kelas III Mali-KalabahiSource: Meteorology Station Class III Mali-Kalabahi
Climate Situation
Statistics of Alor Regency 2014 37
Situasi Iklim
38 Statistik Kabupaten Alor 2014
Governance
Statistics of Alor Regency 2014 39
BAB IIIPEMERINTAHAN
Governance

Pemerintahan
40 Statistik Kabupaten Alor 2014
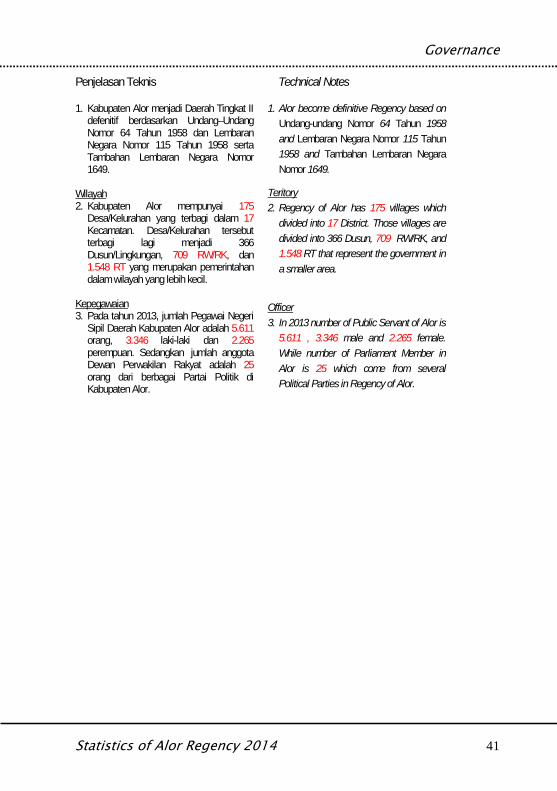
Governance
Statistics of Alor Regency 2014 41
Penjelasan Teknis Technical Notes
1. Kabupaten Alor menjadi Daerah Tingkat IIdefenitif berdasarkan Undang–UndangNomor 64 Tahun 1958 dan LembaranNegara Nomor 115 Tahun 1958 sertaTambahan Lembaran Negara Nomor1649.
Wilayah2. Kabupaten Alor mempunyai 175
Desa/Kelurahan yang terbagi dalam 17Kecamatan. Desa/Kelurahan tersebutterbagi lagi menjadi 366Dusun/Lingkungan, 709 RW/RK, dan1.548 RT yang merupakan pemerintahandalam wilayah yang lebih kecil.
Kepegawaian3. Pada tahun 2013, jumlah Pegawai Negeri
Sipil Daerah Kabupaten Alor adalah 5.611orang, 3.346 laki-laki dan 2.265perempuan. Sedangkan jumlah anggotaDewan Perwakilan Rakyat adalah 25orang dari berbagai Partai Politik diKabupaten Alor.
1. Alor become definitive Regency based onUndang-undang Nomor 64 Tahun 1958and Lembaran Negara Nomor 115 Tahun1958 and Tambahan Lembaran NegaraNomor 1649.
Teritory2. Regency of Alor has 175 villages which
divided into 17 District. Those villages aredivided into 366 Dusun, 709 RW/RK, and1.548 RT that represent the government ina smaller area.
Officer3. In 2013 number of Public Servant of Alor is
5.611 , 3.346 male and 2.265 female.While number of Parliament Member inAlor is 25 which come from severalPolitical Parties in Regency of Alor.
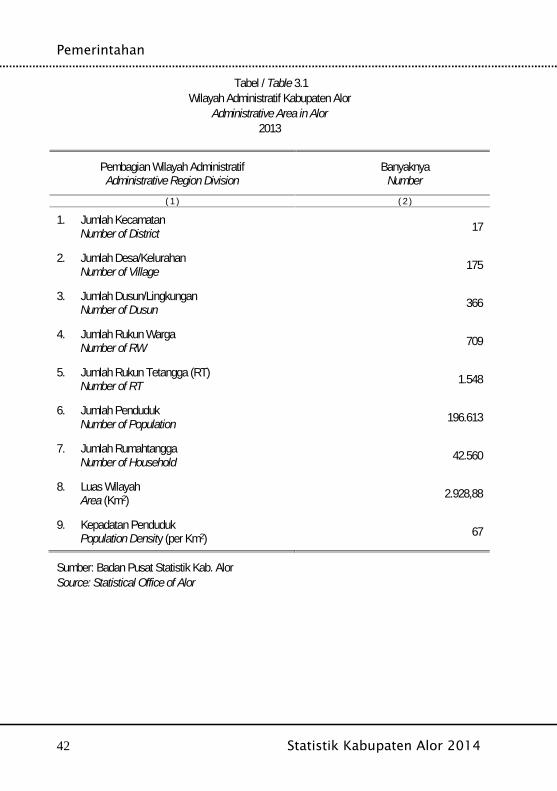
Pemerintahan
42 Statistik Kabupaten Alor 2014
Tabel / Table 3.1Wilayah Administratif Kabupaten Alor
Administrative Area in Alor2013
Pembagian Wilayah AdministratifAdministrative Region Division
BanyaknyaNumber
( 1 ) ( 2 )
1. Jumlah KecamatanNumber of District 17
2. Jumlah Desa/KelurahanNumber of Village 175
3. Jumlah Dusun/LingkunganNumber of Dusun 366
4. Jumlah Rukun WargaNumber of RW 709
5. Jumlah Rukun Tetangga (RT)Number of RT 1.548
6. Jumlah PendudukNumber of Population 196.613
7. Jumlah RumahtanggaNumber of Household 42.560
8. Luas WilayahArea (Km2) 2.928,88
9. Kepadatan PendudukPopulation Density (per Km2) 67
Sumber: Badan Pusat Statistik Kab. AlorSource: Statistical Office of Alor
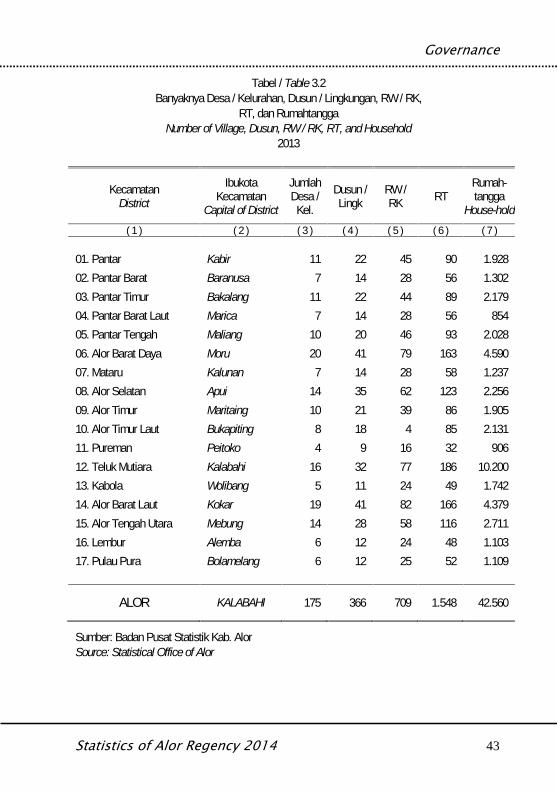
Governance
Statistics of Alor Regency 2014 43
Tabel / Table 3.2Banyaknya Desa / Kelurahan, Dusun / Lingkungan, RW / RK,
RT, dan RumahtanggaNumber of Village, Dusun, RW / RK, RT, and Household
2013
KecamatanDistrict
IbukotaKecamatan
Capital of District
JumlahDesa /
Kel.Dusun /Lingk
RW /RK RT
Rumah-tangga
House-hold( 1 ) ( 2 ) ( 3 ) ( 4 ) ( 5 ) ( 6 ) ( 7 )
01. Pantar Kabir 11 22 45 90 1.92802. Pantar Barat Baranusa 7 14 28 56 1.30203. Pantar Timur Bakalang 11 22 44 89 2.17904. Pantar Barat Laut Marica 7 14 28 56 85405. Pantar Tengah Maliang 10 20 46 93 2.02806. Alor Barat Daya Moru 20 41 79 163 4.59007. Mataru Kalunan 7 14 28 58 1.23708. Alor Selatan Apui 14 35 62 123 2.25609. Alor Timur Maritaing 10 21 39 86 1.90510. Alor Timur Laut Bukapiting 8 18 4 85 2.13111. Pureman Peitoko 4 9 16 32 90612. Teluk Mutiara Kalabahi 16 32 77 186 10.20013. Kabola Wolibang 5 11 24 49 1.74214. Alor Barat Laut Kokar 19 41 82 166 4.37915. Alor Tengah Utara Mebung 14 28 58 116 2.71116. Lembur Alemba 6 12 24 48 1.10317. Pulau Pura Bolamelang 6 12 25 52 1.109
ALOR KALABAHI 175 366 709 1.548 42.560
Sumber: Badan Pusat Statistik Kab. AlorSource: Statistical Office of Alor
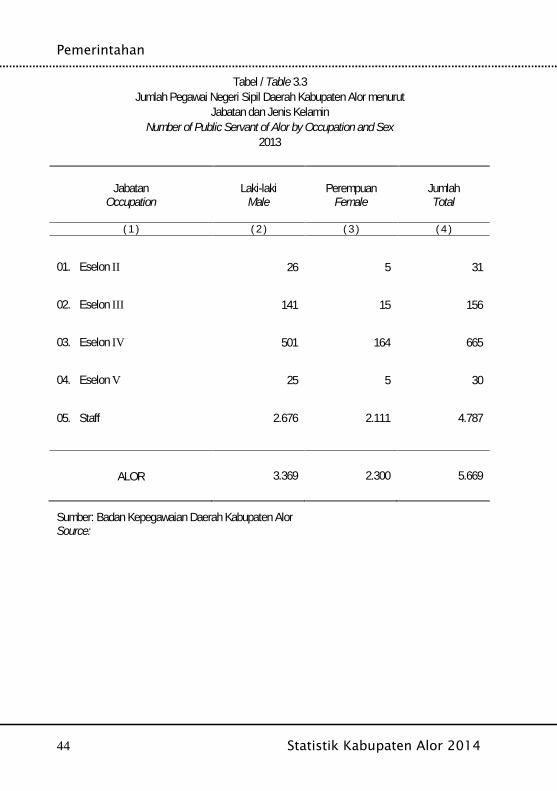
Pemerintahan
44 Statistik Kabupaten Alor 2014
Tabel / Table 3.3Jumlah Pegawai Negeri Sipil Daerah Kabupaten Alor menurut
Jabatan dan Jenis KelaminNumber of Public Servant of Alor by Occupation and Sex
2013
JabatanOccupation
Laki-lakiMale
PerempuanFemale
JumlahTotal
( 1 ) ( 2 ) ( 3 ) ( 4 )
01. Eselon II 26 5 31
02. Eselon III 141 15 156
03. Eselon IV 501 164 665
04. Eselon V 25 5 30
05. Staff 2.676 2.111 4.787
ALOR 3.369 2.300 5.669
Sumber: Badan Kepegawaian Daerah Kabupaten AlorSource:
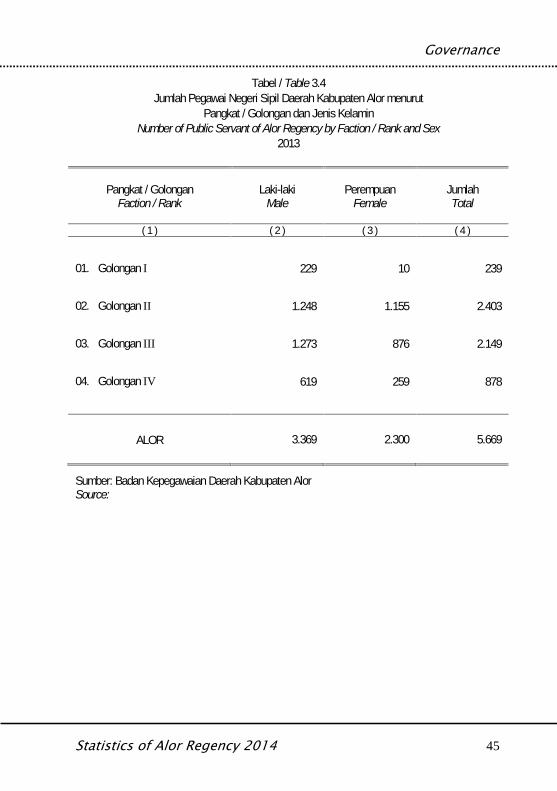
Governance
Statistics of Alor Regency 2014 45
Tabel / Table 3.4Jumlah Pegawai Negeri Sipil Daerah Kabupaten Alor menurut
Pangkat / Golongan dan Jenis KelaminNumber of Public Servant of Alor Regency by Faction / Rank and Sex
2013
Pangkat / GolonganFaction / Rank
Laki-lakiMale
PerempuanFemale
JumlahTotal
( 1 ) ( 2 ) ( 3 ) ( 4 )
01. Golongan I 229 10 239
02. Golongan II 1.248 1.155 2.403
03. Golongan III 1.273 876 2.149
04. Golongan IV 619 259 878
ALOR 3.369 2.300 5.669
Sumber: Badan Kepegawaian Daerah Kabupaten AlorSource:
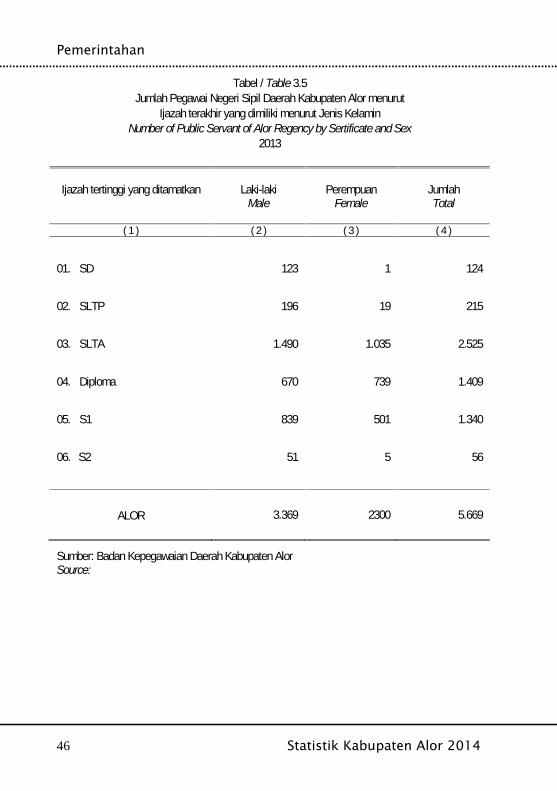
Pemerintahan
46 Statistik Kabupaten Alor 2014
Tabel / Table 3.5Jumlah Pegawai Negeri Sipil Daerah Kabupaten Alor menurut
Ijazah terakhir yang dimiliki menurut Jenis KelaminNumber of Public Servant of Alor Regency by Sertificate and Sex
2013
Ijazah tertinggi yang ditamatkan Laki-lakiMale
PerempuanFemale
JumlahTotal
( 1 ) ( 2 ) ( 3 ) ( 4 )
01. SD 123 1 124
02. SLTP 196 19 215
03. SLTA 1.490 1.035 2.525
04. Diploma 670 739 1.409
05. S1 839 501 1.340
06. S2 51 5 56
ALOR 3.369 2300 5.669
Sumber: Badan Kepegawaian Daerah Kabupaten AlorSource:
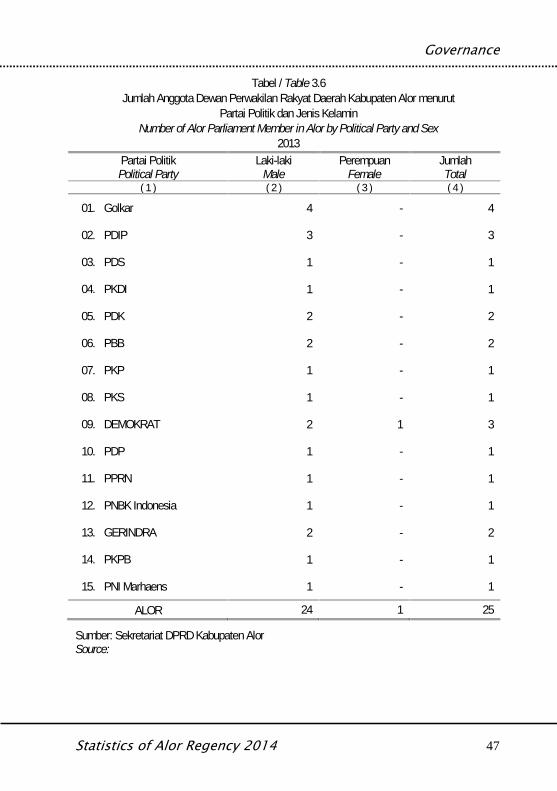
Governance
Statistics of Alor Regency 2014 47
Tabel / Table 3.6Jumlah Anggota Dewan Perwakilan Rakyat Daerah Kabupaten Alor menurut
Partai Politik dan Jenis KelaminNumber of Alor Parliament Member in Alor by Political Party and Sex
2013Partai PolitikPolitical Party
Laki-lakiMale
PerempuanFemale
JumlahTotal
( 1 ) ( 2 ) ( 3 ) ( 4 )
01. Golkar 4 - 4
02. PDIP 3 - 3
03. PDS 1 - 1
04. PKDI 1 - 1
05. PDK 2 - 2
06. PBB 2 - 2
07. PKP 1 - 1
08. PKS 1 - 1
09. DEMOKRAT 2 1 3
10. PDP 1 - 1
11. PPRN 1 - 1
12. PNBK Indonesia 1 - 1
13. GERINDRA 2 - 2
14. PKPB 1 - 1
15. PNI Marhaens 1 - 1
ALOR 24 1 25
Sumber: Sekretariat DPRD Kabupaten AlorSource:
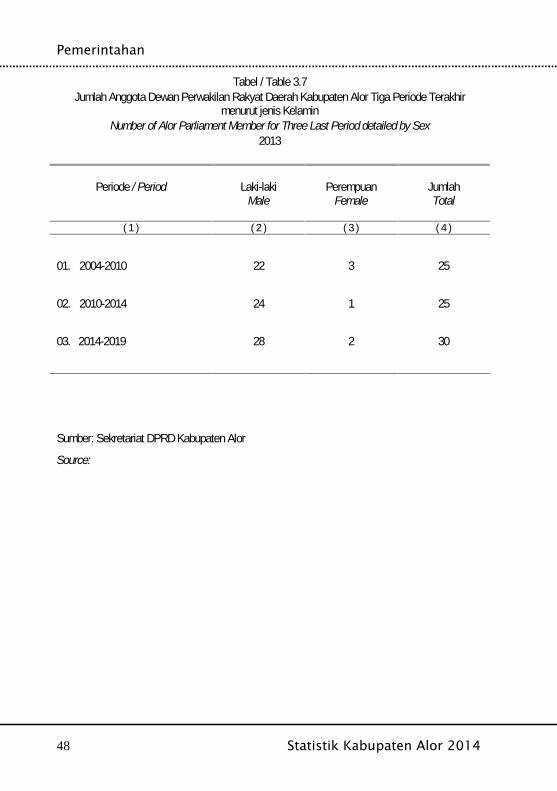
Pemerintahan
48 Statistik Kabupaten Alor 2014
Tabel / Table 3.7Jumlah Anggota Dewan Perwakilan Rakyat Daerah Kabupaten Alor Tiga Periode Terakhir
menurut jenis KelaminNumber of Alor Parliament Member for Three Last Period detailed by Sex
2013
Periode / Period Laki-lakiMale
PerempuanFemale
JumlahTotal
( 1 ) ( 2 ) ( 3 ) ( 4 )
01. 2004-2010 22 3 25
02. 2010-2014 24 1 25
03. 2014-2019 28 2 30
ALOR
Sumber: Sekretariat DPRD Kabupaten Alor
Source:
Governance
Statistics of Alor Regency 2014 49

Pemerintahan
50 Statistik Kabupaten Alor 2014
Population
Statistics of Alor Regency 2014 51
BAB IVPENDUDUK & TENAGA KERJA
Population& Labour
Penduduk
52 Statistik Kabupaten Alor 2014
Population
Statistics of Alor Regency 2014 53
BAB IV.1PENDUDUK
Population

Penduduk
54 Statistik Kabupaten Alor 2014
Population
Statistics of Alor Regency 2014 55
Penjelasan Teknis Technical Notes
1. Penduduk Indonesia adalah semua orang yangberdomisili di wilayah teritorial RepublikIndonesia.
2. Rata – rata pertumbuhan penduduk adalah angkayang menunjukkan tingkat pertambahanpenduduk per tahun dalam jangka waktu tertentu.
3. Kepadatan penduduk adalah banyaknyapenduduk per km persegi.
4. Rasio jenis kelamin adalah perbandingan antarabanyaknya penduduk perempuan pada suatudaerah dan waktu tertentu. Biasanya dinyatakandengan banyaknya penduduk laki-laki untuk 100penduduk perempuan.
5. Rumah Tangga adalah seseorang atausekelompok orang yang biasanya tinggalbersama dalam suatu bangunan sertapengelolaan makan dari satu dapur. Satu rumahtangga dapat terdiri dari hanya satu anggotarumah tangga. Yang dimaksud makan dari satudapur adalah jika pengurusan kebutuhan sehari-harinya dikelola bersama-sama menjadi satu.
6. Penduduk usia kerja adalah penduduk yangberumur 15 tahun ke atas.
7. Bekerja adalah melakukan pekerjaan denganmaksud memperoleh atau membantumemperoleh pendapatan / keuntungan danlamanya bekerja paling sedikit 1 jam secara terusmenerus dalam seminggu yang lalu (termasukpekerja keluarga tanpa upah)
1. Indonesian population are all residents of theentire territory of Republic of Indonesia.
2. Average growth of population is the annualpopulation growth rate over a certain period.
3. Population density is the number of people persquare kilometer
4. Sex Ratio is the ratio of the number of males tothe number of females in a given area and time,usually expressed as the number of males forevery 100 females.
5. Household is group of person who usually livetogether in a building or housing unit who makecommon provision for food and other essentials ofliving. One household could consist of only onehousehold member. Common provision for foodmeans one organising daily needs for all ofhousehold members.
6. Working age populations aged 15 years and over
7. The concept of working means activity intended toearn income by doing work or helping to do workat least one hour continuously during thereference week ( including unpaid family worker/sfor any economic activity

Penduduk
56 Statistik Kabupaten Alor 2014
Tabel / Table 4.1.1Jumlah Penduduk, Luas Wilayah dan Kepadatan Penduduk
Population, Area, and Population Density2013
KecamatanDistrict
Jumlah PendudukPopulation
Luas daerahArea(Km²)
Kepadatan PendudukPopulation Density
(per Km²)
( 1 ) ( 2 ) ( 3 ) ( 4 )
01. Pantar 9.104 119,82 7602. Pantar Barat 6.964 58,71 11903. Pantar Timur 11.114 141,44 7904. Pantar Barat Laut 4.424 150,13 2905. Pantar Tengah 9.636 306,02 2006. Alor Barat Daya 22.276 447,97 5007. Mataru 5.775 102,78 5608. Alor Selatan 9.193 192,97 4809. Alor Timur 7.765 562,76 1410. Alor Timur Laut 8.898 208,49 4311. Pureman 3.590 147,88 2412. Teluk Mutiara 50.086 80,18 62513. Kabola 7.579 73,01 10414. Alor Barat Laut 19.417 107,96 18015. Alor Tengah Utara 11.298 125,14 9016. Lembur 4.273 75,79 5617. Pulau Pura 5.221 27,83 188
ALOR 196.613 2.928.87 67
Sumber: Proyeksi Sensus Penduduk 2010Source: Projection Population Census 2010
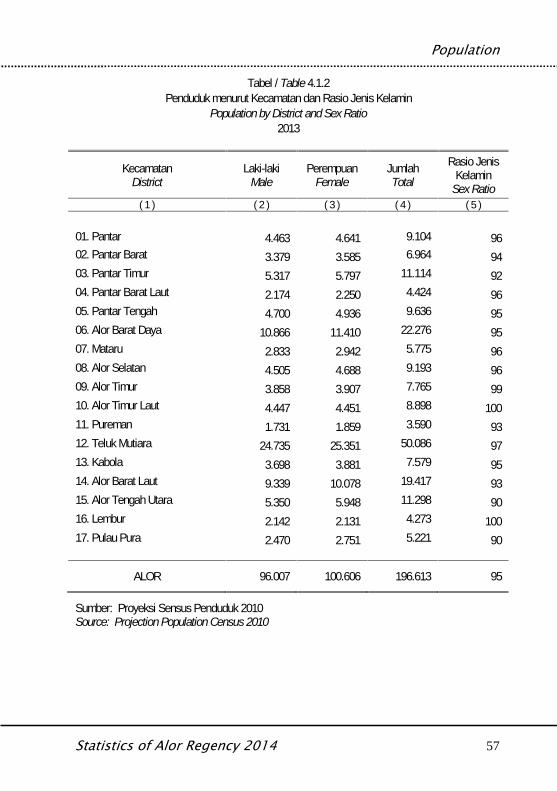
Population
Statistics of Alor Regency 2014 57
Tabel / Table 4.1.2Penduduk menurut Kecamatan dan Rasio Jenis Kelamin
Population by District and Sex Ratio2013
KecamatanDistrict
Laki-lakiMale
PerempuanFemale
JumlahTotal
Rasio JenisKelamin
Sex Ratio( 1 ) ( 2 ) ( 3 ) ( 4 ) ( 5 )
01. Pantar 4.463 4.641 9.104 9602. Pantar Barat 3.379 3.585 6.964 9403. Pantar Timur 5.317 5.797 11.114 9204. Pantar Barat Laut 2.174 2.250 4.424 9605. Pantar Tengah 4.700 4.936 9.636 9506. Alor Barat Daya 10.866 11.410 22.276 9507. Mataru 2.833 2.942 5.775 9608. Alor Selatan 4.505 4.688 9.193 9609. Alor Timur 3.858 3.907 7.765 9910. Alor Timur Laut 4.447 4.451 8.898 10011. Pureman 1.731 1.859 3.590 9312. Teluk Mutiara 24.735 25.351 50.086 9713. Kabola 3.698 3.881 7.579 9514. Alor Barat Laut 9.339 10.078 19.417 9315. Alor Tengah Utara 5.350 5.948 11.298 9016. Lembur 2.142 2.131 4.273 10017. Pulau Pura 2.470 2.751 5.221 90
ALOR 96.007 100.606 196.613 95
Sumber: Proyeksi Sensus Penduduk 2010Source: Projection Population Census 2010
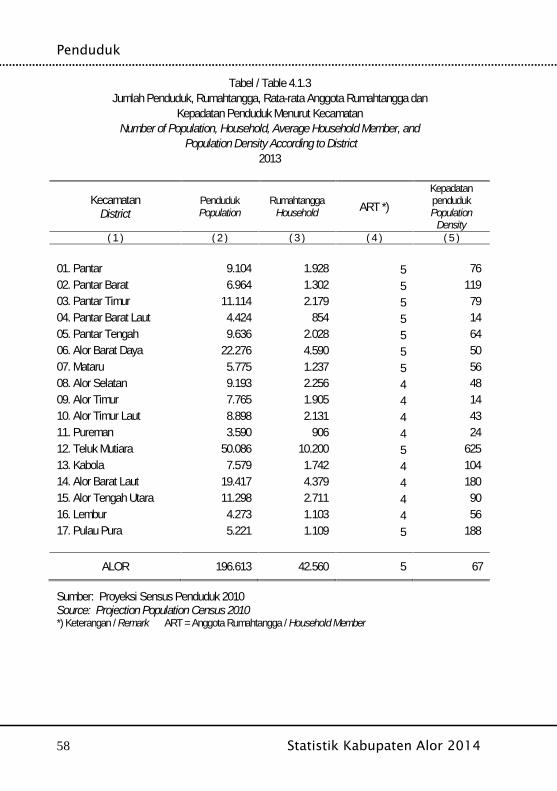
Penduduk
58 Statistik Kabupaten Alor 2014
Tabel / Table 4.1.3Jumlah Penduduk, Rumahtangga, Rata-rata Anggota Rumahtangga dan
Kepadatan Penduduk Menurut KecamatanNumber of Population, Household, Average Household Member, and
Population Density According to District2013
KecamatanDistrict
PendudukPopulation
RumahtanggaHousehold ART *)
KepadatanpendudukPopulation
Density( 1 ) ( 2 ) ( 3 ) ( 4 ) ( 5 )
01. Pantar 9.104 1.928 5 7602. Pantar Barat 6.964 1.302 5 11903. Pantar Timur 11.114 2.179 5 7904. Pantar Barat Laut 4.424 854 5 1405. Pantar Tengah 9.636 2.028 5 6406. Alor Barat Daya 22.276 4.590 5 5007. Mataru 5.775 1.237 5 5608. Alor Selatan 9.193 2.256 4 4809. Alor Timur 7.765 1.905 4 1410. Alor Timur Laut 8.898 2.131 4 4311. Pureman 3.590 906 4 2412. Teluk Mutiara 50.086 10.200 5 62513. Kabola 7.579 1.742 4 10414. Alor Barat Laut 19.417 4.379 4 18015. Alor Tengah Utara 11.298 2.711 4 9016. Lembur 4.273 1.103 4 5617. Pulau Pura 5.221 1.109 5 188
ALOR 196.613 42.560 5 67
Sumber: Proyeksi Sensus Penduduk 2010Source: Projection Population Census 2010*) Keterangan / Remark ART = Anggota Rumahtangga / Household Member
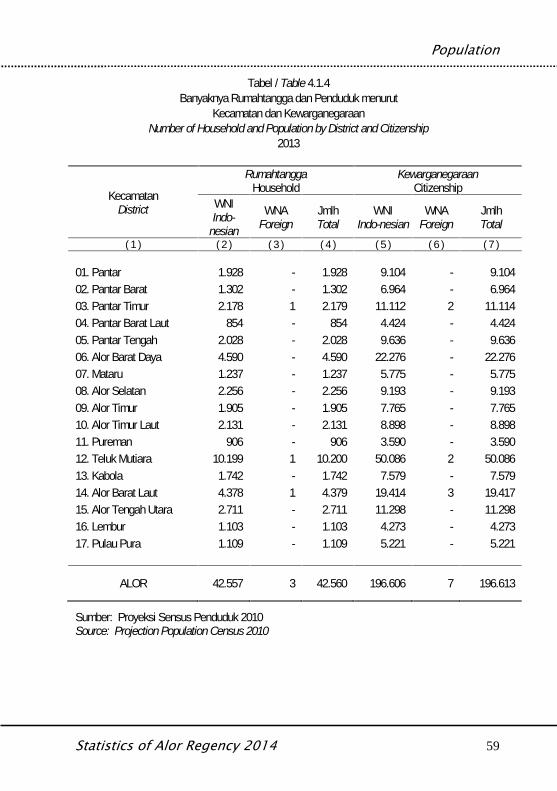
Population
Statistics of Alor Regency 2014 59
Tabel / Table 4.1.4Banyaknya Rumahtangga dan Penduduk menurut
Kecamatan dan KewarganegaraanNumber of Household and Population by District and Citizenship
2013
KecamatanDistrict
RumahtanggaHousehold
KewarganegaraanCitizenship
WNIIndo-
nesian
WNAForeign
JmlhTotal
WNIIndo-nesian
WNAForeign
JmlhTotal
( 1 ) ( 2 ) ( 3 ) ( 4 ) ( 5 ) ( 6 ) ( 7 )
01. Pantar 1.928 - 1.928 9.104 - 9.10402. Pantar Barat 1.302 - 1.302 6.964 - 6.96403. Pantar Timur 2.178 1 2.179 11.112 2 11.11404. Pantar Barat Laut 854 - 854 4.424 - 4.42405. Pantar Tengah 2.028 - 2.028 9.636 - 9.63606. Alor Barat Daya 4.590 - 4.590 22.276 - 22.27607. Mataru 1.237 - 1.237 5.775 - 5.77508. Alor Selatan 2.256 - 2.256 9.193 - 9.19309. Alor Timur 1.905 - 1.905 7.765 - 7.76510. Alor Timur Laut 2.131 - 2.131 8.898 - 8.89811. Pureman 906 - 906 3.590 - 3.59012. Teluk Mutiara 10.199 1 10.200 50.086 2 50.08613. Kabola 1.742 - 1.742 7.579 - 7.57914. Alor Barat Laut 4.378 1 4.379 19.414 3 19.41715. Alor Tengah Utara 2.711 - 2.711 11.298 - 11.29816. Lembur 1.103 - 1.103 4.273 - 4.27317. Pulau Pura 1.109 - 1.109 5.221 - 5.221
ALOR 42.557 3 42.560 196.606 7 196.613
Sumber: Proyeksi Sensus Penduduk 2010Source: Projection Population Census 2010
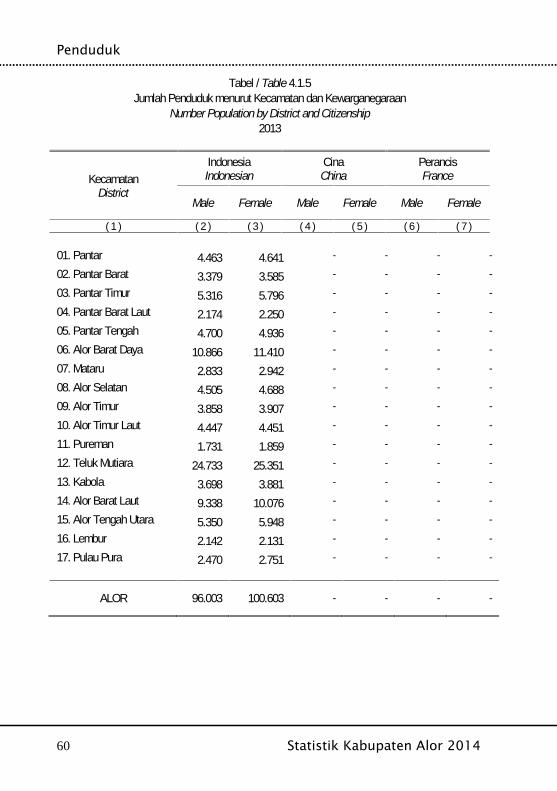
Penduduk
60 Statistik Kabupaten Alor 2014
Tabel / Table 4.1.5Jumlah Penduduk menurut Kecamatan dan Kewarganegaraan
Number Population by District and Citizenship2013
KecamatanDistrict
IndonesiaIndonesian
CinaChina
PerancisFrance
Male Female Male Female Male Female
( 1 ) ( 2 ) ( 3 ) ( 4 ) ( 5 ) ( 6 ) ( 7 )
01. Pantar 4.463 4.641 - - - -
02. Pantar Barat 3.379 3.585 - - - -
03. Pantar Timur 5.316 5.796 - - - -
04. Pantar Barat Laut 2.174 2.250 - - - -
05. Pantar Tengah 4.700 4.936 - - - -
06. Alor Barat Daya 10.866 11.410 - - - -
07. Mataru 2.833 2.942 - - - -
08. Alor Selatan 4.505 4.688 - - - -
09. Alor Timur 3.858 3.907 - - - -
10. Alor Timur Laut 4.447 4.451 - - - -
11. Pureman 1.731 1.859 - - - -
12. Teluk Mutiara 24.733 25.351 - - - -
13. Kabola 3.698 3.881 - - - -
14. Alor Barat Laut 9.338 10.076 - - - -
15. Alor Tengah Utara 5.350 5.948 - - - -
16. Lembur 2.142 2.131 - - - -
17. Pulau Pura 2.470 2.751 - - - -
ALOR 96.003 100.603 - - - -
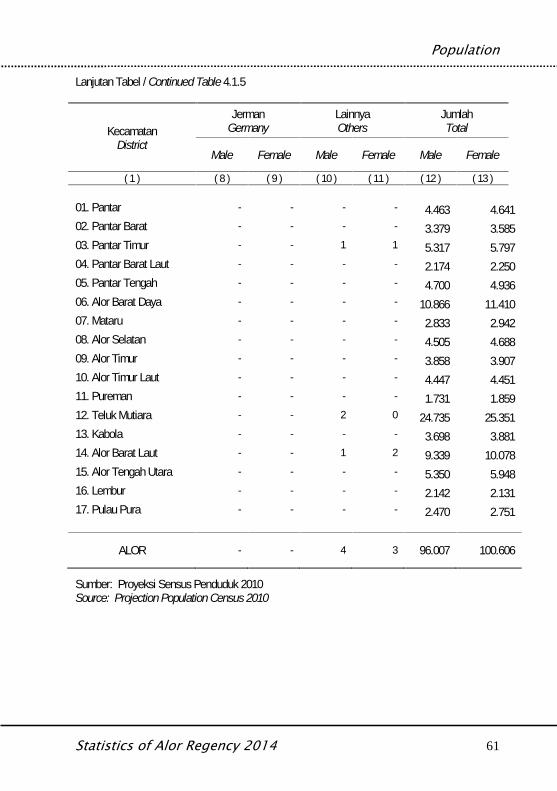
Population
Statistics of Alor Regency 2014 61
Lanjutan Tabel / Continued Table 4.1.5
KecamatanDistrict
JermanGermany
LainnyaOthers
JumlahTotal
Male Female Male Female Male Female
( 1 ) ( 8 ) ( 9 ) ( 10 ) ( 11 ) ( 12 ) ( 13 )
01. Pantar - - - - 4.463 4.64102. Pantar Barat - - - - 3.379 3.58503. Pantar Timur - - 1 1 5.317 5.79704. Pantar Barat Laut - - - - 2.174 2.25005. Pantar Tengah - - - - 4.700 4.93606. Alor Barat Daya - - - - 10.866 11.41007. Mataru - - - - 2.833 2.94208. Alor Selatan - - - - 4.505 4.68809. Alor Timur - - - - 3.858 3.90710. Alor Timur Laut - - - - 4.447 4.45111. Pureman - - - - 1.731 1.85912. Teluk Mutiara - - 2 0 24.735 25.35113. Kabola - - - - 3.698 3.88114. Alor Barat Laut - - 1 2 9.339 10.07815. Alor Tengah Utara - - - - 5.350 5.94816. Lembur - - - - 2.142 2.13117. Pulau Pura - - - - 2.470 2.751
ALOR - - 4 3 96.007 100.606
Sumber: Proyeksi Sensus Penduduk 2010Source: Projection Population Census 2010
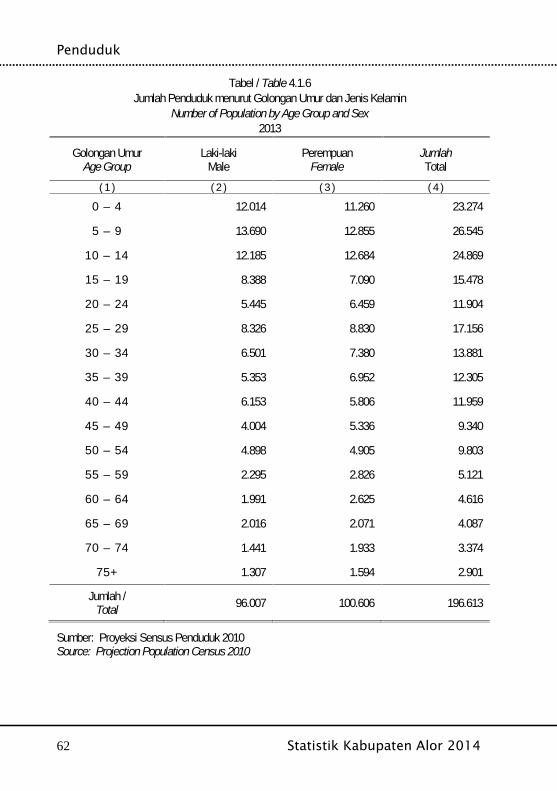
Penduduk
62 Statistik Kabupaten Alor 2014
Tabel / Table 4.1.6Jumlah Penduduk menurut Golongan Umur dan Jenis Kelamin
Number of Population by Age Group and Sex2013
Golongan UmurAge Group
Laki-lakiMale
PerempuanFemale
JumlahTotal
( 1 ) ( 2 ) ( 3 ) ( 4 )
0 – 4 12.014 11.260 23.274
5 – 9 13.690 12.855 26.545
1 0 – 1 4 12.185 12.684 24.869
1 5 – 1 9 8.388 7.090 15.478
2 0 – 2 4 5.445 6.459 11.904
2 5 – 2 9 8.326 8.830 17.156
3 0 – 3 4 6.501 7.380 13.881
3 5 – 3 9 5.353 6.952 12.305
4 0 – 4 4 6.153 5.806 11.959
4 5 – 4 9 4.004 5.336 9.340
5 0 – 5 4 4.898 4.905 9.803
5 5 – 5 9 2.295 2.826 5.121
6 0 – 6 4 1.991 2.625 4.616
6 5 – 6 9 2.016 2.071 4.087
7 0 – 7 4 1.441 1.933 3.374
7 5 + 1.307 1.594 2.901
Jumlah /Total 96.007 100.606 196.613
Sumber: Proyeksi Sensus Penduduk 2010Source: Projection Population Census 2010
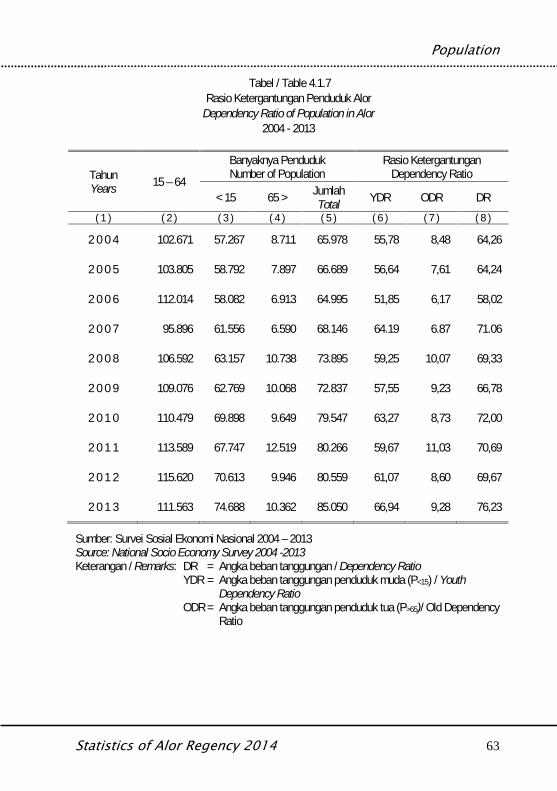
Population
Statistics of Alor Regency 2014 63
Tabel / Table 4.1.7Rasio Ketergantungan Penduduk Alor
Dependency Ratio of Population in Alor2004 - 2013
TahunYears 15 – 64
Banyaknya PendudukNumber of Population
Rasio KetergantunganDependency Ratio
< 15 65 > JumlahTotal YDR ODR DR
( 1 ) ( 2 ) ( 3 ) ( 4 ) ( 5 ) ( 6 ) ( 7 ) ( 8 )
2 0 0 4 102.671 57.267 8.711 65.978 55,78 8,48 64,26
2 0 0 5 103.805 58.792 7.897 66.689 56,64 7,61 64,24
2 0 0 6 112.014 58.082 6.913 64.995 51,85 6,17 58,02
2 0 0 7 95.896 61.556 6.590 68.146 64.19 6.87 71.06
2 0 0 8 106.592 63.157 10.738 73.895 59,25 10,07 69,33
2 0 0 9 109.076 62.769 10.068 72.837 57,55 9,23 66,78
2 0 1 0 110.479 69.898 9.649 79.547 63,27 8,73 72,00
2 0 1 1 113.589 67.747 12.519 80.266 59,67 11,03 70,69
2 0 1 2 115.620 70.613 9.946 80.559 61,07 8,60 69,67
2 0 1 3 111.563 74.688 10.362 85.050 66,94 9,28 76,23
Sumber: Survei Sosial Ekonomi Nasional 2004 – 2013Source: National Socio Economy Survey 2004 -2013Keterangan / Remarks: DR = Angka beban tanggungan / Dependency Ratio
YDR = Angka beban tanggungan penduduk muda (P<15) / YouthDependency Ratio
ODR = Angka beban tanggungan penduduk tua (P>65)/ Old DependencyRatio
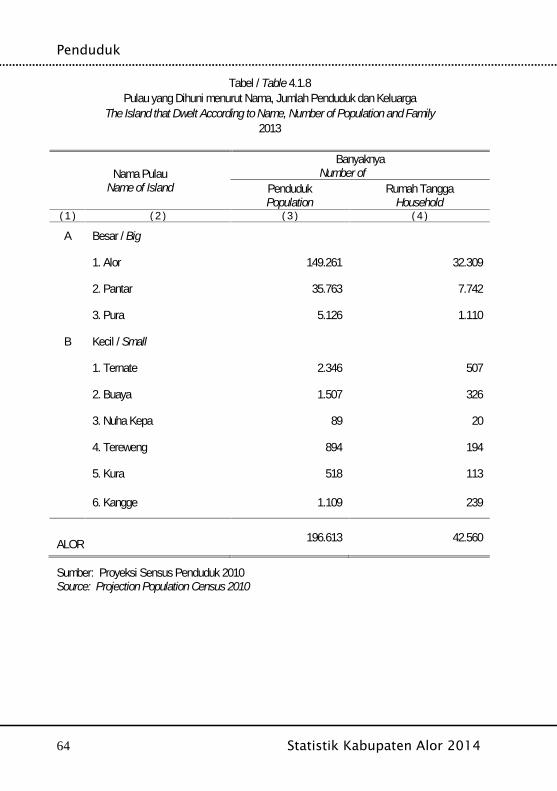
Penduduk
64 Statistik Kabupaten Alor 2014
Tabel / Table 4.1.8Pulau yang Dihuni menurut Nama, Jumlah Penduduk dan Keluarga
The Island that Dwelt According to Name, Number of Population and Family2013
Nama PulauName of Island
BanyaknyaNumber of
PendudukPopulation
Rumah TanggaHousehold
( 1 ) ( 2 ) ( 3 ) ( 4 )
A Besar / Big
1. Alor 149.261 32.309
2. Pantar 35.763 7.742
3. Pura 5.126 1.110
B Kecil / Small
1. Ternate 2.346 507
2. Buaya 1.507 326
3. Nuha Kepa 89 20
4. Tereweng 894 194
5. Kura 518 113
6. Kangge 1.109 239
ALOR 196.613 42.560
Sumber: Proyeksi Sensus Penduduk 2010Source: Projection Population Census 2010
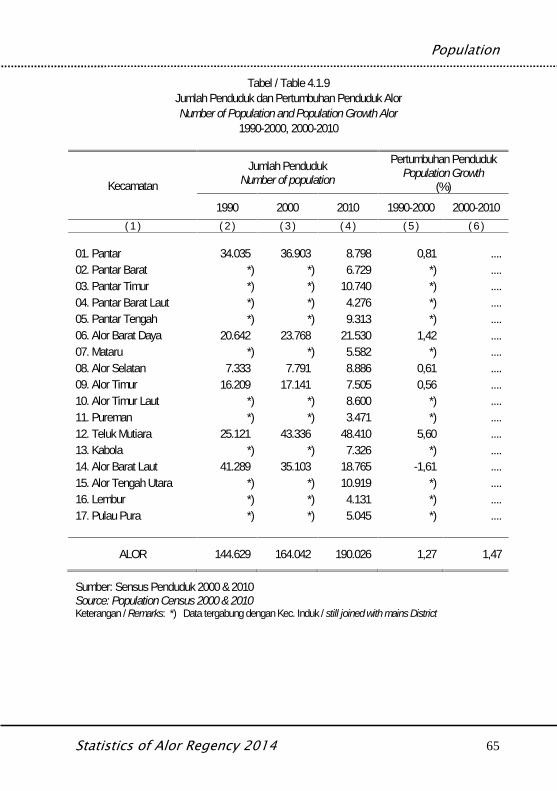
Population
Statistics of Alor Regency 2014 65
Tabel / Table 4.1.9Jumlah Penduduk dan Pertumbuhan Penduduk AlorNumber of Population and Population Growth Alor
1990-2000, 2000-2010
KecamatanJumlah Penduduk
Number of population
Pertumbuhan PendudukPopulation Growth
(%)1990 2000 2010 1990-2000 2000-2010
( 1 ) ( 2 ) ( 3 ) ( 4 ) ( 5 ) ( 6 )
01. Pantar 34.035 36.903 8.798 0,81 ....02. Pantar Barat *) *) 6.729 *) ....03. Pantar Timur *) *) 10.740 *) ....04. Pantar Barat Laut *) *) 4.276 *) ....05. Pantar Tengah *) *) 9.313 *) ....06. Alor Barat Daya 20.642 23.768 21.530 1,42 ....07. Mataru *) *) 5.582 *) ....08. Alor Selatan 7.333 7.791 8.886 0,61 ....09. Alor Timur 16.209 17.141 7.505 0,56 ....10. Alor Timur Laut *) *) 8.600 *) ....11. Pureman *) *) 3.471 *) ....12. Teluk Mutiara 25.121 43.336 48.410 5,60 ....13. Kabola *) *) 7.326 *) ....14. Alor Barat Laut 41.289 35.103 18.765 -1,61 ....15. Alor Tengah Utara *) *) 10.919 *) ....16. Lembur *) *) 4.131 *) ....17. Pulau Pura *) *) 5.045 *) ....
ALOR 144.629 164.042 190.026 1,27 1,47
Sumber: Sensus Penduduk 2000 & 2010Source: Population Census 2000 & 2010Keterangan / Remarks: *) Data tergabung dengan Kec. Induk / still joined with mains District
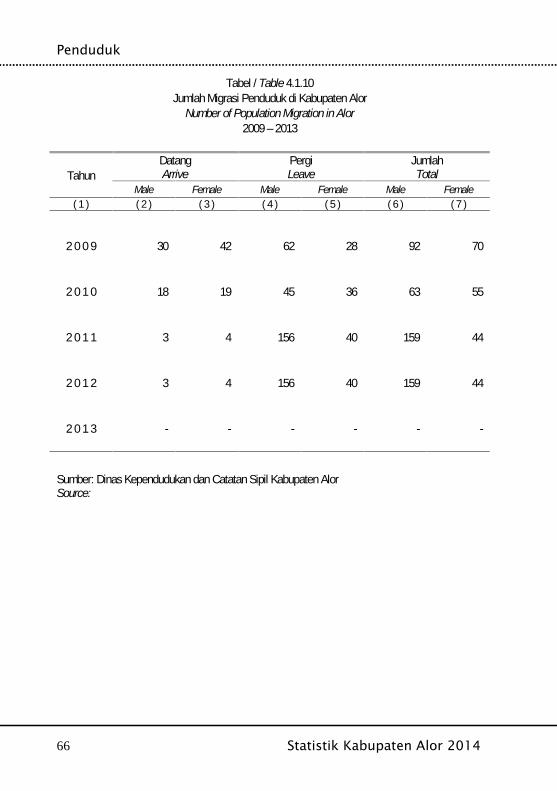
Penduduk
66 Statistik Kabupaten Alor 2014
Tabel / Table 4.1.10Jumlah Migrasi Penduduk di Kabupaten Alor
Number of Population Migration in Alor2009 – 2013
TahunDatangArrive
PergiLeave
JumlahTotal
Male Female Male Female Male Female( 1 ) ( 2 ) ( 3 ) ( 4 ) ( 5 ) ( 6 ) ( 7 )
2 0 0 9 30 42 62 28 92 70
2 0 1 0 18 19 45 36 63 55
2 0 1 1 3 4 156 40 159 44
2 0 1 2 3 4 156 40 159 44
2 0 1 3 - - - - - -
Sumber: Dinas Kependudukan dan Catatan Sipil Kabupaten AlorSource:
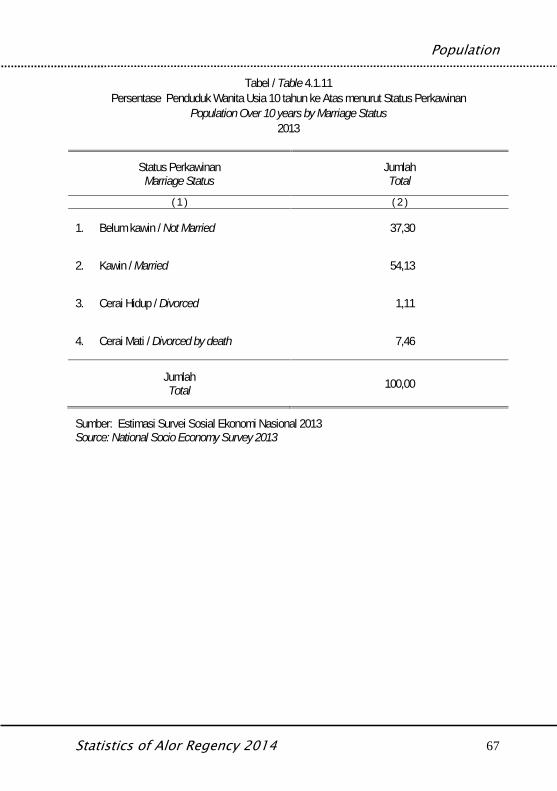
Population
Statistics of Alor Regency 2014 67
Tabel / Table 4.1.11Persentase Penduduk Wanita Usia 10 tahun ke Atas menurut Status Perkawinan
Population Over 10 years by Marriage Status2013
Status PerkawinanMarriage Status
JumlahTotal
( 1 ) ( 2 )
1. Belum kawin / Not Married 37,30
2. Kawin / Married 54,13
3. Cerai Hidup / Divorced 1,11
4. Cerai Mati / Divorced by death 7,46
JumlahTotal 100,00
Sumber: Estimasi Survei Sosial Ekonomi Nasional 2013Source: National Socio Economy Survey 2013
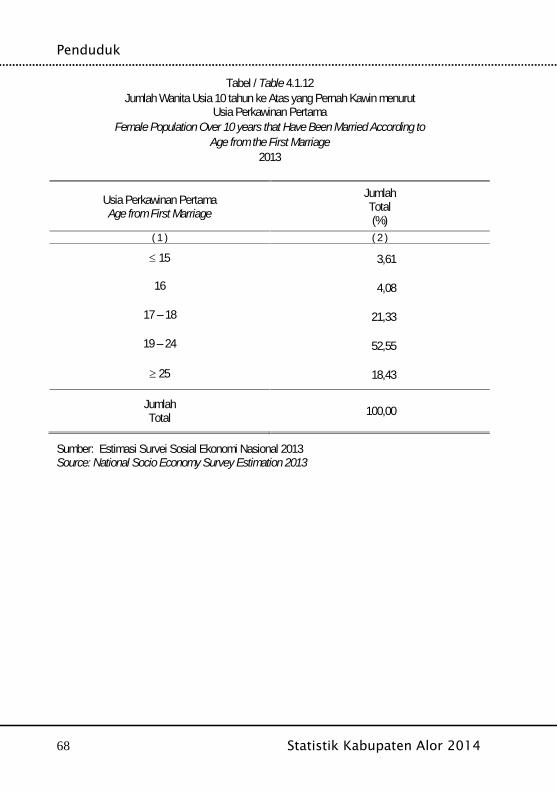
Penduduk
68 Statistik Kabupaten Alor 2014
Tabel / Table 4.1.12Jumlah Wanita Usia 10 tahun ke Atas yang Pernah Kawin menurut
Usia Perkawinan PertamaFemale Population Over 10 years that Have Been Married According to
Age from the First Marriage2013
Usia Perkawinan PertamaAge from First Marriage
JumlahTotal(%)
( 1 ) ( 2 )
15 3,61
16 4,08
17 – 18 21,33
19 – 24 52,55
25 18,43
JumlahTotal 100,00
Sumber: Estimasi Survei Sosial Ekonomi Nasional 2013Source: National Socio Economy Survey Estimation 2013
Population
Statistics of Alor Regency 2014 69

Penduduk
70 Statistik Kabupaten Alor 2014
Labour Force
Statistics of Alor Regency 2014 71
BAB IV.2TENAGA KERJA
Labour Force

Tenaga Kerja
72 Statistik Kabupaten Alor 2014
Labour Force
Statistics of Alor Regency 2014 73
Penjelasan Teknis Technical Notes
1. Angkatan Kerja adalah penduduk usia kerja (15tahun dan lebih) yang bekerja, atau punyapekerjaan namun sementara tidak bekerja danpengangguran
2. Lapangan Usaha adalah bidang kegiatan daripekerjaan/ tempat bekerja dimana seseorangbekerja. Klasifikasi Baku Lapangan UsahaIndonesia (KBLI) dalam 1 digit.
3. Status Pekerjaan adalah kedudukan seseorangdalam unit usaha/kegiatan dalam melakukanpekerjaan.
4. Pekerja Tak Dibayar adalah seseorang yangbekerja membantu usaha untuk memperolehpenghasilan/ keuntungan yang dilakukan olehsalah seorang anggota rumah tangga atau bukananggota rumah tangga tanpa mendapat upah/gaji.
1. Labor Force are people aged 15 years old andover who, in the previous week, were working,temporarily absent from work but having jobs, andthose who did not have job and were looking forwork.
2. Industry is field of a person’s activity orestablishment. The classification of industriesfollows the Indonesia Standard IndustrialClassification (KBLI) in one digit.
3. Employment Status is the status of a person at hisplace of work or establishment where he wasemployed
4. Unpaid Worker is a person who intended to workwithout pay in an establishment run by othermembers of the family, relative or neighbour.

Tenaga Kerja
74 Statistik Kabupaten Alor 2014
Tabel / Table 4.2.1Penduduk Berumur 15 Tahun Keatas menurut Kegiatan Utama dan Jenis Kelamin
Selama Seminggu yang LaluPopulation Over 15 Years by Type of Activity and Gender
During the Previous Week2013
Kegiatan semingguyang Lalu
Type of activity duringthe previous week
Laki-lakiMale
PerempuanFemale
JumlahTotal
( 1 ) ( 2 ) ( 3 ) ( 4 )I. Angkatan Kerja
Labor Force 46.499 44.541 91.040
1. Bekerja / Worked 45.344 43.219 88.563
2. Mencari Pekerjaan /Looking for Work 1.155 1.322 2.477
II. Bukan Angkatan KerjaNon Labor Force 11.619 19.266 30.885
1. Sekolah / Attending School 5.507 4.756 10.263
2. Mengurus RT / ManagingHousehold 1.556 11.854 13.410
3. Lainnya / Others 4.556 2.656 7.212
Jumlah / Total ( I + II ) 58.118 63.807 121.925
Sumber: Survei Angkatan Kerja Nasional 2013Source: National Labor Force Survey 2013

Labour Force
Statistics of Alor Regency 2014 75
Tabel / Table 4.2.2Penduduk Berumur 15 Tahun Keatas yang Bekerja menurut
Lapangan Usaha Utama dan Jenis KelaminPopulation Over 15 Years by Work Field and Gender
2013
Lapangan Usaha UtamaWork Field
Laki-lakiMale
PerempuanFemale
JumlahTotal
( 1 ) ( 2 ) ( 3 ) ( 4 )
01. Primer 25.733 29.805 55.538
02. Sekunder 6.565 3.287 9.852
03. Tersier 13.046 10.127 23.173
ALOR 45.344 43.219 88.563
Sumber: Survei Angkatan Kerja Nasional 2013Source: National Labor Force Survey 2013
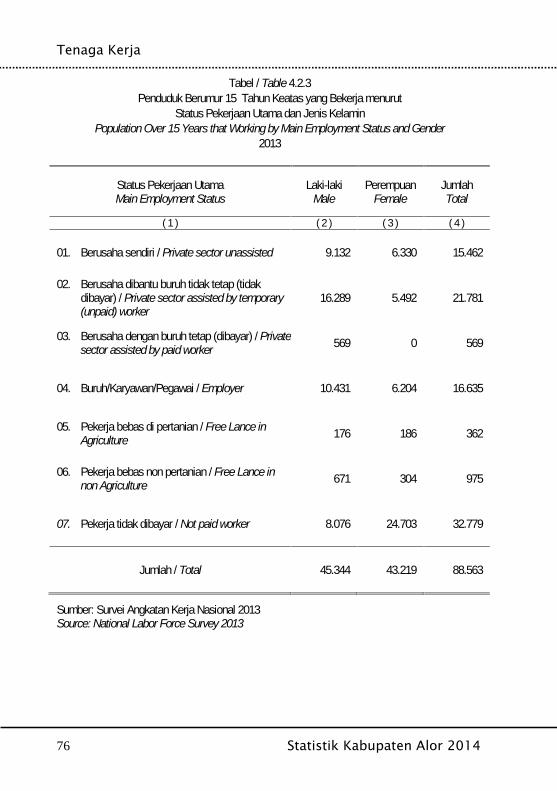
Tenaga Kerja
76 Statistik Kabupaten Alor 2014
Tabel / Table 4.2.3Penduduk Berumur 15 Tahun Keatas yang Bekerja menurut
Status Pekerjaan Utama dan Jenis KelaminPopulation Over 15 Years that Working by Main Employment Status and Gender
2013
Status Pekerjaan UtamaMain Employment Status
Laki-lakiMale
PerempuanFemale
JumlahTotal
( 1 ) ( 2 ) ( 3 ) ( 4 )
01. Berusaha sendiri / Private sector unassisted 9.132 6.330 15.462
02. Berusaha dibantu buruh tidak tetap (tidakdibayar) / Private sector assisted by temporary(unpaid) worker
16.289 5.492 21.781
03. Berusaha dengan buruh tetap (dibayar) / Privatesector assisted by paid worker 569 0 569
04. Buruh/Karyawan/Pegawai / Employer 10.431 6.204 16.635
05. Pekerja bebas di pertanian / Free Lance inAgriculture 176 186 362
06. Pekerja bebas non pertanian / Free Lance innon Agriculture 671 304 975
07. Pekerja tidak dibayar / Not paid worker 8.076 24.703 32.779
Jumlah / Total 45.344 43.219 88.563
Sumber: Survei Angkatan Kerja Nasional 2013Source: National Labor Force Survey 2013
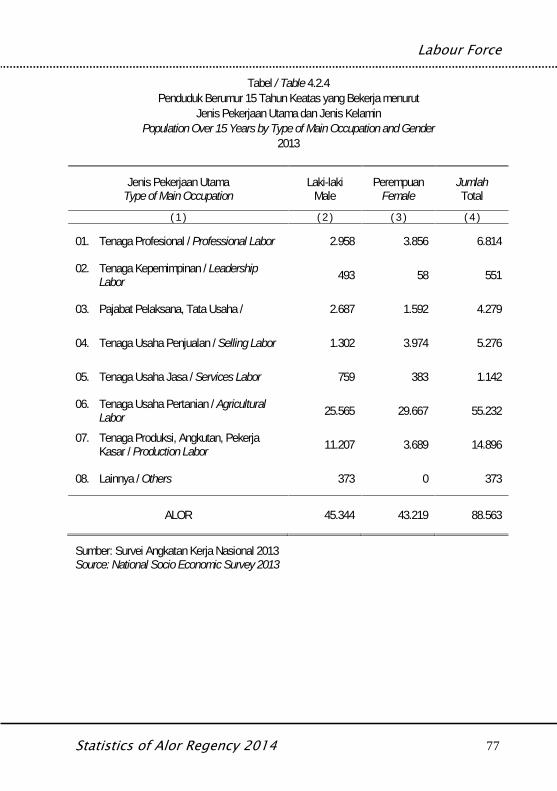
Labour Force
Statistics of Alor Regency 2014 77
Tabel / Table 4.2.4Penduduk Berumur 15 Tahun Keatas yang Bekerja menurut
Jenis Pekerjaan Utama dan Jenis KelaminPopulation Over 15 Years by Type of Main Occupation and Gender
2013
Jenis Pekerjaan UtamaType of Main Occupation
Laki-lakiMale
PerempuanFemale
JumlahTotal
( 1 ) ( 2 ) ( 3 ) ( 4 )
01. Tenaga Profesional / Professional Labor 2.958 3.856 6.814
02. Tenaga Kepemimpinan / LeadershipLabor 493 58 551
03. Pajabat Pelaksana, Tata Usaha / 2.687 1.592 4.279
04. Tenaga Usaha Penjualan / Selling Labor 1.302 3.974 5.276
05. Tenaga Usaha Jasa / Services Labor 759 383 1.142
06. Tenaga Usaha Pertanian / AgriculturalLabor 25.565 29.667 55.232
07. Tenaga Produksi, Angkutan, PekerjaKasar / Production Labor 11.207 3.689 14.896
08. Lainnya / Others 373 0 373
ALOR 45.344 43.219 88.563
Sumber: Survei Angkatan Kerja Nasional 2013Source: National Socio Economic Survey 2013
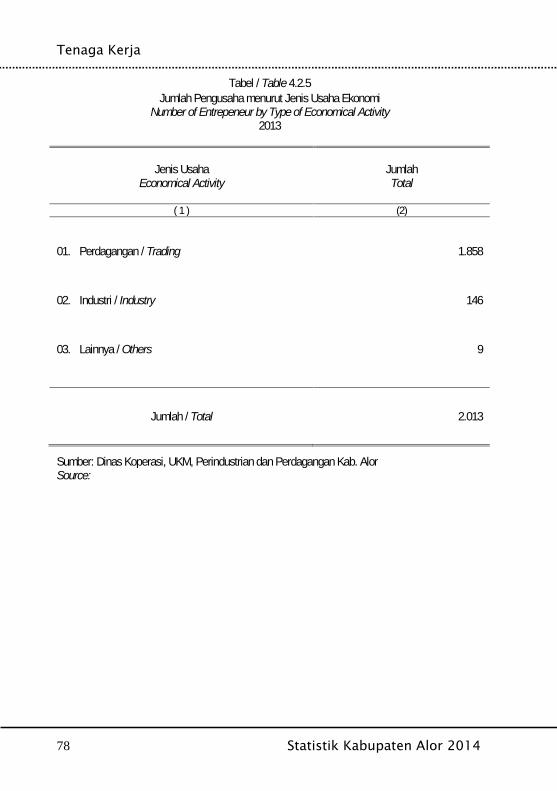
Tenaga Kerja
78 Statistik Kabupaten Alor 2014
Tabel / Table 4.2.5Jumlah Pengusaha menurut Jenis Usaha Ekonomi
Number of Entrepeneur by Type of Economical Activity2013
Jenis UsahaEconomical Activity
JumlahTotal
( 1 ) (2)
01. Perdagangan / Trading 1.858
02. Industri / Industry 146
03. Lainnya / Others 9
Jumlah / Total 2.013
Sumber: Dinas Koperasi, UKM, Perindustrian dan Perdagangan Kab. AlorSource:

Labour Force
Statistics of Alor Regency 2014 79
Tabel / Table 4.2.6Jumlah Pekerja Anak menurut Jenis Usaha Ekonomi
Number of Under-age Employee by Type of Economical Activity2013
Jenis UsahaEconomical Activity
Laki-LakiMale
PerempuanFemale
JumlahTotal
( 1 ) ( 2 ) ( 3 ) (4)
01. Perdagangan / Trading - - -
02. Industri / Industry - - -
03. Lainnya / Others - - -
Jumlah / Total - - -
Sumber: Dinas Koperasi, UKM, Perindustrian dan Perdagangan Kab. AlorSource:
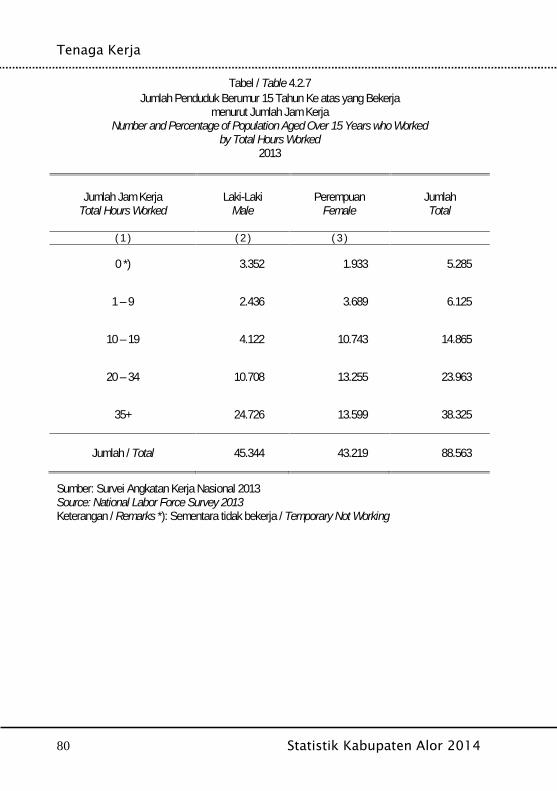
Tenaga Kerja
80 Statistik Kabupaten Alor 2014
Tabel / Table 4.2.7Jumlah Penduduk Berumur 15 Tahun Ke atas yang Bekerja
menurut Jumlah Jam KerjaNumber and Percentage of Population Aged Over 15 Years who Worked
by Total Hours Worked2013
Jumlah Jam KerjaTotal Hours Worked
Laki-LakiMale
PerempuanFemale
JumlahTotal
( 1 ) ( 2 ) ( 3 )
0 *) 3.352 1.933 5.285
1 – 9 2.436 3.689 6.125
10 – 19 4.122 10.743 14.865
20 – 34 10.708 13.255 23.963
35+ 24.726 13.599 38.325
Jumlah / Total 45.344 43.219 88.563
Sumber: Survei Angkatan Kerja Nasional 2013Source: National Labor Force Survey 2013Keterangan / Remarks *): Sementara tidak bekerja / Temporary Not Working
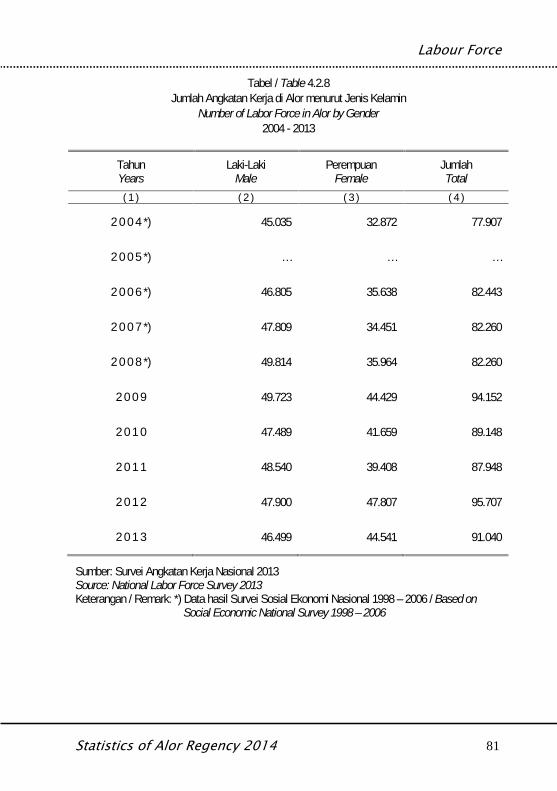
Labour Force
Statistics of Alor Regency 2014 81
Tabel / Table 4.2.8Jumlah Angkatan Kerja di Alor menurut Jenis Kelamin
Number of Labor Force in Alor by Gender2004 - 2013
TahunYears
Laki-LakiMale
PerempuanFemale
JumlahTotal
( 1 ) ( 2 ) ( 3 ) ( 4 )
2 0 0 4 *) 45.035 32.872 77.907
2 0 0 5 *) … … …
2 0 0 6 *) 46.805 35.638 82.443
2 0 0 7 *) 47.809 34.451 82.260
2 0 0 8 *) 49.814 35.964 82.260
2 0 0 9 49.723 44.429 94.152
2 0 1 0 47.489 41.659 89.148
2 0 1 1 48.540 39.408 87.948
2 0 1 2 47.900 47.807 95.707
2 0 1 3 46.499 44.541 91.040
Sumber: Survei Angkatan Kerja Nasional 2013Source: National Labor Force Survey 2013Keterangan / Remark: *) Data hasil Survei Sosial Ekonomi Nasional 1998 – 2006 / Based on
Social Economic National Survey 1998 – 2006
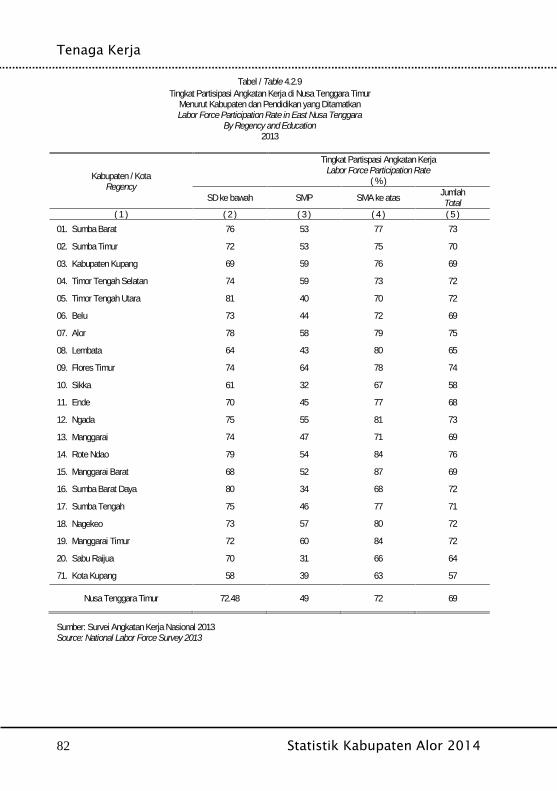
Tenaga Kerja
82 Statistik Kabupaten Alor 2014
Tabel / Table 4.2.9Tingkat Partisipasi Angkatan Kerja di Nusa Tenggara Timur
Menurut Kabupaten dan Pendidikan yang DitamatkanLabor Force Participation Rate in East Nusa Tenggara
By Regency and Education2013
Kabupaten / KotaRegency
Tingkat Partispasi Angkatan KerjaLabor Force Participation Rate
( % )
SD ke bawah SMP SMA ke atas JumlahTotal
( 1 ) ( 2 ) ( 3 ) ( 4 ) ( 5 )01. Sumba Barat 76 53 77 73
02. Sumba Timur 72 53 75 70
03. Kabupaten Kupang 69 59 76 69
04. Timor Tengah Selatan 74 59 73 72
05. Timor Tengah Utara 81 40 70 72
06. Belu 73 44 72 69
07. Alor 78 58 79 75
08. Lembata 64 43 80 65
09. Flores Timur 74 64 78 74
10. Sikka 61 32 67 58
11. Ende 70 45 77 68
12. Ngada 75 55 81 73
13. Manggarai 74 47 71 69
14. Rote Ndao 79 54 84 76
15. Manggarai Barat 68 52 87 69
16. Sumba Barat Daya 80 34 68 72
17. Sumba Tengah 75 46 77 71
18. Nagekeo 73 57 80 72
19. Manggarai Timur 72 60 84 72
20. Sabu Raijua 70 31 66 64
71. Kota Kupang 58 39 63 57
Nusa Tenggara Timur 72.48 49 72 69
Sumber: Survei Angkatan Kerja Nasional 2013Source: National Labor Force Survey 2013
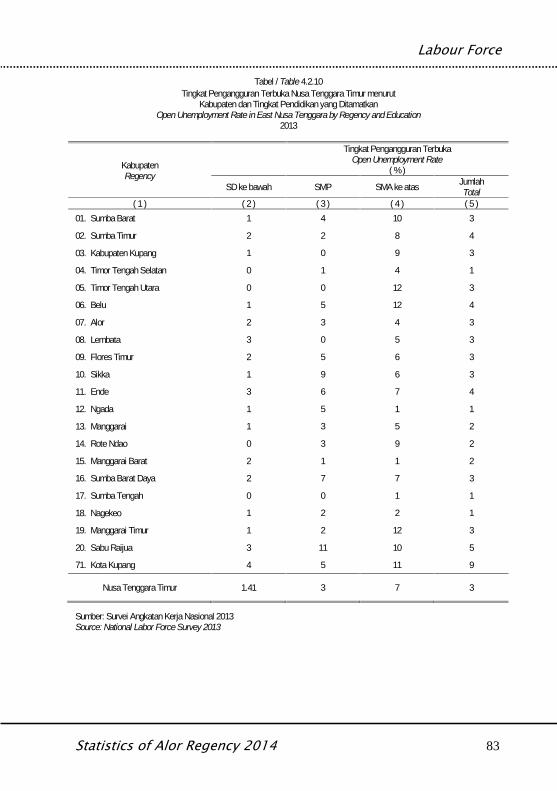
Labour Force
Statistics of Alor Regency 2014 83
Tabel / Table 4.2.10Tingkat Pengangguran Terbuka Nusa Tenggara Timur menurut
Kabupaten dan Tingkat Pendidikan yang DitamatkanOpen Unemployment Rate in East Nusa Tenggara by Regency and Education
2013
KabupatenRegency
Tingkat Pengangguran TerbukaOpen Unemployment Rate
( % )
SD ke bawah SMP SMA ke atas JumlahTotal
( 1 ) ( 2 ) ( 3 ) ( 4 ) ( 5 )01. Sumba Barat 1 4 10 3
02. Sumba Timur 2 2 8 4
03. Kabupaten Kupang 1 0 9 3
04. Timor Tengah Selatan 0 1 4 1
05. Timor Tengah Utara 0 0 12 3
06. Belu 1 5 12 4
07. Alor 2 3 4 3
08. Lembata 3 0 5 3
09. Flores Timur 2 5 6 3
10. Sikka 1 9 6 3
11. Ende 3 6 7 4
12. Ngada 1 5 1 1
13. Manggarai 1 3 5 2
14. Rote Ndao 0 3 9 2
15. Manggarai Barat 2 1 1 2
16. Sumba Barat Daya 2 7 7 3
17. Sumba Tengah 0 0 1 1
18. Nagekeo 1 2 2 1
19. Manggarai Timur 1 2 12 3
20. Sabu Raijua 3 11 10 5
71. Kota Kupang 4 5 11 9
Nusa Tenggara Timur 1.41 3 7 3
Sumber: Survei Angkatan Kerja Nasional 2013Source: National Labor Force Survey 2013
Tenaga Kerja
84 Statistik Kabupaten Alor 2014
Social - Education
Statistics of Alor Regency 2014 85
BAB VSOSIALSocial

Sosial - Pendidikan
86 Statistik Kabupaten Alor 2014

Social - Education
Statistics of Alor Regency 2014 87
BAB V.1PENDIDIKAN
Education

Sosial - Pendidikan
88 Statistik Kabupaten Alor 2014
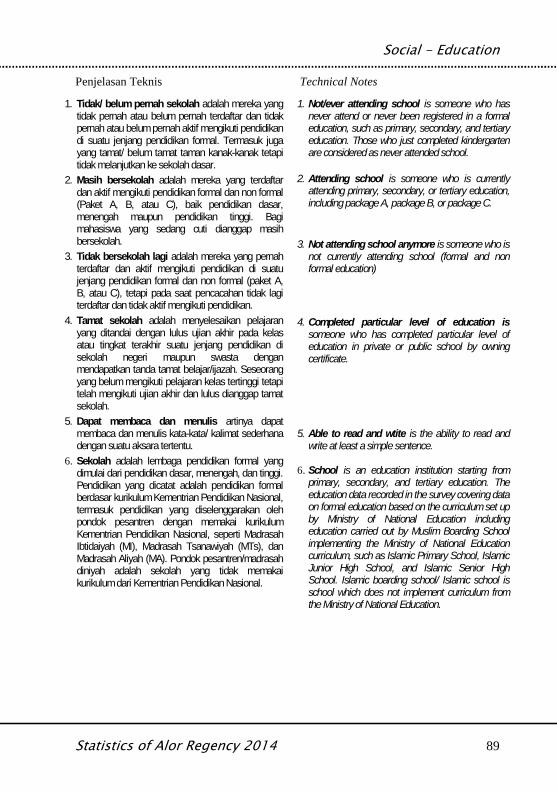
Social - Education
Statistics of Alor Regency 2014 89
Penjelasan Teknis Technical Notes
1. Tidak/ belum pernah sekolah adalah mereka yangtidak pernah atau belum pernah terdaftar dan tidakpernah atau belum pernah aktif mengikuti pendidikandi suatu jenjang pendidikan formal. Termasuk jugayang tamat/ belum tamat taman kanak-kanak tetapitidak melanjutkan ke sekolah dasar.
2. Masih bersekolah adalah mereka yang terdaftardan aktif mengikuti pendidikan formal dan non formal(Paket A, B, atau C), baik pendidikan dasar,menengah maupun pendidikan tinggi. Bagimahasiswa yang sedang cuti dianggap masihbersekolah.
3. Tidak bersekolah lagi adalah mereka yang pernahterdaftar dan aktif mengikuti pendidikan di suatujenjang pendidikan formal dan non formal (paket A,B, atau C), tetapi pada saat pencacahan tidak lagiterdaftar dan tidak aktif mengikuti pendidikan.
4. Tamat sekolah adalah menyelesaikan pelajaranyang ditandai dengan lulus ujian akhir pada kelasatau tingkat terakhir suatu jenjang pendidikan disekolah negeri maupun swasta denganmendapatkan tanda tamat belajar/ijazah. Seseorangyang belum mengikuti pelajaran kelas tertinggi tetapitelah mengikuti ujian akhir dan lulus dianggap tamatsekolah.
5. Dapat membaca dan menulis artinya dapatmembaca dan menulis kata-kata/ kalimat sederhanadengan suatu aksara tertentu.
6. Sekolah adalah lembaga pendidikan formal yangdimulai dari pendidikan dasar, menengah, dan tinggi.Pendidikan yang dicatat adalah pendidikan formalberdasar kurikulum Kementrian Pendidikan Nasional,termasuk pendidikan yang diselenggarakan olehpondok pesantren dengan memakai kurikulumKementrian Pendidikan Nasional, seperti MadrasahIbtidaiyah (MI), Madrasah Tsanawiyah (MTs), danMadrasah Aliyah (MA). Pondok pesantren/madrasahdiniyah adalah sekolah yang tidak memakaikurikulum dari Kementrian Pendidikan Nasional.
1. Not/ever attending school is someone who hasnever attend or never been registered in a formaleducation, such as primary, secondary, and tertiaryeducation. Those who just completed kindergartenare considered as never attended school.
2. Attending school is someone who is currentlyattending primary, secondary, or tertiary education,including package A, package B, or package C.
3. Not attending school anymore is someone who isnot currently attending school (formal and nonformal education)
4. Completed particular level of education issomeone who has completed particular level ofeducation in private or public school by owningcertificate.
5. Able to read and wtite is the ability to read andwrite at least a simple sentence.
6. School is an education institution starting fromprimary, secondary, and tertiary education. Theeducation data recorded in the survey covering dataon formal education based on the curriculum set upby Ministry of National Education includingeducation carried out by Muslim Boarding Schoolimplementing the Ministry of National Educationcurriculum, such as Islamic Primary School, IslamicJunior High School, and Islamic Senior HighSchool. Islamic boarding school/ Islamic school isschool which does not implement curriculum fromthe Ministry of National Education.
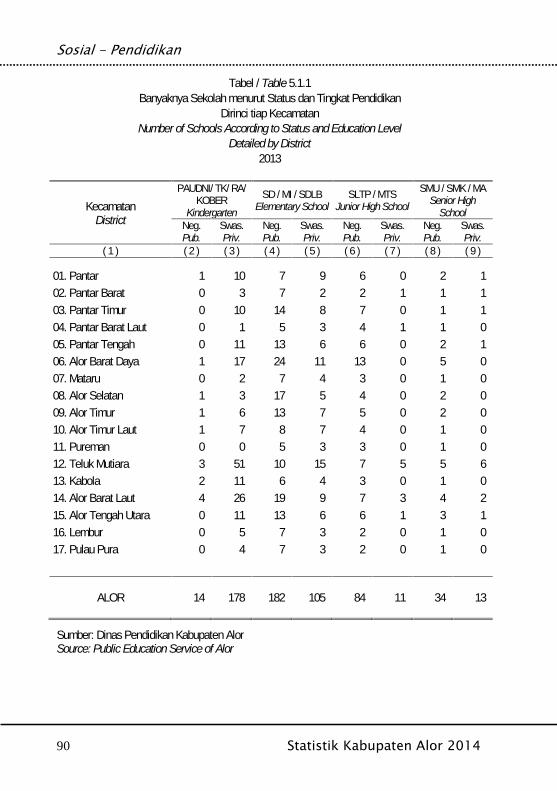
Sosial - Pendidikan
90 Statistik Kabupaten Alor 2014
Tabel / Table 5.1.1Banyaknya Sekolah menurut Status dan Tingkat Pendidikan
Dirinci tiap KecamatanNumber of Schools According to Status and Education Level
Detailed by District2013
KecamatanDistrict
PAUDNI/ TK/ RA/KOBER
Kindergarten
SD / MI / SDLBElementary School
SLTP / MTSJunior High School
SMU / SMK / MASenior High
SchoolNeg.Pub.
Swas.Priv.
Neg.Pub.
Swas.Priv.
Neg.Pub.
Swas.Priv.
Neg.Pub.
Swas.Priv.
( 1 ) ( 2 ) ( 3 ) ( 4 ) ( 5 ) ( 6 ) ( 7 ) ( 8 ) ( 9 )
01. Pantar 1 10 7 9 6 0 2 102. Pantar Barat 0 3 7 2 2 1 1 103. Pantar Timur 0 10 14 8 7 0 1 104. Pantar Barat Laut 0 1 5 3 4 1 1 005. Pantar Tengah 0 11 13 6 6 0 2 106. Alor Barat Daya 1 17 24 11 13 0 5 007. Mataru 0 2 7 4 3 0 1 008. Alor Selatan 1 3 17 5 4 0 2 009. Alor Timur 1 6 13 7 5 0 2 010. Alor Timur Laut 1 7 8 7 4 0 1 011. Pureman 0 0 5 3 3 0 1 012. Teluk Mutiara 3 51 10 15 7 5 5 613. Kabola 2 11 6 4 3 0 1 014. Alor Barat Laut 4 26 19 9 7 3 4 215. Alor Tengah Utara 0 11 13 6 6 1 3 116. Lembur 0 5 7 3 2 0 1 017. Pulau Pura 0 4 7 3 2 0 1 0
ALOR 14 178 182 105 84 11 34 13
Sumber: Dinas Pendidikan Kabupaten AlorSource: Public Education Service of Alor

Social - Education
Statistics of Alor Regency 2014 91
Tabel / Table 5.1.2Banyaknya Sekolah menurut Tingkat Pendidikan
Dirinci tiap Pulau di Kabupaten AlorNumber of School According to Education Level
Detailed by Island in Alor2013
PulauIsland
Banyaknya SekolahNumber of School
PAUDNI/ TK/ RA/KOBER
Kindergarten
SD / MIElementary
SMPJunior High
SMASenior High
UniversitasUniversity
Neg.Pub.
Swas.Priv.
Neg.Pub.
Swas.Priv.
Neg.Pub.
Swas.Priv.
Neg.Pub.
Swas.Priv.
Neg.Pub.
Swas.Priv.
( 1 ) ( 2 ) ( 3 ) ( 4 ) ( 5 ) ( 6 ) ( 7 ) ( 8 ) ( 9 ) ( 10 ) ( 11 )A. Pulau Besar (Big
Island)
1. Alor 13 136 126 73 56 8 26 9 0 0
2. Pantar 1 32 44 27 24 1 7 4 0 0
3. Pura 0 4 7 3 2 0 1 0 0 0
B. Pulau Kecil (SmallIsland)
1. Ternate 0 2 2 1 1 0 0 0 0 0
2. Buaya 0 1 1 0 0 0 0 0 0 0
3. Nuha Kepa 0 0 0 0 0 0 0 0 0 0
4. Tereweng 0 1 1 0 1 0 0 0 0 0
5. Kura 0 1 1 0 0 0 0 0 0 0
6. Kangge 0 1 0 1 0 1 0 0 0 0
ALOR 14 178 182 105 84 11 34 13 0 0
Sumber: Dinas Pendidikan Kabupaten AlorSource: Public Education Service of Alor
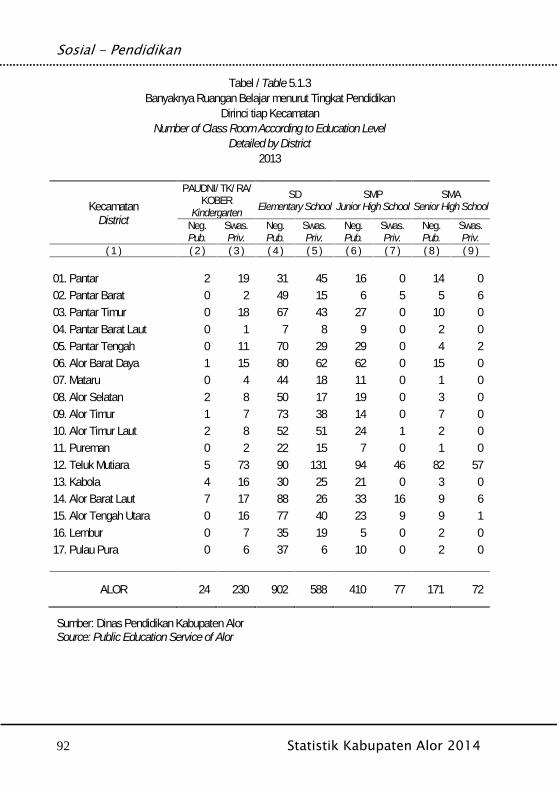
Sosial - Pendidikan
92 Statistik Kabupaten Alor 2014
Tabel / Table 5.1.3Banyaknya Ruangan Belajar menurut Tingkat Pendidikan
Dirinci tiap KecamatanNumber of Class Room According to Education Level
Detailed by District2013
KecamatanDistrict
PAUDNI/ TK/ RA/KOBER
Kindergarten
SDElementary School
SMPJunior High School
SMASenior High School
Neg.Pub.
Swas.Priv.
Neg.Pub.
Swas.Priv.
Neg.Pub.
Swas.Priv.
Neg.Pub.
Swas.Priv.
( 1 ) ( 2 ) ( 3 ) ( 4 ) ( 5 ) ( 6 ) ( 7 ) ( 8 ) ( 9 )
01. Pantar 2 19 31 45 16 0 14 002. Pantar Barat 0 2 49 15 6 5 5 603. Pantar Timur 0 18 67 43 27 0 10 004. Pantar Barat Laut 0 1 7 8 9 0 2 005. Pantar Tengah 0 11 70 29 29 0 4 206. Alor Barat Daya 1 15 80 62 62 0 15 007. Mataru 0 4 44 18 11 0 1 008. Alor Selatan 2 8 50 17 19 0 3 009. Alor Timur 1 7 73 38 14 0 7 010. Alor Timur Laut 2 8 52 51 24 1 2 011. Pureman 0 2 22 15 7 0 1 012. Teluk Mutiara 5 73 90 131 94 46 82 5713. Kabola 4 16 30 25 21 0 3 014. Alor Barat Laut 7 17 88 26 33 16 9 615. Alor Tengah Utara 0 16 77 40 23 9 9 116. Lembur 0 7 35 19 5 0 2 017. Pulau Pura 0 6 37 6 10 0 2 0
ALOR 24 230 902 588 410 77 171 72
Sumber: Dinas Pendidikan Kabupaten AlorSource: Public Education Service of Alor
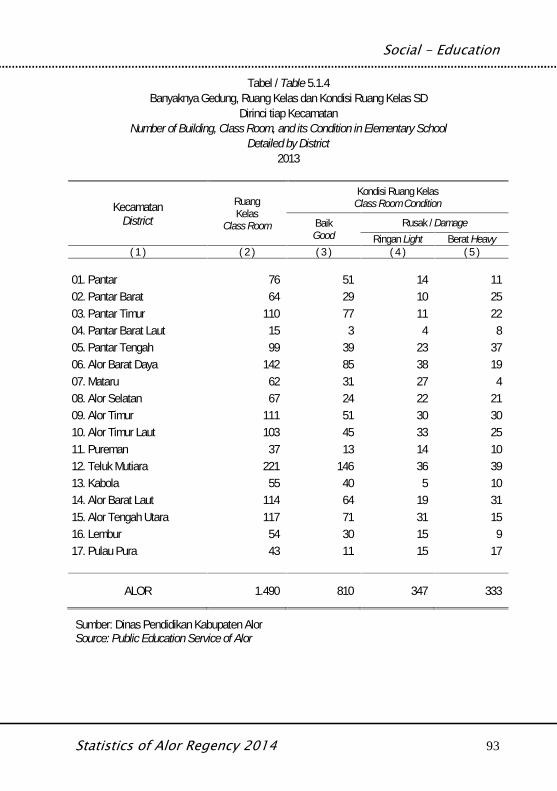
Social - Education
Statistics of Alor Regency 2014 93
Tabel / Table 5.1.4Banyaknya Gedung, Ruang Kelas dan Kondisi Ruang Kelas SD
Dirinci tiap KecamatanNumber of Building, Class Room, and its Condition in Elementary School
Detailed by District2013
KecamatanDistrict
RuangKelas
Class Room
Kondisi Ruang KelasClass Room Condition
BaikGood
Rusak / DamageRingan Light Berat Heavy
( 1 ) ( 2 ) ( 3 ) ( 4 ) ( 5 )
01. Pantar 76 51 14 1102. Pantar Barat 64 29 10 2503. Pantar Timur 110 77 11 2204. Pantar Barat Laut 15 3 4 805. Pantar Tengah 99 39 23 3706. Alor Barat Daya 142 85 38 1907. Mataru 62 31 27 408. Alor Selatan 67 24 22 2109. Alor Timur 111 51 30 3010. Alor Timur Laut 103 45 33 2511. Pureman 37 13 14 1012. Teluk Mutiara 221 146 36 3913. Kabola 55 40 5 1014. Alor Barat Laut 114 64 19 3115. Alor Tengah Utara 117 71 31 1516. Lembur 54 30 15 917. Pulau Pura 43 11 15 17
ALOR 1.490 810 347 333
Sumber: Dinas Pendidikan Kabupaten AlorSource: Public Education Service of Alor
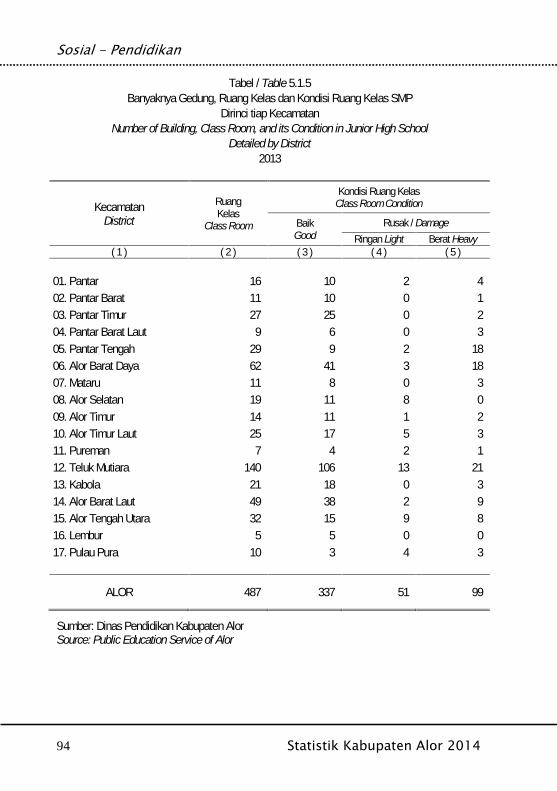
Sosial - Pendidikan
94 Statistik Kabupaten Alor 2014
Tabel / Table 5.1.5Banyaknya Gedung, Ruang Kelas dan Kondisi Ruang Kelas SMP
Dirinci tiap KecamatanNumber of Building, Class Room, and its Condition in Junior High School
Detailed by District2013
KecamatanDistrict
RuangKelas
Class Room
Kondisi Ruang KelasClass Room Condition
BaikGood
Rusak / DamageRingan Light Berat Heavy
( 1 ) ( 2 ) ( 3 ) ( 4 ) ( 5 )
01. Pantar 16 10 2 402. Pantar Barat 11 10 0 103. Pantar Timur 27 25 0 204. Pantar Barat Laut 9 6 0 305. Pantar Tengah 29 9 2 1806. Alor Barat Daya 62 41 3 1807. Mataru 11 8 0 308. Alor Selatan 19 11 8 009. Alor Timur 14 11 1 210. Alor Timur Laut 25 17 5 311. Pureman 7 4 2 112. Teluk Mutiara 140 106 13 2113. Kabola 21 18 0 314. Alor Barat Laut 49 38 2 915. Alor Tengah Utara 32 15 9 816. Lembur 5 5 0 017. Pulau Pura 10 3 4 3
ALOR 487 337 51 99
Sumber: Dinas Pendidikan Kabupaten AlorSource: Public Education Service of Alor
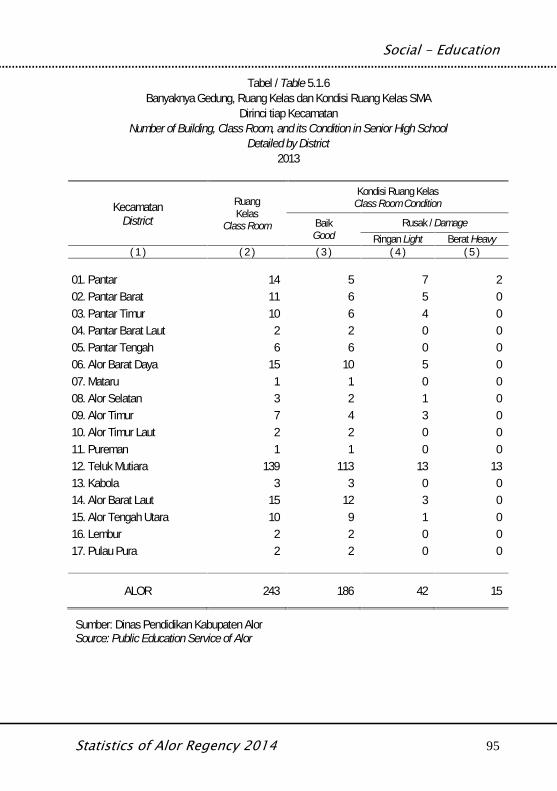
Social - Education
Statistics of Alor Regency 2014 95
Tabel / Table 5.1.6Banyaknya Gedung, Ruang Kelas dan Kondisi Ruang Kelas SMA
Dirinci tiap KecamatanNumber of Building, Class Room, and its Condition in Senior High School
Detailed by District2013
KecamatanDistrict
RuangKelas
Class Room
Kondisi Ruang KelasClass Room Condition
BaikGood
Rusak / DamageRingan Light Berat Heavy
( 1 ) ( 2 ) ( 3 ) ( 4 ) ( 5 )
01. Pantar 14 5 7 202. Pantar Barat 11 6 5 003. Pantar Timur 10 6 4 004. Pantar Barat Laut 2 2 0 005. Pantar Tengah 6 6 0 006. Alor Barat Daya 15 10 5 007. Mataru 1 1 0 008. Alor Selatan 3 2 1 009. Alor Timur 7 4 3 010. Alor Timur Laut 2 2 0 011. Pureman 1 1 0 012. Teluk Mutiara 139 113 13 1313. Kabola 3 3 0 014. Alor Barat Laut 15 12 3 015. Alor Tengah Utara 10 9 1 016. Lembur 2 2 0 017. Pulau Pura 2 2 0 0
ALOR 243 186 42 15
Sumber: Dinas Pendidikan Kabupaten AlorSource: Public Education Service of Alor
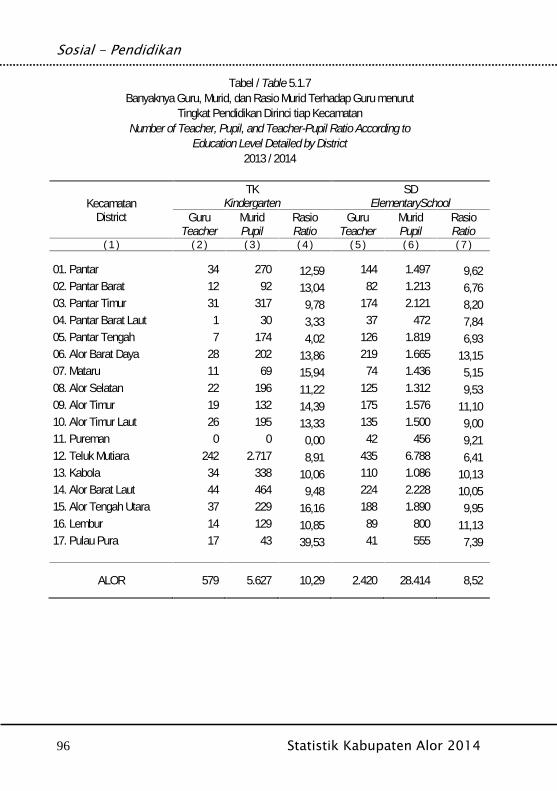
Sosial - Pendidikan
96 Statistik Kabupaten Alor 2014
Tabel / Table 5.1.7Banyaknya Guru, Murid, dan Rasio Murid Terhadap Guru menurut
Tingkat Pendidikan Dirinci tiap KecamatanNumber of Teacher, Pupil, and Teacher-Pupil Ratio According to
Education Level Detailed by District2013 / 2014
KecamatanDistrict
TKKindergarten
SDElementarySchool
GuruTeacher
MuridPupil
RasioRatio
GuruTeacher
MuridPupil
RasioRatio
( 1 ) ( 2 ) ( 3 ) ( 4 ) ( 5 ) ( 6 ) ( 7 )
01. Pantar 34 270 12,59 144 1.497 9,6202. Pantar Barat 12 92 13,04 82 1.213 6,7603. Pantar Timur 31 317 9,78 174 2.121 8,2004. Pantar Barat Laut 1 30 3,33 37 472 7,8405. Pantar Tengah 7 174 4,02 126 1.819 6,9306. Alor Barat Daya 28 202 13,86 219 1.665 13,1507. Mataru 11 69 15,94 74 1.436 5,1508. Alor Selatan 22 196 11,22 125 1.312 9,5309. Alor Timur 19 132 14,39 175 1.576 11,1010. Alor Timur Laut 26 195 13,33 135 1.500 9,0011. Pureman 0 0 0,00 42 456 9,2112. Teluk Mutiara 242 2.717 8,91 435 6.788 6,4113. Kabola 34 338 10,06 110 1.086 10,1314. Alor Barat Laut 44 464 9,48 224 2.228 10,0515. Alor Tengah Utara 37 229 16,16 188 1.890 9,9516. Lembur 14 129 10,85 89 800 11,1317. Pulau Pura 17 43 39,53 41 555 7,39
ALOR 579 5.627 10,29 2.420 28.414 8,52
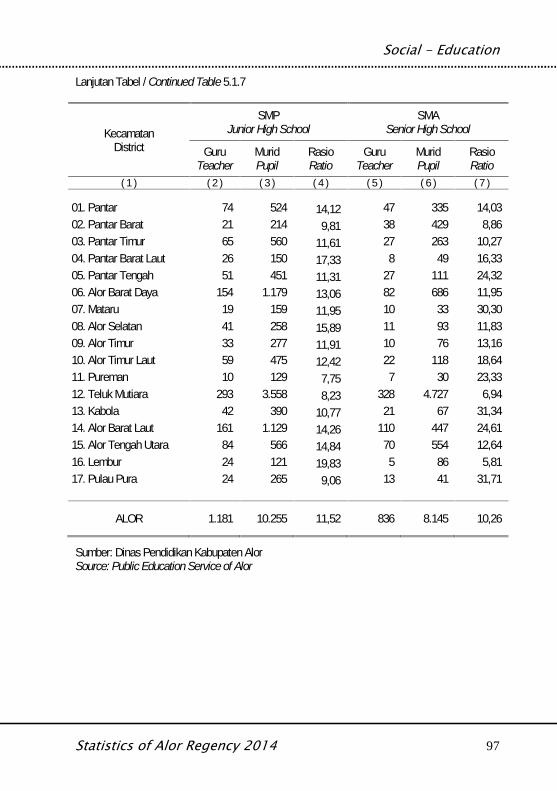
Social - Education
Statistics of Alor Regency 2014 97
Lanjutan Tabel / Continued Table 5.1.7
KecamatanDistrict
SMPJunior High School
SMASenior High School
GuruTeacher
MuridPupil
RasioRatio
GuruTeacher
MuridPupil
RasioRatio
( 1 ) ( 2 ) ( 3 ) ( 4 ) ( 5 ) ( 6 ) ( 7 )
01. Pantar 74 524 14,12 47 335 14,0302. Pantar Barat 21 214 9,81 38 429 8,8603. Pantar Timur 65 560 11,61 27 263 10,2704. Pantar Barat Laut 26 150 17,33 8 49 16,3305. Pantar Tengah 51 451 11,31 27 111 24,3206. Alor Barat Daya 154 1.179 13,06 82 686 11,9507. Mataru 19 159 11,95 10 33 30,3008. Alor Selatan 41 258 15,89 11 93 11,8309. Alor Timur 33 277 11,91 10 76 13,1610. Alor Timur Laut 59 475 12,42 22 118 18,6411. Pureman 10 129 7,75 7 30 23,3312. Teluk Mutiara 293 3.558 8,23 328 4.727 6,9413. Kabola 42 390 10,77 21 67 31,3414. Alor Barat Laut 161 1.129 14,26 110 447 24,6115. Alor Tengah Utara 84 566 14,84 70 554 12,6416. Lembur 24 121 19,83 5 86 5,8117. Pulau Pura 24 265 9,06 13 41 31,71
ALOR 1.181 10.255 11,52 836 8.145 10,26
Sumber: Dinas Pendidikan Kabupaten AlorSource: Public Education Service of Alor
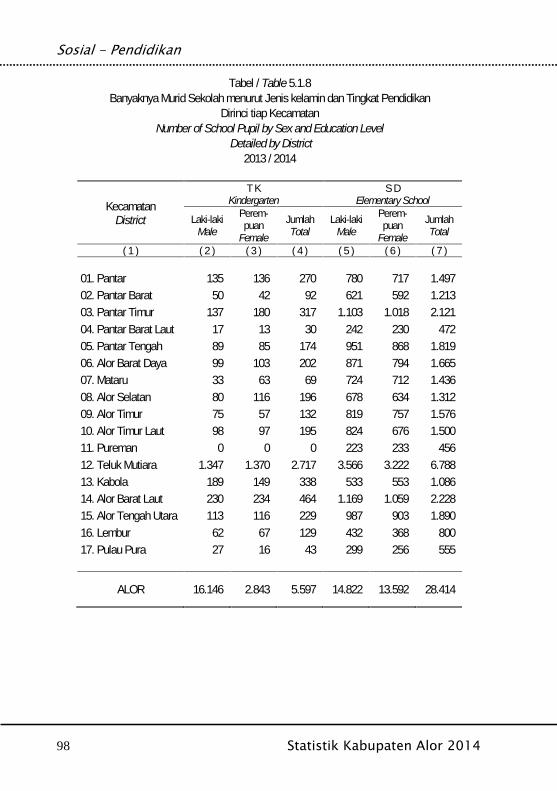
Sosial - Pendidikan
98 Statistik Kabupaten Alor 2014
Tabel / Table 5.1.8Banyaknya Murid Sekolah menurut Jenis kelamin dan Tingkat Pendidikan
Dirinci tiap KecamatanNumber of School Pupil by Sex and Education Level
Detailed by District2013 / 2014
KecamatanDistrict
T KKindergarten
S DElementary School
Laki-lakiMale
Perem-puan
Female
JumlahTotal
Laki-lakiMale
Perem-puan
Female
JumlahTotal
( 1 ) ( 2 ) ( 3 ) ( 4 ) ( 5 ) ( 6 ) ( 7 )
01. Pantar 135 136 270 780 717 1.49702. Pantar Barat 50 42 92 621 592 1.21303. Pantar Timur 137 180 317 1.103 1.018 2.12104. Pantar Barat Laut 17 13 30 242 230 47205. Pantar Tengah 89 85 174 951 868 1.81906. Alor Barat Daya 99 103 202 871 794 1.66507. Mataru 33 63 69 724 712 1.43608. Alor Selatan 80 116 196 678 634 1.31209. Alor Timur 75 57 132 819 757 1.57610. Alor Timur Laut 98 97 195 824 676 1.50011. Pureman 0 0 0 223 233 45612. Teluk Mutiara 1.347 1.370 2.717 3.566 3.222 6.78813. Kabola 189 149 338 533 553 1.08614. Alor Barat Laut 230 234 464 1.169 1.059 2.22815. Alor Tengah Utara 113 116 229 987 903 1.89016. Lembur 62 67 129 432 368 80017. Pulau Pura 27 16 43 299 256 555
ALOR 16.146 2.843 5.597 14.822 13.592 28.414
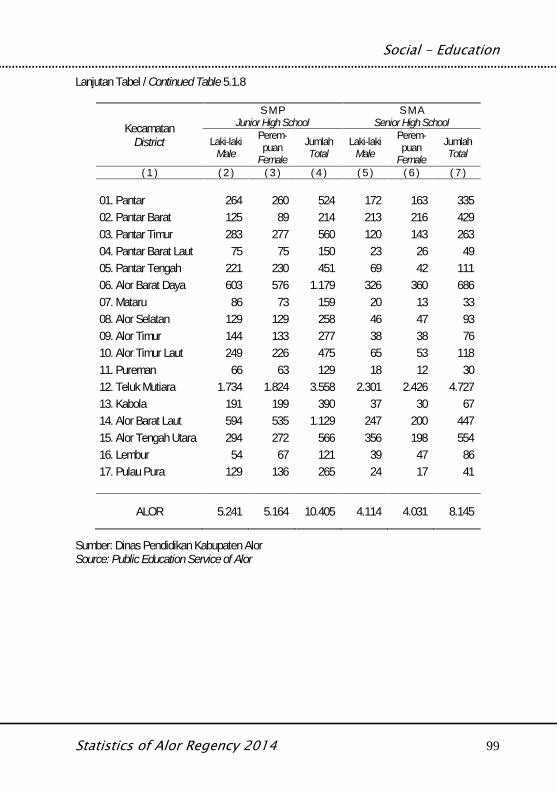
Social - Education
Statistics of Alor Regency 2014 99
Lanjutan Tabel / Continued Table 5.1.8
KecamatanDistrict
S M PJunior High School
S M ASenior High School
Laki-lakiMale
Perem-puan
Female
JumlahTotal
Laki-lakiMale
Perem-puan
Female
JumlahTotal
( 1 ) ( 2 ) ( 3 ) ( 4 ) ( 5 ) ( 6 ) ( 7 )
01. Pantar 264 260 524 172 163 33502. Pantar Barat 125 89 214 213 216 42903. Pantar Timur 283 277 560 120 143 26304. Pantar Barat Laut 75 75 150 23 26 4905. Pantar Tengah 221 230 451 69 42 11106. Alor Barat Daya 603 576 1.179 326 360 68607. Mataru 86 73 159 20 13 3308. Alor Selatan 129 129 258 46 47 9309. Alor Timur 144 133 277 38 38 7610. Alor Timur Laut 249 226 475 65 53 11811. Pureman 66 63 129 18 12 3012. Teluk Mutiara 1.734 1.824 3.558 2.301 2.426 4.72713. Kabola 191 199 390 37 30 6714. Alor Barat Laut 594 535 1.129 247 200 44715. Alor Tengah Utara 294 272 566 356 198 55416. Lembur 54 67 121 39 47 8617. Pulau Pura 129 136 265 24 17 41
ALOR 5.241 5.164 10.405 4.114 4.031 8.145
Sumber: Dinas Pendidikan Kabupaten AlorSource: Public Education Service of Alor
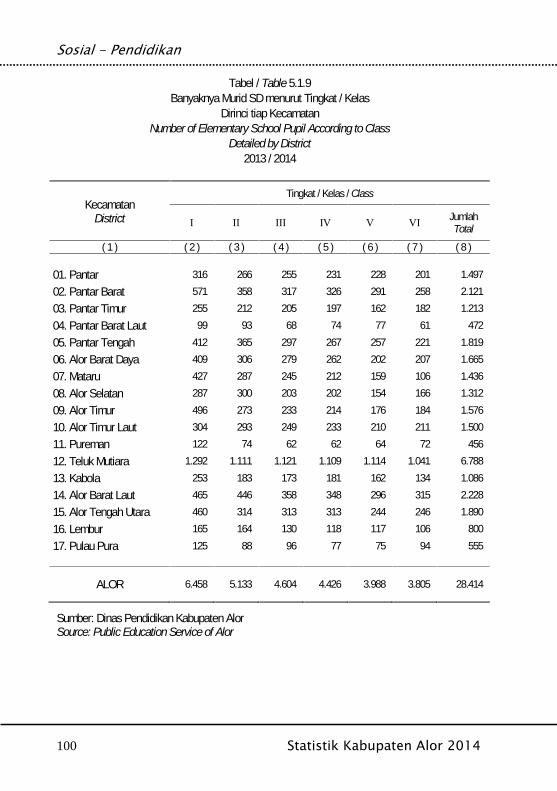
Sosial - Pendidikan
100 Statistik Kabupaten Alor 2014
Tabel / Table 5.1.9Banyaknya Murid SD menurut Tingkat / Kelas
Dirinci tiap KecamatanNumber of Elementary School Pupil According to Class
Detailed by District2013 / 2014
KecamatanDistrict
Tingkat / Kelas / Class
I II III IV V VIJumlahTotal
( 1 ) ( 2 ) ( 3 ) ( 4 ) ( 5 ) ( 6 ) ( 7 ) ( 8 )
01. Pantar 316 266 255 231 228 201 1.49702. Pantar Barat 571 358 317 326 291 258 2.12103. Pantar Timur 255 212 205 197 162 182 1.21304. Pantar Barat Laut 99 93 68 74 77 61 47205. Pantar Tengah 412 365 297 267 257 221 1.81906. Alor Barat Daya 409 306 279 262 202 207 1.66507. Mataru 427 287 245 212 159 106 1.43608. Alor Selatan 287 300 203 202 154 166 1.31209. Alor Timur 496 273 233 214 176 184 1.57610. Alor Timur Laut 304 293 249 233 210 211 1.50011. Pureman 122 74 62 62 64 72 45612. Teluk Mutiara 1.292 1.111 1.121 1.109 1.114 1.041 6.78813. Kabola 253 183 173 181 162 134 1.08614. Alor Barat Laut 465 446 358 348 296 315 2.22815. Alor Tengah Utara 460 314 313 313 244 246 1.89016. Lembur 165 164 130 118 117 106 80017. Pulau Pura 125 88 96 77 75 94 555
ALOR 6.458 5.133 4.604 4.426 3.988 3.805 28.414
Sumber: Dinas Pendidikan Kabupaten AlorSource: Public Education Service of Alor
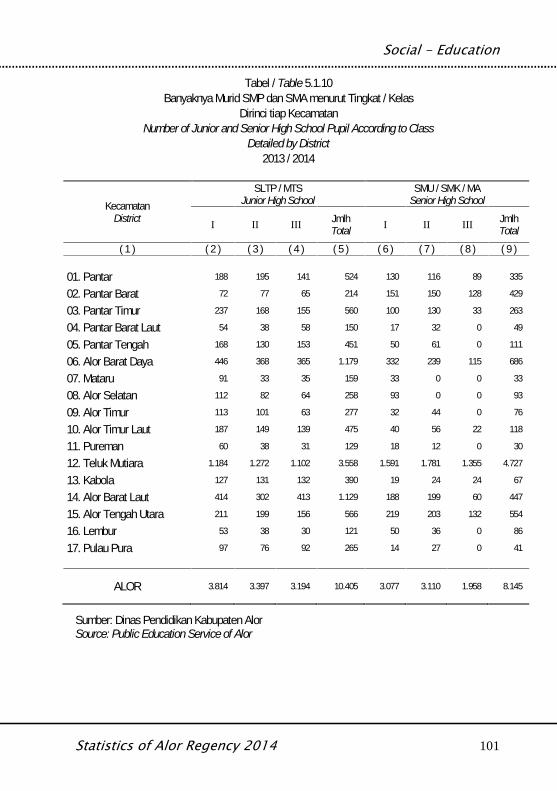
Social - Education
Statistics of Alor Regency 2014 101
Tabel / Table 5.1.10Banyaknya Murid SMP dan SMA menurut Tingkat / Kelas
Dirinci tiap KecamatanNumber of Junior and Senior High School Pupil According to Class
Detailed by District2013 / 2014
KecamatanDistrict
SLTP / MTSJunior High School
SMU / SMK / MASenior High School
I II III JmlhTotal I II III Jmlh
Total
( 1 ) ( 2 ) ( 3 ) ( 4 ) ( 5 ) ( 6 ) ( 7 ) ( 8 ) ( 9 )
01. Pantar 188 195 141 524 130 116 89 335
02. Pantar Barat 72 77 65 214 151 150 128 429
03. Pantar Timur 237 168 155 560 100 130 33 263
04. Pantar Barat Laut 54 38 58 150 17 32 0 49
05. Pantar Tengah 168 130 153 451 50 61 0 111
06. Alor Barat Daya 446 368 365 1.179 332 239 115 686
07. Mataru 91 33 35 159 33 0 0 33
08. Alor Selatan 112 82 64 258 93 0 0 93
09. Alor Timur 113 101 63 277 32 44 0 76
10. Alor Timur Laut 187 149 139 475 40 56 22 118
11. Pureman 60 38 31 129 18 12 0 30
12. Teluk Mutiara 1.184 1.272 1.102 3.558 1.591 1.781 1.355 4.727
13. Kabola 127 131 132 390 19 24 24 67
14. Alor Barat Laut 414 302 413 1.129 188 199 60 447
15. Alor Tengah Utara 211 199 156 566 219 203 132 554
16. Lembur 53 38 30 121 50 36 0 86
17. Pulau Pura 97 76 92 265 14 27 0 41
ALOR 3.814 3.397 3.194 10.405 3.077 3.110 1.958 8.145
Sumber: Dinas Pendidikan Kabupaten AlorSource: Public Education Service of Alor
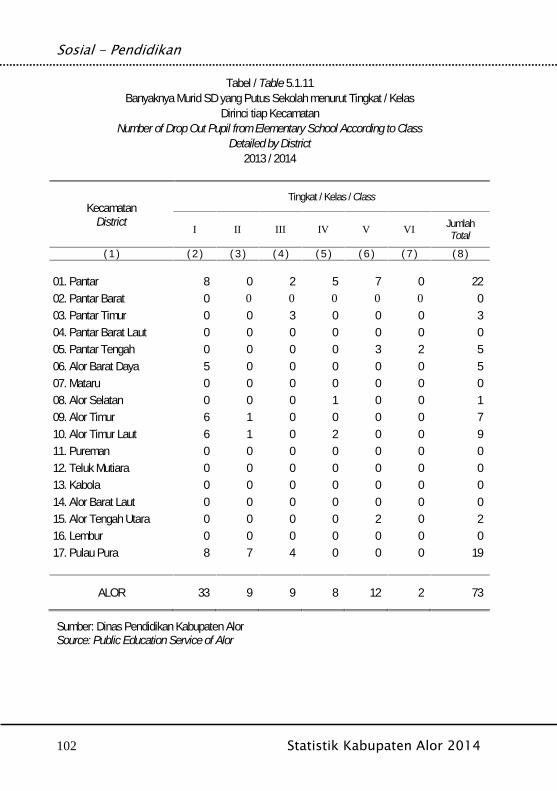
Sosial - Pendidikan
102 Statistik Kabupaten Alor 2014
Tabel / Table 5.1.11Banyaknya Murid SD yang Putus Sekolah menurut Tingkat / Kelas
Dirinci tiap KecamatanNumber of Drop Out Pupil from Elementary School According to Class
Detailed by District2013 / 2014
KecamatanDistrict
Tingkat / Kelas / Class
I II III IV V VI JumlahTotal
( 1 ) ( 2 ) ( 3 ) ( 4 ) ( 5 ) ( 6 ) ( 7 ) ( 8 )
01. Pantar 8 0 2 5 7 0 2202. Pantar Barat 0 0 0 0 0 0 003. Pantar Timur 0 0 3 0 0 0 304. Pantar Barat Laut 0 0 0 0 0 0 005. Pantar Tengah 0 0 0 0 3 2 506. Alor Barat Daya 5 0 0 0 0 0 507. Mataru 0 0 0 0 0 0 008. Alor Selatan 0 0 0 1 0 0 109. Alor Timur 6 1 0 0 0 0 710. Alor Timur Laut 6 1 0 2 0 0 911. Pureman 0 0 0 0 0 0 012. Teluk Mutiara 0 0 0 0 0 0 013. Kabola 0 0 0 0 0 0 014. Alor Barat Laut 0 0 0 0 0 0 015. Alor Tengah Utara 0 0 0 0 2 0 216. Lembur 0 0 0 0 0 0 017. Pulau Pura 8 7 4 0 0 0 19
ALOR 33 9 9 8 12 2 73
Sumber: Dinas Pendidikan Kabupaten AlorSource: Public Education Service of Alor
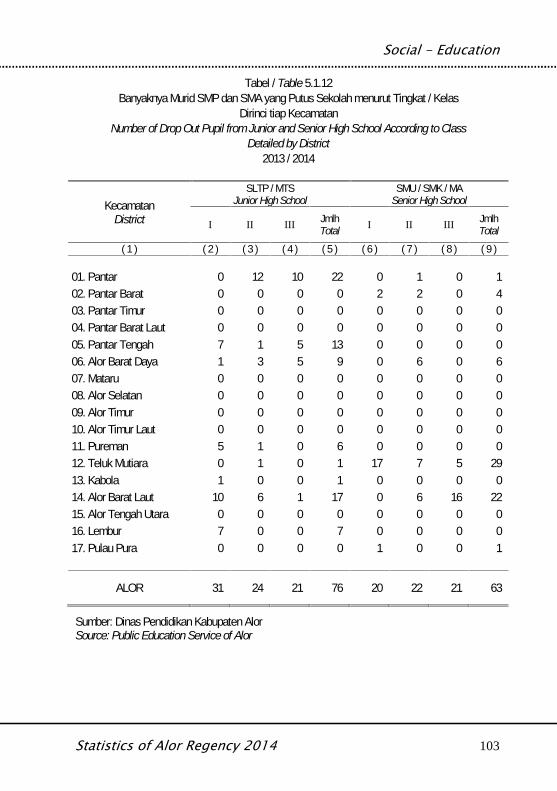
Social - Education
Statistics of Alor Regency 2014 103
Tabel / Table 5.1.12Banyaknya Murid SMP dan SMA yang Putus Sekolah menurut Tingkat / Kelas
Dirinci tiap KecamatanNumber of Drop Out Pupil from Junior and Senior High School According to Class
Detailed by District2013 / 2014
KecamatanDistrict
SLTP / MTSJunior High School
SMU / SMK / MASenior High School
I II III JmlhTotal I II III Jmlh
Total
( 1 ) ( 2 ) ( 3 ) ( 4 ) ( 5 ) ( 6 ) ( 7 ) ( 8 ) ( 9 )
01. Pantar 0 12 10 22 0 1 0 102. Pantar Barat 0 0 0 0 2 2 0 403. Pantar Timur 0 0 0 0 0 0 0 004. Pantar Barat Laut 0 0 0 0 0 0 0 005. Pantar Tengah 7 1 5 13 0 0 0 006. Alor Barat Daya 1 3 5 9 0 6 0 607. Mataru 0 0 0 0 0 0 0 008. Alor Selatan 0 0 0 0 0 0 0 009. Alor Timur 0 0 0 0 0 0 0 010. Alor Timur Laut 0 0 0 0 0 0 0 011. Pureman 5 1 0 6 0 0 0 012. Teluk Mutiara 0 1 0 1 17 7 5 2913. Kabola 1 0 0 1 0 0 0 014. Alor Barat Laut 10 6 1 17 0 6 16 2215. Alor Tengah Utara 0 0 0 0 0 0 0 016. Lembur 7 0 0 7 0 0 0 017. Pulau Pura 0 0 0 0 1 0 0 1
ALOR 31 24 21 76 20 22 21 63
Sumber: Dinas Pendidikan Kabupaten AlorSource: Public Education Service of Alor
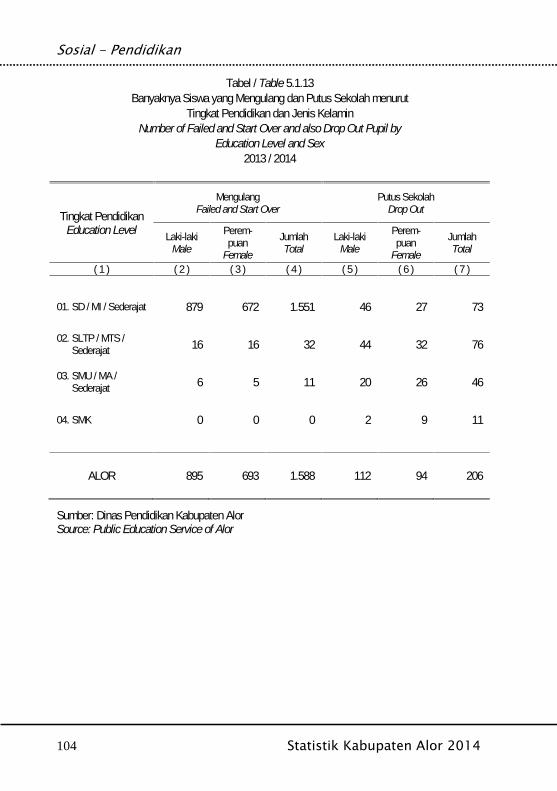
Sosial - Pendidikan
104 Statistik Kabupaten Alor 2014
Tabel / Table 5.1.13Banyaknya Siswa yang Mengulang dan Putus Sekolah menurut
Tingkat Pendidikan dan Jenis KelaminNumber of Failed and Start Over and also Drop Out Pupil by
Education Level and Sex2013 / 2014
Tingkat PendidikanEducation Level
MengulangFailed and Start Over
Putus SekolahDrop Out
Laki-lakiMale
Perem-puan
Female
JumlahTotal
Laki-lakiMale
Perem-puan
Female
JumlahTotal
( 1 ) ( 2 ) ( 3 ) ( 4 ) ( 5 ) ( 6 ) ( 7 )
01. SD / MI / Sederajat 879 672 1.551 46 27 73
02. SLTP / MTS /Sederajat 16 16 32 44 32 76
03. SMU / MA /Sederajat 6 5 11 20 26 46
04. SMK 0 0 0 2 9 11
ALOR 895 693 1.588 112 94 206
Sumber: Dinas Pendidikan Kabupaten AlorSource: Public Education Service of Alor
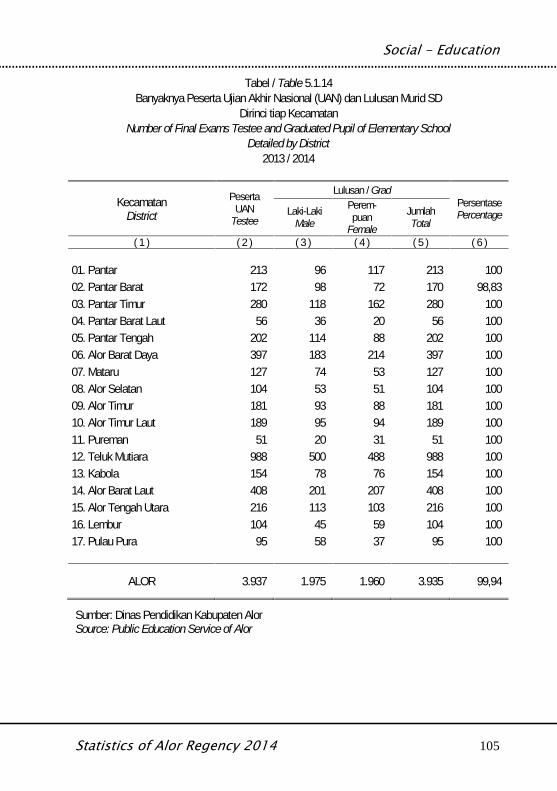
Social - Education
Statistics of Alor Regency 2014 105
Tabel / Table 5.1.14Banyaknya Peserta Ujian Akhir Nasional (UAN) dan Lulusan Murid SD
Dirinci tiap KecamatanNumber of Final Exams Testee and Graduated Pupil of Elementary School
Detailed by District2013 / 2014
KecamatanDistrict
PesertaUAN
Testee
Lulusan / GradPersentasePercentageLaki-Laki
Male
Perem-puan
Female
JumlahTotal
( 1 ) ( 2 ) ( 3 ) ( 4 ) ( 5 ) ( 6 )
01. Pantar 213 96 117 213 10002. Pantar Barat 172 98 72 170 98,8303. Pantar Timur 280 118 162 280 10004. Pantar Barat Laut 56 36 20 56 10005. Pantar Tengah 202 114 88 202 10006. Alor Barat Daya 397 183 214 397 10007. Mataru 127 74 53 127 10008. Alor Selatan 104 53 51 104 10009. Alor Timur 181 93 88 181 10010. Alor Timur Laut 189 95 94 189 10011. Pureman 51 20 31 51 10012. Teluk Mutiara 988 500 488 988 10013. Kabola 154 78 76 154 10014. Alor Barat Laut 408 201 207 408 10015. Alor Tengah Utara 216 113 103 216 10016. Lembur 104 45 59 104 10017. Pulau Pura 95 58 37 95 100
ALOR 3.937 1.975 1.960 3.935 99,94
Sumber: Dinas Pendidikan Kabupaten AlorSource: Public Education Service of Alor
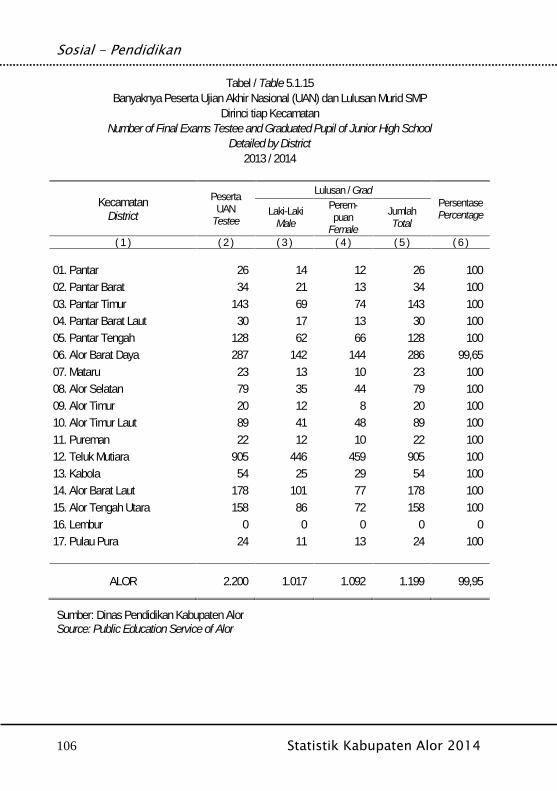
Sosial - Pendidikan
106 Statistik Kabupaten Alor 2014
Tabel / Table 5.1.15Banyaknya Peserta Ujian Akhir Nasional (UAN) dan Lulusan Murid SMP
Dirinci tiap KecamatanNumber of Final Exams Testee and Graduated Pupil of Junior High School
Detailed by District2013 / 2014
KecamatanDistrict
PesertaUAN
Testee
Lulusan / GradPersentasePercentageLaki-Laki
Male
Perem-puan
Female
JumlahTotal
( 1 ) ( 2 ) ( 3 ) ( 4 ) ( 5 ) ( 6 )
01. Pantar 26 14 12 26 10002. Pantar Barat 34 21 13 34 10003. Pantar Timur 143 69 74 143 10004. Pantar Barat Laut 30 17 13 30 10005. Pantar Tengah 128 62 66 128 10006. Alor Barat Daya 287 142 144 286 99,6507. Mataru 23 13 10 23 10008. Alor Selatan 79 35 44 79 10009. Alor Timur 20 12 8 20 10010. Alor Timur Laut 89 41 48 89 10011. Pureman 22 12 10 22 10012. Teluk Mutiara 905 446 459 905 10013. Kabola 54 25 29 54 10014. Alor Barat Laut 178 101 77 178 10015. Alor Tengah Utara 158 86 72 158 10016. Lembur 0 0 0 0 017. Pulau Pura 24 11 13 24 100
ALOR 2.200 1.017 1.092 1.199 99,95
Sumber: Dinas Pendidikan Kabupaten AlorSource: Public Education Service of Alor
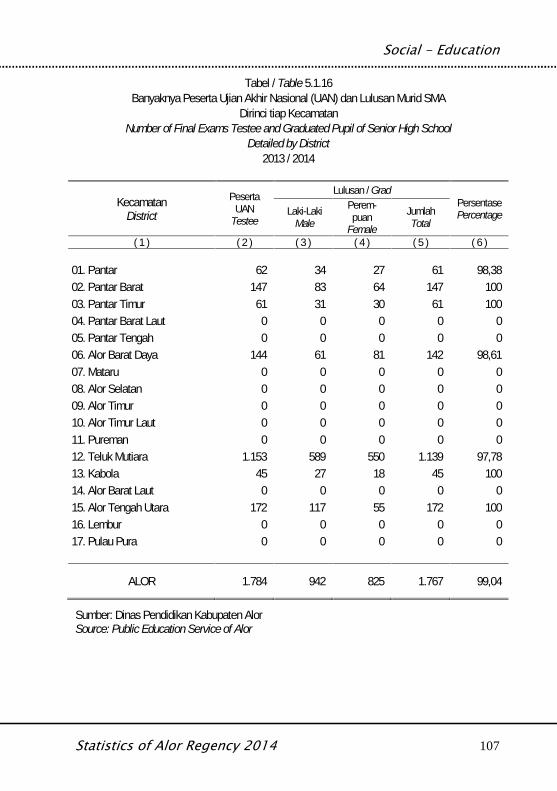
Social - Education
Statistics of Alor Regency 2014 107
Tabel / Table 5.1.16Banyaknya Peserta Ujian Akhir Nasional (UAN) dan Lulusan Murid SMA
Dirinci tiap KecamatanNumber of Final Exams Testee and Graduated Pupil of Senior High School
Detailed by District2013 / 2014
KecamatanDistrict
PesertaUAN
Testee
Lulusan / GradPersentasePercentageLaki-Laki
Male
Perem-puan
Female
JumlahTotal
( 1 ) ( 2 ) ( 3 ) ( 4 ) ( 5 ) ( 6 )
01. Pantar 62 34 27 61 98,3802. Pantar Barat 147 83 64 147 10003. Pantar Timur 61 31 30 61 10004. Pantar Barat Laut 0 0 0 0 005. Pantar Tengah 0 0 0 0 006. Alor Barat Daya 144 61 81 142 98,6107. Mataru 0 0 0 0 008. Alor Selatan 0 0 0 0 009. Alor Timur 0 0 0 0 010. Alor Timur Laut 0 0 0 0 011. Pureman 0 0 0 0 012. Teluk Mutiara 1.153 589 550 1.139 97,7813. Kabola 45 27 18 45 10014. Alor Barat Laut 0 0 0 0 015. Alor Tengah Utara 172 117 55 172 10016. Lembur 0 0 0 0 017. Pulau Pura 0 0 0 0 0
ALOR 1.784 942 825 1.767 99,04
Sumber: Dinas Pendidikan Kabupaten AlorSource: Public Education Service of Alor
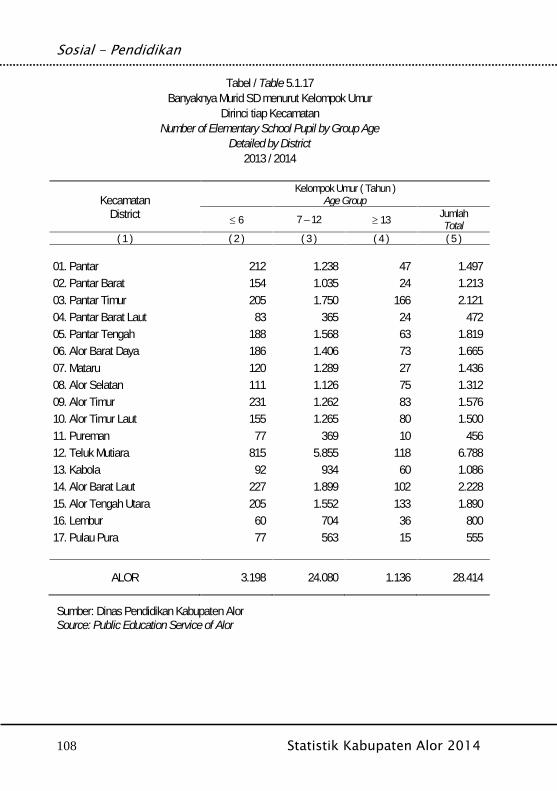
Sosial - Pendidikan
108 Statistik Kabupaten Alor 2014
Tabel / Table 5.1.17Banyaknya Murid SD menurut Kelompok Umur
Dirinci tiap KecamatanNumber of Elementary School Pupil by Group Age
Detailed by District2013 / 2014
KecamatanDistrict
Kelompok Umur ( Tahun )Age Group
6 7 – 12 13 JumlahTotal
( 1 ) ( 2 ) ( 3 ) ( 4 ) ( 5 )
01. Pantar 212 1.238 47 1.49702. Pantar Barat 154 1.035 24 1.21303. Pantar Timur 205 1.750 166 2.12104. Pantar Barat Laut 83 365 24 47205. Pantar Tengah 188 1.568 63 1.81906. Alor Barat Daya 186 1.406 73 1.66507. Mataru 120 1.289 27 1.43608. Alor Selatan 111 1.126 75 1.31209. Alor Timur 231 1.262 83 1.57610. Alor Timur Laut 155 1.265 80 1.50011. Pureman 77 369 10 45612. Teluk Mutiara 815 5.855 118 6.78813. Kabola 92 934 60 1.08614. Alor Barat Laut 227 1.899 102 2.22815. Alor Tengah Utara 205 1.552 133 1.89016. Lembur 60 704 36 80017. Pulau Pura 77 563 15 555
ALOR 3.198 24.080 1.136 28.414
Sumber: Dinas Pendidikan Kabupaten AlorSource: Public Education Service of Alor
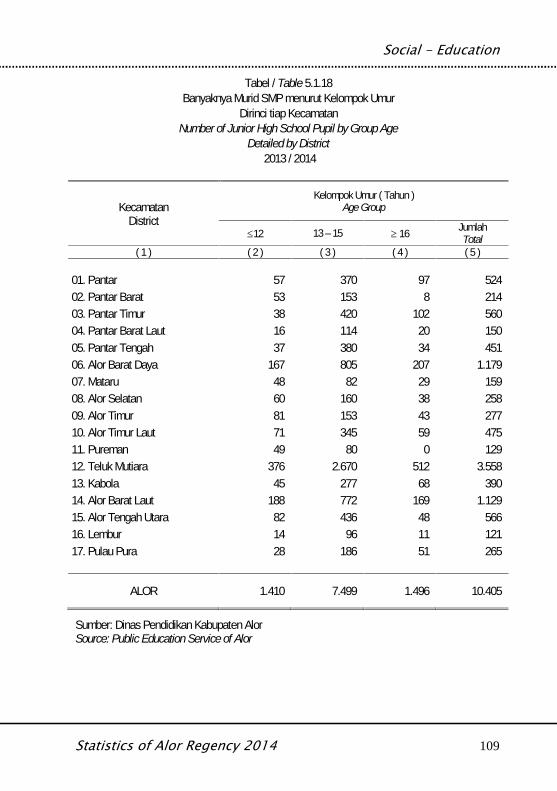
Social - Education
Statistics of Alor Regency 2014 109
Tabel / Table 5.1.18Banyaknya Murid SMP menurut Kelompok Umur
Dirinci tiap KecamatanNumber of Junior High School Pupil by Group Age
Detailed by District2013 / 2014
KecamatanDistrict
Kelompok Umur ( Tahun )Age Group
12 13 – 15 16 JumlahTotal
( 1 ) ( 2 ) ( 3 ) ( 4 ) ( 5 )
01. Pantar 57 370 97 52402. Pantar Barat 53 153 8 21403. Pantar Timur 38 420 102 56004. Pantar Barat Laut 16 114 20 15005. Pantar Tengah 37 380 34 45106. Alor Barat Daya 167 805 207 1.17907. Mataru 48 82 29 15908. Alor Selatan 60 160 38 25809. Alor Timur 81 153 43 27710. Alor Timur Laut 71 345 59 47511. Pureman 49 80 0 12912. Teluk Mutiara 376 2.670 512 3.55813. Kabola 45 277 68 39014. Alor Barat Laut 188 772 169 1.12915. Alor Tengah Utara 82 436 48 56616. Lembur 14 96 11 12117. Pulau Pura 28 186 51 265
ALOR 1.410 7.499 1.496 10.405
Sumber: Dinas Pendidikan Kabupaten AlorSource: Public Education Service of Alor
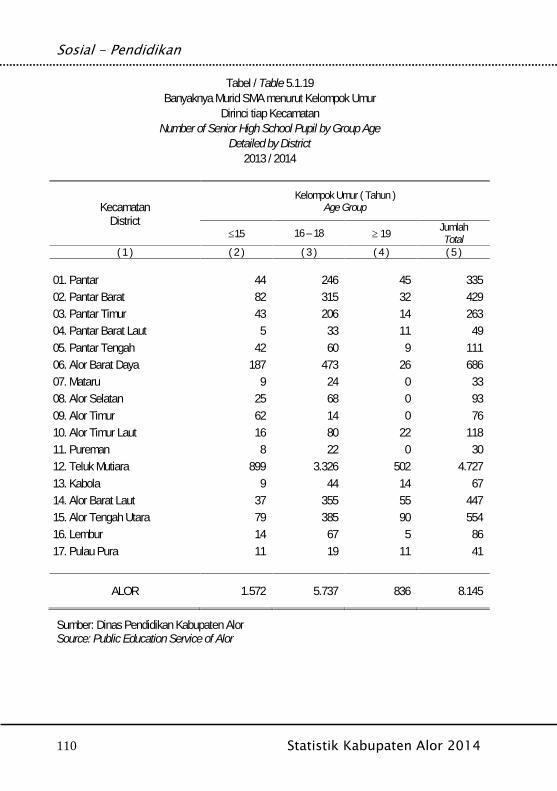
Sosial - Pendidikan
110 Statistik Kabupaten Alor 2014
Tabel / Table 5.1.19Banyaknya Murid SMA menurut Kelompok Umur
Dirinci tiap KecamatanNumber of Senior High School Pupil by Group Age
Detailed by District2013 / 2014
KecamatanDistrict
Kelompok Umur ( Tahun )Age Group
15 16 – 18 19 JumlahTotal
( 1 ) ( 2 ) ( 3 ) ( 4 ) ( 5 )
01. Pantar 44 246 45 33502. Pantar Barat 82 315 32 42903. Pantar Timur 43 206 14 26304. Pantar Barat Laut 5 33 11 4905. Pantar Tengah 42 60 9 11106. Alor Barat Daya 187 473 26 68607. Mataru 9 24 0 3308. Alor Selatan 25 68 0 9309. Alor Timur 62 14 0 7610. Alor Timur Laut 16 80 22 11811. Pureman 8 22 0 3012. Teluk Mutiara 899 3.326 502 4.72713. Kabola 9 44 14 6714. Alor Barat Laut 37 355 55 44715. Alor Tengah Utara 79 385 90 55416. Lembur 14 67 5 8617. Pulau Pura 11 19 11 41
ALOR 1.572 5.737 836 8.145
Sumber: Dinas Pendidikan Kabupaten AlorSource: Public Education Service of Alor
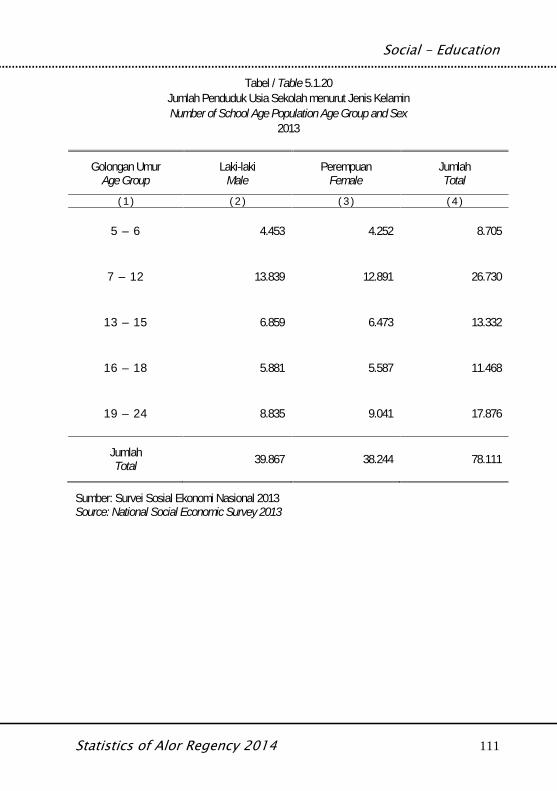
Social - Education
Statistics of Alor Regency 2014 111
Tabel / Table 5.1.20Jumlah Penduduk Usia Sekolah menurut Jenis KelaminNumber of School Age Population Age Group and Sex
2013
Golongan UmurAge Group
Laki-lakiMale
PerempuanFemale
JumlahTotal
( 1 ) ( 2 ) ( 3 ) ( 4 )
5 – 6 4.453 4.252 8.705
7 – 1 2 13.839 12.891 26.730
1 3 – 1 5 6.859 6.473 13.332
1 6 – 1 8 5.881 5.587 11.468
1 9 – 2 4 8.835 9.041 17.876
JumlahTotal 39.867 38.244 78.111
Sumber: Survei Sosial Ekonomi Nasional 2013Source: National Social Economic Survey 2013
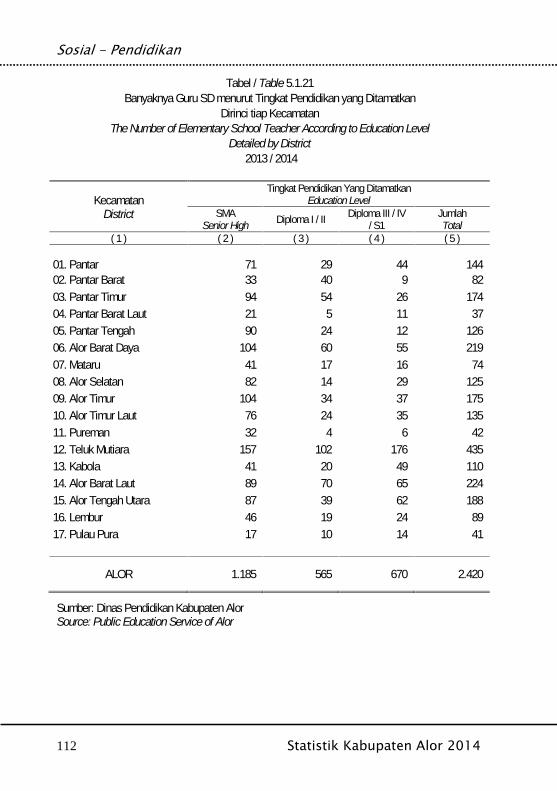
Sosial - Pendidikan
112 Statistik Kabupaten Alor 2014
Tabel / Table 5.1.21Banyaknya Guru SD menurut Tingkat Pendidikan yang Ditamatkan
Dirinci tiap KecamatanThe Number of Elementary School Teacher According to Education Level
Detailed by District2013 / 2014
KecamatanDistrict
Tingkat Pendidikan Yang DitamatkanEducation Level
SMASenior High Diploma I / II Diploma III / IV
/ S1JumlahTotal
( 1 ) ( 2 ) ( 3 ) ( 4 ) ( 5 )
01. Pantar 71 29 44 14402. Pantar Barat 33 40 9 8203. Pantar Timur 94 54 26 17404. Pantar Barat Laut 21 5 11 3705. Pantar Tengah 90 24 12 12606. Alor Barat Daya 104 60 55 21907. Mataru 41 17 16 7408. Alor Selatan 82 14 29 12509. Alor Timur 104 34 37 17510. Alor Timur Laut 76 24 35 13511. Pureman 32 4 6 4212. Teluk Mutiara 157 102 176 43513. Kabola 41 20 49 11014. Alor Barat Laut 89 70 65 22415. Alor Tengah Utara 87 39 62 18816. Lembur 46 19 24 8917. Pulau Pura 17 10 14 41
ALOR 1.185 565 670 2.420
Sumber: Dinas Pendidikan Kabupaten AlorSource: Public Education Service of Alor
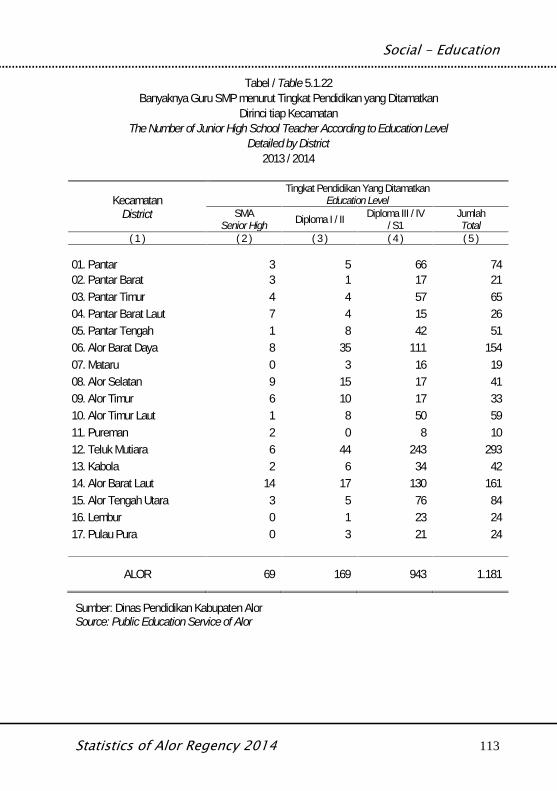
Social - Education
Statistics of Alor Regency 2014 113
Tabel / Table 5.1.22Banyaknya Guru SMP menurut Tingkat Pendidikan yang Ditamatkan
Dirinci tiap KecamatanThe Number of Junior High School Teacher According to Education Level
Detailed by District2013 / 2014
KecamatanDistrict
Tingkat Pendidikan Yang DitamatkanEducation Level
SMASenior High Diploma I / II Diploma III / IV
/ S1JumlahTotal
( 1 ) ( 2 ) ( 3 ) ( 4 ) ( 5 )
01. Pantar 3 5 66 7402. Pantar Barat 3 1 17 2103. Pantar Timur 4 4 57 6504. Pantar Barat Laut 7 4 15 2605. Pantar Tengah 1 8 42 5106. Alor Barat Daya 8 35 111 15407. Mataru 0 3 16 1908. Alor Selatan 9 15 17 4109. Alor Timur 6 10 17 3310. Alor Timur Laut 1 8 50 5911. Pureman 2 0 8 1012. Teluk Mutiara 6 44 243 29313. Kabola 2 6 34 4214. Alor Barat Laut 14 17 130 16115. Alor Tengah Utara 3 5 76 8416. Lembur 0 1 23 2417. Pulau Pura 0 3 21 24
ALOR 69 169 943 1.181
Sumber: Dinas Pendidikan Kabupaten AlorSource: Public Education Service of Alor
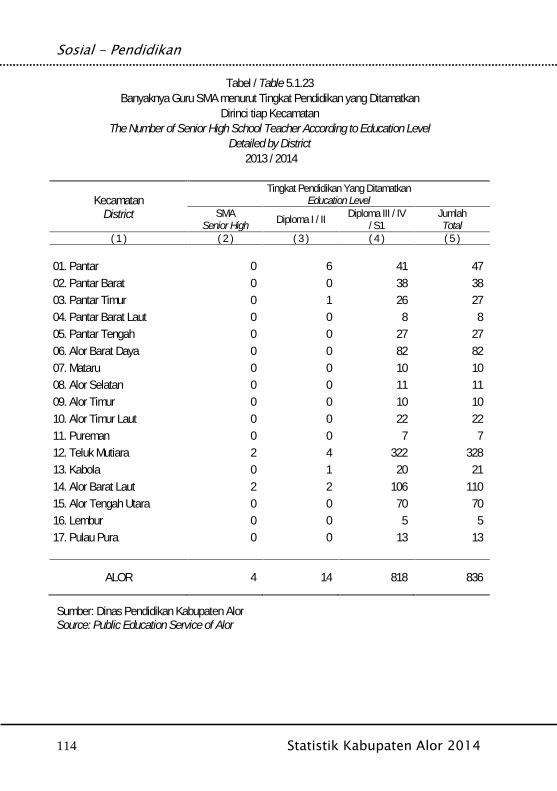
Sosial - Pendidikan
114 Statistik Kabupaten Alor 2014
Tabel / Table 5.1.23Banyaknya Guru SMA menurut Tingkat Pendidikan yang Ditamatkan
Dirinci tiap KecamatanThe Number of Senior High School Teacher According to Education Level
Detailed by District2013 / 2014
KecamatanDistrict
Tingkat Pendidikan Yang DitamatkanEducation Level
SMASenior High Diploma I / II Diploma III / IV
/ S1JumlahTotal
( 1 ) ( 2 ) ( 3 ) ( 4 ) ( 5 )
01. Pantar 0 6 41 4702. Pantar Barat 0 0 38 3803. Pantar Timur 0 1 26 2704. Pantar Barat Laut 0 0 8 805. Pantar Tengah 0 0 27 2706. Alor Barat Daya 0 0 82 8207. Mataru 0 0 10 1008. Alor Selatan 0 0 11 1109. Alor Timur 0 0 10 1010. Alor Timur Laut 0 0 22 2211. Pureman 0 0 7 712. Teluk Mutiara 2 4 322 32813. Kabola 0 1 20 2114. Alor Barat Laut 2 2 106 11015. Alor Tengah Utara 0 0 70 7016. Lembur 0 0 5 517. Pulau Pura 0 0 13 13
ALOR 4 14 818 836
Sumber: Dinas Pendidikan Kabupaten AlorSource: Public Education Service of Alor
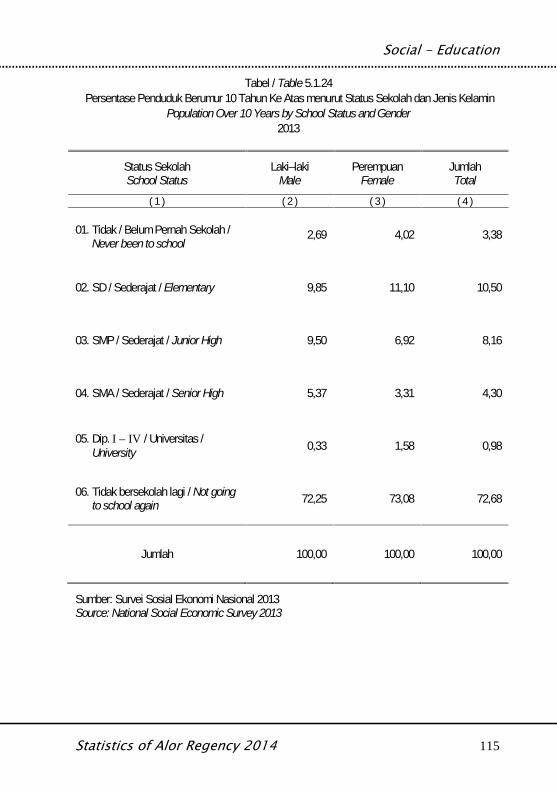
Social - Education
Statistics of Alor Regency 2014 115
Tabel / Table 5.1.24Persentase Penduduk Berumur 10 Tahun Ke Atas menurut Status Sekolah dan Jenis Kelamin
Population Over 10 Years by School Status and Gender2013
Status SekolahSchool Status
Laki–lakiMale
PerempuanFemale
JumlahTotal
( 1 ) ( 2 ) ( 3 ) ( 4 )
01. Tidak / Belum Pernah Sekolah /Never been to school
2,69 4,02 3,38
02. SD / Sederajat / Elementary 9,85 11,10 10,50
03. SMP / Sederajat / Junior High 9,50 6,92 8,16
04. SMA / Sederajat / Senior High 5,37 3,31 4,30
05. Dip. I – IV / Universitas /University 0,33 1,58 0,98
06. Tidak bersekolah lagi / Not goingto school again 72,25 73,08 72,68
Jumlah 100,00 100,00 100,00
Sumber: Survei Sosial Ekonomi Nasional 2013Source: National Social Economic Survey 2013
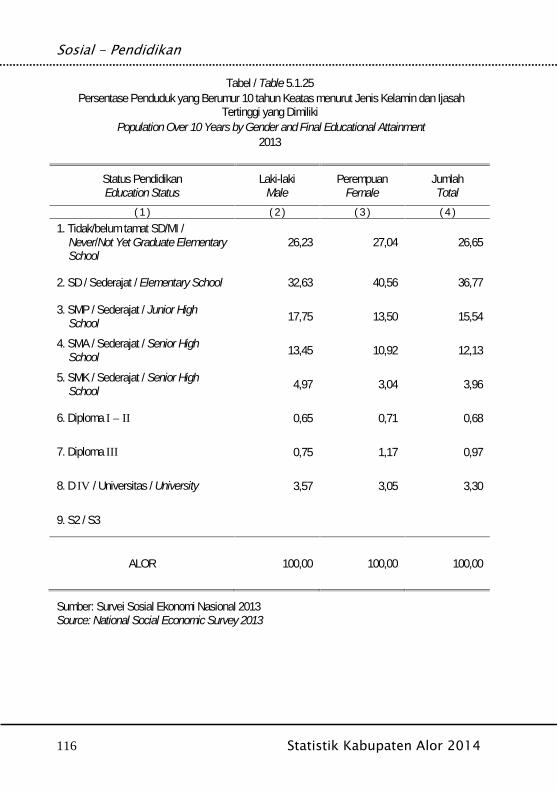
Sosial - Pendidikan
116 Statistik Kabupaten Alor 2014
Tabel / Table 5.1.25Persentase Penduduk yang Berumur 10 tahun Keatas menurut Jenis Kelamin dan Ijasah
Tertinggi yang DimilikiPopulation Over 10 Years by Gender and Final Educational Attainment
2013
Status PendidikanEducation Status
Laki-lakiMale
PerempuanFemale
JumlahTotal
( 1 ) ( 2 ) ( 3 ) ( 4 )1. Tidak/belum tamat SD/MI /
Never/Not Yet Graduate ElementarySchool
26,23 27,04 26,65
2. SD / Sederajat / Elementary School 32,63 40,56 36,77
3. SMP / Sederajat / Junior HighSchool 17,75 13,50 15,54
4. SMA / Sederajat / Senior HighSchool 13,45 10,92 12,13
5. SMK / Sederajat / Senior HighSchool 4,97 3,04 3,96
6. Diploma I – II 0,65 0,71 0,68
7. Diploma III 0,75 1,17 0,97
8. D IV / Universitas / University 3,57 3,05 3,30
9. S2 / S3
ALOR 100,00 100,00 100,00
Sumber: Survei Sosial Ekonomi Nasional 2013Source: National Social Economic Survey 2013
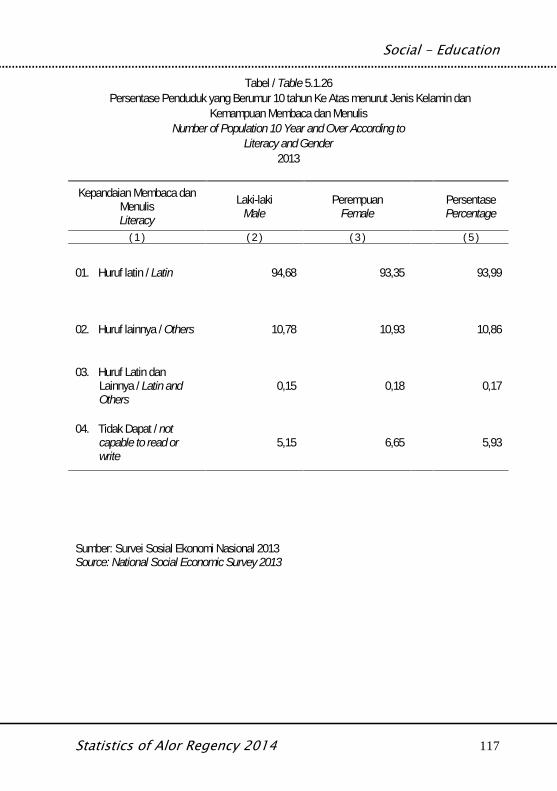
Social - Education
Statistics of Alor Regency 2014 117
Tabel / Table 5.1.26Persentase Penduduk yang Berumur 10 tahun Ke Atas menurut Jenis Kelamin dan
Kemampuan Membaca dan MenulisNumber of Population 10 Year and Over According to
Literacy and Gender2013
Kepandaian Membaca danMenulisLiteracy
Laki-lakiMale
PerempuanFemale
PersentasePercentage
( 1 ) ( 2 ) ( 3 ) ( 5 )
01. Huruf latin / Latin 94,68 93,35 93,99
02. Huruf lainnya / Others 10,78 10,93 10,86
03. Huruf Latin danLainnya / Latin andOthers
0,15 0,18 0,17
04. Tidak Dapat / notcapable to read orwrite
5,15 6,65 5,93
ALOR
Sumber: Survei Sosial Ekonomi Nasional 2013Source: National Social Economic Survey 2013

Sosial - Pendidikan
118 Statistik Kabupaten Alor 2014
Tabel / Table 5.1.27Banyaknya Sekolah yang Mempunyai Usaha Kesehatan Sekolah (UKS)
Dirinci per KecamatanNumber of School that Provide School Clinic at School
Detaied by District2013
KecamatanDistrict
SD / SederajatElementary
SMP / SederajatJunior High
SMA / SederajatSenior High School
( 1 ) ( 2 ) ( 3 ) ( 4 )
01. Pantar 5 0 002. Pantar Barat 1 0 003. Pantar Timur 3 0 004. Pantar Barat Laut 1 0 005. Pantar Tengah 1 1 006. Alor Barat Daya 12 1 007. Mataru 2 0 008. Alor Selatan 4 0 009. Alor Timur 5 1 010. Alor Timur Laut 5 0 011. Pureman 1 0 012. Teluk Mutiara 19 5 613. Kabola 5 0 014. Alor Barat Laut 5 0 015. Alor Tengah Utara 5 0 016. Lembur 1 0 017. Pulau Pura 2 0 0
ALOR 77 8 6
Sumber: Dinas Pendidikan Kabupaten AlorSource: Public Education Service of Alor
Social - Education
Statistics of Alor Regency 2014 119
Sosial - Pendidikan
120 Statistik Kabupaten Alor 2014
Social - Health
Statistics of Alor Regency 2014 121
BAB V.2KESEHATAN
Health

Sosial - Kesehatan
122 Statistik Kabupaten Alor 2014
Social - Health
Statistics of Alor Regency 2014 123
Penjelasan Teknis Technical Notes
1. Rumah Sakit adalah tempat pemeriksaan danperawatan kesehatan, biasanya berada di bawahpengawasan dokter/ tenaga medis, termasukrumah sakit khusus seperti rumah sakitperawatan paru-paru dan RS jantung.
2. Rumah Sakit Bersalin/ Rumah Bersalin adalahrumah sakit yang dilengkapi dengan fasilitasuntuk melahirkan, pemeriksaan kehamilan,pemeriksaan ibu dan anak serta berada di bawahpengawasan dokter dan atau bidan senior.
3. Poliklinik adalah tempat pemeriksaan kesehatan,biasanya tanpa fasilitas perawatan menginap,berada di bawah pengawasan dokter/ tenagamedis, tidak termasuk klinik yang terdapat dipuskesmas/ rumah sakit. Poliklinik yang karenasatu dan lain hal menyediakan tempat perawatanmenginap, tetap digolongkan kedalam poliklinik(bukan rumah sakit)
4. Puskesmas (Pusat Kesehatan Masyarakat)adalah unit pelayanan kesehatan milikpemerintah yang bertanggung jawab terhadappelayanan kesehatan masyarakat untuk wilayahkecamatan, sebagian kecamatan atau kelurahan(misal di DKI Jakarta). Tim Puskesmas sesuaijadwal dapat melakukan kegiatan PuskesmasKeliling ke tempat-tempat tertentu dalam wilayahkerjanya, untuk mendekatkan pelayanan denganmasyarakat.
1. Hospital is a place for health check, usuallycontrolled/ supervised by doctor/ medical personel.Including in this category are special hospital suchLung Hospital and Coronary Hospital.
2. Maternal Hospital/ Maternal Health Care Centreis a hospital completed with health facilities for birthdelivery, pregnancy check and consultation, andpost-natal check, under the supervision of doctorand or senior midwives.
3. Polyclinic is a place for health check andconsultation usually under the control of doctor/medical personnel without in-patient facilities,excluding clinic located in the public health center(Puskesmas)/ hospital. In the case of polyclinic thatprovides in-patient facilities due to a special reason,it remains to be classified as a polyclinic (nothospital).
4. Public Health Center (PHC) is a health centerprovided by government that is responsible for thedelivery health services to the community at thesub-district level, part of sub-district or village (e.g.in DKI Jakarta). Officials in the PHC as scheduledcan provide health services in their working areas inthe effort of closing their services to the communitythrough Mobile PHC program.
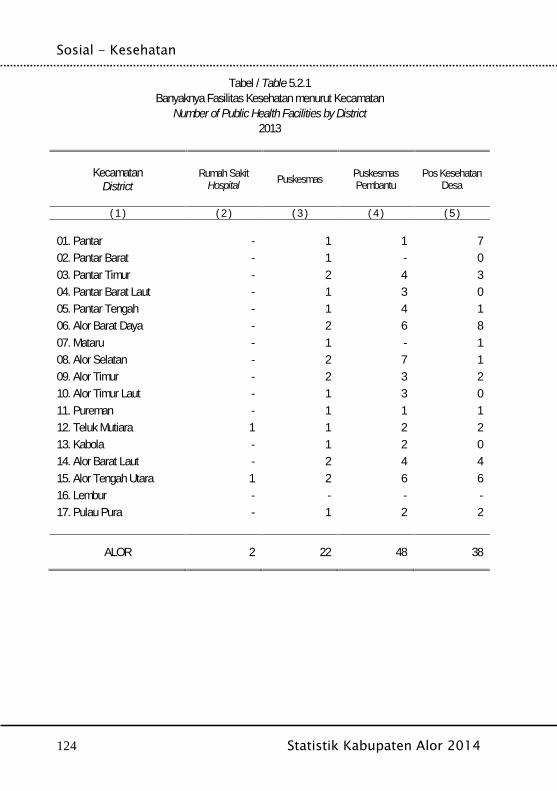
Sosial - Kesehatan
124 Statistik Kabupaten Alor 2014
Tabel / Table 5.2.1Banyaknya Fasilitas Kesehatan menurut Kecamatan
Number of Public Health Facilities by District2013
KecamatanDistrict
Rumah SakitHospital Puskesmas Puskesmas
PembantuPos Kesehatan
Desa
( 1 ) ( 2 ) ( 3 ) ( 4 ) ( 5 )
01. Pantar - 1 1 702. Pantar Barat - 1 - 003. Pantar Timur - 2 4 304. Pantar Barat Laut - 1 3 005. Pantar Tengah - 1 4 106. Alor Barat Daya - 2 6 807. Mataru - 1 - 108. Alor Selatan - 2 7 109. Alor Timur - 2 3 210. Alor Timur Laut - 1 3 011. Pureman - 1 1 112. Teluk Mutiara 1 1 2 213. Kabola - 1 2 014. Alor Barat Laut - 2 4 415. Alor Tengah Utara 1 2 6 616. Lembur - - - -17. Pulau Pura - 1 2 2
ALOR 2 22 48 38
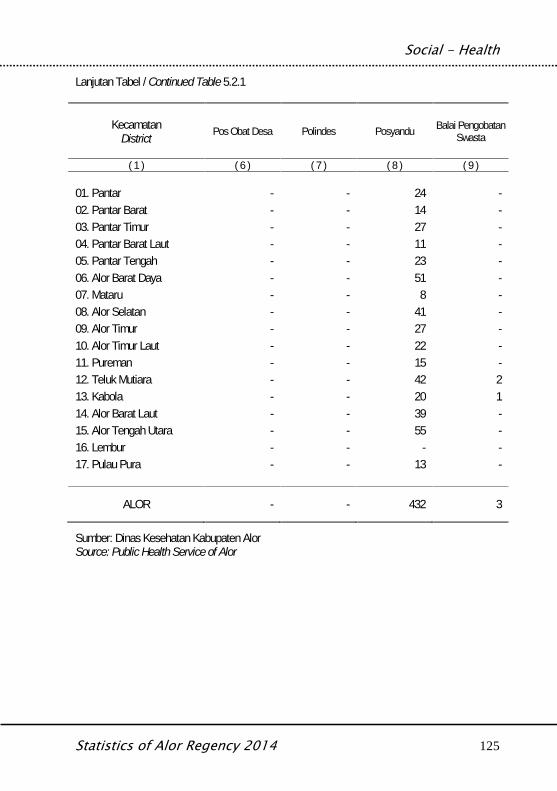
Social - Health
Statistics of Alor Regency 2014 125
Lanjutan Tabel / Continued Table 5.2.1
KecamatanDistrict Pos Obat Desa Polindes Posyandu Balai Pengobatan
Swasta
( 1 ) ( 6 ) ( 7 ) ( 8 ) ( 9 )
01. Pantar - - 24 -02. Pantar Barat - - 14 -03. Pantar Timur - - 27 -04. Pantar Barat Laut - - 11 -05. Pantar Tengah - - 23 -06. Alor Barat Daya - - 51 -07. Mataru - - 8 -08. Alor Selatan - - 41 -09. Alor Timur - - 27 -10. Alor Timur Laut - - 22 -11. Pureman - - 15 -12. Teluk Mutiara - - 42 213. Kabola - - 20 114. Alor Barat Laut - - 39 -15. Alor Tengah Utara - - 55 -16. Lembur - - - -17. Pulau Pura - - 13 -
ALOR - - 432 3
Sumber: Dinas Kesehatan Kabupaten AlorSource: Public Health Service of Alor
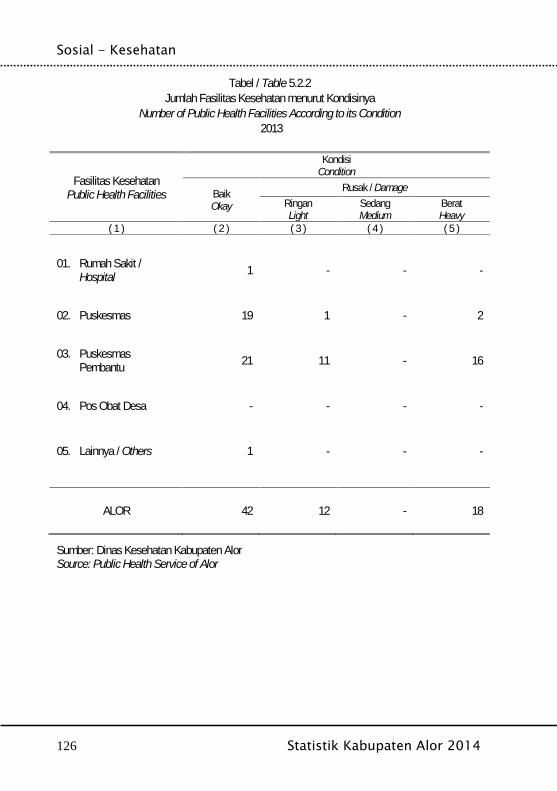
Sosial - Kesehatan
126 Statistik Kabupaten Alor 2014
Tabel / Table 5.2.2Jumlah Fasilitas Kesehatan menurut Kondisinya
Number of Public Health Facilities According to its Condition2013
Fasilitas KesehatanPublic Health Facilities
KondisiCondition
BaikOkay
Rusak / DamageRinganLight
SedangMedium
BeratHeavy
( 1 ) ( 2 ) ( 3 ) ( 4 ) ( 5 )
01. Rumah Sakit /Hospital 1 - - -
02. Puskesmas 19 1 - 2
03. PuskesmasPembantu 21 11 - 16
04. Pos Obat Desa - - - -
05. Lainnya / Others 1 - - -
ALOR 42 12 - 18
Sumber: Dinas Kesehatan Kabupaten AlorSource: Public Health Service of Alor
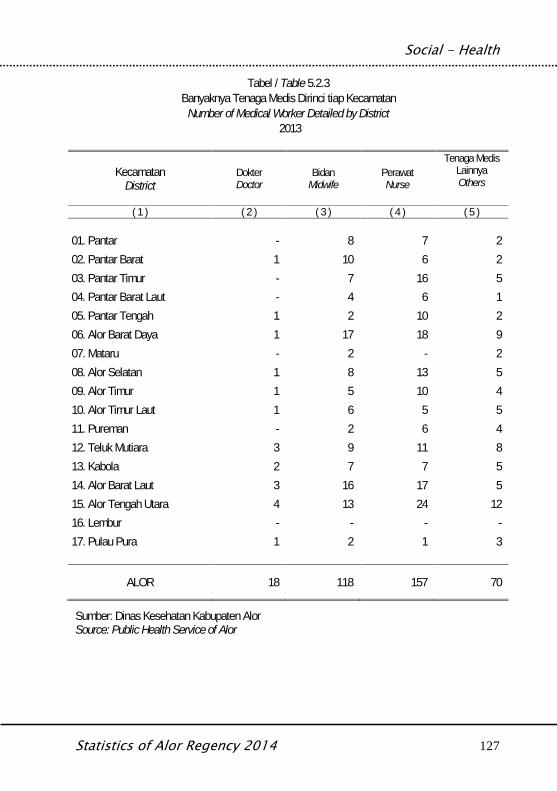
Social - Health
Statistics of Alor Regency 2014 127
Tabel / Table 5.2.3Banyaknya Tenaga Medis Dirinci tiap Kecamatan
Number of Medical Worker Detailed by District2013
KecamatanDistrict
DokterDoctor
BidanMidwife
PerawatNurse
Tenaga MedisLainnyaOthers
( 1 ) ( 2 ) ( 3 ) ( 4 ) ( 5 )
01. Pantar - 8 7 202. Pantar Barat 1 10 6 203. Pantar Timur - 7 16 504. Pantar Barat Laut - 4 6 105. Pantar Tengah 1 2 10 206. Alor Barat Daya 1 17 18 907. Mataru - 2 - 208. Alor Selatan 1 8 13 509. Alor Timur 1 5 10 410. Alor Timur Laut 1 6 5 511. Pureman - 2 6 412. Teluk Mutiara 3 9 11 813. Kabola 2 7 7 514. Alor Barat Laut 3 16 17 515. Alor Tengah Utara 4 13 24 1216. Lembur - - - -17. Pulau Pura 1 2 1 3
ALOR 18 118 157 70
Sumber: Dinas Kesehatan Kabupaten AlorSource: Public Health Service of Alor
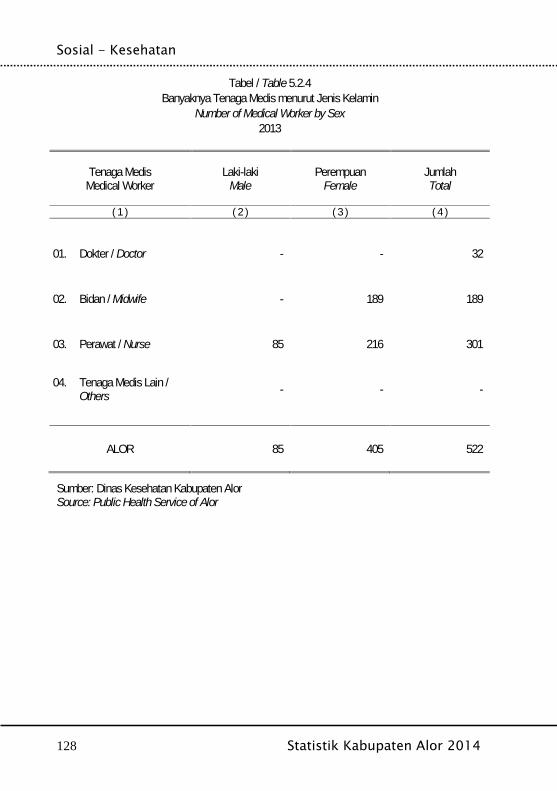
Sosial - Kesehatan
128 Statistik Kabupaten Alor 2014
Tabel / Table 5.2.4Banyaknya Tenaga Medis menurut Jenis Kelamin
Number of Medical Worker by Sex2013
Tenaga MedisMedical Worker
Laki-lakiMale
PerempuanFemale
JumlahTotal
( 1 ) ( 2 ) ( 3 ) ( 4 )
01. Dokter / Doctor - - 32
02. Bidan / Midwife - 189 189
03. Perawat / Nurse 85 216 301
04. Tenaga Medis Lain /Others - - -
ALOR 85 405 522
Sumber: Dinas Kesehatan Kabupaten AlorSource: Public Health Service of Alor

Social - Health
Statistics of Alor Regency 2014 129
Tabel / Table 5.2.5Jumlah Fasilitas Kesehatan yang Melayani Kesehatan Reproduksi dan Kesehatan Reproduksi
Remaja (KRR) serta PMS / HIV / AIDSNumber of Public Health Facilities that Serves Reproduction and the Adolescent Reproduction
Health and also PMS / HIV / AIDS2013
Fasilitas KesehatanPublic Health Facilities
KesproReproduction
HealthKRR PMS / HIV /
AIDS
( 1 ) ( 2 ) ( 3 ) ( 4 )
01. Rumah Sakit / Hospital 1 - 1
02. Puskesmas 22 - -
03. Puskesmas Pembantu 48 - -
04. Lainnya / Others 1 - -
ALOR 72 - -
Sumber: Dinas Kesehatan Kabupaten AlorSource: Public Health Service of Alor
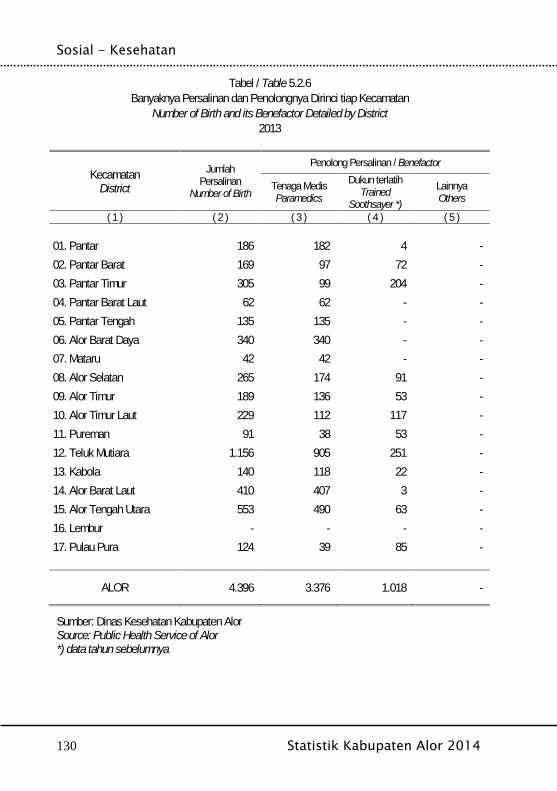
Sosial - Kesehatan
130 Statistik Kabupaten Alor 2014
Tabel / Table 5.2.6Banyaknya Persalinan dan Penolongnya Dirinci tiap Kecamatan
Number of Birth and its Benefactor Detailed by District2013
KecamatanDistrict
JumlahPersalinan
Number of Birth
Penolong Persalinan / Benefactor
Tenaga MedisParamedics
Dukun terlatihTrained
Soothsayer *)
LainnyaOthers
( 1 ) ( 2 ) ( 3 ) ( 4 ) ( 5 )
01. Pantar 186 182 4 -02. Pantar Barat 169 97 72 -03. Pantar Timur 305 99 204 -04. Pantar Barat Laut 62 62 - -05. Pantar Tengah 135 135 - -06. Alor Barat Daya 340 340 - -07. Mataru 42 42 - -08. Alor Selatan 265 174 91 -09. Alor Timur 189 136 53 -10. Alor Timur Laut 229 112 117 -11. Pureman 91 38 53 -12. Teluk Mutiara 1.156 905 251 -13. Kabola 140 118 22 -14. Alor Barat Laut 410 407 3 -15. Alor Tengah Utara 553 490 63 -16. Lembur - - - -17. Pulau Pura 124 39 85 -
ALOR 4.396 3.376 1.018 -
Sumber: Dinas Kesehatan Kabupaten AlorSource: Public Health Service of Alor*) data tahun sebelumnya

Social - Health
Statistics of Alor Regency 2014 131
Tabel / Table 5.2.7Persentase Persalinan menurut Penolong Kelahiran Pertama
Number of Birth and First Birth Benefactor2013
Penolong Kelahiran PertamaFirst Birth Benefactor
JumlahTotal
( 1 ) ( 2 )
01. Dokter / Doctor 5,03
02. Bidan / Midwife 40,61
03. Tenaga Medis Lain / Other Medical Worker 0,56
04. Dukun / Soothsayer 53,22
05. Keluarga / Family 0,58
06. Lainnya 0,00
ALOR 100,00
Sumber: Survei Sosial Ekonomi Nasional 2013Source: National Socio Economy Survey 2013

Sosial - Kesehatan
132 Statistik Kabupaten Alor 2014
Tabel / Table 5.2.8Jumlah Sarana Kesehatan yang Melayani Persalinan
Number of Public Health Facilities that Serves Maternity2013
Sarana KesehatanPublic Health Facilities
JumlahNumber
( 1 ) (2)
1. Rumah Sakit (Hospital ) 1
2. Rumah Sakit Bersalin -
3. Puskesmas 22
4. Rumah Bersalin 2
5. Klinik Bersalin -
Sumber: Dinas Kesehatan Kabupaten AlorSource: Public Health Service of Alor
:
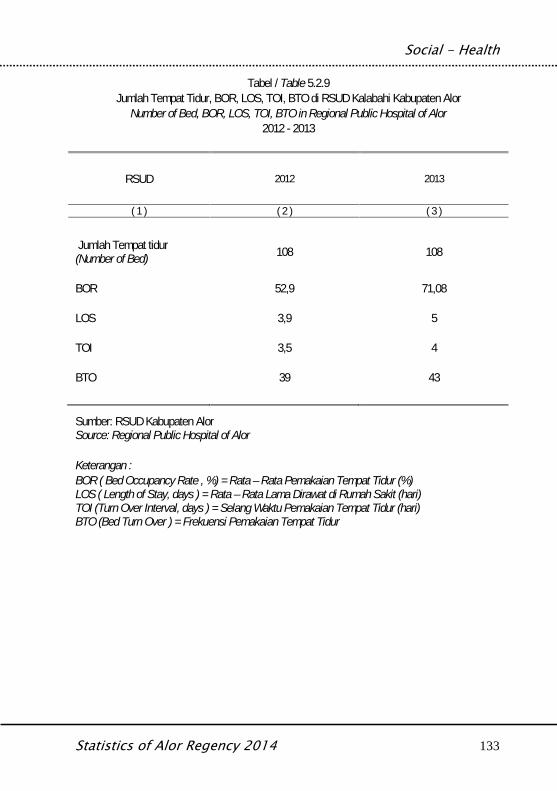
Social - Health
Statistics of Alor Regency 2014 133
Tabel / Table 5.2.9Jumlah Tempat Tidur, BOR, LOS, TOI, BTO di RSUD Kalabahi Kabupaten Alor
Number of Bed, BOR, LOS, TOI, BTO in Regional Public Hospital of Alor2012 - 2013
RSUD 2012 2013
( 1 ) ( 2 ) ( 3 )
Jumlah Tempat tidur(Number of Bed) 108 108
BOR 52,9 71,08
LOS 3,9 5
TOI 3,5 4
BTO 39 43
Sumber: RSUD Kabupaten AlorSource: Regional Public Hospital of Alor
Keterangan :BOR ( Bed Occupancy Rate , %) = Rata – Rata Pemakaian Tempat Tidur (%)LOS ( Length of Stay, days ) = Rata – Rata Lama Dirawat di Rumah Sakit (hari)TOI (Turn Over Interval, days ) = Selang Waktu Pemakaian Tempat Tidur (hari)BTO (Bed Turn Over ) = Frekuensi Pemakaian Tempat Tidur
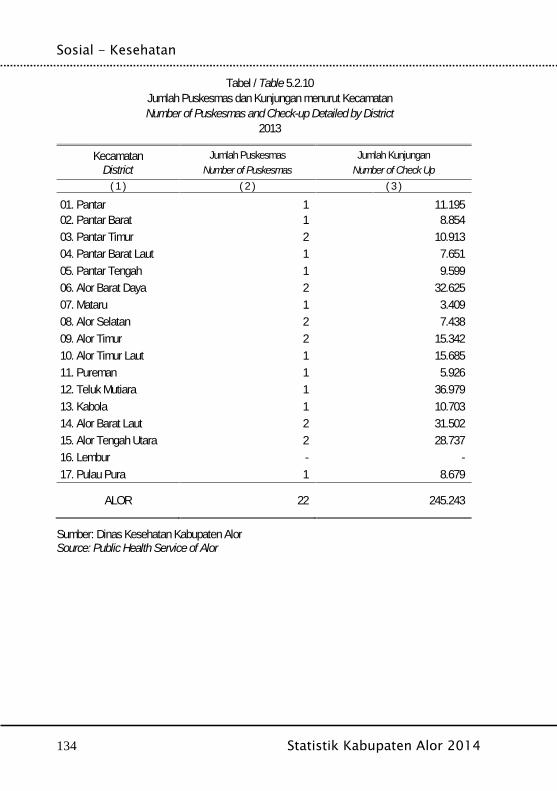
Sosial - Kesehatan
134 Statistik Kabupaten Alor 2014
Tabel / Table 5.2.10Jumlah Puskesmas dan Kunjungan menurut KecamatanNumber of Puskesmas and Check-up Detailed by District
2013
KecamatanDistrict
Jumlah PuskesmasNumber of Puskesmas
Jumlah KunjunganNumber of Check Up
( 1 ) ( 2 ) ( 3 )
01. Pantar 1 11.19502. Pantar Barat 1 8.85403. Pantar Timur 2 10.91304. Pantar Barat Laut 1 7.65105. Pantar Tengah 1 9.59906. Alor Barat Daya 2 32.62507. Mataru 1 3.40908. Alor Selatan 2 7.43809. Alor Timur 2 15.34210. Alor Timur Laut 1 15.68511. Pureman 1 5.92612. Teluk Mutiara 1 36.97913. Kabola 1 10.70314. Alor Barat Laut 2 31.50215. Alor Tengah Utara 2 28.73716. Lembur - -17. Pulau Pura 1 8.679
ALOR 22 245.243
Sumber: Dinas Kesehatan Kabupaten AlorSource: Public Health Service of Alor
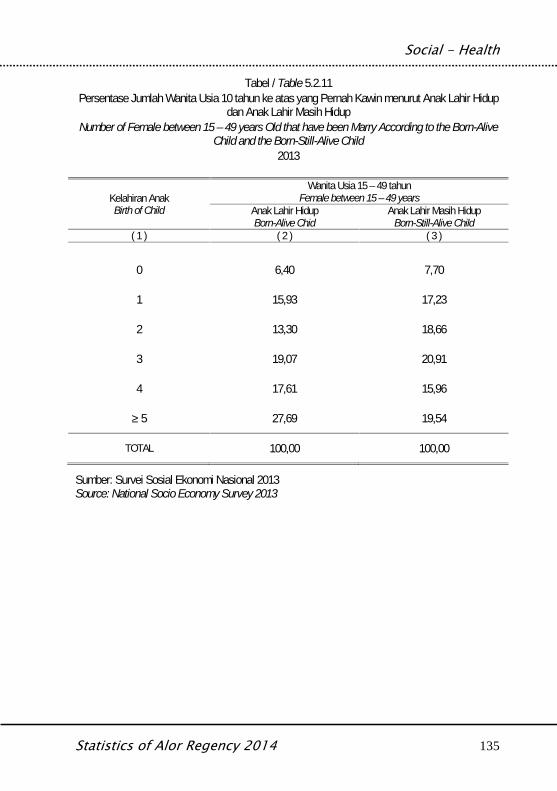
Social - Health
Statistics of Alor Regency 2014 135
Tabel / Table 5.2.11Persentase Jumlah Wanita Usia 10 tahun ke atas yang Pernah Kawin menurut Anak Lahir Hidup
dan Anak Lahir Masih HidupNumber of Female between 15 – 49 years Old that have been Marry According to the Born-Alive
Child and the Born-Still-Alive Child2013
Kelahiran AnakBirth of Child
Wanita Usia 15 – 49 tahunFemale between 15 – 49 years
Anak Lahir HidupBorn-Alive Chid
Anak Lahir Masih HidupBorn-Still-Alive Child
( 1 ) ( 2 ) ( 3 )
0 6,40 7,70
1 15,93 17,23
2 13,30 18,66
3 19,07 20,91
4 17,61 15,96
≥ 5 27,69 19,54
TOTAL 100,00 100,00
Sumber: Survei Sosial Ekonomi Nasional 2013Source: National Socio Economy Survey 2013
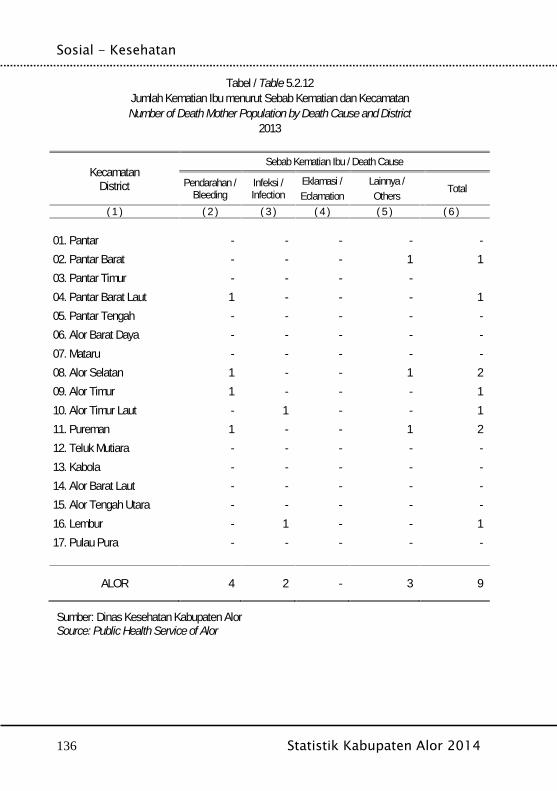
Sosial - Kesehatan
136 Statistik Kabupaten Alor 2014
Tabel / Table 5.2.12Jumlah Kematian Ibu menurut Sebab Kematian dan KecamatanNumber of Death Mother Population by Death Cause and District
2013
KecamatanDistrict
Sebab Kematian Ibu / Death Cause
Pendarahan /Bleeding
Infeksi /Infection
Eklamasi /Eclamation
Lainnya /Others
Total
( 1 ) ( 2 ) ( 3 ) ( 4 ) ( 5 ) ( 6 )
01. Pantar - - - - -02. Pantar Barat - - - 1 103. Pantar Timur - - - -04. Pantar Barat Laut 1 - - - 105. Pantar Tengah - - - - -06. Alor Barat Daya - - - - -07. Mataru - - - - -08. Alor Selatan 1 - - 1 209. Alor Timur 1 - - - 110. Alor Timur Laut - 1 - - 111. Pureman 1 - - 1 212. Teluk Mutiara - - - - -13. Kabola - - - - -14. Alor Barat Laut - - - - -15. Alor Tengah Utara - - - - -16. Lembur - 1 - - 117. Pulau Pura - - - - -
ALOR 4 2 - 3 9
Sumber: Dinas Kesehatan Kabupaten AlorSource: Public Health Service of Alor

Social - Health
Statistics of Alor Regency 2014 137
Tabel / Table 5.2.1310 Penyakit dengan Penderita Terbanyak menurut Jenis Penyakit
Top 10 Disease with the most Patient by Type of Disease2013
Jenis PenyakitType of Disease
JumlahTotal
( 1 ) ( 2 )
01. ISPA 58.653
02. Rheumatik 8.411
03. Malaria Klinis 4.624
04. Penyakit Kulit Infeksi 5.002
05. Gastritis Acut 9.325
06. Diare 7.363
07. Penyakit Kulit Alergi 6.695
08. Myalgia 21.831
09. Observasi Vebris 9.492
10 Batuk 5.089
ALOR 136.485
Sumber: Dinas Kesehatan Kabupaten AlorSource: Public Health Service of Alor
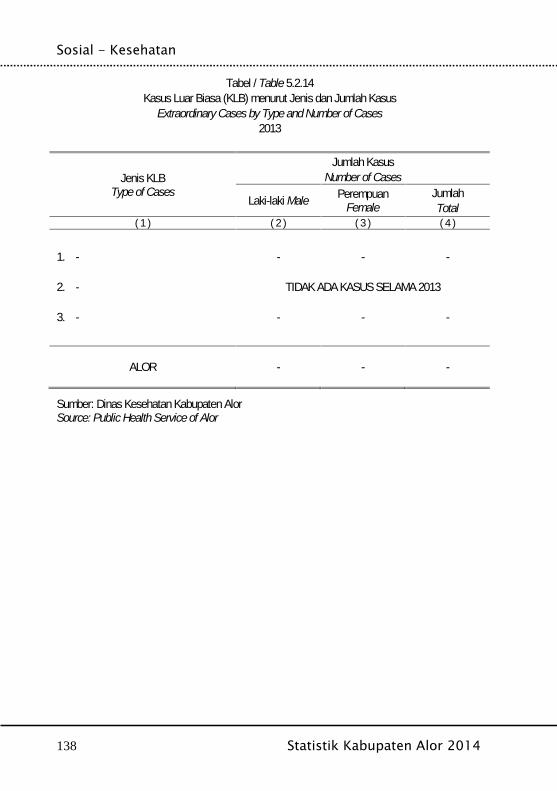
Sosial - Kesehatan
138 Statistik Kabupaten Alor 2014
Tabel / Table 5.2.14Kasus Luar Biasa (KLB) menurut Jenis dan Jumlah Kasus
Extraordinary Cases by Type and Number of Cases2013
Jenis KLBType of Cases
Jumlah KasusNumber of Cases
Laki-laki Male PerempuanFemale
JumlahTotal
( 1 ) ( 2 ) ( 3 ) ( 4 )
1. - - - -
2. - TIDAK ADA KASUS SELAMA 2013
3. - - - -
ALOR - - -
Sumber: Dinas Kesehatan Kabupaten AlorSource: Public Health Service of Alor
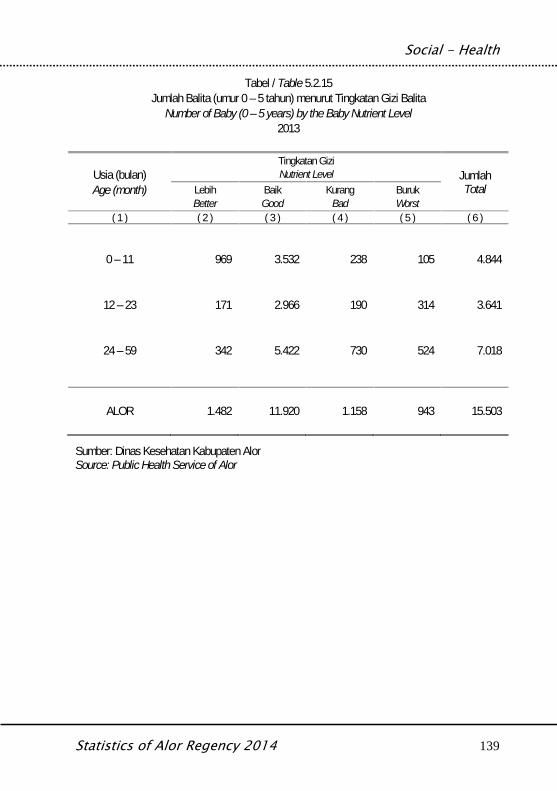
Social - Health
Statistics of Alor Regency 2014 139
Tabel / Table 5.2.15Jumlah Balita (umur 0 – 5 tahun) menurut Tingkatan Gizi Balita
Number of Baby (0 – 5 years) by the Baby Nutrient Level2013
Usia (bulan)Age (month)
Tingkatan GiziNutrient Level Jumlah
TotalLebihBetter
BaikGood
KurangBad
BurukWorst
( 1 ) ( 2 ) ( 3 ) ( 4 ) ( 5 ) ( 6 )
0 – 11 969 3.532 238 105 4.844
12 – 23 171 2.966 190 314 3.641
24 – 59 342 5.422 730 524 7.018
ALOR 1.482 11.920 1.158 943 15.503
Sumber: Dinas Kesehatan Kabupaten AlorSource: Public Health Service of Alor
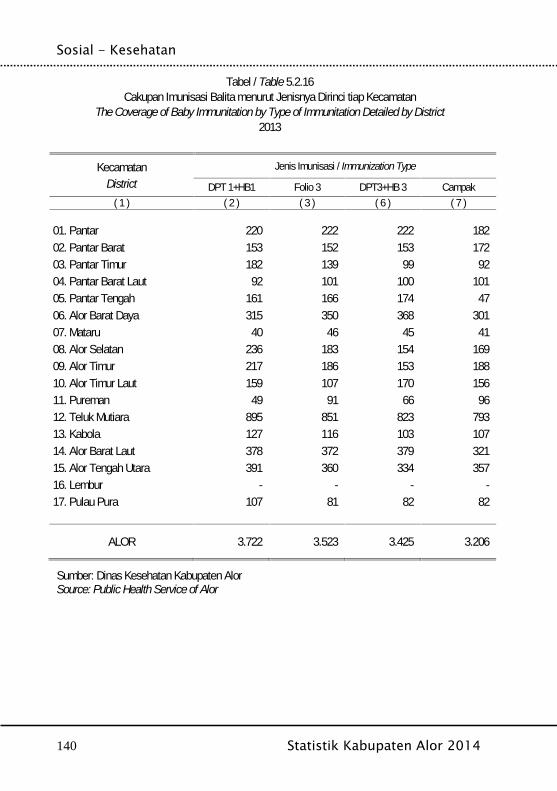
Sosial - Kesehatan
140 Statistik Kabupaten Alor 2014
Tabel / Table 5.2.16Cakupan Imunisasi Balita menurut Jenisnya Dirinci tiap Kecamatan
The Coverage of Baby Immunitation by Type of Immunitation Detailed by District2013
KecamatanDistrict
Jenis Imunisasi / Immunization Type
DPT 1+HB1 Folio 3 DPT3+HB 3 Campak( 1 ) ( 2 ) ( 3 ) ( 6 ) ( 7 )
01. Pantar 220 222 222 18202. Pantar Barat 153 152 153 17203. Pantar Timur 182 139 99 9204. Pantar Barat Laut 92 101 100 10105. Pantar Tengah 161 166 174 4706. Alor Barat Daya 315 350 368 30107. Mataru 40 46 45 4108. Alor Selatan 236 183 154 16909. Alor Timur 217 186 153 18810. Alor Timur Laut 159 107 170 15611. Pureman 49 91 66 9612. Teluk Mutiara 895 851 823 79313. Kabola 127 116 103 10714. Alor Barat Laut 378 372 379 32115. Alor Tengah Utara 391 360 334 35716. Lembur - - - -17. Pulau Pura 107 81 82 82
ALOR 3.722 3.523 3.425 3.206
Sumber: Dinas Kesehatan Kabupaten AlorSource: Public Health Service of Alor
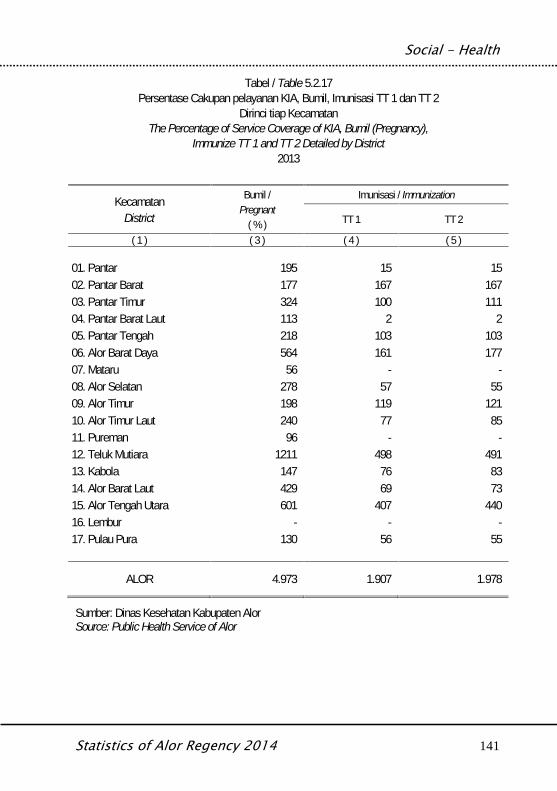
Social - Health
Statistics of Alor Regency 2014 141
Tabel / Table 5.2.17Persentase Cakupan pelayanan KIA, Bumil, Imunisasi TT 1 dan TT 2
Dirinci tiap KecamatanThe Percentage of Service Coverage of KIA, Bumil (Pregnancy),
Immunize TT 1 and TT 2 Detailed by District2013
KecamatanDistrict
Bumil /Pregnant
( % )
Imunisasi / Immunization
TT 1 TT 2
( 1 ) ( 3 ) ( 4 ) ( 5 )
01. Pantar 195 15 1502. Pantar Barat 177 167 16703. Pantar Timur 324 100 11104. Pantar Barat Laut 113 2 205. Pantar Tengah 218 103 10306. Alor Barat Daya 564 161 17707. Mataru 56 - -08. Alor Selatan 278 57 5509. Alor Timur 198 119 12110. Alor Timur Laut 240 77 8511. Pureman 96 - -12. Teluk Mutiara 1211 498 49113. Kabola 147 76 8314. Alor Barat Laut 429 69 7315. Alor Tengah Utara 601 407 44016. Lembur - - -17. Pulau Pura 130 56 55
ALOR 4.973 1.907 1.978
Sumber: Dinas Kesehatan Kabupaten AlorSource: Public Health Service of Alor
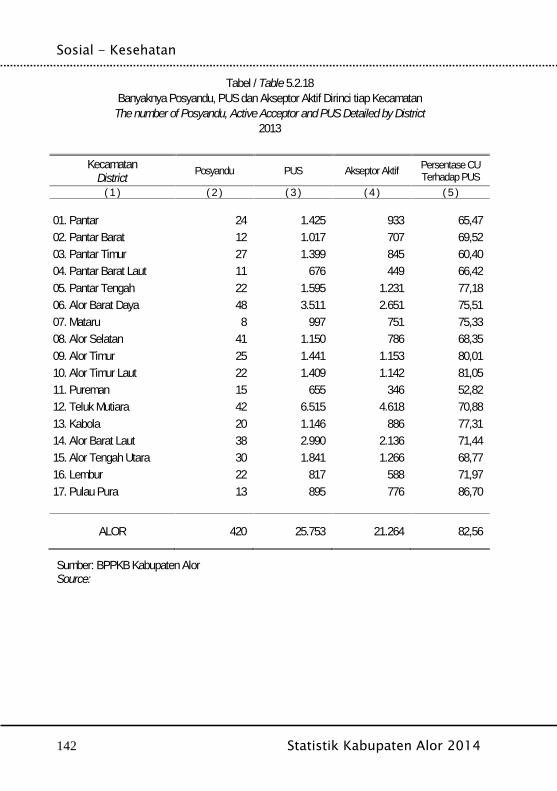
Sosial - Kesehatan
142 Statistik Kabupaten Alor 2014
Tabel / Table 5.2.18Banyaknya Posyandu, PUS dan Akseptor Aktif Dirinci tiap Kecamatan
The number of Posyandu, Active Acceptor and PUS Detailed by District2013
KecamatanDistrict Posyandu PUS Akseptor Aktif Persentase CU
Terhadap PUS( 1 ) ( 2 ) ( 3 ) ( 4 ) ( 5 )
01. Pantar 24 1.425 933 65,4702. Pantar Barat 12 1.017 707 69,5203. Pantar Timur 27 1.399 845 60,4004. Pantar Barat Laut 11 676 449 66,4205. Pantar Tengah 22 1.595 1.231 77,1806. Alor Barat Daya 48 3.511 2.651 75,5107. Mataru 8 997 751 75,3308. Alor Selatan 41 1.150 786 68,3509. Alor Timur 25 1.441 1.153 80,0110. Alor Timur Laut 22 1.409 1.142 81,0511. Pureman 15 655 346 52,8212. Teluk Mutiara 42 6.515 4.618 70,8813. Kabola 20 1.146 886 77,3114. Alor Barat Laut 38 2.990 2.136 71,4415. Alor Tengah Utara 30 1.841 1.266 68,7716. Lembur 22 817 588 71,9717. Pulau Pura 13 895 776 86,70
ALOR 420 25.753 21.264 82,56
Sumber: BPPKB Kabupaten AlorSource:
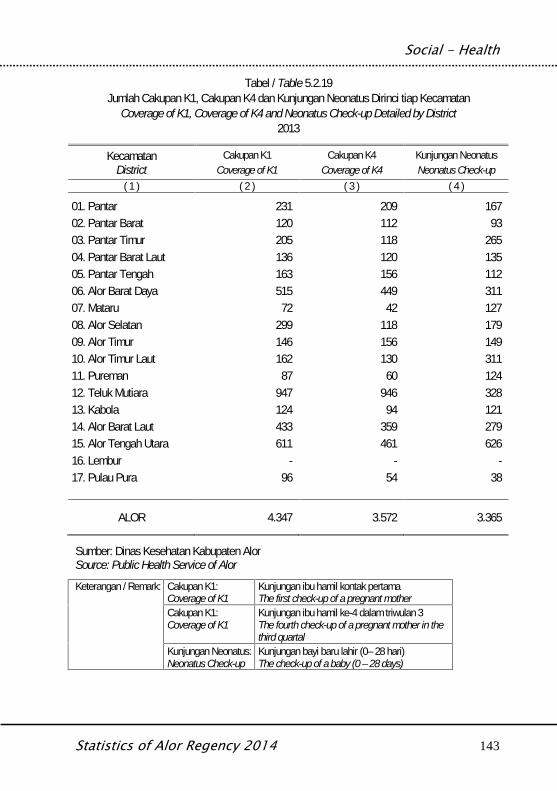
Social - Health
Statistics of Alor Regency 2014 143
Tabel / Table 5.2.19Jumlah Cakupan K1, Cakupan K4 dan Kunjungan Neonatus Dirinci tiap Kecamatan
Coverage of K1, Coverage of K4 and Neonatus Check-up Detailed by District2013
KecamatanDistrict
Cakupan K1Coverage of K1
Cakupan K4Coverage of K4
Kunjungan NeonatusNeonatus Check-up
( 1 ) ( 2 ) ( 3 ) ( 4 )
01. Pantar 231 209 16702. Pantar Barat 120 112 9303. Pantar Timur 205 118 26504. Pantar Barat Laut 136 120 13505. Pantar Tengah 163 156 11206. Alor Barat Daya 515 449 31107. Mataru 72 42 12708. Alor Selatan 299 118 17909. Alor Timur 146 156 14910. Alor Timur Laut 162 130 31111. Pureman 87 60 12412. Teluk Mutiara 947 946 32813. Kabola 124 94 12114. Alor Barat Laut 433 359 27915. Alor Tengah Utara 611 461 62616. Lembur - - -17. Pulau Pura 96 54 38
ALOR 4.347 3.572 3.365
Sumber: Dinas Kesehatan Kabupaten AlorSource: Public Health Service of Alor
Keterangan / Remark: Cakupan K1:Coverage of K1
Kunjungan ibu hamil kontak pertamaThe first check-up of a pregnant mother
Cakupan K1:Coverage of K1
Kunjungan ibu hamil ke-4 dalam triwulan 3The fourth check-up of a pregnant mother in thethird quartal
Kunjungan Neonatus:Neonatus Check-up
Kunjungan bayi baru lahir (0– 28 hari)The check-up of a baby (0 – 28 days)
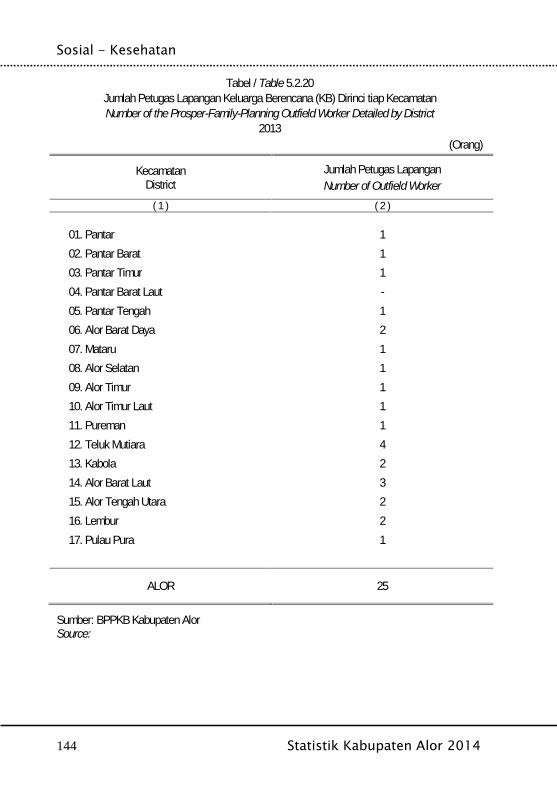
Sosial - Kesehatan
144 Statistik Kabupaten Alor 2014
Tabel / Table 5.2.20Jumlah Petugas Lapangan Keluarga Berencana (KB) Dirinci tiap KecamatanNumber of the Prosper-Family-Planning Outfield Worker Detailed by District
2013(Orang)
KecamatanDistrict
Jumlah Petugas LapanganNumber of Outfield Worker
( 1 ) ( 2 )
01. Pantar 102. Pantar Barat 103. Pantar Timur 104. Pantar Barat Laut -05. Pantar Tengah 106. Alor Barat Daya 207. Mataru 108. Alor Selatan 109. Alor Timur 110. Alor Timur Laut 111. Pureman 112. Teluk Mutiara 413. Kabola 214. Alor Barat Laut 315. Alor Tengah Utara 216. Lembur 217. Pulau Pura 1
ALOR 25
Sumber: BPPKB Kabupaten AlorSource:
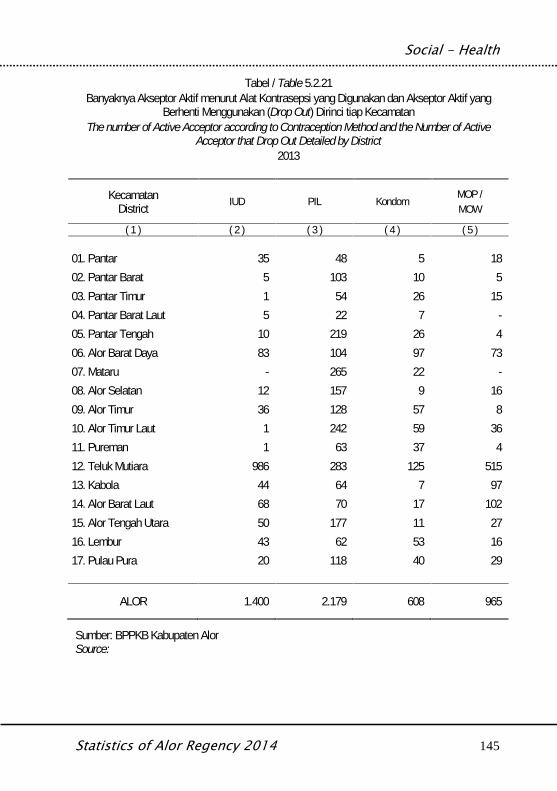
Social - Health
Statistics of Alor Regency 2014 145
Tabel / Table 5.2.21Banyaknya Akseptor Aktif menurut Alat Kontrasepsi yang Digunakan dan Akseptor Aktif yang
Berhenti Menggunakan (Drop Out) Dirinci tiap KecamatanThe number of Active Acceptor according to Contraception Method and the Number of Active
Acceptor that Drop Out Detailed by District2013
KecamatanDistrict IUD PIL Kondom MOP /
MOW
( 1 ) ( 2 ) ( 3 ) ( 4 ) ( 5 )
01. Pantar 35 48 5 1802. Pantar Barat 5 103 10 503. Pantar Timur 1 54 26 1504. Pantar Barat Laut 5 22 7 -05. Pantar Tengah 10 219 26 406. Alor Barat Daya 83 104 97 7307. Mataru - 265 22 -08. Alor Selatan 12 157 9 1609. Alor Timur 36 128 57 810. Alor Timur Laut 1 242 59 3611. Pureman 1 63 37 412. Teluk Mutiara 986 283 125 51513. Kabola 44 64 7 9714. Alor Barat Laut 68 70 17 10215. Alor Tengah Utara 50 177 11 2716. Lembur 43 62 53 1617. Pulau Pura 20 118 40 29
ALOR 1.400 2.179 608 965
Sumber: BPPKB Kabupaten AlorSource:

Sosial - Kesehatan
146 Statistik Kabupaten Alor 2014
Lanjutan Tabel / Countinued Table 5.2.21
KecamatanDistrict Suntikan Implant
JumlahTotal
(2+3+4+5+6+7)Akseptor yang Drop
Out
( 1 ) ( 6 ) ( 7 ) ( 8 ) ( 9 )
01. Pantar 762 65 933 13502. Pantar Barat 443 141 707 10603. Pantar Timur 639 110 845 32804. Pantar Barat Laut 337 78 449 18005. Pantar Tengah 830 142 1.231 29406. Alor Barat Daya 1.731 563 2.651 17607. Mataru 338 126 751 5408. Alor Selatan 436 156 786 30409. Alor Timur 711 213 1.153 25810. Alor Timur Laut 689 115 1.142 11211. Pureman 198 43 346 5212. Teluk Mutiara 2.287 422 4.618 70613. Kabola 560 114 886 12014. Alor Barat Laut 1.496 383 2.136 27815. Alor Tengah Utara 734 267 1.266 61316. Lembur 229 185 588 8817. Pulau Pura 464 105 776 83
ALOR 12.884 3.228 21.264 3.887
Sumber: BPPKB Kabupaten Alor
Source:
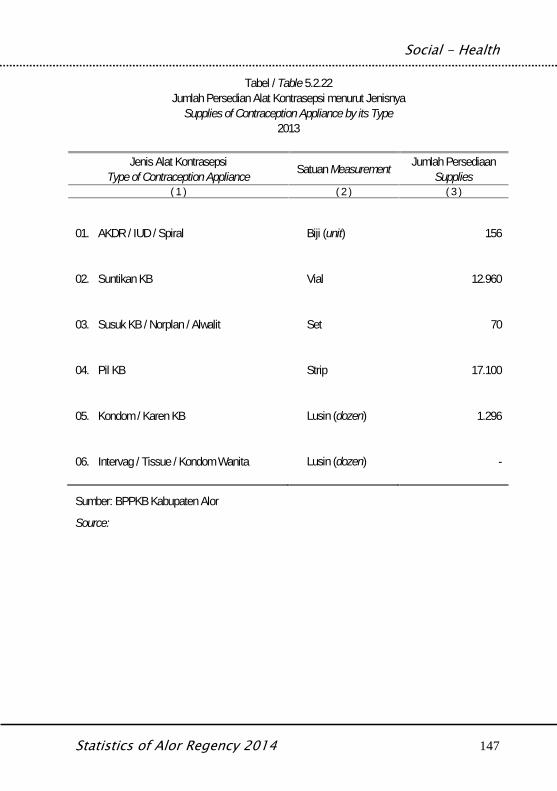
Social - Health
Statistics of Alor Regency 2014 147
Tabel / Table 5.2.22Jumlah Persedian Alat Kontrasepsi menurut Jenisnya
Supplies of Contraception Appliance by its Type2013
Jenis Alat KontrasepsiType of Contraception Appliance Satuan Measurement Jumlah Persediaan
Supplies( 1 ) ( 2 ) ( 3 )
01. AKDR / IUD / Spiral Biji (unit) 156
02. Suntikan KB Vial 12.960
03. Susuk KB / Norplan / Alwalit Set 70
04. Pil KB Strip 17.100
05. Kondom / Karen KB Lusin (dozen) 1.296
06. Intervag / Tissue / Kondom Wanita Lusin (dozen) -
Sumber: BPPKB Kabupaten Alor
Source:
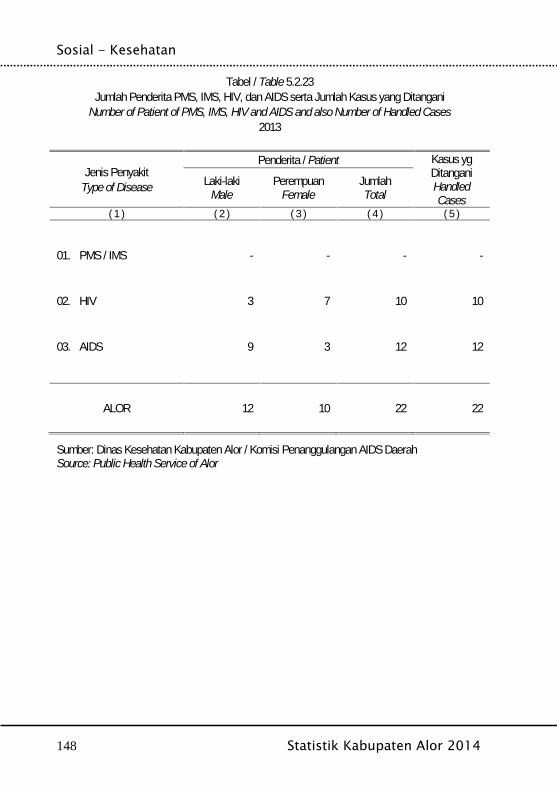
Sosial - Kesehatan
148 Statistik Kabupaten Alor 2014
Tabel / Table 5.2.23Jumlah Penderita PMS, IMS, HIV, dan AIDS serta Jumlah Kasus yang Ditangani
Number of Patient of PMS, IMS, HIV and AIDS and also Number of Handled Cases2013
Jenis PenyakitType of Disease
Penderita / Patient Kasus ygDitanganiHandledCases
Laki-lakiMale
PerempuanFemale
JumlahTotal
( 1 ) ( 2 ) ( 3 ) ( 4 ) ( 5 )
01. PMS / IMS - - - -
02. HIV 3 7 10 10
03. AIDS 9 3 12 12
ALOR 12 10 22 22
Sumber: Dinas Kesehatan Kabupaten Alor / Komisi Penanggulangan AIDS DaerahSource: Public Health Service of Alor
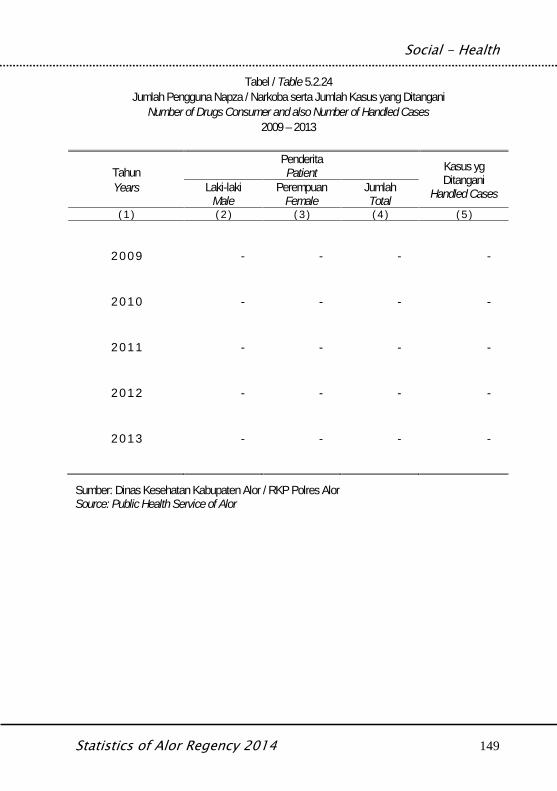
Social - Health
Statistics of Alor Regency 2014 149
Tabel / Table 5.2.24Jumlah Pengguna Napza / Narkoba serta Jumlah Kasus yang Ditangani
Number of Drugs Consumer and also Number of Handled Cases2009 – 2013
TahunYears
PenderitaPatient Kasus yg
DitanganiHandled CasesLaki-laki
MalePerempuan
FemaleJumlahTotal
( 1 ) ( 2 ) ( 3 ) ( 4 ) ( 5 )
2 0 0 9 - - - -
2 0 1 0 - - - -
2 0 1 1 - - - -
2 0 1 2 - - - -
2 0 1 3 - - - -
Sumber: Dinas Kesehatan Kabupaten Alor / RKP Polres AlorSource: Public Health Service of Alor
Sosial - Kesehatan
150 Statistik Kabupaten Alor 2014
Other Social Affairs
Statistics of Alor Regency 2014 151
BAB V.3SOSIAL LAINNYA
Other Social Affairs
Sosial - Lainnya
152 Statistik Kabupaten Alor 2014
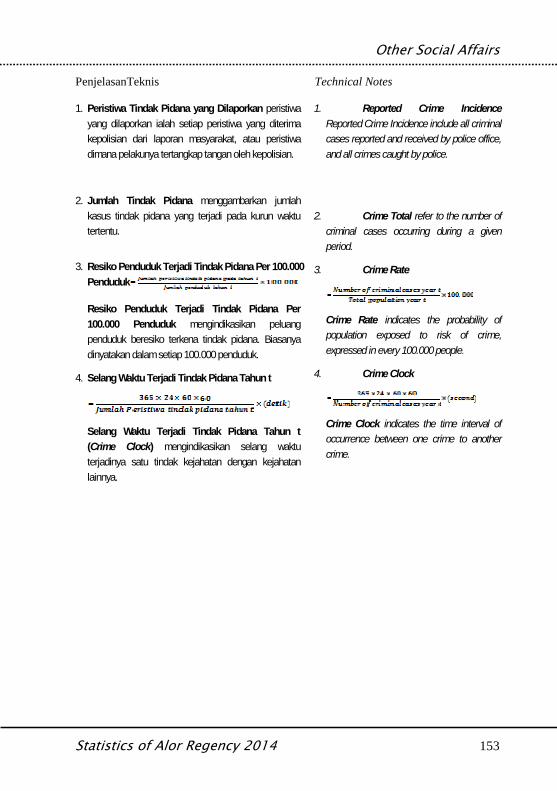
Other Social Affairs
Statistics of Alor Regency 2014 153
PenjelasanTeknis Technical Notes
1. Peristiwa Tindak Pidana yang Dilaporkan peristiwayang dilaporkan ialah setiap peristiwa yang diterimakepolisian dari laporan masyarakat, atau peristiwadimana pelakunya tertangkap tangan oleh kepolisian.
2. Jumlah Tindak Pidana menggambarkan jumlahkasus tindak pidana yang terjadi pada kurun waktutertentu.
3. Resiko Penduduk Terjadi Tindak Pidana Per 100.000Penduduk
Resiko Penduduk Terjadi Tindak Pidana Per100.000 Penduduk mengindikasikan peluangpenduduk beresiko terkena tindak pidana. Biasanyadinyatakan dalam setiap 100.000 penduduk.
4. Selang Waktu Terjadi Tindak Pidana Tahun t
Selang Waktu Terjadi Tindak Pidana Tahun t(Crime Clock) mengindikasikan selang waktuterjadinya satu tindak kejahatan dengan kejahatanlainnya.
1. Reported Crime IncidenceReported Crime Incidence include all criminalcases reported and received by police office,and all crimes caught by police.
2. Crime Total refer to the number ofcriminal cases occurring during a givenperiod.
3. Crime Rate
Crime Rate indicates the probability ofpopulation exposed to risk of crime,expressed in every 100.000 people.
4. Crime Clock
Crime Clock indicates the time interval ofoccurrence between one crime to anothercrime.
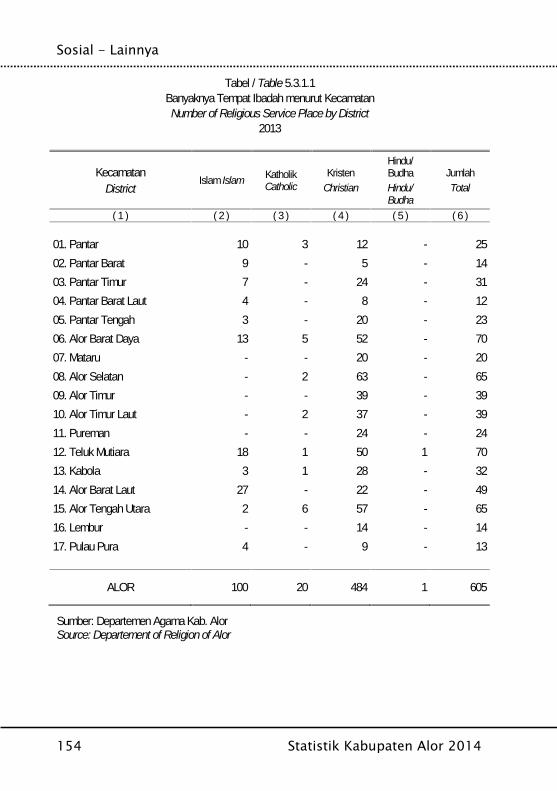
Sosial - Lainnya
154 Statistik Kabupaten Alor 2014
Tabel / Table 5.3.1.1Banyaknya Tempat Ibadah menurut KecamatanNumber of Religious Service Place by District
2013
KecamatanDistrict
Islam Islam KatholikCatholic
KristenChristian
Hindu/BudhaHindu/Budha
JumlahTotal
( 1 ) ( 2 ) ( 3 ) ( 4 ) ( 5 ) ( 6 )
01. Pantar 10 3 12 - 2502. Pantar Barat 9 - 5 - 1403. Pantar Timur 7 - 24 - 3104. Pantar Barat Laut 4 - 8 - 1205. Pantar Tengah 3 - 20 - 2306. Alor Barat Daya 13 5 52 - 7007. Mataru - - 20 - 2008. Alor Selatan - 2 63 - 6509. Alor Timur - - 39 - 3910. Alor Timur Laut - 2 37 - 3911. Pureman - - 24 - 2412. Teluk Mutiara 18 1 50 1 7013. Kabola 3 1 28 - 3214. Alor Barat Laut 27 - 22 - 4915. Alor Tengah Utara 2 6 57 - 6516. Lembur - - 14 - 1417. Pulau Pura 4 - 9 - 13
ALOR 100 20 484 1 605
Sumber: Departemen Agama Kab. AlorSource: Departement of Religion of Alor
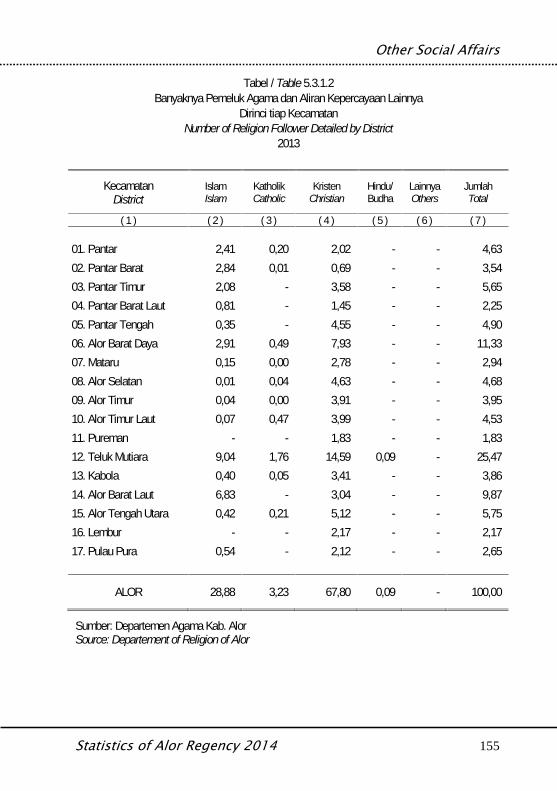
Other Social Affairs
Statistics of Alor Regency 2014 155
Tabel / Table 5.3.1.2Banyaknya Pemeluk Agama dan Aliran Kepercayaan Lainnya
Dirinci tiap KecamatanNumber of Religion Follower Detailed by District
2013
KecamatanDistrict
IslamIslam
KatholikCatholic
KristenChristian
Hindu/Budha
LainnyaOthers
JumlahTotal
( 1 ) ( 2 ) ( 3 ) ( 4 ) ( 5 ) ( 6 ) ( 7 )
01. Pantar 2,41 0,20 2,02 - - 4,6302. Pantar Barat 2,84 0,01 0,69 - - 3,5403. Pantar Timur 2,08 - 3,58 - - 5,6504. Pantar Barat Laut 0,81 - 1,45 - - 2,2505. Pantar Tengah 0,35 - 4,55 - - 4,9006. Alor Barat Daya 2,91 0,49 7,93 - - 11,3307. Mataru 0,15 0,00 2,78 - - 2,9408. Alor Selatan 0,01 0,04 4,63 - - 4,6809. Alor Timur 0,04 0,00 3,91 - - 3,9510. Alor Timur Laut 0,07 0,47 3,99 - - 4,5311. Pureman - - 1,83 - - 1,8312. Teluk Mutiara 9,04 1,76 14,59 0,09 - 25,4713. Kabola 0,40 0,05 3,41 - - 3,8614. Alor Barat Laut 6,83 - 3,04 - - 9,8715. Alor Tengah Utara 0,42 0,21 5,12 - - 5,7516. Lembur - - 2,17 - - 2,1717. Pulau Pura 0,54 - 2,12 - - 2,65
ALOR 28,88 3,23 67,80 0,09 - 100,00
Sumber: Departemen Agama Kab. AlorSource: Departement of Religion of Alor
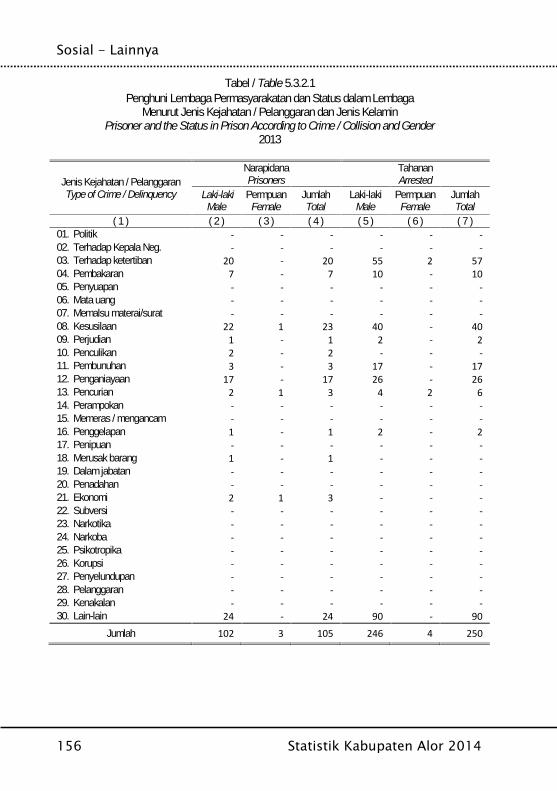
Sosial - Lainnya
156 Statistik Kabupaten Alor 2014
Tabel / Table 5.3.2.1Penghuni Lembaga Permasyarakatan dan Status dalam Lembaga
Menurut Jenis Kejahatan / Pelanggaran dan Jenis KelaminPrisoner and the Status in Prison According to Crime / Collision and Gender
2013
Jenis Kejahatan / PelanggaranType of Crime / Delinquency
NarapidanaPrisoners
TahananArrested
Laki-lakiMale
PermpuanFemale
JumlahTotal
Laki-lakiMale
PermpuanFemale
JumlahTotal
( 1 ) ( 2 ) ( 3 ) ( 4 ) ( 5 ) ( 6 ) ( 7 )01. Politik - - - - - -02. Terhadap Kepala Neg. - - - - - -03. Terhadap ketertiban 20 - 20 55 2 5704. Pembakaran 7 - 7 10 - 1005. Penyuapan - - - - - -06. Mata uang - - - - - -07. Memalsu materai/surat - - - - - -08. Kesusilaan 22 1 23 40 - 4009. Perjudian 1 - 1 2 - 210. Penculikan 2 - 2 - - -11. Pembunuhan 3 - 3 17 - 1712. Penganiayaan 17 - 17 26 - 2613. Pencurian 2 1 3 4 2 614. Perampokan - - - - - -15. Memeras / mengancam - - - - - -16. Penggelapan 1 - 1 2 - 217. Penipuan - - - - - -18. Merusak barang 1 - 1 - - -19. Dalam jabatan - - - - - -20. Penadahan - - - - - -21. Ekonomi 2 1 3 - - -22. Subversi - - - - - -23. Narkotika - - - - - -24. Narkoba - - - - - -25. Psikotropika - - - - - -26. Korupsi - - - - - -27. Penyelundupan - - - - - -28. Pelanggaran - - - - - -29. Kenakalan - - - - - -30. Lain-lain 24 - 24 90 - 90
Jumlah 102 3 105 246 4 250
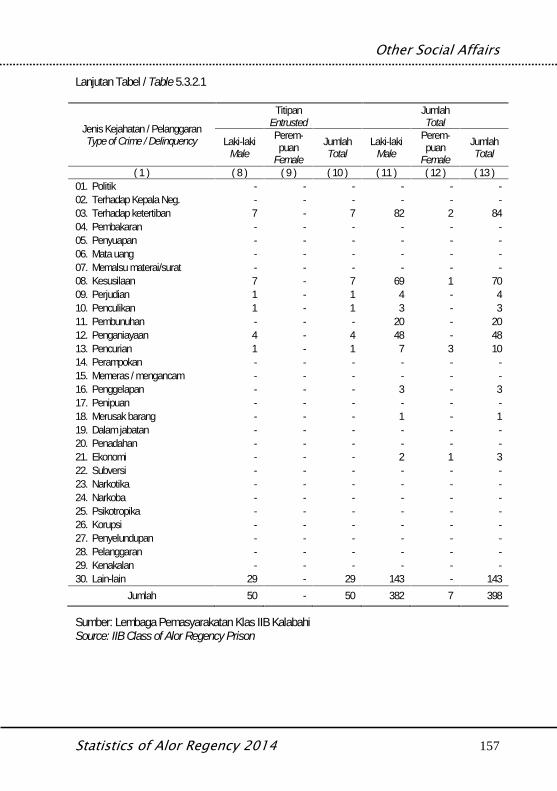
Other Social Affairs
Statistics of Alor Regency 2014 157
Lanjutan Tabel / Table 5.3.2.1
Jenis Kejahatan / PelanggaranType of Crime / Delinquency
TitipanEntrusted
JumlahTotal
Laki-lakiMale
Perem-puan
Female
JumlahTotal
Laki-lakiMale
Perem-puan
Female
JumlahTotal
( 1 ) ( 8 ) ( 9 ) ( 10 ) ( 11 ) ( 12 ) ( 13 )01. Politik - - - - - -02. Terhadap Kepala Neg. - - - - - -03. Terhadap ketertiban 7 - 7 82 2 8404. Pembakaran - - - - - -05. Penyuapan - - - - - -06. Mata uang - - - - - -07. Memalsu materai/surat - - - - - -08. Kesusilaan 7 - 7 69 1 7009. Perjudian 1 - 1 4 - 410. Penculikan 1 - 1 3 - 311. Pembunuhan - - - 20 - 2012. Penganiayaan 4 - 4 48 - 4813. Pencurian 1 - 1 7 3 1014. Perampokan - - - - - -15. Memeras / mengancam - - - - - -16. Penggelapan - - - 3 - 317. Penipuan - - - - - -18. Merusak barang - - - 1 - 119. Dalam jabatan - - - - - -20. Penadahan - - - - - -21. Ekonomi - - - 2 1 322. Subversi - - - - - -23. Narkotika - - - - - -24. Narkoba - - - - - -25. Psikotropika - - - - - -26. Korupsi - - - - - -27. Penyelundupan - - - - - -28. Pelanggaran - - - - - -29. Kenakalan - - - - - -30. Lain-lain 29 - 29 143 - 143
Jumlah 50 - 50 382 7 398
Sumber: Lembaga Pemasyarakatan Klas IIB KalabahiSource: IIB Class of Alor Regency Prison
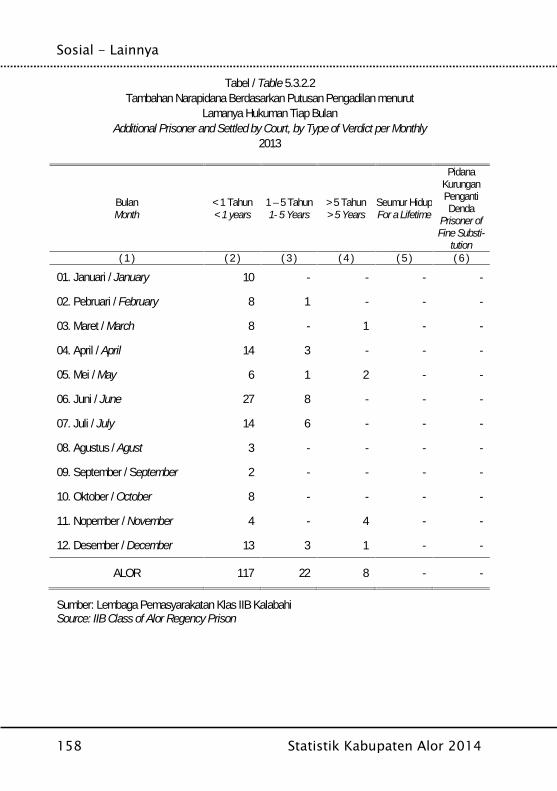
Sosial - Lainnya
158 Statistik Kabupaten Alor 2014
Tabel / Table 5.3.2.2Tambahan Narapidana Berdasarkan Putusan Pengadilan menurut
Lamanya Hukuman Tiap BulanAdditional Prisoner and Settled by Court, by Type of Verdict per Monthly
2013
BulanMonth
< 1 Tahun< 1 years
1 – 5 Tahun1- 5 Years
> 5 Tahun> 5 Years
Seumur HidupFor a Lifetime
PidanaKurunganPengantiDenda
Prisoner ofFine Substi-
tution( 1 ) ( 2 ) ( 3 ) ( 4 ) ( 5 ) ( 6 )
01. Januari / January 10 - - - -
02. Pebruari / February 8 1 - - -
03. Maret / March 8 - 1 - -
04. April / April 14 3 - - -
05. Mei / May 6 1 2 - -
06. Juni / June 27 8 - - -
07. Juli / July 14 6 - - -
08. Agustus / Agust 3 - - - -
09. September / September 2 - - - -
10. Oktober / October 8 - - - -
11. Nopember / November 4 - 4 - -
12. Desember / December 13 3 1 - -
ALOR 117 22 8 - -
Sumber: Lembaga Pemasyarakatan Klas IIB KalabahiSource: IIB Class of Alor Regency Prison
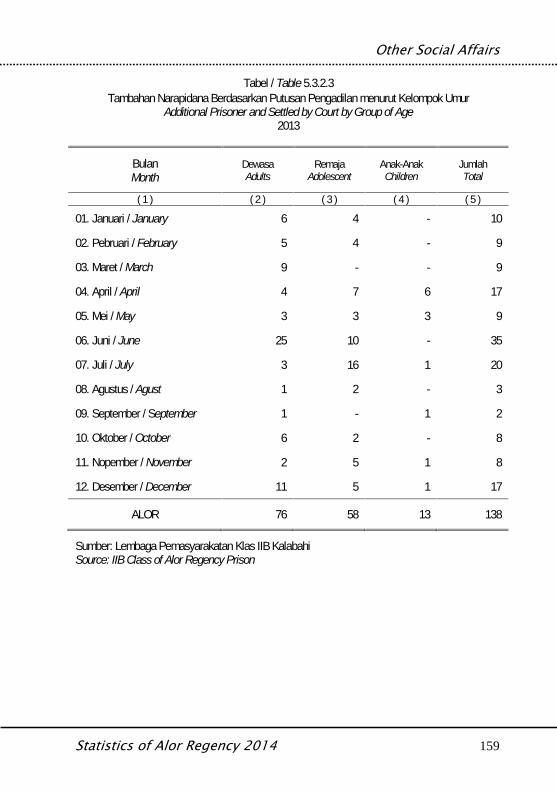
Other Social Affairs
Statistics of Alor Regency 2014 159
Tabel / Table 5.3.2.3Tambahan Narapidana Berdasarkan Putusan Pengadilan menurut Kelompok Umur
Additional Prisoner and Settled by Court by Group of Age2013
BulanMonth
DewasaAdults
RemajaAdolescent
Anak-AnakChildren
JumlahTotal
( 1 ) ( 2 ) ( 3 ) ( 4 ) ( 5 )
01. Januari / January 6 4 - 10
02. Pebruari / February 5 4 - 9
03. Maret / March 9 - - 9
04. April / April 4 7 6 17
05. Mei / May 3 3 3 9
06. Juni / June 25 10 - 35
07. Juli / July 3 16 1 20
08. Agustus / Agust 1 2 - 3
09. September / September 1 - 1 2
10. Oktober / October 6 2 - 8
11. Nopember / November 2 5 1 8
12. Desember / December 11 5 1 17
ALOR 76 58 13 138
Sumber: Lembaga Pemasyarakatan Klas IIB KalabahiSource: IIB Class of Alor Regency Prison
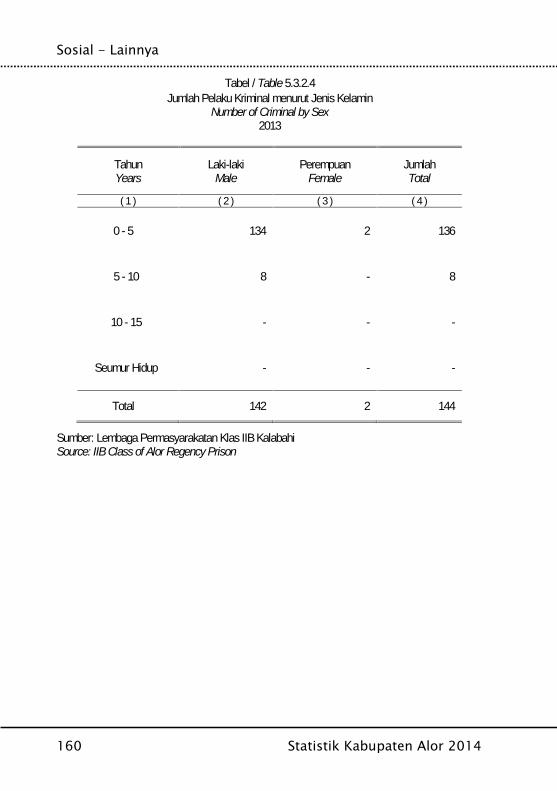
Sosial - Lainnya
160 Statistik Kabupaten Alor 2014
Tabel / Table 5.3.2.4Jumlah Pelaku Kriminal menurut Jenis Kelamin
Number of Criminal by Sex2013
TahunYears
Laki-lakiMale
PerempuanFemale
JumlahTotal
( 1 ) ( 2 ) ( 3 ) ( 4 )
0 - 5 134 2 136
5 - 10 8 - 8
10 - 15 - - -
Seumur Hidup - - -
Total 142 2 144
Sumber: Lembaga Permasyarakatan Klas IIB KalabahiSource: IIB Class of Alor Regency Prison
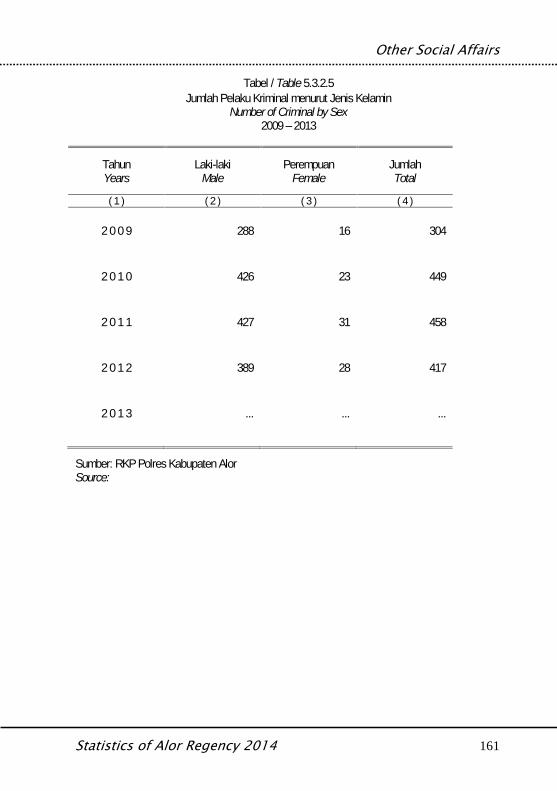
Other Social Affairs
Statistics of Alor Regency 2014 161
Tabel / Table 5.3.2.5Jumlah Pelaku Kriminal menurut Jenis Kelamin
Number of Criminal by Sex2009 – 2013
TahunYears
Laki-lakiMale
PerempuanFemale
JumlahTotal
( 1 ) ( 2 ) ( 3 ) ( 4 )
2 0 0 9 288 16 304
2 0 1 0 426 23 449
2 0 1 1 427 31 458
2 0 1 2 389 28 417
2 0 1 3 ... ... ...
Sumber: RKP Polres Kabupaten AlorSource:
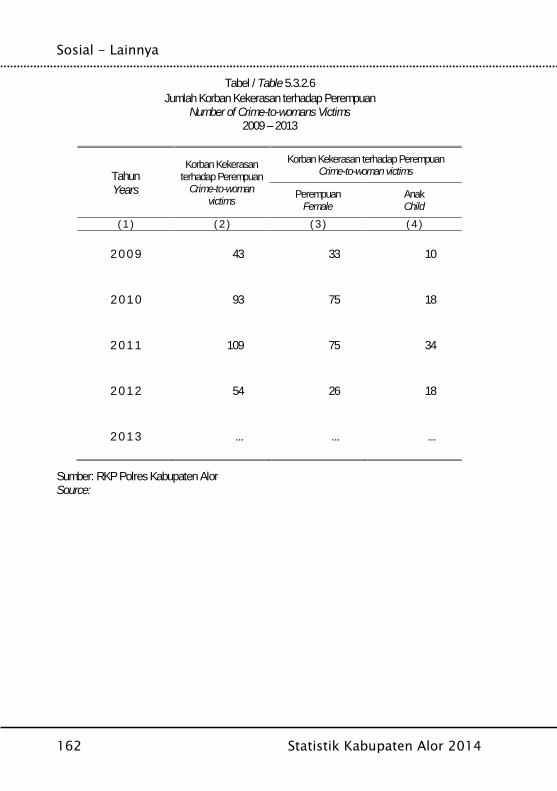
Sosial - Lainnya
162 Statistik Kabupaten Alor 2014
Tabel / Table 5.3.2.6Jumlah Korban Kekerasan terhadap Perempuan
Number of Crime-to-womans Victims2009 – 2013
TahunYears
Korban Kekerasanterhadap Perempuan
Crime-to-womanvictims
Korban Kekerasan terhadap PerempuanCrime-to-woman victims
PerempuanFemale
AnakChild
( 1 ) ( 2 ) ( 3 ) ( 4 )
2 0 0 9 43 33 10
2 0 1 0 93 75 18
2 0 1 1 109 75 34
2 0 1 2 54 26 18
2 0 1 3 ... ... ...
Sumber: RKP Polres Kabupaten AlorSource:

Other Social Affairs
Statistics of Alor Regency 2014 163
Tabel / Table 5.3.2.7Jumlah Laporan Korban Kekerasan terhadap Perempuan dirinci menurut Jenis Kekerasan
Number of Crime-to-womansVictims Report detailed by Kinds of Crime2013
Jenis Tindak KekerasanKinds of Crime
JumlahNumber
PersentasePercentage
( 1 ) ( 2 ) ( 3 )
01. Pelecehan Seksual / SexualAbusement ... ...
02. Kekerasan dalam Rumah Tangga / ... ...
03. Penganiayaan / Abusement ... ...
JumlahTotal ... ...
Sumber: RKP Polres Kabupaten AlorSource:
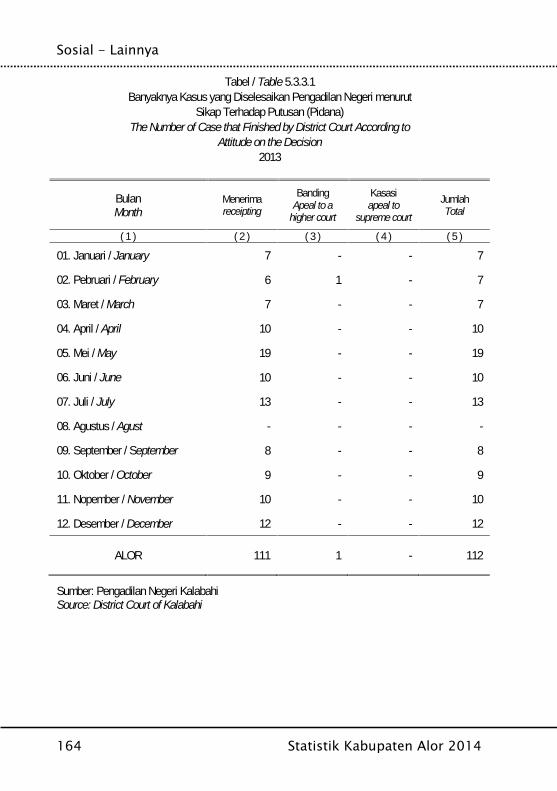
Sosial - Lainnya
164 Statistik Kabupaten Alor 2014
Tabel / Table 5.3.3.1Banyaknya Kasus yang Diselesaikan Pengadilan Negeri menurut
Sikap Terhadap Putusan (Pidana)The Number of Case that Finished by District Court According to
Attitude on the Decision2013
BulanMonth
Menerimareceipting
BandingApeal to a
higher court
Kasasiapeal to
supreme court
JumlahTotal
( 1 ) ( 2 ) ( 3 ) ( 4 ) ( 5 )
01. Januari / January 7 - - 7
02. Pebruari / February 6 1 - 7
03. Maret / March 7 - - 7
04. April / April 10 - - 10
05. Mei / May 19 - - 19
06. Juni / June 10 - - 10
07. Juli / July 13 - - 13
08. Agustus / Agust - - - -
09. September / September 8 - - 8
10. Oktober / October 9 - - 9
11. Nopember / November 10 - - 10
12. Desember / December 12 - - 12
ALOR 111 1 - 112
Sumber: Pengadilan Negeri KalabahiSource: District Court of Kalabahi
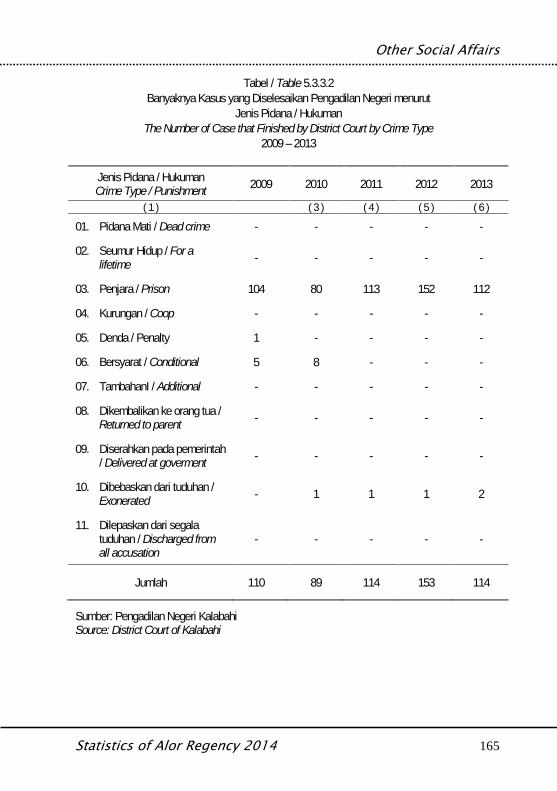
Other Social Affairs
Statistics of Alor Regency 2014 165
Tabel / Table 5.3.3.2Banyaknya Kasus yang Diselesaikan Pengadilan Negeri menurut
Jenis Pidana / HukumanThe Number of Case that Finished by District Court by Crime Type
2009 – 2013
Jenis Pidana / HukumanCrime Type / Punishment 2009 2010 2011 2012 2013
( 1 ) ( 3 ) ( 4 ) ( 5 ) ( 6 )
01. Pidana Mati / Dead crime - - - - -
02. Seumur Hidup / For alifetime - - - - -
03. Penjara / Prison 104 80 113 152 112
04. Kurungan / Coop - - - - -
05. Denda / Penalty 1 - - - -
06. Bersyarat / Conditional 5 8 - - -
07. TambahanI / Additional - - - - -
08. Dikembalikan ke orang tua /Returned to parent - - - - -
09. Diserahkan pada pemerintah/ Delivered at goverment - - - - -
10. Dibebaskan dari tuduhan /Exonerated - 1 1 1 2
11. Dilepaskan dari segalatuduhan / Discharged fromall accusation
- - - - -
Jumlah 110 89 114 153 114
Sumber: Pengadilan Negeri KalabahiSource: District Court of Kalabahi
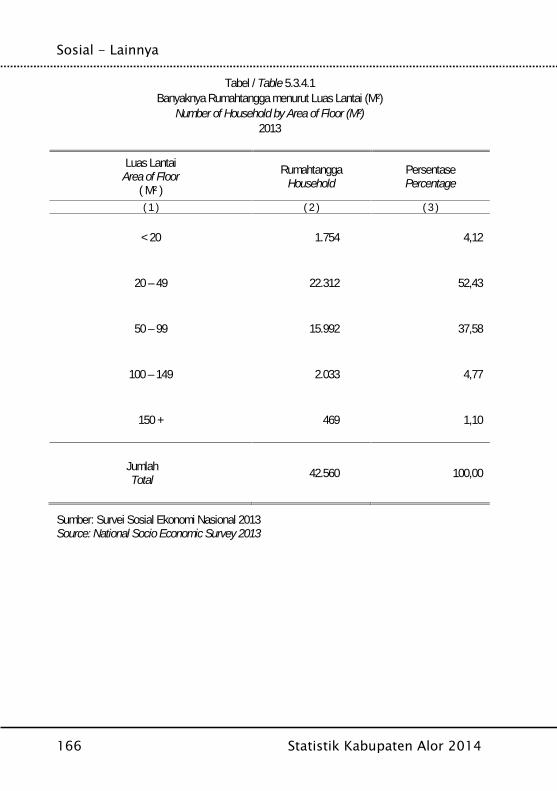
Sosial - Lainnya
166 Statistik Kabupaten Alor 2014
Tabel / Table 5.3.4.1Banyaknya Rumahtangga menurut Luas Lantai (M²)
Number of Household by Area of Floor (M²)2013
Luas LantaiArea of Floor
( M² )Rumahtangga
HouseholdPersentasePercentage
( 1 ) ( 2 ) ( 3 )
< 20 1.754 4,12
20 – 49 22.312 52,43
50 – 99 15.992 37,58
100 – 149 2.033 4,77
150 + 469 1,10
JumlahTotal 42.560 100,00
Sumber: Survei Sosial Ekonomi Nasional 2013Source: National Socio Economic Survey 2013
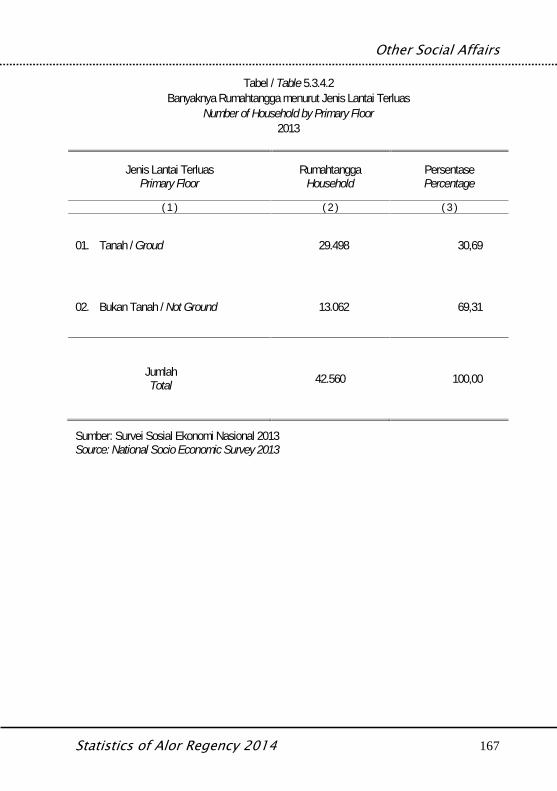
Other Social Affairs
Statistics of Alor Regency 2014 167
Tabel / Table 5.3.4.2Banyaknya Rumahtangga menurut Jenis Lantai Terluas
Number of Household by Primary Floor2013
Jenis Lantai TerluasPrimary Floor
RumahtanggaHousehold
PersentasePercentage
( 1 ) ( 2 ) ( 3 )
01. Tanah / Groud 29.498 30,69
02. Bukan Tanah / Not Ground 13.062 69,31
JumlahTotal 42.560 100,00
Sumber: Survei Sosial Ekonomi Nasional 2013Source: National Socio Economic Survey 2013
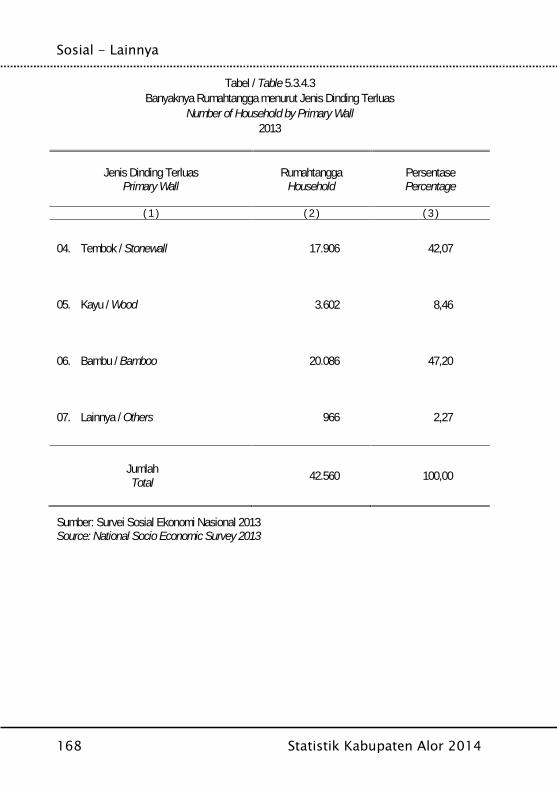
Sosial - Lainnya
168 Statistik Kabupaten Alor 2014
Tabel / Table 5.3.4.3Banyaknya Rumahtangga menurut Jenis Dinding Terluas
Number of Household by Primary Wall2013
Jenis Dinding TerluasPrimary Wall
RumahtanggaHousehold
PersentasePercentage
( 1 ) ( 2 ) ( 3 )
04. Tembok / Stonewall 17.906 42,07
05. Kayu / Wood 3.602 8,46
06. Bambu / Bamboo 20.086 47,20
07. Lainnya / Others 966 2,27
JumlahTotal 42.560 100,00
Sumber: Survei Sosial Ekonomi Nasional 2013Source: National Socio Economic Survey 2013
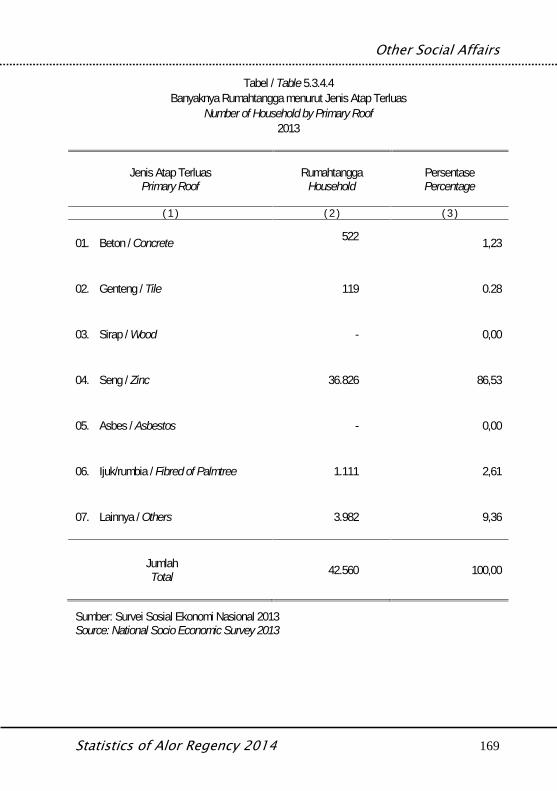
Other Social Affairs
Statistics of Alor Regency 2014 169
Tabel / Table 5.3.4.4Banyaknya Rumahtangga menurut Jenis Atap Terluas
Number of Household by Primary Roof2013
Jenis Atap TerluasPrimary Roof
RumahtanggaHousehold
PersentasePercentage
( 1 ) ( 2 ) ( 3 )
01. Beton / Concrete 522 1,23
02. Genteng / Tile 119 0.28
03. Sirap / Wood - 0,00
04. Seng / Zinc 36.826 86,53
05. Asbes / Asbestos - 0,00
06. Ijuk/rumbia / Fibred of Palmtree 1.111 2,61
07. Lainnya / Others 3.982 9,36
JumlahTotal 42.560 100,00
Sumber: Survei Sosial Ekonomi Nasional 2013Source: National Socio Economic Survey 2013
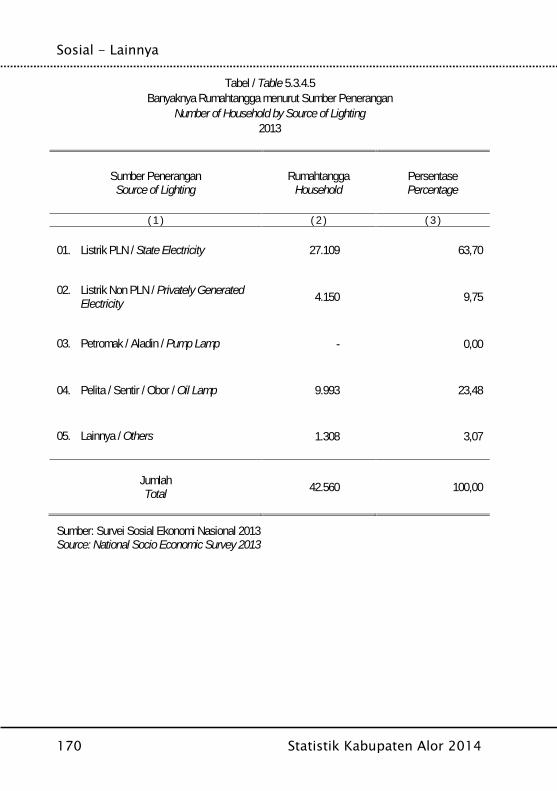
Sosial - Lainnya
170 Statistik Kabupaten Alor 2014
Tabel / Table 5.3.4.5Banyaknya Rumahtangga menurut Sumber Penerangan
Number of Household by Source of Lighting2013
Sumber PeneranganSource of Lighting
RumahtanggaHousehold
PersentasePercentage
( 1 ) ( 2 ) ( 3 )
01. Listrik PLN / State Electricity 27.109 63,70
02. Listrik Non PLN / Privately GeneratedElectricity 4.150 9,75
03. Petromak / Aladin / Pump Lamp - 0,00
04. Pelita / Sentir / Obor / Oil Lamp 9.993 23,48
05. Lainnya / Others 1.308 3,07
JumlahTotal 42.560 100,00
Sumber: Survei Sosial Ekonomi Nasional 2013Source: National Socio Economic Survey 2013
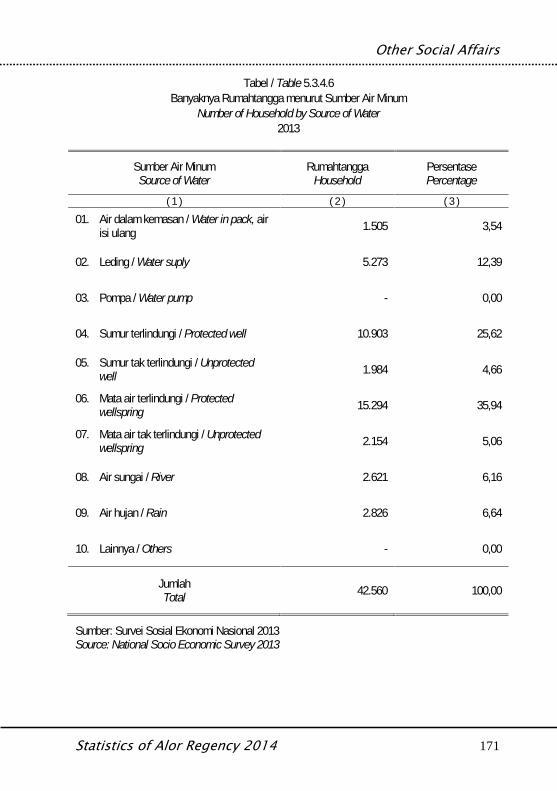
Other Social Affairs
Statistics of Alor Regency 2014 171
Tabel / Table 5.3.4.6Banyaknya Rumahtangga menurut Sumber Air Minum
Number of Household by Source of Water2013
Sumber Air MinumSource of Water
RumahtanggaHousehold
PersentasePercentage
( 1 ) ( 2 ) ( 3 )01. Air dalam kemasan / Water in pack, air
isi ulang 1.505 3,54
02. Leding / Water suply 5.273 12,39
03. Pompa / Water pump - 0,00
04. Sumur terlindungi / Protected well 10.903 25,62
05. Sumur tak terlindungi / Unprotectedwell 1.984 4,66
06. Mata air terlindungi / Protectedwellspring 15.294 35,94
07. Mata air tak terlindungi / Unprotectedwellspring 2.154 5,06
08. Air sungai / River 2.621 6,16
09. Air hujan / Rain 2.826 6,64
10. Lainnya / Others - 0,00
JumlahTotal 42.560 100,00
Sumber: Survei Sosial Ekonomi Nasional 2013Source: National Socio Economic Survey 2013
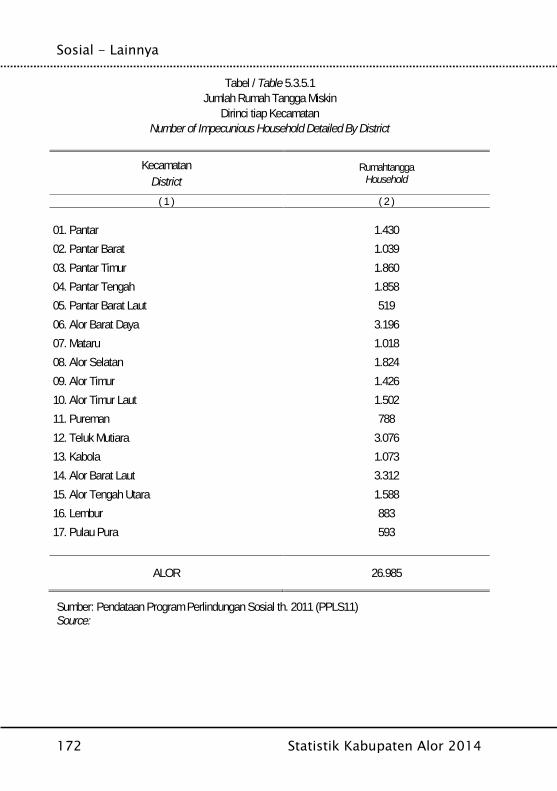
Sosial - Lainnya
172 Statistik Kabupaten Alor 2014
Tabel / Table 5.3.5.1Jumlah Rumah Tangga Miskin
Dirinci tiap KecamatanNumber of Impecunious Household Detailed By District
KecamatanDistrict
RumahtanggaHousehold
( 1 ) ( 2 )
01. Pantar 1.43002. Pantar Barat 1.03903. Pantar Timur 1.86004. Pantar Tengah 1.85805. Pantar Barat Laut 51906. Alor Barat Daya 3.19607. Mataru 1.01808. Alor Selatan 1.82409. Alor Timur 1.42610. Alor Timur Laut 1.50211. Pureman 78812. Teluk Mutiara 3.07613. Kabola 1.07314. Alor Barat Laut 3.31215. Alor Tengah Utara 1.58816. Lembur 88317. Pulau Pura 593
ALOR 26.985
Sumber: Pendataan Program Perlindungan Sosial th. 2011 (PPLS11)Source:
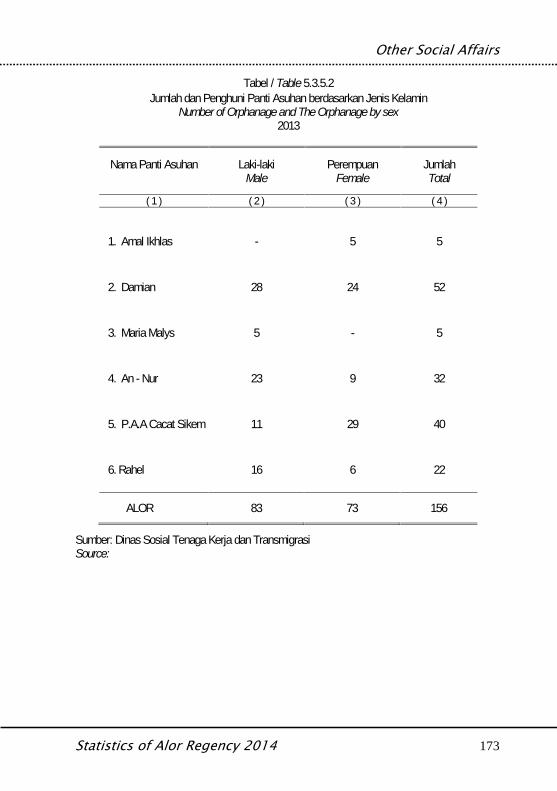
Other Social Affairs
Statistics of Alor Regency 2014 173
Tabel / Table 5.3.5.2Jumlah dan Penghuni Panti Asuhan berdasarkan Jenis Kelamin
Number of Orphanage and The Orphanage by sex2013
Nama Panti Asuhan Laki-lakiMale
PerempuanFemale
JumlahTotal
( 1 ) ( 2 ) ( 3 ) ( 4 )
1. Amal Ikhlas - 5 5
2. Damian 28 24 52
3. Maria Malys 5 - 5
4. An - Nur 23 9 32
5. P.A.A Cacat Sikem 11 29 40
6. Rahel 16 6 22
ALOR 83 73 156
Sumber: Dinas Sosial Tenaga Kerja dan TransmigrasiSource:
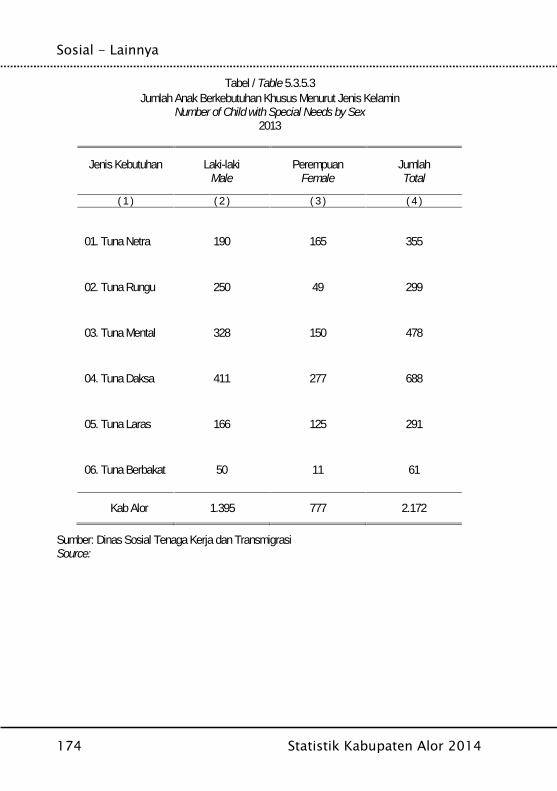
Sosial - Lainnya
174 Statistik Kabupaten Alor 2014
Tabel / Table 5.3.5.3Jumlah Anak Berkebutuhan Khusus Menurut Jenis Kelamin
Number of Child with Special Needs by Sex2013
Jenis Kebutuhan Laki-lakiMale
PerempuanFemale
JumlahTotal
( 1 ) ( 2 ) ( 3 ) ( 4 )
01. Tuna Netra 190 165 355
02. Tuna Rungu 250 49 299
03. Tuna Mental 328 150 478
04. Tuna Daksa 411 277 688
05. Tuna Laras 166 125 291
06. Tuna Berbakat 50 11 61
Kab Alor 1.395 777 2.172
Sumber: Dinas Sosial Tenaga Kerja dan TransmigrasiSource:
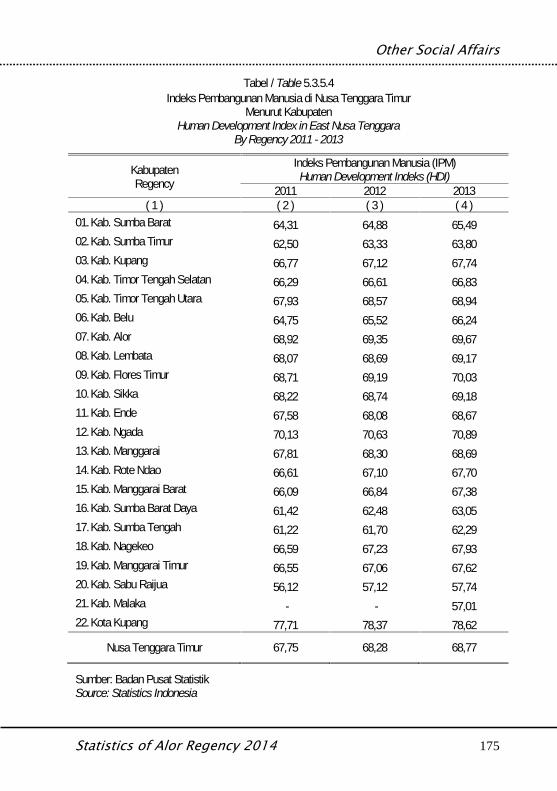
Other Social Affairs
Statistics of Alor Regency 2014 175
Tabel / Table 5.3.5.4Indeks Pembangunan Manusia di Nusa Tenggara Timur
Menurut KabupatenHuman Development Index in East Nusa Tenggara
By Regency 2011 - 2013
KabupatenRegency
Indeks Pembangunan Manusia (IPM)Human Development Indeks (HDI)
2011 2012 2013( 1 ) ( 2 ) ( 3 ) ( 4 )
01. Kab. Sumba Barat 64,31 64,88 65,4902. Kab. Sumba Timur 62,50 63,33 63,8003. Kab. Kupang 66,77 67,12 67,7404. Kab. Timor Tengah Selatan 66,29 66,61 66,8305. Kab. Timor Tengah Utara 67,93 68,57 68,9406. Kab. Belu 64,75 65,52 66,2407. Kab. Alor 68,92 69,35 69,6708. Kab. Lembata 68,07 68,69 69,1709. Kab. Flores Timur 68,71 69,19 70,0310. Kab. Sikka 68,22 68,74 69,1811. Kab. Ende 67,58 68,08 68,6712. Kab. Ngada 70,13 70,63 70,8913. Kab. Manggarai 67,81 68,30 68,6914. Kab. Rote Ndao 66,61 67,10 67,7015. Kab. Manggarai Barat 66,09 66,84 67,3816. Kab. Sumba Barat Daya 61,42 62,48 63,0517. Kab. Sumba Tengah 61,22 61,70 62,2918. Kab. Nagekeo 66,59 67,23 67,9319. Kab. Manggarai Timur 66,55 67,06 67,6220. Kab. Sabu Raijua 56,12 57,12 57,7421. Kab. Malaka - - 57,0122. Kota Kupang 77,71 78,37 78,62
Nusa Tenggara Timur 67,75 68,28 68,77
Sumber: Badan Pusat StatistikSource: Statistics Indonesia
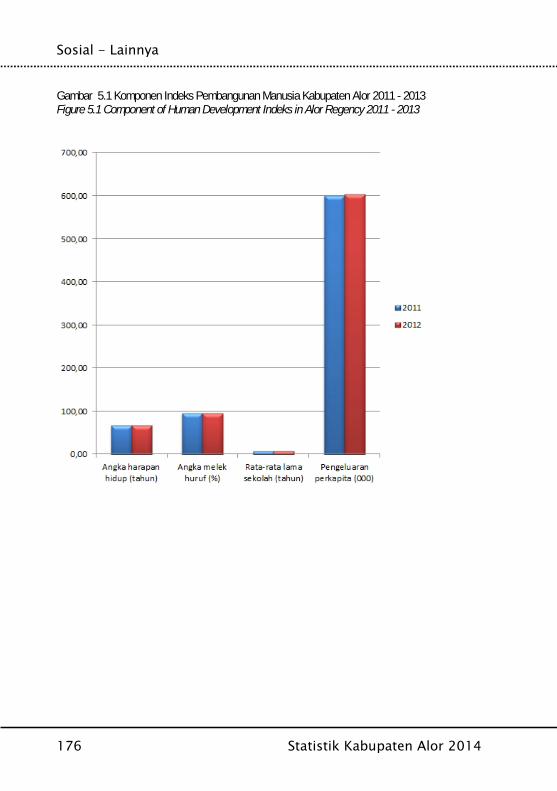
Sosial - Lainnya
176 Statistik Kabupaten Alor 2014
Gambar 5.1 Komponen Indeks Pembangunan Manusia Kabupaten Alor 2011 - 2013Figure 5.1 Component of Human Development Indeks in Alor Regency 2011 - 2013
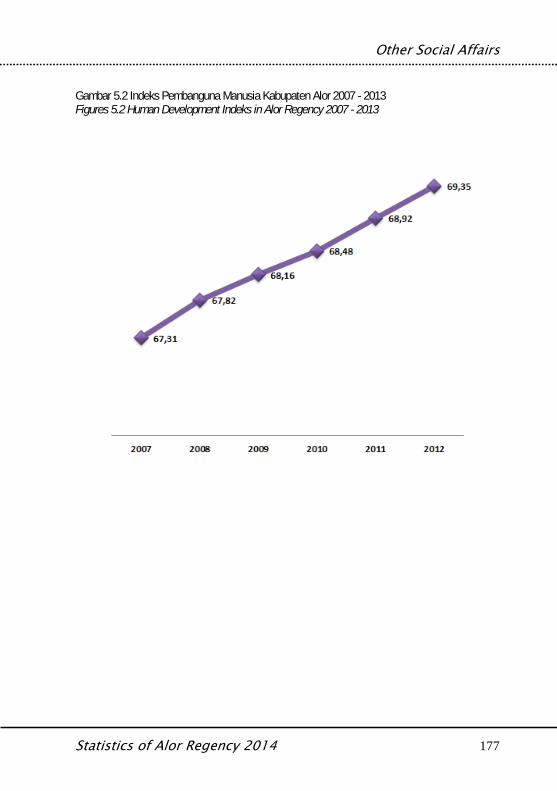
Other Social Affairs
Statistics of Alor Regency 2014 177
Gambar 5.2 Indeks Pembanguna Manusia Kabupaten Alor 2007 - 2013Figures 5.2 Human Development Indeks in Alor Regency 2007 - 2013

Sosial - Lainnya
178 Statistik Kabupaten Alor 2014
Agriculture – Food Crops
Statistics of Alor Regency 2014 185
BAB VIPERTANIAN
Agriculture
Pertanian – Tanaman Pangan
186 Statistik Kabupaten Alor 2014
Agriculture – Food Crops
Statistics of Alor Regency 2014 187
Penjelasan Teknis Technical Notes
1. Luas Panen adalah luas tanaman sayuran, buah-buahan, biofarmaka dan tanaman hias yangdiambil hasilnya/ dipanen pada periodepelaporan.
2. Luas panen untuk tanaman sayuran: luastanaman yang dipanen sekaligus/habis/dibongkar dan luas tanaman yang dipanenberkali-kali (lebih dari satu kali)/ belum habis,
a. Tanaman yang dipanen sekaligus/ habis/dibongkar adalah tanaman yang sehabispanen langsung dibongkar/ dicabut, terdiri daribawang merah, bawang putih, bawang daun,kentang, kol/ kubis, kembang kol, petsai/ sawi,wortel, lobak dan kacang merah.
b. Tanaman yang dipanen berkali-kali (lebih darisatu kali)/ belum habis adalah tanaman yangpemanenannya lebih dari satu kali danbiasanya dibongkar apabila panenan terakhirsudah tidka memadai lagi, terdiri dari: kacangpanjang, cabe besar, cabe rawit, jamur, tomat,terung, buncis, ketimun, labu siam, kangkung,bayam, melon, semangka dan blewah.
3. Produksi adalah hasil menurut bentuk produk darisetiap tanaman sayuran, buah-buahan,biofarmaka dan tanaman hias yang diambilberdasarkan luas yang dipanen pada bulan/triwulan laporan.
4. Data perkebunan besar dikumpulkan oleh BPSsetiap bulan secara lengkap (sensus bulanan)dengan system surat pos. Khusus untuk tanamankelapa, cengkeh dan kapok, datanya diperolehdari Direktorat Jendral Perkebunan. Dataperkebunan rakyat juga diperoleh dari DirektoratJendral Perkebunan.
5. Penghitungan luas tanaman perkebunan besar
1. Harvested area is area which vegetable, fruit,medicinal and ornamental plant of crop harvestedduring the period of report.
2. Harvested area of vegetables: area of entirely plantharvested/demolished and plant harvested severaltimes/undemolished,
a. Entirely plants harvested/ demolished are plantsusually harvested once and demolished to besubstituted by other plants, consisting of shallot,garlic, leeks, potato, cabbage, cauliflower,mustard green, carrots, chinese radish and redkidney beans.
b. Plants harvested several times/ undemolishedare plants usually harvested more than once anddemolished in the case that the last harvest waseconomically not profitable. They consist of: yardlong beans, chili, small chili, mushroom,tomatoes, egg plants, french beans, cucumber,pumpkin/ chajota, swamp cabbage, spinach,melon, watermelon and blewah.
3. Production is the standard production quantity formof vegetable, fruit, medicinal and ornamental plantbased on harvested area reported monthly/quartertly.
4. Data on estates are collected by the BPS everymonth on complete basis through a mailing system.Data on coconut, clove, and kapok, as well assmallholder plantation, are acquired from theDirectorate General of Estates.
Pertanian – Tanaman Pangan
188 Statistik Kabupaten Alor 2014
adalah pada keadaan akhir tahun dan tidaktermasuk yang luasnya kurang dari 5 hektar.
6. Bentuk produksi perkebunan adalah: karet kering(karet), daun kering (teh dan tembakau), bijikering (kopi dan cokelat), kulit kering (kayu manisdan kina), serat kering (rami), bunga kering(cengkeh), refined sugar (tebu dari perkebunanbesar), gula mangkok (tebu dari perkebunanrakyat), equivalent kopra (kopra), biji dan bungapala (pala) serta minyak daun (sereh).
7. Data Statistik Kehutanan sebagian besarmerupakan data sekunder yang bersumber dariKementrian Kehutanan.
8. Hutan Konservasi adalah kawasan hutan denganciri khas tertentu, yang mempunyai fungsi pokokpengawetan keanekaragaman tumbuhan dansatwa serta ekosistemnya.
9. Hutan Lindung adalah kawasan hutan yangmempunyai fungsi pokok sebagai perlindungansistem penyangga kehidupan untuk mengatur tataair, mencegah banjir, mengendalikan erosi,mencegah intrusi air laut, dan memeliharakesuburan tanah.
5. Planted area of estates refer to condition at the endof the year, and do not include area less than 5hectares.
6. Production of estates crops are follows: dry rubber(rubber), dry leaves (tea and tobacco), dry beans(coffee and cocoa), dry bark (cassiavera andcinchona), dry fiber (rosella), dry flowers/buds(cloves), refined sugar (sugar cane from estate),cup sugar (sugar cane from smallholders), copra(copra), seeds and buds (nutmeg) and leaf oil(citronella).
7. Most forestry statistics are secondary data obtainedfrom the Ministry of Forestry.
8. Conservation Forest is a forest area having specificcharacteristic established for the purpose ofconservation of animal and plant species and theirecosystem.
9. Protection Forest is a forest area designated toserve life support system, maintain hydrologicalsystem, prevent of flood, erosion control, seawaterintrusion, and maintain soil fertility.

Agriculture – Food Crops
Statistics of Alor Regency 2014 189
BAB VI.1TANAMAN PANGAN
Food Crops
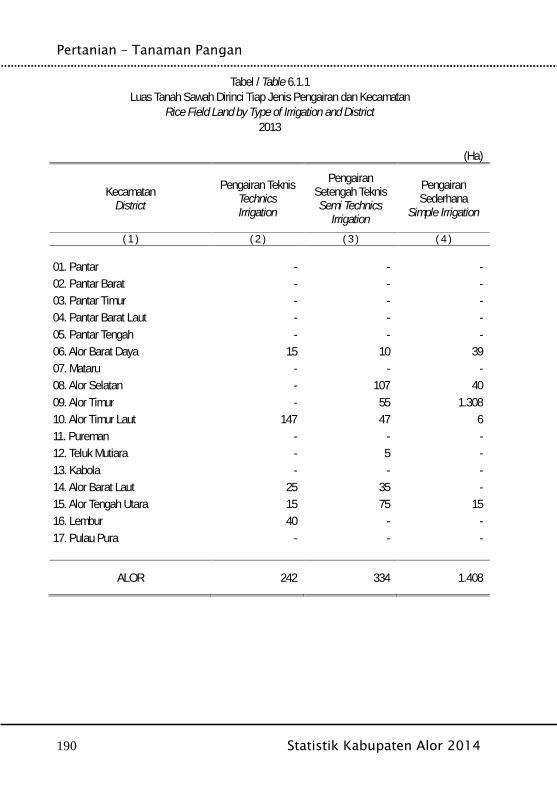
Pertanian – Tanaman Pangan
190 Statistik Kabupaten Alor 2014
Tabel / Table 6.1.1Luas Tanah Sawah Dirinci Tiap Jenis Pengairan dan Kecamatan
Rice Field Land by Type of Irrigation and District2013
(Ha)
KecamatanDistrict
Pengairan TeknisTechnicsIrrigation
PengairanSetengah TeknisSemi Technics
Irrigation
PengairanSederhana
Simple Irrigation
( 1 ) ( 2 ) ( 3 ) ( 4 )
01. Pantar - - -02. Pantar Barat - - -03. Pantar Timur - - -04. Pantar Barat Laut - - -05. Pantar Tengah - - -06. Alor Barat Daya 15 10 3907. Mataru - - -08. Alor Selatan - 107 4009. Alor Timur - 55 1.30810. Alor Timur Laut 147 47 611. Pureman - - -12. Teluk Mutiara - 5 -13. Kabola - - -14. Alor Barat Laut 25 35 -15. Alor Tengah Utara 15 75 1516. Lembur 40 - -17. Pulau Pura - - -
ALOR 242 334 1.408
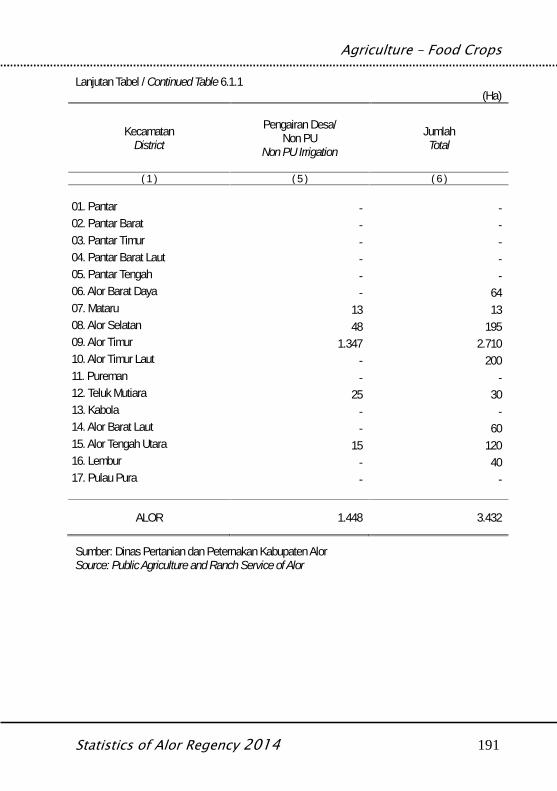
Agriculture – Food Crops
Statistics of Alor Regency 2014 191
Lanjutan Tabel / Continued Table 6.1.1(Ha)
KecamatanDistrict
Pengairan Desa/Non PU
Non PU Irrigation
JumlahTotal
( 1 ) ( 5 ) ( 6 )
01. Pantar - -02. Pantar Barat - -03. Pantar Timur - -04. Pantar Barat Laut - -05. Pantar Tengah - -06. Alor Barat Daya - 6407. Mataru 13 1308. Alor Selatan 48 19509. Alor Timur 1.347 2.71010. Alor Timur Laut - 20011. Pureman - -12. Teluk Mutiara 25 3013. Kabola - -14. Alor Barat Laut - 6015. Alor Tengah Utara 15 12016. Lembur - 4017. Pulau Pura - -
ALOR 1.448 3.432
Sumber: Dinas Pertanian dan Peternakan Kabupaten AlorSource: Public Agriculture and Ranch Service of Alor

Pertanian – Tanaman Pangan
192 Statistik Kabupaten Alor 2014
Tabel / Table 6.1.2Luas Lahan Kering Dirinci Tiap Penggunaannya dan Kecamatan
Area of Dry Land by Type of Utilization and District2013
(Ha)
KecamatanDistict
TanahPekarangan
HouseCompound
Tegalan/Kebun
Dryland Garden
Ladang/Huma
Dry Agri-culture Field
Padang RumputMeadows
( 1 ) ( 2 ) ( 3 ) ( 4 ) ( 5 )
01. Pantar 191 371 931 2.08902. Pantar Barat 82 280 719 73203. Pantar Timur 33 597 1.515 23704. Pantar Barat Laut 15 557 774 20005. Pantar Tengah 31 787 903 2.68806. Alor Barat Daya 58 484 2.092 3.53007. Mataru 16 117 384 2.03608. Alor Selatan 28 443 1.226 13009. Alor Timur 23 635 1.619 4.60010. Alor Timur Laut 29 423 1.011 3.69011. Pureman 11 376 514 80012. Teluk Mutiara 133 136 317 613. Kabola 25 213 665 1314. Alor Barat Laut 64 676 1.279 13415. Alor Tengah Utara 37 323 1.064 13116. Lembur 14 309 704 1.30017. Pulau Pura 19 74 145 6
ALOR 809 6.801 15.862 22.322
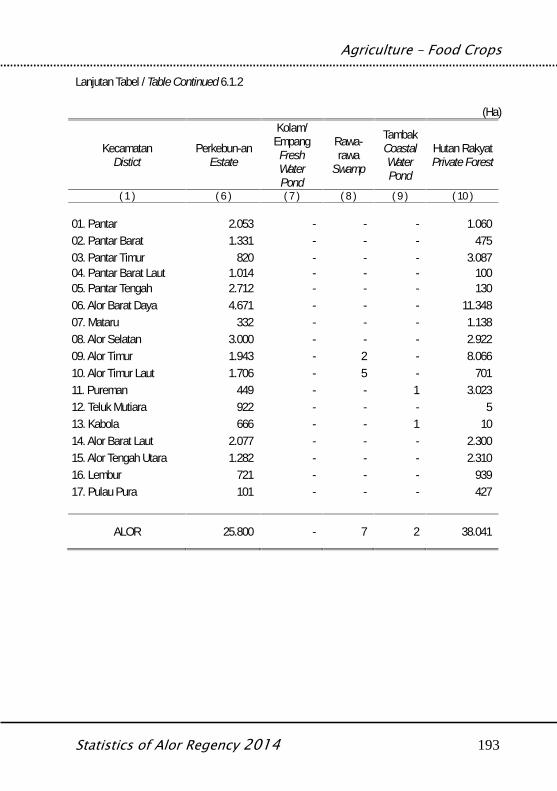
Agriculture – Food Crops
Statistics of Alor Regency 2014 193
Lanjutan Tabel / Table Continued 6.1.2
(Ha)
KecamatanDistict
Perkebun-anEstate
Kolam/Empang
FreshWaterPond
Rawa-rawa
Swamp
TambakCoastalWaterPond
Hutan RakyatPrivate Forest
( 1 ) ( 6 ) ( 7 ) ( 8 ) ( 9 ) ( 10 )
01. Pantar 2.053 - - - 1.06002. Pantar Barat 1.331 - - - 47503. Pantar Timur 820 - - - 3.08704. Pantar Barat Laut 1.014 - - - 10005. Pantar Tengah 2.712 - - - 13006. Alor Barat Daya 4.671 - - - 11.34807. Mataru 332 - - - 1.13808. Alor Selatan 3.000 - - - 2.92209. Alor Timur 1.943 - 2 - 8.06610. Alor Timur Laut 1.706 - 5 - 70111. Pureman 449 - - 1 3.02312. Teluk Mutiara 922 - - - 513. Kabola 666 - - 1 1014. Alor Barat Laut 2.077 - - - 2.30015. Alor Tengah Utara 1.282 - - - 2.31016. Lembur 721 - - - 93917. Pulau Pura 101 - - - 427
ALOR 25.800 - 7 2 38.041
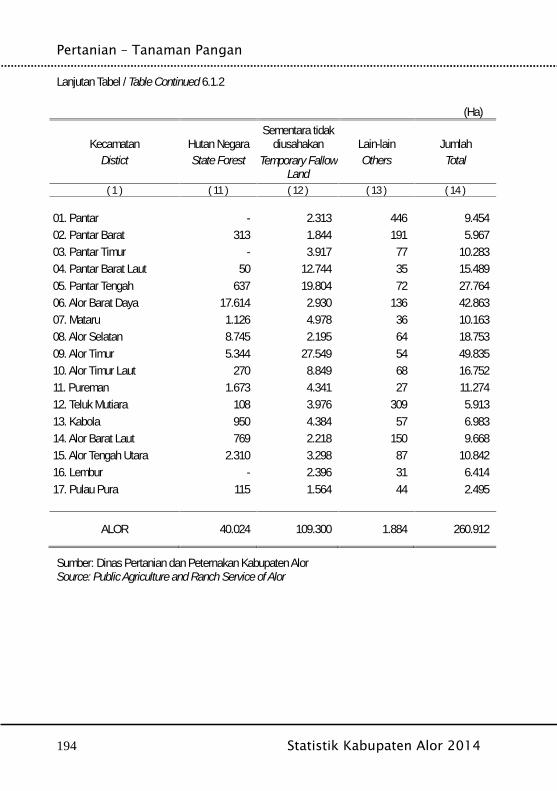
Pertanian – Tanaman Pangan
194 Statistik Kabupaten Alor 2014
Lanjutan Tabel / Table Continued 6.1.2
(Ha)
KecamatanDistict
Hutan NegaraState Forest
Sementara tidakdiusahakan
Temporary FallowLand
Lain-lainOthers
JumlahTotal
( 1 ) ( 11 ) ( 12 ) ( 13 ) ( 14 )
01. Pantar - 2.313 446 9.45402. Pantar Barat 313 1.844 191 5.96703. Pantar Timur - 3.917 77 10.28304. Pantar Barat Laut 50 12.744 35 15.48905. Pantar Tengah 637 19.804 72 27.76406. Alor Barat Daya 17.614 2.930 136 42.86307. Mataru 1.126 4.978 36 10.16308. Alor Selatan 8.745 2.195 64 18.75309. Alor Timur 5.344 27.549 54 49.83510. Alor Timur Laut 270 8.849 68 16.75211. Pureman 1.673 4.341 27 11.27412. Teluk Mutiara 108 3.976 309 5.91313. Kabola 950 4.384 57 6.98314. Alor Barat Laut 769 2.218 150 9.66815. Alor Tengah Utara 2.310 3.298 87 10.84216. Lembur - 2.396 31 6.41417. Pulau Pura 115 1.564 44 2.495
ALOR 40.024 109.300 1.884 260.912
Sumber: Dinas Pertanian dan Peternakan Kabupaten AlorSource: Public Agriculture and Ranch Service of Alor
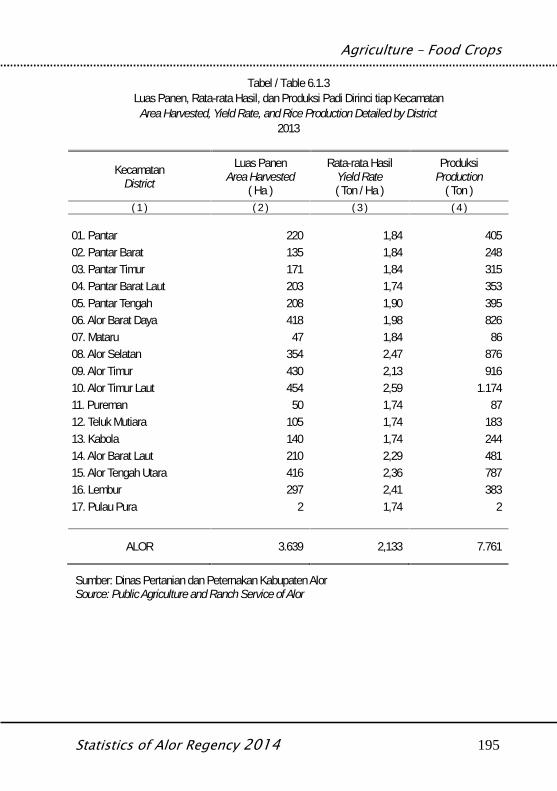
Agriculture – Food Crops
Statistics of Alor Regency 2014 195
Tabel / Table 6.1.3Luas Panen, Rata-rata Hasil, dan Produksi Padi Dirinci tiap Kecamatan
Area Harvested, Yield Rate, and Rice Production Detailed by District2013
KecamatanDistrict
Luas PanenArea Harvested
( Ha )
Rata-rata HasilYield Rate( Ton / Ha )
ProduksiProduction
( Ton )( 1 ) ( 2 ) ( 3 ) ( 4 )
01. Pantar 220 1,84 40502. Pantar Barat 135 1,84 24803. Pantar Timur 171 1,84 31504. Pantar Barat Laut 203 1,74 35305. Pantar Tengah 208 1,90 39506. Alor Barat Daya 418 1,98 82607. Mataru 47 1,84 8608. Alor Selatan 354 2,47 87609. Alor Timur 430 2,13 91610. Alor Timur Laut 454 2,59 1.17411. Pureman 50 1,74 8712. Teluk Mutiara 105 1,74 18313. Kabola 140 1,74 24414. Alor Barat Laut 210 2,29 48115. Alor Tengah Utara 416 2,36 78716. Lembur 297 2,41 38317. Pulau Pura 2 1,74 2
ALOR 3.639 2,133 7.761
Sumber: Dinas Pertanian dan Peternakan Kabupaten AlorSource: Public Agriculture and Ranch Service of Alor
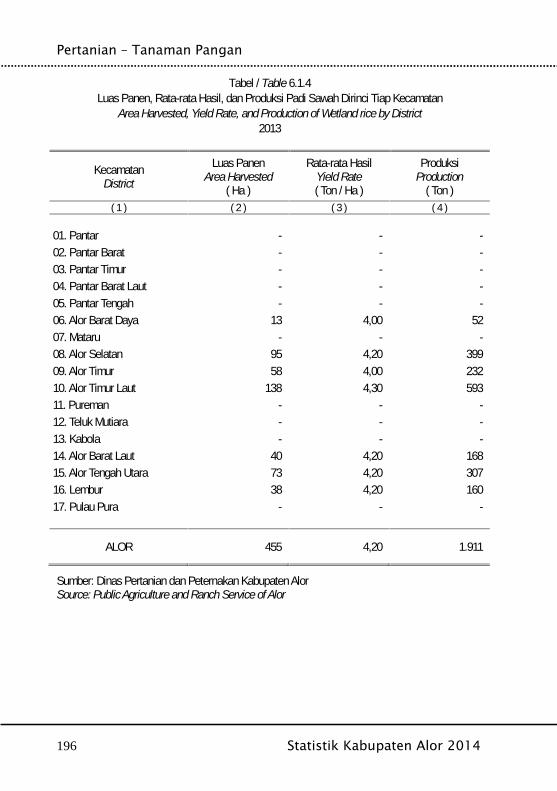
Pertanian – Tanaman Pangan
196 Statistik Kabupaten Alor 2014
Tabel / Table 6.1.4Luas Panen, Rata-rata Hasil, dan Produksi Padi Sawah Dirinci Tiap Kecamatan
Area Harvested, Yield Rate, and Production of Wetland rice by District2013
KecamatanDistrict
Luas PanenArea Harvested
( Ha )
Rata-rata HasilYield Rate( Ton / Ha )
ProduksiProduction
( Ton )( 1 ) ( 2 ) ( 3 ) ( 4 )
01. Pantar - - -02. Pantar Barat - - -03. Pantar Timur - - -04. Pantar Barat Laut - - -05. Pantar Tengah - - -06. Alor Barat Daya 13 4,00 5207. Mataru - - -08. Alor Selatan 95 4,20 39909. Alor Timur 58 4,00 23210. Alor Timur Laut 138 4,30 59311. Pureman - - -12. Teluk Mutiara - - -13. Kabola - - -14. Alor Barat Laut 40 4,20 16815. Alor Tengah Utara 73 4,20 30716. Lembur 38 4,20 16017. Pulau Pura - - -
ALOR 455 4,20 1.911
Sumber: Dinas Pertanian dan Peternakan Kabupaten AlorSource: Public Agriculture and Ranch Service of Alor
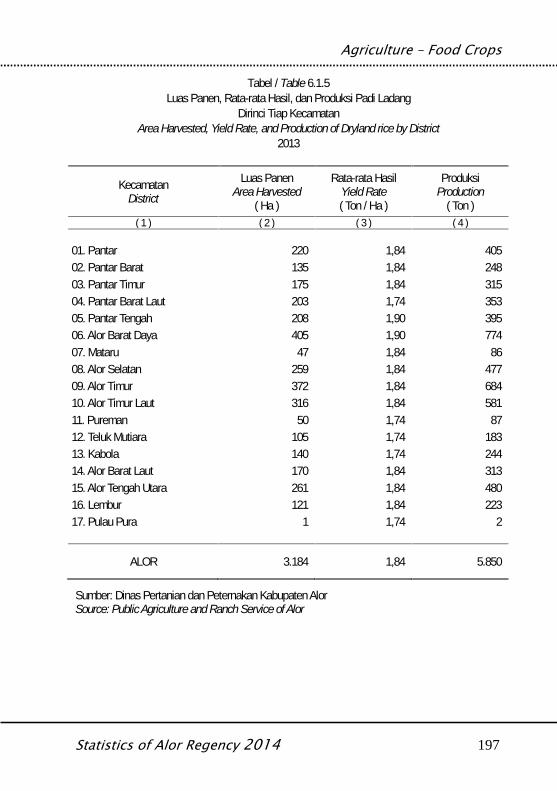
Agriculture – Food Crops
Statistics of Alor Regency 2014 197
Tabel / Table 6.1.5Luas Panen, Rata-rata Hasil, dan Produksi Padi Ladang
Dirinci Tiap KecamatanArea Harvested, Yield Rate, and Production of Dryland rice by District
2013
KecamatanDistrict
Luas PanenArea Harvested
( Ha )
Rata-rata HasilYield Rate( Ton / Ha )
ProduksiProduction
( Ton )( 1 ) ( 2 ) ( 3 ) ( 4 )
01. Pantar 220 1,84 40502. Pantar Barat 135 1,84 24803. Pantar Timur 175 1,84 31504. Pantar Barat Laut 203 1,74 35305. Pantar Tengah 208 1,90 39506. Alor Barat Daya 405 1,90 77407. Mataru 47 1,84 8608. Alor Selatan 259 1,84 47709. Alor Timur 372 1,84 68410. Alor Timur Laut 316 1,84 58111. Pureman 50 1,74 8712. Teluk Mutiara 105 1,74 18313. Kabola 140 1,74 24414. Alor Barat Laut 170 1,84 31315. Alor Tengah Utara 261 1,84 48016. Lembur 121 1,84 22317. Pulau Pura 1 1,74 2
ALOR 3.184 1,84 5.850
Sumber: Dinas Pertanian dan Peternakan Kabupaten AlorSource: Public Agriculture and Ranch Service of Alor
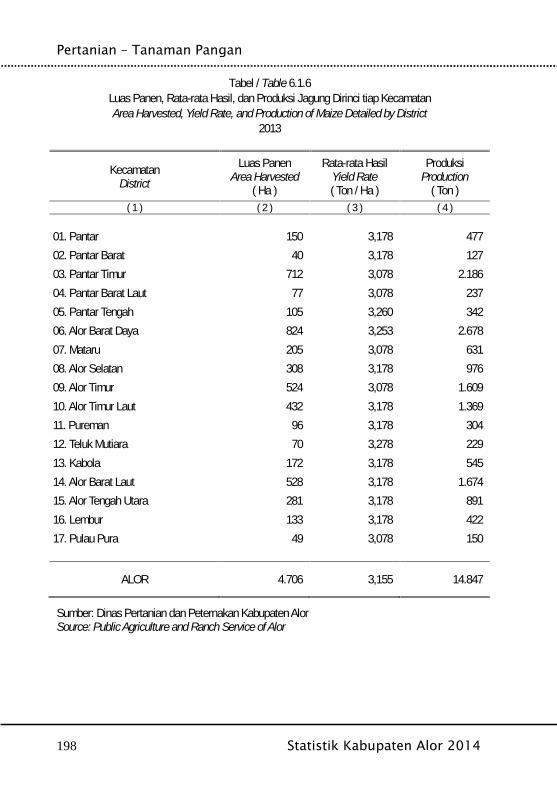
Pertanian – Tanaman Pangan
198 Statistik Kabupaten Alor 2014
Tabel / Table 6.1.6Luas Panen, Rata-rata Hasil, dan Produksi Jagung Dirinci tiap KecamatanArea Harvested, Yield Rate, and Production of Maize Detailed by District
2013
KecamatanDistrict
Luas PanenArea Harvested
( Ha )
Rata-rata HasilYield Rate( Ton / Ha )
ProduksiProduction
( Ton )( 1 ) ( 2 ) ( 3 ) ( 4 )
01. Pantar 150 3,178 47702. Pantar Barat 40 3,178 12703. Pantar Timur 712 3,078 2.18604. Pantar Barat Laut 77 3,078 23705. Pantar Tengah 105 3,260 34206. Alor Barat Daya 824 3,253 2.67807. Mataru 205 3,078 63108. Alor Selatan 308 3,178 97609. Alor Timur 524 3,078 1.60910. Alor Timur Laut 432 3,178 1.36911. Pureman 96 3,178 30412. Teluk Mutiara 70 3,278 22913. Kabola 172 3,178 54514. Alor Barat Laut 528 3,178 1.67415. Alor Tengah Utara 281 3,178 89116. Lembur 133 3,178 42217. Pulau Pura 49 3,078 150
ALOR 4.706 3,155 14.847
Sumber: Dinas Pertanian dan Peternakan Kabupaten AlorSource: Public Agriculture and Ranch Service of Alor
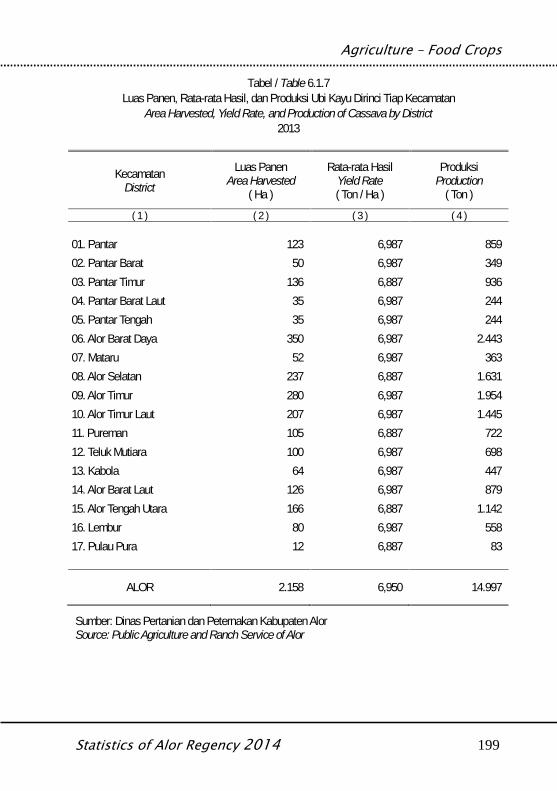
Agriculture – Food Crops
Statistics of Alor Regency 2014 199
Tabel / Table 6.1.7Luas Panen, Rata-rata Hasil, dan Produksi Ubi Kayu Dirinci Tiap Kecamatan
Area Harvested, Yield Rate, and Production of Cassava by District2013
KecamatanDistrict
Luas PanenArea Harvested
( Ha )
Rata-rata HasilYield Rate( Ton / Ha )
ProduksiProduction
( Ton )( 1 ) ( 2 ) ( 3 ) ( 4 )
01. Pantar 123 6,987 85902. Pantar Barat 50 6,987 34903. Pantar Timur 136 6,887 93604. Pantar Barat Laut 35 6,987 24405. Pantar Tengah 35 6,987 24406. Alor Barat Daya 350 6,987 2.44307. Mataru 52 6,987 36308. Alor Selatan 237 6,887 1.63109. Alor Timur 280 6,987 1.95410. Alor Timur Laut 207 6,987 1.44511. Pureman 105 6,887 72212. Teluk Mutiara 100 6,987 69813. Kabola 64 6,987 44714. Alor Barat Laut 126 6,987 87915. Alor Tengah Utara 166 6,887 1.14216. Lembur 80 6,987 55817. Pulau Pura 12 6,887 83
ALOR 2.158 6,950 14.997
Sumber: Dinas Pertanian dan Peternakan Kabupaten AlorSource: Public Agriculture and Ranch Service of Alor
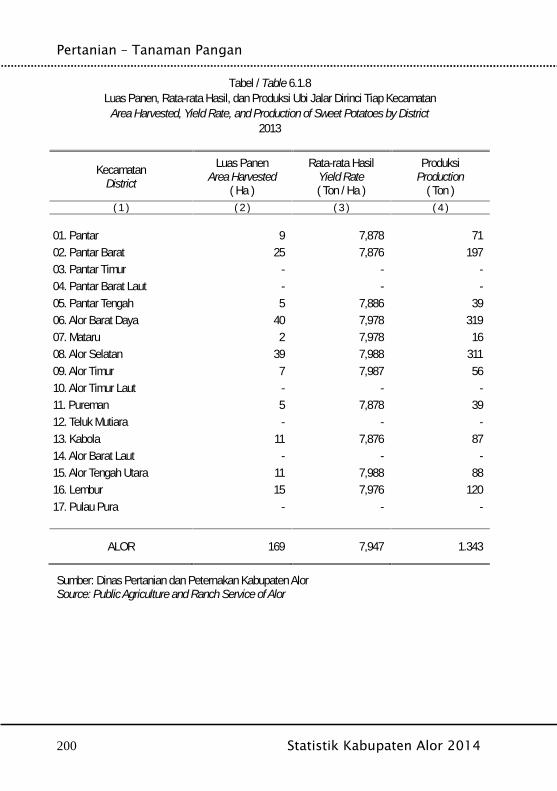
Pertanian – Tanaman Pangan
200 Statistik Kabupaten Alor 2014
Tabel / Table 6.1.8Luas Panen, Rata-rata Hasil, dan Produksi Ubi Jalar Dirinci Tiap Kecamatan
Area Harvested, Yield Rate, and Production of Sweet Potatoes by District2013
KecamatanDistrict
Luas PanenArea Harvested
( Ha )
Rata-rata HasilYield Rate( Ton / Ha )
ProduksiProduction
( Ton )( 1 ) ( 2 ) ( 3 ) ( 4 )
01. Pantar 9 7,878 7102. Pantar Barat 25 7,876 19703. Pantar Timur - - -04. Pantar Barat Laut - - -05. Pantar Tengah 5 7,886 3906. Alor Barat Daya 40 7,978 31907. Mataru 2 7,978 1608. Alor Selatan 39 7,988 31109. Alor Timur 7 7,987 5610. Alor Timur Laut - - -11. Pureman 5 7,878 3912. Teluk Mutiara - - -13. Kabola 11 7,876 8714. Alor Barat Laut - - -15. Alor Tengah Utara 11 7,988 8816. Lembur 15 7,976 12017. Pulau Pura - - -
ALOR 169 7,947 1.343
Sumber: Dinas Pertanian dan Peternakan Kabupaten AlorSource: Public Agriculture and Ranch Service of Alor
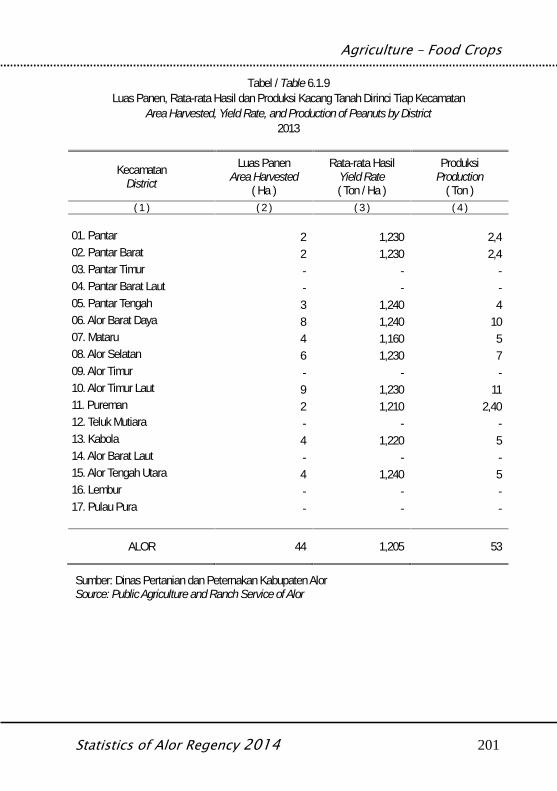
Agriculture – Food Crops
Statistics of Alor Regency 2014 201
Tabel / Table 6.1.9Luas Panen, Rata-rata Hasil dan Produksi Kacang Tanah Dirinci Tiap Kecamatan
Area Harvested, Yield Rate, and Production of Peanuts by District2013
KecamatanDistrict
Luas PanenArea Harvested
( Ha )
Rata-rata HasilYield Rate( Ton / Ha )
ProduksiProduction
( Ton )( 1 ) ( 2 ) ( 3 ) ( 4 )
01. Pantar 2 1,230 2,402. Pantar Barat 2 1,230 2,403. Pantar Timur - - -04. Pantar Barat Laut - - -05. Pantar Tengah 3 1,240 406. Alor Barat Daya 8 1,240 1007. Mataru 4 1,160 508. Alor Selatan 6 1,230 709. Alor Timur - - -10. Alor Timur Laut 9 1,230 1111. Pureman 2 1,210 2,4012. Teluk Mutiara - - -13. Kabola 4 1,220 514. Alor Barat Laut - - -15. Alor Tengah Utara 4 1,240 516. Lembur - - -17. Pulau Pura - - -
ALOR 44 1,205 53
Sumber: Dinas Pertanian dan Peternakan Kabupaten AlorSource: Public Agriculture and Ranch Service of Alor
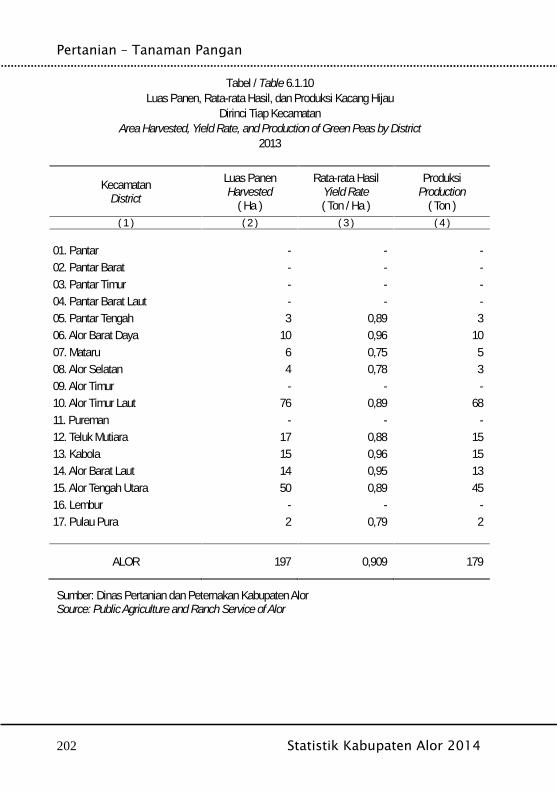
Pertanian – Tanaman Pangan
202 Statistik Kabupaten Alor 2014
Tabel / Table 6.1.10Luas Panen, Rata-rata Hasil, dan Produksi Kacang Hijau
Dirinci Tiap KecamatanArea Harvested, Yield Rate, and Production of Green Peas by District
2013
KecamatanDistrict
Luas PanenHarvested
( Ha )
Rata-rata HasilYield Rate( Ton / Ha )
ProduksiProduction
( Ton )( 1 ) ( 2 ) ( 3 ) ( 4 )
01. Pantar - - -02. Pantar Barat - - -03. Pantar Timur - - -04. Pantar Barat Laut - - -05. Pantar Tengah 3 0,89 306. Alor Barat Daya 10 0,96 1007. Mataru 6 0,75 508. Alor Selatan 4 0,78 309. Alor Timur - - -10. Alor Timur Laut 76 0,89 6811. Pureman - - -12. Teluk Mutiara 17 0,88 1513. Kabola 15 0,96 1514. Alor Barat Laut 14 0,95 1315. Alor Tengah Utara 50 0,89 4516. Lembur - - -17. Pulau Pura 2 0,79 2
ALOR 197 0,909 179
Sumber: Dinas Pertanian dan Peternakan Kabupaten AlorSource: Public Agriculture and Ranch Service of Alor
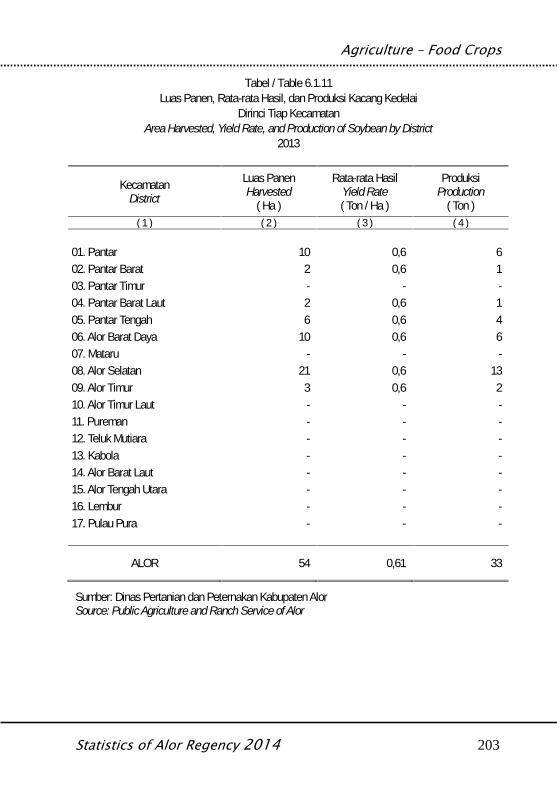
Agriculture – Food Crops
Statistics of Alor Regency 2014 203
Tabel / Table 6.1.11Luas Panen, Rata-rata Hasil, dan Produksi Kacang Kedelai
Dirinci Tiap KecamatanArea Harvested, Yield Rate, and Production of Soybean by District
2013
KecamatanDistrict
Luas PanenHarvested
( Ha )
Rata-rata HasilYield Rate( Ton / Ha )
ProduksiProduction
( Ton )( 1 ) ( 2 ) ( 3 ) ( 4 )
01. Pantar 10 0,6 602. Pantar Barat 2 0,6 103. Pantar Timur - - -04. Pantar Barat Laut 2 0,6 105. Pantar Tengah 6 0,6 406. Alor Barat Daya 10 0,6 607. Mataru - - -08. Alor Selatan 21 0,6 1309. Alor Timur 3 0,6 210. Alor Timur Laut - - -11. Pureman - - -12. Teluk Mutiara - - -13. Kabola - - -14. Alor Barat Laut - - -15. Alor Tengah Utara - - -16. Lembur - - -17. Pulau Pura - - -
ALOR 54 0,61 33
Sumber: Dinas Pertanian dan Peternakan Kabupaten AlorSource: Public Agriculture and Ranch Service of Alor

Pertanian – Tanaman Pangan
204 Statistik Kabupaten Alor 2014
Agriculture – Estate Crops
Statistics of Alor Regency 2014 205
BAB VI.2PERKEBUNAN
Estate Crops

Pertanian - Perkebunan
206 Statistik Kabupaten Alor 2014
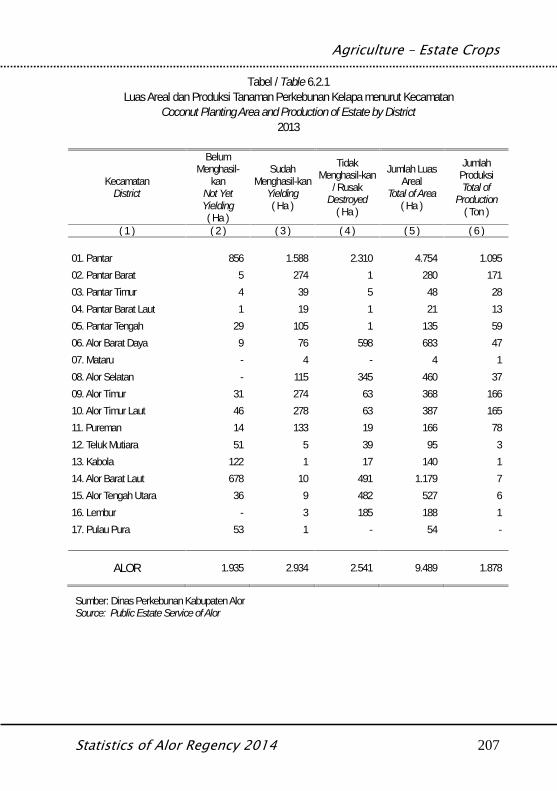
Agriculture – Estate Crops
Statistics of Alor Regency 2014 207
Tabel / Table 6.2.1Luas Areal dan Produksi Tanaman Perkebunan Kelapa menurut Kecamatan
Coconut Planting Area and Production of Estate by District2013
KecamatanDistrict
BelumMenghasil-
kanNot YetYielding( Ha )
SudahMenghasil-kan
Yielding( Ha )
TidakMenghasil-kan
/ RusakDestroyed
( Ha )
Jumlah LuasAreal
Total of Area( Ha )
JumlahProduksiTotal of
Production( Ton )
( 1 ) ( 2 ) ( 3 ) ( 4 ) ( 5 ) ( 6 )
01. Pantar 856 1.588 2.310 4.754 1.09502. Pantar Barat 5 274 1 280 17103. Pantar Timur 4 39 5 48 2804. Pantar Barat Laut 1 19 1 21 1305. Pantar Tengah 29 105 1 135 5906. Alor Barat Daya 9 76 598 683 4707. Mataru - 4 - 4 108. Alor Selatan - 115 345 460 3709. Alor Timur 31 274 63 368 16610. Alor Timur Laut 46 278 63 387 16511. Pureman 14 133 19 166 7812. Teluk Mutiara 51 5 39 95 313. Kabola 122 1 17 140 114. Alor Barat Laut 678 10 491 1.179 715. Alor Tengah Utara 36 9 482 527 616. Lembur - 3 185 188 117. Pulau Pura 53 1 - 54 -
ALOR 1.935 2.934 2.541 9.489 1.878
Sumber: Dinas Perkebunan Kabupaten AlorSource: Public Estate Service of Alor
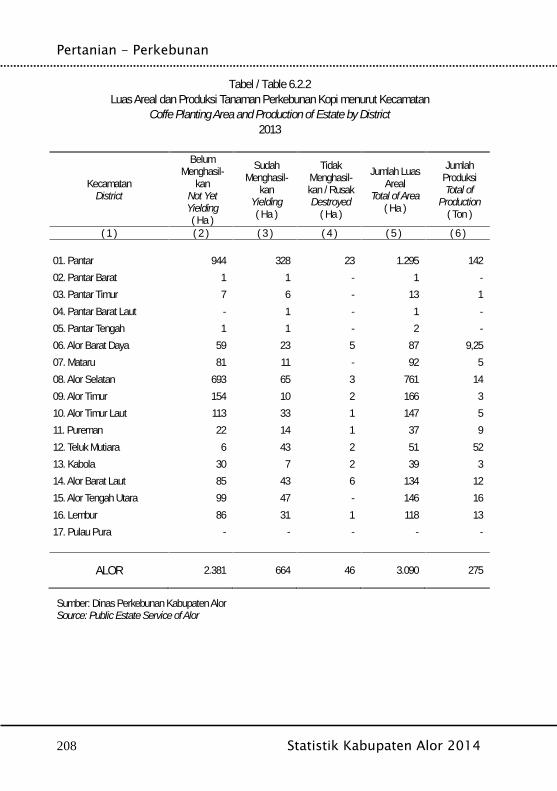
Pertanian - Perkebunan
208 Statistik Kabupaten Alor 2014
Tabel / Table 6.2.2Luas Areal dan Produksi Tanaman Perkebunan Kopi menurut Kecamatan
Coffe Planting Area and Production of Estate by District2013
KecamatanDistrict
BelumMenghasil-
kanNot YetYielding( Ha )
SudahMenghasil-
kanYielding( Ha )
TidakMenghasil-kan / RusakDestroyed
( Ha )
Jumlah LuasAreal
Total of Area( Ha )
JumlahProduksiTotal of
Production( Ton )
( 1 ) ( 2 ) ( 3 ) ( 4 ) ( 5 ) ( 6 )
01. Pantar 944 328 23 1.295 14202. Pantar Barat 1 1 - 1 -03. Pantar Timur 7 6 - 13 104. Pantar Barat Laut - 1 - 1 -05. Pantar Tengah 1 1 - 2 -06. Alor Barat Daya 59 23 5 87 9,2507. Mataru 81 11 - 92 508. Alor Selatan 693 65 3 761 1409. Alor Timur 154 10 2 166 310. Alor Timur Laut 113 33 1 147 511. Pureman 22 14 1 37 912. Teluk Mutiara 6 43 2 51 5213. Kabola 30 7 2 39 314. Alor Barat Laut 85 43 6 134 1215. Alor Tengah Utara 99 47 - 146 1616. Lembur 86 31 1 118 1317. Pulau Pura - - - - -
ALOR 2.381 664 46 3.090 275
Sumber: Dinas Perkebunan Kabupaten AlorSource: Public Estate Service of Alor
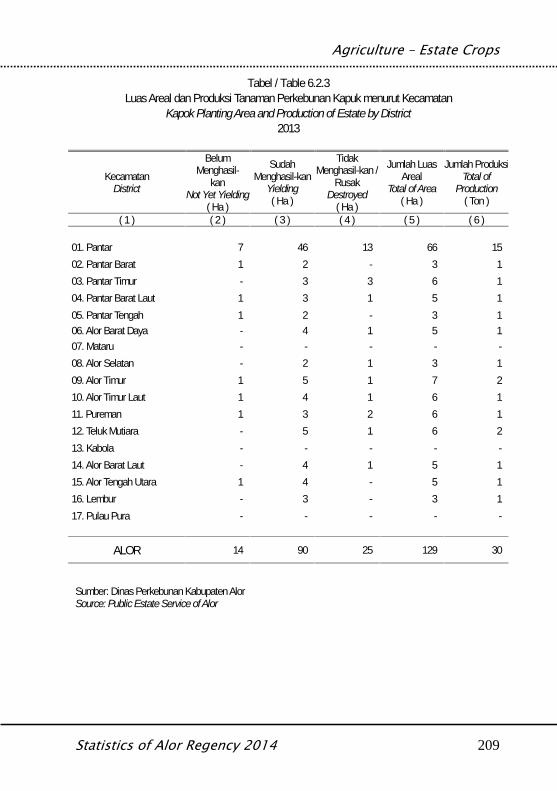
Agriculture – Estate Crops
Statistics of Alor Regency 2014 209
Tabel / Table 6.2.3Luas Areal dan Produksi Tanaman Perkebunan Kapuk menurut Kecamatan
Kapok Planting Area and Production of Estate by District2013
KecamatanDistrict
BelumMenghasil-
kanNot Yet Yielding
( Ha )
SudahMenghasil-kan
Yielding( Ha )
TidakMenghasil-kan /
RusakDestroyed
( Ha )
Jumlah LuasAreal
Total of Area( Ha )
Jumlah ProduksiTotal of
Production( Ton )
( 1 ) ( 2 ) ( 3 ) ( 4 ) ( 5 ) ( 6 )
01. Pantar 7 46 13 66 1502. Pantar Barat 1 2 - 3 103. Pantar Timur - 3 3 6 104. Pantar Barat Laut 1 3 1 5 105. Pantar Tengah 1 2 - 3 106. Alor Barat Daya - 4 1 5 107. Mataru - - - - -08. Alor Selatan - 2 1 3 109. Alor Timur 1 5 1 7 210. Alor Timur Laut 1 4 1 6 111. Pureman 1 3 2 6 112. Teluk Mutiara - 5 1 6 213. Kabola - - - - -14. Alor Barat Laut - 4 1 5 115. Alor Tengah Utara 1 4 - 5 116. Lembur - 3 - 3 117. Pulau Pura - - - - -
ALOR 14 90 25 129 30
Sumber: Dinas Perkebunan Kabupaten AlorSource: Public Estate Service of Alor
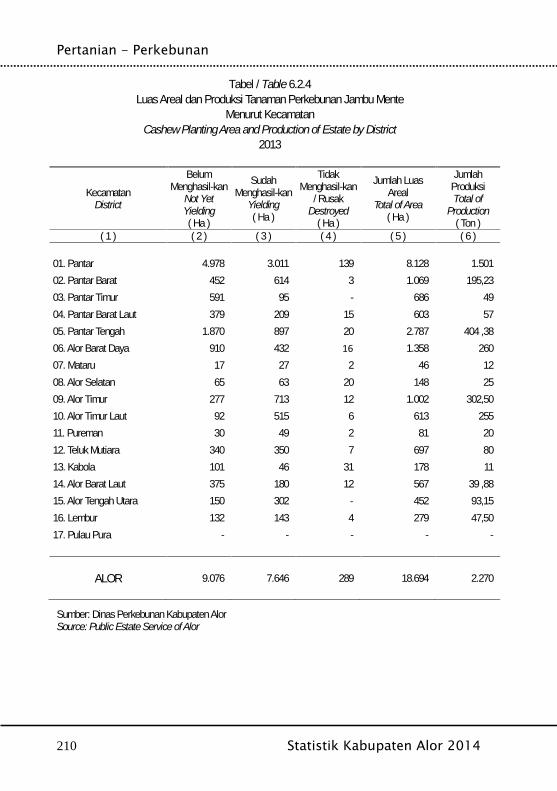
Pertanian - Perkebunan
210 Statistik Kabupaten Alor 2014
Tabel / Table 6.2.4Luas Areal dan Produksi Tanaman Perkebunan Jambu Mente
Menurut KecamatanCashew Planting Area and Production of Estate by District
2013
KecamatanDistrict
BelumMenghasil-kan
Not YetYielding( Ha )
SudahMenghasil-kan
Yielding( Ha )
TidakMenghasil-kan
/ RusakDestroyed
( Ha )
Jumlah LuasAreal
Total of Area( Ha )
JumlahProduksiTotal of
Production( Ton )
( 1 ) ( 2 ) ( 3 ) ( 4 ) ( 5 ) ( 6 )
01. Pantar 4.978 3.011 139 8.128 1.50102. Pantar Barat 452 614 3 1.069 195,2303. Pantar Timur 591 95 - 686 4904. Pantar Barat Laut 379 209 15 603 5705. Pantar Tengah 1.870 897 20 2.787 404 ,3806. Alor Barat Daya 910 432 16 1.358 26007. Mataru 17 27 2 46 1208. Alor Selatan 65 63 20 148 2509. Alor Timur 277 713 12 1.002 302,5010. Alor Timur Laut 92 515 6 613 25511. Pureman 30 49 2 81 2012. Teluk Mutiara 340 350 7 697 8013. Kabola 101 46 31 178 1114. Alor Barat Laut 375 180 12 567 39 ,8815. Alor Tengah Utara 150 302 - 452 93,1516. Lembur 132 143 4 279 47,5017. Pulau Pura - - - - -
ALOR 9.076 7.646 289 18.694 2.270
Sumber: Dinas Perkebunan Kabupaten AlorSource: Public Estate Service of Alor
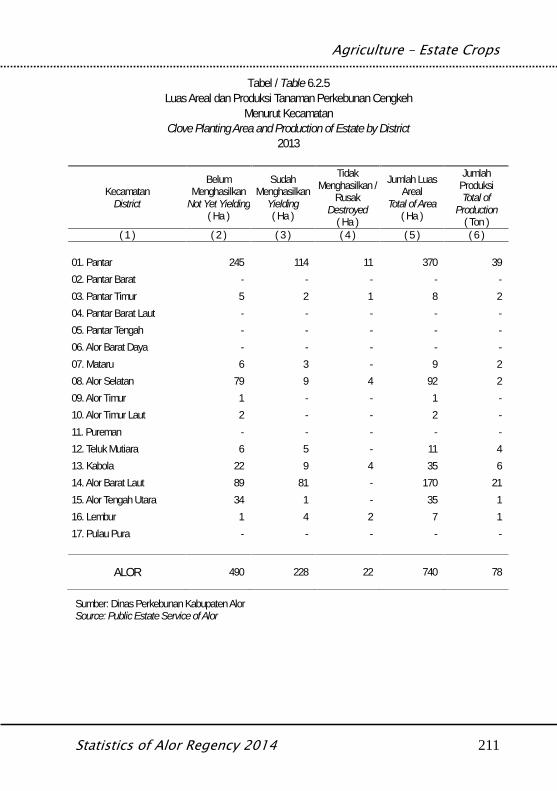
Agriculture – Estate Crops
Statistics of Alor Regency 2014 211
Tabel / Table 6.2.5Luas Areal dan Produksi Tanaman Perkebunan Cengkeh
Menurut KecamatanClove Planting Area and Production of Estate by District
2013
KecamatanDistrict
BelumMenghasilkan
Not Yet Yielding( Ha )
SudahMenghasilkan
Yielding( Ha )
TidakMenghasilkan /
RusakDestroyed
( Ha )
Jumlah LuasAreal
Total of Area( Ha )
JumlahProduksiTotal of
Production( Ton )
( 1 ) ( 2 ) ( 3 ) ( 4 ) ( 5 ) ( 6 )
01. Pantar 245 114 11 370 3902. Pantar Barat - - - - -03. Pantar Timur 5 2 1 8 204. Pantar Barat Laut - - - - -05. Pantar Tengah - - - - -06. Alor Barat Daya - - - - -07. Mataru 6 3 - 9 208. Alor Selatan 79 9 4 92 209. Alor Timur 1 - - 1 -10. Alor Timur Laut 2 - - 2 -11. Pureman - - - - -12. Teluk Mutiara 6 5 - 11 413. Kabola 22 9 4 35 614. Alor Barat Laut 89 81 - 170 2115. Alor Tengah Utara 34 1 - 35 116. Lembur 1 4 2 7 117. Pulau Pura - - - - -
ALOR 490 228 22 740 78
Sumber: Dinas Perkebunan Kabupaten AlorSource: Public Estate Service of Alor
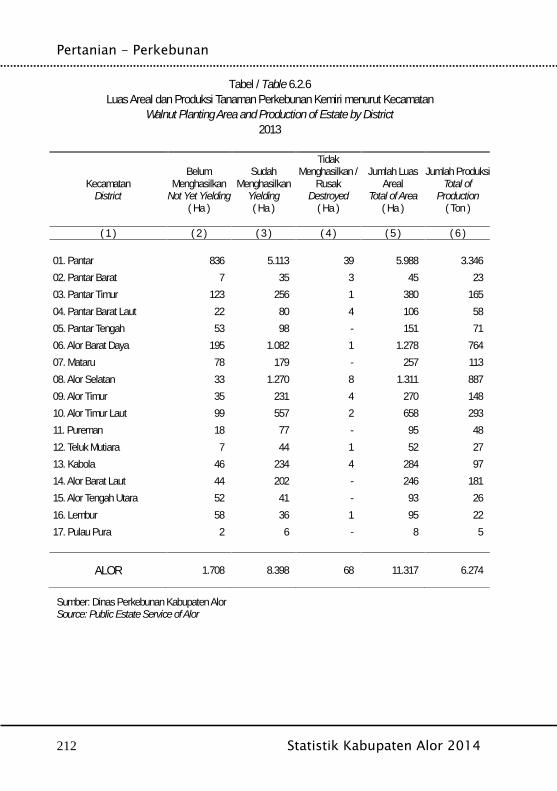
Pertanian - Perkebunan
212 Statistik Kabupaten Alor 2014
Tabel / Table 6.2.6Luas Areal dan Produksi Tanaman Perkebunan Kemiri menurut Kecamatan
Walnut Planting Area and Production of Estate by District2013
KecamatanDistrict
BelumMenghasilkan
Not Yet Yielding( Ha )
SudahMenghasilkan
Yielding( Ha )
TidakMenghasilkan /
RusakDestroyed
( Ha )
Jumlah LuasAreal
Total of Area( Ha )
Jumlah ProduksiTotal of
Production( Ton )
( 1 ) ( 2 ) ( 3 ) ( 4 ) ( 5 ) ( 6 )
01. Pantar 836 5.113 39 5.988 3.34602. Pantar Barat 7 35 3 45 2303. Pantar Timur 123 256 1 380 16504. Pantar Barat Laut 22 80 4 106 5805. Pantar Tengah 53 98 - 151 7106. Alor Barat Daya 195 1.082 1 1.278 76407. Mataru 78 179 - 257 11308. Alor Selatan 33 1.270 8 1.311 88709. Alor Timur 35 231 4 270 14810. Alor Timur Laut 99 557 2 658 29311. Pureman 18 77 - 95 4812. Teluk Mutiara 7 44 1 52 2713. Kabola 46 234 4 284 9714. Alor Barat Laut 44 202 - 246 18115. Alor Tengah Utara 52 41 - 93 2616. Lembur 58 36 1 95 2217. Pulau Pura 2 6 - 8 5
ALOR 1.708 8.398 68 11.317 6.274
Sumber: Dinas Perkebunan Kabupaten AlorSource: Public Estate Service of Alor

Agriculture – Estate Crops
Statistics of Alor Regency 2014 213
Tabel / Table 6.2.7Luas Areal dan Produksi Tanaman Perkebunan Pinang menurut Kecamatan
Areca Planting Area and Production of Estate by District2013
KecamatanDistrict
BelumMenghasil-kan
Not YetYielding( Ha )
SudahMenghasil-kan
Yielding( Ha )
TidakMenghasil-kan
/ RusakDestroyed
( Ha )
Jumlah LuasAreal
Total of Area( Ha )
JumlahProduksiTotal of
Production( Ton )
( 1 ) ( 2 ) ( 3 ) ( 4 ) ( 5 ) ( 6 )
01. Pantar 459 351 13 823 18002. Pantar Barat - - - - -03. Pantar Timur 23 8 1 32 604. Pantar Barat Laut 12 5 3 20 405. Pantar Tengah 8 4 - 12 106. Alor Barat Daya 217 100 - 317 3407. Mataru - - - - -08. Alor Selatan 33 39 - 72 2209. Alor Timur 23 29 3 55 1510. Alor Timur Laut 5 4 2 11 311. Pureman 21 12 - 33 812. Teluk Mutiara 8 8 1 17 413. Kabola 18 13 1 32 814. Alor Barat Laut 27 74 - 101 4915. Alor Tengah Utara 60 39 1 100 1816. Lembur 7 5 - 12 317. Pulau Pura - - - - -
ALOR 921 691 25 1.637 355
Sumber: Dinas Perkebunan Kabupaten AlorSource: Public Estate Service of Alor
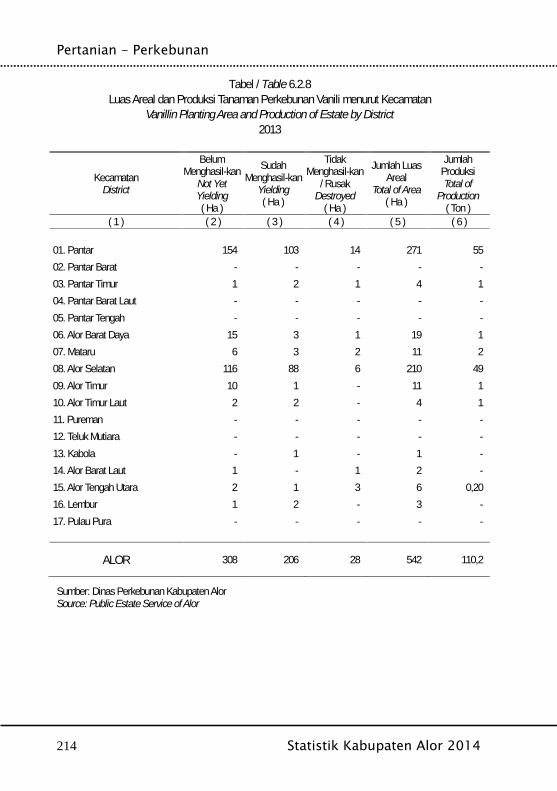
Pertanian - Perkebunan
214 Statistik Kabupaten Alor 2014
Tabel / Table 6.2.8Luas Areal dan Produksi Tanaman Perkebunan Vanili menurut Kecamatan
Vanillin Planting Area and Production of Estate by District2013
KecamatanDistrict
BelumMenghasil-kan
Not YetYielding( Ha )
SudahMenghasil-kan
Yielding( Ha )
TidakMenghasil-kan
/ RusakDestroyed
( Ha )
Jumlah LuasAreal
Total of Area( Ha )
JumlahProduksiTotal of
Production( Ton )
( 1 ) ( 2 ) ( 3 ) ( 4 ) ( 5 ) ( 6 )
01. Pantar 154 103 14 271 5502. Pantar Barat - - - - -03. Pantar Timur 1 2 1 4 104. Pantar Barat Laut - - - - -05. Pantar Tengah - - - - -06. Alor Barat Daya 15 3 1 19 107. Mataru 6 3 2 11 208. Alor Selatan 116 88 6 210 4909. Alor Timur 10 1 - 11 110. Alor Timur Laut 2 2 - 4 111. Pureman - - - - -12. Teluk Mutiara - - - - -13. Kabola - 1 - 1 -14. Alor Barat Laut 1 - 1 2 -15. Alor Tengah Utara 2 1 3 6 0,2016. Lembur 1 2 - 3 -17. Pulau Pura - - - - -
ALOR 308 206 28 542 110,2
Sumber: Dinas Perkebunan Kabupaten AlorSource: Public Estate Service of Alor
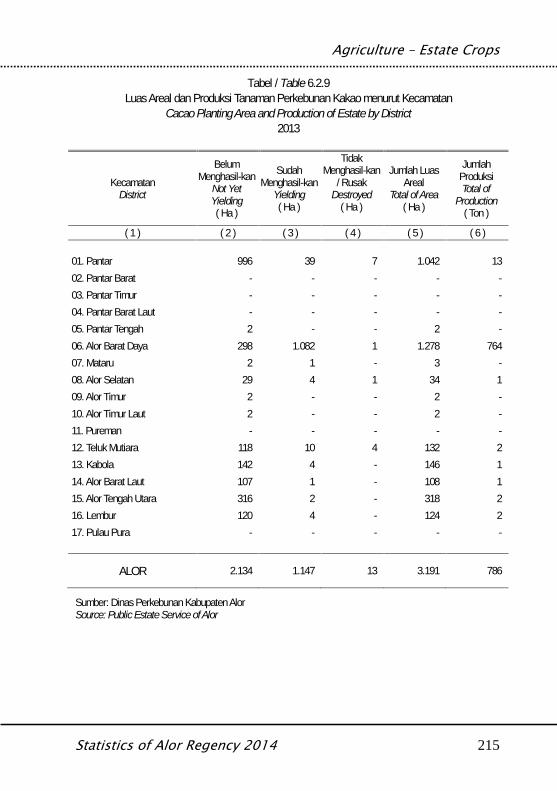
Agriculture – Estate Crops
Statistics of Alor Regency 2014 215
Tabel / Table 6.2.9Luas Areal dan Produksi Tanaman Perkebunan Kakao menurut Kecamatan
Cacao Planting Area and Production of Estate by District2013
KecamatanDistrict
BelumMenghasil-kan
Not YetYielding( Ha )
SudahMenghasil-kan
Yielding( Ha )
TidakMenghasil-kan
/ RusakDestroyed
( Ha )
Jumlah LuasAreal
Total of Area( Ha )
JumlahProduksiTotal of
Production( Ton )
( 1 ) ( 2 ) ( 3 ) ( 4 ) ( 5 ) ( 6 )
01. Pantar 996 39 7 1.042 1302. Pantar Barat - - - - -03. Pantar Timur - - - - -04. Pantar Barat Laut - - - - -05. Pantar Tengah 2 - - 2 -06. Alor Barat Daya 298 1.082 1 1.278 76407. Mataru 2 1 - 3 -08. Alor Selatan 29 4 1 34 109. Alor Timur 2 - - 2 -10. Alor Timur Laut 2 - - 2 -11. Pureman - - - - -12. Teluk Mutiara 118 10 4 132 213. Kabola 142 4 - 146 114. Alor Barat Laut 107 1 - 108 115. Alor Tengah Utara 316 2 - 318 216. Lembur 120 4 - 124 217. Pulau Pura - - - - -
ALOR 2.134 1.147 13 3.191 786
Sumber: Dinas Perkebunan Kabupaten AlorSource: Public Estate Service of Alor
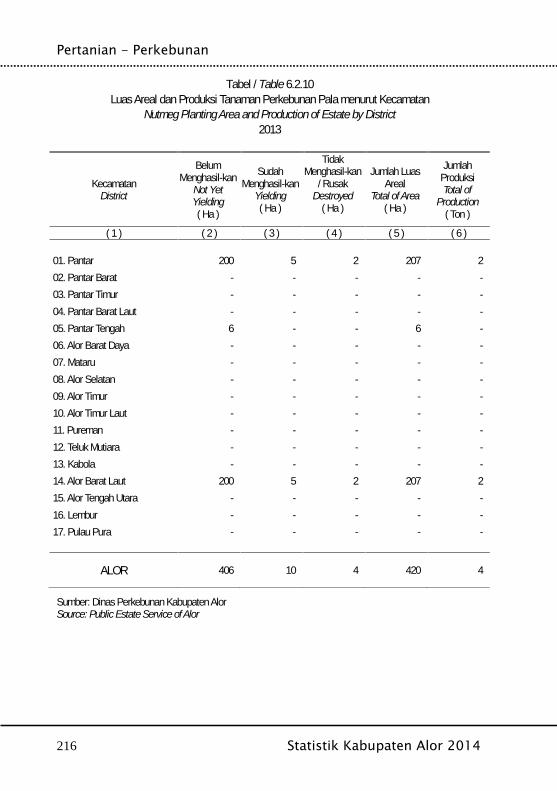
Pertanian - Perkebunan
216 Statistik Kabupaten Alor 2014
Tabel / Table 6.2.10Luas Areal dan Produksi Tanaman Perkebunan Pala menurut Kecamatan
Nutmeg Planting Area and Production of Estate by District2013
KecamatanDistrict
BelumMenghasil-kan
Not YetYielding( Ha )
SudahMenghasil-kan
Yielding( Ha )
TidakMenghasil-kan
/ RusakDestroyed
( Ha )
Jumlah LuasAreal
Total of Area( Ha )
JumlahProduksiTotal of
Production( Ton )
( 1 ) ( 2 ) ( 3 ) ( 4 ) ( 5 ) ( 6 )
01. Pantar 200 5 2 207 202. Pantar Barat - - - - -03. Pantar Timur - - - - -04. Pantar Barat Laut - - - - -05. Pantar Tengah 6 - - 6 -06. Alor Barat Daya - - - - -07. Mataru - - - - -08. Alor Selatan - - - - -09. Alor Timur - - - - -10. Alor Timur Laut - - - - -11. Pureman - - - - -12. Teluk Mutiara - - - - -13. Kabola - - - - -14. Alor Barat Laut 200 5 2 207 215. Alor Tengah Utara - - - - -16. Lembur - - - - -17. Pulau Pura - - - - -
ALOR 406 10 4 420 4
Sumber: Dinas Perkebunan Kabupaten AlorSource: Public Estate Service of Alor
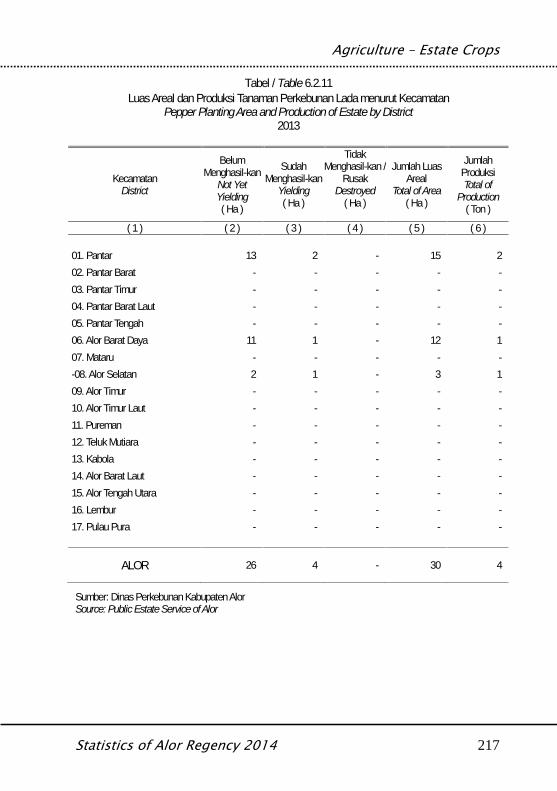
Agriculture – Estate Crops
Statistics of Alor Regency 2014 217
Tabel / Table 6.2.11Luas Areal dan Produksi Tanaman Perkebunan Lada menurut Kecamatan
Pepper Planting Area and Production of Estate by District2013
KecamatanDistrict
BelumMenghasil-kan
Not YetYielding( Ha )
SudahMenghasil-kan
Yielding( Ha )
TidakMenghasil-kan /
RusakDestroyed
( Ha )
Jumlah LuasAreal
Total of Area( Ha )
JumlahProduksiTotal of
Production( Ton )
( 1 ) ( 2 ) ( 3 ) ( 4 ) ( 5 ) ( 6 )
01. Pantar 13 2 - 15 202. Pantar Barat - - - - -03. Pantar Timur - - - - -04. Pantar Barat Laut - - - - -05. Pantar Tengah - - - - -06. Alor Barat Daya 11 1 - 12 107. Mataru - - - - --08. Alor Selatan 2 1 - 3 109. Alor Timur - - - - -10. Alor Timur Laut - - - - -11. Pureman - - - - -12. Teluk Mutiara - - - - -13. Kabola - - - - -14. Alor Barat Laut - - - - -15. Alor Tengah Utara - - - - -16. Lembur - - - - -17. Pulau Pura - - - - -
ALOR 26 4 - 30 4
Sumber: Dinas Perkebunan Kabupaten AlorSource: Public Estate Service of Alor
Pertanian - Perkebunan
218 Statistik Kabupaten Alor 2014

Agriculture - Forestry
Statistics of Alor Regency 2014 219
BAB VI.3KEHUTANAN
Forestry
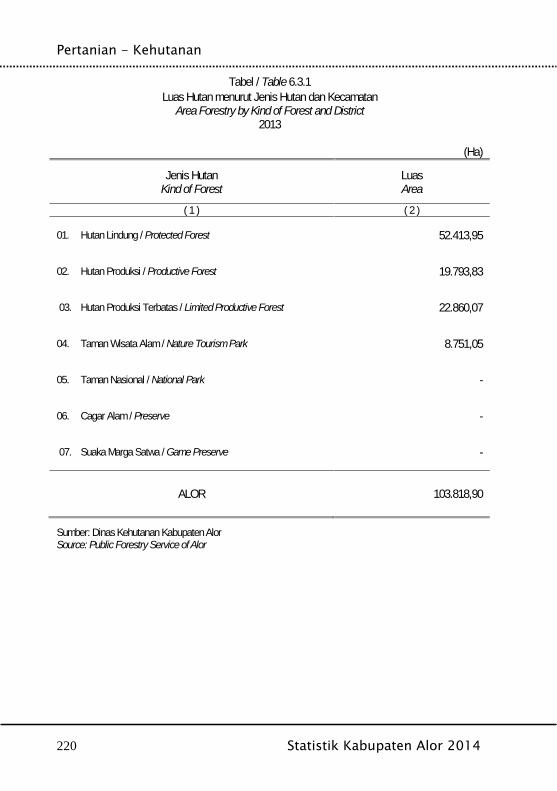
Pertanian - Kehutanan
220 Statistik Kabupaten Alor 2014
Tabel / Table 6.3.1Luas Hutan menurut Jenis Hutan dan Kecamatan
Area Forestry by Kind of Forest and District2013
(Ha)
Jenis HutanKind of Forest
LuasArea
( 1 ) ( 2 )
01. Hutan Lindung / Protected Forest 52.413,95
02. Hutan Produksi / Productive Forest 19.793,83
03. Hutan Produksi Terbatas / Limited Productive Forest 22.860,07
04. Taman Wisata Alam / Nature Tourism Park 8.751,05
05. Taman Nasional / National Park -
06. Cagar Alam / Preserve -
07. Suaka Marga Satwa / Game Preserve -
ALOR 103.818,90
Sumber: Dinas Kehutanan Kabupaten AlorSource: Public Forestry Service of Alor
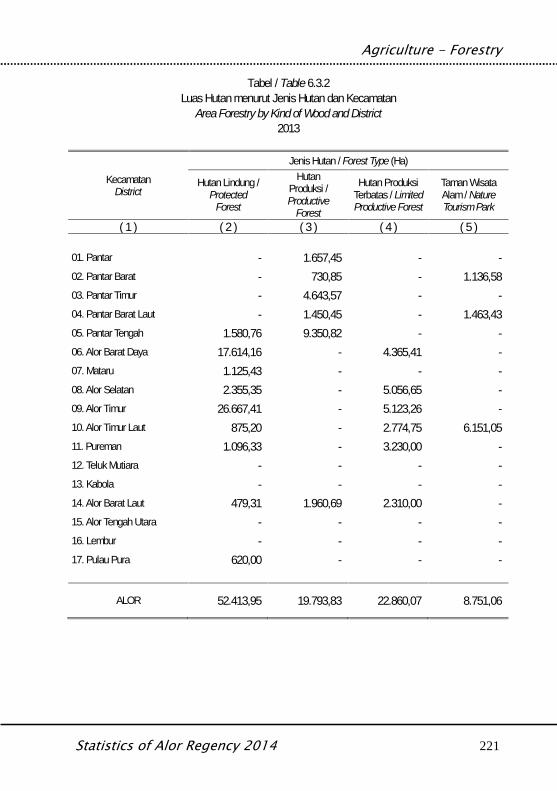
Agriculture - Forestry
Statistics of Alor Regency 2014 221
Tabel / Table 6.3.2Luas Hutan menurut Jenis Hutan dan Kecamatan
Area Forestry by Kind of Wood and District2013
KecamatanDistrict
Jenis Hutan / Forest Type (Ha)
Hutan Lindung /Protected
Forest
HutanProduksi /Productive
Forest
Hutan ProduksiTerbatas / LimitedProductive Forest
Taman WisataAlam / NatureTourism Park
( 1 ) ( 2 ) ( 3 ) ( 4 ) ( 5 )
01. Pantar - 1.657,45 - -02. Pantar Barat - 730,85 - 1.136,5803. Pantar Timur - 4.643,57 - -04. Pantar Barat Laut - 1.450,45 - 1.463,4305. Pantar Tengah 1.580,76 9.350,82 - -06. Alor Barat Daya 17.614,16 - 4.365,41 -07. Mataru 1.125,43 - - -08. Alor Selatan 2.355,35 - 5.056,65 -09. Alor Timur 26.667,41 - 5.123,26 -10. Alor Timur Laut 875,20 - 2.774,75 6.151,0511. Pureman 1.096,33 - 3.230,00 -12. Teluk Mutiara - - - -13. Kabola - - - -14. Alor Barat Laut 479,31 1.960,69 2.310,00 -15. Alor Tengah Utara - - - -16. Lembur - - - -17. Pulau Pura 620,00 - - -
ALOR 52.413,95 19.793,83 22.860,07 8.751,06

Pertanian - Kehutanan
222 Statistik Kabupaten Alor 2014
Lanjutan Tabel / Continued Table 6.3.2
KecamatanDistrict
Jenis Hutan / Forest Type (Ha)
TamanNasional /
National Park
Cagar Alam /Preserve
Suaka MargaSatwa /
Game PreserveTotal
( 1 ) ( 6 ) ( 7 ) ( 8 ) ( 9 )
01. Pantar - - - 1.657,4502. Pantar Barat - - - 1.867,4303. Pantar Timur - - - 4.643,5704. Pantar Barat Laut - - - 2.913,8805. Pantar Tengah - - - 10.931,5806. Alor Barat Daya - - - 21.979,5707. Mataru - - - 1.125,4308. Alor Selatan - - - 7.412,0009. Alor Timur - - - 31.790,6710. Alor Timur Laut - - - 9.801,0011. Pureman - - - 4.326,3312. Teluk Mutiara - - - -13. Kabola - - - -14. Alor Barat Laut - - - 4.750,0015. Alor Tengah Utara - - - -16. Lembur - - - -17. Pulau Pura - - - 620,00
ALOR - - - 103.818,91
Sumber: Dinas Kehutanan Kabupaten AlorSource: Public Forestry Service of Alor Regency
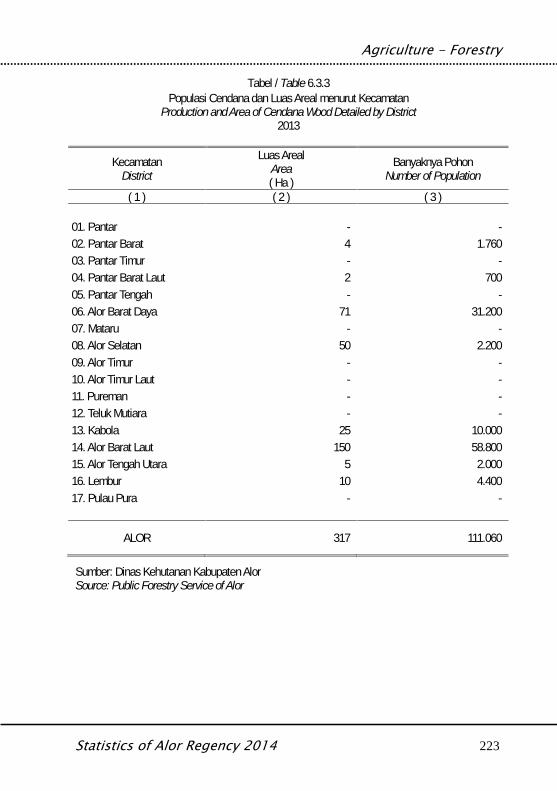
Agriculture - Forestry
Statistics of Alor Regency 2014 223
Tabel / Table 6.3.3Populasi Cendana dan Luas Areal menurut Kecamatan
Production and Area of Cendana Wood Detailed by District2013
KecamatanDistrict
Luas ArealArea( Ha )
Banyaknya PohonNumber of Population
( 1 ) ( 2 ) ( 3 )
01. Pantar - -02. Pantar Barat 4 1.76003. Pantar Timur - -04. Pantar Barat Laut 2 70005. Pantar Tengah - -06. Alor Barat Daya 71 31.20007. Mataru - -08. Alor Selatan 50 2.20009. Alor Timur - -10. Alor Timur Laut - -11. Pureman - -12. Teluk Mutiara - -13. Kabola 25 10.00014. Alor Barat Laut 150 58.80015. Alor Tengah Utara 5 2.00016. Lembur 10 4.40017. Pulau Pura - -
ALOR 317 111.060
Sumber: Dinas Kehutanan Kabupaten AlorSource: Public Forestry Service of Alor

Pertanian - Kehutanan
224 Statistik Kabupaten Alor 2014
Agriculture - Ranch
Statistics of Alor Regency 2014 225
BAB VI.4PETERNAKAN
Ranch

Pertanian - Peternakan
226 Statistik Kabupaten Alor 2014
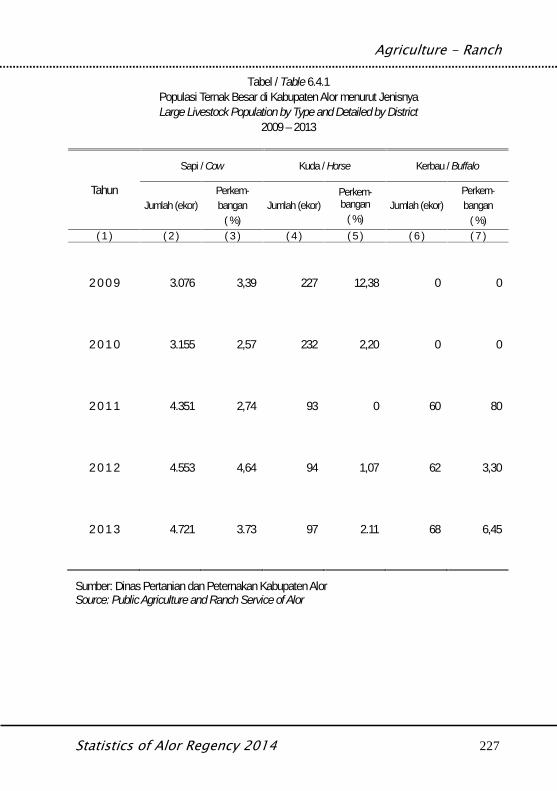
Agriculture - Ranch
Statistics of Alor Regency 2014 227
Tabel / Table 6.4.1Populasi Ternak Besar di Kabupaten Alor menurut JenisnyaLarge Livestock Population by Type and Detailed by District
2009 – 2013
Tahun
Sapi / Cow Kuda / Horse Kerbau / Buffalo
Jumlah (ekor)Perkem-bangan
( %)Jumlah (ekor)
Perkem-bangan
( %)Jumlah (ekor)
Perkem-bangan
( %)( 1 ) ( 2 ) ( 3 ) ( 4 ) ( 5 ) ( 6 ) ( 7 )
2 0 0 9 3.076 3,39 227 12,38 0 0
2 0 1 0 3.155 2,57 232 2,20 0 0
2 0 1 1 4.351 2,74 93 0 60 80
2 0 1 2 4.553 4,64 94 1,07 62 3,30
2 0 1 3 4.721 3.73 97 2.11 68 6,45
Sumber: Dinas Pertanian dan Peternakan Kabupaten AlorSource: Public Agriculture and Ranch Service of Alor
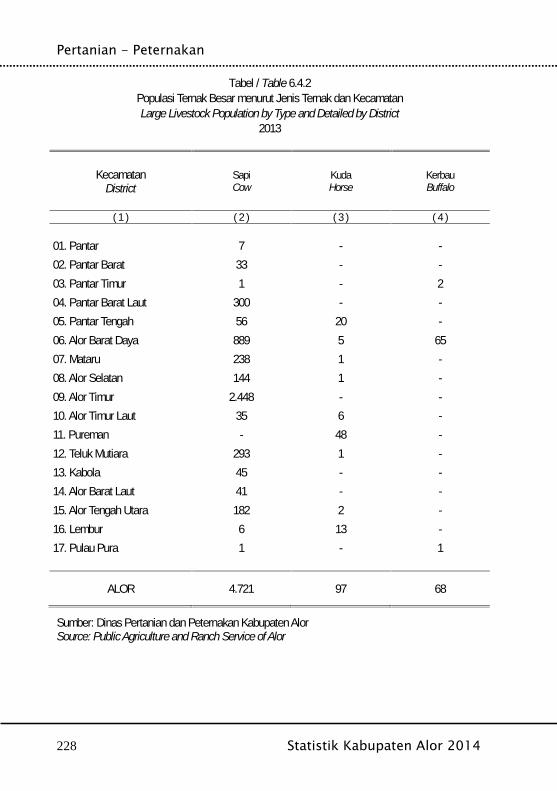
Pertanian - Peternakan
228 Statistik Kabupaten Alor 2014
Tabel / Table 6.4.2Populasi Ternak Besar menurut Jenis Ternak dan KecamatanLarge Livestock Population by Type and Detailed by District
2013
KecamatanDistrict
SapiCow
KudaHorse
KerbauBuffalo
( 1 ) ( 2 ) ( 3 ) ( 4 )
01. Pantar 7 - -02. Pantar Barat 33 - -03. Pantar Timur 1 - 204. Pantar Barat Laut 300 - -05. Pantar Tengah 56 20 -06. Alor Barat Daya 889 5 6507. Mataru 238 1 -08. Alor Selatan 144 1 -09. Alor Timur 2.448 - -10. Alor Timur Laut 35 6 -11. Pureman - 48 -12. Teluk Mutiara 293 1 -13. Kabola 45 - -14. Alor Barat Laut 41 - -15. Alor Tengah Utara 182 2 -16. Lembur 6 13 -17. Pulau Pura 1 - 1
ALOR 4.721 97 68
Sumber: Dinas Pertanian dan Peternakan Kabupaten AlorSource: Public Agriculture and Ranch Service of Alor
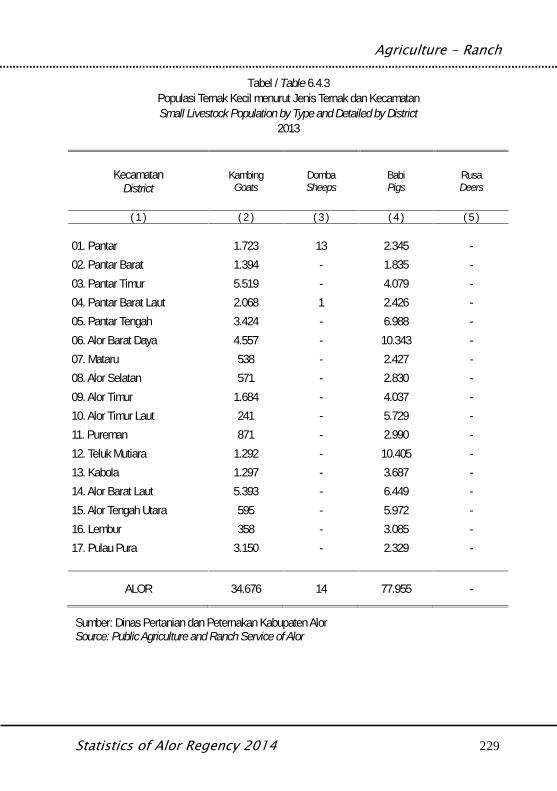
Agriculture - Ranch
Statistics of Alor Regency 2014 229
Tabel / Table 6.4.3Populasi Ternak Kecil menurut Jenis Ternak dan KecamatanSmall Livestock Population by Type and Detailed by District
2013
KecamatanDistrict
KambingGoats
DombaSheeps
BabiPigs
RusaDeers
( 1 ) ( 2 ) ( 3 ) ( 4 ) ( 5 )
01. Pantar 1.723 13 2.345 -02. Pantar Barat 1.394 - 1.835 -03. Pantar Timur 5.519 - 4.079 -04. Pantar Barat Laut 2.068 1 2.426 -05. Pantar Tengah 3.424 - 6.988 -06. Alor Barat Daya 4.557 - 10.343 -07. Mataru 538 - 2.427 -08. Alor Selatan 571 - 2.830 -09. Alor Timur 1.684 - 4.037 -10. Alor Timur Laut 241 - 5.729 -11. Pureman 871 - 2.990 -12. Teluk Mutiara 1.292 - 10.405 -13. Kabola 1.297 - 3.687 -14. Alor Barat Laut 5.393 - 6.449 -15. Alor Tengah Utara 595 - 5.972 -16. Lembur 358 - 3.085 -17. Pulau Pura 3.150 - 2.329 -
ALOR 34.676 14 77.955 -
Sumber: Dinas Pertanian dan Peternakan Kabupaten AlorSource: Public Agriculture and Ranch Service of Alor
Pertanian - Peternakan
230 Statistik Kabupaten Alor 2014
Agriculture - Fishery
Statistics of Alor Regency 2014 231
BAB VI.5PERIKANAN
Fishery

Pertanian - Perikanan
232 Statistik Kabupaten Alor 2014
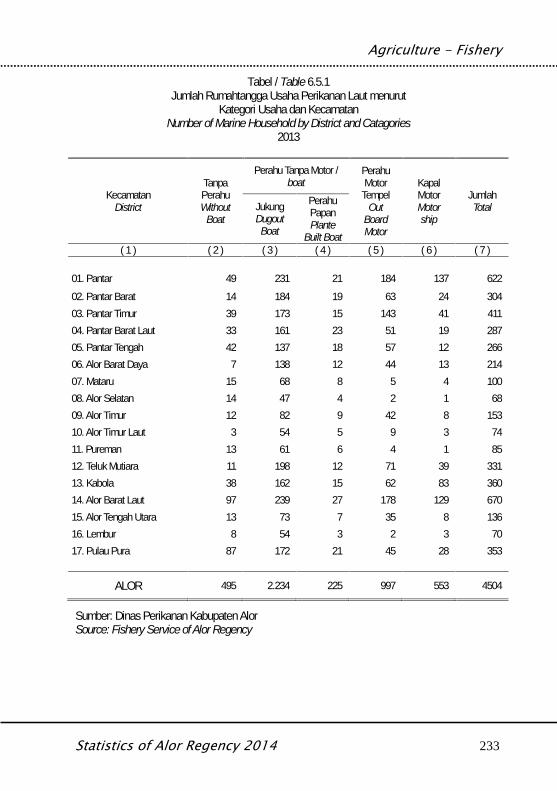
Agriculture - Fishery
Statistics of Alor Regency 2014 233
Tabel / Table 6.5.1Jumlah Rumahtangga Usaha Perikanan Laut menurut
Kategori Usaha dan KecamatanNumber of Marine Household by District and Catagories
2013
KecamatanDistrict
TanpaPerahuWithout
Boat
Perahu Tanpa Motor /boat
PerahuMotor
TempelOut
BoardMotor
KapalMotorMotorship
JumlahTotalJukung
DugoutBoat
PerahuPapanPlante
Built Boat( 1 ) ( 2 ) ( 3 ) ( 4 ) ( 5 ) ( 6 ) ( 7 )
01. Pantar 49 231 21 184 137 62202. Pantar Barat 14 184 19 63 24 30403. Pantar Timur 39 173 15 143 41 41104. Pantar Barat Laut 33 161 23 51 19 28705. Pantar Tengah 42 137 18 57 12 26606. Alor Barat Daya 7 138 12 44 13 21407. Mataru 15 68 8 5 4 10008. Alor Selatan 14 47 4 2 1 6809. Alor Timur 12 82 9 42 8 15310. Alor Timur Laut 3 54 5 9 3 7411. Pureman 13 61 6 4 1 8512. Teluk Mutiara 11 198 12 71 39 33113. Kabola 38 162 15 62 83 36014. Alor Barat Laut 97 239 27 178 129 67015. Alor Tengah Utara 13 73 7 35 8 13616. Lembur 8 54 3 2 3 7017. Pulau Pura 87 172 21 45 28 353
ALOR 495 2.234 225 997 553 4504
Sumber: Dinas Perikanan Kabupaten AlorSource: Fishery Service of Alor Regency
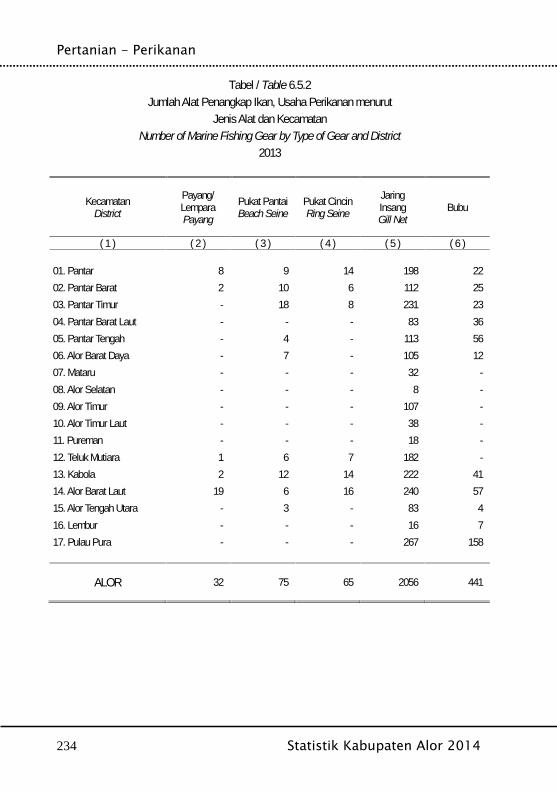
Pertanian - Perikanan
234 Statistik Kabupaten Alor 2014
Tabel / Table 6.5.2Jumlah Alat Penangkap Ikan, Usaha Perikanan menurut
Jenis Alat dan KecamatanNumber of Marine Fishing Gear by Type of Gear and District
2013
KecamatanDistrict
Payang/LemparaPayang
Pukat PantaiBeach Seine
Pukat CincinRing Seine
JaringInsangGill Net
Bubu
( 1 ) ( 2 ) ( 3 ) ( 4 ) ( 5 ) ( 6 )
01. Pantar 8 9 14 198 2202. Pantar Barat 2 10 6 112 2503. Pantar Timur - 18 8 231 2304. Pantar Barat Laut - - - 83 3605. Pantar Tengah - 4 - 113 5606. Alor Barat Daya - 7 - 105 1207. Mataru - - - 32 -08. Alor Selatan - - - 8 -09. Alor Timur - - - 107 -10. Alor Timur Laut - - - 38 -11. Pureman - - - 18 -12. Teluk Mutiara 1 6 7 182 -13. Kabola 2 12 14 222 4114. Alor Barat Laut 19 6 16 240 5715. Alor Tengah Utara - 3 - 83 416. Lembur - - - 16 717. Pulau Pura - - - 267 158
ALOR 32 75 65 2056 441
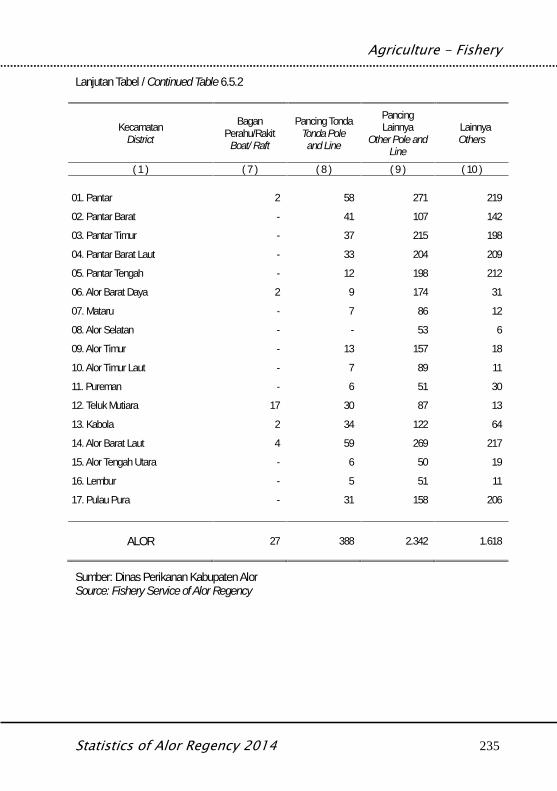
Agriculture - Fishery
Statistics of Alor Regency 2014 235
Lanjutan Tabel / Continued Table 6.5.2
KecamatanDistrict
BaganPerahu/Rakit
Boat/ Raft
Pancing TondaTonda Pole
and Line
PancingLainnya
Other Pole andLine
LainnyaOthers
( 1 ) ( 7 ) ( 8 ) ( 9 ) ( 10 )
01. Pantar 2 58 271 219
02. Pantar Barat - 41 107 142
03. Pantar Timur - 37 215 198
04. Pantar Barat Laut - 33 204 209
05. Pantar Tengah - 12 198 212
06. Alor Barat Daya 2 9 174 31
07. Mataru - 7 86 12
08. Alor Selatan - - 53 6
09. Alor Timur - 13 157 18
10. Alor Timur Laut - 7 89 11
11. Pureman - 6 51 30
12. Teluk Mutiara 17 30 87 13
13. Kabola 2 34 122 64
14. Alor Barat Laut 4 59 269 217
15. Alor Tengah Utara - 6 50 19
16. Lembur - 5 51 11
17. Pulau Pura - 31 158 206
ALOR 27 388 2.342 1.618
Sumber: Dinas Perikanan Kabupaten AlorSource: Fishery Service of Alor Regency
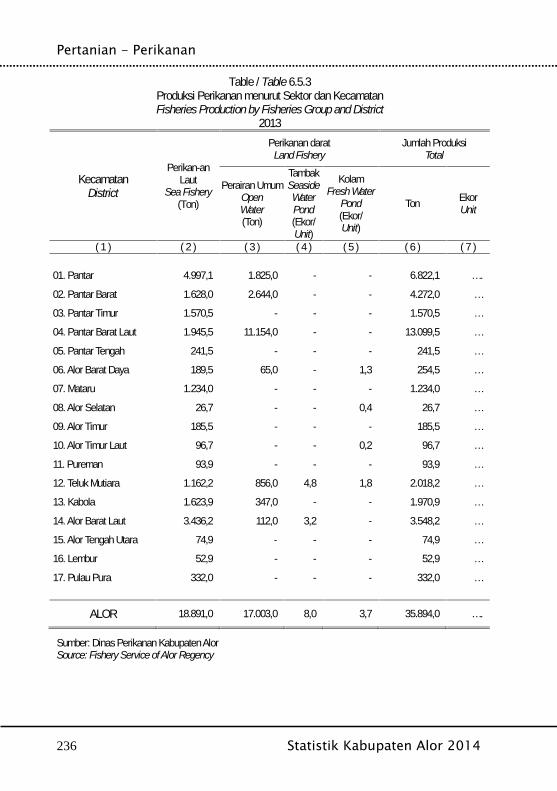
Pertanian - Perikanan
236 Statistik Kabupaten Alor 2014
Table / Table 6.5.3Produksi Perikanan menurut Sektor dan KecamatanFisheries Production by Fisheries Group and District
2013
KecamatanDistrict
Perikan-anLaut
Sea Fishery(Ton)
Perikanan daratLand Fishery
Jumlah ProduksiTotal
Perairan UmumOpenWater(Ton)
TambakSeasideWaterPond(Ekor/Unit)
KolamFresh Water
Pond(Ekor/Unit)
Ton EkorUnit
( 1 ) ( 2 ) ( 3 ) ( 4 ) ( 5 ) ( 6 ) ( 7 )
01. Pantar 4.997,1 1.825,0 - - 6.822,1 ….
02. Pantar Barat 1.628,0 2.644,0 - - 4.272,0 …
03. Pantar Timur 1.570,5 - - - 1.570,5 …
04. Pantar Barat Laut 1.945,5 11.154,0 - - 13.099,5 …
05. Pantar Tengah 241,5 - - - 241,5 …
06. Alor Barat Daya 189,5 65,0 - 1,3 254,5 …
07. Mataru 1.234,0 - - - 1.234,0 …
08. Alor Selatan 26,7 - - 0,4 26,7 …
09. Alor Timur 185,5 - - - 185,5 …
10. Alor Timur Laut 96,7 - - 0,2 96,7 …
11. Pureman 93,9 - - - 93,9 …
12. Teluk Mutiara 1.162,2 856,0 4,8 1,8 2.018,2 …
13. Kabola 1.623,9 347,0 - - 1.970,9 …
14. Alor Barat Laut 3.436,2 112,0 3,2 - 3.548,2 …
15. Alor Tengah Utara 74,9 - - - 74,9 …
16. Lembur 52,9 - - - 52,9 …
17. Pulau Pura 332,0 - - - 332,0 …
ALOR 18.891,0 17.003,0 8,0 3,7 35.894,0 ….
Sumber: Dinas Perikanan Kabupaten AlorSource: Fishery Service of Alor Regency
Electricity and Water
Statistics of Alor Regency 2014 237
BAB VIILISTRIK & AIR MINUM
Electricity & Water

Listrik dan Air Minum
238 Statistik Kabupaten Alor 2014
Electricity and Water
Statistics of Alor Regency 2014 239
Penjelasan Teknis Technical Notes
1. Perusahaan Listrik Negara (PLN) adalahPerusahaan Umum Milik Negara yangmempunyai aktivitas kegiatan pembangkitan,transmisi, dan distribusi tenaga listrik.
2. Perusahaan Air Bersih adalah perusahaan yangmempunyai aktivitas dalam penampungan,penjernihan dan penyaluran air baku atau airbersih dari terminal air melalui saluran air, pipa,atau mobil tangki (dalam satu pengelolaanadministrasi dengan kegiatan ekonomi) kepadarumah tangga, perusahaan industri, ataupengguna komersial lainnya.
3. Jumlah listrik/ gas/ air bersih yang terjual adalahbanyaknya listrik/ gas/ air bersih yang disalurkankepada para pelanggan.
4. Biaya input adalah pengeluaran yang digunakanuntuk pembelian bahan bakar dan pelumastenaga listrik yang dibeli, alat-alat tulis, onderdil,ongkos pemeliharaan dan perbaikan kecil alatproduksi, sewa gedung dan mesin serta jasalainnya.
5. Nilai Output adalah nilai tenaga listrik/gas/airbersih yang dijual atau didistribusikan kepadapara pelanggan dan ditambah denganpendapatan atau penerimaan dari kegiatan jasaperusahaan.
1. State Electricity Company (PLN) is a State ownedcompany that has activities for electricityproduction, transmission, and electricitydistribution.
2. The Water Supply Company (PDAM) is acompany with several activities such as thecollection and purification of water and thedistribution of water to households, industries, andother commercial users.
3. Sold electricity/gas/cleaned water is totalelectricity/gas/cleaned water distributed tocustomers.
4. Input values include expenditures for fuel andlubricant, electricity consumed maintenance,stationaries, spare parts, maintenance cost ofmachineries and vehicles, building andmachineries rental cost, and cost of otherservices.
5. Output cover electricity/gas/cleaned water soldand distributed to customer added by income fromother services.
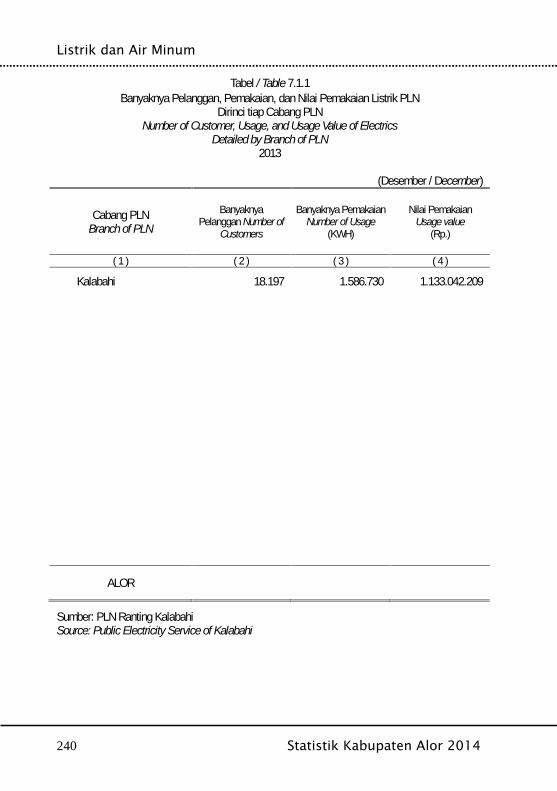
Listrik dan Air Minum
240 Statistik Kabupaten Alor 2014
Tabel / Table 7.1.1Banyaknya Pelanggan, Pemakaian, dan Nilai Pemakaian Listrik PLN
Dirinci tiap Cabang PLNNumber of Customer, Usage, and Usage Value of Electrics
Detailed by Branch of PLN2013
(Desember / December)
Cabang PLNBranch of PLN
BanyaknyaPelanggan Number of
Customers
Banyaknya PemakaianNumber of Usage
(KWH)
Nilai PemakaianUsage value
(Rp.)
( 1 ) ( 2 ) ( 3 ) ( 4 )
01. Kalabahi 18.197 1.586.730 1.133.042.209
02.
03.
04.
05.
06.
07.
08.
09.
10.
11.
ALOR
Sumber: PLN Ranting KalabahiSource: Public Electricity Service of Kalabahi
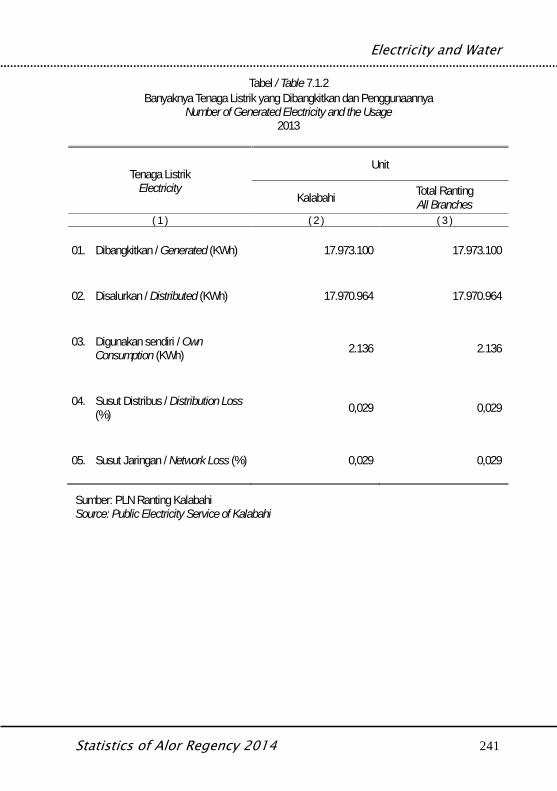
Electricity and Water
Statistics of Alor Regency 2014 241
Tabel / Table 7.1.2Banyaknya Tenaga Listrik yang Dibangkitkan dan Penggunaannya
Number of Generated Electricity and the Usage2013
Tenaga ListrikElectricity
Unit
Kalabahi Total RantingAll Branches
( 1 ) ( 2 ) ( 3 )
01. Dibangkitkan / Generated (KWh) 17.973.100 17.973.100
02. Disalurkan / Distributed (KWh) 17.970.964 17.970.964
03. Digunakan sendiri / OwnConsumption (KWh) 2.136 2.136
04. Susut Distribus / Distribution Loss(%) 0,029 0,029
05. Susut Jaringan / Network Loss (%) 0,029 0,029
Sumber: PLN Ranting KalabahiSource: Public Electricity Service of Kalabahi
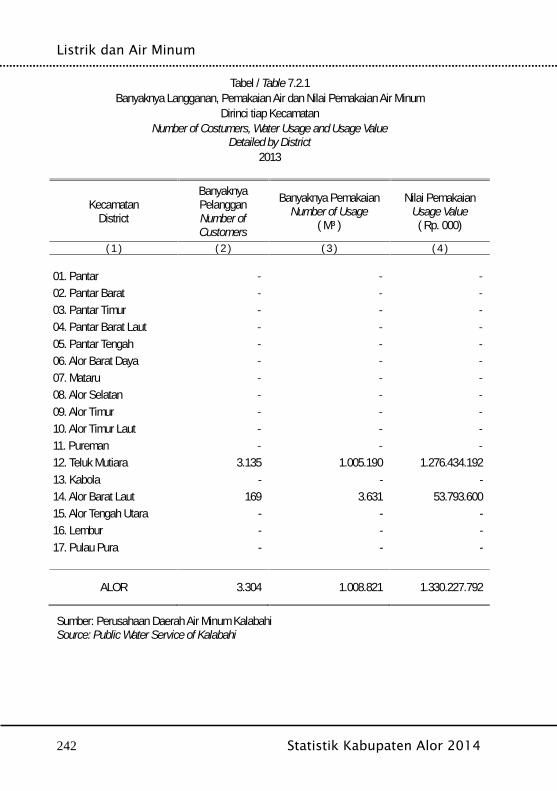
Listrik dan Air Minum
242 Statistik Kabupaten Alor 2014
Tabel / Table 7.2.1Banyaknya Langganan, Pemakaian Air dan Nilai Pemakaian Air Minum
Dirinci tiap KecamatanNumber of Costumers, Water Usage and Usage Value
Detailed by District2013
KecamatanDistrict
BanyaknyaPelangganNumber ofCustomers
Banyaknya PemakaianNumber of Usage
( M³ )
Nilai PemakaianUsage Value
( Rp. 000)
( 1 ) ( 2 ) ( 3 ) ( 4 )
01. Pantar - - -02. Pantar Barat - - -03. Pantar Timur - - -04. Pantar Barat Laut - - -05. Pantar Tengah - - -06. Alor Barat Daya - - -07. Mataru - - -08. Alor Selatan - - -09. Alor Timur - - -10. Alor Timur Laut - - -11. Pureman - - -12. Teluk Mutiara 3.135 1.005.190 1.276.434.19213. Kabola - - -14. Alor Barat Laut 169 3.631 53.793.60015. Alor Tengah Utara - - -16. Lembur - - -17. Pulau Pura - - -
ALOR 3.304 1.008.821 1.330.227.792
Sumber: Perusahaan Daerah Air Minum KalabahiSource: Public Water Service of Kalabahi
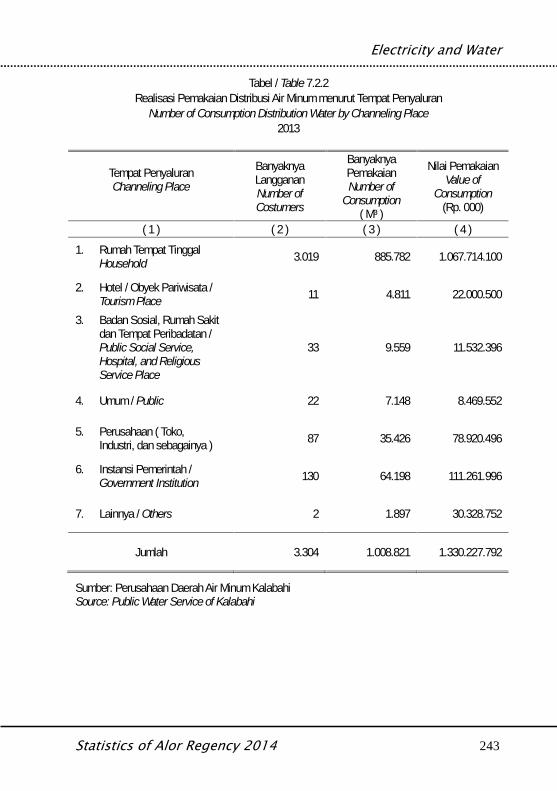
Electricity and Water
Statistics of Alor Regency 2014 243
Tabel / Table 7.2.2Realisasi Pemakaian Distribusi Air Minum menurut Tempat Penyaluran
Number of Consumption Distribution Water by Channeling Place2013
Tempat PenyaluranChanneling Place
BanyaknyaLanggananNumber ofCostumers
BanyaknyaPemakaianNumber of
Consumption( M³ )
Nilai PemakaianValue of
Consumption(Rp. 000)
( 1 ) ( 2 ) ( 3 ) ( 4 )1. Rumah Tempat Tinggal
Household 3.019 885.782 1.067.714.100
2. Hotel / Obyek Pariwisata /Tourism Place 11 4.811 22.000.500
3. Badan Sosial, Rumah Sakitdan Tempat Peribadatan /Public Social Service,Hospital, and ReligiousService Place
33 9.559 11.532.396
4. Umum / Public 22 7.148 8.469.552
5. Perusahaan ( Toko,Industri, dan sebagainya ) 87 35.426 78.920.496
6. Instansi Pemerintah /Government Institution 130 64.198 111.261.996
7. Lainnya / Others 2 1.897 30.328.752
Jumlah 3.304 1.008.821 1.330.227.792
Sumber: Perusahaan Daerah Air Minum KalabahiSource: Public Water Service of Kalabahi
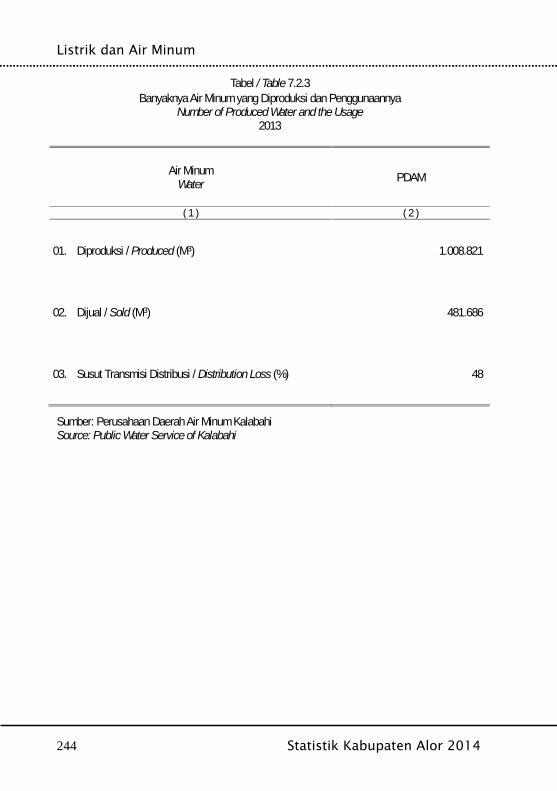
Listrik dan Air Minum
244 Statistik Kabupaten Alor 2014
Tabel / Table 7.2.3Banyaknya Air Minum yang Diproduksi dan Penggunaannya
Number of Produced Water and the Usage2013
Air MinumWater PDAM
( 1 ) ( 2 )
01. Diproduksi / Produced (M3) 1.008.821
02. Dijual / Sold (M3) 481.686
03. Susut Transmisi Distribusi / Distribution Loss (%) 48
Sumber: Perusahaan Daerah Air Minum KalabahiSource: Public Water Service of Kalabahi

Electricity and Water
Statistics of Alor Regency 2014 245

Listrik dan Air Minum
246 Statistik Kabupaten Alor 2014

Industry and Commerce
Statistics of Alor Regency 2014 247
BAB VIIIINDUSTRI & PERDAGANGAN
Industry & Commerce
Industri dan Perdagangan
248 Statistik Kabupaten Alor 2014

Industry and Commerce
Statistics of Alor Regency 2014 249
Penjelasan Teknis Technical Notes
1. Pengumpulan data industri besar dan sedangdilakukan melalui Survei Industri Besar danSedang dilaksanakan setiap tahun secaralengkap (sensus) sejak 1975. Survei IndustriBesar dan Sedang mencakup semua perusahaanindustri yang mempunyai tenaga kerja 20 orangatau lebih dengan menggunakan kuesioner IIA.
2. Klasifikasi industri yang digunakan dalam surveiini berdasar kepada Klasifikasi Baku LapanganUsahan Indonesia (KBLI). KBLI adalahklasifikasi lapangan usaha yang berdasar kepadaInternational Standard Industrial Classification ofAll Economic Acitivites (ISIC) revisi 3 yang telahdisesuaikan dengan kondisi Indonesia.
3. Industri Pengolahan adalah suatu kegiatanekonomi yang melakukan kegiatan mengubahsuatu barang dasar secara mekanis, kimia, ataudengan tangan sehingga menjadi barang jadi/setengah jadi, dan atau barang yang kurangnilainya menjadi barang yang lebih tinggi nilainya,dan sifatnya lebih dekat kepada pemakai akhir.Termasuk dalam kegiatan ini adalah jasa industridan pekerjaan perakitan (assembling).
4. Jasa Industri adalah kegiatan industri yangmelayani keperluan pihak lain. Pada kegiatan inibahan baku disediakan oleh pihak lain sedangkanpihak pengolah hanya melakukan pengolahannyadengan mendapat imbalan sebagai balas jasa(upah maklon)
1. Data collection of large and medium scalemanufacturing is conducted through The Largeand Medium Manufacturing Establishment Surveythat has been done annually for all industries(census) since 1975. Large and MediumManufacturing Establishment Survey cover allmanufacturers/ industries with 20 workers or moreby questionnaire IIA.
2. The industrial classification adopted in this surveyrefers to the Klasifikasi Baku Lapangan UsahaIndonesia (KBLI). KBLI is classification ofeconomic activities based on InternationalStandard Industrial Classification of All EconomicAcitivites (ISIC rev 3) that has been modifiedaccording to the local condition in Indonesia.
3. Manufacturing industry is defined as an economicactivity processing basic goods mechanically,chemicals or manually into final or intermediategoods. It is also defined as processing of lowervalue goods into higher value goods as final orintermediate products. The activities also includeservices for manufacturing and assembling.
4. Service for manufacturing is defined as amanufacturing activity which serving othermanufacturing establishment. In this case, rawmaterials are supplied by others while the workersare paid as a compensation for processing rawmaterials.
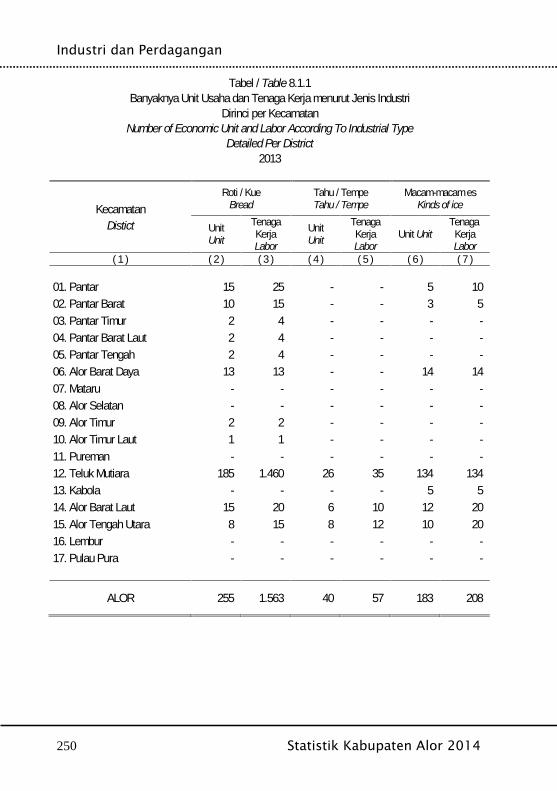
Industri dan Perdagangan
250 Statistik Kabupaten Alor 2014
Tabel / Table 8.1.1Banyaknya Unit Usaha dan Tenaga Kerja menurut Jenis Industri
Dirinci per KecamatanNumber of Economic Unit and Labor According To Industrial Type
Detailed Per District2013
KecamatanDistict
Roti / KueBread
Tahu / TempeTahu / Tempe
Macam-macam esKinds of ice
UnitUnit
TenagaKerjaLabor
UnitUnit
TenagaKerjaLabor
Unit UnitTenaga
KerjaLabor
( 1 ) ( 2 ) ( 3 ) ( 4 ) ( 5 ) ( 6 ) ( 7 )
01. Pantar 15 25 - - 5 1002. Pantar Barat 10 15 - - 3 503. Pantar Timur 2 4 - - - -04. Pantar Barat Laut 2 4 - - - -05. Pantar Tengah 2 4 - - - -06. Alor Barat Daya 13 13 - - 14 1407. Mataru - - - - - -08. Alor Selatan - - - - - -09. Alor Timur 2 2 - - - -10. Alor Timur Laut 1 1 - - - -11. Pureman - - - - - -12. Teluk Mutiara 185 1.460 26 35 134 13413. Kabola - - - - 5 514. Alor Barat Laut 15 20 6 10 12 2015. Alor Tengah Utara 8 15 8 12 10 2016. Lembur - - - - - -17. Pulau Pura - - - - - -
ALOR 255 1.563 40 57 183 208
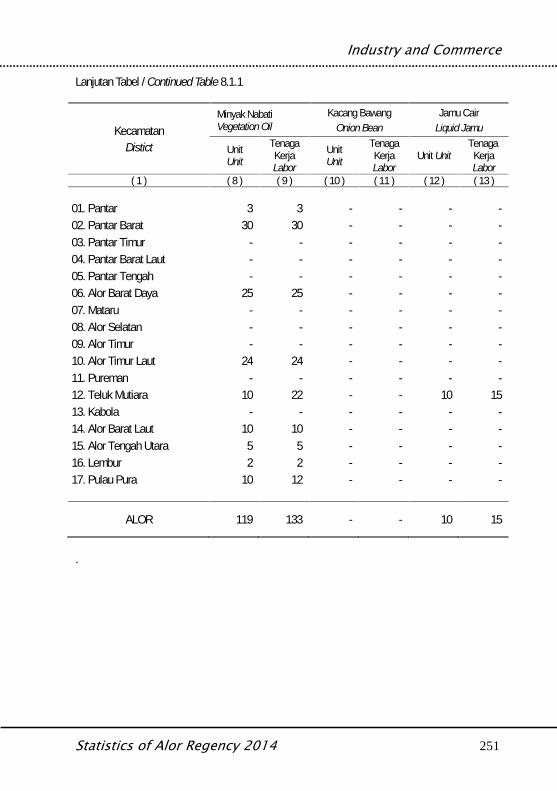
Industry and Commerce
Statistics of Alor Regency 2014 251
Lanjutan Tabel / Continued Table 8.1.1
KecamatanDistict
Minyak NabatiVegetation Oil
Kacang BawangOnion Bean
Jamu CairLiquid Jamu
UnitUnit
TenagaKerjaLabor
UnitUnit
TenagaKerjaLabor
Unit UnitTenaga
KerjaLabor
( 1 ) ( 8 ) ( 9 ) ( 10 ) ( 11 ) ( 12 ) ( 13 )
01. Pantar 3 3 - - - -02. Pantar Barat 30 30 - - - -03. Pantar Timur - - - - - -04. Pantar Barat Laut - - - - - -05. Pantar Tengah - - - - - -06. Alor Barat Daya 25 25 - - - -07. Mataru - - - - - -08. Alor Selatan - - - - - -09. Alor Timur - - - - - -10. Alor Timur Laut 24 24 - - - -11. Pureman - - - - - -12. Teluk Mutiara 10 22 - - 10 1513. Kabola - - - - - -14. Alor Barat Laut 10 10 - - - -15. Alor Tengah Utara 5 5 - - - -16. Lembur 2 2 - - - -17. Pulau Pura 10 12 - - - -
ALOR 119 133 - - 10 15
.
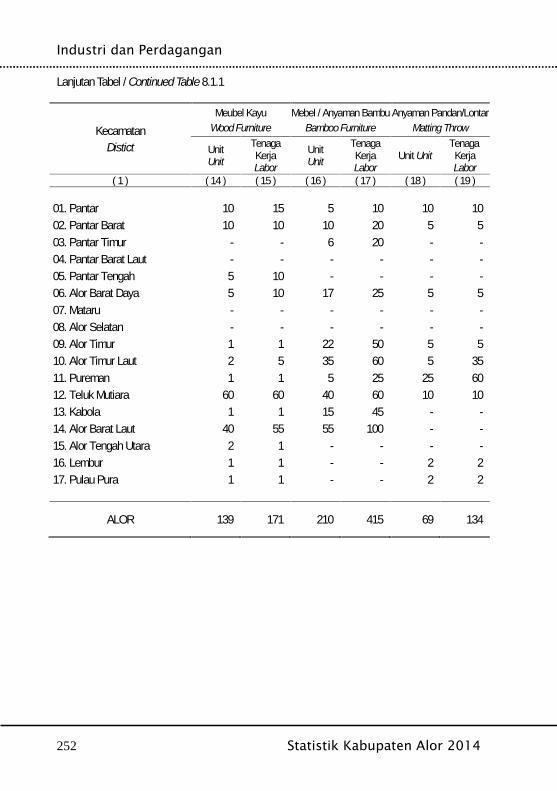
Industri dan Perdagangan
252 Statistik Kabupaten Alor 2014
Lanjutan Tabel / Continued Table 8.1.1
KecamatanDistict
Meubel KayuWood Furniture
Mebel / Anyaman BambuBamboo Furniture
Anyaman Pandan/LontarMatting Throw
UnitUnit
TenagaKerjaLabor
UnitUnit
TenagaKerjaLabor
Unit UnitTenaga
KerjaLabor
( 1 ) ( 14 ) ( 15 ) ( 16 ) ( 17 ) ( 18 ) ( 19 )
01. Pantar 10 15 5 10 10 1002. Pantar Barat 10 10 10 20 5 503. Pantar Timur - - 6 20 - -04. Pantar Barat Laut - - - - - -05. Pantar Tengah 5 10 - - - -06. Alor Barat Daya 5 10 17 25 5 507. Mataru - - - - - -08. Alor Selatan - - - - - -09. Alor Timur 1 1 22 50 5 510. Alor Timur Laut 2 5 35 60 5 3511. Pureman 1 1 5 25 25 6012. Teluk Mutiara 60 60 40 60 10 1013. Kabola 1 1 15 45 - -14. Alor Barat Laut 40 55 55 100 - -15. Alor Tengah Utara 2 1 - - - -16. Lembur 1 1 - - 2 217. Pulau Pura 1 1 - - 2 2
ALOR 139 171 210 415 69 134
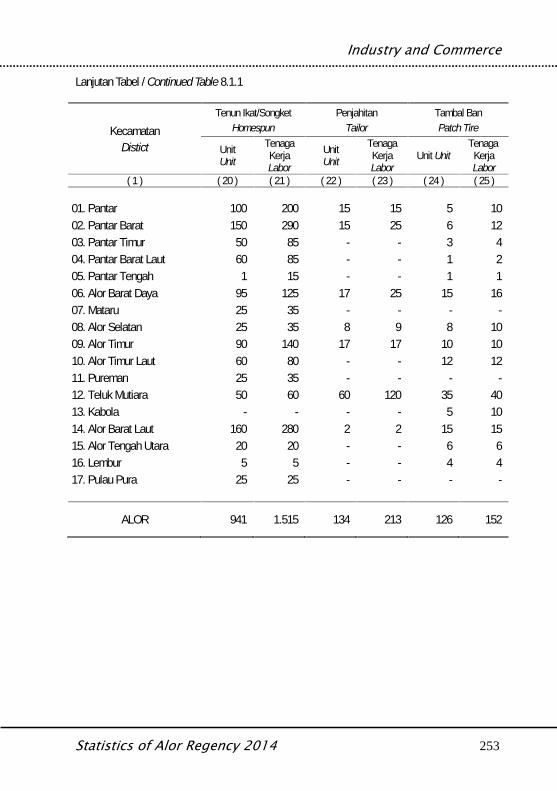
Industry and Commerce
Statistics of Alor Regency 2014 253
Lanjutan Tabel / Continued Table 8.1.1
KecamatanDistict
Tenun Ikat/SongketHomespun
PenjahitanTailor
Tambal BanPatch Tire
UnitUnit
TenagaKerjaLabor
UnitUnit
TenagaKerjaLabor
Unit UnitTenaga
KerjaLabor
( 1 ) ( 20 ) ( 21 ) ( 22 ) ( 23 ) ( 24 ) ( 25 )
01. Pantar 100 200 15 15 5 1002. Pantar Barat 150 290 15 25 6 1203. Pantar Timur 50 85 - - 3 404. Pantar Barat Laut 60 85 - - 1 205. Pantar Tengah 1 15 - - 1 106. Alor Barat Daya 95 125 17 25 15 1607. Mataru 25 35 - - - -08. Alor Selatan 25 35 8 9 8 1009. Alor Timur 90 140 17 17 10 1010. Alor Timur Laut 60 80 - - 12 1211. Pureman 25 35 - - - -12. Teluk Mutiara 50 60 60 120 35 4013. Kabola - - - - 5 1014. Alor Barat Laut 160 280 2 2 15 1515. Alor Tengah Utara 20 20 - - 6 616. Lembur 5 5 - - 4 417. Pulau Pura 25 25 - - - -
ALOR 941 1.515 134 213 126 152
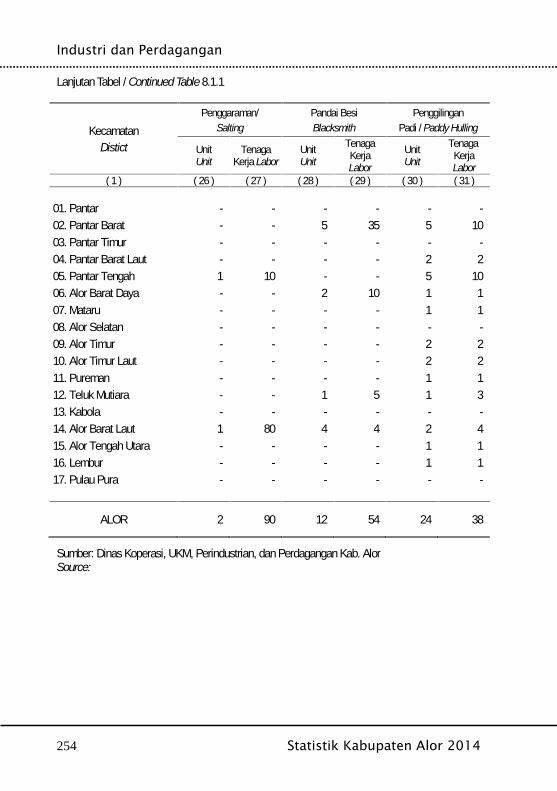
Industri dan Perdagangan
254 Statistik Kabupaten Alor 2014
Lanjutan Tabel / Continued Table 8.1.1
KecamatanDistict
Penggaraman/Salting
Pandai BesiBlacksmith
PenggilinganPadi / Paddy Hulling
UnitUnit
TenagaKerja Labor
UnitUnit
TenagaKerjaLabor
UnitUnit
TenagaKerjaLabor
( 1 ) ( 26 ) ( 27 ) ( 28 ) ( 29 ) ( 30 ) ( 31 )
01. Pantar - - - - - -02. Pantar Barat - - 5 35 5 1003. Pantar Timur - - - - - -04. Pantar Barat Laut - - - - 2 205. Pantar Tengah 1 10 - - 5 1006. Alor Barat Daya - - 2 10 1 107. Mataru - - - - 1 108. Alor Selatan - - - - - -09. Alor Timur - - - - 2 210. Alor Timur Laut - - - - 2 211. Pureman - - - - 1 112. Teluk Mutiara - - 1 5 1 313. Kabola - - - - - -14. Alor Barat Laut 1 80 4 4 2 415. Alor Tengah Utara - - - - 1 116. Lembur - - - - 1 117. Pulau Pura - - - - - -
ALOR 2 90 12 54 24 38
Sumber: Dinas Koperasi, UKM, Perindustrian, dan Perdagangan Kab. AlorSource:
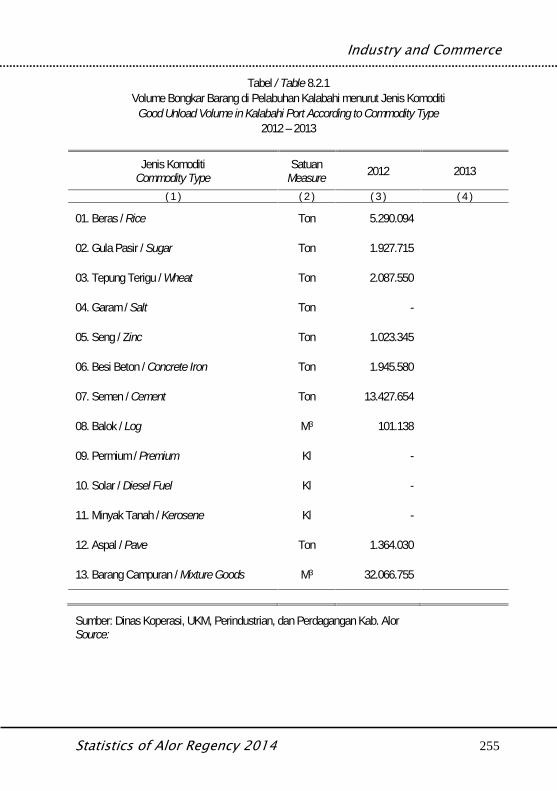
Industry and Commerce
Statistics of Alor Regency 2014 255
Tabel / Table 8.2.1Volume Bongkar Barang di Pelabuhan Kalabahi menurut Jenis Komoditi
Good Unload Volume in Kalabahi Port According to Commodity Type2012 – 2013
Jenis KomoditiCommodity Type
SatuanMeasure 2012 2013
( 1 ) ( 2 ) ( 3 ) ( 4 )
01. Beras / Rice Ton 5.290.094
02. Gula Pasir / Sugar Ton 1.927.715
03. Tepung Terigu / Wheat Ton 2.087.550
04. Garam / Salt Ton -
05. Seng / Zinc Ton 1.023.345
06. Besi Beton / Concrete Iron Ton 1.945.580
07. Semen / Cement Ton 13.427.654
08. Balok / Log M3 101.138
09. Permium / Premium Kl -
10. Solar / Diesel Fuel Kl -
11. Minyak Tanah / Kerosene Kl -
12. Aspal / Pave Ton 1.364.030
13. Barang Campuran / Mixture Goods M3 32.066.755
Sumber: Dinas Koperasi, UKM, Perindustrian, dan Perdagangan Kab. AlorSource:
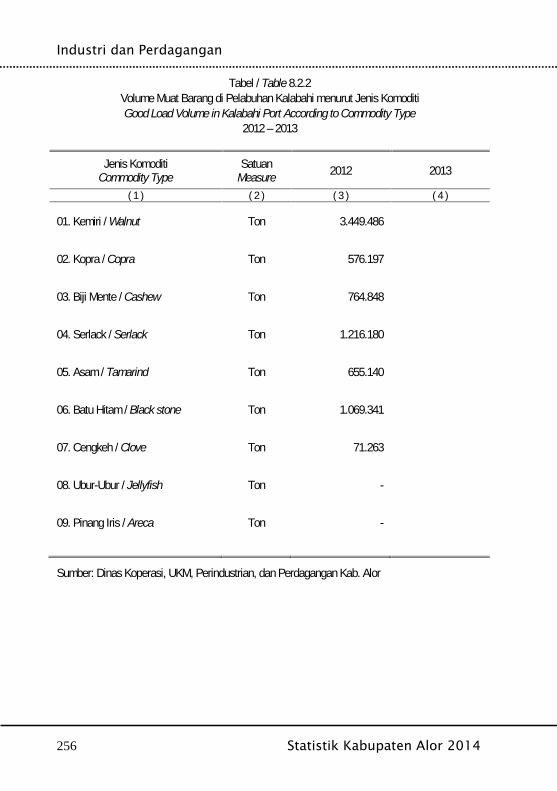
Industri dan Perdagangan
256 Statistik Kabupaten Alor 2014
Tabel / Table 8.2.2Volume Muat Barang di Pelabuhan Kalabahi menurut Jenis KomoditiGood Load Volume in Kalabahi Port According to Commodity Type
2012 – 2013
Jenis KomoditiCommodity Type
SatuanMeasure 2012 2013
( 1 ) ( 2 ) ( 3 ) ( 4 )
01. Kemiri / Walnut Ton 3.449.486
02. Kopra / Copra Ton 576.197
03. Biji Mente / Cashew Ton 764.848
04. Serlack / Serlack Ton 1.216.180
05. Asam / Tamarind Ton 655.140
06. Batu Hitam / Black stone Ton 1.069.341
07. Cengkeh / Clove Ton 71.263
08. Ubur-Ubur / Jellyfish Ton -
09. Pinang Iris / Areca Ton -
Sumber: Dinas Koperasi, UKM, Perindustrian, dan Perdagangan Kab. Alor
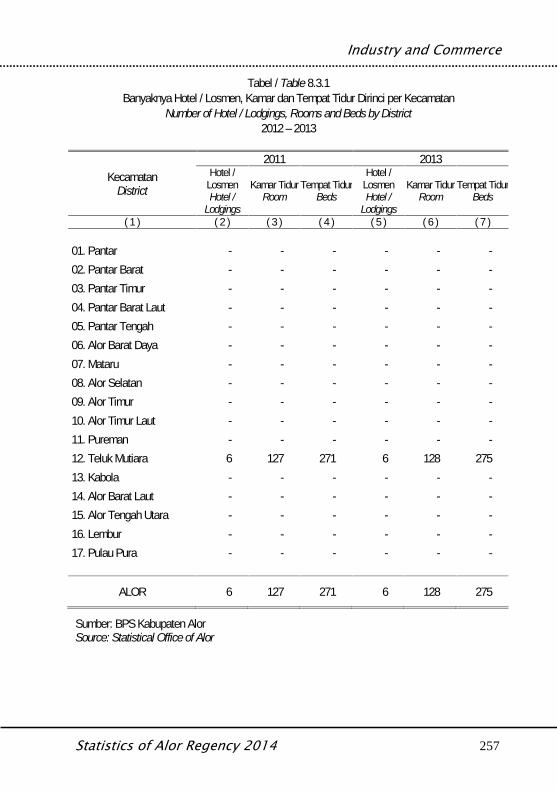
Industry and Commerce
Statistics of Alor Regency 2014 257
Tabel / Table 8.3.1Banyaknya Hotel / Losmen, Kamar dan Tempat Tidur Dirinci per Kecamatan
Number of Hotel / Lodgings, Rooms and Beds by District2012 – 2013
KecamatanDistrict
2011 2013Hotel /
LosmenHotel /
Lodgings
Kamar TidurRoom
Tempat TidurBeds
Hotel /LosmenHotel /
Lodgings
Kamar TidurRoom
Tempat TidurBeds
( 1 ) ( 2 ) ( 3 ) ( 4 ) ( 5 ) ( 6 ) ( 7 )
01. Pantar - - - - - -02. Pantar Barat - - - - - -03. Pantar Timur - - - - - -04. Pantar Barat Laut - - - - - -05. Pantar Tengah - - - - - -06. Alor Barat Daya - - - - - -07. Mataru - - - - - -08. Alor Selatan - - - - - -09. Alor Timur - - - - - -10. Alor Timur Laut - - - - - -11. Pureman - - - - - -12. Teluk Mutiara 6 127 271 6 128 27513. Kabola - - - - - -14. Alor Barat Laut - - - - - -15. Alor Tengah Utara - - - - - -16. Lembur - - - - - -17. Pulau Pura - - - - - -
ALOR 6 127 271 6 128 275
Sumber: BPS Kabupaten AlorSource: Statistical Office of Alor
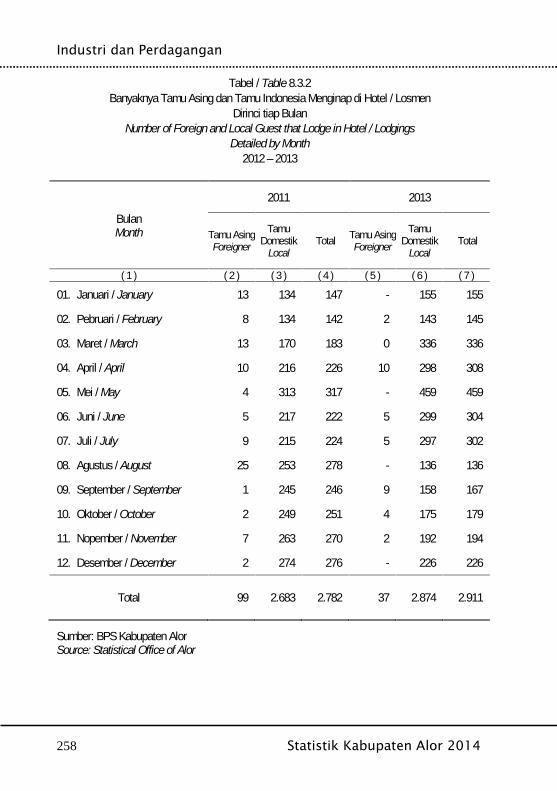
Industri dan Perdagangan
258 Statistik Kabupaten Alor 2014
Tabel / Table 8.3.2Banyaknya Tamu Asing dan Tamu Indonesia Menginap di Hotel / Losmen
Dirinci tiap BulanNumber of Foreign and Local Guest that Lodge in Hotel / Lodgings
Detailed by Month2012 – 2013
BulanMonth
2011 2013
Tamu AsingForeigner
TamuDomestik
LocalTotal Tamu Asing
Foreigner
TamuDomestik
LocalTotal
( 1 ) ( 2 ) ( 3 ) ( 4 ) ( 5 ) ( 6 ) ( 7 )
01. Januari / January 13 134 147 - 155 155
02. Pebruari / February 8 134 142 2 143 145
03. Maret / March 13 170 183 0 336 336
04. April / April 10 216 226 10 298 308
05. Mei / May 4 313 317 - 459 459
06. Juni / June 5 217 222 5 299 304
07. Juli / July 9 215 224 5 297 302
08. Agustus / August 25 253 278 - 136 136
09. September / September 1 245 246 9 158 167
10. Oktober / October 2 249 251 4 175 179
11. Nopember / November 7 263 270 2 192 194
12. Desember / December 2 274 276 - 226 226
Total 99 2.683 2.782 37 2.874 2.911
Sumber: BPS Kabupaten AlorSource: Statistical Office of Alor
Industry and Commerce
Statistics of Alor Regency 2014 259

Industri dan Perdagangan
260 Statistik Kabupaten Alor 2014
Transportation and Communication
Statistics of Alor Regency 2014 261
BAB IXTRANSPORTASI & KOMUNIKASI
Transportation & Communication
Tranportasi dan Komunikasi
262 Statistik Kabupaten Alor 2014
Transportation and Communication
Statistics of Alor Regency 2014 263
Penjelasan Teknis Technical Notes
1. Data transportasi dan komunikasi meliputi:a. Panjang jalanb. Angkutan Daratc. Angkutan Lautd. Angkutan Udarae. Pos dan Telekomunikasi
2. Kendaraan bermotor adalah setiap kendaraanyang digerakkan oleh peralatan teknik yang adapada kendaraan tersebut, biasanya digunakanuntuk angkutan orang atau barang di atas jalanraya selain kendaraan yang berjalan di atas rel.Kendaraan bermotor yang dicatat adalah semuajenis kendaraan kecuali kendaraan bermotor TNI/Polri dan Korps Diplomatik.
3. Mobil penumpang adalah setiap kendaraanbermotor yang dilengkapi dengan tempat dudukuntuk sebanyak-banyaknya delapan orang, tidaktermasuk tempat duduk untuk pengemudi, baikdilengkapi atau tidak dilengkapi bagasi.
4. Mobil bis adalah setiap kendaraan bermotor yangdilengkapi dengan tempat duduk untuk lebih daridelapan orang, tidak termasuk tempat dudukuntuk pengemudi, baik dilengkapi atau tidakdilengkapi bagasi.
5. Mobil truk adalah setiap kendaraan bermotoryang digunakan untuk angkutan barang, selainmobil penumpang, mobil bis dan kendaraanbermotor roda dua.
6. Data panjang jalan negara dan jalan propinsibersumber dari Kementrian Pekerjaan Umum,sedangkan jalan kabupaten/ kota, diolah daridaftar PJ-II/5.
1. Data on transportation and communicationscover:a. Length of Roadb. Land Transportationc. Sea Transportationd. Air Transportatione. Pos and Telecomunication
2. Motor vehicle are any kind of vehicle motorized bymachine set up in those vehicle. They are usuallyused for transporting peoples and goods on roadsexcept vehicle moving along railway line. The datacover all kinds of motor vehicle except thosebelong to Indonesia Army Force Indonesian StatePolice and Diplomatic Corps.
3. Passengers cars are any motor vehicle with nomore than eight seats, excluding seat for driver. Itcan be with or without boot.
4. Buses are passengers cars having seats for morethan eight passenger, excluding seat for driver. Itcan be with or without boot.
5. Trucks are any motor vehicle used to transportgoods excluding passenger cars, buses andmotorcycle.
6. Data on the length of state and provincial roadswere taken from the Ministry of Public Works,while the regency/ city roads data were taken fromRegency Public Works Offices, based on PJ-II/5questionnaire.
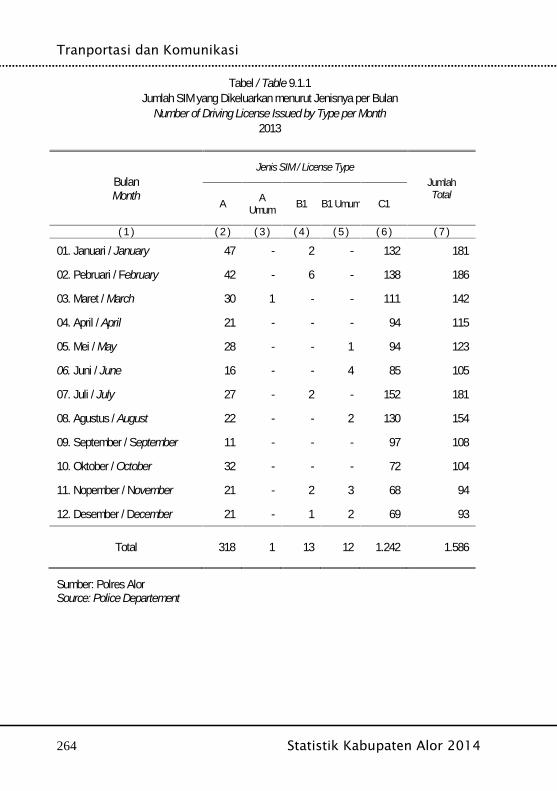
Tranportasi dan Komunikasi
264 Statistik Kabupaten Alor 2014
Tabel / Table 9.1.1Jumlah SIM yang Dikeluarkan menurut Jenisnya per Bulan
Number of Driving License Issued by Type per Month2013
BulanMonth
Jenis SIM / License TypeJumlahTotal
A AUmum B1 B1 Umum C1
( 1 ) ( 2 ) ( 3 ) ( 4 ) ( 5 ) ( 6 ) ( 7 )
01. Januari / January 47 - 2 - 132 181
02. Pebruari / February 42 - 6 - 138 186
03. Maret / March 30 1 - - 111 142
04. April / April 21 - - - 94 115
05. Mei / May 28 - - 1 94 123
06. Juni / June 16 - - 4 85 105
07. Juli / July 27 - 2 - 152 181
08. Agustus / August 22 - - 2 130 154
09. September / September 11 - - - 97 108
10. Oktober / October 32 - - - 72 104
11. Nopember / November 21 - 2 3 68 94
12. Desember / December 21 - 1 2 69 93
Total 318 1 13 12 1.242 1.586
Sumber: Polres AlorSource: Police Departement
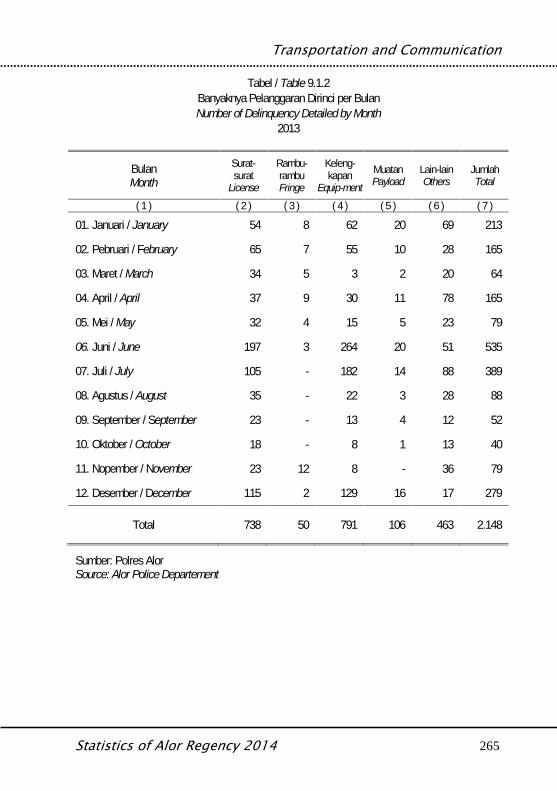
Transportation and Communication
Statistics of Alor Regency 2014 265
Tabel / Table 9.1.2Banyaknya Pelanggaran Dirinci per BulanNumber of Delinquency Detailed by Month
2013
BulanMonth
Surat-surat
License
Rambu-rambuFringe
Keleng-kapan
Equip-ment
MuatanPayload
Lain-lainOthers
JumlahTotal
( 1 ) ( 2 ) ( 3 ) ( 4 ) ( 5 ) ( 6 ) ( 7 )
01. Januari / January 54 8 62 20 69 213
02. Pebruari / February 65 7 55 10 28 165
03. Maret / March 34 5 3 2 20 64
04. April / April 37 9 30 11 78 165
05. Mei / May 32 4 15 5 23 79
06. Juni / June 197 3 264 20 51 535
07. Juli / July 105 - 182 14 88 389
08. Agustus / August 35 - 22 3 28 88
09. September / September 23 - 13 4 12 52
10. Oktober / October 18 - 8 1 13 40
11. Nopember / November 23 12 8 - 36 79
12. Desember / December 115 2 129 16 17 279
Total 738 50 791 106 463 2.148
Sumber: Polres AlorSource: Alor Police Departement
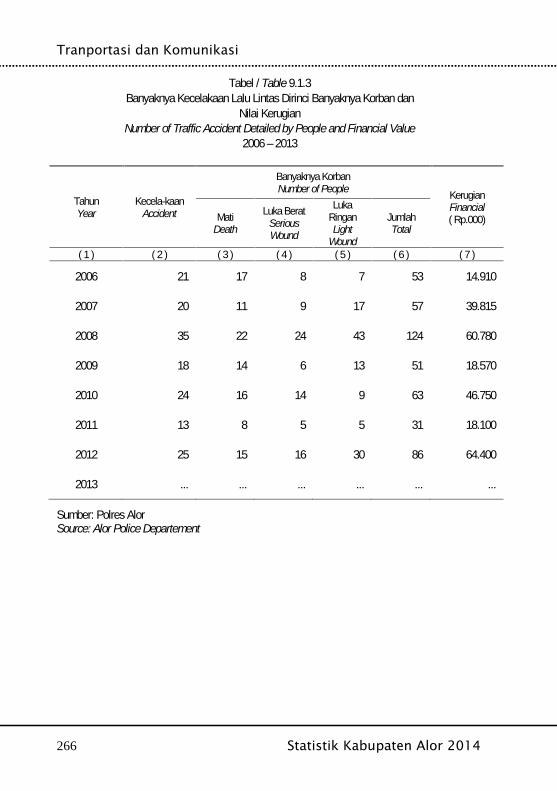
Tranportasi dan Komunikasi
266 Statistik Kabupaten Alor 2014
Tabel / Table 9.1.3Banyaknya Kecelakaan Lalu Lintas Dirinci Banyaknya Korban dan
Nilai KerugianNumber of Traffic Accident Detailed by People and Financial Value
2006 – 2013
TahunYear
Kecela-kaanAccident
Banyaknya KorbanNumber of People Kerugian
Financial( Rp.000)Mati
Death
Luka BeratSeriousWound
LukaRinganLight
Wound
JumlahTotal
( 1 ) ( 2 ) ( 3 ) ( 4 ) ( 5 ) ( 6 ) ( 7 )
2006 21 17 8 7 53 14.910
2007 20 11 9 17 57 39.815
2008 35 22 24 43 124 60.780
2009 18 14 6 13 51 18.570
2010 24 16 14 9 63 46.750
2011 13 8 5 5 31 18.100
2012 25 15 16 30 86 64.400
2013 ... ... ... ... ... ...
Sumber: Polres AlorSource: Alor Police Departement

Transportation and Communication
Statistics of Alor Regency 2014 267
Tabel / Table 9.1.4Banyaknya Kendaraan Bermotor Pribadi Dirinci menurut Jenis
Number of Private Vehicles by Type of Vehicles2009 – 2013
Jenis KendaraanType of Vehicles 2009 2010 2011 2012 2013
( 1 ) ( 2 ) ( 3 ) ( 4 ) ( 5 ) ( 6 )
1. Sepeda Motor / MotorCycles 7.917 9.230 10.265 12.025 ...
2. Sedan, Jeep, StationWagon 154 162 170 207 ...
3. Bus, Micro Bus 10 32 48 48 ...
4. Truck, Pick Up 62 78 82 136 ...
JumlahTotal 8.143 9.502 10.565 12.416 ...
Sumber: Polres AlorSource: Alor Police Department
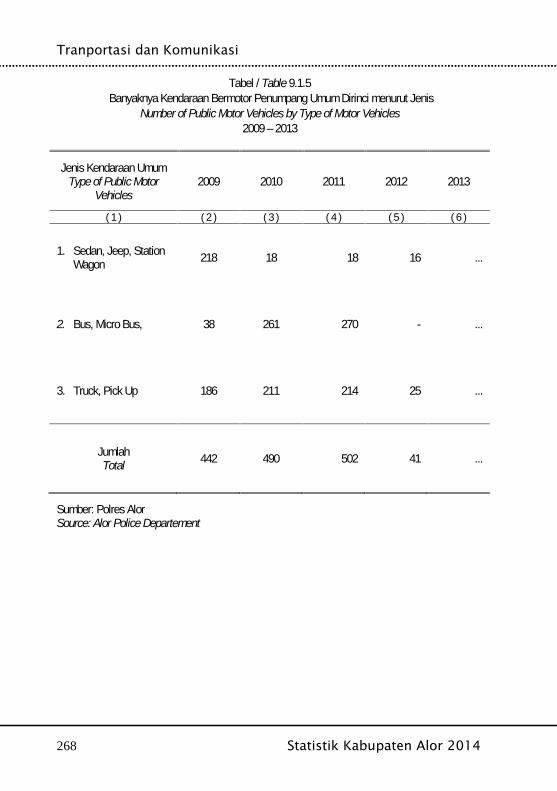
Tranportasi dan Komunikasi
268 Statistik Kabupaten Alor 2014
Tabel / Table 9.1.5Banyaknya Kendaraan Bermotor Penumpang Umum Dirinci menurut Jenis
Number of Public Motor Vehicles by Type of Motor Vehicles2009 – 2013
Jenis Kendaraan UmumType of Public Motor
Vehicles2009 2010 2011 2012 2013
( 1 ) ( 2 ) ( 3 ) ( 4 ) ( 5 ) ( 6 )
1. Sedan, Jeep, StationWagon 218 18 18 16 ...
2. Bus, Micro Bus, 38 261 270 - ...
3. Truck, Pick Up 186 211 214 25 ...
JumlahTotal 442 490 502 41 ...
Sumber: Polres AlorSource: Alor Police Departement
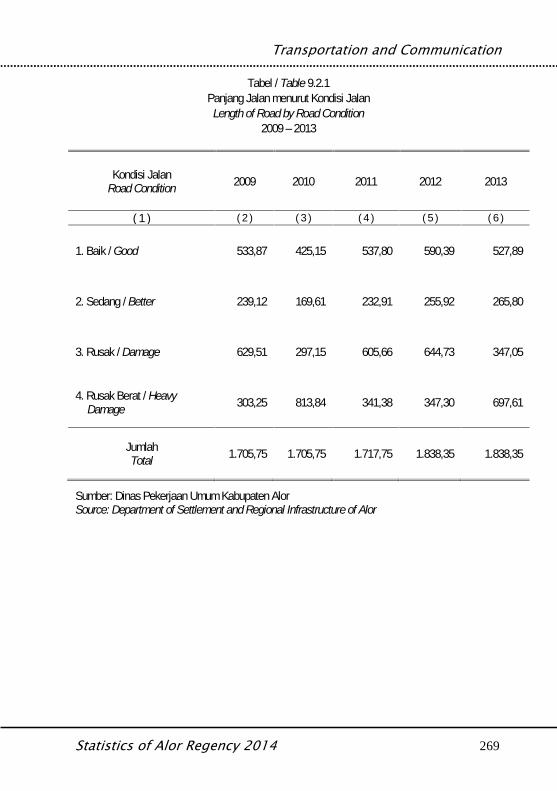
Transportation and Communication
Statistics of Alor Regency 2014 269
Tabel / Table 9.2.1Panjang Jalan menurut Kondisi Jalan
Length of Road by Road Condition2009 – 2013
Kondisi JalanRoad Condition 2009 2010 2011 2012 2013
( 1 ) ( 2 ) ( 3 ) ( 4 ) ( 5 ) ( 6 )
1. Baik / Good 533,87 425,15 537,80 590,39 527,89
2. Sedang / Better 239,12 169,61 232,91 255,92 265,80
3. Rusak / Damage 629,51 297,15 605,66 644,73 347,05
4. Rusak Berat / HeavyDamage 303,25 813,84 341,38 347,30 697,61
JumlahTotal 1.705,75 1.705,75 1.717,75 1.838,35 1.838,35
Sumber: Dinas Pekerjaan Umum Kabupaten AlorSource: Department of Settlement and Regional Infrastructure of Alor
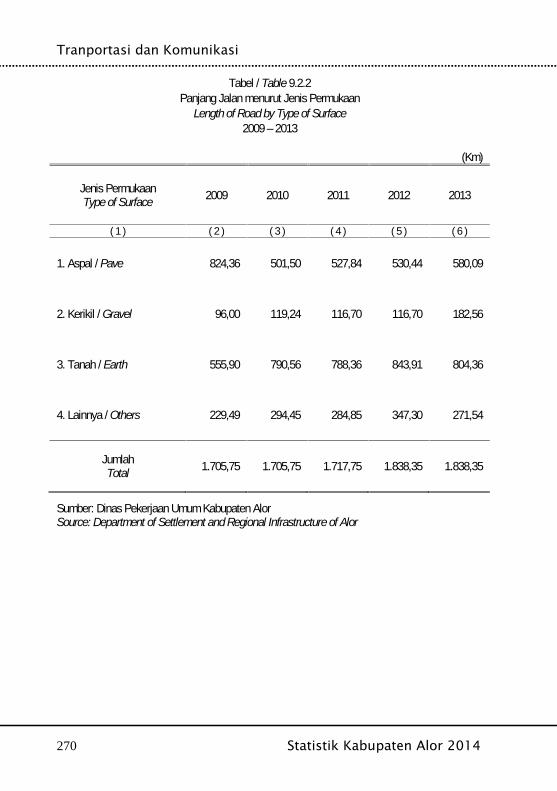
Tranportasi dan Komunikasi
270 Statistik Kabupaten Alor 2014
Tabel / Table 9.2.2Panjang Jalan menurut Jenis Permukaan
Length of Road by Type of Surface2009 – 2013
(Km)
Jenis PermukaanType of Surface 2009 2010 2011 2012 2013
( 1 ) ( 2 ) ( 3 ) ( 4 ) ( 5 ) ( 6 )
1. Aspal / Pave 824,36 501,50 527,84 530,44 580,09
2. Kerikil / Gravel 96,00 119,24 116,70 116,70 182,56
3. Tanah / Earth 555,90 790,56 788,36 843,91 804,36
4. Lainnya / Others 229,49 294,45 284,85 347,30 271,54
JumlahTotal 1.705,75 1.705,75 1.717,75 1.838,35 1.838,35
Sumber: Dinas Pekerjaan Umum Kabupaten AlorSource: Department of Settlement and Regional Infrastructure of Alor

Transportation and Communication
Statistics of Alor Regency 2014 271
Tabel / Table 9.2.3Panjang Jalan menurut Status Jalan
Length of Road by Status Road2009 – 2013
Status JalanStatus of Road 2009 2010 2011 2012 2013
( 1 ) ( 2 ) ( 3 ) ( 4 ) ( 5 ) ( 6 )
1. Jalan Nasional /National Road / NonStatus
105,20 105,20 112,33 112,33 145,43
2. Jalan Propinsi /Provincial 62,13 62,13 67,00 67,00 62,13
3. Jalan Kabupaten /Regency 871,16 871,16 871,16 1.203,02 1.174,79
4. Lainnya / Others 667,26 667,26 667,26 456,00 456,00
JumlahTotal 1.705,75 1.705,75 1.717,75 1.838,35 1.838,35
Sumber: Dinas Pekerjaan Umum Kabupaten AlorSource: Department of Settlement and Regional Infrastructure of Alor
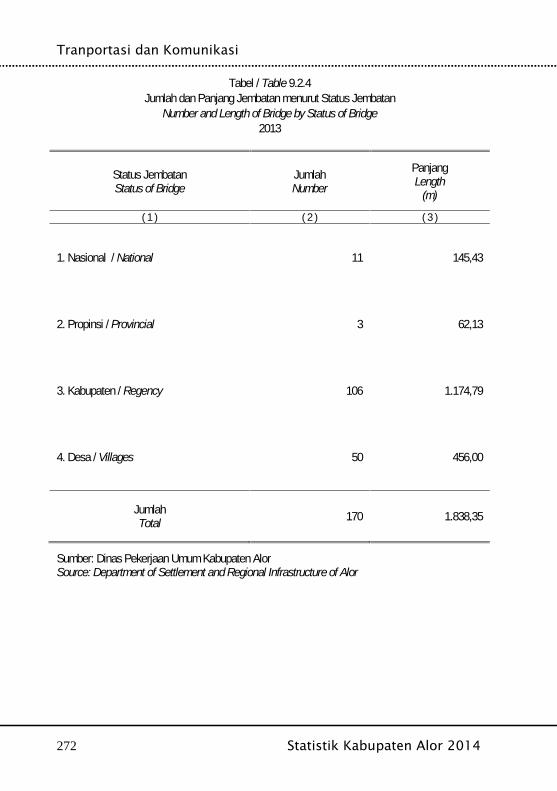
Tranportasi dan Komunikasi
272 Statistik Kabupaten Alor 2014
Tabel / Table 9.2.4Jumlah dan Panjang Jembatan menurut Status Jembatan
Number and Length of Bridge by Status of Bridge2013
Status JembatanStatus of Bridge
JumlahNumber
PanjangLength
(m)
( 1 ) ( 2 ) ( 3 )
1. Nasional / National 11 145,43
2. Propinsi / Provincial 3 62,13
3. Kabupaten / Regency 106 1.174,79
4. Desa / Villages 50 456,00
JumlahTotal 170 1.838,35
Sumber: Dinas Pekerjaan Umum Kabupaten AlorSource: Department of Settlement and Regional Infrastructure of Alor

Transportation and Communication
Statistics of Alor Regency 2014 273
Tabel / Table 9.3.1Banyaknya Pesawat dan Penumpang yang Datang dan Berangkat Lewat Bandar Udara Mali
Dirimci tiap BulanNumber of Incoming Passenger and Plane that Arrive and Depart Through the Mali Airport
Detailed by Month2013
BulanMonth
PesawatPlane
PenumpangPassengers
DatangArrival
BerangkatDepartures
DatangArrival
BerangkatDepartures
( 1 ) ( 2 ) ( 3 ) ( 4 ) ( 5 )
01. Januari / January 52 52 2.324 2.115
02. Pebruari / February 42 42 1.797 1.854
03. Maret / March 55 55 2.464 2.146
04. April / April 60 60 2.571 2.509
05. Mei / May 66 66 2.659 2.524
06. Juni / June 63 63 2.924 2.773
07. Juli / July 62 62 3.142 2.807
08. Agustus / August 64 64 2.895 2.907
09. September / September 62 62 2.897 2.747
10. Oktober / October 66 66 2.955 2.851
11. Nopember / November 63 63 3.105 2.901
12. Desember / December 64 64 3.204 3.107
JumlahTotal 719 719 32.937 31.241
Sumber: Bandar Udara MaliSource: Mali Airport
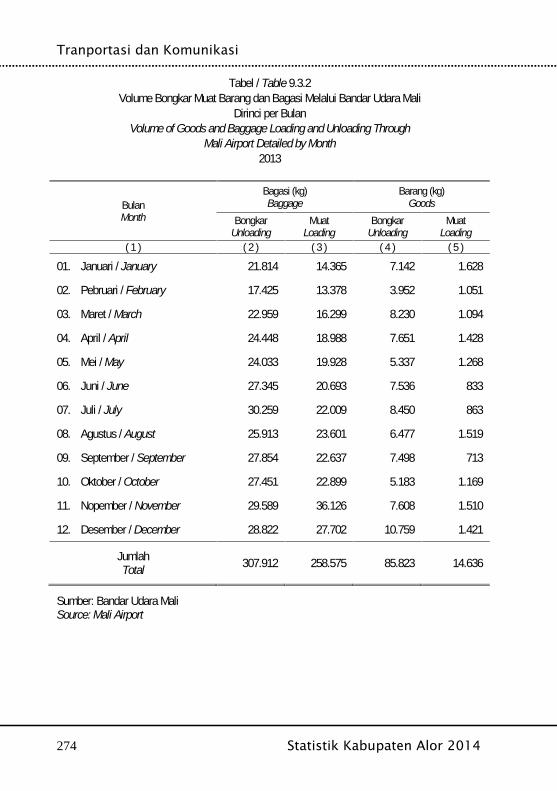
Tranportasi dan Komunikasi
274 Statistik Kabupaten Alor 2014
Tabel / Table 9.3.2Volume Bongkar Muat Barang dan Bagasi Melalui Bandar Udara Mali
Dirinci per BulanVolume of Goods and Baggage Loading and Unloading Through
Mali Airport Detailed by Month2013
BulanMonth
Bagasi (kg)Baggage
Barang (kg)Goods
BongkarUnloading
MuatLoading
BongkarUnloading
MuatLoading
( 1 ) ( 2 ) ( 3 ) ( 4 ) ( 5 )
01. Januari / January 21.814 14.365 7.142 1.628
02. Pebruari / February 17.425 13.378 3.952 1.051
03. Maret / March 22.959 16.299 8.230 1.094
04. April / April 24.448 18.988 7.651 1.428
05. Mei / May 24.033 19.928 5.337 1.268
06. Juni / June 27.345 20.693 7.536 833
07. Juli / July 30.259 22.009 8.450 863
08. Agustus / August 25.913 23.601 6.477 1.519
09. September / September 27.854 22.637 7.498 713
10. Oktober / October 27.451 22.899 5.183 1.169
11. Nopember / November 29.589 36.126 7.608 1.510
12. Desember / December 28.822 27.702 10.759 1.421
JumlahTotal 307.912 258.575 85.823 14.636
Sumber: Bandar Udara MaliSource: Mali Airport
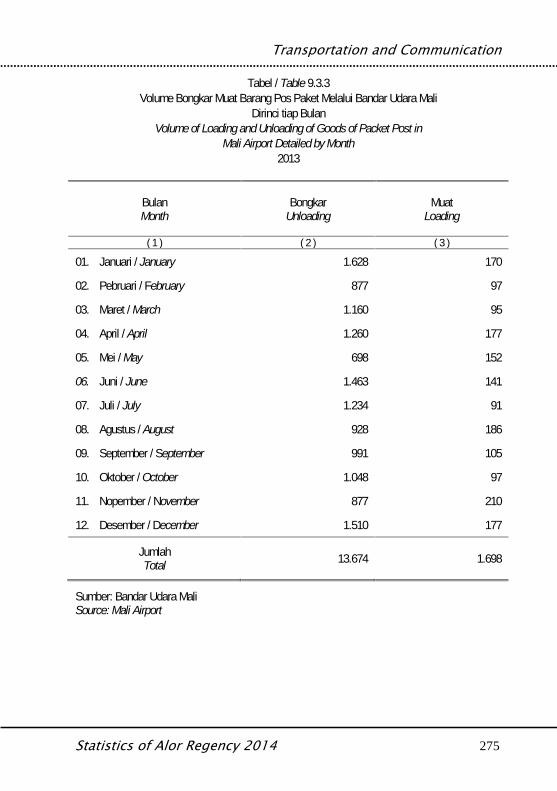
Transportation and Communication
Statistics of Alor Regency 2014 275
Tabel / Table 9.3.3Volume Bongkar Muat Barang Pos Paket Melalui Bandar Udara Mali
Dirinci tiap BulanVolume of Loading and Unloading of Goods of Packet Post in
Mali Airport Detailed by Month2013
BulanMonth
BongkarUnloading
MuatLoading
( 1 ) ( 2 ) ( 3 )
01. Januari / January 1.628 170
02. Pebruari / February 877 97
03. Maret / March 1.160 95
04. April / April 1.260 177
05. Mei / May 698 152
06. Juni / June 1.463 141
07. Juli / July 1.234 91
08. Agustus / August 928 186
09. September / September 991 105
10. Oktober / October 1.048 97
11. Nopember / November 877 210
12. Desember / December 1.510 177
JumlahTotal 13.674 1.698
Sumber: Bandar Udara MaliSource: Mali Airport
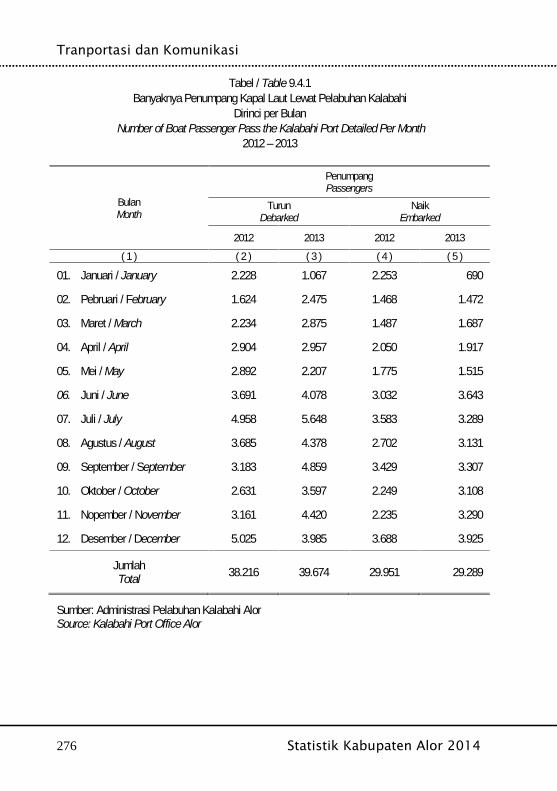
Tranportasi dan Komunikasi
276 Statistik Kabupaten Alor 2014
Tabel / Table 9.4.1Banyaknya Penumpang Kapal Laut Lewat Pelabuhan Kalabahi
Dirinci per BulanNumber of Boat Passenger Pass the Kalabahi Port Detailed Per Month
2012 – 2013
BulanMonth
PenumpangPassengers
TurunDebarked
NaikEmbarked
2012 2013 2012 2013( 1 ) ( 2 ) ( 3 ) ( 4 ) ( 5 )
01. Januari / January 2.228 1.067 2.253 690
02. Pebruari / February 1.624 2.475 1.468 1.472
03. Maret / March 2.234 2.875 1.487 1.687
04. April / April 2.904 2.957 2.050 1.917
05. Mei / May 2.892 2.207 1.775 1.515
06. Juni / June 3.691 4.078 3.032 3.643
07. Juli / July 4.958 5.648 3.583 3.289
08. Agustus / August 3.685 4.378 2.702 3.131
09. September / September 3.183 4.859 3.429 3.307
10. Oktober / October 2.631 3.597 2.249 3.108
11. Nopember / November 3.161 4.420 2.235 3.290
12. Desember / December 5.025 3.985 3.688 3.925
JumlahTotal 38.216 39.674 29.951 29.289
Sumber: Administrasi Pelabuhan Kalabahi AlorSource: Kalabahi Port Office Alor
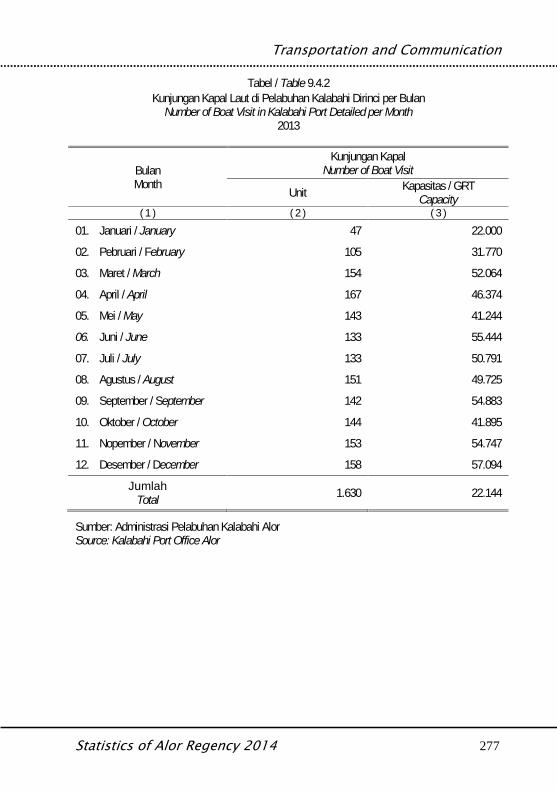
Transportation and Communication
Statistics of Alor Regency 2014 277
Tabel / Table 9.4.2Kunjungan Kapal Laut di Pelabuhan Kalabahi Dirinci per Bulan
Number of Boat Visit in Kalabahi Port Detailed per Month2013
BulanMonth
Kunjungan KapalNumber of Boat Visit
Unit Kapasitas / GRTCapacity
( 1 ) ( 2 ) ( 3 )01. Januari / January 47 22.000
02. Pebruari / February 105 31.770
03. Maret / March 154 52.064
04. April / April 167 46.374
05. Mei / May 143 41.244
06. Juni / June 133 55.444
07. Juli / July 133 50.791
08. Agustus / August 151 49.725
09. September / September 142 54.883
10. Oktober / October 144 41.895
11. Nopember / November 153 54.747
12. Desember / December 158 57.094
JumlahTotal 1.630 22.144
Sumber: Administrasi Pelabuhan Kalabahi AlorSource: Kalabahi Port Office Alor
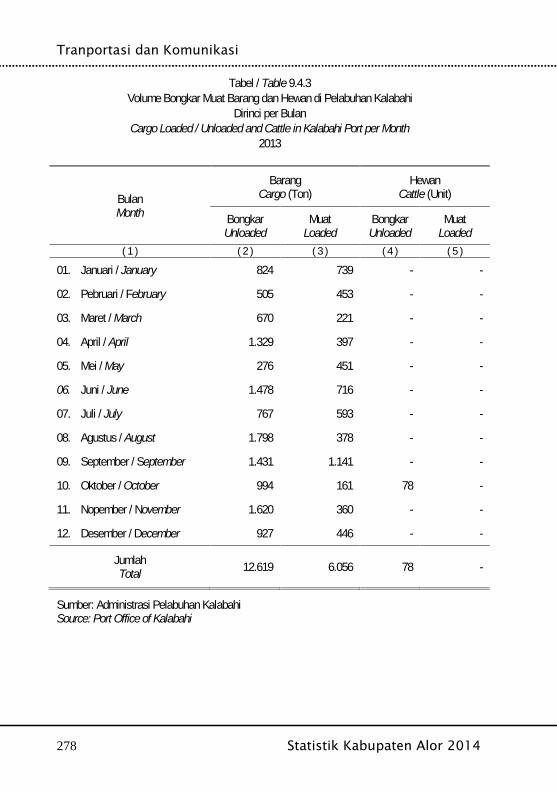
Tranportasi dan Komunikasi
278 Statistik Kabupaten Alor 2014
Tabel / Table 9.4.3Volume Bongkar Muat Barang dan Hewan di Pelabuhan Kalabahi
Dirinci per BulanCargo Loaded / Unloaded and Cattle in Kalabahi Port per Month
2013
BulanMonth
BarangCargo (Ton)
HewanCattle (Unit)
BongkarUnloaded
MuatLoaded
BongkarUnloaded
MuatLoaded
( 1 ) ( 2 ) ( 3 ) ( 4 ) ( 5 )
01. Januari / January 824 739 - -
02. Pebruari / February 505 453 - -
03. Maret / March 670 221 - -
04. April / April 1.329 397 - -
05. Mei / May 276 451 - -
06. Juni / June 1.478 716 - -
07. Juli / July 767 593 - -
08. Agustus / August 1.798 378 - -
09. September / September 1.431 1.141 - -
10. Oktober / October 994 161 78 -
11. Nopember / November 1.620 360 - -
12. Desember / December 927 446 - -
JumlahTotal 12.619 6.056 78 -
Sumber: Administrasi Pelabuhan KalabahiSource: Port Office of Kalabahi
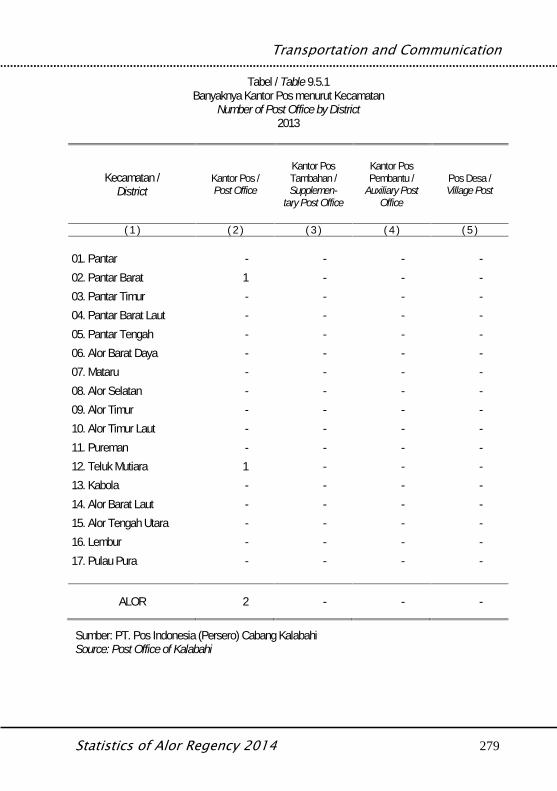
Transportation and Communication
Statistics of Alor Regency 2014 279
Tabel / Table 9.5.1Banyaknya Kantor Pos menurut Kecamatan
Number of Post Office by District2013
Kecamatan /District
Kantor Pos /Post Office
Kantor PosTambahan /Supplemen-
tary Post Office
Kantor PosPembantu /
Auxiliary PostOffice
Pos Desa /Village Post
( 1 ) ( 2 ) ( 3 ) ( 4 ) ( 5 )
01. Pantar - - - -02. Pantar Barat 1 - - -03. Pantar Timur - - - -04. Pantar Barat Laut - - - -05. Pantar Tengah - - - -06. Alor Barat Daya - - - -07. Mataru - - - -08. Alor Selatan - - - -09. Alor Timur - - - -10. Alor Timur Laut - - - -11. Pureman - - - -12. Teluk Mutiara 1 - - -13. Kabola - - - -14. Alor Barat Laut - - - -15. Alor Tengah Utara - - - -16. Lembur - - - -17. Pulau Pura - - - -
ALOR 2 - - -
Sumber: PT. Pos Indonesia (Persero) Cabang KalabahiSource: Post Office of Kalabahi
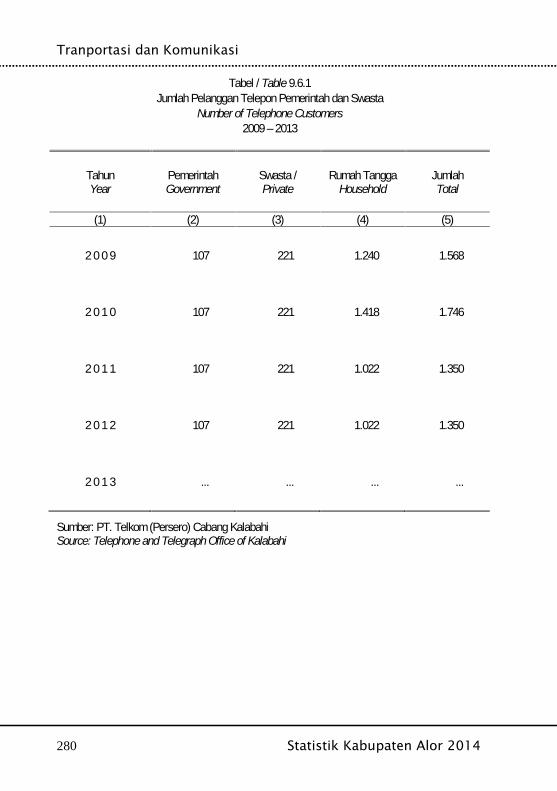
Tranportasi dan Komunikasi
280 Statistik Kabupaten Alor 2014
Tabel / Table 9.6.1Jumlah Pelanggan Telepon Pemerintah dan Swasta
Number of Telephone Customers2009 – 2013
TahunYear
PemerintahGovernment
Swasta /Private
Rumah TanggaHousehold
JumlahTotal
(1) (2) (3) (4) (5)
2 0 0 9 107 221 1.240 1.568
2 0 1 0 107 221 1.418 1.746
2 0 1 1 107 221 1.022 1.350
2 0 1 2 107 221 1.022 1.350
2 0 1 3 ... ... ... ...
Sumber: PT. Telkom (Persero) Cabang KalabahiSource: Telephone and Telegraph Office of Kalabahi
Transportation and Communication
Statistics of Alor Regency 2014 281

Tranportasi dan Komunikasi
282 Statistik Kabupaten Alor 2014
Finance and Prices
Statistics of Alor Regency 2014 283
BAB XKEUANGAN DAN HARGA
Finance and Prices

Keuangan dan Harga
284 Statistik Kabupaten Alor 2014
Finance and Prices
Statistics of Alor Regency 2014 285
Penjelasan Teknis Technical Notes
1. Data harga yang disajikan meliputi:a. Harga eceran beras di beberapa kotab. Harga eceran beberapa jenis barang di pasar
Jakartac. Indeks Harga Konsumen (IHK) dan laju inflasid. Indeks Harga Perdagangan Besar (IHPB)e. Indeks harga yang diterima dan dibayar petanif. Harga CKG dan GKP di tingkat petani dan
penggiling
2. Harga eceran beras di olah dari survei mingguanBadan Pusat Statistik di beberapa kota. Karenaberagamnya kualitas beras di masing-masingkota, maka harga yang disajikan adalah hargaberas tertimbang.
3. Harga eceran beberapa jenis barang di pasarJakarta diolah dari hasil survei bulanan BadanPusat Statistik di Jakarta dan terbatas hanya 13komoditas.
4. Indeks Harga Konsumen (IHK) yang merupakanindikator inflasi di Indonesia, sejak Juni 2008dihitung dari 66 kota, mencakup sekitar 284-441komoditas yang dihitung berdasarkan polakonsumsi hasil Survei Biaya Hidup (SBH) di 66kota tahun 2007.
5. IHK mencakup 7 kelompok, yaitu: bahanmakanan, makanan jadi, minuman, rokok, dantembakau, perumahan, air, listrik, gas dan bahanbakar, sandang, kesehatan, pendidikan, rekreasidan olah raga, transpor, komunikasi, dan jasakeuangan.
1. Price statistics cover:a. Retail price of rice in several cities.b. Retail price of several commodities in Jakartac. Consumer Price Index (CPI) and inflation ratesd. Wholesale Price Index (WPI)e. Indices of prices received and paid bay
farmersf. Dried Unhusked Grain’s price and Dried
Harvested Grain’s price at the farmers leveland the huller level.
2. The retail price of rice is compiled through theweekly price survey conducted by BPS- StatisticsIndonesia in several cities. Due to differentqualities of rice in each city, the weighted price ofrice is used.
3. The retail prices of several commodities in Jakartaare compiled from monthly price surveyconducted by the BPS-Statistics Indonesia inJakarta and, for the purpose of this publication,are limited to 13 commodities.
4. The Consumer Price Index (CPI) which is theindicator of inflation in Indonesia, since June 2008has been developed from the consumption patternof the 2007 Cost Living Survey (CLS) conductedin 66 cities, covering 284-441 commodities.
5. Commodities of CPI consist of 7 groups asfollows: foodstuff, prepare goods, beverages, andtobacco products, housing, water, electricity, gasand fuel, clothing, health, education, recreation,and sports, transportation, communication andfinancial services.

Keuangan dan Harga
286 Statistik Kabupaten Alor 2014
Tabel / Table 10.1.1Realisasi Pendapatan Daerah Otonomi Tingkat II Kabupaten Alor
Menurut Jenis Pendapatan pada Tahun AnggaranActual Second Stage Autonomous Regional Receipts of Alor on Fiscal Year
2013
(Ribuan / Thousand rupiah)Jenis PendapatanKind of Receipts 2013
( 1 ) ( 2 )01. Sisa lebih perhitungan anggaran tahun lalu/Remains more
budget calculation last year 33.949,194
02. Pendapatan asli daerah/Original income of region 31.555.988
2.1. Pajak daerah/region tax 7.309.814
2.2. Retribusi daerah/retribution region 15.945.9852.3. Hasil BUMD dan pengelolaan kekayaan daerah/ income
from region company and management of regionresources
2.352.965
2.4. PAD lain yang sah/Others income 5.947.225.
03. Dana Perimbangan/Balance Fund 564.522.3563.1. Bagi hasil pajak dan bukan pajak/tax sharing and non tax
sharing 17.083.577
3.2. Subsidi daerah otonom (DAU)/autonomous districtsubsidy 461.359.979
3.3. Bantuan pembangunan (DAK)/development aid 86.078.8003.4. Bagi hasil pajak & bantuan Keuangan dari propinsi/Tax
sharing & financial aid from province 4.183.802
04. Penerimaan lainnya yang sah/Other valid income 40.553.559
JumlahTotal 640.815.705
Sumber: Dinas Pendapatan Keuangan dan Aset Kab. AlorSource:
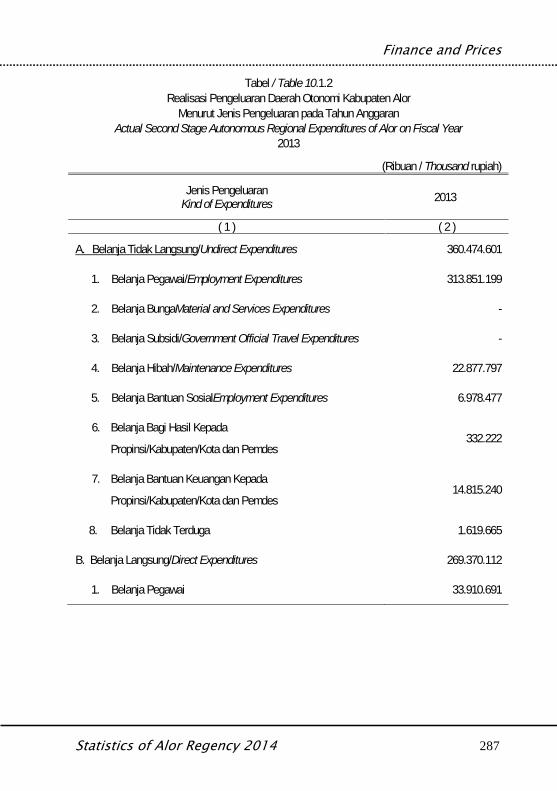
Finance and Prices
Statistics of Alor Regency 2014 287
Tabel / Table 10.1.2Realisasi Pengeluaran Daerah Otonomi Kabupaten Alor
Menurut Jenis Pengeluaran pada Tahun AnggaranActual Second Stage Autonomous Regional Expenditures of Alor on Fiscal Year
2013
(Ribuan / Thousand rupiah)
Jenis PengeluaranKind of Expenditures 2013
( 1 ) ( 2 )
A. Belanja Tidak Langsung/Undirect Expenditures 360.474.601
1. Belanja Pegawai/Employment Expenditures 313.851.199
2. Belanja BungaMaterial and Services Expenditures -
3. Belanja Subsidi/Government Official Travel Expenditures -
4. Belanja Hibah/Maintenance Expenditures 22.877.797
5. Belanja Bantuan SosialEmployment Expenditures 6.978.477
6. Belanja Bagi Hasil Kepada
Propinsi/Kabupaten/Kota dan Pemdes332.222
7. Belanja Bantuan Keuangan Kepada
Propinsi/Kabupaten/Kota dan Pemdes14.815.240
8. Belanja Tidak Terduga 1.619.665
B. Belanja Langsung/Direct Expenditures 269.370.112
1. Belanja Pegawai 33.910.691
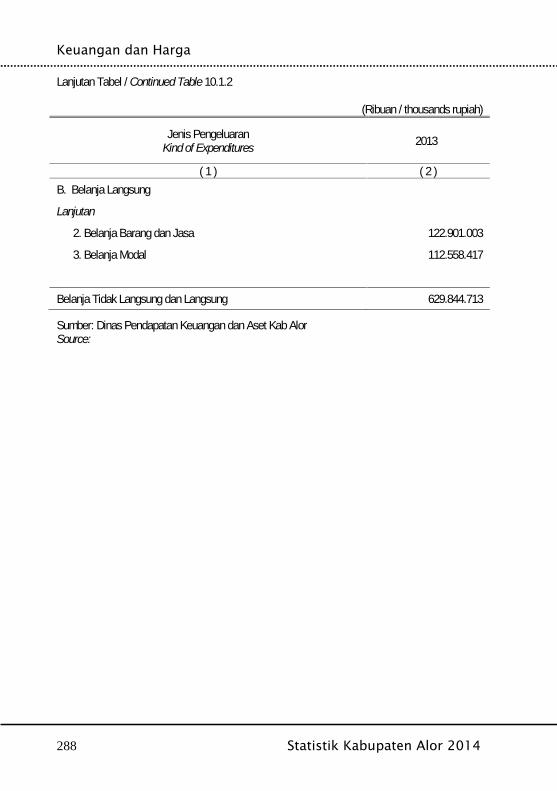
Keuangan dan Harga
288 Statistik Kabupaten Alor 2014
Lanjutan Tabel / Continued Table 10.1.2
(Ribuan / thousands rupiah)
Jenis PengeluaranKind of Expenditures 2013
( 1 ) ( 2 )B. Belanja Langsung
Lanjutan
2. Belanja Barang dan Jasa 122.901.003
3. Belanja Modal 112.558.417
Belanja Tidak Langsung dan Langsung 629.844.713
Sumber: Dinas Pendapatan Keuangan dan Aset Kab AlorSource:
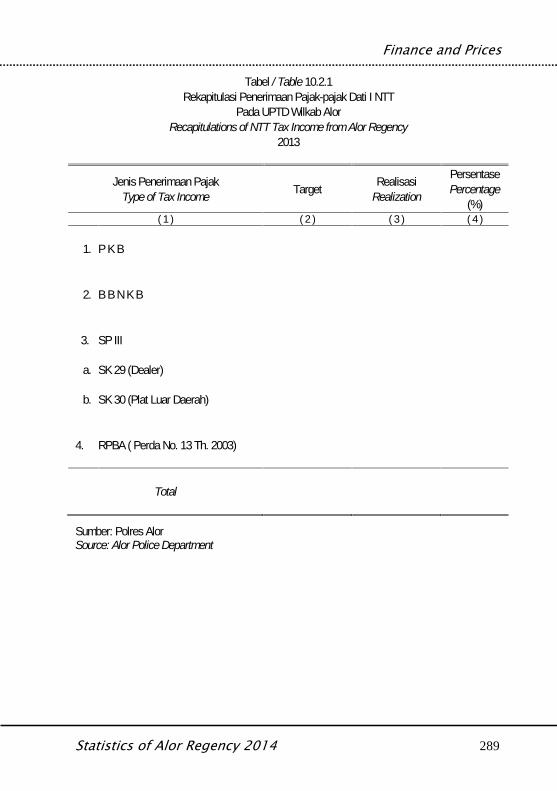
Finance and Prices
Statistics of Alor Regency 2014 289
Tabel / Table 10.2.1Rekapitulasi Penerimaan Pajak-pajak Dati I NTT
Pada UPTD Wilkab AlorRecapitulations of NTT Tax Income from Alor Regency
2013
Jenis Penerimaan PajakType of Tax Income Target Realisasi
Realization
PersentasePercentage
(%)( 1 ) ( 2 ) ( 3 ) ( 4 )
1. P K B
2. B B N K B
3. SP III
a. SK 29 (Dealer)
b. SK 30 (Plat Luar Daerah)
4. RPBA ( Perda No. 13 Th. 2003)
Total
Sumber: Polres AlorSource: Alor Police Department
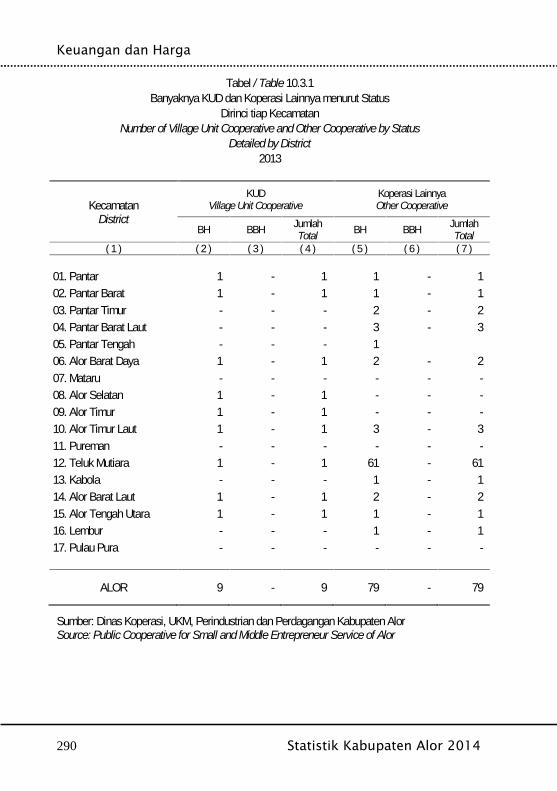
Keuangan dan Harga
290 Statistik Kabupaten Alor 2014
Tabel / Table 10.3.1Banyaknya KUD dan Koperasi Lainnya menurut Status
Dirinci tiap KecamatanNumber of Village Unit Cooperative and Other Cooperative by Status
Detailed by District2013
KecamatanDistrict
KUDVillage Unit Cooperative
Koperasi LainnyaOther Cooperative
BH BBH JumlahTotal BH BBH Jumlah
Total( 1 ) ( 2 ) ( 3 ) ( 4 ) ( 5 ) ( 6 ) ( 7 )
01. Pantar 1 - 1 1 - 102. Pantar Barat 1 - 1 1 - 103. Pantar Timur - - - 2 - 204. Pantar Barat Laut - - - 3 - 305. Pantar Tengah - - - 106. Alor Barat Daya 1 - 1 2 - 207. Mataru - - - - - -08. Alor Selatan 1 - 1 - - -09. Alor Timur 1 - 1 - - -10. Alor Timur Laut 1 - 1 3 - 311. Pureman - - - - - -12. Teluk Mutiara 1 - 1 61 - 6113. Kabola - - - 1 - 114. Alor Barat Laut 1 - 1 2 - 215. Alor Tengah Utara 1 - 1 1 - 116. Lembur - - - 1 - 117. Pulau Pura - - - - - -
ALOR 9 - 9 79 - 79
Sumber: Dinas Koperasi, UKM, Perindustrian dan Perdagangan Kabupaten AlorSource: Public Cooperative for Small and Middle Entrepreneur Service of Alor
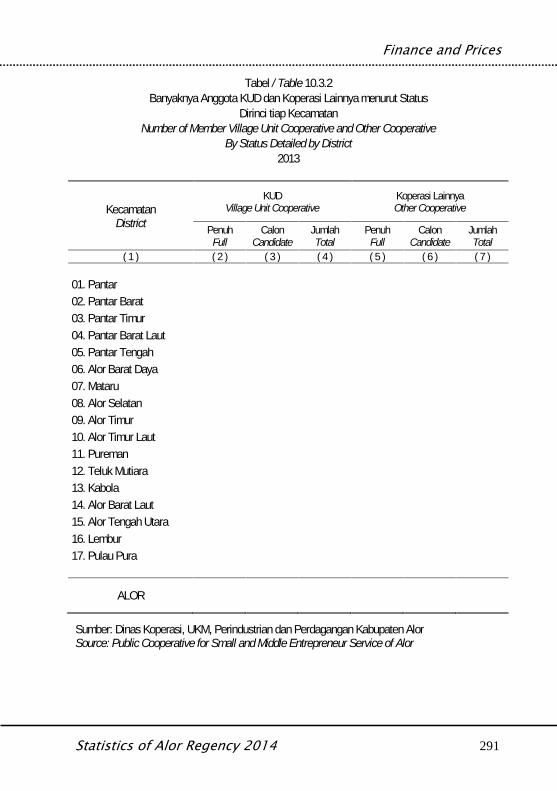
Finance and Prices
Statistics of Alor Regency 2014 291
Tabel / Table 10.3.2Banyaknya Anggota KUD dan Koperasi Lainnya menurut Status
Dirinci tiap KecamatanNumber of Member Village Unit Cooperative and Other Cooperative
By Status Detailed by District2013
KecamatanDistrict
KUDVillage Unit Cooperative
Koperasi LainnyaOther Cooperative
PenuhFull
CalonCandidate
JumlahTotal
PenuhFull
CalonCandidate
JumlahTotal
( 1 ) ( 2 ) ( 3 ) ( 4 ) ( 5 ) ( 6 ) ( 7 )
01. Pantar02. Pantar Barat03. Pantar Timur04. Pantar Barat Laut05. Pantar Tengah06. Alor Barat Daya07. Mataru08. Alor Selatan09. Alor Timur10. Alor Timur Laut11. Pureman12. Teluk Mutiara13. Kabola14. Alor Barat Laut15. Alor Tengah Utara16. Lembur17. Pulau Pura
ALOR
Sumber: Dinas Koperasi, UKM, Perindustrian dan Perdagangan Kabupaten AlorSource: Public Cooperative for Small and Middle Entrepreneur Service of Alor
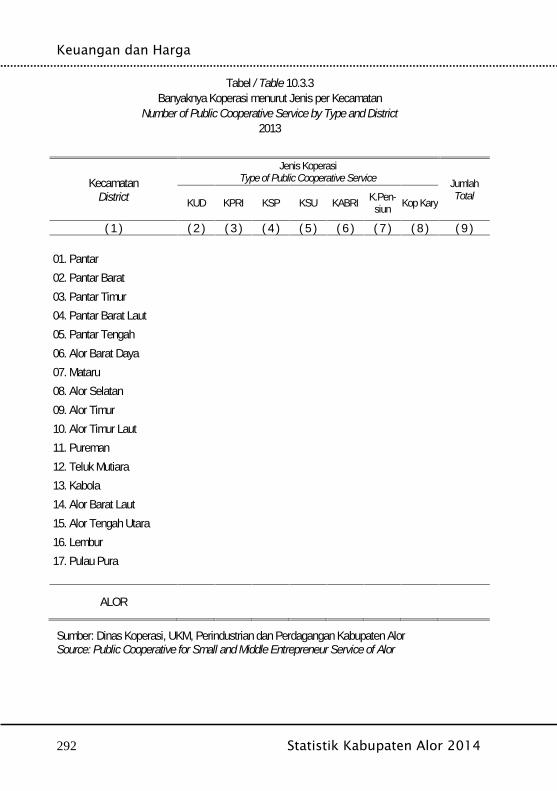
Keuangan dan Harga
292 Statistik Kabupaten Alor 2014
Tabel / Table 10.3.3Banyaknya Koperasi menurut Jenis per Kecamatan
Number of Public Cooperative Service by Type and District2013
KecamatanDistrict
Jenis KoperasiType of Public Cooperative Service Jumlah
TotalKUD KPRI KSP KSU KABRI K.Pen-siun Kop Kary
( 1 ) ( 2 ) ( 3 ) ( 4 ) ( 5 ) ( 6 ) ( 7 ) ( 8 ) ( 9 )
01. Pantar02. Pantar Barat03. Pantar Timur04. Pantar Barat Laut05. Pantar Tengah06. Alor Barat Daya07. Mataru08. Alor Selatan09. Alor Timur10. Alor Timur Laut11. Pureman12. Teluk Mutiara13. Kabola14. Alor Barat Laut15. Alor Tengah Utara16. Lembur17. Pulau Pura
ALOR
Sumber: Dinas Koperasi, UKM, Perindustrian dan Perdagangan Kabupaten AlorSource: Public Cooperative for Small and Middle Entrepreneur Service of Alor
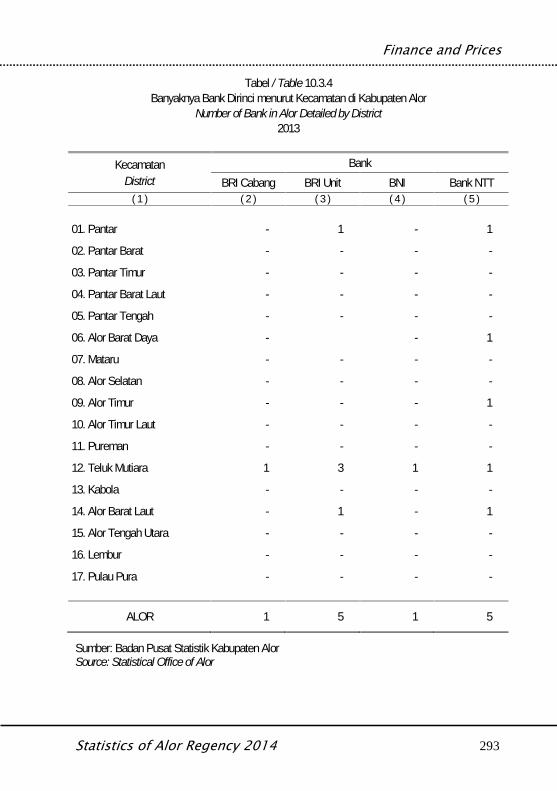
Finance and Prices
Statistics of Alor Regency 2014 293
Tabel / Table 10.3.4Banyaknya Bank Dirinci menurut Kecamatan di Kabupaten Alor
Number of Bank in Alor Detailed by District2013
KecamatanDistrict
BankBRI Cabang BRI Unit BNI Bank NTT
( 1 ) ( 2 ) ( 3 ) ( 4 ) ( 5 )
01. Pantar - 1 - 1
02. Pantar Barat - - - -
03. Pantar Timur - - - -
04. Pantar Barat Laut - - - -
05. Pantar Tengah - - - -
06. Alor Barat Daya - - 1
07. Mataru - - - -
08. Alor Selatan - - - -
09. Alor Timur - - - 1
10. Alor Timur Laut - - - -
11. Pureman - - - -
12. Teluk Mutiara 1 3 1 1
13. Kabola - - - -
14. Alor Barat Laut - 1 - 1
15. Alor Tengah Utara - - - -
16. Lembur - - - -
17. Pulau Pura - - - -
ALOR 1 5 1 5
Sumber: Badan Pusat Statistik Kabupaten AlorSource: Statistical Office of Alor
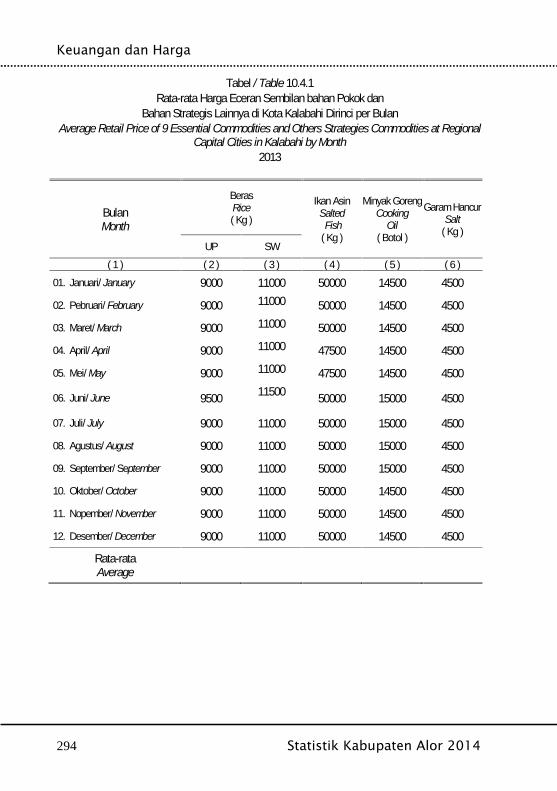
Keuangan dan Harga
294 Statistik Kabupaten Alor 2014
Tabel / Table 10.4.1Rata-rata Harga Eceran Sembilan bahan Pokok dan
Bahan Strategis Lainnya di Kota Kalabahi Dirinci per BulanAverage Retail Price of 9 Essential Commodities and Others Strategies Commodities at Regional
Capital Cities in Kalabahi by Month2013
BulanMonth
BerasRice( Kg )
Ikan AsinSalted
Fish( Kg )
Minyak GorengCooking
Oil( Botol )
Garam HancurSalt
( Kg )UP SW
( 1 ) ( 2 ) ( 3 ) ( 4 ) ( 5 ) ( 6 )01. Januari/ January 9000 11000 50000 14500 4500
02. Pebruari/ February 9000 11000 50000 14500 4500
03. Maret/ March 9000 11000 50000 14500 4500
04. April/ April 9000 11000 47500 14500 4500
05. Mei/ May 9000 11000 47500 14500 4500
06. Juni/ June 9500 11500 50000 15000 4500
07. Juli/ July 9000 11000 50000 15000 4500
08. Agustus/ August 9000 11000 50000 15000 4500
09. September/ September 9000 11000 50000 15000 4500
10. Oktober/ October 9000 11000 50000 14500 4500
11. Nopember/ November 9000 11000 50000 14500 4500
12. Desember/ December 9000 11000 50000 14500 4500
Rata-rataAverage
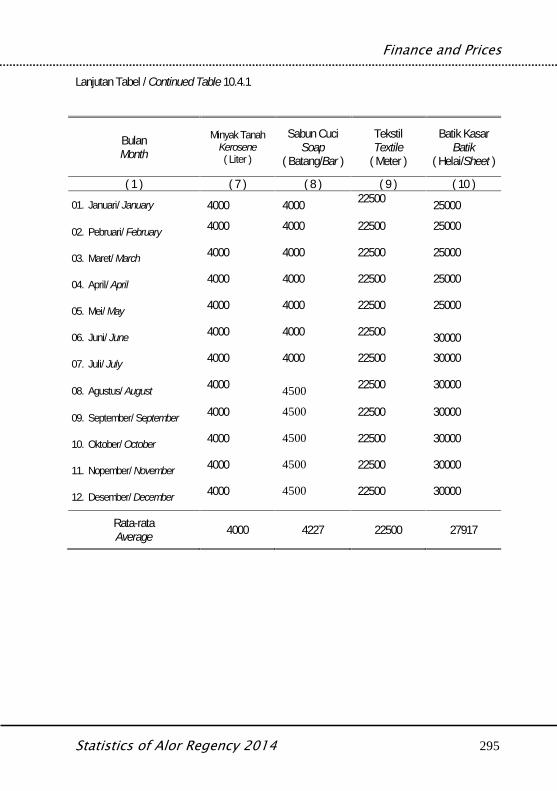
Finance and Prices
Statistics of Alor Regency 2014 295
Lanjutan Tabel / Continued Table 10.4.1
BulanMonth
Minyak TanahKerosene( Liter )
Sabun CuciSoap
( Batang/Bar )
TekstilTextile
( Meter )
Batik KasarBatik
( Helai/Sheet )
( 1 ) ( 7 ) ( 8 ) ( 9 ) ( 10 )01. Januari/ January 4000 4000 22500 25000
02. Pebruari/ February 4000 4000 22500 25000
03. Maret/ March 4000 4000 22500 25000
04. April/ April 4000 4000 22500 25000
05. Mei/ May 4000 4000 22500 25000
06. Juni/ June 4000 4000 22500 30000
07. Juli/ July 4000 4000 22500 30000
08. Agustus/ August 4000 4500 22500 30000
09. September/ September 4000 4500 22500 30000
10. Oktober/ October 4000 4500 22500 30000
11. Nopember/ November 4000 4500 22500 30000
12. Desember/ December 4000 4500 22500 30000
Rata-rataAverage 4000 4227 22500 27917
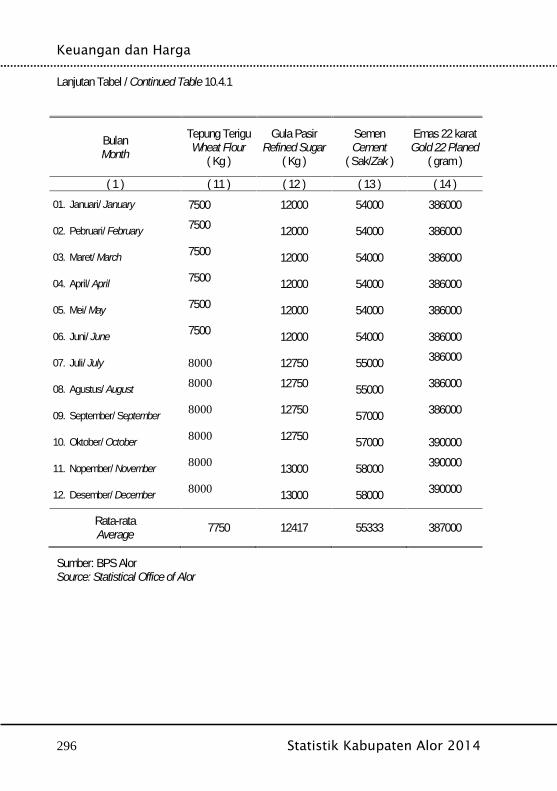
Keuangan dan Harga
296 Statistik Kabupaten Alor 2014
Lanjutan Tabel / Continued Table 10.4.1
BulanMonth
Tepung TeriguWheat Flour
( Kg )
Gula PasirRefined Sugar
( Kg )
SemenCement
( Sak/Zak )
Emas 22 karatGold 22 Planed
( gram )
( 1 ) ( 11 ) ( 12 ) ( 13 ) ( 14 )01. Januari/ January 7500 12000 54000 386000
02. Pebruari/ February 7500 12000 54000 386000
03. Maret/ March 7500 12000 54000 386000
04. April/ April 7500 12000 54000 386000
05. Mei/ May 7500 12000 54000 386000
06. Juni/ June 7500 12000 54000 386000
07. Juli/ July 8000 12750 55000 386000
08. Agustus/ August 8000 12750 55000 386000
09. September/ September 8000 12750 57000 386000
10. Oktober/ October 8000 12750 57000 390000
11. Nopember/ November 8000 13000 58000 390000
12. Desember/ December 8000 13000 58000 390000
Rata-rataAverage 7750 12417 55333 387000
Sumber: BPS AlorSource: Statistical Office of Alor

Finance and Prices
Statistics of Alor Regency 2014 297
Tabel / Table 10.4.2Harga Konsumen Komoditas di Ibu Kota Kabupaten Alor
Consumer Prices Commodities at Regional Capital Cities in Alor2013
KelompokSub kelompokJenis barang
Kualitasmerk Satuan
2013
Jan Jun Des( 1 ) ( 2 ) ( 3 ) ( 4 ) ( 5 ) ( 6 )
MAKANAN/FOODS
Padi-Padian/
1. Beras SW Kg 11000 11500 11000
2. Jagung pipilan No.1 Kg 6000 5500 7000
3. Ketela pohon - Kg 1500 1000 2000
4. Mie kering instan Cap Kuda Bungkus 8000 8500 9500
5. Tepung terigu Kompas Kg 8000 8500 9000
Daging/Meat
1. Daging babi - Kg 45000 40000 45000
2. Daging kambing - Kg 55000 50000 55000
3. Daging sapi - Kg 90000 90000 100000
4. Abon - Kg - - -
Ikan Segar/Fish
1. Ekor kuning - Ekor 20000 15000 20000
2. Kakap - Ekor 25000 20000 25000
3. Kembung - Ekor 20000 15000 20000
4. Tenggiri - Ekor 25000 22500 23000
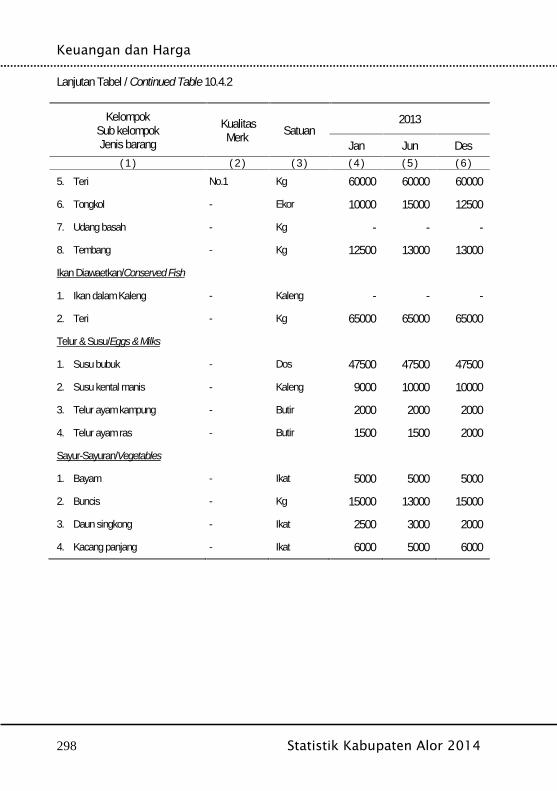
Keuangan dan Harga
298 Statistik Kabupaten Alor 2014
Lanjutan Tabel / Continued Table 10.4.2
KelompokSub kelompokJenis barang
KualitasMerk Satuan
2013
Jan Jun Des( 1 ) ( 2 ) ( 3 ) ( 4 ) ( 5 ) ( 6 )
5. Teri No.1 Kg 60000 60000 60000
6. Tongkol - Ekor 10000 15000 12500
7. Udang basah - Kg - - -
8. Tembang - Kg 12500 13000 13000
Ikan Diawaetkan/Conserved Fish
1. Ikan dalam Kaleng - Kaleng - - -
2. Teri - Kg 65000 65000 65000
Telur & Susu/Eggs & Milks
1. Susu bubuk - Dos 47500 47500 47500
2. Susu kental manis - Kaleng 9000 10000 10000
3. Telur ayam kampung - Butir 2000 2000 2000
4. Telur ayam ras - Butir 1500 1500 2000
Sayur-Sayuran/Vegetables
1. Bayam - Ikat 5000 5000 5000
2. Buncis - Kg 15000 13000 15000
3. Daun singkong - Ikat 2500 3000 2000
4. Kacang panjang - Ikat 6000 5000 6000
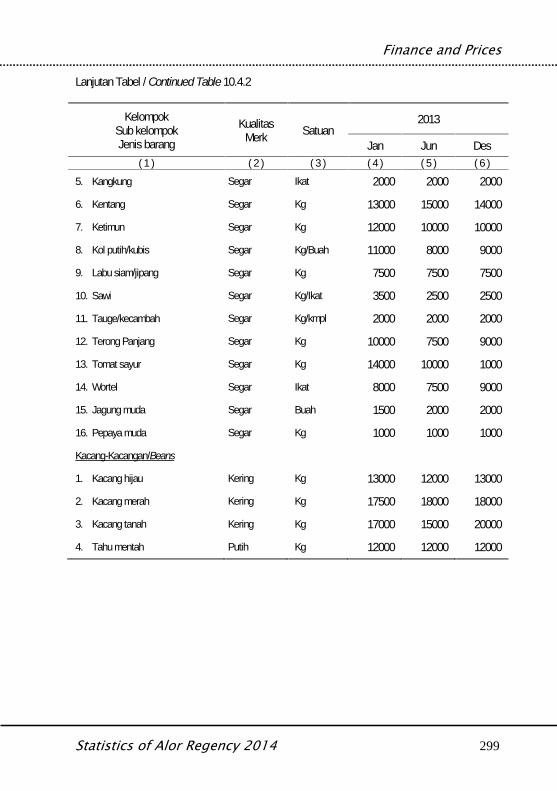
Finance and Prices
Statistics of Alor Regency 2014 299
Lanjutan Tabel / Continued Table 10.4.2
KelompokSub kelompokJenis barang
KualitasMerk Satuan
2013
Jan Jun Des( 1 ) ( 2 ) ( 3 ) ( 4 ) ( 5 ) ( 6 )
5. Kangkung Segar Ikat 2000 2000 2000
6. Kentang Segar Kg 13000 15000 14000
7. Ketimun Segar Kg 12000 10000 10000
8. Kol putih/kubis Segar Kg/Buah 11000 8000 9000
9. Labu siam/jipang Segar Kg 7500 7500 7500
10. Sawi Segar Kg/Ikat 3500 2500 2500
11. Tauge/kecambah Segar Kg/kmpl 2000 2000 2000
12. Terong Panjang Segar Kg 10000 7500 9000
13. Tomat sayur Segar Kg 14000 10000 1000
14. Wortel Segar Ikat 8000 7500 9000
15. Jagung muda Segar Buah 1500 2000 2000
16. Pepaya muda Segar Kg 1000 1000 1000
Kacang-Kacangan/Beans
1. Kacang hijau Kering Kg 13000 12000 13000
2. Kacang merah Kering Kg 17500 18000 18000
3. Kacang tanah Kering Kg 17000 15000 20000
4. Tahu mentah Putih Kg 12000 12000 12000
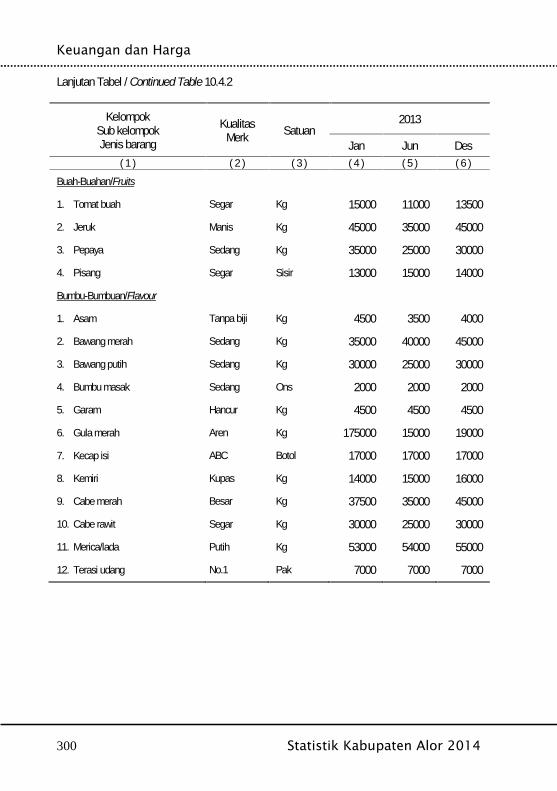
Keuangan dan Harga
300 Statistik Kabupaten Alor 2014
Lanjutan Tabel / Continued Table 10.4.2
KelompokSub kelompokJenis barang
KualitasMerk Satuan
2013
Jan Jun Des( 1 ) ( 2 ) ( 3 ) ( 4 ) ( 5 ) ( 6 )
Buah-Buahan/Fruits
1. Tomat buah Segar Kg 15000 11000 13500
2. Jeruk Manis Kg 45000 35000 45000
3. Pepaya Sedang Kg 35000 25000 30000
4. Pisang Segar Sisir 13000 15000 14000
Bumbu-Bumbuan/Flavour
1. Asam Tanpa biji Kg 4500 3500 4000
2. Bawang merah Sedang Kg 35000 40000 45000
3. Bawang putih Sedang Kg 30000 25000 30000
4. Bumbu masak Sedang Ons 2000 2000 2000
5. Garam Hancur Kg 4500 4500 4500
6. Gula merah Aren Kg 175000 15000 19000
7. Kecap isi ABC Botol 17000 17000 17000
8. Kemiri Kupas Kg 14000 15000 16000
9. Cabe merah Besar Kg 37500 35000 45000
10. Cabe rawit Segar Kg 30000 25000 30000
11. Merica/lada Putih Kg 53000 54000 55000
12. Terasi udang No.1 Pak 7000 7000 7000

Finance and Prices
Statistics of Alor Regency 2014 301
Lanjutan Tabel / Continued Table 10.4.2
KelompokSub kelompokJenis barang
KualitasMerk Satuan
2013
Jan Jun Des( 1 ) ( 2 ) ( 3 ) ( 4 ) ( 5 ) ( 6 )
Lemak & Minyak/Fat & Oil
13. Kelapa tua - Butir 3000 3000 300
14. Margarin Blue Band 1/2 Kg 18000 18500 19500
15. Minyak goreng - Botol 13000 13000 13000
Minuman Non-Alkohol/Non-alcoholic Beverages
1. Gula pasir SHS.1 Kg 11250 11250 12250
2. Kopi bubuk Tugu Buaya Lempeng 12000 13000 13500
3. Minuman ringan Coca-cola Botol 13000 13000 13500
4. Sirup ABC Botol 15000 15000 15000
5. Teh Goalpara Bungkus 12000 12500 12000
6. Kopi biji Baik Kg 27500 28000 28000
Kue & lainnya/Cookies & others
1. Biskuit Kongghuan Kg 40000 40000 45000
2. Gado-gado - Porsi 10000 10000 10000
3. Kerupuk Udang Kg 18000 18500 20000
4. Roti tawar - Balok 12000 13000 13000
5. Sate Kambing 10 ts 13000 13000 13000
Sumber: BPS Alor (Survei Harga Konsumen)Source: Statistical Office of Alor
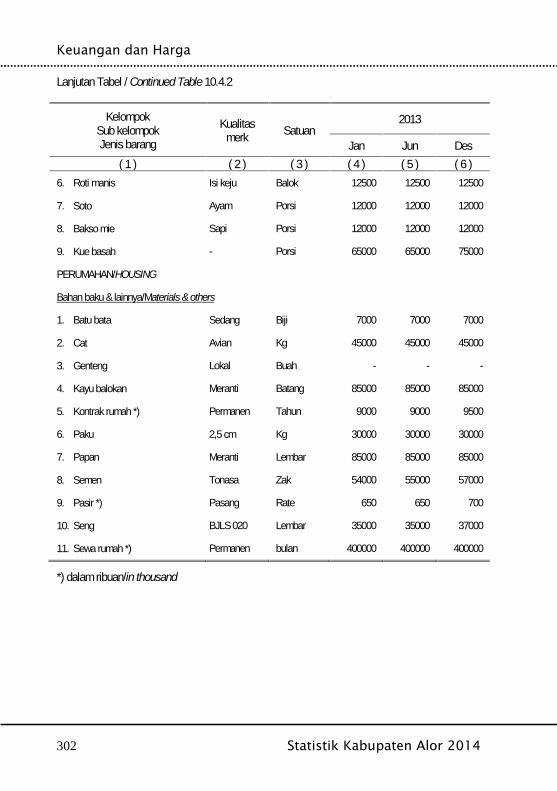
Keuangan dan Harga
302 Statistik Kabupaten Alor 2014
Lanjutan Tabel / Continued Table 10.4.2
KelompokSub kelompokJenis barang
Kualitasmerk Satuan
2013
Jan Jun Des( 1 ) ( 2 ) ( 3 ) ( 4 ) ( 5 ) ( 6 )
6. Roti manis Isi keju Balok 12500 12500 12500
7. Soto Ayam Porsi 12000 12000 12000
8. Bakso mie Sapi Porsi 12000 12000 12000
9. Kue basah - Porsi 65000 65000 75000
PERUMAHAN/HOUSING
Bahan baku & lainnya/Materials & others
1. Batu bata Sedang Biji 7000 7000 7000
2. Cat Avian Kg 45000 45000 45000
3. Genteng Lokal Buah - - -
4. Kayu balokan Meranti Batang 85000 85000 85000
5. Kontrak rumah *) Permanen Tahun 9000 9000 9500
6. Paku 2,5 cm Kg 30000 30000 30000
7. Papan Meranti Lembar 85000 85000 85000
8. Semen Tonasa Zak 54000 55000 57000
9. Pasir *) Pasang Rate 650 650 700
10. Seng BJLS 020 Lembar 35000 35000 37000
11. Sewa rumah *) Permanen bulan 400000 400000 400000
*) dalam ribuan/in thousand
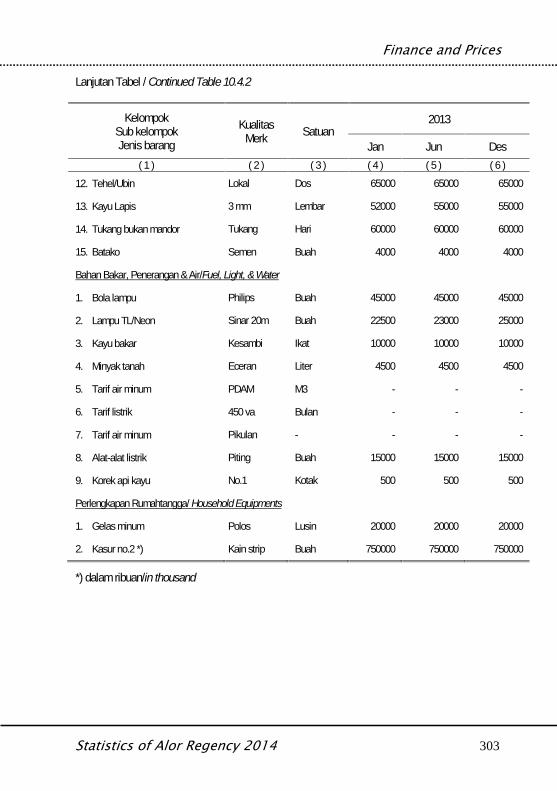
Finance and Prices
Statistics of Alor Regency 2014 303
Lanjutan Tabel / Continued Table 10.4.2
KelompokSub kelompokJenis barang
KualitasMerk Satuan
2013
Jan Jun Des( 1 ) ( 2 ) ( 3 ) ( 4 ) ( 5 ) ( 6 )
12. Tehel/Ubin Lokal Dos 65000 65000 65000
13. Kayu Lapis 3 mm Lembar 52000 55000 55000
14. Tukang bukan mandor Tukang Hari 60000 60000 60000
15. Batako Semen Buah 4000 4000 4000
Bahan Bakar, Penerangan & Air/Fuel, Light, & Water
1. Bola lampu Philips Buah 45000 45000 45000
2. Lampu TL/Neon Sinar 20m Buah 22500 23000 25000
3. Kayu bakar Kesambi Ikat 10000 10000 10000
4. Minyak tanah Eceran Liter 4500 4500 4500
5. Tarif air minum PDAM M3 - - -
6. Tarif listrik 450 va Bulan - - -
7. Tarif air minum Pikulan - - - -
8. Alat-alat listrik Piting Buah 15000 15000 15000
9. Korek api kayu No.1 Kotak 500 500 500
Perlengkapan Rumahtangga/ Household Equipments
1. Gelas minum Polos Lusin 20000 20000 20000
2. Kasur no.2 *) Kain strip Buah 750000 750000 750000
*) dalam ribuan/in thousand

Keuangan dan Harga
304 Statistik Kabupaten Alor 2014
Lanjutan Tabel / Continued Table 10.4.2
KelompokSub kelompokJenis barang
Kualitasmerk Satuan
2013
Jan Jun Des( 1 ) ( 2 ) ( 3 ) ( 4 ) ( 5 ) ( 6 )
3. Lemari kayu *) Kls II Buah 1900 1900 2100
4. Meja kursi tamu *) Sofa Set 2850 2850 3750
5. Tempat tidur kayu *) No.1 Buah 2600 2850 3150
6. Ember plastic 18 cm Buah 5000 5500 6000
7. Panci email Matahari Buah 55000 60000 60000
8. Kompor minyak tanah 18 sumbu Buah 225000 225000 235000
9. Kulkas *) Sharp Buah 2450 2500 2555
10. Seprei *) Tetoron Lembar 250 250 275
Lainnya/Others
1. Sabun cuci bubuk Rinso Kg 19000 19000 21000
2. Sabun cuci batangan Wings Dos 3000 3000 3000
3. Obat nyamuk spray Baygon Kaleng 35000 35000 35000
4. Sabun cuci cair Sunligth Bungkus 18000 18000 20000
5. Upah pembantu rt *) - Org/Bln 300 300 300
SANDANG/CLOTHES
Laki-Laki/Man’s
1. Bahan celana sersin Frienship Meter 65000 65000 75000
*) dalam ribuan/in thousand
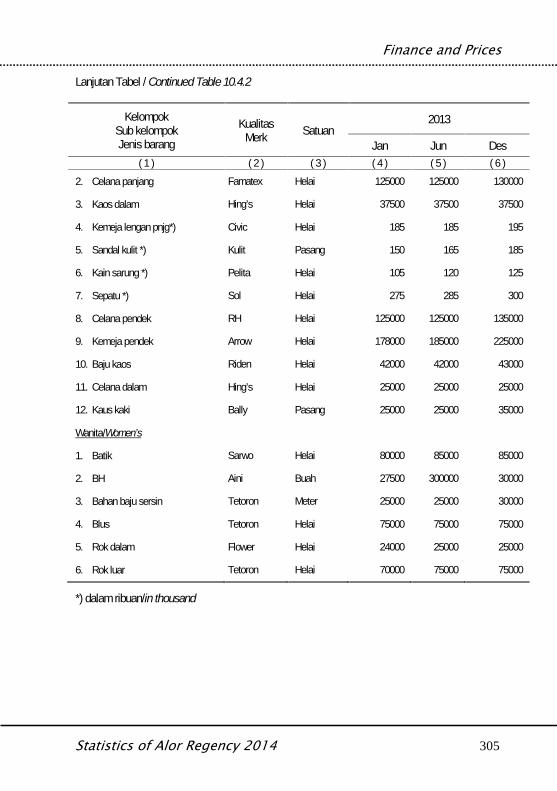
Finance and Prices
Statistics of Alor Regency 2014 305
Lanjutan Tabel / Continued Table 10.4.2
KelompokSub kelompokJenis barang
KualitasMerk Satuan
2013
Jan Jun Des( 1 ) ( 2 ) ( 3 ) ( 4 ) ( 5 ) ( 6 )
2. Celana panjang Famatex Helai 125000 125000 130000
3. Kaos dalam Hing’s Helai 37500 37500 37500
4. Kemeja lengan pnjg*) Civic Helai 185 185 195
5. Sandal kulit *) Kulit Pasang 150 165 185
6. Kain sarung *) Pelita Helai 105 120 125
7. Sepatu *) Sol Helai 275 285 300
8. Celana pendek RH Helai 125000 125000 135000
9. Kemeja pendek Arrow Helai 178000 185000 225000
10. Baju kaos Riden Helai 42000 42000 43000
11. Celana dalam Hing’s Helai 25000 25000 25000
12. Kaus kaki Bally Pasang 25000 25000 35000
Wanita/Women’s
1. Batik Sarwo Helai 80000 85000 85000
2. BH Aini Buah 27500 300000 30000
3. Bahan baju sersin Tetoron Meter 25000 25000 30000
4. Blus Tetoron Helai 75000 75000 75000
5. Rok dalam Flower Helai 24000 25000 25000
6. Rok luar Tetoron Helai 70000 75000 75000
*) dalam ribuan/in thousand
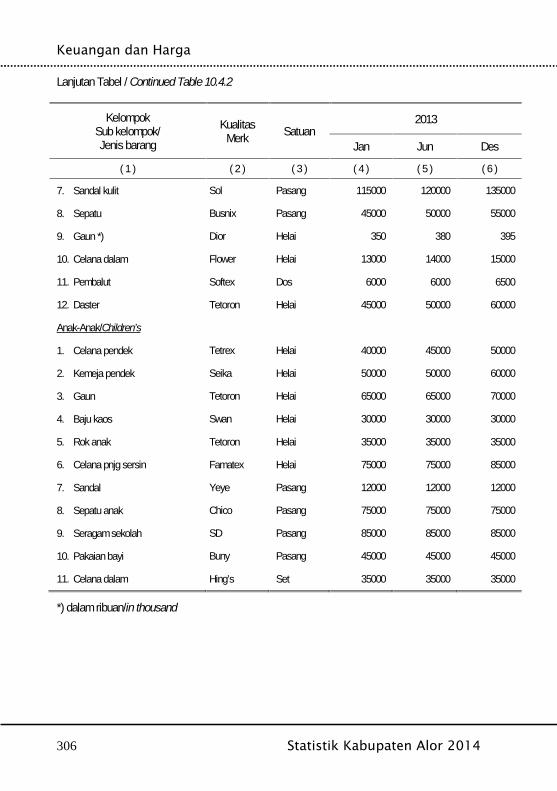
Keuangan dan Harga
306 Statistik Kabupaten Alor 2014
Lanjutan Tabel / Continued Table 10.4.2
KelompokSub kelompok/Jenis barang
KualitasMerk Satuan
2013
Jan Jun Des
( 1 ) ( 2 ) ( 3 ) ( 4 ) ( 5 ) ( 6 )
7. Sandal kulit Sol Pasang 115000 120000 135000
8. Sepatu Busnix Pasang 45000 50000 55000
9. Gaun *) Dior Helai 350 380 395
10. Celana dalam Flower Helai 13000 14000 15000
11. Pembalut Softex Dos 6000 6000 6500
12. Daster Tetoron Helai 45000 50000 60000
Anak-Anak/Children’s
1. Celana pendek Tetrex Helai 40000 45000 50000
2. Kemeja pendek Seika Helai 50000 50000 60000
3. Gaun Tetoron Helai 65000 65000 70000
4. Baju kaos Swan Helai 30000 30000 30000
5. Rok anak Tetoron Helai 35000 35000 35000
6. Celana pnjg sersin Famatex Helai 75000 75000 85000
7. Sandal Yeye Pasang 12000 12000 12000
8. Sepatu anak Chico Pasang 75000 75000 75000
9. Seragam sekolah SD Pasang 85000 85000 85000
10. Pakaian bayi Buny Pasang 45000 45000 45000
11. Celana dalam Hing’s Set 35000 35000 35000
*) dalam ribuan/in thousand
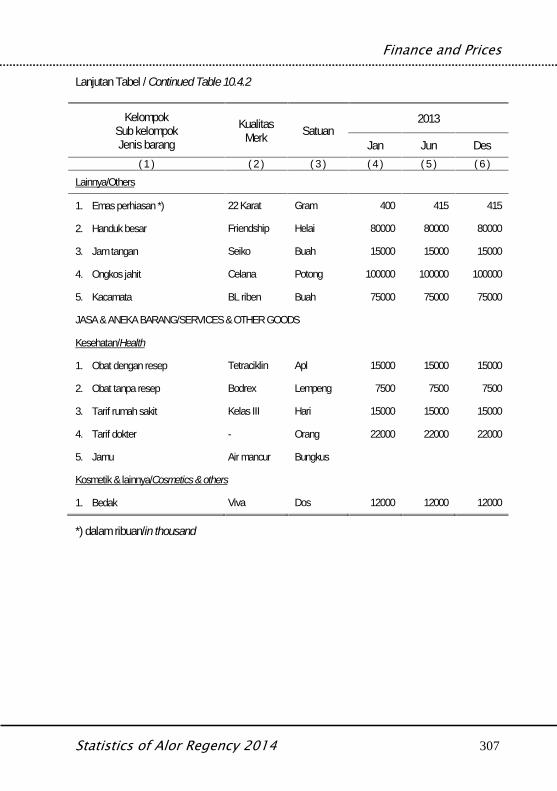
Finance and Prices
Statistics of Alor Regency 2014 307
Lanjutan Tabel / Continued Table 10.4.2
KelompokSub kelompokJenis barang
KualitasMerk Satuan
2013
Jan Jun Des( 1 ) ( 2 ) ( 3 ) ( 4 ) ( 5 ) ( 6 )
Lainnya/Others
1. Emas perhiasan *) 22 Karat Gram 400 415 415
2. Handuk besar Friendship Helai 80000 80000 80000
3. Jam tangan Seiko Buah 15000 15000 15000
4. Ongkos jahit Celana Potong 100000 100000 100000
5. Kacamata BL riben Buah 75000 75000 75000
JASA & ANEKA BARANG/SERVICES & OTHER GOODS
Kesehatan/Health
1. Obat dengan resep Tetraciklin Apl 15000 15000 15000
2. Obat tanpa resep Bodrex Lempeng 7500 7500 7500
3. Tarif rumah sakit Kelas III Hari 15000 15000 15000
4. Tarif dokter - Orang 22000 22000 22000
5. Jamu Air mancur Bungkus
Kosmetik & lainnya/Cosmetics & others
1. Bedak Viva Dos 12000 12000 12000
*) dalam ribuan/in thousand
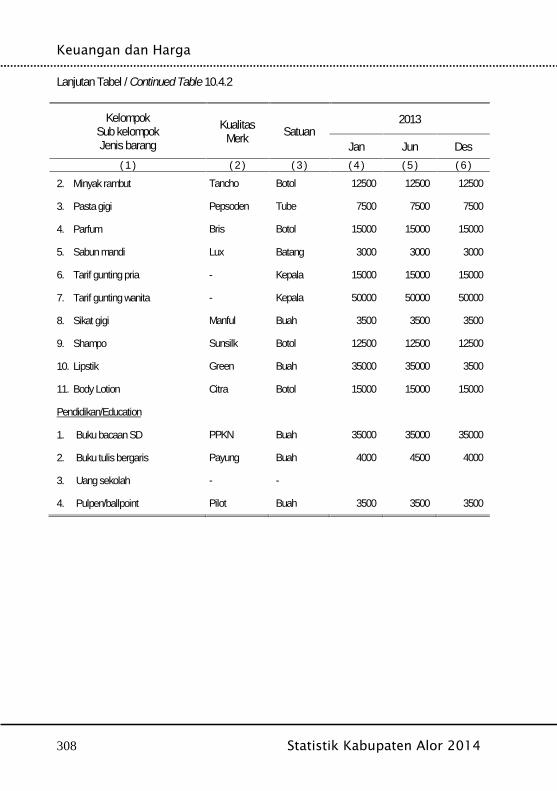
Keuangan dan Harga
308 Statistik Kabupaten Alor 2014
Lanjutan Tabel / Continued Table 10.4.2
KelompokSub kelompokJenis barang
KualitasMerk Satuan
2013
Jan Jun Des( 1 ) ( 2 ) ( 3 ) ( 4 ) ( 5 ) ( 6 )
2. Minyak rambut Tancho Botol 12500 12500 12500
3. Pasta gigi Pepsoden Tube 7500 7500 7500
4. Parfum Bris Botol 15000 15000 15000
5. Sabun mandi Lux Batang 3000 3000 3000
6. Tarif gunting pria - Kepala 15000 15000 15000
7. Tarif gunting wanita - Kepala 50000 50000 50000
8. Sikat gigi Manful Buah 3500 3500 3500
9. Shampo Sunsilk Botol 12500 12500 12500
10. Lipstik Green Buah 35000 35000 3500
11. Body Lotion Citra Botol 15000 15000 15000
Pendidikan/Education
1. Buku bacaan SD PPKN Buah 35000 35000 35000
2. Buku tulis bergaris Payung Buah 4000 4500 4000
3. Uang sekolah - -
4. Pulpen/ballpoint Pilot Buah 3500 3500 3500
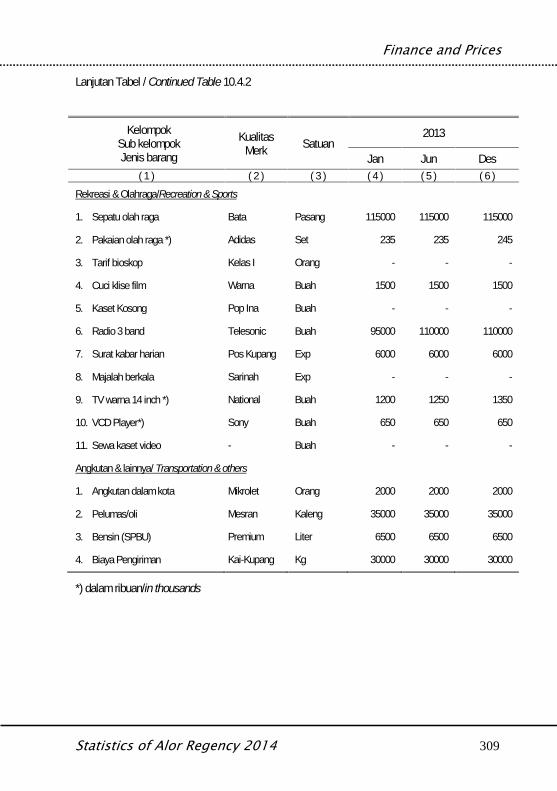
Finance and Prices
Statistics of Alor Regency 2014 309
Lanjutan Tabel / Continued Table 10.4.2
KelompokSub kelompokJenis barang
KualitasMerk Satuan
2013
Jan Jun Des( 1 ) ( 2 ) ( 3 ) ( 4 ) ( 5 ) ( 6 )
Rekreasi & Olahraga/Recreation & Sports
1. Sepatu olah raga Bata Pasang 115000 115000 115000
2. Pakaian olah raga *) Adidas Set 235 235 245
3. Tarif bioskop Kelas I Orang - - -
4. Cuci klise film Warna Buah 1500 1500 1500
5. Kaset Kosong Pop Ina Buah - - -
6. Radio 3 band Telesonic Buah 95000 110000 110000
7. Surat kabar harian Pos Kupang Exp 6000 6000 6000
8. Majalah berkala Sarinah Exp - - -
9. TV warna 14 inch *) National Buah 1200 1250 1350
10. VCD Player*) Sony Buah 650 650 650
11. Sewa kaset video - Buah - - -
Angkutan & lainnya/ Transportation & others
1. Angkutan dalam kota Mikrolet Orang 2000 2000 2000
2. Pelumas/oli Mesran Kaleng 35000 35000 35000
3. Bensin (SPBU) Premium Liter 6500 6500 6500
4. Biaya Pengiriman Kai-Kupang Kg 30000 30000 30000
*) dalam ribuan/in thousands

Keuangan dan Harga
310 Statistik Kabupaten Alor 2014
Lanjutan Tabel / Continued Table 10.4.2
KelompokSub kelompokJenis barang
KualitasMerk Satuan
2013
Jan Jun Des( 1 ) ( 2 ) ( 3 ) ( 4 ) ( 5 ) ( 6 )
5. Bus antar kota Kai-Kokar Orang 15000 15000 15000
6. Sepeda motor *) Suzuki Buah 14500 14500 14500
7. Angkutan laut Kai–Kupang Dewasa 145000 145000 145000
8. Ferry Kai–Kupang Orang 105000 105000 105000
9. Angkutan udara *) Kai–Kupang Orang 712000 712000 712000
10. Tarif telpon Lokal Pulsa - - -
11. Suku cadang Ban luar mtr buah 215000 215000 215000
1. Bir Bintang Botol 35000 35000 35000
2. Rokok kretek G. Garam Bungkus 10000 10000 10000
3. Rokok putih Comodor Bungkus 13000 13000 13000
*) dalam ribuan/in thousands
Sumber: BPS Alor (Survei Harga Konsumen)Source: Statistical Office of Alor
Finance and Prices
Statistics of Alor Regency 2014 311

Keuangan dan Harga
312 Statistik Kabupaten Alor 2014
Expenditure and Consumption
Statistics of Alor Regency 2014 313
BAB XIPENGELUARAN & KONSUMSI
Expenditure & Consumption
Pengeluaran dan Konsumsi
314 Statistik Kabupaten Alor 2014
Expenditure and Consumption
Statistics of Alor Regency 2014 315
Penjelasan Teknis Technical Notes
1. Penyediaan pangan dalam negeri adalah produkdalam negeri ditambah dengan perubahan stokdan impor dikurangi dengan ekspor.
2. Ketersediaan pangan untuk dikonsumsi pendudukterlebih dahulu dikurangi dengan bagian produksiyang digunakan untuk bibit, makanan ternak,industri dan yang tercecer.
3. Ketersediaan pangan per kapita adalahketersediaan pangan dibagi dengan jumlahpenduduk pertengahan tahun. Ketersediaanpangan per kapita bisa dalam bentuk kuantummaupun unsur gizi yaitu kalori, protein, danlemak.
4. Data pengeluaran dan konsumsi pendudukmenurut kelompok barang diperoleh dari SurveiSosial Ekonomi Nasional (Susenas) Panel BPStahun 2013, yang mencakup semua propinsi diIndonesia.
5. Susenas Panel Maret 2013 merupakansubsampel dari Susenas Juli 2013 (Susenasbesar) modul konsumsi/ pengeluaran.
6. Perbedaan yang paling mendasar antaraSusenas Juli dengan Susenas Panel adalahbesarnya sampel.
1. Domestic food availability is defined as domesticproduction plus changes in stock and importsminus exports.
2. In compiling data on domestic food availability, theshare of production for seeds, waste, residuals,animal feeds, and industrial use is first taken intoaccount.
3. Per capita food availability is total food availabilitydivided by number of population in the middle ofthe year. It is presented in terms of quantity aswell as nutrient content such as calories, proteins,and fats.
4. Data on consumer expenditure and consumptionby commodity group of expenditure are obtainedfrom 2013 National Socio-Economic Survey(Susenas) Panel which covers all provinces inIndonesia.
5. The Panel Susenas in March 2013 is thesubsample of Susenas module of consumption/expenditure in July 2013.
6. The Panel Susenas in March and Susenas in Julymainly differ in their sample size.
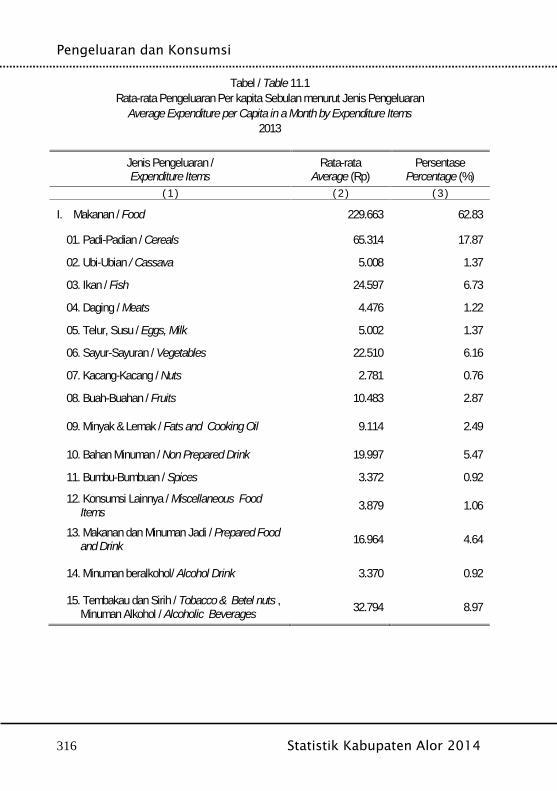
Pengeluaran dan Konsumsi
316 Statistik Kabupaten Alor 2014
Tabel / Table 11.1Rata-rata Pengeluaran Per kapita Sebulan menurut Jenis Pengeluaran
Average Expenditure per Capita in a Month by Expenditure Items2013
Jenis Pengeluaran /Expenditure Items
Rata-rataAverage (Rp)
PersentasePercentage (%)
( 1 ) ( 2 ) ( 3 )
I. Makanan / Food 229.663 62.83
01. Padi-Padian / Cereals 65.314 17.87
02. Ubi-Ubian / Cassava 5.008 1.37
03. Ikan / Fish 24.597 6.73
04. Daging / Meats 4.476 1.22
05. Telur, Susu / Eggs, Milk 5.002 1.37
06. Sayur-Sayuran / Vegetables 22.510 6.16
07. Kacang-Kacang / Nuts 2.781 0.76
08. Buah-Buahan / Fruits 10.483 2.87
09. Minyak & Lemak / Fats and Cooking Oil 9.114 2.49
10. Bahan Minuman / Non Prepared Drink 19.997 5.47
11. Bumbu-Bumbuan / Spices 3.372 0.92
12. Konsumsi Lainnya / Miscellaneous FoodItems 3.879 1.06
13. Makanan dan Minuman Jadi / Prepared Foodand Drink 16.964 4.64
14. Minuman beralkohol/ Alcohol Drink 3.370 0.92
15. Tembakau dan Sirih / Tobacco & Betel nuts ,Minuman Alkohol / Alcoholic Beverages 32.794 8.97
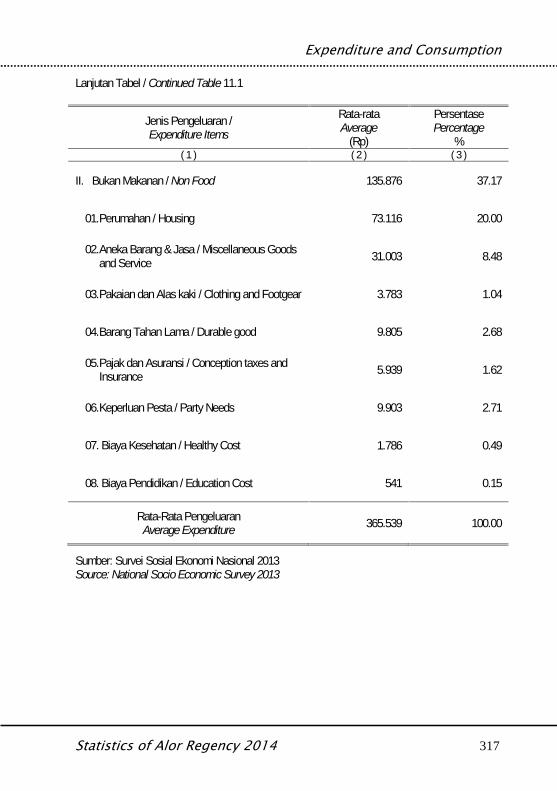
Expenditure and Consumption
Statistics of Alor Regency 2014 317
Lanjutan Tabel / Continued Table 11.1
Jenis Pengeluaran /Expenditure Items
Rata-rataAverage
(Rp)
PersentasePercentage
%( 1 ) ( 2 ) ( 3 )
II. Bukan Makanan / Non Food 135.876 37.17
01.Perumahan / Housing 73.116 20.00
02.Aneka Barang & Jasa / Miscellaneous Goodsand Service 31.003 8.48
03.Pakaian dan Alas kaki / Clothing and Footgear 3.783 1.04
04.Barang Tahan Lama / Durable good 9.805 2.68
05.Pajak dan Asuransi / Conception taxes andInsurance 5.939 1.62
06.Keperluan Pesta / Party Needs 9.903 2.71
07. Biaya Kesehatan / Healthy Cost 1.786 0.49
08. Biaya Pendidikan / Education Cost 541 0.15
Rata-Rata PengeluaranAverage Expenditure 365.539 100.00
Sumber: Survei Sosial Ekonomi Nasional 2013Source: National Socio Economic Survey 2013
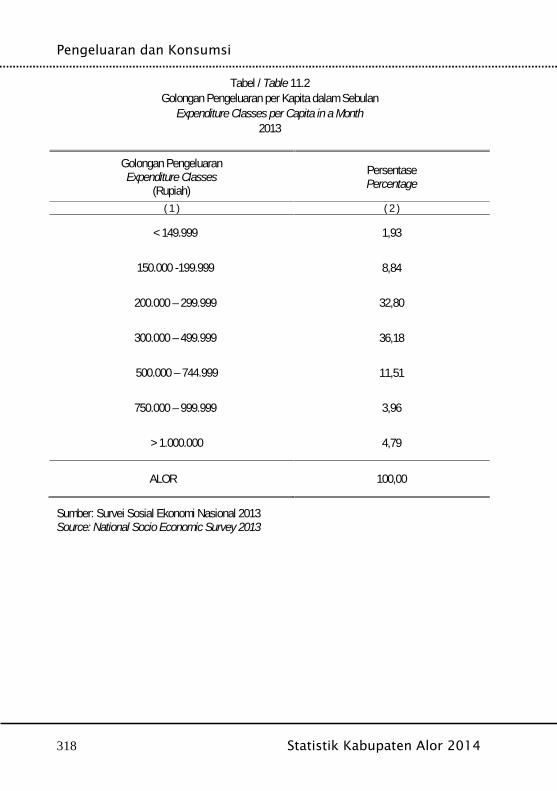
Pengeluaran dan Konsumsi
318 Statistik Kabupaten Alor 2014
Tabel / Table 11.2Golongan Pengeluaran per Kapita dalam Sebulan
Expenditure Classes per Capita in a Month2013
Golongan PengeluaranExpenditure Classes
(Rupiah)PersentasePercentage
( 1 ) ( 2 )
< 149.999 1,93
150.000 -199.999 8,84
200.000 – 299.999 32,80
300.000 – 499.999 36,18
500.000 – 744.999 11,51
750.000 – 999.999 3,96
> 1.000.000 4,79
ALOR 100,00
Sumber: Survei Sosial Ekonomi Nasional 2013Source: National Socio Economic Survey 2013
Expenditure and Consumption
Statistics of Alor Regency 2014 319
Pengeluaran dan Konsumsi
320 Statistik Kabupaten Alor 2014
Regional Income
Statistics of Alor Regency 2014 321
BAB XIIPENDAPATAN REGIONAL
Regional Income

Pendapatan Regional
322 Statistik Kabupaten Alor 2014

Regional Income
Statistics of Alor Regency 2014 323
Penjelasan Teknis Technical Notes
1. Pengeluaran konsumsi rumah tangga mencakupberbagai pengeluaran konsumsi akhir rumahtangga atas barang dan jasa untuk memenuhikebutuhan individu ataupun kelompok secaralangsung. Pengeluaran rumah tangga disinimencakup pembelian untuk makanan dan bukanmakanan (barang dan jasa) di dalam negerimaupun di luar negeri. Termasuk pula di sinipengeluaran untuk melayani keperluan rumahtangga.
2. Pengeluaran konsumsi pemerintah mencakuppengeluaran pemerintah untuk belanja pegawai,penyusutan maupun belanja barang (termasukbiaya perjalanan, pemeliharaan dan pengeluaranrutin lainnya), baik yang dilakukan olehpemerintah pusat maupun pemerintah daerah.
3. Laju pertumbuhan Produk Domestik RegionalBruto diperoleh dari perhitungan PDRB atasdasar harga konstan. Diperoleh dengan caramengurangi nilai PDRB pada tahun ke-n terhadapnilai pada tahun ke n-1 (tahun sebelumnya),dibagi dengan nilai pada tahun ke n-1, kemudiandikalikan dengan 100 persen. Laju pertumbuhanmenunjukkan perkembangan agregat pendapatandari satu waktu tertentu terhadap waktusebelumnya.
4. Pendapatan nasional per kapita adalahpendapatan nasional atau Produk Nasional Netoatas dasar biaya factor, dibagi dengan jumlahpenduduk pertengahan tahun.
1. Household consumption expenditure consist ofexpenditures incurred by households, which areused for both individual or collective needs.Household consumption are classified into foodand non-food (goods and services) expendituresthat may take place in domestic or abroad.Expenditure here include expenditures of Non-profit institutions serving household.
2. Government consumption expenditure consist ofexpenditure for the compensation of employees,capital consumption (including travel allowance,maintenance cost, and other routine expenditure)spent by their central or local government.
3. Growth rate of Gross Domestic Regional Product(GDRP) is derived from GDRP at constant prices.It is obtained by subtracting the value of GDRPyear n with the value of GDRP year n-1, dividedby the value of GDRP year n-1 then multiplied by100 percent. The growth rate of GDRP explainsthe income growth during the given period.
4. Per capita national income is national income ornet national product at factor costs divided by mid-year population.

Pendapatan Regional
324 Statistik Kabupaten Alor 2014
Tabel / Table 12.1Produk Domestik Regional Bruto Kabupaten Alor Atas Dasar Harga Berlaku
Menurut Lapangan UsahaGross Regional Product of Alor by Current Market Prices
By Industrial Origin2011 – 2013
( jutaan / million rupiah)Lapangan UsahaIndustrial Origin 2011 2012 2013
( 1 ) ( 2 ) ( 3 ) ( 4 )
1. Pertanian / Agriculture 319.834,94 349.158,19 383.825,39
a. Tanaman bahan makanan / Farm FoodCrop 107.657,89 116.068,67 127.981,97
b. Tanaman perkebunan / Farm NonFood Crop 67.712,99 73.463,58 79.931,22
c. Peternakan / Lifestock 61.560,13 67.489,74 74.214,96d. Kehutanan / Forestry 4.902,73 5.346,63 5.866,13e. Perikanan / Fishery 78.001,19 86.789,56 95.831,11
2. Pertambangan dan Pengalian / Miningand Quarrying 13.762,92 15.467,73 17.226,90
3. Industri Pengolahan /Manufacturing Industries
15.625,32 16.981,67 18.463,89
4. Listrik, Gas dan Air Minum / Electricity,Gas and Water Supply 4.753,98 5.515,61 6.455,82
a. Listrik / Electricity 3.203,14 3.808,87 4.521,93
b. Air Minum / Water Supply 1.550,84 1.706,74 1.933,89
5. Bangunan / Konstruksi / Construction 59.467,27 64.867,27 71.231,56
6. Perdagangan / Trade 161.173,63 187.609,05 217.889,20
a. Perdagangan besar dan eceran /Wholesale and retail commerce 156.921,73 182.999,62 212.691,62
b. Perhotelan / Hotels 1.243,97 1.380,67 1.596,45c. Restoran / rumah makan / Restaurant 3.007,92 3.228,76 3.601,13
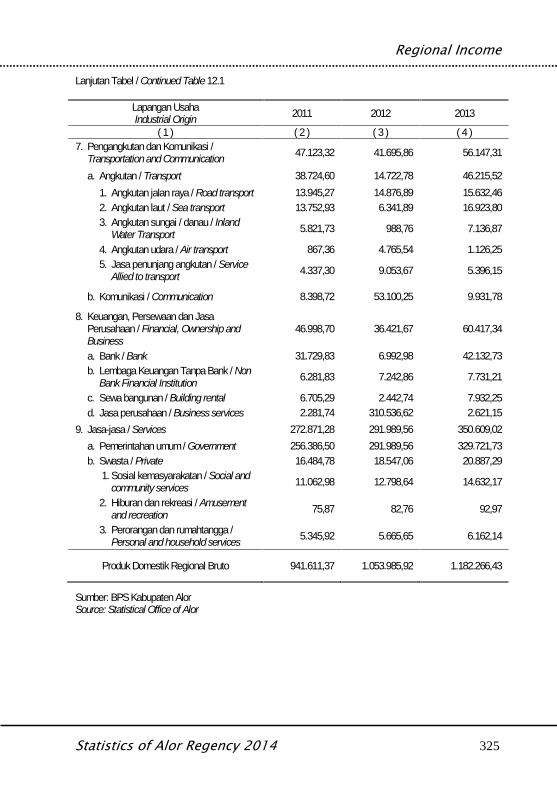
Regional Income
Statistics of Alor Regency 2014 325
Lanjutan Tabel / Continued Table 12.1
Lapangan UsahaIndustrial Origin 2011 2012 2013
( 1 ) ( 2 ) ( 3 ) ( 4 )7. Pengangkutan dan Komunikasi /
Transportation and Communication 47.123,32 41.695,86 56.147,31
a. Angkutan / Transport 38.724,60 14.722,78 46.215,521. Angkutan jalan raya / Road transport 13.945,27 14.876,89 15.632,462. Angkutan laut / Sea transport 13.752,93 6.341,89 16.923,803. Angkutan sungai / danau / Inland
Water Transport 5.821,73 988,76 7.136,87
4. Angkutan udara / Air transport 867,36 4.765,54 1.126,255. Jasa penunjang angkutan / Service
Allied to transport 4.337,30 9.053,67 5.396,15
b. Komunikasi / Communication 8.398,72 53.100,25 9.931,78
8. Keuangan, Persewaan dan JasaPerusahaan / Financial, Ownership andBusiness
46.998,70 36.421,67 60.417,34
a. Bank / Bank 31.729,83 6.992,98 42.132,73b. Lembaga Keuangan Tanpa Bank / Non
Bank Financial Institution 6.281,83 7.242,86 7.731,21
c. Sewa bangunan / Building rental 6.705,29 2.442,74 7.932,25d. Jasa perusahaan / Business services 2.281,74 310.536,62 2.621,15
9. Jasa-jasa / Services 272.871,28 291.989,56 350.609,02a. Pemerintahan umum / Government 256.386,50 291.989,56 329.721,73b. Swasta / Private 16.484,78 18.547,06 20.887,29
1. Sosial kemasyarakatan / Social andcommunity services 11.062,98 12.798,64 14.632,17
2. Hiburan dan rekreasi / Amusementand recreation 75,87 82,76 92,97
3. Perorangan dan rumahtangga /Personal and household services 5.345,92 5.665,65 6.162,14
Produk Domestik Regional Bruto 941.611,37 1.053.985,92 1.182.266,43
Sumber: BPS Kabupaten AlorSource: Statistical Office of Alor
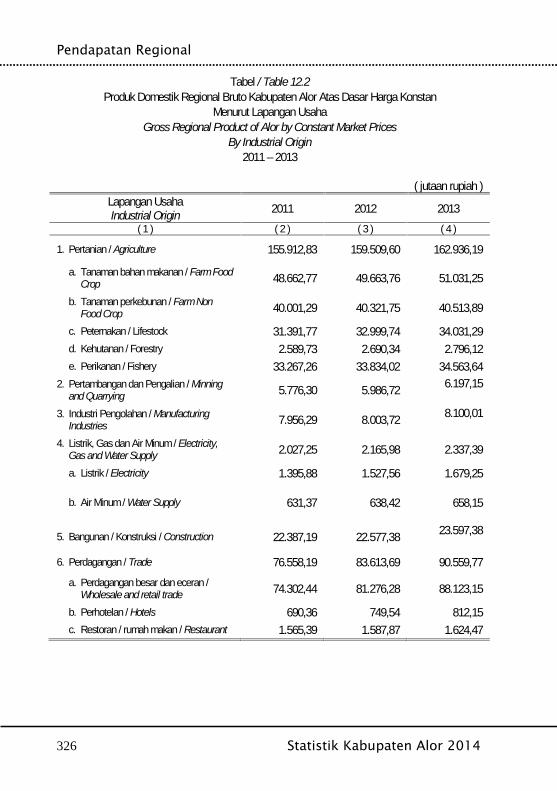
Pendapatan Regional
326 Statistik Kabupaten Alor 2014
Tabel / Table 12.2Produk Domestik Regional Bruto Kabupaten Alor Atas Dasar Harga Konstan
Menurut Lapangan UsahaGross Regional Product of Alor by Constant Market Prices
By Industrial Origin2011 – 2013
( jutaan rupiah )Lapangan UsahaIndustrial Origin 2011 2012 2013
( 1 ) ( 2 ) ( 3 ) ( 4 )
1. Pertanian / Agriculture 155.912,83 159.509,60 162.936,19
a. Tanaman bahan makanan / Farm FoodCrop 48.662,77 49.663,76 51.031,25
b. Tanaman perkebunan / Farm NonFood Crop 40.001,29 40.321,75 40.513,89
c. Peternakan / Lifestock 31.391,77 32.999,74 34.031,29d. Kehutanan / Forestry 2.589,73 2.690,34 2.796,12e. Perikanan / Fishery 33.267,26 33.834,02 34.563,64
2. Pertambangan dan Pengalian / Minningand Quarrying 5.776,30 5.986,72 6.197,15
3. Industri Pengolahan / ManufacturingIndustries 7.956,29 8.003,72 8.100,01
4. Listrik, Gas dan Air Minum / Electricity,Gas and Water Supply 2.027,25 2.165,98 2.337,39
a. Listrik / Electricity 1.395,88 1.527,56 1.679,25
b. Air Minum / Water Supply 631,37 638,42 658,15
5. Bangunan / Konstruksi / Construction 22.387,19 22.577,38 23.597,38
6. Perdagangan / Trade 76.558,19 83.613,69 90.559,77a. Perdagangan besar dan eceran /
Wholesale and retail trade 74.302,44 81.276,28 88.123,15
b. Perhotelan / Hotels 690,36 749,54 812,15c. Restoran / rumah makan / Restaurant 1.565,39 1.587,87 1.624,47

Regional Income
Statistics of Alor Regency 2014 327
Lanjutan Tabel / Continued Table 12.2Lapangan UsahaIndustrial Origin 2011 2012 2013
( 1 ) ( 2 ) ( 3 ) ( 4 )7. Pengangkutan dan Komunikasi /
Transportation and Communication 26.223,60 22.285,24 28.495,35
a. Angkutan / Transport 21.426,27 8.511,84 23.295,701. Angkutan jalan raya / Road transport 8.401,27 8.081,56 8.673,152. Angkutan laut / Sea transport 7.702,91 3.012,55 8.523,113. Angkutan sungai / danau / Inland Water
Transport 2.835,19 486,64 3.217,204. Angkutan udara / Air transport 454,23 2.192,65 520,375. Jasa penunjang angkutan / Service
Allied to transport 2.032,66 4.982,52 2.361,87
b. Komunikasi / Communication 4.797,33 20.681,63 5.199,658. Keuangan, Persewaan dan Jasa Perusahaan
/ Financial, Ownership and Business 19.655,32 12.183,43 21.872,19a. Bank / Bank 11.279,30 3.570,35 13.197,71b. Lembaga Keuangan Tanpa Bank / Non
Bank Financial Institution 3.469,39 3.912,42 3.683,15c. Sewa bangunan / Building rental 3.900,24 1.015,43 3.968,18d. Jasa perusahaan / Business services 1.006,38 143.871,31 1.023,15
9. Jasa-jasa / Services 134.320,70 136.001,08 152.748,97a. Pemerintahan umum / Government 126.863,75 136.001,08 144.476,15b. Swasta / Private 7.456,95 7.870,23 8.272,82
1. Sosial kemasyarakatan / Social andcommunity services 4.767,37 5.123,84 5.432,90
2. Hiburan dan rekreasi / Amusement andrecreation 37,29 40,67 43,78
3. Perorangan dan rumahtangga /Personal and household services 2.652,28 2.705,72 2.796,15
Produk Domestik Regional Bruto 450.817,68 473.677,78 496.844,39
Sumber: BPS Kabupaten AlorSource: Statistical Office of AlorTahun Dasar / Base Year: 2000
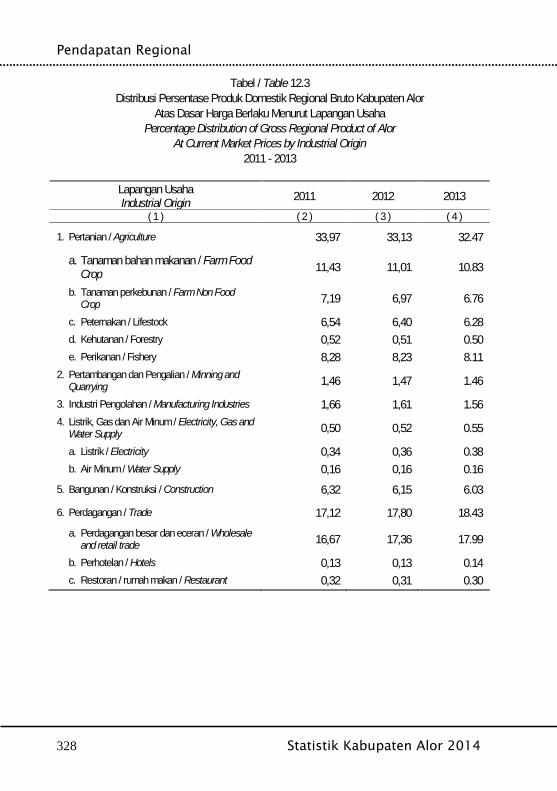
Pendapatan Regional
328 Statistik Kabupaten Alor 2014
Tabel / Table 12.3Distribusi Persentase Produk Domestik Regional Bruto Kabupaten Alor
Atas Dasar Harga Berlaku Menurut Lapangan UsahaPercentage Distribution of Gross Regional Product of Alor
At Current Market Prices by Industrial Origin2011 - 2013
Lapangan UsahaIndustrial Origin 2011 2012 2013
( 1 ) ( 2 ) ( 3 ) ( 4 )
1. Pertanian / Agriculture 33,97 33,13 32.47
a. Tanaman bahan makanan / Farm FoodCrop 11,43 11,01 10.83
b. Tanaman perkebunan / Farm Non FoodCrop 7,19 6,97 6.76
c. Peternakan / Lifestock 6,54 6,40 6.28d. Kehutanan / Forestry 0,52 0,51 0.50e. Perikanan / Fishery 8,28 8,23 8.11
2. Pertambangan dan Pengalian / Minning andQuarrying 1,46 1,47 1.46
3. Industri Pengolahan / Manufacturing Industries 1,66 1,61 1.564. Listrik, Gas dan Air Minum / Electricity, Gas and
Water Supply 0,50 0,52 0.55
a. Listrik / Electricity 0,34 0,36 0.38b. Air Minum / Water Supply 0,16 0,16 0.16
5. Bangunan / Konstruksi / Construction 6,32 6,15 6.03
6. Perdagangan / Trade 17,12 17,80 18.43a. Perdagangan besar dan eceran / Wholesale
and retail trade 16,67 17,36 17.99
b. Perhotelan / Hotels 0,13 0,13 0.14c. Restoran / rumah makan / Restaurant 0,32 0,31 0.30

Regional Income
Statistics of Alor Regency 2014 329
Lanjutan Tabel / Continued Table 12.3
Lapangan UsahaIndustrial Origin 2011 2012 2013
( 1 ) ( 2 ) ( 3 ) ( 4 )7. Pengangkutan dan Komunikasi /
Transportation and Communication 5,00 3,96 4.75
a. Angkutan / Transport 4,11 1,40 3.911. Angkutan jalan raya / Road transport 1,48 1,41 1.322. Angkutan laut / Sea transport 1,46 0,60 1.433. Angkutan sungai / danau / Inland Water
Transport 0,62 0,09 0.604. Angkutan udara / Air transport 0,09 0,45 0.105. Jasa penunjang angkutan / Service
Allied to transport 0,46 0,86 0.46
b. Komunikasi / Communication 0,89 5,04 0.848. Keuangan, Persewaan dan Jasa Perusahaan
/ Financial, Ownership and Business 4,99 3,46 5.11a. Bank / Bank 3,37 0,66 3.56b. Lembaga Keuangan Tanpa Bank / Non
Bank Financial Institution 0,67 0,69 0.65c. Sewa bangunan / Building rental 0,71 0,23 0.67d. Jasa perusahaan / Business services 0,24 29,46 0.22
9. Jasa-jasa / Services 28,98 27,70 29.89a. Pemerintahan umum / Government 27,23 27,70 27.89b. Swasta / Private 1,75 1,76 1.77
1. Sosial kemasyarakatan / Social andcommunity services 1,17 1,21 1.24
2. Hiburan dan rekreasi / Amusement andrecreation 0,01 0,01 0.01
3. Perorangan dan rumahtangga /Personal and household services 0,57 0,54 0.52
Produk Domestik Regional Bruto 100,00 100,00 100,00
Sumber: BPS Kabupaten AlorSource: Statistical Office of AlorTahun Dasar / Base Year: 2000
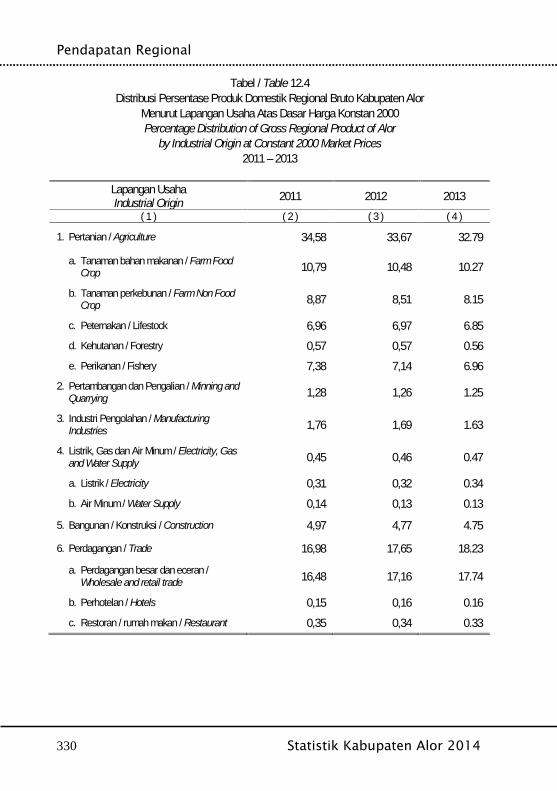
Pendapatan Regional
330 Statistik Kabupaten Alor 2014
Tabel / Table 12.4Distribusi Persentase Produk Domestik Regional Bruto Kabupaten Alor
Menurut Lapangan Usaha Atas Dasar Harga Konstan 2000Percentage Distribution of Gross Regional Product of Alor
by Industrial Origin at Constant 2000 Market Prices2011 – 2013
Lapangan UsahaIndustrial Origin 2011 2012 2013
( 1 ) ( 2 ) ( 3 ) ( 4 )
1. Pertanian / Agriculture 34,58 33,67 32.79
a. Tanaman bahan makanan / Farm FoodCrop 10,79 10,48 10.27
b. Tanaman perkebunan / Farm Non FoodCrop 8,87 8,51 8.15
c. Peternakan / Lifestock 6,96 6,97 6.85d. Kehutanan / Forestry 0,57 0,57 0.56e. Perikanan / Fishery 7,38 7,14 6.96
2. Pertambangan dan Pengalian / Minning andQuarrying 1,28 1,26 1.25
3. Industri Pengolahan / ManufacturingIndustries 1,76 1,69 1.63
4. Listrik, Gas dan Air Minum / Electricity, Gasand Water Supply 0,45 0,46 0.47
a. Listrik / Electricity 0,31 0,32 0.34b. Air Minum / Water Supply 0,14 0,13 0.13
5. Bangunan / Konstruksi / Construction 4,97 4,77 4.75
6. Perdagangan / Trade 16,98 17,65 18.23
a. Perdagangan besar dan eceran /Wholesale and retail trade 16,48 17,16 17.74
b. Perhotelan / Hotels 0,15 0,16 0.16c. Restoran / rumah makan / Restaurant 0,35 0,34 0.33
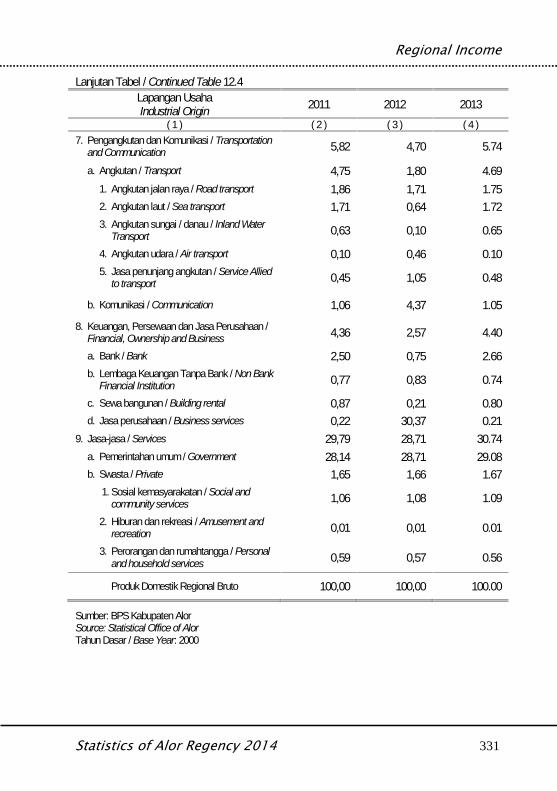
Regional Income
Statistics of Alor Regency 2014 331
Lanjutan Tabel / Continued Table 12.4Lapangan UsahaIndustrial Origin 2011 2012 2013
( 1 ) ( 2 ) ( 3 ) ( 4 )7. Pengangkutan dan Komunikasi / Transportation
and Communication 5,82 4,70 5.74
a. Angkutan / Transport 4,75 1,80 4.691. Angkutan jalan raya / Road transport 1,86 1,71 1.752. Angkutan laut / Sea transport 1,71 0,64 1.723. Angkutan sungai / danau / Inland Water
Transport 0,63 0,10 0.65
4. Angkutan udara / Air transport 0,10 0,46 0.105. Jasa penunjang angkutan / Service Allied
to transport 0,45 1,05 0.48
b. Komunikasi / Communication 1,06 4,37 1.058. Keuangan, Persewaan dan Jasa Perusahaan /
Financial, Ownership and Business 4,36 2,57 4.40
a. Bank / Bank 2,50 0,75 2.66b. Lembaga Keuangan Tanpa Bank / Non Bank
Financial Institution 0,77 0,83 0.74
c. Sewa bangunan / Building rental 0,87 0,21 0.80d. Jasa perusahaan / Business services 0,22 30,37 0.21
9. Jasa-jasa / Services 29,79 28,71 30.74a. Pemerintahan umum / Government 28,14 28,71 29.08b. Swasta / Private 1,65 1,66 1.67
1. Sosial kemasyarakatan / Social andcommunity services 1,06 1,08 1.09
2. Hiburan dan rekreasi / Amusement andrecreation 0,01 0,01 0.01
3. Perorangan dan rumahtangga / Personaland household services 0,59 0,57 0.56
Produk Domestik Regional Bruto 100,00 100,00 100.00
Sumber: BPS Kabupaten AlorSource: Statistical Office of AlorTahun Dasar / Base Year: 2000

Pendapatan Regional
332 Statistik Kabupaten Alor 2014
Tabel / Table 12.5Pendapatan Regional dan Angka Perkapita Kabupaten Alor
Regional Income and Per Capita Income Alor2011 – 2013
( jutaan rupiah)Perincian
Description 2011 2012 2013( 1 ) ( 2 ) ( 3 ) ( 4 )
I. Atas Dasar Harga Berlaku / At Current MarketPrices
1. Produk Domestik Regional Bruto Atas Dasar HargaPasar (Ribuan Rupiah) / Gross Regional DomesticProduct at Current Market Prices (ThousandRupiah)
941.611 1.053.986 1.182.266
2. Dikurangi Penyusutan Barang-barang Modal(Ribuan Rupiah) / Less Depreciation (ThousandRupiah)
52.592 58.869 72.378
3. Produk Domestik regional Netto Atas Dasar HargaPasar (Ribuan Rupiah) / Net Regional DomesticProduct at Current Market Prices (ThousandRupiah)
889.019 995.117 1.109.888
4. Dikurangi Pajak Tak Langsung Netto (RibuanRupiah) / Less Net Indirect Taxes (ThousandRupiah)
12.192 14.455 14.696
5. Produk Domestik Regional Netto Atas Dasar BiayaFaktor = Pendapatan Regional (Ribuan Rupiah) /Net Regional Domestic Product at Factor Cost(Thousand Rupiah)
876.827 980.662 1.095.193
6. Jumlah Penduduk Pertengahan Tahun (orang) /Population at The Middle of The Year (person) 193.785 196.133 196.613
7. Produk Domestik Regional Bruto Atas Dasar HargaPasar Perkapita (Rupiah) / Per Capita GrossRegional Product (Rupiah)
4.859.052 5.373.833 6.013.165
8. Pendapatan Regional Perkapita (Rupiah) / PerCapita Regional Income (Rupiah) 4.524.741 4.999.987 5.570.296
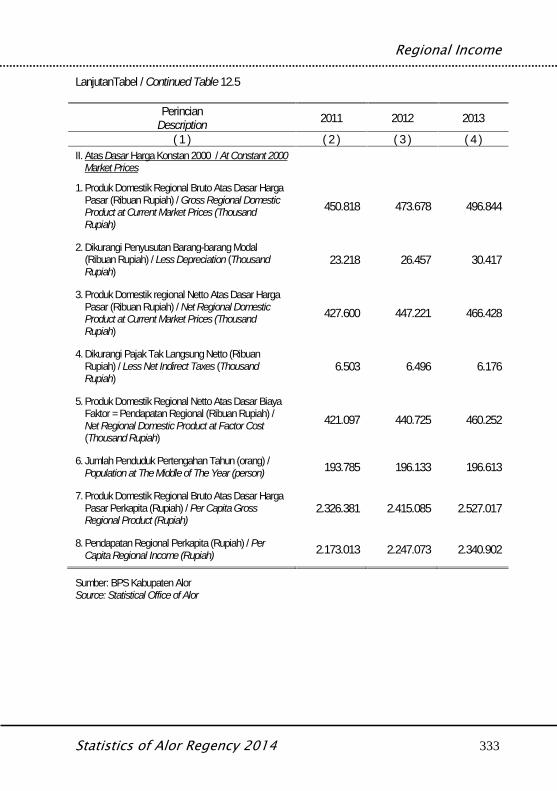
Regional Income
Statistics of Alor Regency 2014 333
LanjutanTabel / Continued Table 12.5
PerincianDescription 2011 2012 2013
( 1 ) ( 2 ) ( 3 ) ( 4 )II. Atas Dasar Harga Konstan 2000 / At Constant 2000
Market Prices
1. Produk Domestik Regional Bruto Atas Dasar HargaPasar (Ribuan Rupiah) / Gross Regional DomesticProduct at Current Market Prices (ThousandRupiah)
450.818 473.678 496.844
2. Dikurangi Penyusutan Barang-barang Modal(Ribuan Rupiah) / Less Depreciation (ThousandRupiah)
23.218 26.457 30.417
3. Produk Domestik regional Netto Atas Dasar HargaPasar (Ribuan Rupiah) / Net Regional DomesticProduct at Current Market Prices (ThousandRupiah)
427.600 447.221 466.428
4. Dikurangi Pajak Tak Langsung Netto (RibuanRupiah) / Less Net Indirect Taxes (ThousandRupiah)
6.503 6.496 6.176
5. Produk Domestik Regional Netto Atas Dasar BiayaFaktor = Pendapatan Regional (Ribuan Rupiah) /Net Regional Domestic Product at Factor Cost(Thousand Rupiah)
421.097 440.725 460.252
6. Jumlah Penduduk Pertengahan Tahun (orang) /Population at The Middle of The Year (person) 193.785 196.133 196.613
7. Produk Domestik Regional Bruto Atas Dasar HargaPasar Perkapita (Rupiah) / Per Capita GrossRegional Product (Rupiah)
2.326.381 2.415.085 2.527.017
8. Pendapatan Regional Perkapita (Rupiah) / PerCapita Regional Income (Rupiah) 2.173.013 2.247.073 2.340.902
Sumber: BPS Kabupaten AlorSource: Statistical Office of Alor
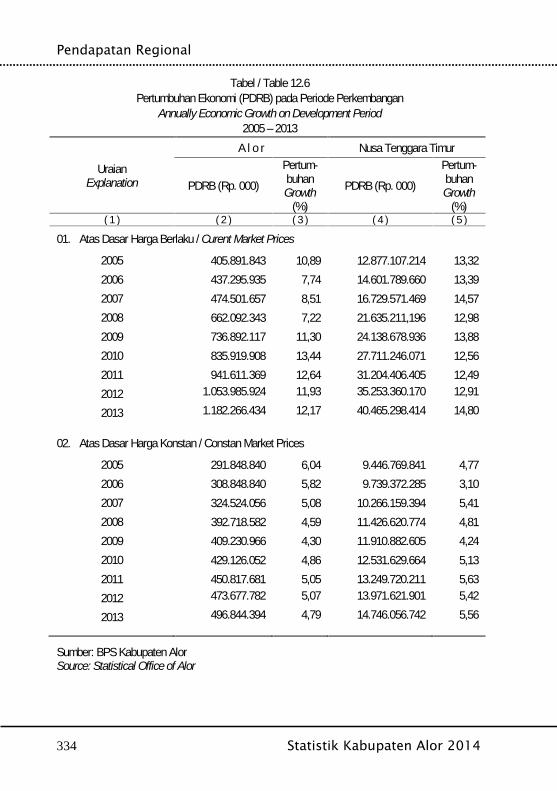
Pendapatan Regional
334 Statistik Kabupaten Alor 2014
Tabel / Table 12.6Pertumbuhan Ekonomi (PDRB) pada Periode Perkembangan
Annually Economic Growth on Development Period2005 – 2013
UraianExplanation
A l o r Nusa Tenggara Timur
PDRB (Rp. 000)Pertum-buhanGrowth
(%)PDRB (Rp. 000)
Pertum-buhanGrowth
(%)( 1 ) ( 2 ) ( 3 ) ( 4 ) ( 5 )
01. Atas Dasar Harga Berlaku / Curent Market Prices
2005 405.891.843 10,89 12.877.107.214 13,322006 437.295.935 7,74 14.601.789.660 13,392007 474.501.657 8,51 16.729.571.469 14,572008 662.092.343 7,22 21.635.211,196 12,982009 736.892.117 11,30 24.138.678.936 13,882010 835.919.908 13,44 27.711.246.071 12,562011 941.611.369 12,64 31.204.406.405 12,492012 1.053.985.924 11,93 35.253.360.170 12,91
2013 1.182.266.434 12,17 40.465.298.414 14,80
02. Atas Dasar Harga Konstan / Constan Market Prices
2005 291.848.840 6,04 9.446.769.841 4,772006 308.848.840 5,82 9.739.372.285 3,102007 324.524.056 5,08 10.266.159.394 5,412008 392.718.582 4,59 11.426.620.774 4,812009 409.230.966 4,30 11.910.882.605 4,242010 429.126.052 4,86 12.531.629.664 5,132011 450.817.681 5,05 13.249.720.211 5,632012 473.677.782 5,07 13.971.621.901 5,42
2013 496.844.394 4,79 14.746.056.742 5,56
Sumber: BPS Kabupaten AlorSource: Statistical Office of Alor