Embed Size (px)
Citation preview
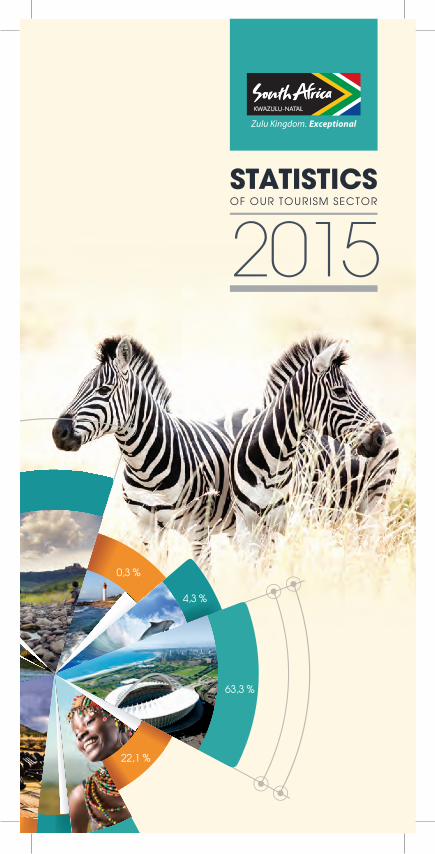
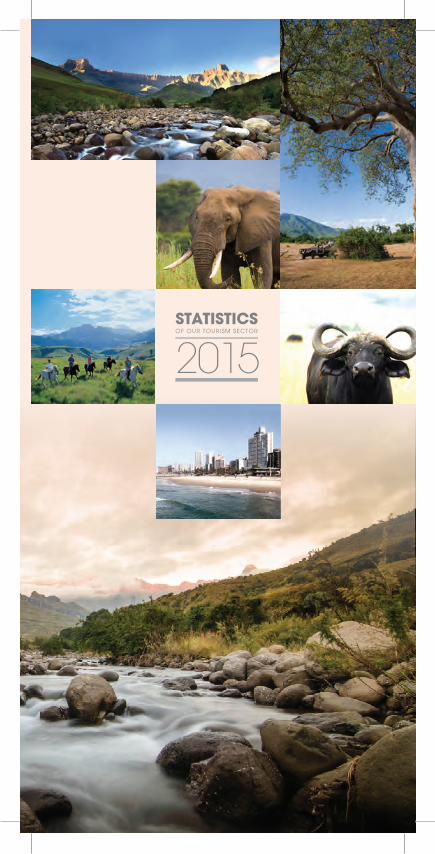
OF OUR TOURISM SECTOR
2015STATISTICS
63,3 %
22,1 %
4,3 %
0,3 %
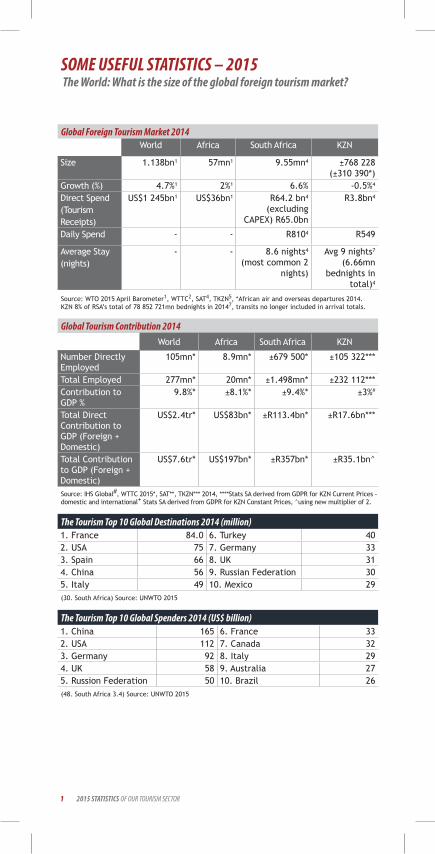
Source: WTO 2015 April Barometer1, WTTC2, SAT4, TKZN5, *African air and overseas departures 2014. KZN 8% of RSA’s total of 78 852 721mn bednights in 20147, transits no longer included in arrival totals.
Source: IHS Global#, WTTC 2015*, SAT**, TKZN*** 2014, ****Stats SA derived from GDPR for KZN Current Prices - domestic and international+ Stats SA derived from GDPR for KZN Constant Prices, ^using new multiplier of 2.
SOME USEFUL STATISTICS – 2015 The World: What is the size of the global foreign tourism market?
Global Foreign Tourism Market 2014
Global Tourism Contribution 2014
The Tourism Top 10 Global Destinations 2014 (million)
The Tourism Top 10 Global Spenders 2014 (US$ billion)
1 2015 STATISTICS OF OUR TOURISM SECTOR
(30. South Africa) Source: UNWTO 2015
(48. South Africa 3.4) Source: UNWTO 2015
World Africa South Africa KZN
Size 1.138bn1 57mn1 9.55mn4 ±768 228(±310 390*)
Growth (%) 4.7%1 2%1 6.6% -0.5%4
Direct Spend (Tourism Receipts)
US$1 245bn1 US$36bn1 R64.2 bn4 (excluding
CAPEX) R65.0bn
R3.8bn4
Daily Spend - - R8104 R549
Average Stay (nights)
- - 8.6 nights4 (most common 2
nights)
Avg 9 nights7 (6.66mn
bednights in total)4
World Africa South Africa KZN
Number Directly Employed
105mn* 8.9mn* ±679 500* ±105 322***
Total Employed 277mn* 20mn* ±1.498mn* ±232 112***Contribution to GDP %
9.8%* ±8.1%* ±9.4%* ±3%#
Total Direct Contribution to GDP (Foreign + Domestic)
US$2.4tr* US$83bn* ±R113.4bn* ±R17.6bn***
Total Contribution to GDP (Foreign + Domestic)
US$7.6tr* US$197bn* ±R357bn* ±R35.1bn^
1. France 84.0 6. Turkey 402. USA 75 7. Germany 33 3. Spain 66 8. UK 314. China 56 9. Russian Federation 305. Italy 49 10. Mexico 29
1. China 165 6. France 33 2. USA 112 7. Canada 32 3. Germany 92 8. Italy 294. UK 58 9. Australia 275. Russion Federation 50 10. Brazil 26

The South African Foreign Picture 2014:
South Africa’s Top 5 Overseas (Long Haul) Tourist Markets 2014:
South Africa’s Top 5 average spending markets per trip (excluding Capital Expenditure)
Source: SAT 2015, WTTC 2015
Source: SAT 2015
Source: SAT 2015
The Top 10 Global Generators of Tourists 2014:
(SA 5 168 000) Source: The World Bank 2015; UNWTO 2015
1. China 98 185 000 6. Russian Federation 54 069 0002. Hong Kong, China 84 414 000 7. Canada 32 977 0003. Germany 74 192 000 8. Italy 27 798 0004. USA 61 569 000 9. France 26 243 0005. UK 58 510 000 10. Ukraine 23 761 000
Numbers of Foreign Tourists 9.55mnSpend - pppd R810 (R7 000 per trip)Leisure Spend 66% of total, or R162.3bnBusiness Spend 34% of total, or R83.6bnAverage Length of Stay 8.6 nightsMain Overseas Source Markets UK, USA, Germany, France, NetherlandsSpend, Foreign vs Domestic 45.9% vs 54.1%
1. UK 401 9142. USA 309 2553. Germany 274 5714. France 131 5025. Netherlands 131 287
1. Malawi R19 7002. Zambia R17 6003. Australia R15 7004. Netherlands R15 600 5. Belgium R15 000
22015 STATISTICS OF OUR TOURISM SECTOR
Foreign Tourist Activities in South Africa 2014:Shopping 81.7%Nightlife 74.8%Social 53.6%Visiting Natural Attractions 16%Business 12.1%Cultural, Historical, Heritage 12.5%Beach 11.9%Wildlife 8.8%Theme Parks 10%Adventure 5.6%Source: SAT 2015
Purpose of Visit to South Africa
Source: SAT 2015
All Foreign Tourists (2014)Holiday 16.8%VFR 40.1%Shopping 21.6%Business Travel 0.6%Other 5.5%Medical 2.3%Business Tourism 12.4%
3
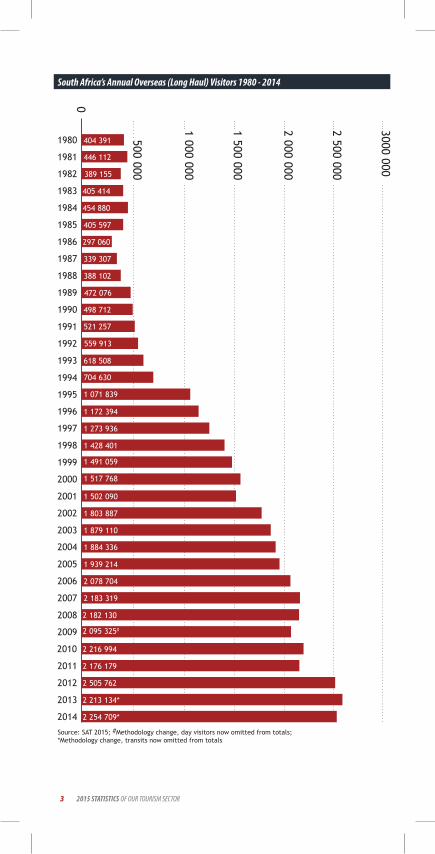
South Africa’s Annual Overseas (Long Haul) Visitors 1980 - 2014
1 500 000
2 000 000
1 000 000
500 000
0
2 500 000
3000 000
1997
1998
1999
2000
2004
2002
2006
2009
2001
2005
2008
2003
2007
2010
2012
2013
2014
2011
1 428 401
1 517 768
1 803 887
1 884 336
2 078 704
2 182 130
2 216 994
2 176 179
2 505 762
2 213 134*
2 254 709*
1 273 936
1 491 059
1 502 090
1 879 110
1 939 214
2 183 319
2 095 325#
1980
1985
1991
1981
1986
1992
1982
1987
1993
1983
1988
1984
1990
1989
1994
1995
404 391
389 155
454 880
297 060
388 102
498 712
559 913
704 630
446 112
405 414
405 597
339 307
472 076
521 257
618 508
1 071 839
1996 1 172 394
Source: SAT 2015; #Methodology change, day visitors now omitted from totals; *Methodology change, transits now omitted from totals
2015 STATISTICS OF OUR TOURISM SECTOR
4
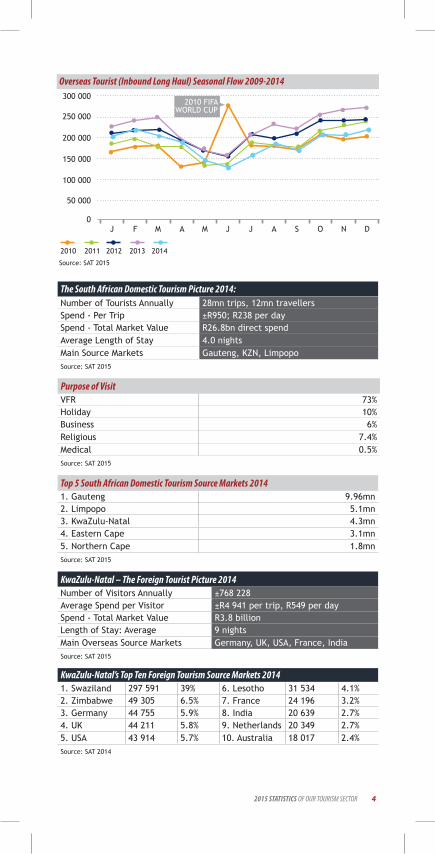
Number of Tourists Annually 28mn trips, 12mn travellersSpend - Per Trip ±R950; R238 per daySpend - Total Market Value R26.8bn direct spend Average Length of Stay 4.0 nightsMain Source Markets Gauteng, KZN, Limpopo
VFR 73%Holiday 10%Business 6%Religious 7.4%Medical 0.5%
Source: SAT 2015
Source: SAT 2015
Source: SAT 2015
Source: SAT 2015
The South African Domestic Tourism Picture 2014:
Purpose of Visit
Source: SAT 2015
2010 2011 2012 20142013
50 000
150 000
100 000
250 000
300 000
200 000
Overseas Tourist (Inbound Long Haul) Seasonal Flow 2009-2014
J J JF M MA A S NO D0
Top 5 South African Domestic Tourism Source Markets 2014
KwaZulu-Natal – The Foreign Tourist Picture 2014Number of Visitors Annually ±768 228 Average Spend per Visitor ±R4 941 per trip, R549 per day Spend - Total Market Value R3.8 billionLength of Stay: Average 9 nights Main Overseas Source Markets Germany, UK, USA, France, India
Source: SAT 2014
KwaZulu-Natal’s Top Ten Foreign Tourism Source Markets 2014
3000 000
1. Swaziland 297 591 39% 6. Lesotho 31 534 4.1%2. Zimbabwe 49 305 6.5% 7. France 24 196 3.2%3. Germany 44 755 5.9% 8. India 20 639 2.7%4. UK 44 211 5.8% 9. Netherlands 20 349 2.7%5. USA 43 914 5.7% 10. Australia 18 017 2.4%
1. Gauteng 9.96mn2. Limpopo 5.1mn3. KwaZulu-Natal 4.3mn4. Eastern Cape 3.1mn5. Northern Cape 1.8mn
2010 FIFA WORLD CUP
2015 STATISTICS OF OUR TOURISM SECTOR

Destinations Visited in KZN – Foreign Tourists 2014
Purpose of Visit to KZN – Overseas and African Air Departures 2014
Purpose of Visit to KZN – Land Departures 2014
KwaZulu-Natal’s Top Long Haul Source Markets
Durban 63.3%Pietermaritzburg 4.3%Zululand 22.1%Drakensberg 2.1%Elephant Coast 7.8%North Coast 0.3%South Coast 0%Battlefields 2.4%
Holiday Overseas: 27.7% African Air: 52.8%Business Overseas: 15% African Air: 18.7%VFR Overseas: 0.8% African Air: 18.7%Other Overseas: 5.2% African Air: 7.7%
Holiday 9.4%Business 12.3%VFR 74.9%Other 3.4%
2014 2013 2012 2011 20101. Germany 1. USA 1. UK 1. UK 1. UK2. UK 2. UK 2. USA 2. USA 2. USA3. USA 3. Germany 3. Germany 3. Germany 3. Germany4. France 4. India 4. India 4. France 4. France5. India 5. Australia 5. Netherlands 5. Netherlands 5. Australia6. Netherlands 6. France 6. Australia 6. Australia 6. Netherlands
Source: SAT 2015
Source: SAT 2015
Source: SAT 2015
Source: SAT 2015
OF OUR TOURISM SECTOR
2015STATISTICS
5 2015 STATISTICS OF OUR TOURISM SECTOR

62015 STATISTICS OF OUR TOURISM SECTOR
KZN – The Domestic Tourist Picture 2014
Some Activities Undertaken in KZN – African Land, African Air Departure and Overseas Visitors 2014
Monthly Foreign Tourist Arrivals in KZN – 2009-2014
Number of Visitors Annually ±5.3mn trips* Average Spend Per Trip ±R979Spend – Total Direct Value ±R5.2bnAverage Length of Stay 4.2 nights (8.02 – TKZN)Main Source Markets Gauteng, KwaZulu-Natal
Land Africa Air Rest of WorldNightlife 83.0% 59.3% 73.0%Shopping 95.1% 71.0% 84.9%Visiting Natural Attractions 7.3% 62.7% 30.6%Beach 49.7% 61.3% 54.6%Wildlife 2.3% 42.3% 19.2%Cultural, Historical and Heritage 13.9% 37.4% 23.8%Social 80.9% 23.6% 56.7%Business 5.6% 69.4% 10.6%Theme Parks 5.6% 39.2% 19.8%Adventure 26.8% 0.5% 11.6%Visited a Casino 5.8% 5.1% 5.5%Sporting - Spectator 1.8% 1.2% 1.6%Education 1.3% 4.0% 2.4%Sporting - Competed 0.4%- 0.7% 0.5%Hunting 0.1% 2.2% 1.0%Medical 0.6% 0.3% 0.5%Health 0.9% 3.5% 2.0%Trading 1.6% 1.1% 1.4%Source: SAT 2015
Source: SAT 2015
Source: SAT 2015 2009 2013 20142011 20122010
J J JF M MA A S NO D0
120 000
80 000
20 000
100 000
40 000
60 000

7 2015 STATISTICS OF OUR TOURISM SECTOR
KZN – Top 5 Domestic Source Markets 2014
KZN – Top Source Markets for Holiday Makers 2014
Purpose of Visit to KZN – Domestic Visitors 2014
Activities Undertaken in KZN - Domestic Visitors 2014Activity %
Go to the beach 62Go to a live show, theatre or concert 26Watch a live sports event 36Visit a museum, art gallery or historical building 30Visit a nature or wildlife or game reserve 23Take part in a sports event 35Take part in any water sport 25Visit an arts or craft outlet 22Visit an African township or cultural village on a tour 21Food and wine fair 30Go hiking or mountain-climbing 13Bird-watching 19Art and crafts festival 22Attend a conference, workshop or training session 17Visit a health spa 21See Bushman paintings 14Fly-fishing 14Horse riding 10Go backpack/hostel travelling 15Mountain biking or other cycling 11Tour of the battlefields 9
VFR 54%Holiday/Leisure 37%Business 9%Other 0.1%
Source: TKZN 2015
Source: TKZN 2015
Source: TKZN 2015
Source: TKZN 2014
1. Gauteng2. KwaZulu-Natal 3. Western Cape 4. Free State 5. Eastern Cape
1. Gauteng2. KwaZulu-Natal 3. Western Cape 4. Eastern Cape 5. Limpopo/Mpumalanga

82015 STATISTICS OF OUR TOURISM SECTOR
Domestic Trips to Destinations in KZN 2014
Average Trips in 2014
Destinations Visited in KZN – Domestic Tourists 2014
Durban 39%Pietermaritzburg 11%Zululand 19%Drakensberg 4%Elephant Coast 7%North Coast 7%South Coast 8%Battlefields 5%
Durban 2.54Pietermaritzburg/Midlands 2.17South Coast 2.06North Coast 1.95Zululand 2.22Drakensberg 2.20Elephant Coast 1.45Battlefields 1.31
Source: TKZN 2015
Source: TKZN 2015
Source: TKZN 2015
2 500
3 000
3 500
569720
1 228
520 587
271
740
1 500
2 000
1 000
500
0
Tour
ists
(‘0
00)
2 200
Dur
ban
Sout
h Co
ast
PMB/
Mid
land
s
Zulu
land
Nor
th C
oast
Batt
lefie
lds
Dra
kens
berg
Elep
hant
Coa
st
Source: FEDHASA (KZN), STR Global, 2015
Hotel Room Occupancy % Graph KZN 2004 - 2015
%
10
30
50
70
90
0
20
40
60
80
Jan May SepFeb Jun OctMar Jul NovApr Aug Dec
2014 20152011 2012 20132010
9 2015 STATISTICS OF OUR TOURISM SECTOR
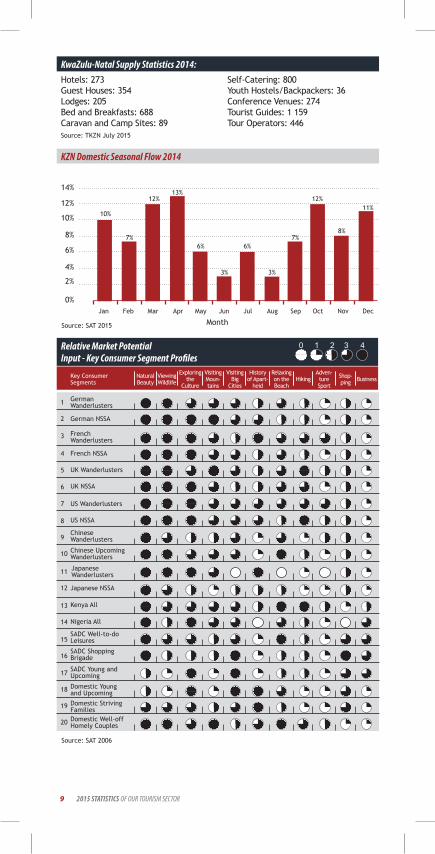
KZN Domestic Seasonal Flow 2014
Source: SAT 2015
Source: TKZN July 2015
2%
6%
10%
0%
4%
8%
12%
14%
Jan
MonthMar AugJun NovFeb May OctApr SepJul Dec
10%
12%
7%8%
12%13%
3%
6%6%
11%
3%
7%
Source: SAT 2006
Key ConsumerSegments
German Wanderlusters
20
18
16
14
12
6
10
4
8
2
19
17
15
13
11
5
9
3
7
1
Natural Beauty
Exploring the
Culture
VisitingMoun-tains
VisitingBig
Cities
History of Apart-
heid
Relaxing on the Beach
HikingAdven-ture Sport
Shop-ping BusinessViewing
Wildlife
German NSSA
French Wanderlusters
ChineseWanderlusters
Chinese UpcomingWanderlusters
Japanese Wanderlusters
Japanese NSSA
Kenya All
Nigeria All
SADC Well-to-doLeisures
SADC Shopping Brigade
SADC Young and Upcoming
Domestic Young and Upcoming
Domestic Striving FamiliesDomestic Well-off Homely Couples
French NSSA
UK Wanderlusters
UK NSSA
US Wanderlusters
US NSSA
KwaZulu-Natal Supply Statistics 2014:Hotels: 273Guest Houses: 354Lodges: 205Bed and Breakfasts: 688Caravan and Camp Sites: 89
Self-Catering: 800Youth Hostels/Backpackers: 36Conference Venues: 274Tourist Guides: 1 159Tour Operators: 446
Relative Market PotentialInput - Key Consumer Segment Profiles
102015 STATISTICS OF OUR TOURISM SECTOR
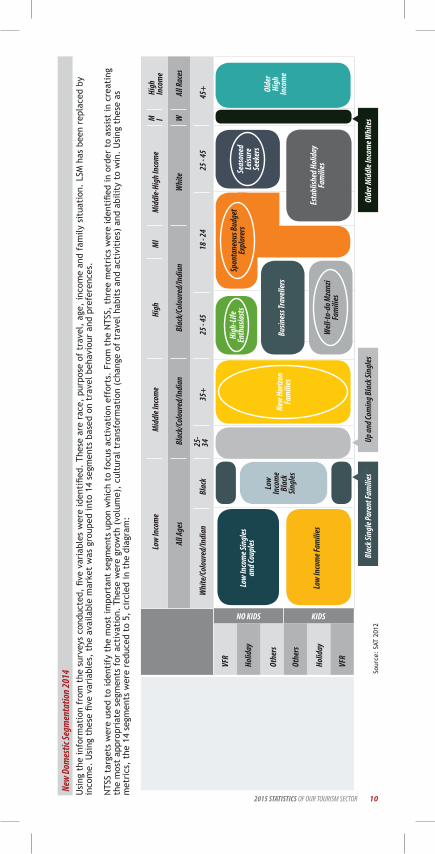
Usi
ng t
he in
form
atio
n fr
om t
he s
urve
ys c
ondu
cted
, fiv
e va
riab
les
wer
e id
enti
fied.
The
se a
re r
ace,
pur
pose
of
trav
el,
age,
inco
me
and
fam
ily s
itua
tion
. LS
M h
as b
een
repl
aced
by
inco
me.
Usi
ng t
hese
five
var
iabl
es,
the
avai
labl
e m
arke
t w
as g
roup
ed in
to 1
4 se
gmen
ts b
ased
on
trav
el b
ehav
iour
and
pre
fere
nces
.
NTS
S ta
rget
s w
ere
used
to
iden
tify
the
mos
t im
port
ant
segm
ents
upo
n w
hich
to
focu
s ac
tiva
tion
eff
orts
. Fr
om t
he N
TSS,
thr
ee m
etri
cs w
ere
iden
tifie
d in
ord
er t
o as
sist
in c
reat
ing
the
mos
t ap
prop
riat
e se
gmen
ts f
or a
ctiv
atio
n. T
hese
wer
e gr
owth
(vo
lum
e),
cult
ural
tra
nsfo
rmat
ion
(cha
nge
of t
rave
l hab
its
and
acti
viti
es)
and
abili
ty t
o w
in.
Usi
ng t
hese
as
met
rics
, th
e 14
seg
men
ts w
ere
redu
ced
to 5
, ci
rcle
d in
the
dia
gram
:
Low
Inco
me
VFR
NO KIDS KIDS
VFR
Holid
ay
Holid
ay
Othe
rs
Othe
rs
Mid
dle I
ncom
eM
iddl
e-Hi
gh In
com
eHi
gh
Inco
me
M I WAl
l Rac
esW
hite
Blac
k/Co
lour
ed/In
dian
Blac
k/Co
lour
ed/In
dian
Whi
te/C
olou
red/
Indi
an
Low
Inco
me S
ingl
esan
d Cou
ples
New
Horiz
onFa
mili
es
Olde
r Hi
ghIn
com
e
High
-Life
Enth
usia
sts
Low
Inco
me
Blac
k Sin
gles
Low
Inco
me F
amili
es
Busin
ess T
rave
llers
Well
-to-d
o Mza
nzi
Fam
ilies
Spon
tane
ous B
udge
tEx
plor
ers
Esta
blish
ed H
olid
ayFa
mili
esSeas
oned
Leisu
reSe
eker
s
Blac
k35
+45
+25
- 45
25 - 4
518
- 24
25-
34
All A
ges
High
MI
Blac
k Sin
gle P
aren
t Fam
ilies
Up an
d Com
ing B
lack
Sing
lesOl
der M
iddl
e Inc
ome W
hite
sSo
urce
: SA
T 20
12
New
Dom
estic
Segm
enta
tion 2
014

11 2015 STATISTICS OF OUR TOURISM SECTOR
Wan
derl
uste
rs
• W
ande
rlus
ters
(U
SA)
• U
psca
le W
ande
rlus
ters
(U
SA)
• W
ande
rlus
ters
(U
K)•
Ups
cale
Wan
derl
uste
rs (
UK)
•
Wan
derl
uste
rs (
De)
• W
ande
rlus
ters
(Fr
)•
Wan
derl
uste
rs (
In)
• W
ande
rlus
ters
(N
e)•
Emer
ging
Wan
derl
uste
rs (
Aust
)•
Wan
derl
uste
rs (
Aust
)•
Ex-P
at W
ande
rlus
ters
(N
i, K
)•
Org
anis
ed W
ande
rlus
ters
(Ch
)•
Expe
rien
ced
Wan
derl
uste
rs (
Ch)
• O
rgan
ised
Wan
derl
uste
rs (
Jp)
• Ex
peri
ence
d W
ande
rlus
ters
(Jp
)•
Wan
derl
uste
rs (
Jp) Po
siti
ve C
onve
rtib
les
• Co
nver
tibl
e Sh
ort
Hau
l (N
e)•
Posi
tive
Con
vert
ible
s (U
SA)
• Po
siti
ve C
onve
rtib
le c
oupl
es (
UK)
• Po
siti
ve C
onve
rtib
les
(Jap
an)
Seni
or E
xplo
rers
• Se
nior
Exp
lore
rs (
De)
• Se
nior
Exp
lore
rs (
Fr)
• Se
nior
Exp
lore
rs (
Japa
n)•
Empt
y N
este
rs (
In)
• Se
nior
Exp
lore
rs (
Aust
)
Purp
ose
Trav
elle
rs
• In
depe
nden
t Bu
sine
ss P
eopl
e (N
i)•
Trad
ers/
Impo
rter
s (N
i)•
Purp
ose
Trav
elle
rs (
Chin
a)•
Busi
ness
Pro
fess
iona
ls (
SADC
)•
Priv
ate
Trad
ers
(SAD
C)•
Taxi
Tra
ders
(SA
DC)
• Tr
adin
g Tr
ucke
rs (
SADC
)
• U
S Ad
vent
ure/
Cult
ure
NSS
As•
UK
NSS
As (
UK)
• G
erm
an N
SSAs
(De
)•
Fre
nch
NSS
As (
Fr)
• D
utch
NSS
As (
Ne)
• E
x-Pa
t N
SSAs
(N
i, K
e)
• N
SSAs
(Ke
) •
NSS
As (
Japa
n)
• N
SSAs
(Au
st)
• U
S R e
laxe
r N
SSAs
• H
igh
End
P ack
age
(Ne)
• Lu
xury
Eld
erly
Bre
ak (
Ne)
• H
igh
Spen
d P a
ckag
e (A
) •
Hyp
er W
ealt
hy (
Wit
hout
Kid
s) (
Ni)
• E
x-Pa
t Pa
mpe
red
NSS
As (
Ni,
Ke)
Caco
oned
/Low
Adv
entu
re•
Fam
ily E
xplo
rers
(U
SA)
• H
yper
Wea
lthy
(W
ith
kids
) (N
i)•
Ex-P
at L
ow A
dven
ture
Fa
mily
Tra
velle
rs (
Ni,
Ke)
• Y o
ung
Fam
ilies
(In
)
Expl
orer
s/Ad
vent
urou
s•
Fam
ily A
fric
an D
isco
vere
rs (
De)
• Fr
ench
Fam
ily E
xplo
rers
• Ex
-Pat
Fam
ily E
xplo
rers
(N
i, K
e)•
New
Fam
ily E
xplo
rers
(In
)•
Expe
rien
ced
Fam
ily E
xplo
rers
(In
)
NSS
As
Fam
ily T
rave
llers
Adve
ntur
ous,
exp
lora
tive
(G
row
n-up
Wan
derl
uste
rs)
NSS
A Ex
plor
ers
Rela
xati
on a
nd lu
xury
wit
h so
me
disc
over
y
Pam
pere
d N
SSAs
Source: SAT 2012
Inte
rnat
ional
Segm
enta
tion
SA to
urism
has id
entifi
ed ke
y seg
men
ts in
its fo
cus m
arke
ts ac
ross
the w
orld.
..KE
Y FOC
US SE
GMEN
TS
Thro
ugh
the
segm
enta
tion
of
mar
kets
, a
num
ber
of g
loba
l seg
men
ts h
ave
emer
ged
acro
ss c
ount
ries
, of
peo
ple
who
are
pos
itiv
e an
d ke
en t
o vi
sit
Sout
h Af
rica
. The
dia
gram
bel
ow d
epic
ts t
he la
test
seg
men
tati
on:

122015 STATISTICS OF OUR TOURISM SECTOR
YOUNG SOUTH AFRICA
SEEKERS
CENTRE OF GRAvITY
MATURE SOUTH AFRICA
SEEKERS
SOUTH AFRICA
SEEKERS
• 26 - 40 years old.• Predominantly
male (61%).• Make decisions by
themselves.• Almost all work
full-time.• Have ±2 weeks for
holiday.• Holiday Spend:
<$2 000.• Use Internet for info and
travel agents for fulfillment.
• Don’t like tours. They want largely
independent adventure.
• They are active explorers.
• Concerns: getting around, safety and perceived expense.
• Well-travelled. Worldly.
• Independent.• Travellers, not
tourists.• Travel is a state of mind for them. They are global citizens
for whom travel is an essential part of their
everyday lives.• They travel to expand their knowledge and to evolve (It keeps them
interesting).• They want to engage the destination, not see
it at arm’s length.• They seek out
interesting and high quality experiences.• They like to make
their own decisions and maintain a sense of control over their
own destiny.
• 41 - 60 years old.• Most married, make
decisions together.• 40% retired. 20%
semi-retired.• Travel for between
2 and 5 weeks.• High holiday spend: between $2 000 and
$5 000.• Use travel agents for information and fulfillment (have a
relationship).• May use tours if they are flexible.• Interested in a large variety of
activities that allow them to explore.
• Demanding travellers who are constantly looking
for the next amazing thing.
The core segments which SAT will be focusing on are the NSSAs (Next Stop South Africa) and the Wanderlusters. The major differentiator between these two segments is age. The Wanderluster is a more ‘youthful’ segment, whereas the NSSAs are more ‘mature’. However, they both know and are positive about South Africa and have a desire to travel here. They travel abroad regularly, however, they have several destination choices. The challenge is to switch them from other destinations to South Africa. Centre of gravity descriptions: “The person and situation for which the brand is always the best choice is defined in terms of their attitudes and values, NOT just demographics”.

Source: TKZN, IHS, STATSSA, KZN Provincial Treasury, *Quantec
MARKET GEOGRAPHIC SCOPE TARGET SEGMENTS CORE EXPERIENCES
Domestic • KwaZulu-Natal• Gauteng• Western Cape• Eastern Cape• Free State
• New horizon families• High-life enthusiasts• Well-to-do Mzansi families• Spontaneous budget explorers• Seasoned leisure seekers
• Beaches• Natural beauty• Nightlife• Shopping• Heritage• Culture
SADCRest of Africa
• Swaziland• Lesotho• Botswana• Mozambique• Zambia• Zimbabwe• Kenya• Nigeria• Angola
• Business professionals• Traders
• Shopping• Big cities• Beaches (not coastal markets)• Wildlife• Heritage
EUROPEAMERICASASIA
CORE OPPORTUNITY INVESTMENTS STRATEGIC HUB
• United Kingdom
• USA• Germany
• France• Netherlands• Australia
• India• China• Brazil• Sweden• Eastern
Europe (Russia)
• Middle East (GCC countries)
• NSSA, Wanderlusters • Family explorers• New beach-lovers
• Natural beauty• Wildlife• Culture• Visiting mountains• Beach• Adventure (USA Wanderluster)
13 2015 STATISTICS OF OUR TOURISM SECTOR
KZN’s International and Domestic Segmentation 2014 - 2019

MARKET GEOGRAPHIC SCOPE TARGET SEGMENTS CORE EXPERIENCES
Domestic • KwaZulu-Natal• Gauteng• Western Cape• Eastern Cape• Free State
• New horizon families• High-life enthusiasts• Well-to-do Mzansi families• Spontaneous budget explorers• Seasoned leisure seekers
• Beaches• Natural beauty• Nightlife• Shopping• Heritage• Culture
SADCRest of Africa
• Swaziland• Lesotho• Botswana• Mozambique• Zambia• Zimbabwe• Kenya• Nigeria• Angola
• Business professionals• Traders
• Shopping• Big cities• Beaches (not coastal markets)• Wildlife• Heritage
EUROPEAMERICASASIA
CORE OPPORTUNITY INVESTMENTS STRATEGIC HUB
• United Kingdom
• USA• Germany
• France• Netherlands• Australia
• India• China• Brazil• Sweden• Eastern
Europe (Russia)
• Middle East (GCC countries)
• NSSA, Wanderlusters • Family explorers• New beach-lovers
• Natural beauty• Wildlife• Culture• Visiting mountains• Beach• Adventure (USA Wanderluster)
142015 STATISTICS OF OUR TOURISM SECTOR
OF OUR TOURISM SECTOR
2015STATISTICS

15 2015 STATISTICS OF OUR TOURISM SECTOR
KZN Provincial InformationArea 94 361 km2 (7.7% of South Africa)Coastline 560kmsClimate Sub-tropical. Summer 17-28 ºC, Winter 11–25 ºC,
Durban average rainfall 1 009mmHighest Elevation 3 451 m (Mafadi, in the Drakensberg)Population 10.5mn (19.8% of South Africa) mid-2014 (growth
rate 1.3%)Population Density 113 people per square kilometre 2014Capital PietermaritzburgLanguages Mainly Zulu and EnglishHolidays 1 January, 21 March, 24 March, 27 April, 28 April,
1 May, 2 May, 16 June, 9 August, 24 September, 16 December, 25 December, 26 December.
Time Zone GMT +2Currency The Rand is made up of 100 centsGDP 2014 R585.6 billion or 16.7% of South Africa’s GDP*Electricity 220 VoltsHarbours Durban, Richards BayAirports King Shaka International Airport, Oribi, Richards
Bay, Margate, Ulundi.Literacy Rate 75.6% (2012)Employment Rate Between 57.2% - 61.5% (2014, using strict and
expanded definitions)Source: TKZN, IHS, STATSSA, KZN Provincial Treasury, *Quantec
OF OUR TOURISM SECTOR
2015STATISTICS
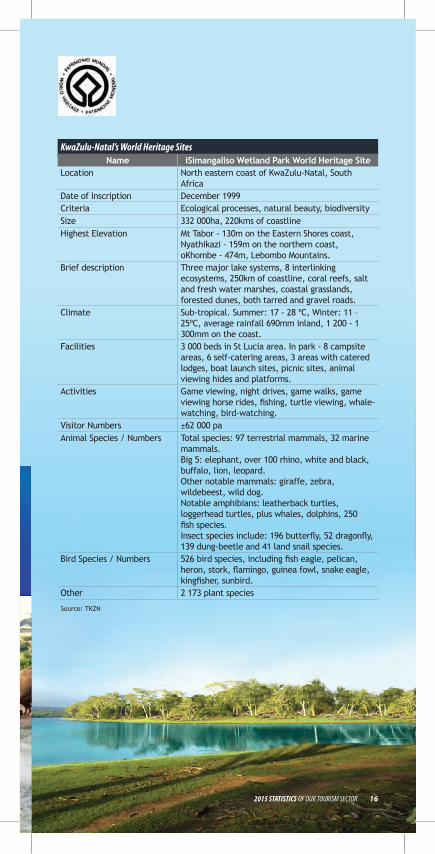
Name iSimangaliso Wetland Park World Heritage SiteLocation North eastern coast of KwaZulu-Natal, South
AfricaDate of Inscription December 1999Criteria Ecological processes, natural beauty, biodiversitySize 332 000ha, 220kms of coastlineHighest Elevation Mt Tabor - 130m on the Eastern Shores coast,
Nyathikazi - 159m on the northern coast, oKhombe - 474m, Lebombo Mountains.
Brief description Three major lake systems, 8 interlinking ecosystems, 250km of coastline, coral reefs, salt and fresh water marshes, coastal grasslands, forested dunes, both tarred and gravel roads.
Climate Sub-tropical. Summer: 17 - 28 ºC, Winter: 11 – 25ºC, average rainfall 690mm inland, 1 200 - 1 300mm on the coast.
Facilities 3 000 beds in St Lucia area. In park - 8 campsite areas, 6 self-catering areas, 3 areas with catered lodges, boat launch sites, picnic sites, animal viewing hides and platforms.
Activities Game viewing, night drives, game walks, game viewing horse rides, fishing, turtle viewing, whale- watching, bird-watching.
Visitor Numbers ±62 000 paAnimal Species / Numbers Total species: 97 terrestrial mammals, 32 marine
mammals.Big 5: elephant, over 100 rhino, white and black, buffalo, lion, leopard.Other notable mammals: giraffe, zebra, wildebeest, wild dog.Notable amphibians: leatherback turtles, loggerhead turtles, plus whales, dolphins, 250 fish species.Insect species include: 196 butterfly, 52 dragonfly, 139 dung-beetle and 41 land snail species.
Bird Species / Numbers 526 bird species, including fish eagle, pelican, heron, stork, flamingo, guinea fowl, snake eagle, kingfisher, sunbird.
Other 2 173 plant species
KwaZulu-Natal’s World Heritage Sites
Source: TKZN
162015 STATISTICS OF OUR TOURISM SECTOR

Name uKhahlamba Drakensberg Park World Heritage SiteLocation Forms western KwaZulu-Natal border between
South Africa and Lesotho, major watershedDate of Inscription November 2000Criteria Cultural (3) and natural (4) criteriaSize 242 813haHighest Elevation 3 451mBrief description High basalt mountain range overlying sandstone
bands over shale, foothills, incised valleys, grassland and protea, yellowwood and bottlebrush forests.
Climate Summer: 22ºC, Winter 5ºC, average rainfall: 900mm, frequent snow in winter.
Facilities 700 beds inside the park, 2 000 closely adjacent, 9 campsites, ±150 caves, picnic sites, view sites, ‘vultures restaurant’.
Activities Walking, hiking, climbing, ice-climbing, bird- watching, fly-fishing, paragliding, mountain biking, hang-gliding, horse riding, horse trekking, river swimming, rock art viewing, picnicking.
Visitor Numbers Annual total 2009 – ±110 000Animal Species / Numbers Mammals: 48 species including eland, water buck,
oribi, mountain reed buck, ±1 800 rhebok, jackals, leopard.Insects include 46 species of millipedes and centipedes, 44 dragonfly species (about a third of South Africa’s total) and 74 butterfly species, 124 frog species, 23 lizard and 25 snake species.
Bird Species / Numbers Total: 296 species, including Lammergeyer, Cape vulture, black eagles.
Other 2 153 plant species
KwaZulu-Natal’s World Heritage Sites
Source: TKZN 2012
17 2015 STATISTICS OF OUR TOURISM SECTOR
OF OUR TOURISM SECTOR
2015STATISTICS

7,8 %
www.zulu.org.za
2nd Floor Ithala Trade Centre
29 Canal Quay Road
Point, Durban, 4001
PO Box 2516
Durban, 4000
Switchboard: +27 (0) 31 366 7500
Fax: +27 (0) 31 305 6693
Airport Office: +27 (0) 32 436 0013
V&A Cape Town Office: +27 (0) 21 418 1684
Airport Office Gauteng: +27 (0) 11 390 1000
Customer Care: 0860 101 099
uShaka Marine World: +27 (0) 31 337 8099
Email: [email protected]
TOURISM REGIONS OF KWAZULU-NATAL
2,1 %
2,4 %