Embed Size (px)
Citation preview
Statistics IntroStatistics Intro
Univariate AnalysisCentral Tendency
Dispersion
Descriptive Statistics are used to present quantitative descriptions in a manageable form.
This method works by reducing lots of data into a simpler summary.
Example: •Batting average in baseball
•Cornell’s grade-point system
Review of Descriptive Stats.
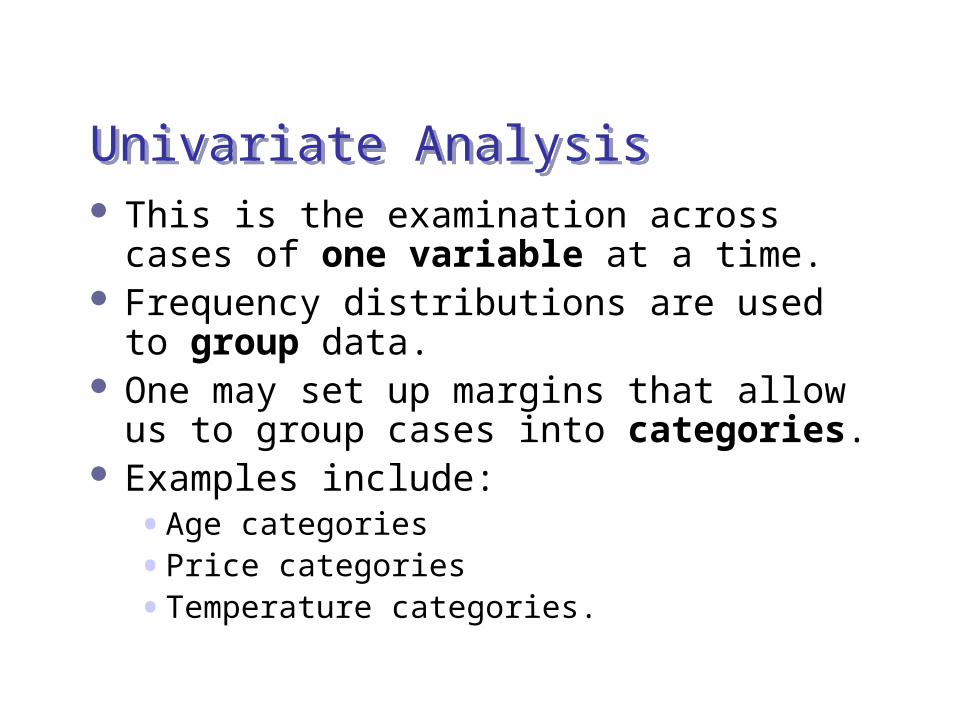
This is the examination across cases of one variable at a time.
Frequency distributions are used to group data.
One may set up margins that allow us to group cases into categories.
Examples include:•Age categories
•Price categories
•Temperature categories.
Univariate AnalysisUnivariate Analysis
Two ways to describe a univariate distribution:
A tableA graph (histogram, bar
chart)
Distributions
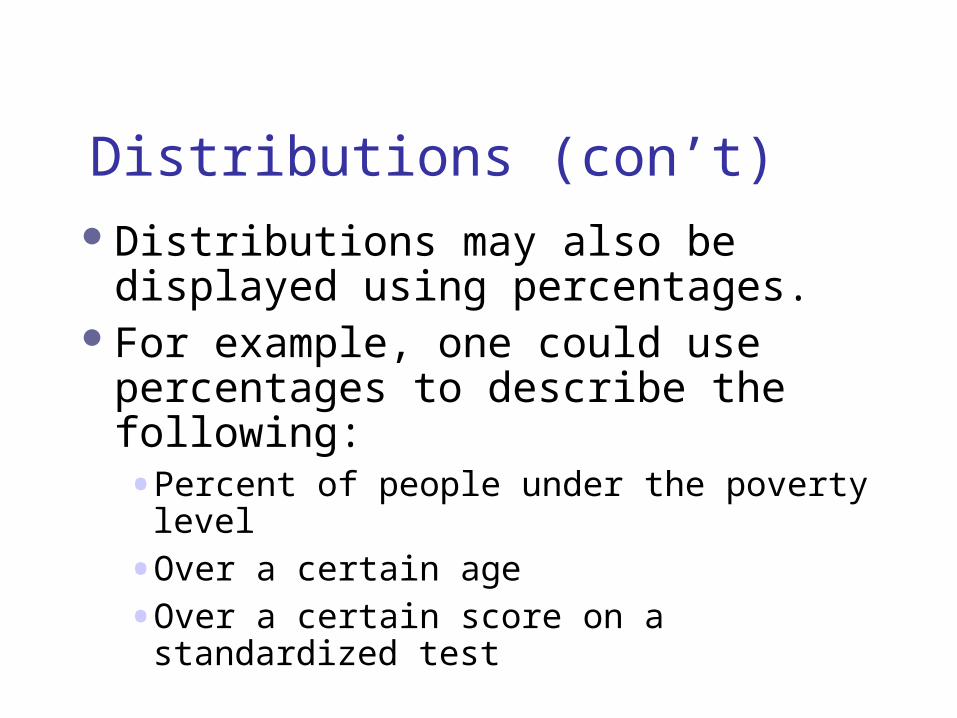
Distributions may also be displayed using percentages.
For example, one could use percentages to describe the following: •Percent of people under the poverty level
•Over a certain age
•Over a certain score on a standardized test
Distributions (con’t)
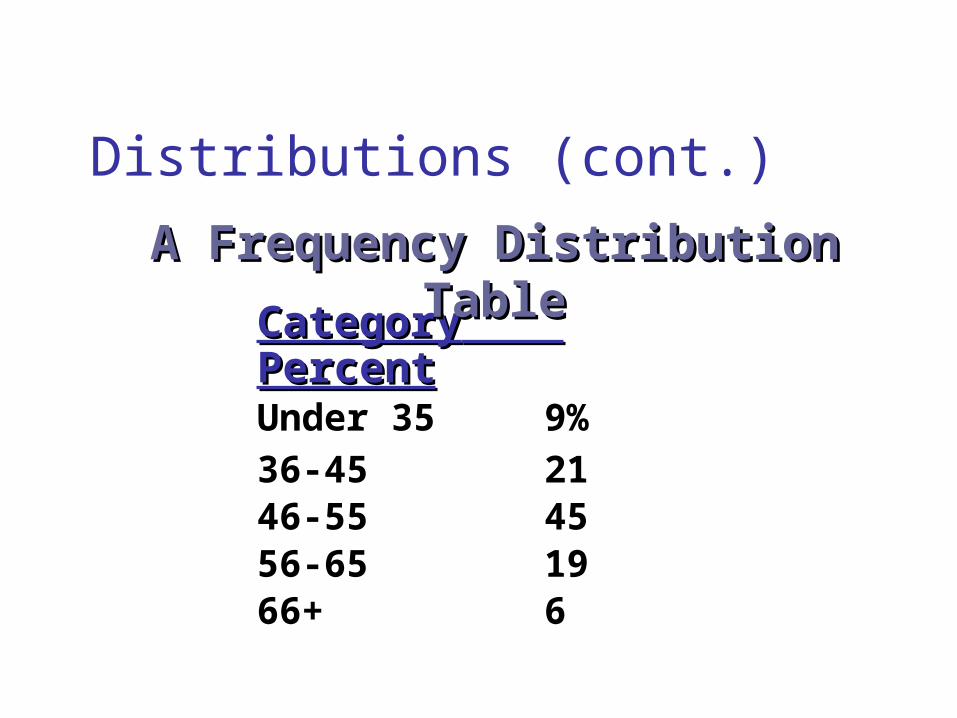
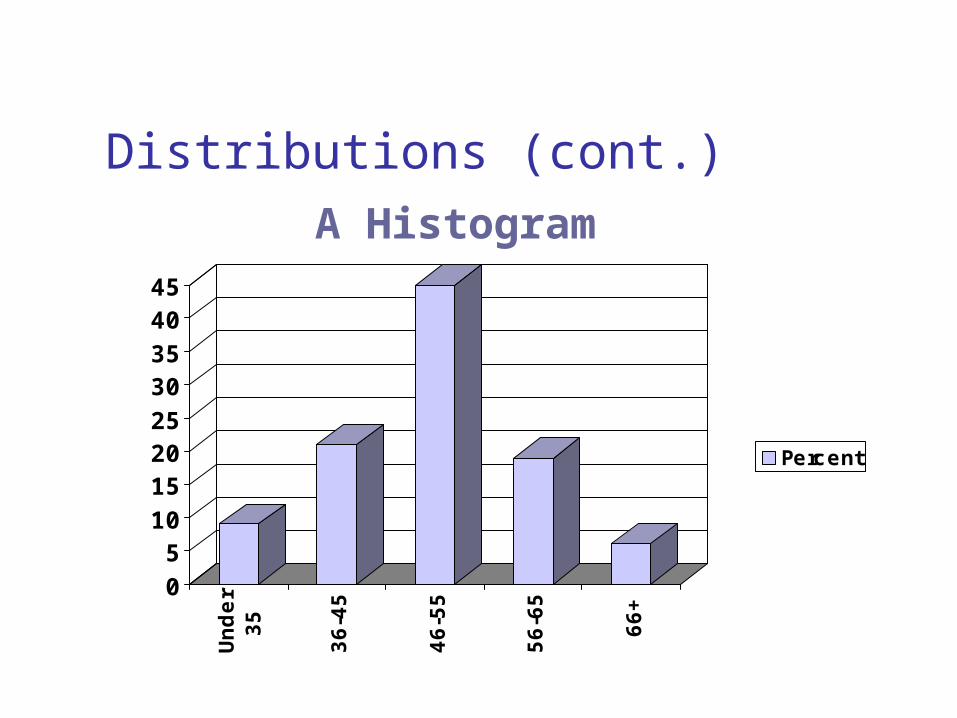
CategoryCategory PercentPercentUnder 35 9%36-45 2146-55 4556-65 1966+ 6
A Frequency Distribution A Frequency Distribution TableTable
Distributions (cont.)
05
1015202530354045
Under
35
36-4
5
46-5
5
56-6
5
66+
Percent
A Histogram
Distributions (cont.)
An estimate of the “center” of a distribution
Three different types of estimates:•Mean
•Median
•Mode
Central Tendency
The most commonly used method of describing central tendency.
One basically totals all the results and then divides by the number of units or “n” of the sample.
Example: The Exam 1[CBA 300] mean was determined by the sum of all the scores divided by the number of students taking the exam.
Mean
Lets take the set of scores: 15,20,21,20,36,15, 25,15
The Mean would be: 167/8=20.875
Working Example (Mean)
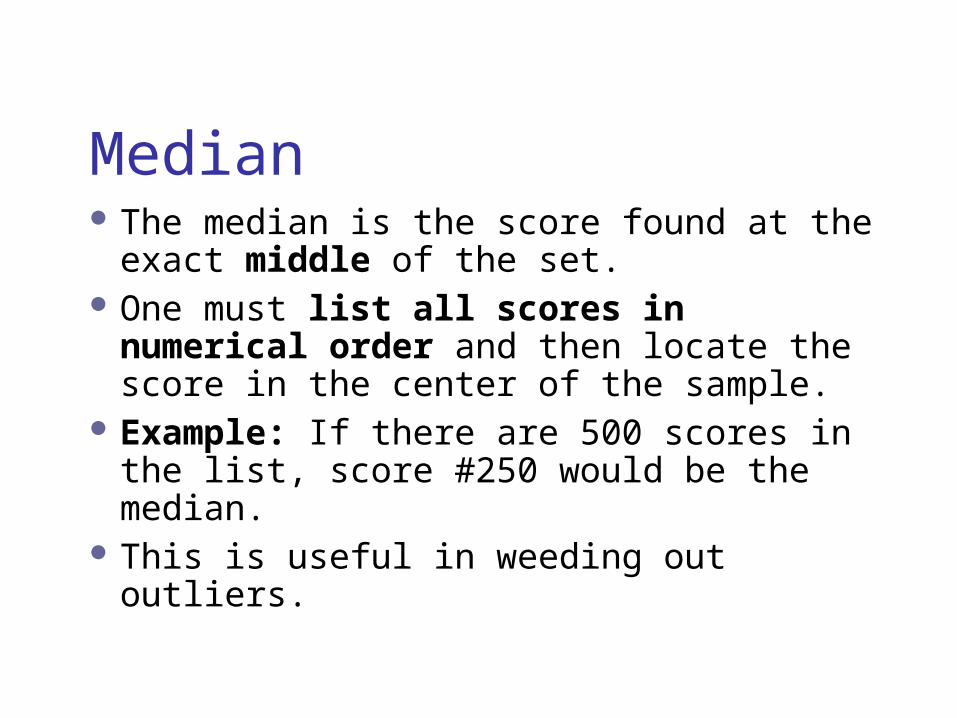
The median is the score found at the exact middle of the set.
One must list all scores in numerical order and then locate the score in the center of the sample.
Example: If there are 500 scores in the list, score #250 would be the median.
This is useful in weeding out outliers.
Median
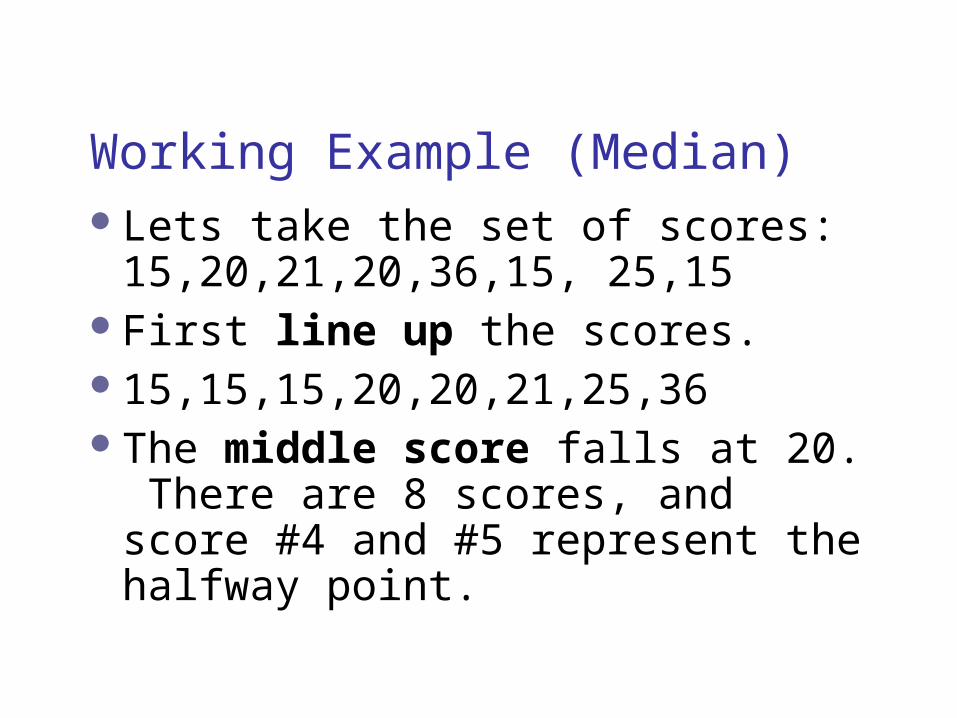
Lets take the set of scores: 15,20,21,20,36,15, 25,15
First line up the scores.15,15,15,20,20,21,25,36The middle score falls at 20.
There are 8 scores, and score #4 and #5 represent the halfway point.
Working Example (Median)
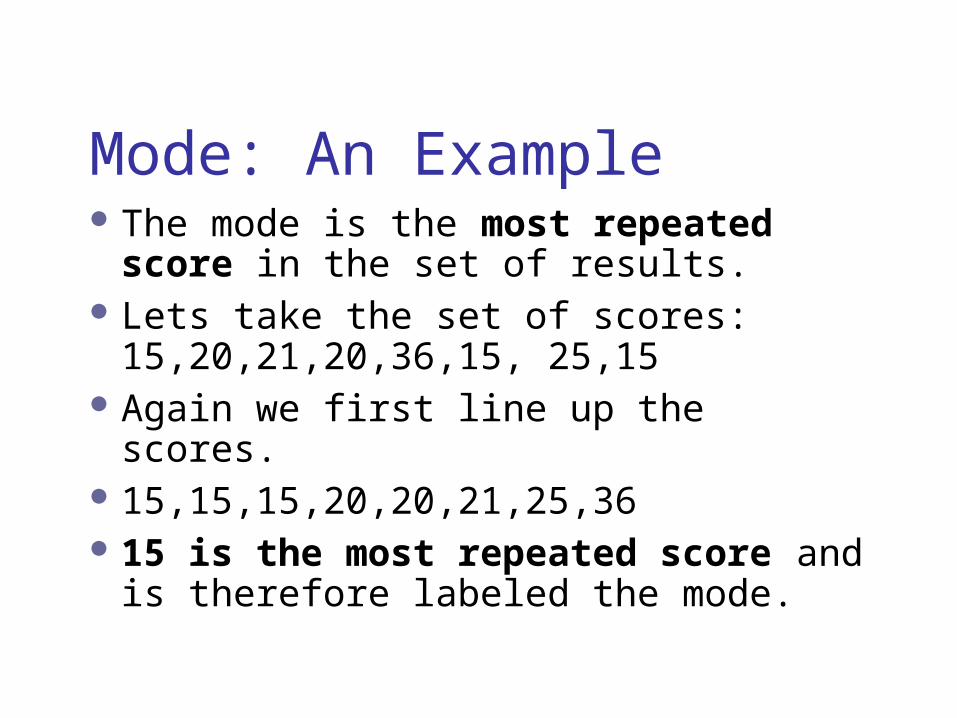
The mode is the most repeated score in the set of results.
Lets take the set of scores: 15,20,21,20,36,15, 25,15
Again we first line up the scores. 15,15,15,20,20,21,25,3615 is the most repeated score
and is therefore labeled the mode.
Mode: An Example
If the distribution is normal (i.e., bell-shaped), the mean, median, and mode are all equal.
In our analyses, we’ll use the mean.
Central Tendency
Two estimates types:•Range
•Standard deviationStandard deviation [sd] is
more accurate/detailed because an outlier can greatly extend the range.
Dispersion
The range is used to identify the highest and lowest scores.
Lets take the set of scores: 15,20,21,20,36,15, 25,15.
The range would be 15-36. This identifies the fact that 21 points separates the highest to the lowest score.
Range
The standard deviation is a value that shows the relation that individual scores have to the mean of the sample.
If scores are said to be standardized to a normal curve, there are several statistical manipulations that can be performed to analyze the data set.
Standard Deviation
Assumptions may be made about the percentage of scores as they deviate from the mean.
If scores are normally distributed, one can assume that approximately 69% of the scores in the sample fall within one std. deviation of the mean. Approximately 95% of the scores would then fall within two standard deviations of the mean.
Standard Dev. (con’t)
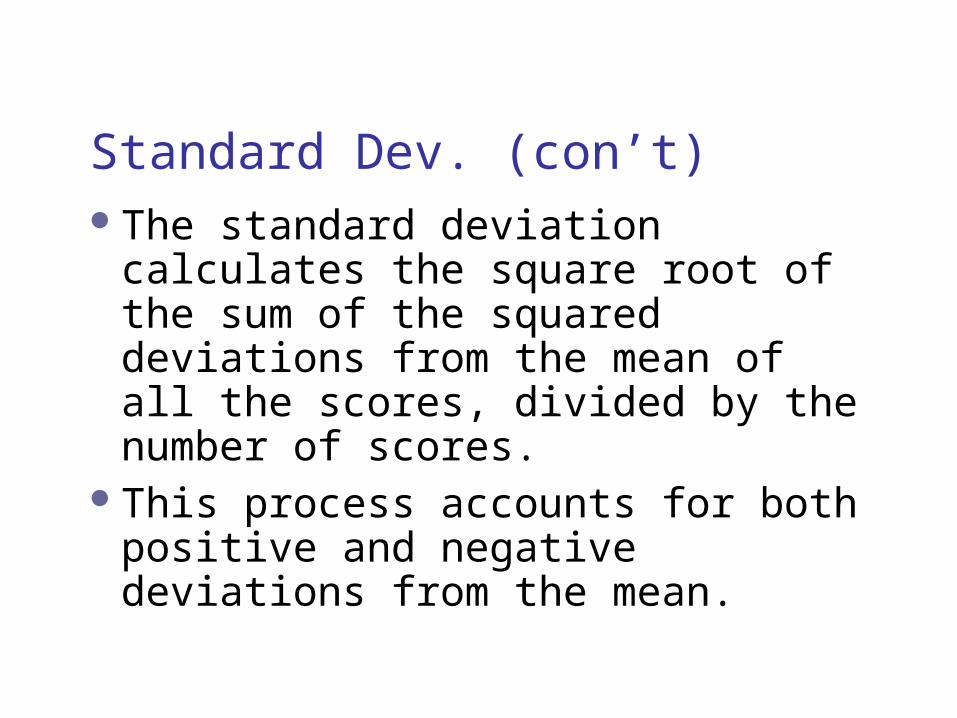
The standard deviation calculates the square root of the sum of the squared deviations from the mean of all the scores, divided by the number of scores.
This process accounts for both positive and negative deviations from the mean.
Standard Dev. (con’t)
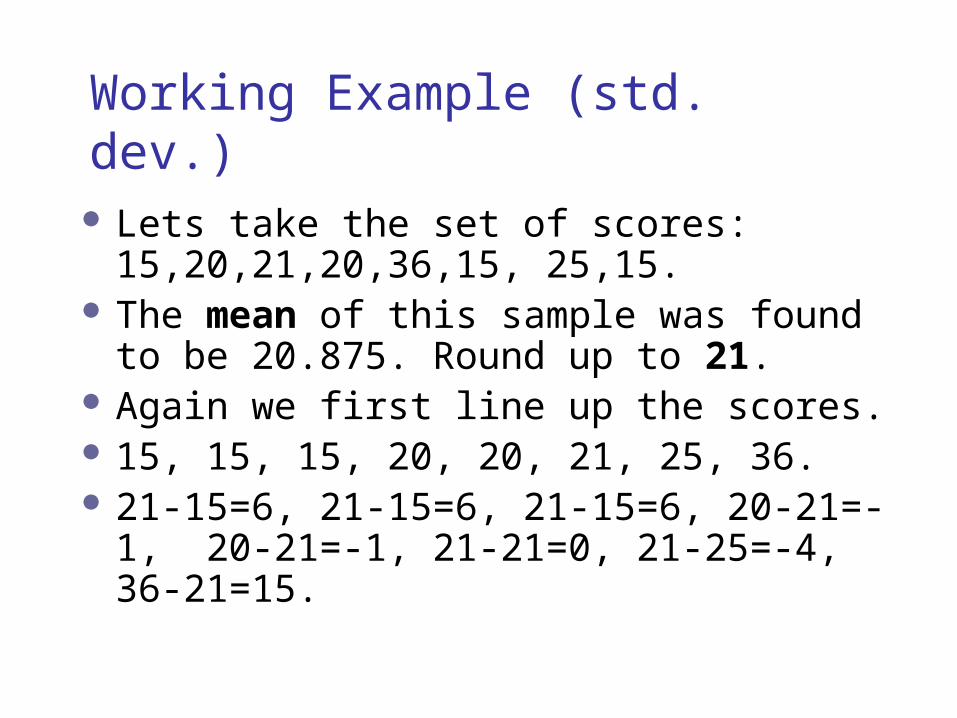
Lets take the set of scores: 15,20,21,20,36,15, 25,15.
The mean of this sample was found to be 20.875. Round up to 21.
Again we first line up the scores. 15, 15, 15, 20, 20, 21, 25, 36. 21-15=6, 21-15=6, 21-15=6, 20-21=-
1, 20-21=-1, 21-21=0, 21-25=-4, 36-21=15.
Working Example (std. dev.)
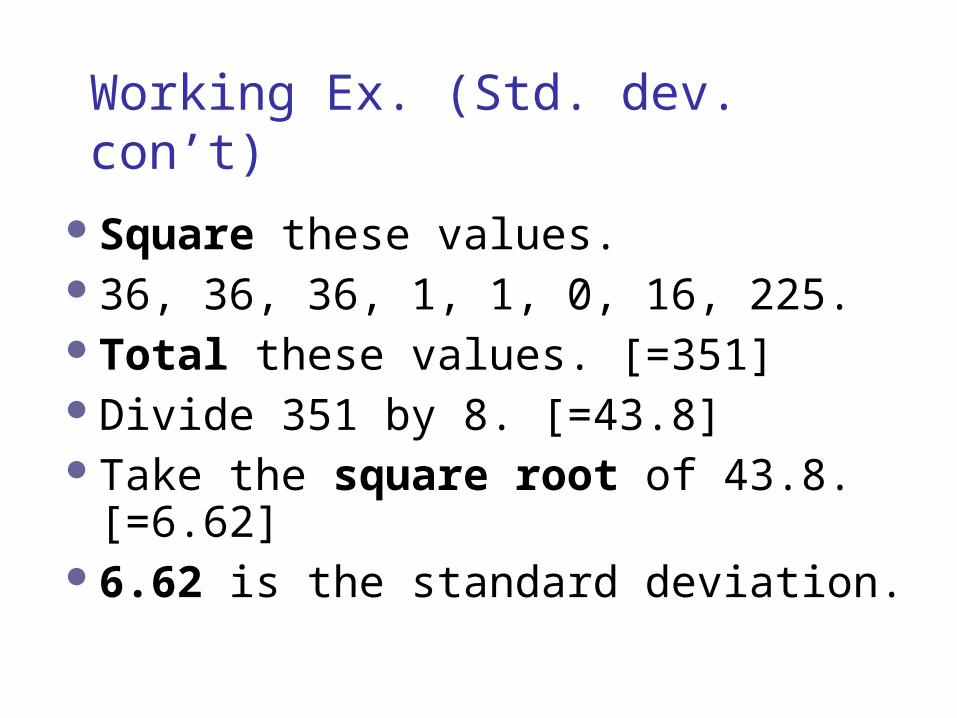
Square these values.36, 36, 36, 1, 1, 0, 16, 225.Total these values. [=351]Divide 351 by 8. [=43.8]Take the square root of 43.8.
[=6.62]6.62 is the standard deviation.
Working Ex. (Std. dev. con’t)
Statistics IntroStatistics Intro
Hopefully, nothing ‘new.’