Embed Size (px)
DESCRIPTION
Measures of Central Tendency, Dispersion, IQR and Standard Deviation. How do we describe data using statistical measures?. M2 Unit 4: Day 1. Statistics: numerical values used to summarize and compare sets of data. - PowerPoint PPT Presentation
Citation preview
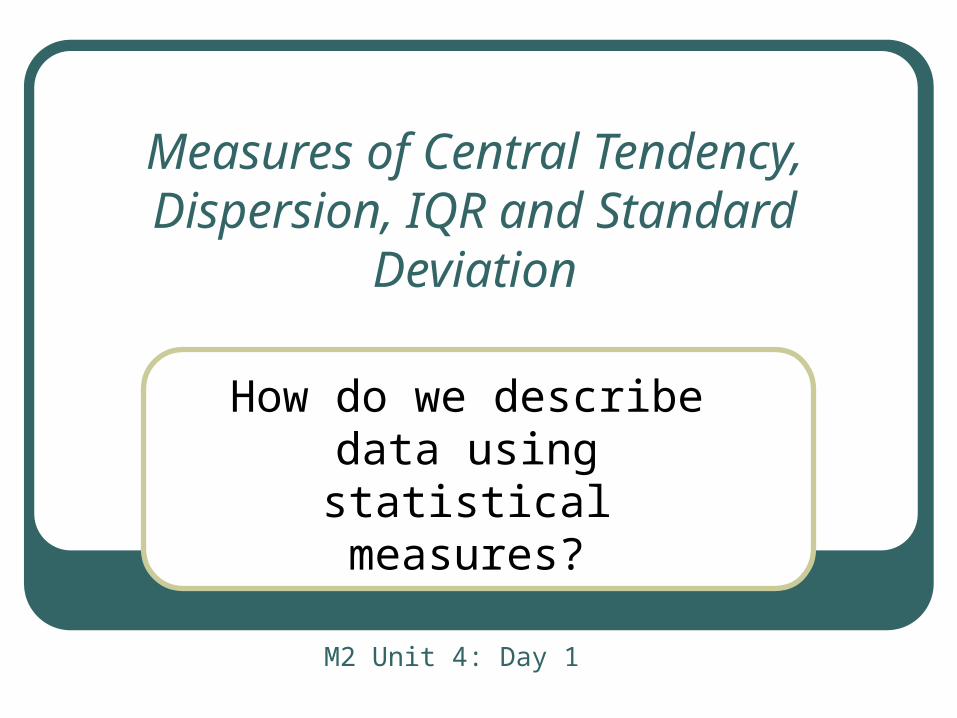
Measures of Central Tendency, Dispersion, IQR and Standard
Deviation
How do we describe data using statistical measures?
M2 Unit 4: Day 1
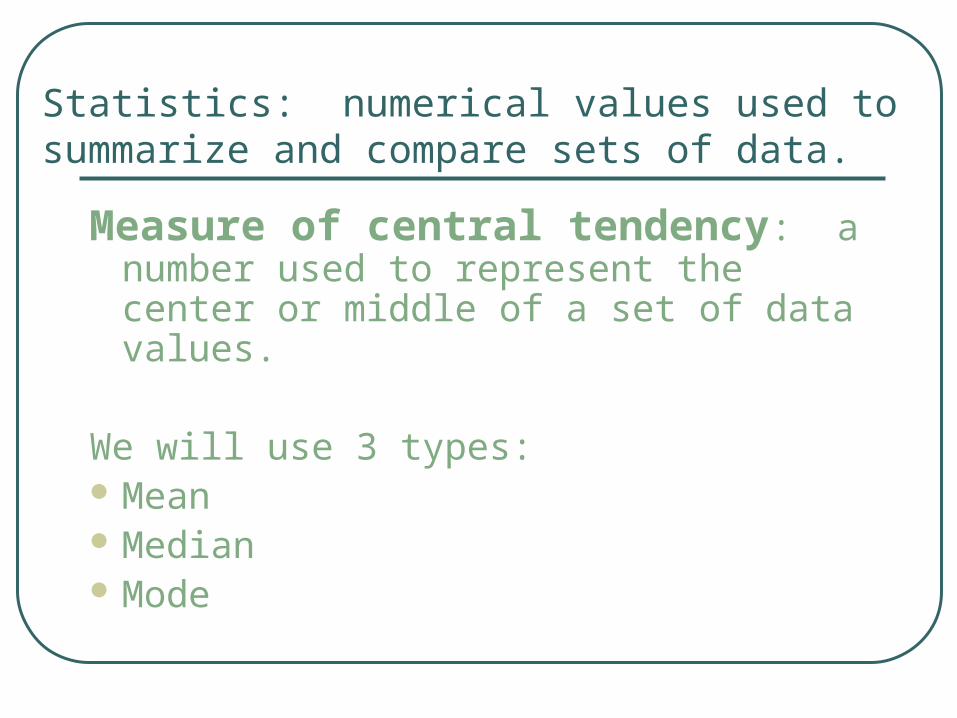
Statistics: numerical values used to summarize and compare sets of data.
Measure of central tendency: a number used to represent the center or middle of a set of data values.
We will use 3 types: Mean Median Mode
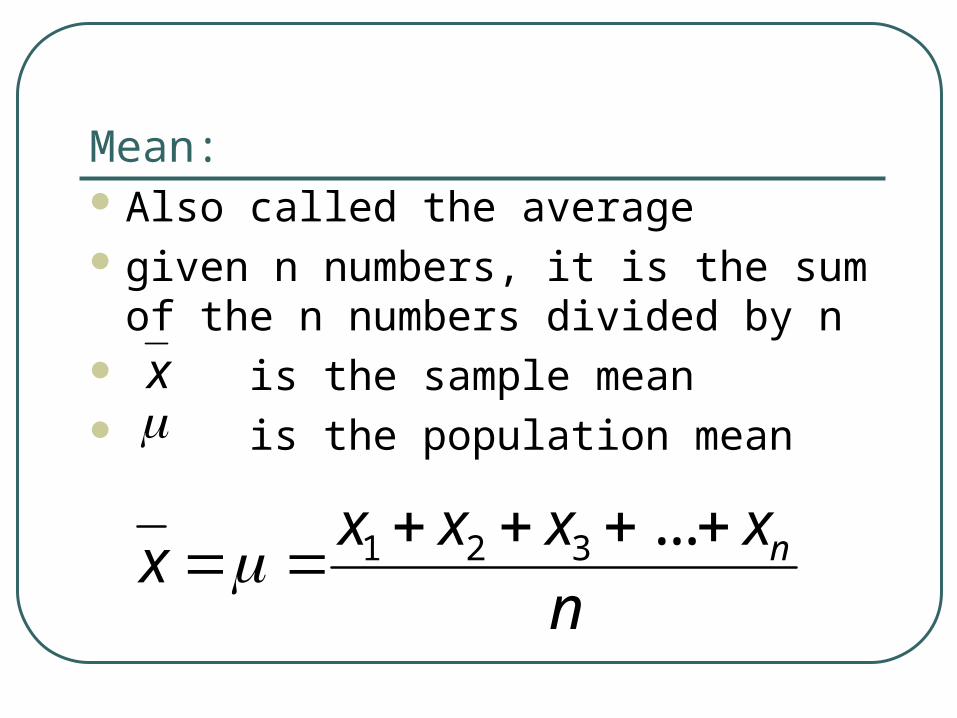
Also called the average given n numbers, it is the sum of the n
numbers divided by n is the sample mean is the population mean
Mean:
1 2 3 ... nx x x xx
n
x
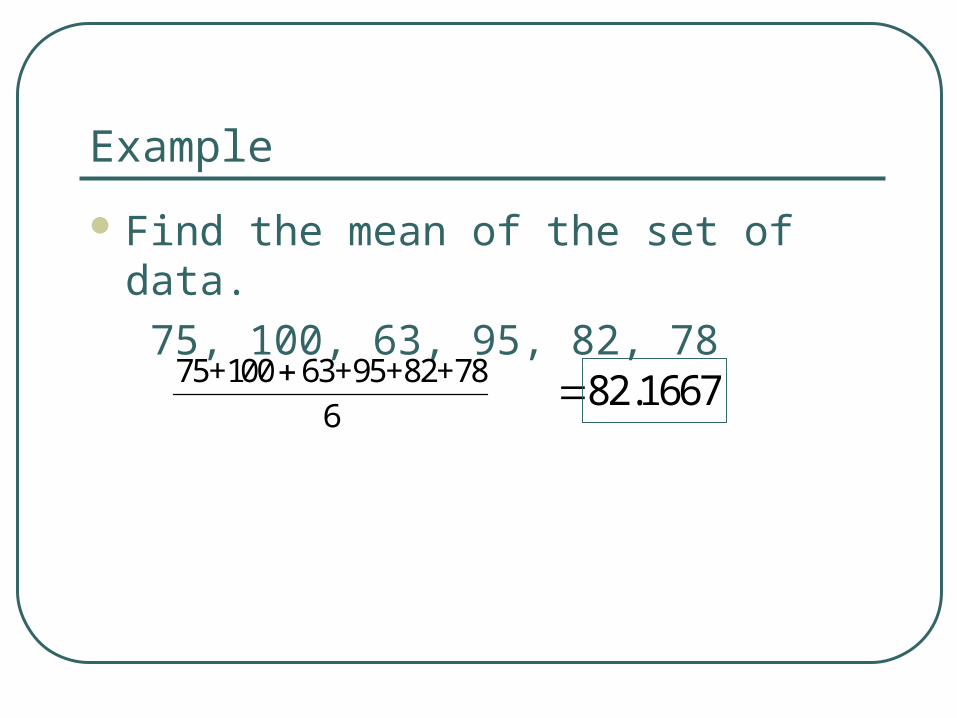
Example
Find the mean of the set of data.
75, 100, 63, 95, 82, 78
75+100 63+95+82+78
6
82.1667
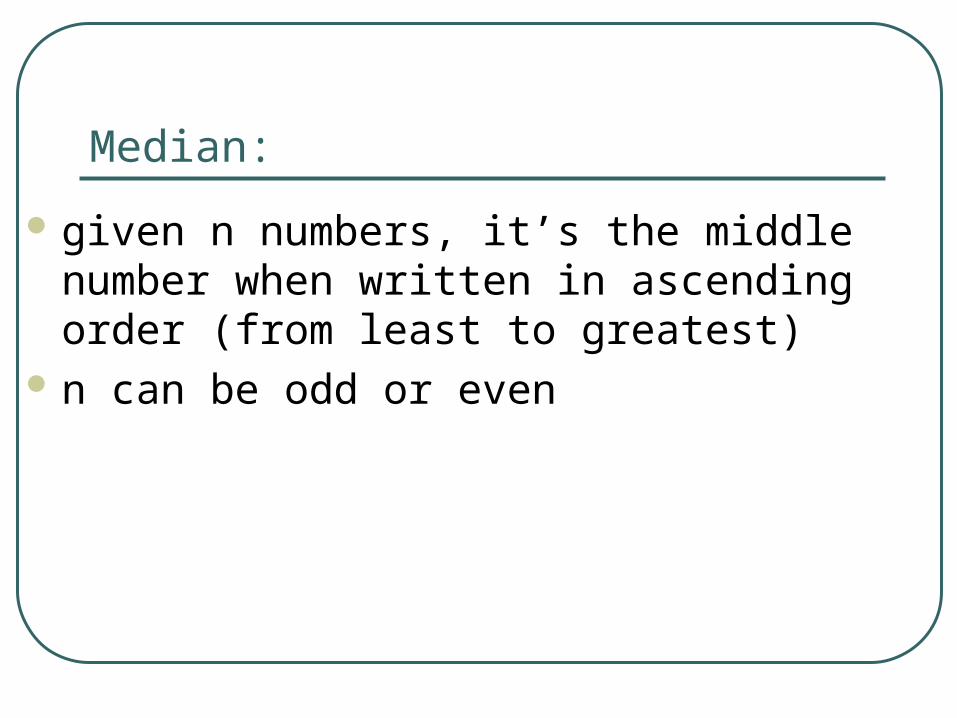
Median:
given n numbers, it’s the middle number when written in ascending order (from least to greatest)
n can be odd or even
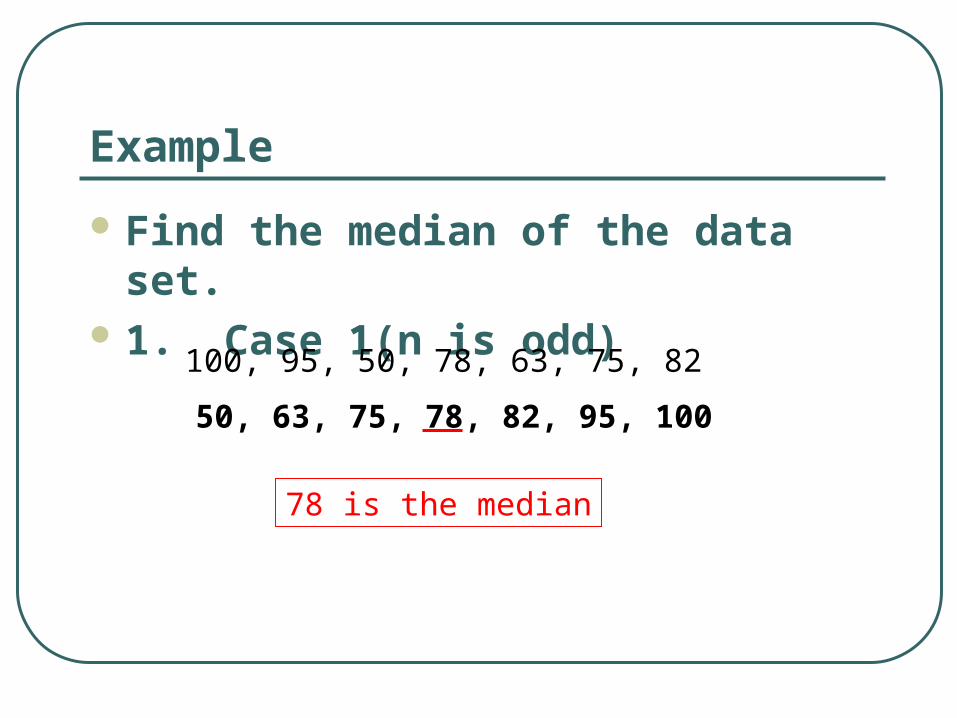
Example
Find the median of the data set. 1. Case 1(n is odd)
50, 63, 75, 78, 82, 95, 100
100, 95, 50, 78, 63, 75, 82
78 is the median
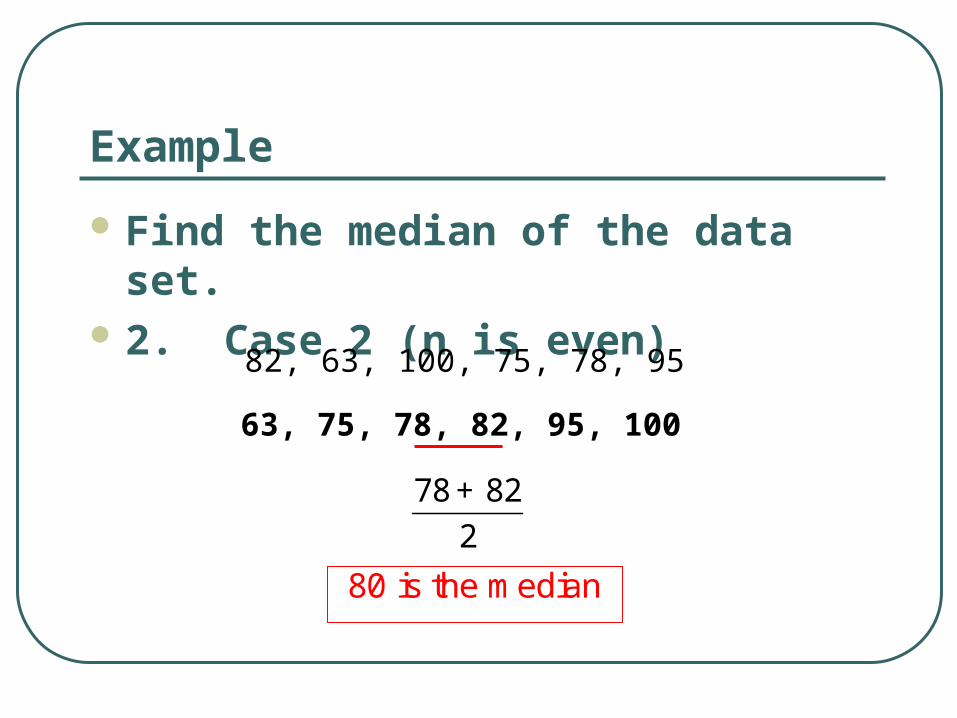
Example
Find the median of the data set. 2. Case 2 (n is even)
63, 75, 78, 82, 95, 100
82, 63, 100, 75, 78, 95
78 82
2
+
80 is the median
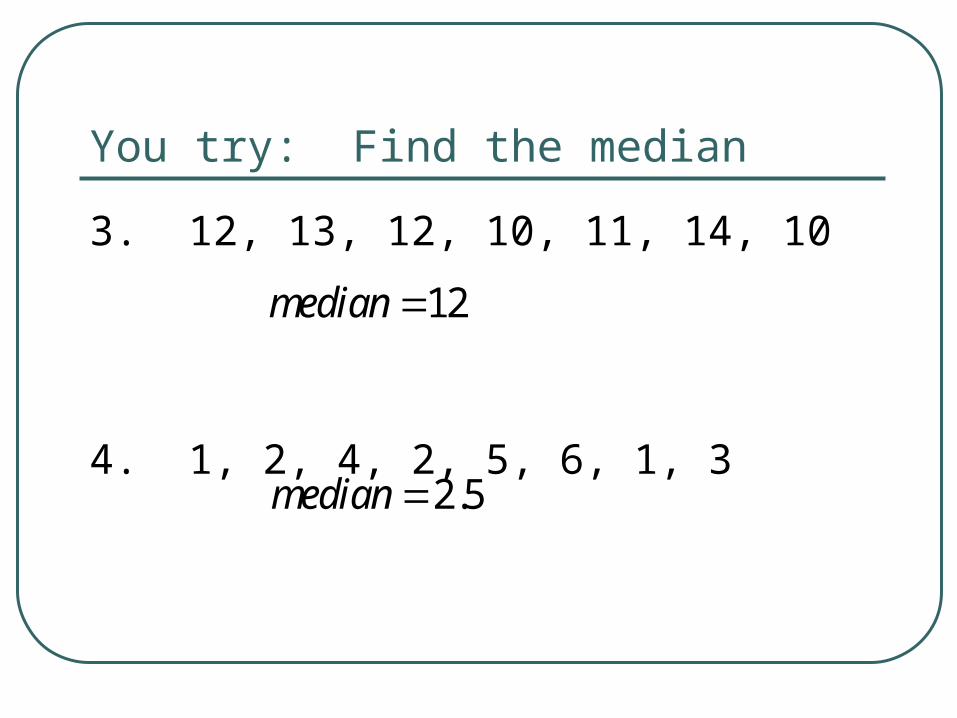
You try: Find the median
3. 12, 13, 12, 10, 11, 14, 10
4. 1, 2, 4, 2, 5, 6, 1, 3
12median
2.5median
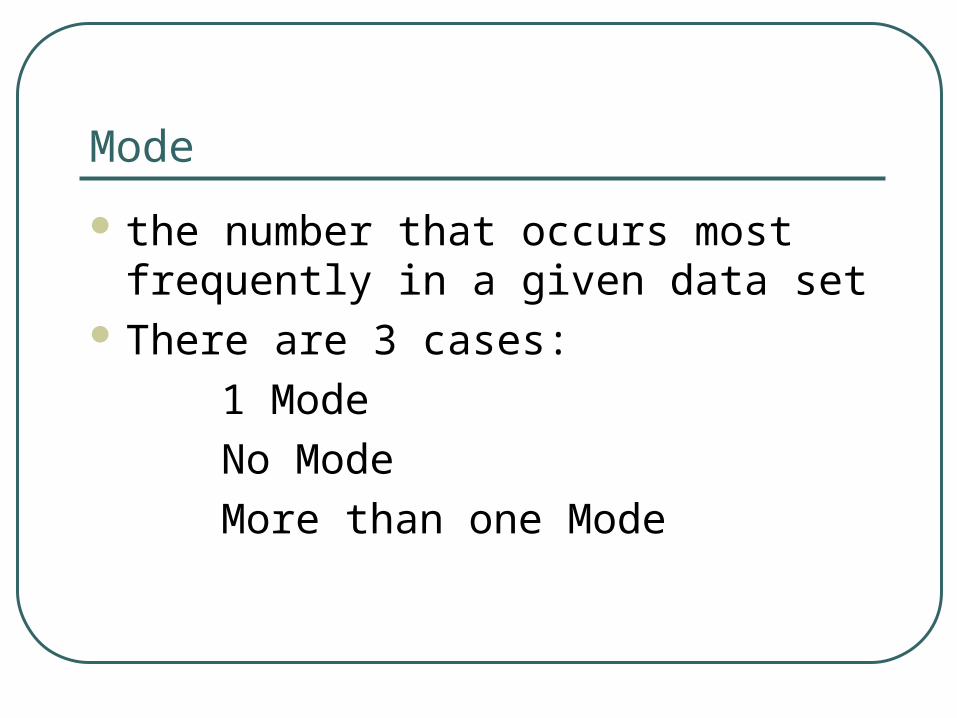
Mode
the number that occurs most frequently in a given data set
There are 3 cases:
1 Mode
No Mode
More than one Mode
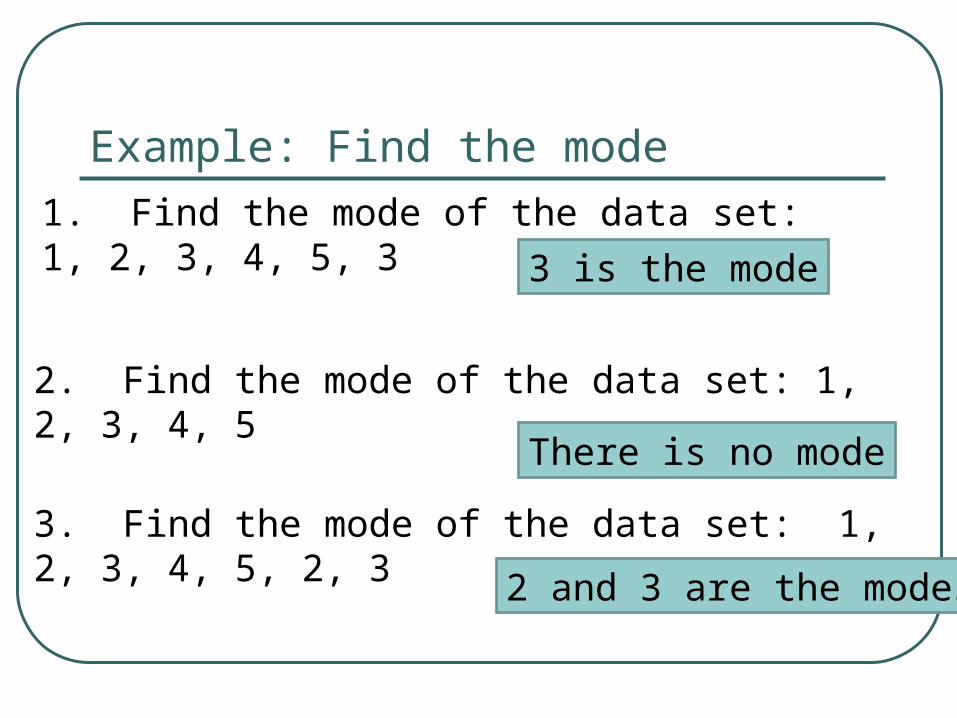
Example: Find the mode1. Find the mode of the data set: 1, 2, 3, 4, 5, 3
2. Find the mode of the data set: 1, 2, 3, 4, 5
3. Find the mode of the data set: 1, 2, 3, 4, 5, 2, 3
3 is the mode
There is no mode
2 and 3 are the modes
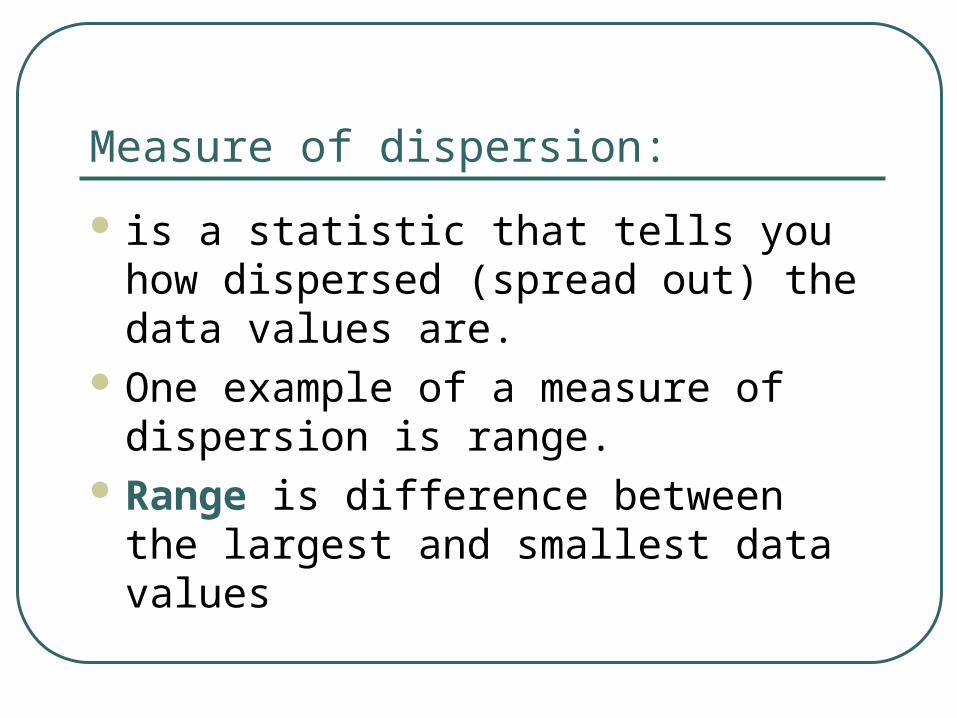
Measure of dispersion:
is a statistic that tells you how dispersed (spread out) the data values are.
One example of a measure of dispersion is range.
Range is difference between the largest and smallest data values
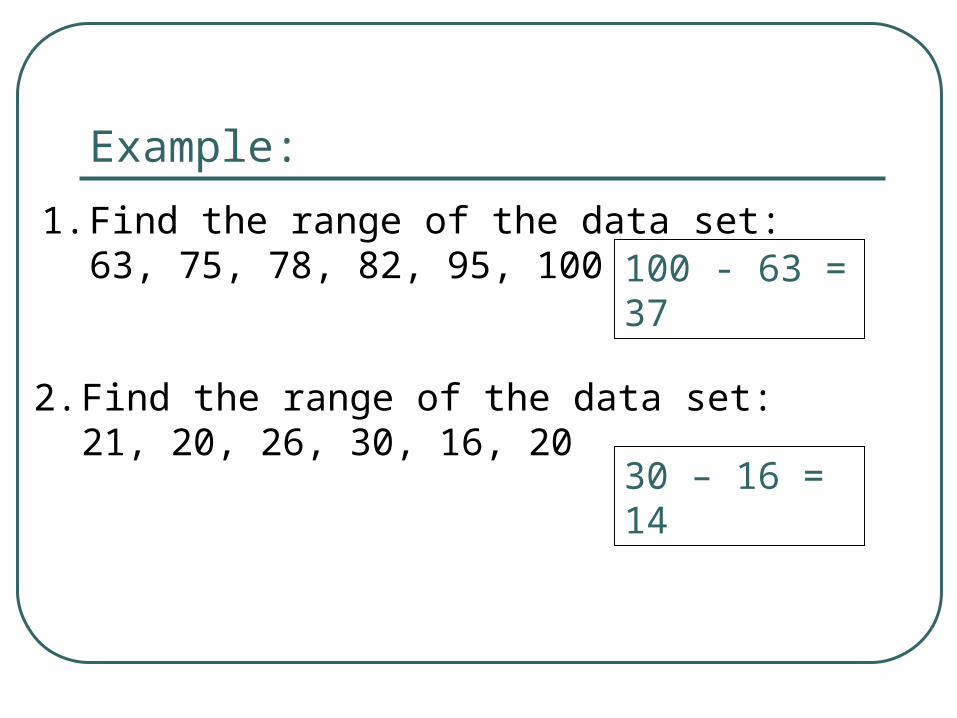
Example:
1. Find the range of the data set: 63, 75, 78, 82, 95, 100 100 - 63 = 37
2. Find the range of the data set: 21, 20, 26, 30, 16, 20
30 – 16 = 14
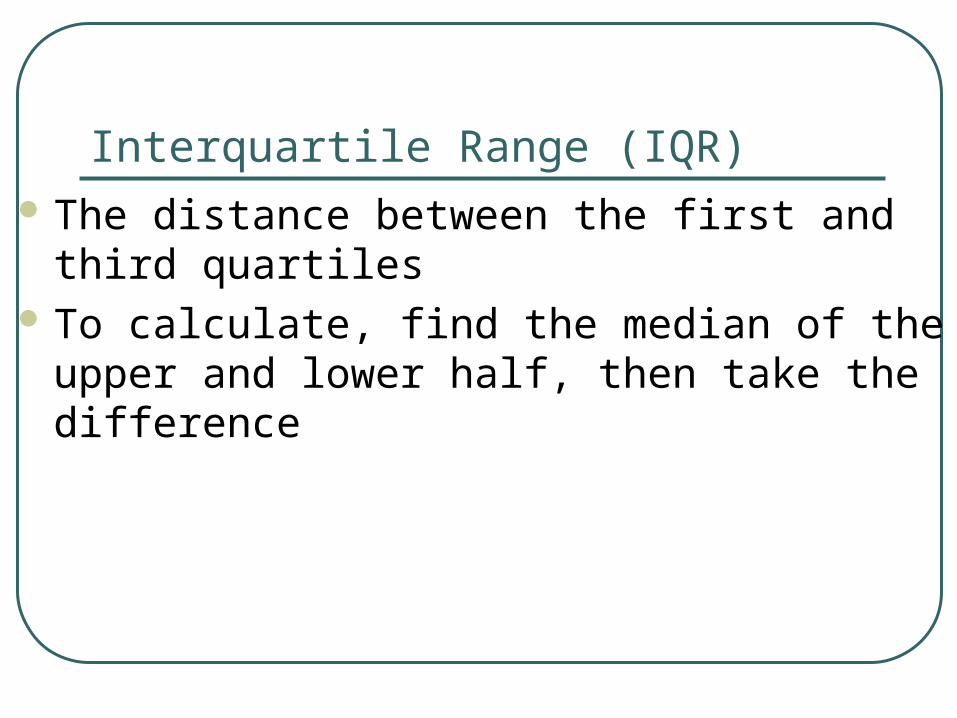
Interquartile Range (IQR) The distance between the first and third quartiles To calculate, find the median of the upper and
lower half, then take the difference
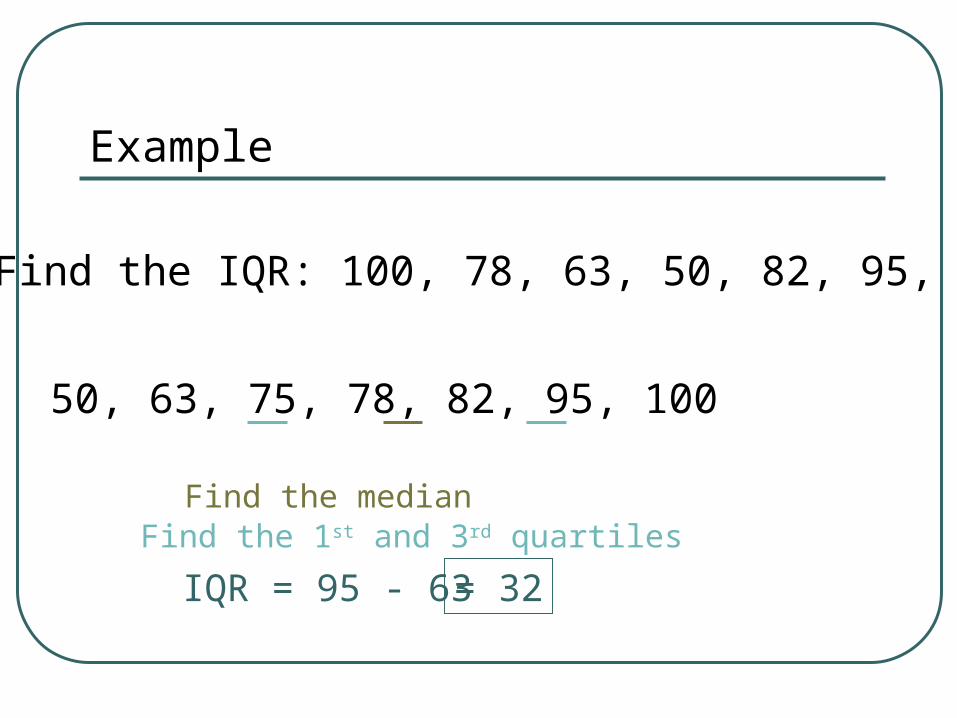
Example
50, 63, 75, 78, 82, 95, 100
Find the medianFind the 1st and 3rd quartiles
IQR = 95 - 63 = 32
1. Find the IQR: 100, 78, 63, 50, 82, 95, 75
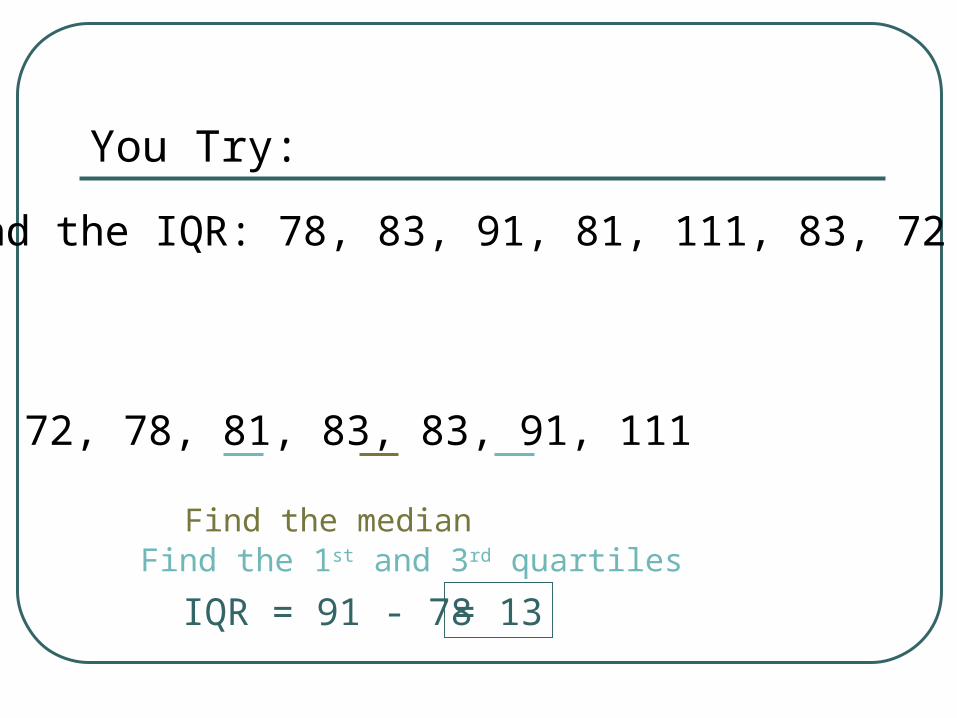
You Try:
72, 78, 81, 83, 83, 91, 111
Find the medianFind the 1st and 3rd quartiles
IQR = 91 - 78 = 13
Find the IQR: 78, 83, 91, 81, 111, 83, 72
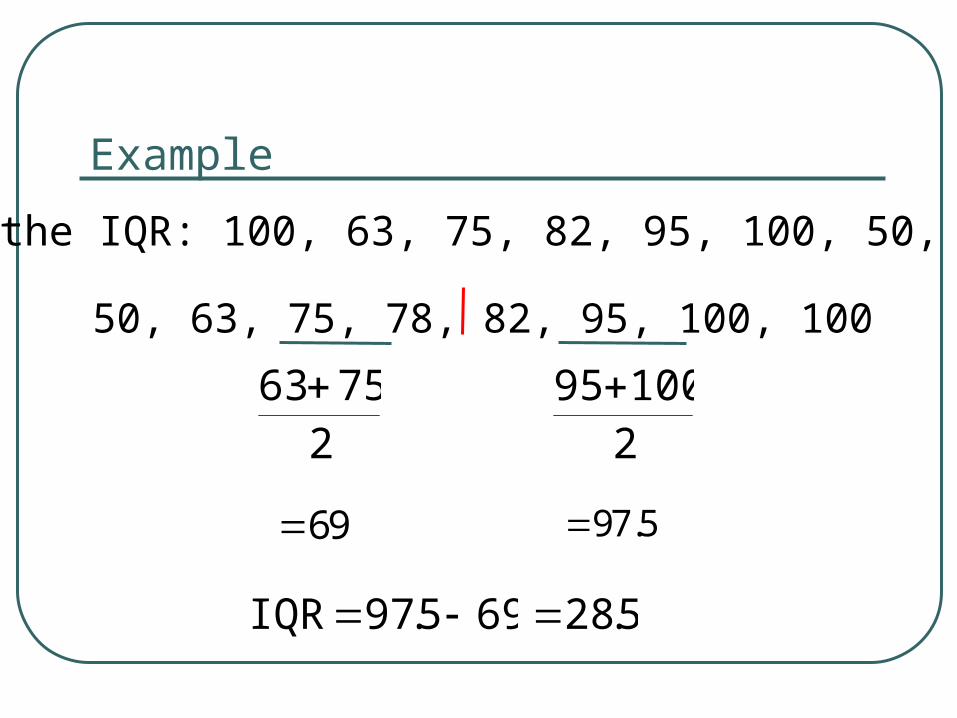
Example
50, 63, 75, 78, 82, 95, 100, 100
IQR 97.5 69
28.5
63 752
95 1002
Find the IQR: 100, 63, 75, 82, 95, 100, 50, 78
69 97.5
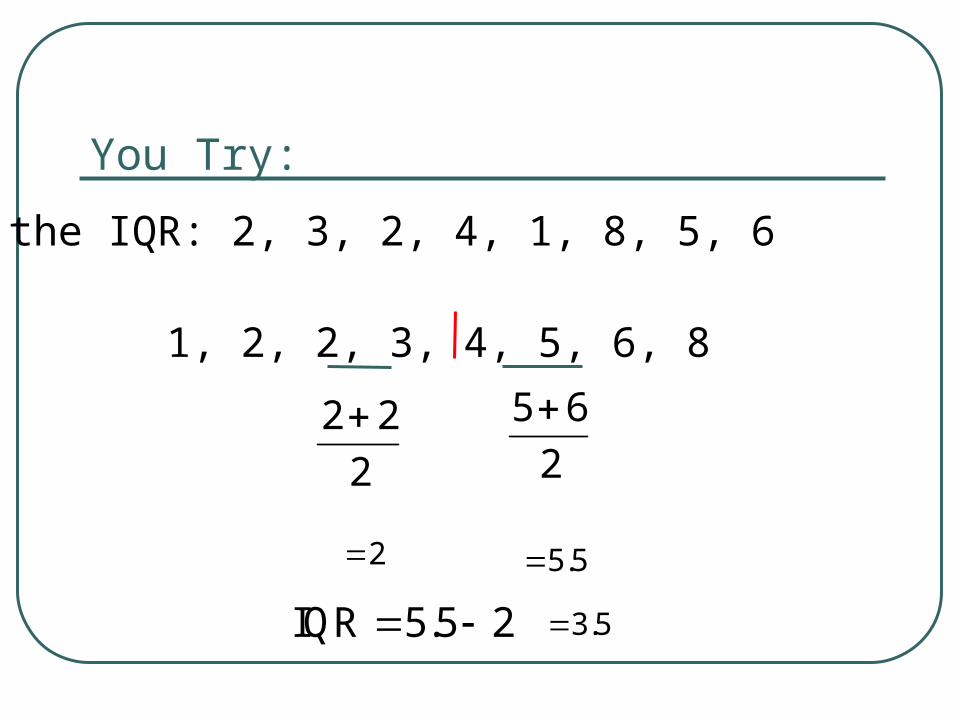
You Try:
1, 2, 2, 3, 4, 5, 6, 8
IQR 5.5 2 3.5
5 6
2
2 2
2
Find the IQR: 2, 3, 2, 4, 1, 8, 5, 6
2 5.5
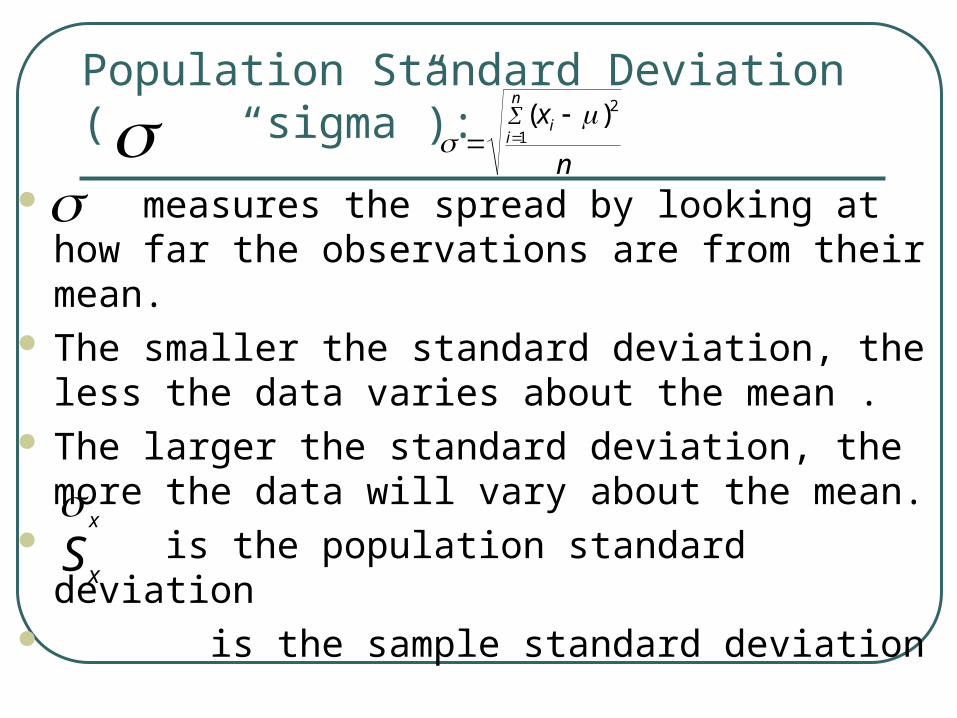
Population Standard Deviation( “sigma”):
measures the spread by looking at how far the
observations are from their mean. The smaller the standard deviation, the less the data
varies about the mean . The larger the standard deviation, the more the data
will vary about the mean. is the population standard deviation is the sample standard deviation
(xi )2
i1
n
n
xxS
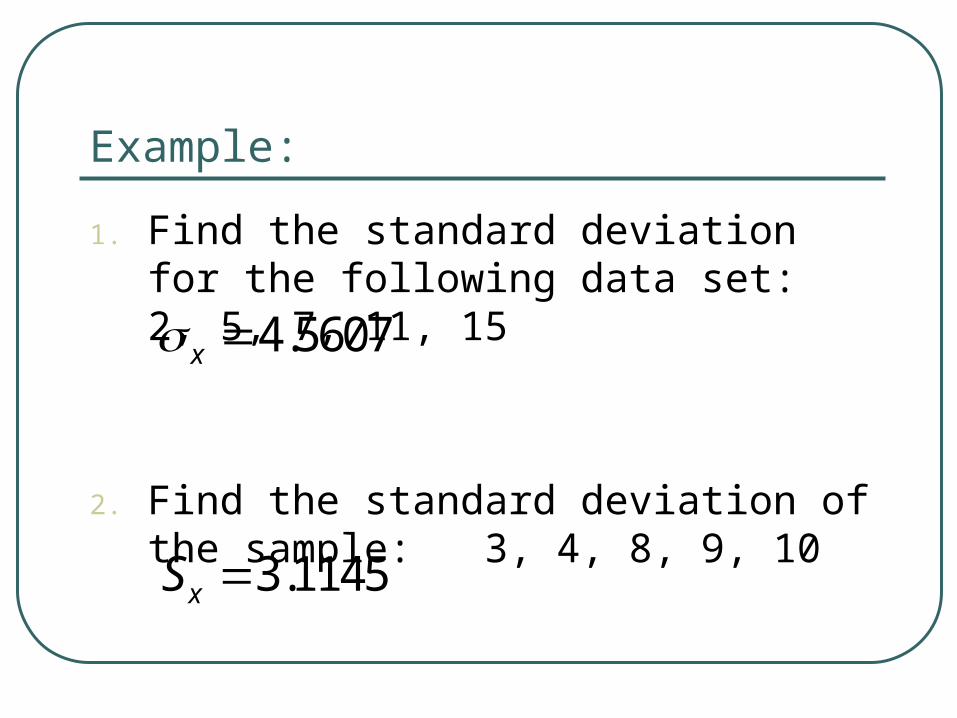
Example:
1. Find the standard deviation for the following data set: 2, 5, 7, 11, 15
2. Find the standard deviation of the sample: 3, 4, 8, 9, 10
4.5607x
3.1145xS
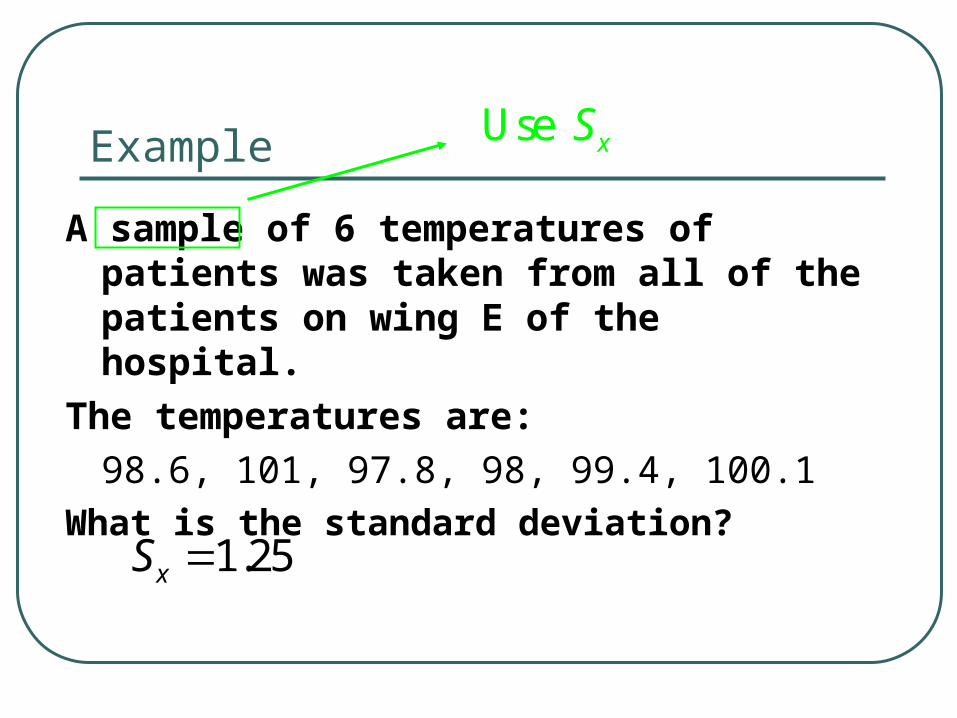
Example
A sample of 6 temperatures of patients was taken from all of the patients on wing E of the hospital.
The temperatures are:
98.6, 101, 97.8, 98, 99.4, 100.1
What is the standard deviation?
1.25xS
Use xS
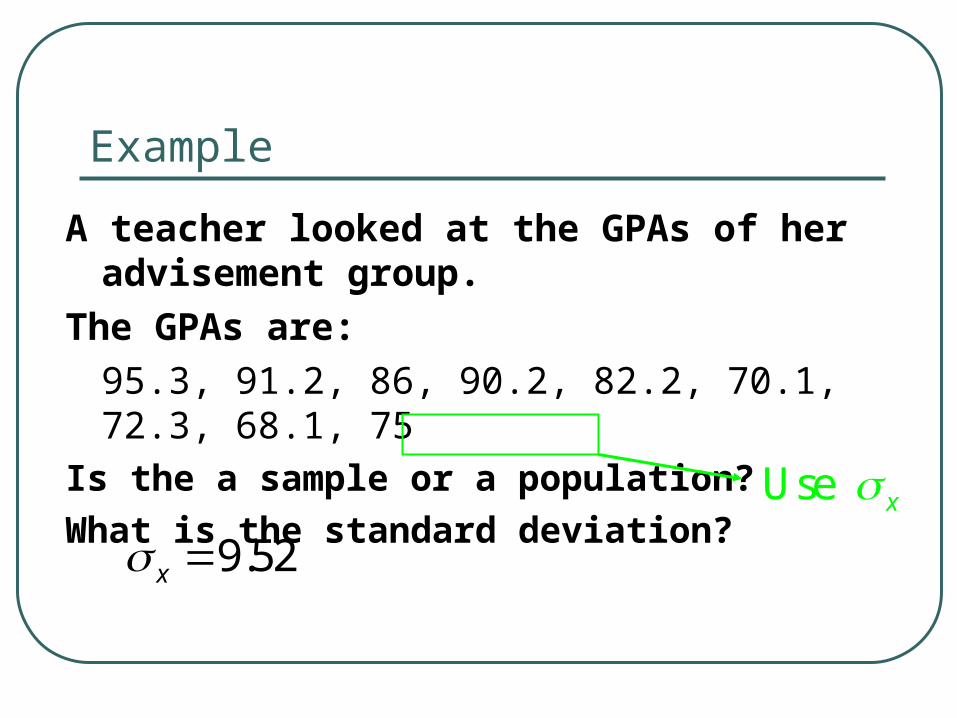
Example
A teacher looked at the GPAs of her advisement group.
The GPAs are:
95.3, 91.2, 86, 90.2, 82.2, 70.1, 72.3, 68.1, 75
Is the a sample or a population?
What is the standard deviation?
9.52x
Use x
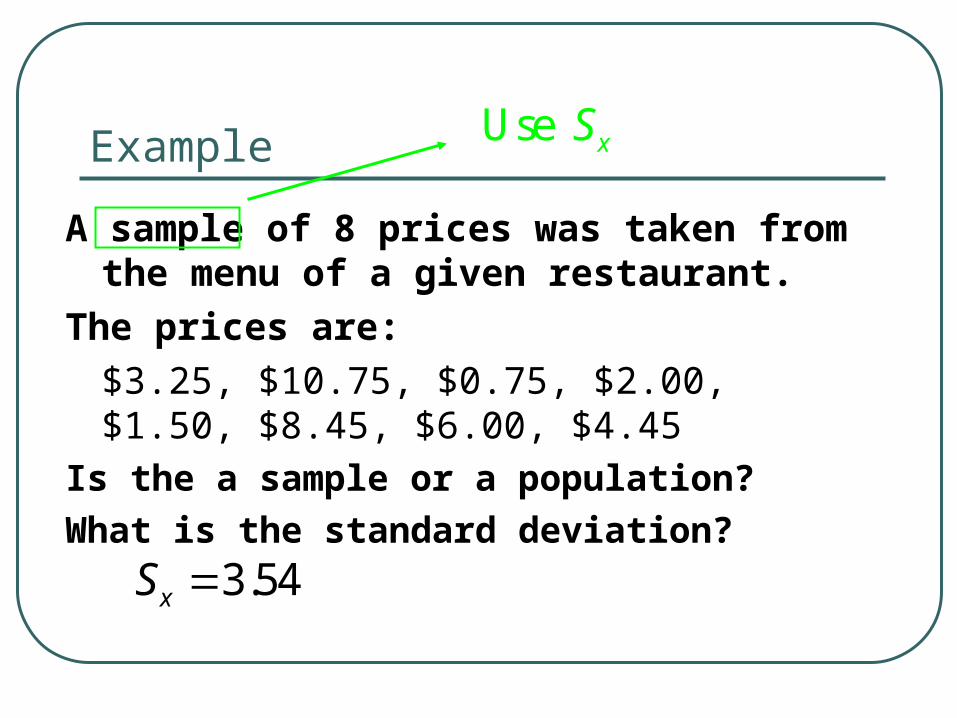
Example
A sample of 8 prices was taken from the menu of a given restaurant.
The prices are:
$3.25, $10.75, $0.75, $2.00, $1.50, $8.45, $6.00, $4.45
Is the a sample or a population?
What is the standard deviation?
3.54xS
Use xS
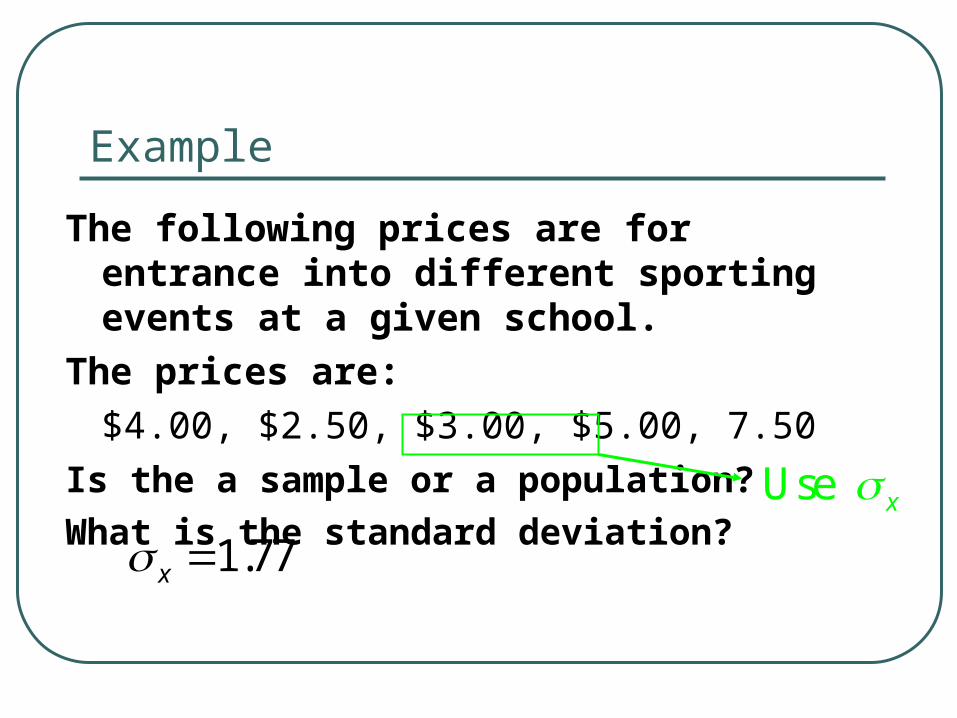
Example
The following prices are for entrance into different sporting events at a given school.
The prices are:
$4.00, $2.50, $3.00, $5.00, 7.50
Is the a sample or a population?
What is the standard deviation?
1.77x
Use x
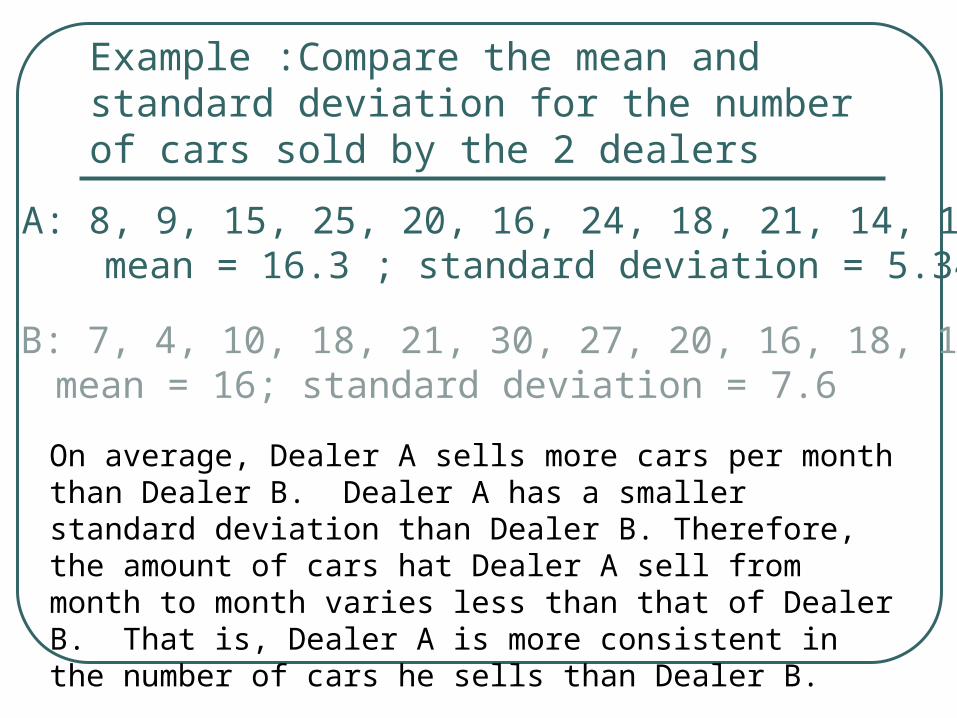
Example :Compare the mean and standard deviation for the number of cars sold by the 2 dealers
Dealer A: 8, 9, 15, 25, 20, 16, 24, 18, 21, 14, 16, 10 mean = 16.3 ; standard deviation = 5.34
Dealer B: 7, 4, 10, 18, 21, 30, 27, 20, 16, 18, 12, 9mean = 16; standard deviation = 7.6
On average, Dealer A sells more cars per month than Dealer B. Dealer A has a smaller standard deviation than Dealer B. Therefore, the amount of cars hat Dealer A sell from month to month varies less than that of Dealer B. That is, Dealer A is more consistent in the number of cars he sells than Dealer B.
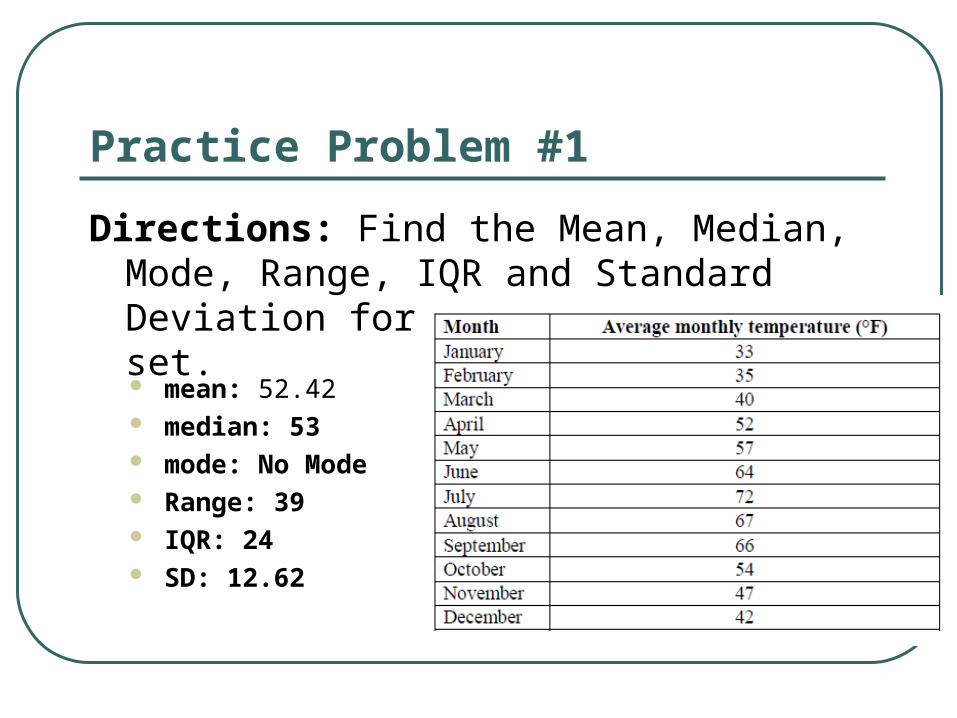
Practice Problem #1
Directions: Find the Mean, Median, Mode, Range, IQR and Standard Deviation for the following data set.
mean: 52.42 median: 53 mode: No Mode Range: 39 IQR: 24 SD: 12.62
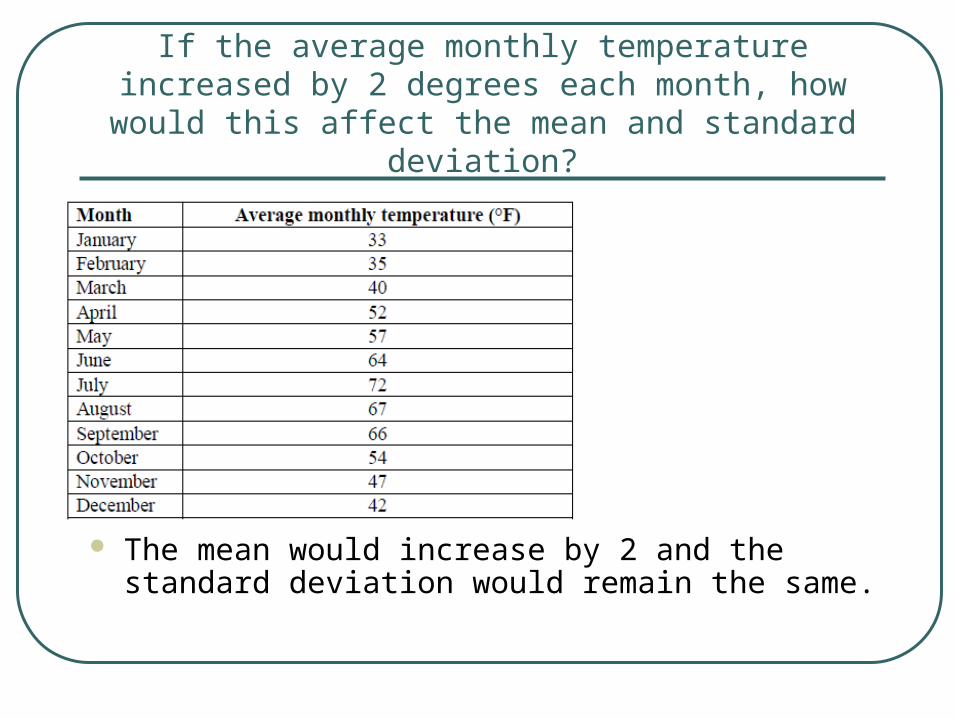
If the average monthly temperature increased by 2 degrees each month, how would this affect
the mean and standard deviation?
The mean would increase by 2 and the standard deviation would remain the same.
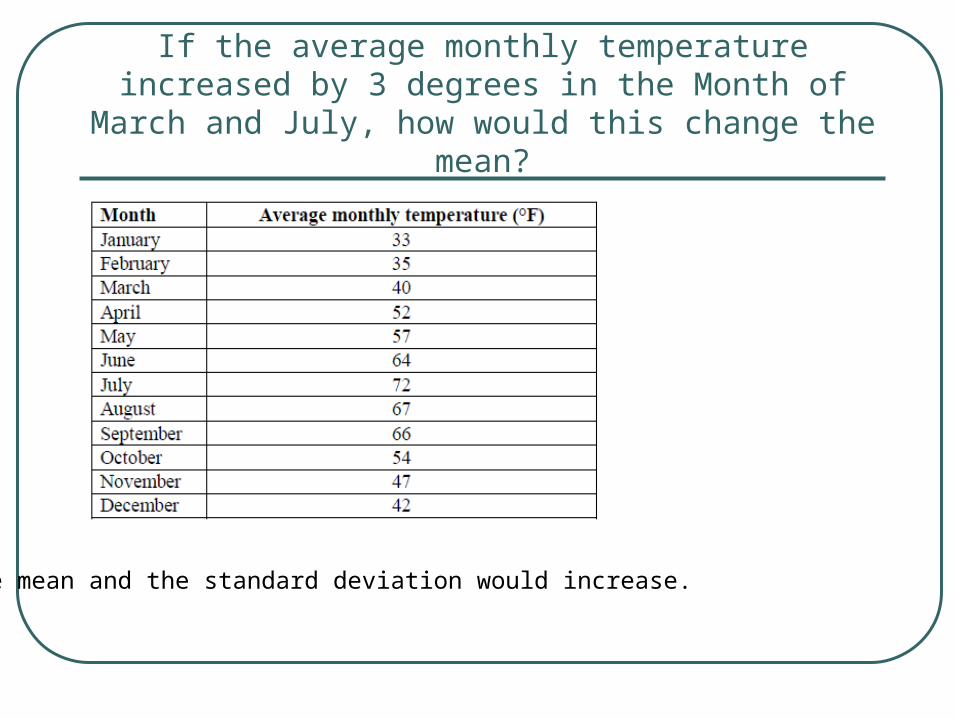
If the average monthly temperature increased by 3 degrees in the Month of March and July,
how would this change the mean?
The mean and the standard deviation would increase.
Practice Problem #2
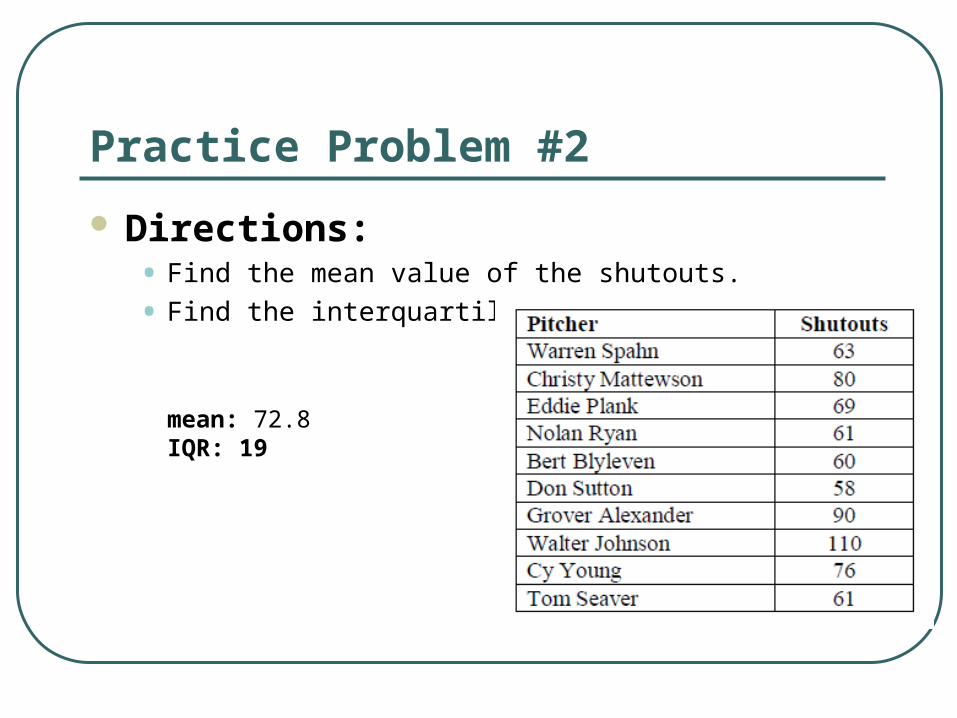
Directions: • Find the mean value of the shutouts.
• Find the interquartile range.
mean: 72.8IQR: 19
Practice Problem #3
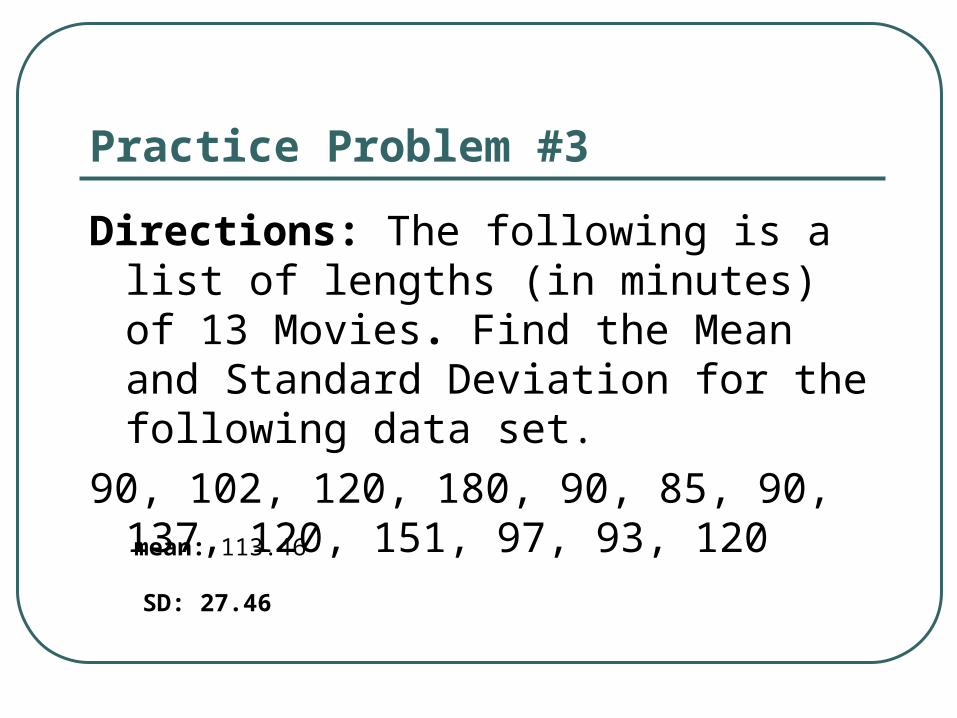
Directions: The following is a list of lengths (in minutes) of 13 Movies. Find the Mean and Standard Deviation for the following data set.
90, 102, 120, 180, 90, 85, 90, 137, 120, 151, 97, 93, 120
mean: 113.46
SD: 27.46
Practice Problems # 4
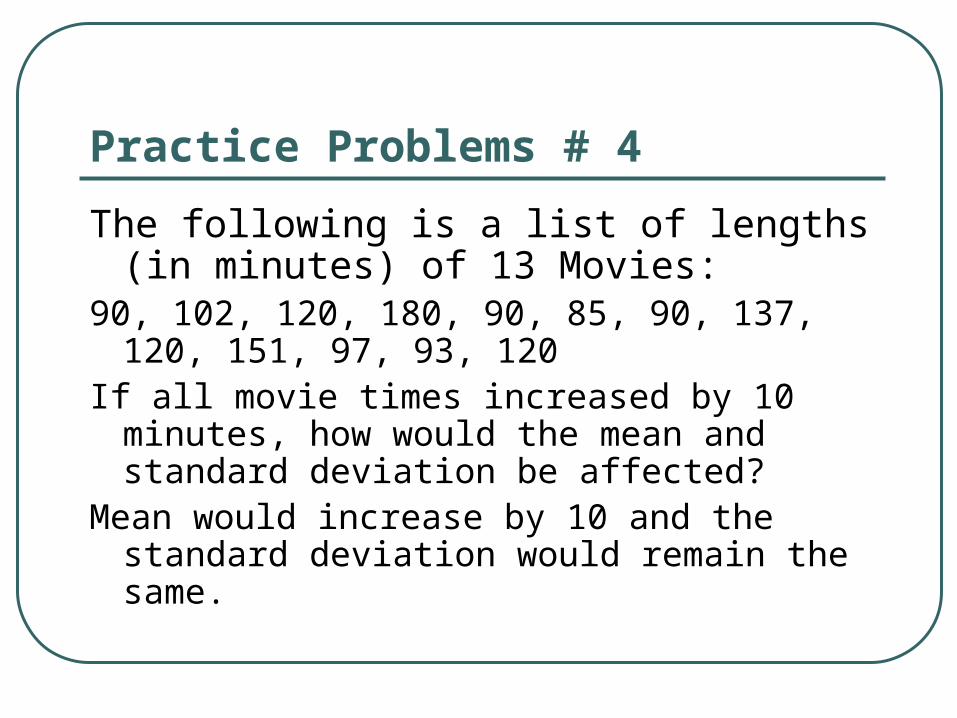
The following is a list of lengths (in minutes) of 13 Movies:
90, 102, 120, 180, 90, 85, 90, 137, 120, 151, 97, 93, 120
If all movie times increased by 10 minutes, how would the mean and standard deviation be affected?
Mean would increase by 10 and the standard deviation would remain the same.
Assignment:• Day 1 Handout
• Review packet