Embed Size (px)
DESCRIPTION
Statistics 1 Elementary Statistics for the Social Sciences (UC:CSU) - 3 units Ray Lim, PhD. BEH 1306F [email protected]. INTRODUCTION Statistics A set of mathematical procedures for organizing , summarizing, and interpreting information Population - PowerPoint PPT Presentation
Citation preview

Statistics 1 1
Statistics 1
Elementary Statistics Elementary Statistics
for the Social Sciences (UC:CSU) - 3 unitsfor the Social Sciences (UC:CSU) - 3 units
Ray Lim, PhD.
BEH 1306F

Statistics 1 2
INTRODUCTIONStatistics
A set of mathematical procedures for organizing , summarizing, and interpreting information
Population
A group of two or more individuals or things that share one or more common characteristics
Sample
A subgroup of two or more individuals or things from a population

Statistics 1 3
Representative Sample
· A subgroup of two or more individuals or things randomly and independently selected * from a population
· Randomly and independently selected means each member of the population has an equal opportunity of being included in the sample
Parameter
· Usually a numerical value, that describes a population.

Statistics 1 5
Statistic
A value, usually a numerical value that describes a sample.
Data
measurements or observations
Descriptive Statistics
Statistical procedures used to summarize, organize and simplify data.
Inferential Statistics
Techniques that allow us to study samples and then make generalization about the population from which they were selected.

Statistics 1 6
Sampling error
· The discrepency, or amount of error, that exists between a sample statistic and the corresponding population parameter
Variable
· A characteristic or condition that changes or has different values for different individuals
Constant
· A characteristic or condition that does not vary but is the same for every individual.

Statistics 1 7
Correlational Research: Observing naturally occurring phenomena
· Naturalistic observation
· Archival research
· Case histories
· Surveys
Correlational Research
–Is variable X associated with variable Y?
–Example: Is watching WWE related to aggressive behavior in children?
–How can we describe this relationship?
Statistics 1 8
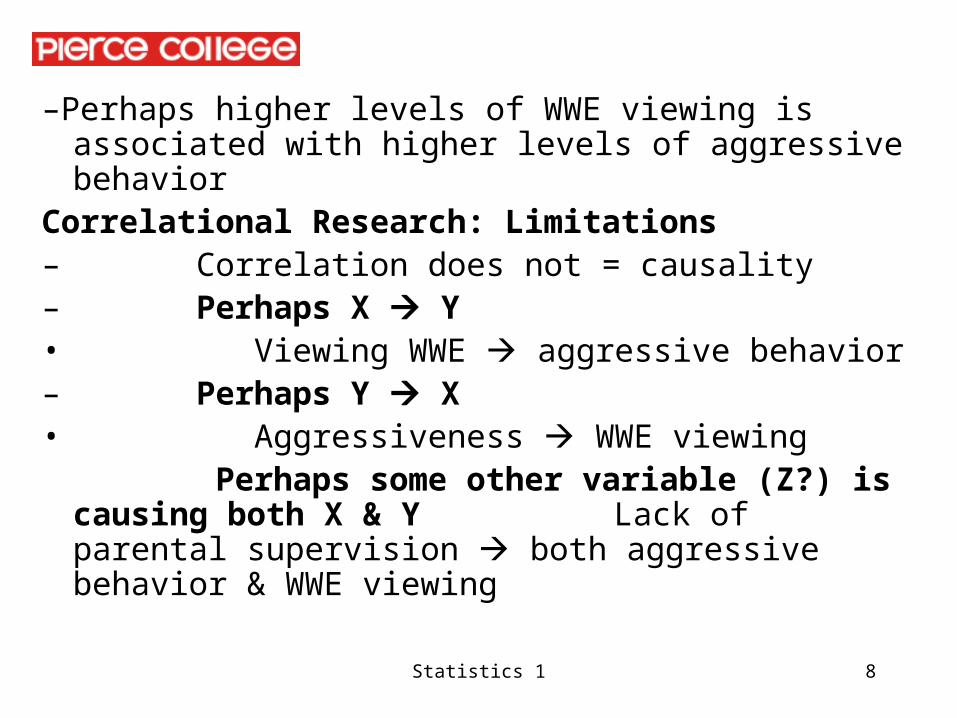
–Perhaps higher levels of WWE viewing is associated with higher levels of aggressive behavior
Correlational Research: Limitations– Correlation does not = causality– Perhaps X Y• Viewing WWE aggressive behavior– Perhaps Y X• Aggressiveness WWE viewing Perhaps some other variable (Z?) is causing
both X & Y Lack of parental supervision both aggressive behavior & WWE viewing

Statistics 1 9
Correlational Research: Advantages
– A good place to start & explore (especially if relevant theory is lacking)
– Often cheapest & easiest option
– Can look at more variables simultaneously / greater realism
Fewer ethical issues…

Statistics 1 10
Experimental Research: Manipulation & Measurement
– Independent (manipulated) variables
– Dependent (measured) variables
– Does manipulating IV “X” cause changes in DV “Y?”
– Example: Does assigning some children to watch WWE cause them to behave more aggressively than other children?

Statistics 1 11
Experimental Research: Analyzing causality
– Manipulation of IV
– Random assignment to treatments
– Control of extraneous variables
– Eliminating threats to validity
Experimenter bias, for example
• Affects treatments
• Affects measurements
Statistics 1 12
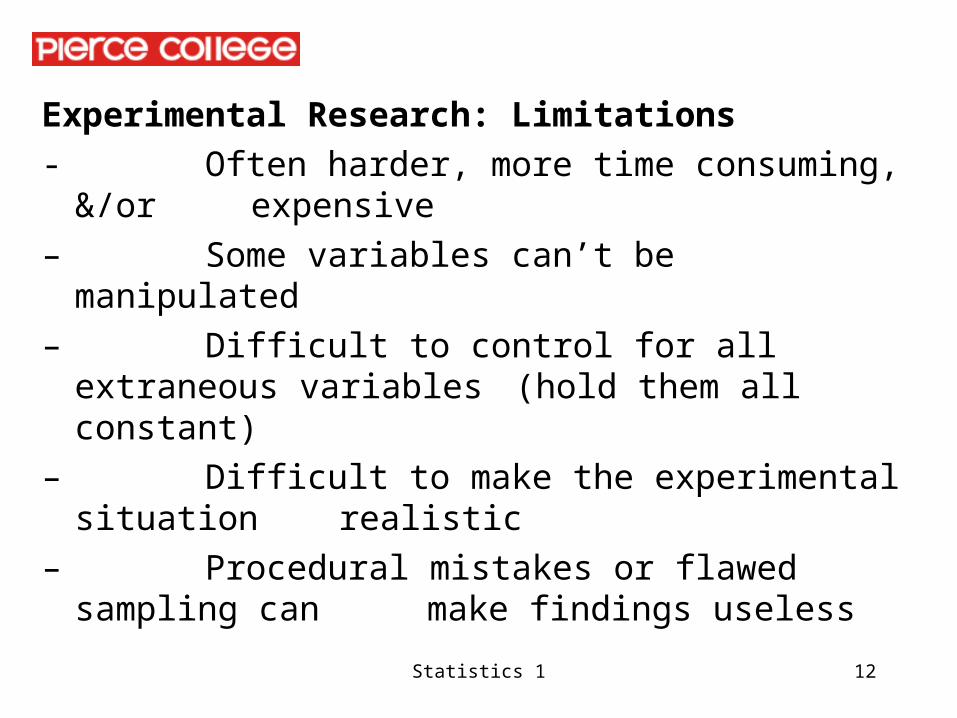
Experimental Research: Limitations
- Often harder, more time consuming, &/or expensive
– Some variables can’t be manipulated
– Difficult to control for all extraneous variables (hold them all constant)
– Difficult to make the experimental situation realistic
– Procedural mistakes or flawed sampling can make findings useless
Statistics 1 13
Greater ethical obligations• – Some variables shouldn’t be manipulated, or
only with great caution• Repeat as necessary to build, refine, or discard
theory • – Theories allow us to generate testable
hypotheses• – When hypotheses are supported by
evidence, the theory is considered the best explanation so far
• When hypotheses are not supported, the theory is refined or discarded

Statistics 1 15
Criteria for evaluating evidence
Observations must be
– Public
– Replicable
• Can be repeated by others using same procedures
– Reliable
• Consistent across measurements &/or observers

Statistics 1 17
Depends on the population you want your findings to apply to
• – to talk about a specific group like women, study women
• – to make statements about people in general, study samples representative of people in general
Random sampling of the population of interest is best, but often difficult to achieve

Statistics 1 18
Operational Definitions
– Defining a construct in terms of the operation(s) used to measure it
Ways to measure fear? attraction?
Poor operational definitions bad research / misleading results
– Problems with reliability of observations
– Problems with interpretation of results

Statistics 1 19
Independent variable
–The variable that is manipulated by the researcher. Independent variable consists of the antecedent condition that were manipulated prior to observing the dependent variable.
Dependent variable
–The variable that is observed in order to assess the effect of the treatment.

Statistics 1 20
Control condition
–Individuals do not receive experimental treatment.
Experimental condition
–Individuals receive experimental treatment.
Confounding variable
–An uncontrolled variable that is unintentionally allowed to vary systematically with the independent variable.

Statistics 1 22
Discrete vs. Continuous Variables
Discrete: each item corresponds to a separate value of the variable
Values/categories do NOT overlap or “touch” on the scale.
There are no values “in between”

Statistics 1 23
Figure 1. Student soda preferences.
0
1
2
3
4
5
6
7
8
9
Coke Pepsi Sprite 7 Up Mt. Dew Dr. P Mr. P Other
Brand
f

Statistics 1 24
Continuous: each item corresponds to an interval on the scale of measurement.
Intervals defined by upper & lower real limits
Real limits are continuous (“they touch”)

Statistics 1 26
Properties of scales of measurement
Each scale has all the properties of the ones below it plus an additional property.
The higher-level measurements contain more detailed information about observations & allow more complex analyses.

Statistics 1 27
Nominal Scale
o Identification (Name): allows you to label observations.
o Applies to category labels & numbers used as labels.
o Examples: college major, any “yes/no,” participant number, etc…

Statistics 1 28
Ordinal Scale
o Magnitude (Order): allows you to make statements about relative size or ordering/ranking of observations.
o Applies to ordered category labels & numbers used as ranks.
o Examples: any “high/medium/low,” class rank, etc…

Statistics 1 29
Interval Scale
o Equal Intervals: allows you to assume that the distances between numbers on the measurement scale are equal & correspond to equal differences in the variable being measured.
o Applies to numbers, often scores or ratings.
o Examples: attitude as preference ratings, etc...

Statistics 1 30
Ratio Scale
o Absolute Zero: allows you to assume that a score of “0” on a variable really means the absence of that property, & that you can make meaningful ratio statements.
o Applies to numbers, often tallies or physical measurements.
o Examples: stress as change in BP, memory performance as # of words recalled, etc...
Statistics 1 31
Displaying our observations: Frequency distribution tables & graphs of frequency distributions
Frequency distribution table: shows a range of possible values for a single variable (X) & the number of observations of each value (f).

Statistics 1 32
Nominal data
Example: X =gender of class members (1 = male; 2 = female)
X f X f
1 14 OR Male 14
2 33 Female 33
Σf=N=
Proportion: p= f / N percentage=p*100
p(m)= % of the class is male

Statistics 1 33
X f fX p = f/N % = p(100)
10 2
9 5
8 7
7 3
6 2
5 0
4 1
Σf =
N =
ΣX =
ΣX² =

Statistics 1 34
Rank or percentile rankA particular score is defined as the percentage of individuals in the
distribution with scores at or below the particular value.
Calculating cumulative frequencies (cf) & cumulative percentages (cum%)
cf = # of observations at or below a given value of X
add up frequencies from bottom of table upwards
cum% = percentage of observations at or below a given value of X
divide cf/N for each row (better—less rounding error)
OR add up percentages from bottom of table upwards

Statistics 1 35
X f fX cf c%
10 2
9 5
8 7
7 3
6 2
5 0
4 1
Σf =
N =
ΣX =
ΣX² =

Statistics 1 36
Characteristics of distributions
Symmetry vs. skewness, number of modes or “pileups”

Statistics 1 37
The Normal Distribution• mean = median = mode• symmetrical• Many complexly-determined
traits are normally distributed,
e.g. IQ & SAT scores.

Statistics 1 38
A symmetrical bimodal distribution
mean = median, with 2 modes
Bimodal distributions may
also be asymmetrical (mean,
median), & multimodal
distributions are possible.

Statistics 1 39
A positively skewed distribution (tail positive end of scale)
Mode<median<mean

Statistics 1 40
A negatively skewed distribution (tail negative end of scale)
Mean<median<mode