Embed Size (px)
Citation preview

1

2
February 12-13, 2009, Kathmandu, Nepal
Dongsoon Lim, Ph. D., ProfessorDepartment of Economics, Dongeui University
Korea
Biotechnology Industry, Statistics and Policies in Korea
I. Introduction
II. Biotechnology Industry Statistics in Korea• Classification of Bio-industry Statistics in Korea• Establishment of the Biotechnology Classification System
III. Biotechnology Industry and Policies in Korea• Brief History of the Korean Bio-industry• R&D• Firms, Employment, Papers, and Patents• Bio-industry trade• Bio-industry regulations and policies
IV. Concluding remarks

4
I. Introduction
Biotechnology: shaping current industries into entirely new ones in the world as well as in Korea
Enormous expectations concerning the economic potential of biotechnology
This research: based on industry surveys with R&D, Firms’ economic activities, government policies
Korean biotechnology industry has been successful: - Enjoyed considerable scientific success and has grown to a substantial size
- Mainly due to continuous fund from both the government and the private sector
- Substantial increase in total sales, employment, private and public R&D, and international trade
- During the years 2002~2007, biotechnology sales almost doubled from the equivalent of US $2.4 billion to US $4.0 billion, an annual increase of 14 percent
- Employment of FTE increased from 8,604 (Biotech R&D employees, 5,030) to 20,236 (Biotech R&D employees, 10,178) an 18.7(15.1)% per year

5
I. Introduction- The Korean government committed additional funds to state-based R&D projects
valued at US$920 million · raising another US$22 billion through issuing state based bonds to foster the
commercialization of next generation technologies
- The leading private firm groups also established their biotechnology firms and research institutes to pursue the business opportunities
· LG Life Sciences, Postech, SK, etc.
- More than 800 biotechnology firms· 32 per cent are biopharmaceuticals; 23 per cent bio foods; 14 per cent, bio chemicals
- Estimated to rank top 12 in papers and patents
- Bio-statistics had been managed by BAK in 1992 ~2002, MKE since 2002 · Provide a stable and consistent set of annual statistics of biotechnology industry and
its activities· Recently the statistical system has been modified at a detailed level of disaggregation
and put more focus on trade statistics

6
II. Biotechnology Industry Statistics in Korea
The growth in the use of biotechnology with a variety of goods and services led to questions: whether biotechnology-related activity could somehow be reflected in standard statistics classification in national as well as OECD and UN ISIC system?In general industry statistics, classified based on commodities: the technology-input goods and services difficult to distinguish from those With the continuous efforts of OECD and participating countries, the biotechnology and bio-industry, quite successfully compiled in conventional statistics system, so in Korea Biotechnology and bio-industry statistics in Korea, compiled as a distinct activity based on both rules of general statistical system in Korea, such as KSIC (Korea Standard Industry Classification) 8th rev. and SKTC (Standard Korean Trade Classification), a consistent trade statistics of SITC The Korean statistical system is, in principle, decentralized in that each agency has the responsibilities to collect its statistics relating to its particular fieldHence, bio-industry statistics is also managed and operated under the authority of cooperation of separate ministries, mainly MKE, with field work of KIET and BAKWith the aim of improving the comparability and consistency of statistics, the authority standardizes bio-statistical terms and classifications periodicallyTrade statistics of bio-industry in Korea is complied as the above rules
Classification of Biotechnology and Bio-industry Statistics

7
Classification of Bio-industry Statistics in Korea
Table 1. Structure of the biotechnology classification system in Korea
II. Biotechnology Industry Statistics in Korea
Biotechnology Classification system of 13 categoriesReflecting the status of the Korean Bio-industryStructure criteria: the main value-chains used & the object of the technology
Key BiotechnologiesPurpose of the technologiesValue chains
Safety and efficiency
Fusion
Biosecurity andsustainable development
Production
Bioinfornation analysis and application
Biological Material and Cell
Others
Evaluation
Production and Applications
R&D
G. Bioprocess
F. Metabolic engineering
M. Other biotechnology
L. Biosafety and bioefficiency
K. Bioelectronics
J. Nanobiotechnology
I. Envionmental and bioenergy
H. Bioresource production and utilization
E. Systems biology and bioinformatics
C. Other macromolecular engineering
B. Protein engineering
A. Genetic engineering
D. Cell and tissue engineering
7

8
II. Biotechnology Industry Statistics in Korea
Table 2. Structure of the bio-industry classification system in Korea
Classification of Bio-industry Statistics in KoreaBio-industry Classification System of 8 categoriesFacilitate Analysis of the Bio-industry & the Economic Impact on the Various Industrial SectorsStructure Criteria: Goods & Services
8. Bioassay, Bioinformatics and R&D service
7. Bioenergy and Bioresources
6. Bioprocesses and equipment
5. Bioelectronics
4. Bioenvironmental
3. Biofoods
2. Biochemicals
1. Biopharmaceuticals
R&D and assay service
Resource and energy
Commodity
Services
Goods
8

9
II. Biotechnology Industry Statistics in Korea
Scope of bio-firms: basically following OECD
Firms that utilized biotechnology as a key technology in the R&D stage but used other technology to manufacture productsFirms that directly used biotechnology in the manufacturing, production and service (R&D included) processesFirms that used raw materials which was made with biotechnology but produced their products using technology other than biotechnologyFirms that produced machines, equipment or plants to be used in the R&D or production process where biotechnology is involvedFirms that purchased and resold the abovementioned products or acted as sales agents on contract terms
A firm not a directly manufacturer of a specific product but commissions another firm, included if the following four conditions are met:
• directly plans a product (concept, design, samples etc);• buys raw materials with its own account and provides them to the contractor;• manufactures the relevant products in its own name;• takes over the products and sells them directly in the market.

10
III. Biotechnology Industry and Policies in KoreaHistory of Korean Bio-industry
1980~1989 : Technology Development StageIntroduction & Development of New BiotechnologyEnactment of Biotechnology Promotion Law, 1983Establishment of Biotechnology Departments & Research Institutes in Universities, 1984Establishment of the Korea Research Institute of Bioscience & Biotechnology(KRIBB), 1985
1990~1999 : Product Manufacturing StageEstablishment of Bio-industry Association of Korea(BAK), 1991Formalizing of Biotech 2000 Program(MOST), 1994Proclaim of Bio-industry Vision 2000(MOCIE), 1994Development of Bioprocess Technology & Launching of Bio-products
2000~Current : Bio-industry Introduction StageEstablishment of Korean Bio-industry Development Strategy, 2000
Key National Strategic IndustryInauguration of National Bio-industry Action PlanProductivity Improvement of Generic Products, Development of New & Modified Bio-productsInvestment Increase in Public & Private Sector

11
III. Biotechnology Industry and Policies in Korea
Year 2002 2003 2004 2005 2006 2007 CAGR(02-07)
Biopharmaceuticals 691
122
957
105
9
74
46
34
2,038
925 1,047 1,200 1,313 1,814 21.3
Biochemicals 108 154 199 218 252 15.7
Biofoods 989 1,137 1,233 1,463 1,416 8.2
Bioenvironmental 99 121 155 175 216 15.6
Bioelectronics 8 17 20 28 62 46.2
Bioprocesses and equipment 46 49 61 80 91 4.2
Bioenergy and bioresources 14 10 17 17 27 -9.8
Bioassay, bioinformatics and R&D service 47 69 98 105 118 28.0
Total 2,237 2,604 2,983 3,400 3,997 14.4
Korean Bio-industry has been growing rapidly - CAGR 1999~2004: 14.4%
Major Driving Force - Political Support from the Government- Entrepreneurship of R&D Oriented Company
Table 3. Sales and Growth rate of the Korean bio-industry
11

12
III. Biotechnology Industry and Policies in Korea
Government’s investment increased rapidly at an average of 27.5% per year, greater than that by firms’ investment with 17.5%
Figure 1. Public and Private Investment in the Korean bio-industry
12

13
III. Biotechnology Industry and Policies in Koreaa sharper fluctuation in the annual growth rates of government investmentNote that there are only the years, 2000 and 2004~2006 when the direction of the two growth rates are reverseMay refer that government investment could have a reverse impact on the growth rate change in the private investments for the years
Figure 2. Growth rates of Public and Private Investment
13

14
III. Biotechnology Industry and Policies in Korea
R&D fund provider 1994~97 1998~’01 2002~06 2007 1994~’07
Ministry of Knowledge Economy (MKE) 18
253
86
10
48
0
415
140 707 193 1058
Ministry of Education, Science and Technology (MEST) 564 1335 352 2503
Ministry of Food, Agriculture, Forestry and Fisheries (MAF) 111 433 133 764
Ministry of Environment (ME) 21 111 140 282
Ministry of Health, Welfare and Family Affairs (MW) 95 654 29 827
Public research institutes 0 76 100 177
Sum 932 3317 946 5610
MEST is the largest public fund provider during the period 1994~2007, accounting for 44.6%, followed by MKE, .18.9%.
Table 4. Public R&D expenditures and providers (2007 millions of US$)
14

15
III. Biotechnology Industry and Policies in Korea
Year Life science Health Agri.
FoodInd.
Process
101 104
100
4.2
107
5.7
2007
2008
’08/07, %
Bio-fusion Sum
274 178 91 748
314 221 94 836
14.9 24.1 2.9 11.7
According to distribution of pure public R&D by biotechnology divisions, Life science accounted for the largest share for both years, followed by health sector
Table 5. Distribution of pure public R&D expenditures (2007 millions of US$)
15

16
III. Biotechnology Industry and Policies in KoreaNumber of graduates majoring in the biotechnology and bio-engineering, including bachelor, master, and Ph.D., increased consistently reaching 29,256 graduates, annual increasing rate of 2.4 per cent from 2004 to 2007. In 2007, Bachelor degree holders accounted for 66.5 per cent of total; masters, 24.1 per cent; Ph.D., 9.4 per cent.
Figure 3. Graduated students form biotechnology and bio-engineering
16

17
III. Biotechnology Industry and Policies in Korea
From 1998 to 2007, total employment increased 22.1% annually; from2002 to 2007, 9.8%Researchers increased 19.9% (8.0% for 2002 to 2007); manufacturing and service workers at site, 24.8% (12.0% for 2002 to 2007).
Figure 6. Employment in biotechnology industry
17
1,9821,372
3,371
1,8155,082
3,625
6,608
5,530
8,715
8,601
10,178
10,058
0
5,000
10,000
15,000
20,000
25,000
1998 2000 2002 2004 2006 2007
Year
Research Manufacture

18
III. Biotechnology Industry and Policies in KoreaIn 2007, 834 firms active in biotechnology in Korea The largest share of employees worked in the Biopharmaceutical sector (40.5%), followed by the Bio-food sector (24.0%) and Biochemical sector (11.7%)Over half of the employees had R&D-related duties (50.3% or 10,178 employeesAverage number of employment per firm is 24, ranging from 31 (Biopharmaceutical sector) to 14 (Bioelectronics)
Table 6. Firms and Employment of the Korean bio-industry
18
Firms Employmentnumber share number average share, %
Biopharmaceutical Ind. 266 31.9 8,196 31 40.5 Biochemical Ind. 117 14.0 2,377 20 11.7 Biofood Ind. 188 22.5 4,864 26 24.0 Bioenvironmental Ind. 111 13.3 1,775 16 8.8 Bioelectronics Ind. 21 2.5 304 14 1.5 Bioprocess and equipment Ind. 62 7.4 1,238 20 6.1 Bioenergy and bioresource Ind. 25 3.0 618 25 3.1 Bioassay, bioinformatics and R&D 44 5.3 864 20 4.3
Sum 834 100.0 20,236 24 100.0
Sub-industry

19
III. Biotechnology Industry and Policies in Korea
Figure 3. Professional papers of biotechnology and bio-engineering
19
Korean auth.

20
III. Biotechnology Industry and Policies in Korea
Figure 5. Trend of patents of the Korean biotechnology (Unit: items)
20
For the rough scratch of the competitiveness review, the number of patents both in overseas and in domestic area, has increased continuously, with slight declining in 2007Out of total patent application acquired from overseas during 2006~’07, 596 items, the US patents accounted for 28 percent.

21
III. Biotechnology Industry and Policies in Korea
TS (Technology Specialization), as an index for measuring the competitiveness, determined by multiplying a country’s number of patents during the period by the current PII (patent impact index)The current patent impact index, a measure of how important a country’s patents: how often they are citedA PII ratio of 1.0, defined that the country’s patents were cited as often as the overall average The TS was ranked 17th in 1998 to 2001. The rank has been improved 15th in 2002~2005, 13th in 2006~2007, reflecting gradual gain of competitiveness in the biotechnology
Table 8. Biotechnology Patents and Competitiveness
21
Patents Patent Impact Index (PII)98~01 02~05 06~07 98~01 02~05 06~07
178 207 170 0.440 0.637 0.645Technology Specialization (TS)
98~01 02~05 06~07TS value Rank TS value Rank TS value Rank
78 17 131 15 109 13

22
III. Biotechnology Industry and Policies in Korea
Table 9 Biotechnology Patents and Competitiveness
22
Patents Patent Impact Index (PII) Technology Specialization (TS)98~01 02~05 06~07 98~01 02~05 06~07 98~01 Rank 02~05 Rank 06~07 Rank
USA 21,289 17,352 9,088 1.150 1.055 1.003 24,497 1 18,300 1 9111 1Japan 2,116 1,702 1,166 0.500 0.672 0.761 1,050 2 1,144 3 886 2UK 1,031 764 396 0.920 1.200 2.037 948 3 916 5 806 3Netherlands 703 1,023 557 0.510 0.921 1.161 355 8 942 4 646 4Germany 1,282 1,512 715 0.630 0.858 0.766 804 5 1,297 2 547 5Canada 929 761 410 0.930 0.864 1.147 862 4 657 6 470 6France 859 712 373 0.600 0.799 0.821 519 6 569 7 306 7Denmark 465 516 252 0.880 0.822 1.032 408 7 423 9 260 8Switzerland 343 389 245 0.790 1.104 0.838 271 9 429 8 205 9Sweden 246 236 108 1.080 0.856 1.720 265 10 201 12 185 10Belgium 205 271 160 0.600 1.088 1.129 123 13 294 10 180 11Israel 245 233 172 0.850 0.713 0.726 207 11 166 14 124 12Korea 178 207 170 0.440 0.637 0.645 78 17 131 15 109 13Austrailia 358 333 168 0.460 0.800 0.645 164 12 266 11 108 14Taiwan 80 119 101 0.360 0.508 0.774 29 21 60 18 78 15India 65 204 101 0.510 0.580 0.645 33 20 118 16 65 16Italy 186 134 62 0.520 1.369 0.645 97 15 183 13 39 17Finland 101 62 31 0.780 1.894 1.290 79 16 117 17 39 17New Zealand 43 96 30 0.580 0.617 0.000 25 22 59 19 0 19Austria 84 51 24 0.720 0.816 0.000 61 18 41 20 0 19
Country

23
III. Biotechnology Industry and Policies in Korea
Table 10. Exports and Imports of the Korean bio-industry (2007 millions of US$)
23
Import1998 2002 2007 98~'07,% 02~'07,%
Biopharmaceutical Ind. 84 219 853 29 31Biochemical Ind. 22 62 92 17 8Biofood Ind. 4 7 13 14 14Bioenvironmental Ind. 2 2 6 11 26Bioelectronics Ind. 0 6 1 14 -31Bioprocess and equipment Ind. 55 188 130 10 -7Bioenergy and bioresource Ind. 16 0 4 -15 125Bioassay, bioinformatics and R&D 0 0 0 -23 42Total 183 484 1,099 22 18
Export1998 2002 2007 98~'07,% 02~'07,%
Biopharmaceutical Ind. 200 190 452 9 19Biochemical Ind. 242 18 49 -16 22Biofood Ind. 62 752 1,004 36 6Bioenvironmental Ind. 0 9 9 76 -1Bioelectronics Ind. 0 9 38 304 32Bioprocess and equipment Ind. 3 11 22 27 15Bioenergy and bioresource Ind. 12 1 1 -29 -12Bioassay, bioinformatics and R&D 0 3 10 26 25Total 518 993 1,584 13 10
24
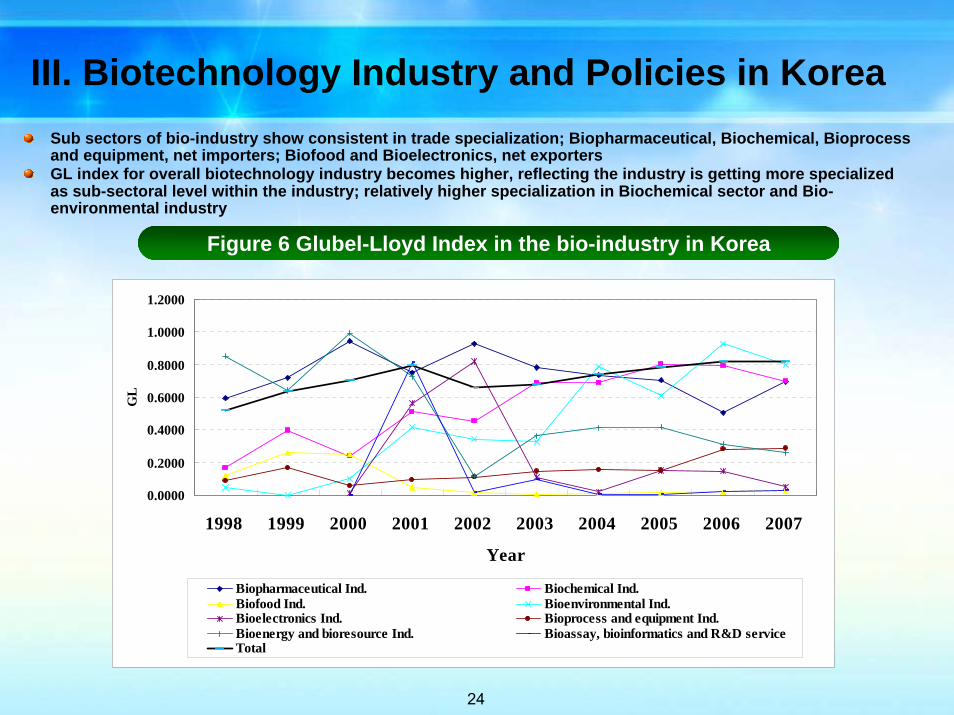
III. Biotechnology Industry and Policies in KoreaSub sectors of bio-industry show consistent in trade specialization; Biopharmaceutical, Biochemical, Bioprocess and equipment, net importers; Biofood and Bioelectronics, net exporters GL index for overall biotechnology industry becomes higher, reflecting the industry is getting more specialized as sub-sectoral level within the industry; relatively higher specialization in Biochemical sector and Bio-environmental industry
Figure 6 Glubel-Lloyd Index in the bio-industry in Korea
24
0.0000
0.2000
0.4000
0.6000
0.8000
1.0000
1.2000
1998 1999 2000 2001 2002 2003 2004 2005 2006 2007
Year
GL
Biopharmaceutical Ind. Biochemical Ind.Biofood Ind. Bioenvironmental Ind.Bioelectronics Ind. Bioprocess and equipment Ind.Bioenergy and bioresource Ind. Bioassay, bioinformatics and R&D serviceTotal

25
III. Biotechnology Industry and Policies in Korea
Since the 2000s, the government still support major public areas including developing fundamental biotechnologies, managing research institutes, building bio-infrastructures, and educationMinistry of Knowledge Economy (MKE, http://english.mke.go.kr/) and Ministry of Education, Science and Technology (MEST, http://english.mest.go.kr/), two major public organizers
· MKE: applied biotechnologies and industrialization, and development of bio-related renewable energy
· MEST: basic and leading-edge technologies, promotion of biotechnology-supporting systems, education and human resource development, basic researches on life science
• Ministry of Health, Welfare and Family Affairs (MW): an authority body in management and policies for developing new biopharmaceuticals
· Clinical trials and safety-related regulations regarding biotechnology
• (MAF, http://english.mifaff.go.kr/main.tdf): breeding animals, plants , and new food additives, conservation of marine resources, and gene analysis of the marine species
• Ministry of Environment (ME, http://english.me.go.kr/): reservation and use of biodiversity, development of wastes treatment technology
25
Driving force 1: Government Role in Bio-industry

26
National Science & Technology Administration System
S&T Related MinistriesS&T Related Ministries
Ministry of Knowledge Economy (MKE)
Agency for Technology and standardSmall & Medium Business AdministrationIndustrial Property Office
Ministry of Health & WelfareFood and Drug AdministrationNational Institute of Health
Ministry of Construction & Transportation
National Railroad Administration
Ministry of Education, Science and Technology (MEST) National Universities and CollegesBasic and Leading-edge Technologies Promotion of Biotechnology-supporting SystemsEducation Assistance of Basic Researches on Life Science
Ministry of National Defense
Ministry of EnvironmentNational Institute of Environmental Research
Ministry of Finance and EconomyNational Tax ServiceCustoms ServicePublic Procurement ServiceNational Statistical Office
Ministry of Agriculture & Forestry
Rural Development Administration Agricultural Research Institute
Forestry ServiceForestry Research Institute
Agency for Defense DevelopmentMilitary Manpower Administration

27
Establishing of Legal and Institutional Frameworks
Bioethics
Bio-safety
IPR
Protection
International
Agreement
The Act on Bioethics & Biosafety(2004)To ban human cloning/cross-species experiments
To allow research for therapeutic purpose on frozen
eggs left unused from fertility treatment and somatic cells nuclear transfers
Strong protection for IPRKorea is an IP safehold – Regional Head, Leading
Multinational Corporation
The Act on Cross-border Movement of Living Modified Organisms(2001)
To Implement Cartagena Protocol to the Convention
on Biological Diversity
Importation and manufacturing of GMOs requires
safety check and government authorization

28
III. Biotechnology Industry and Policies in Korea
Biotechnology-related Departments were set up in around 40 UniversitiesCollege of Science 60%, College of Agriculture 25%, College of Engineering 15%30 University-associated Research Institutes on the Genetic Engineering were establishedInstitute of Molecular Biology and Genetics, Seoul National University, etc.Science Research Center (SRC) & Engineering Research Center (ERC)Over 20 Centers in Biotechnology Area in the UniversitiesSeoul National University, Korea University, KAIST, etc.Biotechnology-related societies are working onKorean Society for Biotechnology and Bioengineering (KSBB)Korean Institute of Chemical Engineering / Division of Biochemical Engineering, etc.
28
Driving force 2: Academia

29
III. Biotechnology Industry and Policies in Korea
Driving force 3: Research Institutes
SNU Bio-MAX Institute is a research organization established in 2003 with a support from MOCIEto carry out innovative projects in a multidisciplinary environment
Bio-MAX Institute, Seoul National University
Korea Research Institute of Bioscience and Biotechnology(KRIBB) is the only government research institute dedicated to biotechnology research across a broad span of expertise, from basic studies for the fundamental understanding of life phenomena to applied studies, established in 1985
Korea Research Institute of Bioscience and Biotechnology(KRIBB)
MOGAM Biotechnology Institute is one of the best private research institutes established in 1984 on the promotions of the research and development in the field of Biopharmaceuticals
MOGAM Biotechnology Institute

30
III. Biotechnology Industry and Policies in Korea
Driving force 3: Research Institutes
Asan Institute for Life ScienceSamsumg Bioscience Research Institute
Private Research Institutes
Korea Institute of Science and Technology Information(KISTI)Agriculture and Life Science Research Center, Seoul National UniversityBiological Research Information Center(BRIC), Pohang University of Science and Technology
Research Institutes on Bioinformatics
Korean Collection for Type Cultures(KCTC)Korean Culture Center of Microorganisms(KCCM)Korean Cell Line Research Foundation
Microorganism Depository Organizations
31
III. Biotechnology Industry and Policies in Korea
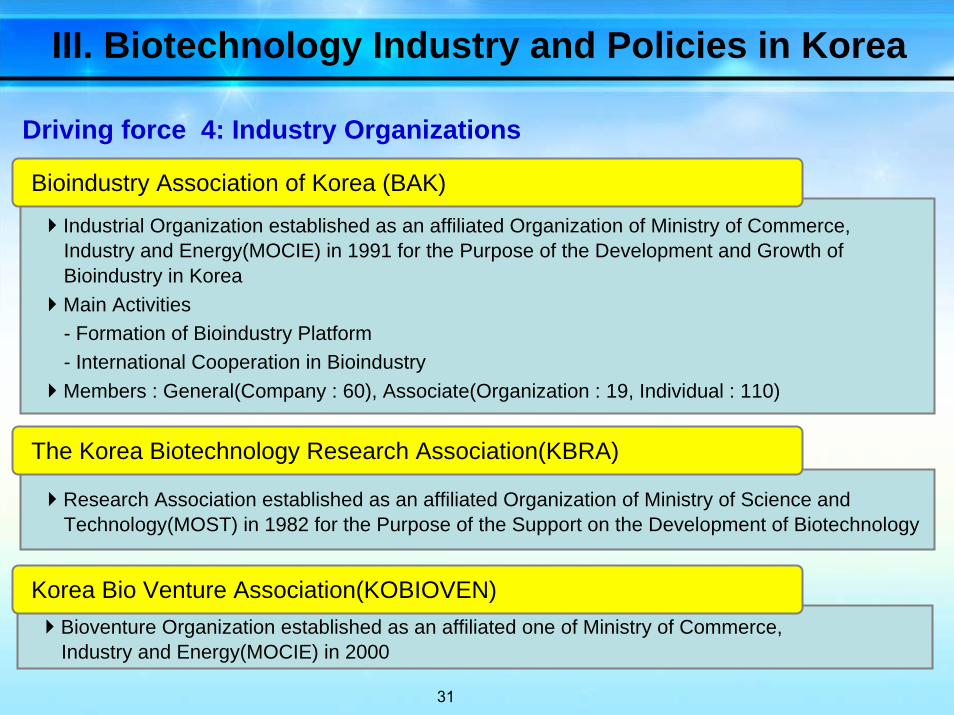
Driving force 4: Industry Organizations
Industrial Organization established as an affiliated Organization of Ministry of Commerce, Industry and Energy(MOCIE) in 1991 for the Purpose of the Development and Growth of Bioindustry in KoreaMain Activities- Formation of Bioindustry Platform- International Cooperation in BioindustryMembers : General(Company : 60), Associate(Organization : 19, Individual : 110)
Bioindustry Association of Korea (BAK)
Research Association established as an affiliated Organization of Ministry of Science and Technology(MOST) in 1982 for the Purpose of the Support on the Development of Biotechnology
The Korea Biotechnology Research Association(KBRA)
Bioventure Organization established as an affiliated one of Ministry of Commerce, Industry and Energy(MOCIE) in 2000
Korea Bio Venture Association(KOBIOVEN)

32
Fostering Regional Bio-Cluster
Based on their respective characteristics, biotechnology centers will be developed across Korea according to their areas of specializationA total of 25 biotechnology centers will be fostered as innovation clusters, which will create added value and serve as an incubator for world-class biotechnology companies
4 Clusters, 25 Centers based on regional characteristics
SeoulKorea Bio-Hub
Daejeon/Chungcheong AreaBio-medicine, healthcare, oriental
medicine, livestock, functional food
Jeonlla/Jeju AreaNew natural materials, biofood, agriculture, functional cosmetics
Gangwon/ Gyoungsang AreaBio-electronics, process, fishery, marine
environment, healthcare, functional materials, bio-chemicals, marine life,
oriental medicine
33
International Cooperation
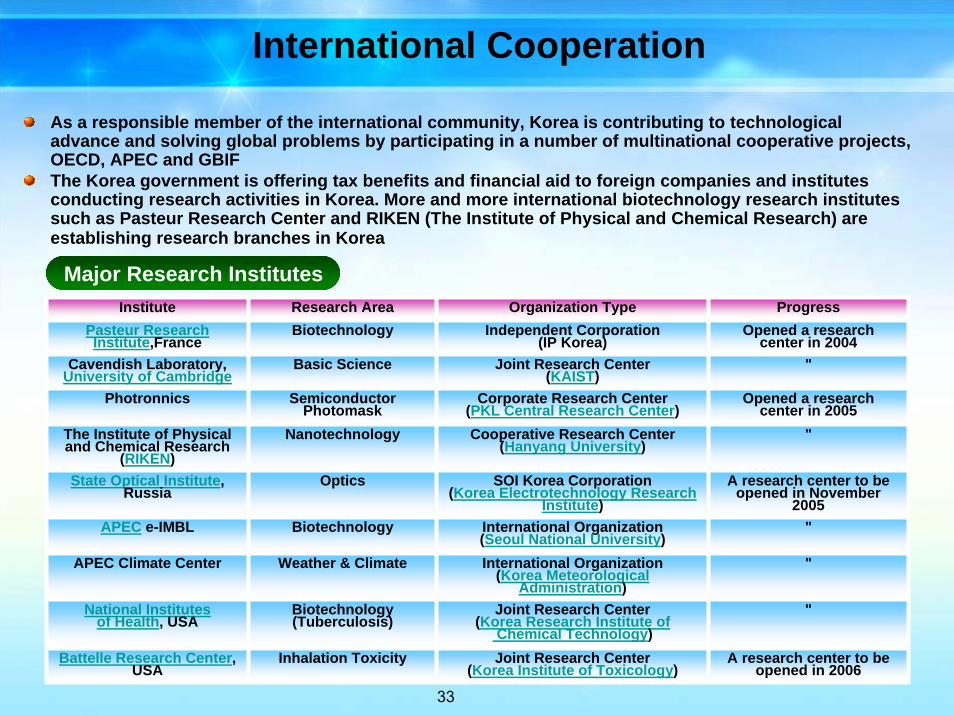
As a responsible member of the international community, Korea is contributing to technological advance and solving global problems by participating in a number of multinational cooperative projects, OECD, APEC and GBIFThe Korea government is offering tax benefits and financial aid to foreign companies and institutes conducting research activities in Korea. More and more international biotechnology research institutes such as Pasteur Research Center and RIKEN (The Institute of Physical and Chemical Research) are establishing research branches in Korea
Major Research Institutes Institute Research Area Organization Type Progress
Pasteur Research Institute,France
Biotechnology Independent Corporation(IP Korea)
Opened a research center in 2004
Cavendish Laboratory, University of Cambridge
Basic Science Joint Research Center(KAIST)
"
Photronnics Semiconductor Photomask
Corporate Research Center(PKL Central Research Center)
Opened a research center in 2005
The Institute of Physical and Chemical Research
(RIKEN) Nanotechnology Cooperative Research Center
(Hanyang University) "
State Optical Institute, Russia
Optics SOI Korea Corporation(Korea Electrotechnology Research
Institute) A research center to be
opened in November 2005
APEC e-IMBL Biotechnology International Organization(Seoul National University)
"
APEC Climate Center Weather & Climate International Organization(Korea Meteorological
Administration) "
National Institutes of Health, USA
Biotechnology (Tuberculosis)
Joint Research Center(Korea Research Institute of
Chemical Technology) "
Battelle Research Center, USA
Inhalation Toxicity Joint Research Center(Korea Institute of Toxicology)
A research center to be opened in 2006

34
Vision for Bio-Society and Goal of Bio-industry
Vision for Bio-Society
Transformation to BioSociety where the Bio-Products and Services are
just on Your HandsThe Coming BioSociety after the Bio-Revolution of 21C through the Fusion of
Biotechnology(BT) and Information Technology(IT)
Remaking the World Transforming Ourselves From Alchemy to Algeny
Impact of Bio-industry
The Core Contributor in Korea Economy in 21CThe paradigm shift in economy from mass assembly industry to knowledge based industry

35
Basic Direction of Bio-industry Policy
Creation of Bio-Society for the 21st Century
Healthy Bio-Society
Wealthy Bio-Society
Clean Bio-Society
Growth of Bio-industryIntensive Promotion of Bio-industry as a National Strategic Industry
Active Lead toward Development of Bio-industry
2nd Bio-Economy Basic Strategy 2007~2016
3 Goals : R&D, Infra, Business Environment
12 Programmes : Bio-Star Project, Biocluster, etc.
36
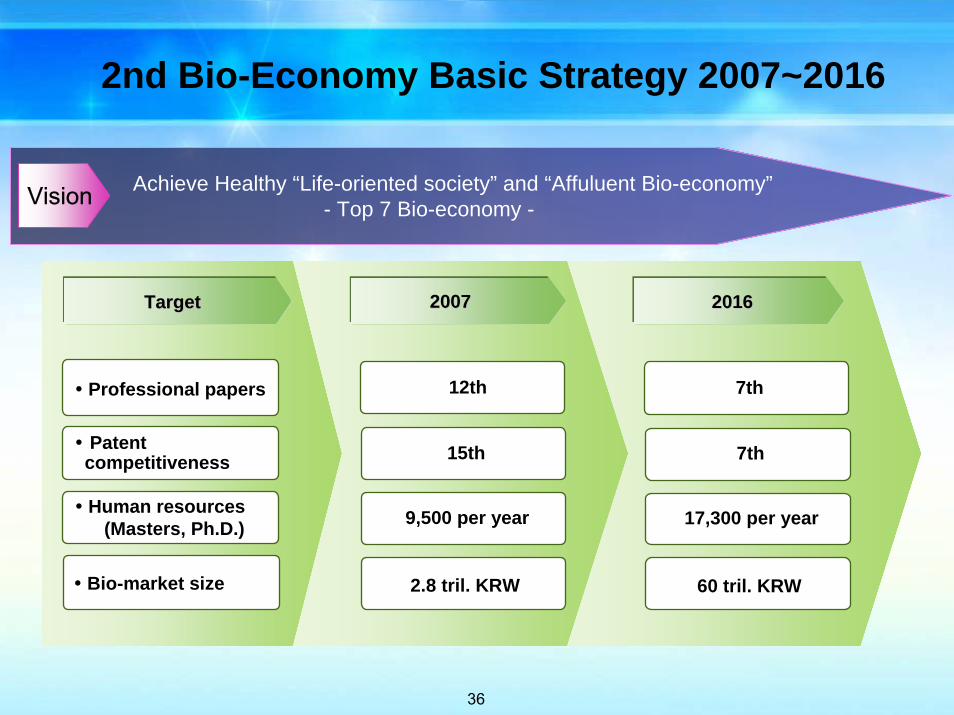
2nd Bio-Economy Basic Strategy 2007~2016
TargetTarget 20072007 20162016
Professional papers
Patent competitiveness
Human resources(Masters, Ph.D.)
Bio-market size 2.8 tril. KRW
9,500 per year
15th
12th
60 tril. KRW
17,300 per year
7th
7th
Achieve Healthy “Life-oriented society” and “Affuluent Bio-economy”- Top 7 Bio-economy -Vision
36

37
Strengthening Strategy of Competitiveness on Bio-industry
Development of Core Technology- Technology for Mid-term & Next generation
Growth Engine Industry for Next generation- New Bio-Drug / Artificial Organ, Bio-Chip
Bio-Star Project- Innovative Biotechnology & Bio-Product
Development of Core Technology
& Bio-Product
Establishment of Bio-product Manufacturing - International authorization of GLP System- Establishment of GCP system for Functional Active Compound- Expansion of cGMP and Improvement of Management
Implementation of LMOs- Biosafety Information Center- Foundation of Bio-hazard Evaluation Center
Expansion of Industrialization
Infrastructure

38
Strengthening Strategy of Competitiveness on Bio-industry
Activation of Biocluster- Construction of Korea Bio-Hub- Strengthening of existing Biocluster- Promotion of using Micro-biochip production platform- Establishment of platform for supporting Industrialization of
BIT technology
Construction of Complex - Advanced Biopharmaceutical production complex - Bulk Vaccine production complex
Strengthening & Promoting of Bio-cluster
Establishment of Investment / Consulting Company- Participation from public company, private & foreign companies- Support of long-term investment
Joint R&D with Foreign CountriesTraining International Standard Specialist
Networking among Domestic & Foreign association, companies and government
Promoting Global
Network

39
Entry to the Ranks of the G7 in terms of BT Power- Foster Bio-industry as a National Economic Growth Engine in post-IT Age-
Central government: focus on RED-BT at the beginning stage and diversify to White-BT Local government: focus on Green-BT(Food, LMO)
Role AssignmentRole Assignment
Support the bioindustry R&DCreate and structure the bioindustry-related infrastructures
Investment PlanInvestment Plan
Invest Budget that amounts to US $2 Billion over the next 10 years
Health care, Red-BT: production US $50 billion, exports US $20 billionIndustrial, White-BT: production US $10 billion, experts US $5 billion
Target in 2015Target in 2015
Production worth US $60 billion and Exports worth US $25 billion
39

40