Embed Size (px)
Citation preview

1
Statistical Models in Data Mining
Sargur N. Srihari
University at Buffalo The State University of New York
Department of Computer Science and Engineering Department of Biostatistics
Srihari

Flood of Data
2
New York Times, January 11, 2010
Video and Image Data “Unstructured”
“Structured and Unstructured” (Text) Data
Srihari

3
Large Data Sets are Ubiquitous 1. Due to digital data acquisition and storage technology
Business • Supermarket transactions • Credit card usage records • Telephone call details • Government statistics
Scientific • Images of astronomical bodies • Molecular databases • Medical records
2. Automatic data production leads to need for automatic data consumption
3. Large databases mean vast amounts of information 4. Difficulty lies in converting data to useful knowledge
Srihari

Data Mining Definition
Analyze Observational Data to find unsuspected relationships and Summarize data in novel ways that are understandable and useful to data owner Unsuspected Relationships non-trivial, implicit, previously unknown Ex of Trivial: Those who are pregnant are female Summarize as Patterns and Models (usually probabilistic)
Linear Equations, Rules, Clusters, Graphs, Tree Structures, Recurrent Patterns in Time Series
Usefulness: meaningful: lead to some advantage, usually economic
Analysis: Automatic/Semi-automatic Process (Extraction of knowledge)
Srihari
Extracting useful information from large data sets

Reasons for Uncertainty
1. Data may only be a sample of population to be studied Uncertain about extent to which samples differ from each other
2. Interest is in making a prediction about tomorrow based on data we have today
3. Cannot observe some values and need to make a guess
Srihari 5

Dealing with Uncertainty
• Several Conceptual bases 1. Probability 2. Fuzzy Sets 3. Rough Sets
• Probability Theory vs Probability Calculus • Probability Calculus is well-developed
• Generally accepted axioms and derivations • Probability Theory has scope for perspectives
• Mapping real world to what probability is 6
Lack theoretical backbone and the wide acceptance of probability

Frequentist vs Bayesian • Frequentist
• Probability is objective • It is the limiting proportion of times event occurs in
identical situations – An idealization since all customers are not identical
• Bayesian • Subjective probability
• Explicit characterization of all uncertainty including any parameters estimated from the data
• Frequently yield same results Srihari 7
8
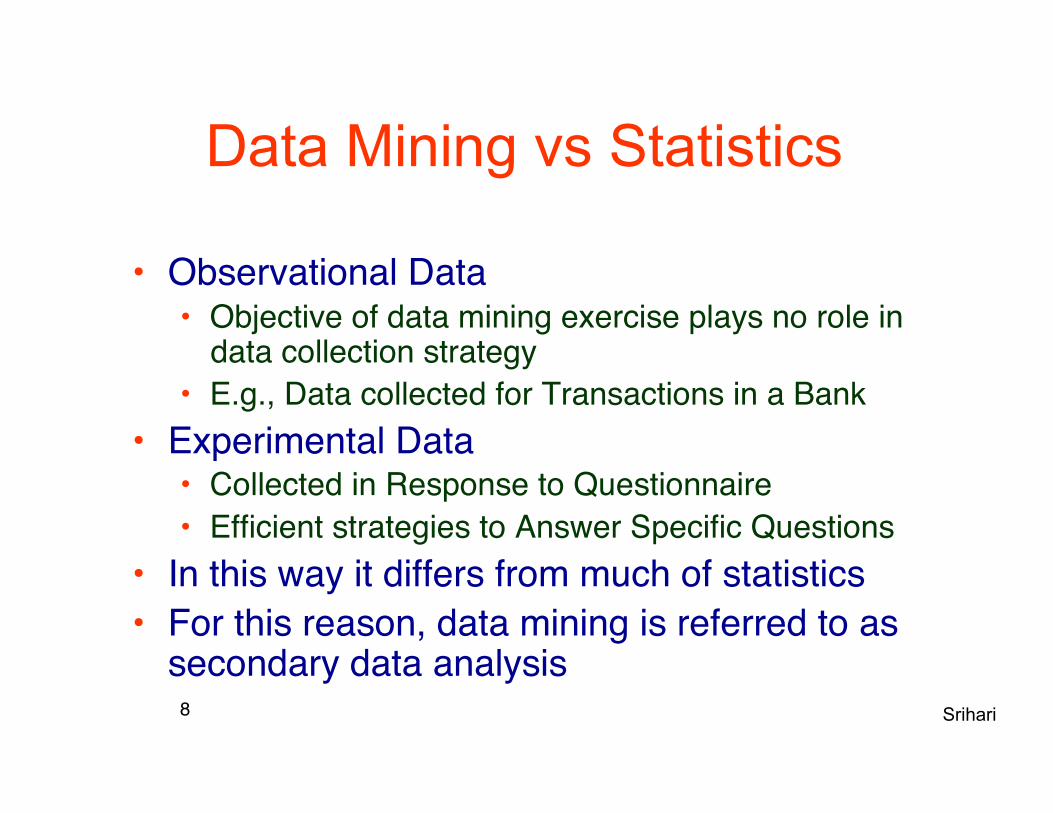
Data Mining vs Statistics
• Observational Data • Objective of data mining exercise plays no role in
data collection strategy • E.g., Data collected for Transactions in a Bank
• Experimental Data • Collected in Response to Questionnaire • Efficient strategies to Answer Specific Questions
• In this way it differs from much of statistics • For this reason, data mining is referred to as
secondary data analysis Srihari

Statistics vs Data Mining
• Size of data set (large in data mining) • Eyeballing not an option (terabytes of data) • Entire dataset rather than a sample
• Many variables • Curse of dimensionality
• Make predictions • Small sample sizes can lead to spurious discovery:
• Superbowl winner conference correlates to stock market (up/down)

10
Information Retrieval
Statistics
Machine Learning Pattern Recognition
Database
Visualization
Multidisciplinary terminology
Training Set
Samples
Structured Data
Unstructured Data
Artificial Intelligence Expert Systems
Data Mining
Data Points
Instances
Records
Table
Srihari Leading Conference known as Knowledge Discovery and Data Mining

11
Data Mining Tasks • Not so much a single technique • Idea that there is more knowledge hidden in the data
than shows itself on the surface • Any technique that helps to extract more out of data
is useful • Five major task types:
1. Exploratory Data Analysis (Visualization: boxplots, charts) 2. Descriptive Modeling (Density estimation, Clustering) 3. Predictive Modeling (Classification and Regression) 4. Discovering Patterns and Rules (Association rules) 5. Retrieval by Content (Retrieve items similar to pattern of interest)
Model
building
Srihari

12
Clustering • Old Faithful (Hydrothermal Geyser in
Yellowstone) • 272 observations • Duration (mins, horiz axis) vs Time to next
eruption (vertical axis) • Simple Gaussian unable to capture
structure • Linear superposition of two Gaussians is
better • Gaussian has limitations in modeling real
data sets • Gaussian Mixture Models give very
complex densities
πk are mixing coefficients that sum to one
• One –dimension • Three Gaussians in blue • Sum in red
∑=
Σ=K
kkkk xNp
1),|()x( µπ

13
Models and Patterns • Global Model
• High level global description of data set • Make statement about any point in d-space
• E.g., prediction, clustering • It takes a large sample perspective
• Summarizing data in convenient, concise way
• Local Patterns • Make statement about restricted regions of d-space
• E.g.: if x > thresh1 then Prob (y > thresh2) = p • Departure from run of data • Identify members with unusual properties • Outliers in a database

14
Models for Prediction: Regression and Classification
• Predict response variable from given values of others • Response variable y given predictor variables x1,.., xd
• When y is quantitative the task is known as regression • When y is categorical, it is known as classification
learning or supervised classification

15
Statistical Models for Regression and Classification
• Generative • Naïve Bayes • Mixtures of
multinomials • Mixtures of Gaussians • Hidden Markov Models
(HMM) • Bayesian networks • Markov random fields
• Discriminative • Logistic regression • SVMs • Traditional neural
networks • Nearest neighbor • Conditional Random
Fields (CRF) • Gaussian Processes

National Academy of Sciences:Keck Center
16

Regression Problem:Carbon Dioxide in Atmosphere
1960 1980 2000 2010 2020
320
340
360
380
400
CO2 Concentration ppm
?
Year

18
Linear Models • Regression
• Single input variable • Polynomial y(x,w) = w0+w1 x+w2 x2 +…=Σ wixi
• Several variables • linear combination of non-linear (basis) functions
• Bayesian Linear Regression • Classification
• Logistic Regression (with sigmoid or soft-max) €
y(x,w) = w0 + w jφ j (x)j=1
M −1
∑ =wTφ(x)
€
y(x,w) =σ[wTφ(x)]
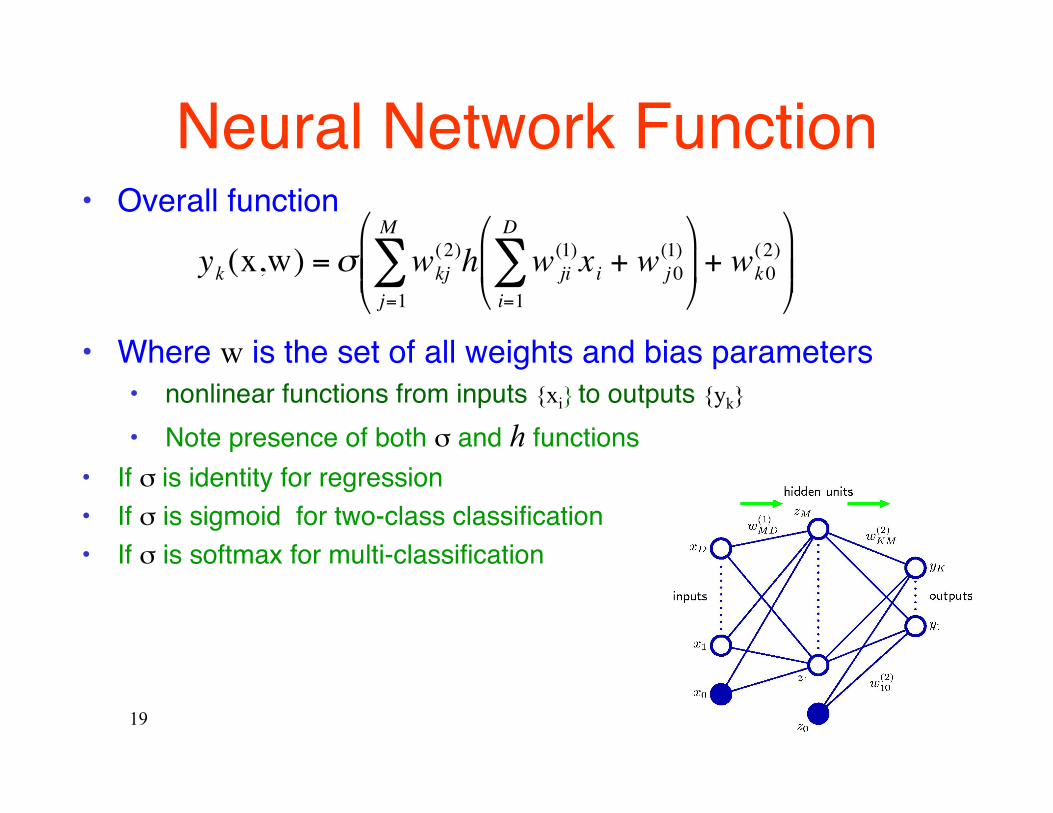
• Overall function
• Where w is the set of all weights and bias parameters • nonlinear functions from inputs {xi} to outputs {yk}
• Note presence of both σ and h functions • If σ is identity for regression • If σ is sigmoid for two-class classification • If σ is softmax for multi-classification
Neural Network Function
€
yk (x,w) =σ wkj(2)
j=1
M
∑ h w ji(1)
i=1
D
∑ xi + w j 0(1)
+ wk0
(2)
19

Gaussian Processes for Regression
20
Gaussian Kernel Exponential Kernel
€
k(x,x') = exp − || x − x' ||2 /2σ 2( )
€
k(x,x') = exp −θ | x − x' |( )
Ornstein-Uhlenbeck process for
Brownian motion
• Radically different viewpoint • not involving weight parameters
• Functions are drawn from a Gaussian • where each data point is a function

Gaussian Process with Two Samples • Let y be a function (curve)
• of a one-dimensional variable x • We take two samples y1 and y2
corresponding to x1 and x2
• Assume they have a bivariate Gaussian distribution
• Each point from this distribution • has an associated probability • It also defines a function y(x)
• Assuming that two points are enough to define a curve
• More than two points will be needed to define a curve • Which leads to a higher
dimensional probability distribution 21
x1 x2
y1
y2
y1
y2

Gaussian Process Regression • Generalize multivariate Gaussian to infinite
variables (over all values of input x) • A Gaussian distribution is fully specified by a
mean vector µ and covariance matrix Σ f = (f1,..fn)T ~ N (µ,Σ) indexes i =1,..n
• A Gaussian process is fully specified by a mean function m(x) and covariance function k(x,x’)
f (x) ~ GP(m(x), k(x,x’)) indexes x • Kernel function k appears in place of covariance matrix • Both express similarity of two in multidimensional space

Gaussian Process Fit to CO2 data

Dual Role of Probability and Statistics in Data Analysis
24
Generative Model of data allows data to be generated from the model
Inference allows making statements about data

25
2. Nature of Data Sets
• Structured Data • set of measurements from an environment or
process • Simple case
• n objects with d measurements each: n x d matrix • d columns are called variables, features, attributes
or fields

26
Unstructured Data 1. Structured Data
• Well-defined tables, attributes (columns), tuples (rows) 2. Unstructured Data
• World wide web • Documents (HTML/XML) and hyperlinks
– HTML: tree structure with text and attributes embedded at nodes – XML pages use metadata descriptions
• Text Documents • Document viewed as sequence of words and punctuations
– Mining Tasks » Text categorization » Clustering Similar Documents » Finding documents that match a query
• Image Databases

Retrieval by Content • User has pattern of interest and wishes
to find that pattern in database, Ex: • Text Search
• Estimate the relative importance of web pages using a feature vector whose elements are derived from the Query-URL pair
• Image Search • Search a large database of images by using
content descriptors such as color, texture, relative position
Srihari 27

28
Representations of Text Documents • Boolean Vector
• Document is a vector where each element is a bit representing presence/absence of word
• A set of documents • can be represented as matrix (d,w)
– where document d and word w has value 1 or 0 (sparse matrix)
• Vector Space Representation • Each element has a value such as no. of occurrences or frequency • A set of documents represented as a document-term matrix

29
Vector Space Example
Document-Term Matrix t1 database t2 SQL t3 index t4 regression t5 likelihood t6 linear
dij represents number of times that term appears in that document

Image Retrieval Results
Crime scene mark and their closest matches

Conclusion • Data mining objective is to make
discoveries from data • We want to be as confident as we can
that our conclusions are correct • Nothing is certain • Fundamental tool is probability
• Universal language for handling uncertainty • Allows us to obtain best estimates even
with data inadequacies and small samples Srihari 31