Embed Size (px)
Citation preview

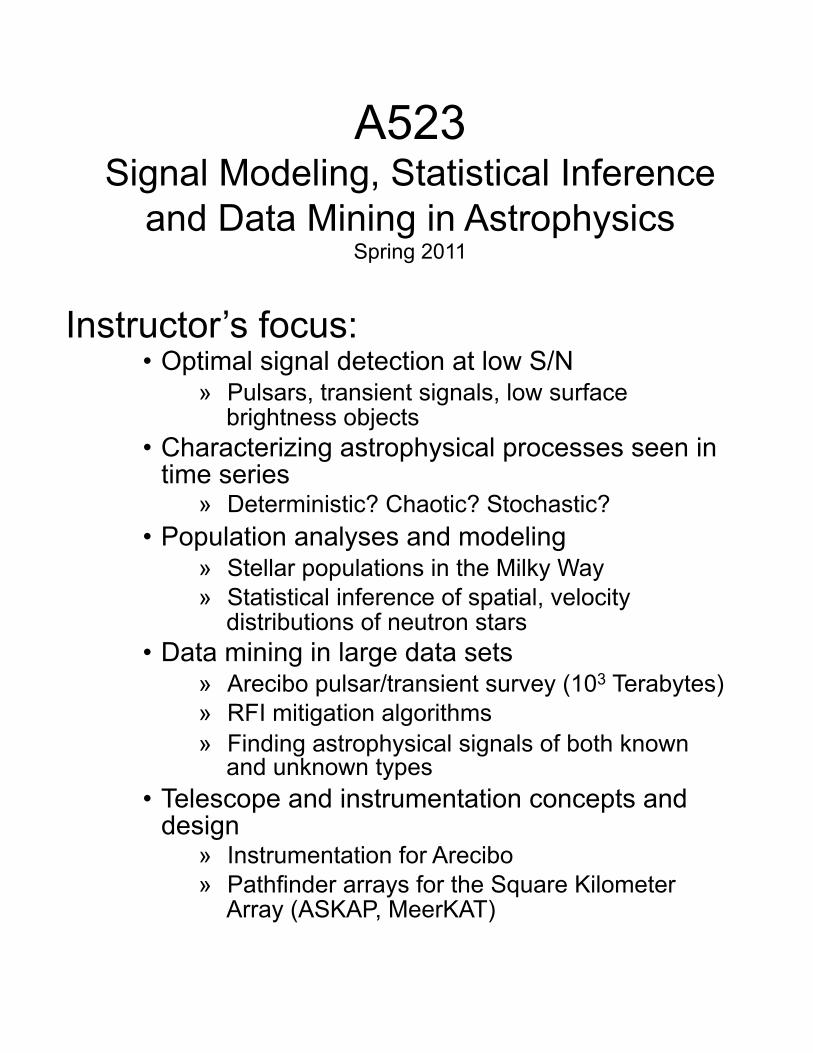
A523 Signal Modeling, Statistical Inference
and Data Mining in Astrophysics Spring 2011
Lecture 1 • Organization:
» Syllabus (text, requirements, topics) » Course approach (goals, themes)
• Book: Gregory, “Bayesian Logical Data Analysis for the Physical Sciences”
• Heavy use of unpublished notes and articles from the literature
• Numerical assignments: you can use your favorite programming language or software package (note no direct use of Mathematica in this course)
• Grading: legibility and clear explanations in complete sentences are needed for all submitted homework and papers.
• Course meeting times: ok as is? go to MW? Reschedule a makeup day?
A523 Signal Modeling, Statistical Inference
and Data Mining in Astrophysics Spring 2011
Instructor’s focus: • Optimal signal detection at low S/N
» Pulsars, transient signals, low surface brightness objects
• Characterizing astrophysical processes seen in time series
» Deterministic? Chaotic? Stochastic? • Population analyses and modeling
» Stellar populations in the Milky Way » Statistical inference of spatial, velocity
distributions of neutron stars • Data mining in large data sets
» Arecibo pulsar/transient survey (103 Terabytes) » RFI mitigation algorithms » Finding astrophysical signals of both known
and unknown types • Telescope and instrumentation concepts and
design » Instrumentation for Arecibo » Pathfinder arrays for the Square Kilometer
Array (ASKAP, MeerKAT)

A523 Signal Modeling, Statistical Inference
and Data Mining in Astrophysics Spring 2011
Traditional topics: • Fourier analysis, least squares fitting,
frequentist-oriented statistical inference, histograms, KS-tests, spectral analysis, correlation and structure functions, matched filtering, generalized linear basis vectors
More recent: • Data adaptive techniques (maximum
entropy approaches), Bayesian inference and hypothesis testing, non-linear methods, wavelet bases
New: • Poisson processes, time-frequency
atoms, Markov-chain

Basic Course Sections
• Linear systems & Fourier methods • Probability & Random Processes • Statistical inference
• Frequentist • Bayesian
• Spectral analysis • Fourier • generalized (wavelets, PCA, etc.)
• Matched filtering & localization • Exploration of large parameter
spaces


Current Assignment
Reading: 1. “Discrete Fourier Transforms”
Appendix B of Gregory, pages 392 – 416 (continuous FTs, DFTs, FFTs)
2. Problem Set 1: Fourier transforms, due Tues Feb 8. minimalist grading

Basic Points • Signal types are defined with respect to
quantization • Continuous signals are easier to work with
analytically, digital signals are what we actually use
• The relationship between digital and analog signals is sometimes trivial, sometimes not
• LSI systems obey the convolution theorem and thus have an impulse response (= Green’s function)
• LSI systems obey superposition • Examples can be found in nature as well as
in devices • The natural basis functions for LSI systems
are exponentials • Causal systems: Laplace transforms • Acausal systems: Fourier transforms
• While LSI systems are important, nonlinear systems and alternative basis functions are highly important in science and engineering

Broad Classes of Problems • Detection, analysis and modeling:
signal detection analysis Natural or artificial
Is it there?
Optimal detection schemes
Maximize S/N of a test statistic
Population of signals:
• maximize detections of real signals
• minimize false positives and false negatives
• null hypothesis: no signal there
What are its properties?
Parametric approaches:
(e.g. least squares fitting of a model with parameters)
Non-parametric approaches:
(e.g. relative comparison of distributions [KS test])

Broad Classes of Problems • Many measured quantitites (“raw
data”) are the outputs of linear systems
• Wave propagation (EM, gravitational, seismic, acoustic …)
• Many signals are the result of nonlinear operations in natural systems or in apparati
• Many analyses of data are linear operations acting on the data to produce some desired result (detection, modeling)
• E.g. Fourier transform based spectral analysis
• Many analyses are nonlinear • E.g. Maximum entropy and Bayesian
spectral analysis

time
Freq
uenc
y
time
DM
|FFT(f)|
FFT each DM’s time series
1/P2/
P3/
P• • •

Example Time Series and Power Spectrum for a recent PALFA discovery
(follow-up data set shown)
DM = 0 pc cm-3
DM = 217 pc cm-3
Time Series
Where is the pulsar?

Example Time Series and Power Spectrum for a recent PALFA discovery
(follow-up data set shown)
DM = 0 pc cm-3
DM = 217 pc cm-3
Time Series
Here is the pulsar

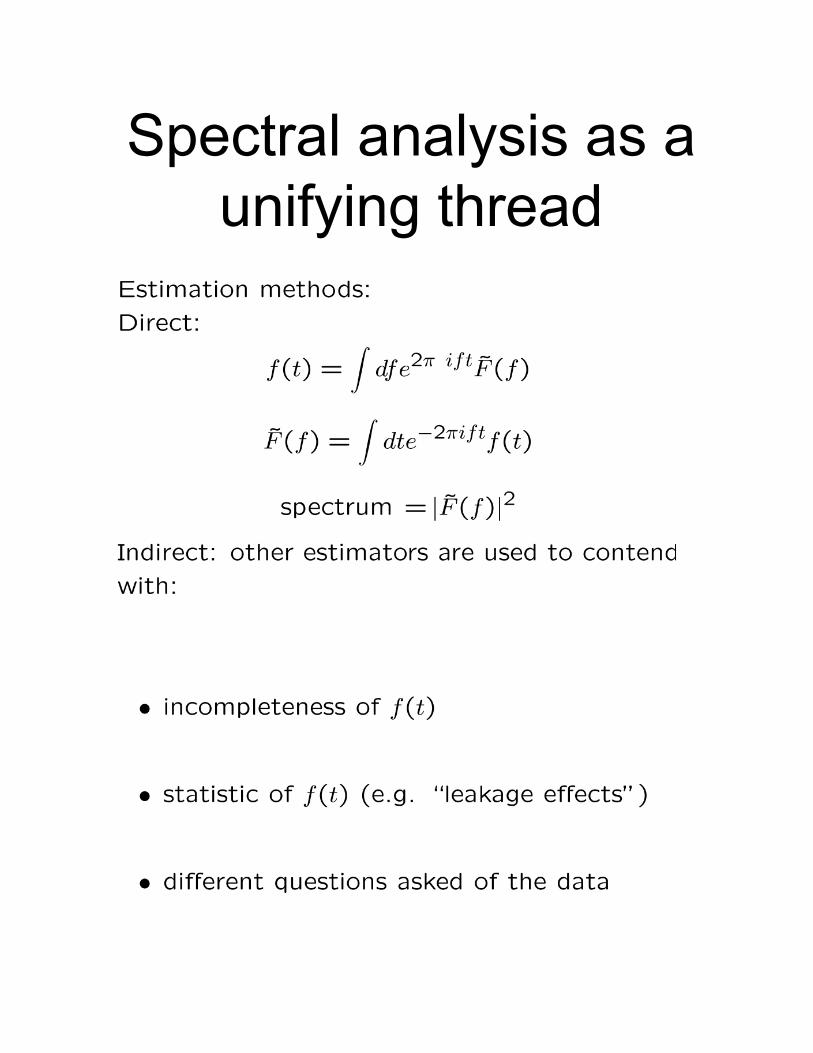
Spectral analysis as a unifying thread Signals ⇔ Statistics
Spectral analysis: 1. Analysis of variance in a conjugate space
t ↔ f (time and frequency domains) u,v ↔ θ (interferometric images)
• Statistical questions about the nature of the signal in frequency space:
a. Is there a signal? b. What is its frequency? c. What is the shape of the spectrum?
1. Basis functions: Sinusoids t ↔ f Spherical harmonics θ, ϕ ↔ l,m Wavelets time-frequency atoms Principal components the data determine the basis
The appropriate basis (often) is the one that most compactifies the signal in the conjugate domain
Spectral analysis as a unifying thread

Color coded temperature variations of the cosmic microwave background (CMB)
TCMB = 2.7 K
ΔT/TCMB ~ 10-5
Wilkinson Microwave Anisotropy Probe

Basis functions: spherical harmonics
TCMB = 2.7 K
ΔT/TCMB ~ 10-5
Wilkinson Microwave Anisotropy Probe

So we understand the big bang and that there is dark energy

Or maybe not:
“After scrutinizing over seven years’ worth of WMAP data, as well as data from the BOOMERanG balloon experiment in Antarctica, Penrose and Gurzadyn say they have identified a series of concentric circles within the data. These circles show regions in the microwave sky in which the range of the radiation’s temperature is markedly smaller than elsewhere. According to the researchers, the patterns correspond to gravitational waves formed by the collision of black holes in the aeon that preceded our own, and they published these claims in a paper submitted to arXiv” (Physics World).


Galaxy clustering Data from the Sloan Digital Sky Survey

SDSS galaxy distribution (Those with spectra)

Gamma-ray burst locations on the sky
Is there any clustering?
How would you test this?

“Flights within the US were grounded because of the attacks, and incoming international flights were diverted to Canada. Services resumed within a few days but it took years for the market to recover.“
From the BBC web page 04 Sept 2006
Example of a “change point”
Example of a transient event identifiable through data mining of article content:

Is there a periodicity in this time series?

• Repeat for L epochs spanning N=T/P spin periods
• N ~ 108 – 1010 cycles in one year • ⇒ P determined to
Basics of Pulsars as Clocks
• Signal average M pulses • Time-tag using template fitting
P …M×P
W
• J1909-3744: eccentricity < 0.00000013 (Jacoby et al.)
• B1937+21: P = 0.0015578064924327±0.0000000000000004 s
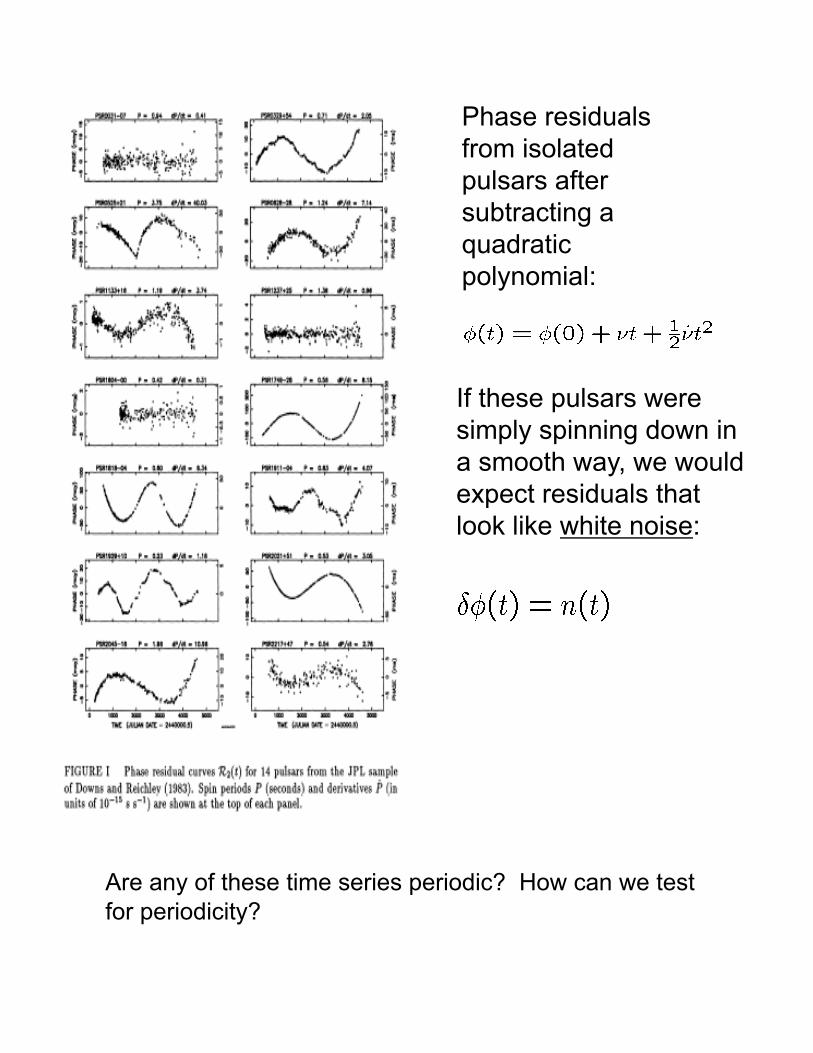
Phase residuals from isolated pulsars after subtracting a quadratic polynomial:
If these pulsars were simply spinning down in a smooth way, we would expect residuals that look like white noise:
Are any of these time series periodic? How can we test for periodicity?

Phase residuals from isolated pulsars after subtracting a quadratic polynomial:
If these pulsars were simply spinning down in a smooth way, we would expect residuals that look like white noise:
For these pulsars, the residuals are mostly caused by spin noise in the pulsar
Are any of these time series periodic? How can we test for periodicity?

Noise in Timing Residuals from G. Hobbs
Long period pulsars
MSPs

How Good are Pulsars as Clocks?
Clock processes are similar to random walks or Brownian motion. What are the best ways to characterize such processes?
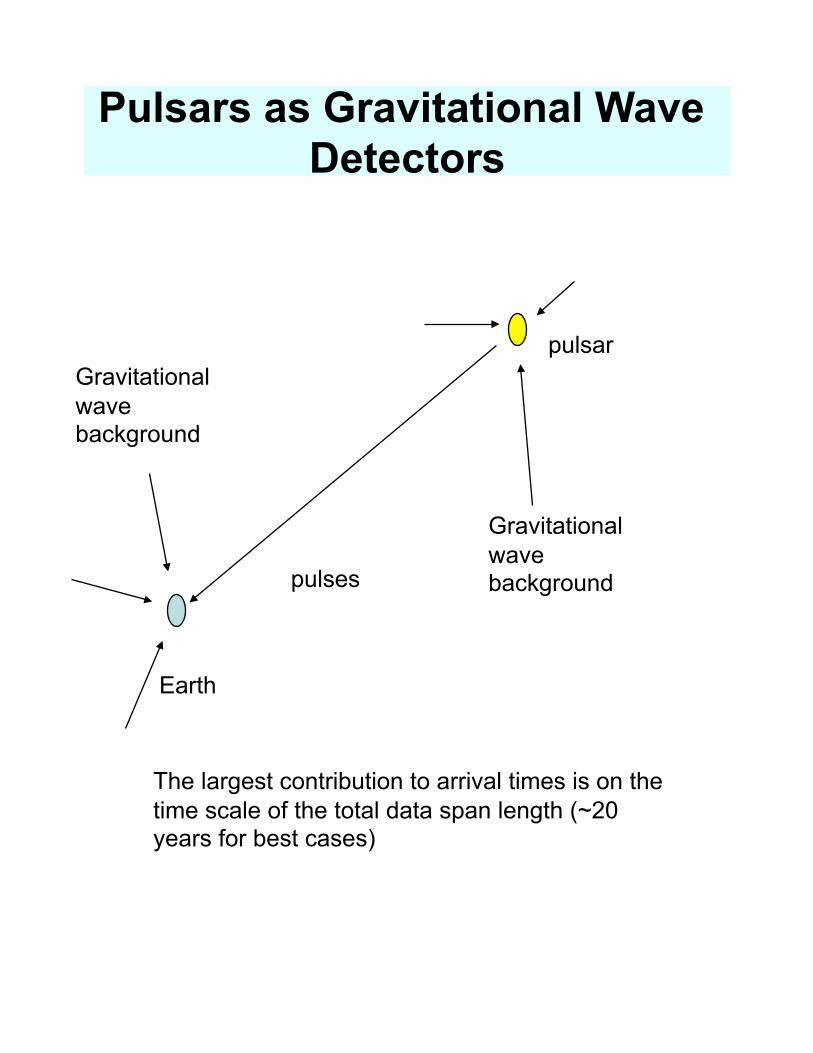
Pulsars as Gravitational Wave Detectors
Earth
pulsar
pulses
Gravitational wave background
Gravitational wave background
The largest contribution to arrival times is on the time scale of the total data span length (~20 years for best cases)

MSP J1909-3744 P=3 ms + WD
Jacoby et al. (2005)
Weighted σTOA = 74 ns
Shapiro delay
The best pulsar timing so far:

Correlation Function Between Pulsars
Correlation function of residuals vs angle between pulsars
Example power-law spectrum from merging supermassive black holes (Jaffe & Backer)
Estimation errors from: • dipole term from solar system
ephemeris errors
• red noise in the pulsar clock
• red interstellar noise
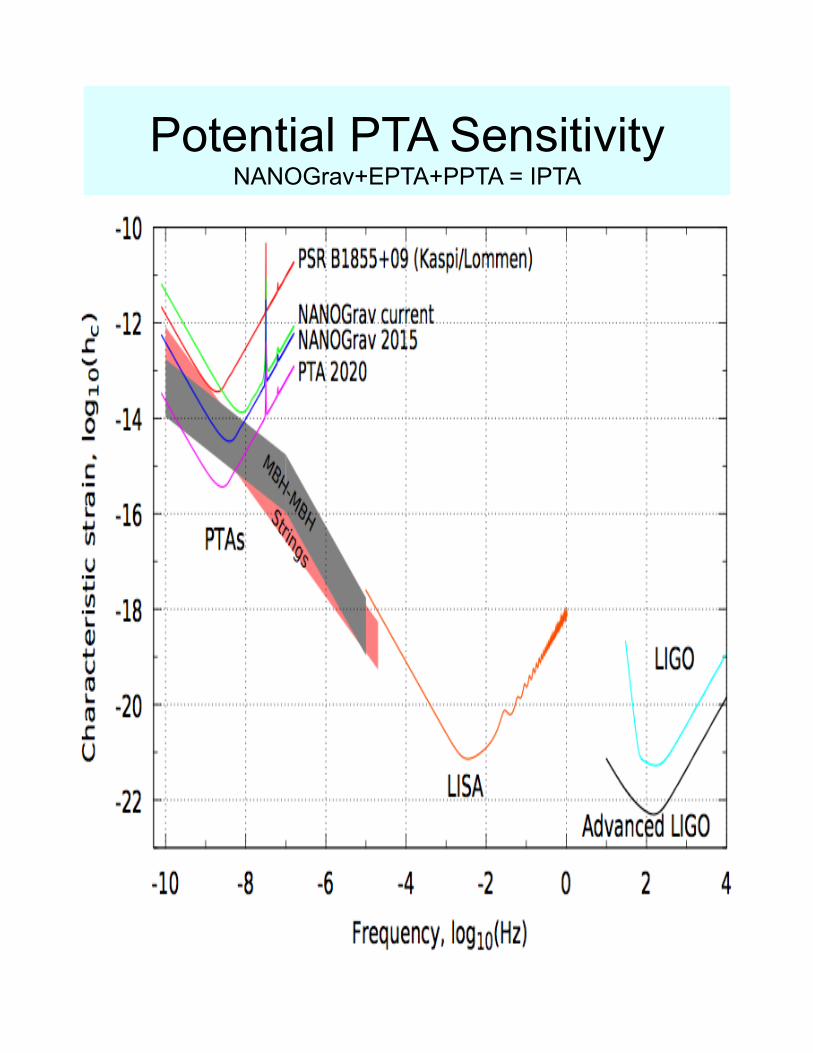
Potential PTA Sensitivity NANOGrav+EPTA+PPTA = IPTA