Embed Size (px)
Citation preview
IIE Transactions (2012) 44, 534–550Copyright C© “IIE”ISSN: 0740-817X print / 1545-8830 onlineDOI: 10.1080/0740817X.2011.596509
Statistical characterization of nanostructured materialsfrom severe plastic deformation in machining
MARCUS B. PERRY1, JEFFREY P. KHAROUFEH2,∗, SHASHANK SHEKHAR2, JIAZHAO CAI2
and M. RAVI SHANKAR2,3
1Department of Information Systems, Statistics & Management Science, The University of Alabama Tuscaloosa, AL 35487, USA2Department of Industrial Engineering, University of Pittsburgh, Pittsburgh, PA 15261, USAE-mail: [email protected] of Mechanical Engineering and Materials Science, University of Pittsburgh, Pittsburgh, PA 15261, USA
Received June 2010 and accepted May 2011
Endowing conventional microcrystalline materials with nanometer-scale grains at the surfaces can offer enhanced mechanical prop-erties, including improved wear, fatigue, and friction properties, while simultaneously enabling useful functionalizations with regardto biocompatibility, osseointegration, electrochemical performance, etc. To inherit such multifunctional properties from the surfacenanograined state, existing approaches often use coatings that are created through an array of secondary processing techniques (e.g.,physical or chemical vapor deposition, surface mechanical attrition treatment, etc.). Obviating the need for such surface processing,recent empirical evidence has demonstrated the introduction of integral surface nanograin structures on bulk materials as a result ofsevere plastic deformation during machining-based processes. Building on these observations, if empirically driven, process–structuremappings can be developed, it may be possible to engineer enhanced nanoscale surface microstructures directly using machiningprocesses while simultaneously incorporating them within existing computer-numeric-controlled manufacturing systems. Toward thisend, this article provides a statistical characterization of nanograined metals created by severe plastic deformation in machining-based processes that maps machining conditions to the resulting microstructure, namely, the mean grain size. A specialized designedexperiments approach is used to hypothesize and test a linear mixed-effects model of two important machining parameters. Unlikestandard analysis approaches, the statistical dependence between subsets of experimental grain size observations is accounted for andit is shown that ignoring this inherent dependence can yield misleading results for the mean response function. The statistical modelis applied to pure copper specimens to identify the factors that most significantly contribute to variability in the mean grain size andis shown to accurately predict the mean grain size under a few scenarios.
Keywords: Nanostructured materials, mean grain size, mixed-effects model
1. Introduction
Manufacturing processes have always sought to endowaccurate geometric and topographical attributes whilesimultaneously controlling performance attributes such asstrength, fatigue life, wear behavior, biological response,corrosion resistance, and others. It is well known thatcontrolling the manufacturing process via a science-basedunderstanding of the process–structure–performance triadcan significantly expand the product design space andlead to state-of-the-art manufacturing processes that yieldproducts with superior performance properties. Emergingthrusts in nanomanufacturing and nanomaterials havesought to manipulate the organization of crystal structureat nanometer length scales to favorably modulate the
∗Corresponding author
property combinations. Nanocrystallinity on surfacesdemonstrably enhances mechanical, biological, andcorrosion properties as compared to the conventionalmicrocrystalline state (Di Schino et al., 2003; Mishra andBalasubramaniam, 2004; Misra et al., 2009b). As a result,some of the broadest efforts in the area of nanomaterialshave focused on creating controlled nanoscale microstruc-tures at the surfaces, often using an array of secondaryprocessing approaches, including chemical and physicaldeposition techniques, mechanical surface modification,etc. Much of this nanoprocessing often seeks to enhancethe underlying microscale crystalline structure that typ-ically results from several conventional metal-formingoperations such as rolling, forging, and others, where theprocess–structure mappings are generally well established.
In contrast to conventional metal forming, an un-derstanding of the evolution of microstructures frommachining-based metal cutting processes is complex and
0740-817X C© 2012 “IIE”
Dow
nloa
ded
by [
Uni
vers
ity O
f Pi
ttsbu
rgh]
at 0
4:24
02
Sept
embe
r 20
12
Characterization of nanostructured materials 535
still incomplete. However, emerging evidence suggests thatpeculiarities of the metal cutting process might, in fact,offer opportunities for controlling nanoscale surface grainstructures (Calistes et al., 2009) to obviate the need forsecondary nanomanufacturing steps aimed at engineer-ing multifunctional properties. To date, manufacturingengineers and scientists have predominantly remainedfocused on the metrology and modeling of the surfacegeometry, roughness, mechanics of material removal,and dynamics of the cutting forces, despite the fact thatit is known that material removal by metal cutting is aSevere Plastic Deformation (SPD) process that imposesvery large strains (�1) at high rates (up to 105/s) andcoupled dynamic temperature rise in the deformationzone. Even a cursory application of the principles ofphysical metallurgy indicates that such deformation mustentail dramatic microstructure transformations involvingthe accumulation of abnormally high defect densities inthe deformation zone. When high defect densities areaccumulated, the chip and the machined surface willinherit a severely transformed nanoscale structure thatdiffers dramatically from the bulk material. Nanoscaletransformations involving the accumulation, dynamicrearrangement, and recovery of high-density crystaldefects under SPD conditions can bequeath an integralnanograined microstructure at the freshly generatedsurfaces. Such nanograined surface microstructures canplay a central role in determining performance attributessuch as fatigue life, wear behavior, or corrosion resistancethat determine the life cycle of machined components in anarray of critical engineering applications. However, despitethe prevalence of machining operations in the manufactureof critical components, the manufacturing community doesnot currently possess a holistic data or knowledge base ofthe surface microstructures and crystallography inheritedby components subsequent to machining operations.
From a technological standpoint, the ability to introducesurface nanograin structures on bulk materials directlythrough machining-based processes can offer a scalablemanufacturing framework for engineering novel surfaces.Currently, approaches for enhancing surface mechanicalproperties utilize coatings that are created through an ar-ray of secondary processing techniques such as physical orchemical vapor deposition or mechanical treatments suchas surface mechanical attrition treatment (Roland et al.,2006). If empirically derived process–structure mappingscan be developed using the approaches delineated herein,it may be possible to engineer enhanced ultra-fine surfacemicrostructures directly using machining processes whilesimultaneously incorporating them within existing man-ufacturing systems. From a materials processing scienceperspective, these mappings can help elucidate the evolu-tion of grain structure under the simultaneous applicationof high strains, strain rates, and dynamic temperature, aregime that is currently characterized by remarkably sparseempirical data sets.
It has been recently demonstrated that the SPD duringchip formation by machining leads to both a nanostruc-tured chip and a nanostructured machined surface, evenwhen the bulk material is a conventional microcrystallinesystem (Shankar et al., 2005, 2006, 2007; Sevier et al.,2006; Calistes et al., 2009). This discovery has crucialimplications for the machining and broader manufacturingcommunities. It is well known that the nanostructuredstate involves strength, wear, fretting, fatigue, biological,and electro-chemical properties that are substantiallydifferent than those of the conventional microcrystallinestate (Valiev et al., 2000; Di Schino et al., 2003; Mishraand Balasubramaniam, 2004; Zhang et al., 2005; Iglesiaset al., 2007). Therefore, it is crucial to consider thenanostructural nature of the machined component’ssurface during the design, manufacture, and life cycleanalysis of the product, particularly for applications inwhich the surface properties and structure are critical.To this end, it is imperative to (i) develop a metrologicalframework for characterizing the nanostructural nature ofmachined surfaces and (ii) create process–microstructuremappings that relate surface microstructures to machin-ing parameters. Neither of these frameworks currentlyexists.
The main objective of this article is to take a firststep toward addressing the latter need by developingand analyzing a statistical model of surface microstruc-ture via a designed experiments approach that can beused to map a few machining parameters to the result-ing transformed microstructure. The implications of de-veloping such a framework are potentially enormous. Ifthese process–microstructure mappings can be harnessedto custom design surface nanostructures, it will be pos-sible to directly utilize machining-based processes to cre-ate refined nanograins on surfaces to exploit the uniquephenomena operative at the nanoscale and endow multi-functional property combinations. Furthermore, if the po-tential for significant technological breakthroughs wroughtby recent research on nanostructured/nanocrystalline ma-terials is any indication (Valiev et al., 2000, 2007), theimplications of a simple machining-based approach forcreating nanograined surfaces can be expected to stimu-late innovative product and manufacturing process designopportunities.
Currently, there is a significant gap in empirical data anda gap in what is known about the microstructures resultingfrom SPD in machining. Addressing the data gap is espe-cially urgent because there have been no comprehensive,quantitative, modern electron microscopic studies of thenanostructures generated by machining operations. How-ever, even if empirical data are made available, a formalizedstatistical framework for relating microstructural char-acteristics to the machining parameters has not yet beenestablished. Our aim here is to lay a foundation for address-ing the second point. To this end, we present non-standardstatistical techniques that can be used to relate common
Dow
nloa
ded
by [
Uni
vers
ity O
f Pi
ttsbu
rgh]
at 0
4:24
02
Sept
embe
r 20
12
536 Perry et al.
machining parameters to the resulting refined grain struc-tures from SPD. Although the resulting microstructure canbe described by an estimated grain size distribution, ourfocus here is the characterization of the mean grain size.
The remainder of the article is organized as follows. Sec-tion 2 reviews literature pertaining to the analysis of mi-crostructure that is relevant to our work. Section 3 describesthe experimental test bed we will use to develop and ana-lyze our statistical model. In Section 4, we formally describethe statistical model for characterizing the microstructureof chips obtained from machining processes (namely themean grain size). Variants of the general model can be usedto account for different model assumptions. Section 5 il-lustrates the use of the model, describes important analysispitfalls, and summarizes the results of the statistical experi-ments. Finally, Section 6 provides some concluding remarksand discusses future potential applications of this work.
2. Relevant literature
Machining processes impart SPD to the chip and the newlyformed surface that results in a microstructure that dif-fers significantly from that of the bulk material. More-over, machining induces large strains at high strain ratesalong with a dynamic in situ temperature rise, which engen-ders nanograined or ultra-fine grained microstructure inthe chip as well as on the freshly machined surface (Shaw,1984; Shankar et al., 2005, 2006, 2008; Huang et al., 2008;Cai et al., 2009; Calistes et al., 2009). As noted in Section1, microstructure is the central element that determinesthe mechanical and other characteristic responses of thematerial.
Nanostructured materials have been shown to exhibit su-perior mechanical properties (e.g., increased yield strengthup to an order of magnitude higher than their coarse-grained counterparts) and mass transport properties (e.g.,enhanced diffusion, which can be several orders of mag-nitude higher). Some important studies verifying thesuperior properties of nanostructured surfaces includeHorvath (1990), Hofler et al. (1993), Youngdahl et al.(2001), Valiev et al. (2002), and Tao et al. (2007). Mate-rials with a nanostructured surface layer have also beenshown to be endowed with improved mechanical and othermicrostructure-dependent multifunctional characteristicslike corrosion and electrochemical and biological responses(Hofler et al., 1993; Tao et al., 2003; Roland et al., 2006;Op’t Hoog et al., 2008; Shi and Han, 2008; Misra et al.,2009a, 2009b; Raman and Gupta, 2009). For example, itwas shown in Tao et al. (2003) that nanostructured surfacesof thickness as small as 50 µm can enhance the wear proper-ties in iron, while Roland et al. (2006) have shown improvedfatigue life for steel with a nanograined layer smaller than100 µm in thickness. In addition to improved wear proper-ties, improved oxidation resistance and corrosion resistanceproperties have been demonstrated as a result of finer grain
size (Op’t Hoog et al., 2008; Raman and Gupta, 2009). An-other intriguing characteristic displayed by nanostructuredsurfaces is their biological responses, such as the enhancedcell–substrate interaction for preosteoblasts on nanostruc-tured and ultra-fine-grained stainless steel (Misra et al.,2009a, 2009b). In those works, the authors demonstratedthat materials with nano- and ultra-fine-grained surfacesamplify cell adhesion, viability, and interconnectivity ofpreosteoblasts in cell cultures as compared to that in coarse-grained surfaces. All of these properties and phenomena area direct function of the microstructure of the surface thatcan be quantitatively characterized using two important at-tributes: the grain size distribution and the distribution ofgrain and sub-grain misorintations.
Statistical methods have been employed to extract in-formation from microstructures and to determine materialproperties and the cause-and-effect relationship withinitial processing parameters (Torquato, 2002; Al-Ostaz etal., 2007; Grosselle et al., 2010). Some of these works havefocused on using statistical methods, like correlation tech-niques, to reconstruct the complete microstructure in orderto determine material properties of disordered materials(Torquato, 2002). While this may be a very useful method, itis very resource intensive and not easy to implement for allconditions. Moreover, it does not establish a direct relationbetween the initial parameters and the microstructure.
Other researchers have attempted to quantify mi-crostructural information and relate it to materialproperties (Al-Ostaz et al., 2007; Grosselle et al., 2010).Al-Ostaz et al. (2007) have statistically characterized therandomness in morphology in terms of spatial dispersionof inclusions in composites with the aim of classifying mi-crostructural arrangements and relating them to the localstress fields. Grosselle et al. (2010) have used traditionalDesign-Of-Experiment (DOE) techniques and Analysis OfVariance (ANOVA) to determine the significance of factors(e.g., casting speed, copper content, titanium content, heattreatment) on mechanical properties (e.g., yield strengthand ductility). While initial processing parameters indeedaffect the material properties, these changes in propertiesare mediated through changes in microstructure, and thecomplex interplay of the initial conditions can result inunexpected changes in properties that may not be captureddirectly. For example, in the case of machining, strain andstrain rate lead to an in situ temperature rise in the materialand can result in recovery and recrystallization. Thus,while it is expected that an increase in strain and strain-rateleads to finer grain size (and, hence, higher strength), atvery high strain and strain rate, the ensuing temperaturerise can result in bimodal grain size distributions thatyield appealing property combinations such as highductility and high yield strength (Shekhar et al., 2009,2011). These transformations are best captured in termsof microstructural changes, rather than directly relating toproperty changes, which are an outcome of the complex in-terplay of these transformations in conjunction with other
Dow
nloa
ded
by [
Uni
vers
ity O
f Pi
ttsbu
rgh]
at 0
4:24
02
Sept
embe
r 20
12
Characterization of nanostructured materials 537
parameters. Moreover, once the microstructure can becharacterized based on these initial conditions, it canbe used to predict various microstructure-dependentcharacteristics and phenomenon exhibited by the material,and its usefulness will not be limited to any one specificproperty. Grosselle et al. (2010) have also employedstandard DOE techniques to relate initial parameters tosome of the microstructural features like precipitate sizeand texture. However, they look into specific properties bysimple correlation techniques.
The primary aim of this research is to create a predic-tive statistical model of ultra-fine-grained structures as afunction of important machining parameters, which, inturn, can be used to determine the mechanical and othermicrostructure-controlled properties. We consider as themain response the grain size that results from a cuttingoperation. A specialized designed experiments approach isproposed that is capable of handling the non-normality ofthe grain size distribution and the inherent dependence ofgrain size observations. This framework can be extended tomicrostructures created by other processes. Before present-ing our statistical model, we first describe the experimentalsetup and the means by which samples were created andanalyzed.
3. Description of experiments
As a test bed for our proposed approach, we consideredthe process of machining copper bars and subsequentlyusing electron microscopy to statistically examine the re-sulting microstructure, namely, the distribution of grainsizes. In this study, we examine the grain structure in a chipthat has undergone SPD by machining. Prior research hasdemonstrated that chip formation in machining occurs in afan-shaped deformation zone ahead of the cutting tool thatis the progenitor of similar levels of extreme deformationin both the chip and the freshly created, machined surface(Huang et al., 2008). This has often been shown to resultin a nanostructured chip that closely resembles the ultra-fine-grain structure of the machined surface (Calistes et al.,2009). Therefore, it is reasonable to treat the chip as a com-mon archetype of the transformed grain structure resultingfrom SPD in machining for a given strain and strain rate.
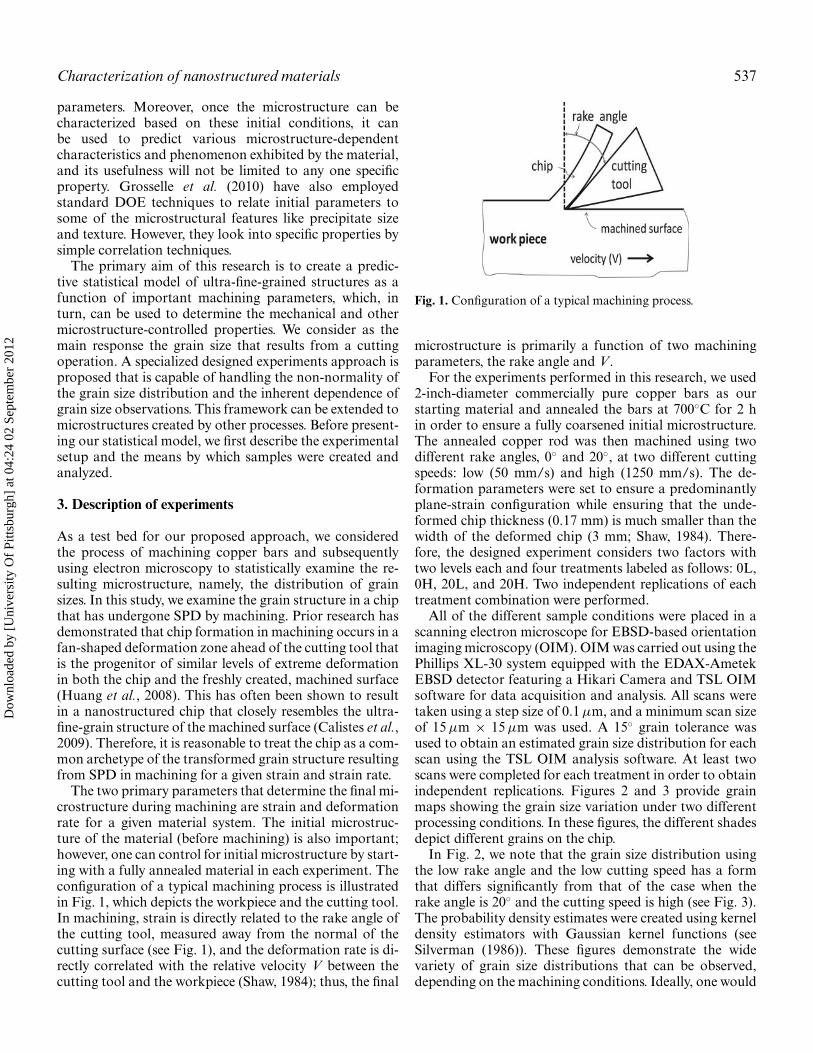
The two primary parameters that determine the final mi-crostructure during machining are strain and deformationrate for a given material system. The initial microstruc-ture of the material (before machining) is also important;however, one can control for initial microstructure by start-ing with a fully annealed material in each experiment. Theconfiguration of a typical machining process is illustratedin Fig. 1, which depicts the workpiece and the cutting tool.In machining, strain is directly related to the rake angle ofthe cutting tool, measured away from the normal of thecutting surface (see Fig. 1), and the deformation rate is di-rectly correlated with the relative velocity V between thecutting tool and the workpiece (Shaw, 1984); thus, the final
Fig. 1. Configuration of a typical machining process.
microstructure is primarily a function of two machiningparameters, the rake angle and V.
For the experiments performed in this research, we used2-inch-diameter commercially pure copper bars as ourstarting material and annealed the bars at 700◦C for 2 hin order to ensure a fully coarsened initial microstructure.The annealed copper rod was then machined using twodifferent rake angles, 0◦ and 20◦, at two different cuttingspeeds: low (50 mm/s) and high (1250 mm/s). The de-formation parameters were set to ensure a predominantlyplane-strain configuration while ensuring that the unde-formed chip thickness (0.17 mm) is much smaller than thewidth of the deformed chip (3 mm; Shaw, 1984). There-fore, the designed experiment considers two factors withtwo levels each and four treatments labeled as follows: 0L,0H, 20L, and 20H. Two independent replications of eachtreatment combination were performed.
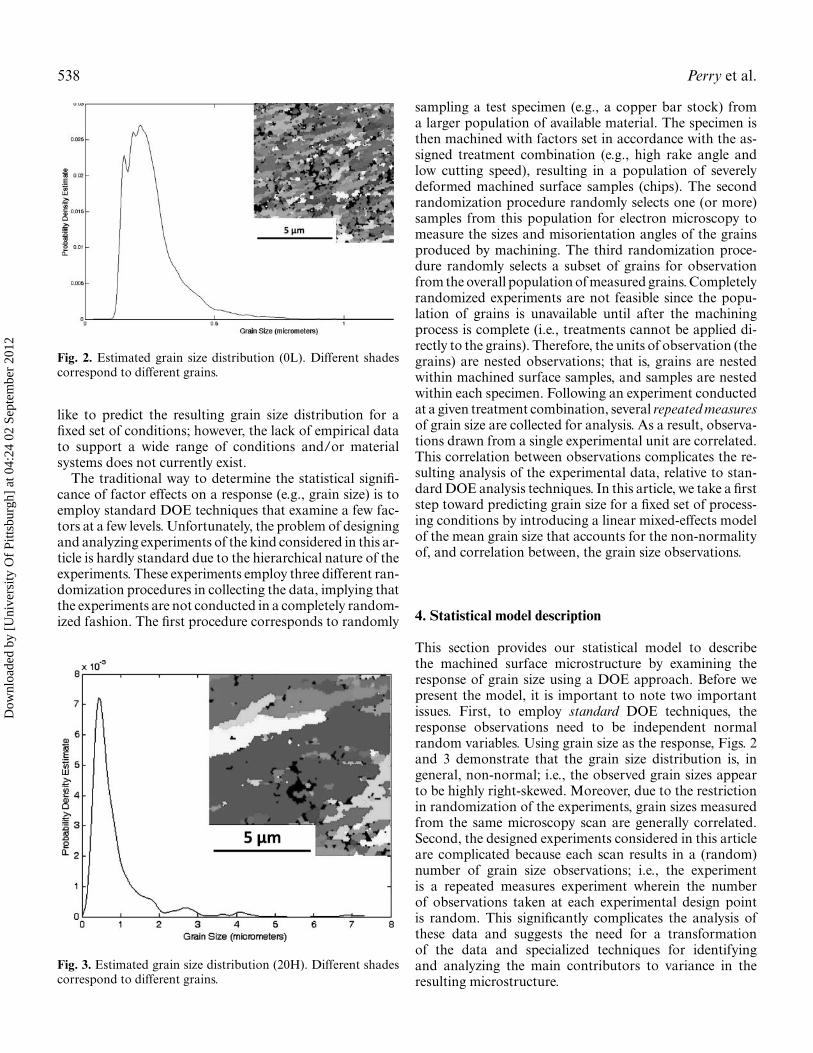
All of the different sample conditions were placed in ascanning electron microscope for EBSD-based orientationimaging microscopy (OIM). OIM was carried out using thePhillips XL-30 system equipped with the EDAX-AmetekEBSD detector featuring a Hikari Camera and TSL OIMsoftware for data acquisition and analysis. All scans weretaken using a step size of 0.1 µm, and a minimum scan sizeof 15 µm × 15 µm was used. A 15◦ grain tolerance wasused to obtain an estimated grain size distribution for eachscan using the TSL OIM analysis software. At least twoscans were completed for each treatment in order to obtainindependent replications. Figures 2 and 3 provide grainmaps showing the grain size variation under two differentprocessing conditions. In these figures, the different shadesdepict different grains on the chip.
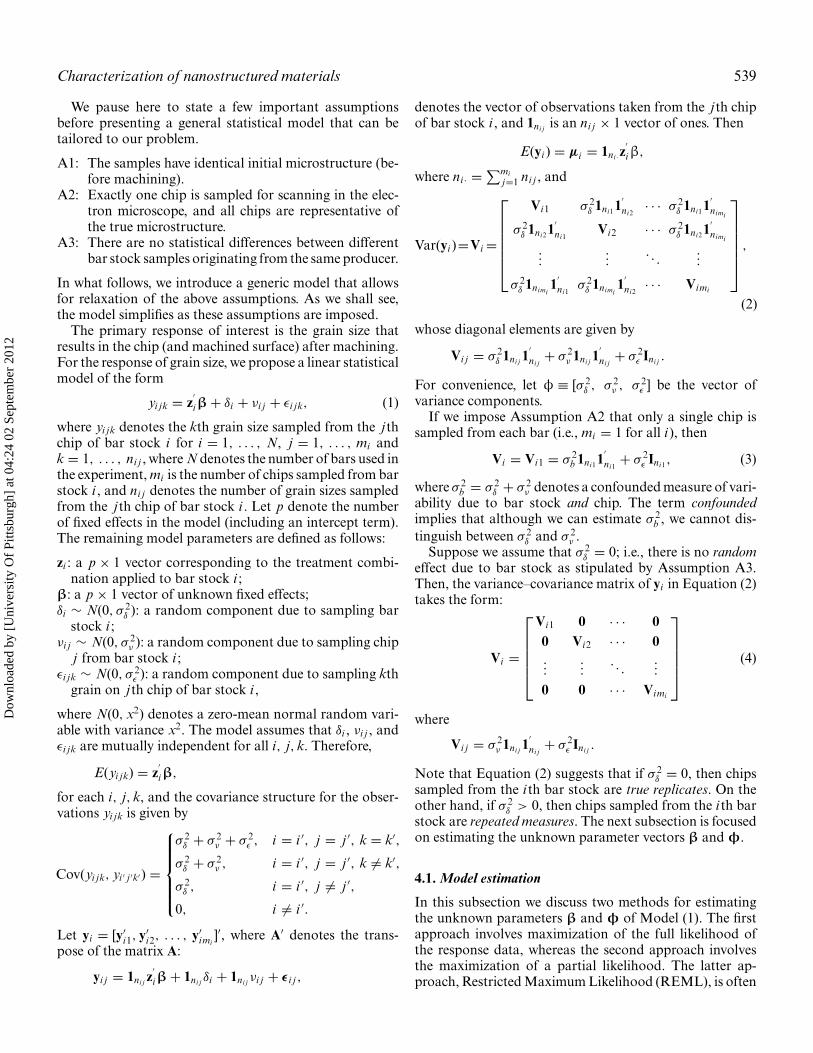
In Fig. 2, we note that the grain size distribution usingthe low rake angle and the low cutting speed has a formthat differs significantly from that of the case when therake angle is 20◦ and the cutting speed is high (see Fig. 3).The probability density estimates were created using kerneldensity estimators with Gaussian kernel functions (seeSilverman (1986)). These figures demonstrate the widevariety of grain size distributions that can be observed,depending on the machining conditions. Ideally, one would
Dow
nloa
ded
by [
Uni
vers
ity O
f Pi
ttsbu
rgh]
at 0
4:24
02
Sept
embe
r 20
12
538 Perry et al.
Fig. 2. Estimated grain size distribution (0L). Different shadescorrespond to different grains.
like to predict the resulting grain size distribution for afixed set of conditions; however, the lack of empirical datato support a wide range of conditions and/or materialsystems does not currently exist.
The traditional way to determine the statistical signifi-cance of factor effects on a response (e.g., grain size) is toemploy standard DOE techniques that examine a few fac-tors at a few levels. Unfortunately, the problem of designingand analyzing experiments of the kind considered in this ar-ticle is hardly standard due to the hierarchical nature of theexperiments. These experiments employ three different ran-domization procedures in collecting the data, implying thatthe experiments are not conducted in a completely random-ized fashion. The first procedure corresponds to randomly
Fig. 3. Estimated grain size distribution (20H). Different shadescorrespond to different grains.
sampling a test specimen (e.g., a copper bar stock) froma larger population of available material. The specimen isthen machined with factors set in accordance with the as-signed treatment combination (e.g., high rake angle andlow cutting speed), resulting in a population of severelydeformed machined surface samples (chips). The secondrandomization procedure randomly selects one (or more)samples from this population for electron microscopy tomeasure the sizes and misorientation angles of the grainsproduced by machining. The third randomization proce-dure randomly selects a subset of grains for observationfrom the overall population of measured grains. Completelyrandomized experiments are not feasible since the popu-lation of grains is unavailable until after the machiningprocess is complete (i.e., treatments cannot be applied di-rectly to the grains). Therefore, the units of observation (thegrains) are nested observations; that is, grains are nestedwithin machined surface samples, and samples are nestedwithin each specimen. Following an experiment conductedat a given treatment combination, several repeated measuresof grain size are collected for analysis. As a result, observa-tions drawn from a single experimental unit are correlated.This correlation between observations complicates the re-sulting analysis of the experimental data, relative to stan-dard DOE analysis techniques. In this article, we take a firststep toward predicting grain size for a fixed set of process-ing conditions by introducing a linear mixed-effects modelof the mean grain size that accounts for the non-normalityof, and correlation between, the grain size observations.
4. Statistical model description
This section provides our statistical model to describethe machined surface microstructure by examining theresponse of grain size using a DOE approach. Before wepresent the model, it is important to note two importantissues. First, to employ standard DOE techniques, theresponse observations need to be independent normalrandom variables. Using grain size as the response, Figs. 2and 3 demonstrate that the grain size distribution is, ingeneral, non-normal; i.e., the observed grain sizes appearto be highly right-skewed. Moreover, due to the restrictionin randomization of the experiments, grain sizes measuredfrom the same microscopy scan are generally correlated.Second, the designed experiments considered in this articleare complicated because each scan results in a (random)number of grain size observations; i.e., the experimentis a repeated measures experiment wherein the numberof observations taken at each experimental design pointis random. This significantly complicates the analysis ofthese data and suggests the need for a transformationof the data and specialized techniques for identifyingand analyzing the main contributors to variance in theresulting microstructure.
Dow
nloa
ded
by [
Uni
vers
ity O
f Pi
ttsbu
rgh]
at 0
4:24
02
Sept
embe
r 20
12
Characterization of nanostructured materials 539
We pause here to state a few important assumptionsbefore presenting a general statistical model that can betailored to our problem.
A1: The samples have identical initial microstructure (be-fore machining).
A2: Exactly one chip is sampled for scanning in the elec-tron microscope, and all chips are representative ofthe true microstructure.
A3: There are no statistical differences between differentbar stock samples originating from the same producer.
In what follows, we introduce a generic model that allowsfor relaxation of the above assumptions. As we shall see,the model simplifies as these assumptions are imposed.
The primary response of interest is the grain size thatresults in the chip (and machined surface) after machining.For the response of grain size, we propose a linear statisticalmodel of the form
yi jk = z′iβ + δi + νi j + εi jk, (1)
where yi jk denotes the kth grain size sampled from the j thchip of bar stock i for i = 1, . . . , N, j = 1, . . . , mi andk = 1, . . . , ni j , where N denotes the number of bars used inthe experiment, mi is the number of chips sampled from barstock i , and ni j denotes the number of grain sizes sampledfrom the j th chip of bar stock i . Let p denote the numberof fixed effects in the model (including an intercept term).The remaining model parameters are defined as follows:
zi : a p × 1 vector corresponding to the treatment combi-nation applied to bar stock i ;
β: a p × 1 vector of unknown fixed effects;δi ∼ N(0, σ 2
δ ): a random component due to sampling barstock i ;
νi j ∼ N(0, σ 2ν ): a random component due to sampling chip
j from bar stock i ;εi jk ∼ N(0, σ 2
ε ): a random component due to sampling kthgrain on j th chip of bar stock i ,
where N(0, x2) denotes a zero-mean normal random vari-able with variance x2. The model assumes that δi , νi j , andεi jk are mutually independent for all i, j, k. Therefore,
E(yi jk) = z′iβ,
for each i, j, k, and the covariance structure for the obser-vations yi jk is given by
Cov(yi jk, yi ′ j ′k′) =
⎧⎪⎪⎪⎪⎨⎪⎪⎪⎪⎩
σ 2δ + σ 2
ν + σ 2ε , i = i ′, j = j ′, k = k′,
σ 2δ + σ 2
ν , i = i ′, j = j ′, k �= k′,
σ 2δ , i = i ′, j �= j ′,
0, i �= i ′.
Let yi = [y′i1, y′
i2, . . . , y′imi
]′, where A′ denotes the trans-pose of the matrix A:
yi j = 1ni j z′iβ + 1ni j δi + 1ni j νi j + εi j ,
denotes the vector of observations taken from the j th chipof bar stock i , and 1ni j is an ni j × 1 vector of ones. Then
E(yi ) = µi = 1ni ·z′iβ,
where ni · = ∑mij=1 ni j , and
Var(yi )=Vi =
⎡⎢⎢⎢⎢⎢⎣
Vi1 σ 2δ 1ni1 1
′ni2
· · · σ 2δ 1ni1 1
′nimi
σ 2δ 1ni2 1
′ni1
Vi2 · · · σ 2δ 1ni2 1
′nimi
......
. . ....
σ 2δ 1nimi
1′ni1
σ 2δ 1nimi
1′ni2
· · · Vimi
⎤⎥⎥⎥⎥⎥⎦ ,
(2)
whose diagonal elements are given by
Vi j = σ 2δ 1ni j 1
′ni j
+ σ 2ν 1ni j 1
′ni j
+ σ 2ε Ini j .
For convenience, let φ ≡ [σ 2δ , σ 2
ν , σ 2ε ] be the vector of
variance components.If we impose Assumption A2 that only a single chip is
sampled from each bar (i.e., mi = 1 for all i ), then
Vi = Vi1 = σ 2b 1ni1 1
′ni1
+ σ 2ε Ini1, (3)
where σ 2b = σ 2
δ + σ 2ν denotes a confounded measure of vari-
ability due to bar stock and chip. The term confoundedimplies that although we can estimate σ 2
b , we cannot dis-tinguish between σ 2
δ and σ 2ν .
Suppose we assume that σ 2δ = 0; i.e., there is no random
effect due to bar stock as stipulated by Assumption A3.Then, the variance–covariance matrix of yi in Equation (2)takes the form:
Vi =
⎡⎢⎢⎢⎢⎣
Vi1 0 · · · 00 Vi2 · · · 0...
.... . .
...0 0 · · · Vimi
⎤⎥⎥⎥⎥⎦ (4)
where
Vi j = σ 2ν 1ni j 1
′ni j
+ σ 2ε Ini j .
Note that Equation (2) suggests that if σ 2δ = 0, then chips
sampled from the i th bar stock are true replicates. On theother hand, if σ 2
δ > 0, then chips sampled from the i th barstock are repeated measures. The next subsection is focusedon estimating the unknown parameter vectors β and φ.
4.1. Model estimation
In this subsection we discuss two methods for estimatingthe unknown parameters β and φ of Model (1). The firstapproach involves maximization of the full likelihood ofthe response data, whereas the second approach involvesthe maximization of a partial likelihood. The latter ap-proach, Restricted Maximum Likelihood (REML), is often
Dow
nloa
ded
by [
Uni
vers
ity O
f Pi
ttsbu
rgh]
at 0
4:24
02
Sept
embe
r 20
12

540 Perry et al.
preferred over the former due to its effectiveness in elimi-nating the bias in the variance component estimates as a re-sult of estimating the fixed-effects component of the model.However, arguments such as those given in Harville (1977)suggest that there may not be a clear “winner” betweenthe two methods. Therefore, we present both methods forcompleteness. The following developments are for the casewhere σ 2
δ = 0, as stipulated by Assumption A3.
4.1.1. Method of maximum likelihoodThe Maximum Likelihood (ML) approach to parameterestimation in the general linear mixed-effects model wasfirst developed by Hartley and Rao (1967). To apply theirapproach to our experiments, let y = [y
′1, y
′2, . . . , y
′N]′
denote the a × 1 observed response vector for the exper-iment, where a = ∑
i∑
j ni j = ∑i ni · denotes the total
number of observations. Then, under multivariate normalmodel assumptions, the log-likelihood function of β andφ is given by
�(φ,β|y) = −N∑
i=1
mi∑j=1
ln |Vi j | −N∑
i=1
mi∑j=1
(yi j − 1ni j z′iβ)′V−1
i j
× (yi j − 1ni j z′iβ), (5)
where ln = loge and Vi j denotes the variance–covariancematrix corresponding to the observations obtained fromthe j th chip of bar stock i . In what follows, note that Vi jcan be written as
Vi j = φ1Vi j1 + φ2Vi j2, (6)
where Vi j1 = 1ni j 1′ni j
, Vi j2 = Ini j , and φ1 and φ2 areunknown parameters. To derive the stationary equations,we first differentiate the log-likelihood function (5) withrespect to the unknown parameters φr to obtain
∂�(φ,β|y)∂φr
= −N∑
i=1
mi∑j=1
tr(V−1
i j Vi jr)+
N∑i=1
mi∑j=1
ρi jr ,
r = 1, 2,
where tr(A) denotes the trace of matrix A and
ρi jr = (yi j − 1ni j z′iβ)′V−1
i j Vi jr V−1i j (yi j − 1ni j z
′iβ).
Note that we can write:
tr(V−1
i j Vi jr) = φ1ωi jr1 + φ2ωi jr2,
where
ωi jrs = tr(V−1
i j Vi jr V−1i j Vi j s
),
for s = 1, 2. Therefore, if we define the 2 × 2 matrices �i j ={ωi jrs}, then the stationary equations for any given β are
N∑i=1
mi∑j=1
�i jφ =N∑
i=1
mi∑j=1
ρi j ,
where
ρi j =[
(yi j − 1ni j z′iβ)′V−1
i j 1ni j 1′ni j
V−1i j (yi j − 1ni j z
′iβ)
(yi j − 1ni j z′iβ)′V−1
i j V−1i j (yi j − 1ni j z
′iβ)
],
and thus the estimate of φ is obtained iteratively by
φ(β) =⎛⎝ N∑
i=1
mi∑j=1
�i j
⎞⎠
−1⎛⎝ N∑
i=1
mi∑j=1
ρi j
⎞⎠ .
The stationary equations with respect to β are easilyshown to be⎡
⎣ N∑i=1
mi∑j=1
(zi 1′ni j
V−1i j 1ni j z
′i )
⎤⎦β =
N∑i=1
mi∑j=1
zi 1ni j V−1i j yi j ,
so that
β(φ)=⎡⎣ N∑
i=1
mi∑j=1
(zi 1′ni j
V−1i j 1ni j z
′i )
⎤⎦
−1⎡⎣ N∑
i=1
mi∑j=1
zi 1′ni j
V−1i j yi j
⎤⎦ .
This estimation procedure relies on the assumption thatthe yi values are mutually independent and multivariatenormal with mean vector µi and variance–covariance ma-trix Vi . Unfortunately, the grain size distributions tend tobe highly right-skewed (see Figs. 2 and 3) and thus are notwell approximated by the normal distribution. However,suppose there exists a transformation on yi such that thetransformed data, say yi (θ), follow the prescribed multivari-ate normal distribution. For our purposes in this research,we follow Box and Cox (1964) and consider the class ofpower transformations:
yi jk(θ) ={
(yθi jk − 1)/θ, θ �= 0,
ln(yi jk), θ = 0,(7)
for i = 1, . . . , N, j = 1, . . . , mi , and k = 1, . . . , ni j ,where θ denotes the transformation parameter. The Ja-cobian determinant of the transformation in Equation (7)is
J =N∏
i=1
mi∏j=1
ni j∏k=1
yθ−1i jk ,
and since the yi (θ) values are assumed to be mutually in-dependent, each following a multivariate normal distribu-tion, the log-likelihood function of the untransformed datais then given by
�(β,φ, θ)= (θ − 1)N∑
i=1
mi∑j=1
ni j∑k=1
ln(yi jk)− 12
N∑i=1
mi∑j=1
ln(|Vi j |)
−N∑
i=1
mi∑j=1
(yi j (θ) − 1ni j z′iβ)′V−1
i j (yi j (θ)−1ni j z′iβ).
(8)
Dow
nloa
ded
by [
Uni
vers
ity O
f Pi
ttsbu
rgh]
at 0
4:24
02
Sept
embe
r 20
12
Characterization of nanostructured materials 541
Our objective is to obtain the values of θ , β, and φ thatmaximize �(β,φ, θ).
Note that for a given value of the transformation param-eter θ , optimal (or near optimal) values of β and φ canbe obtained iteratively by performing the following stepswhich, as noted by Hocking (2003), are closely related tosecond-order gradient methods:
Step 1. Choose a value for θ and an initial vector for φ,
say φ(0)
;Step 2. Compute
V(0)i j = φ
(0)1 1ni j 1
′ni j
+ φ(0)2 Ini j
for i = 1, . . . , N and j = 1, . . . , mi , and
β(0)
(θ) =⎡⎣ N∑
i=1
mi∑j=1
(zi 1
′ni j
(V(0)
i j
)−11ni j z′i
)⎤⎦−1
×⎡⎣ N∑
i=1
mi∑j=1
zi 1′ni j
(V(0)
i j
)−1yi j (θ)
⎤⎦ ; .
Step 3. Use V(0)i j ’s and β
(0)(θ) to evaluate �i j and ρi j (θ) (for
i = 1, . . . , N and j = 1, . . . , mi ), then compute
φ(1) =
⎛⎝ N∑
i=1
mi∑j=1
�i j
⎞⎠
−1⎛⎝ N∑
i=1
mi∑j=1
ρi j (θ)
⎞⎠ ;
Step 4. Return to Step 2 and iterate until ‖φ(c) − φ(c−1)‖ <
ϑ , where c is the iteration index and ϑ (ϑ > 0) isthe convergence threshold.
These steps can be performed for a range of θ values, eachtime substituting the resulting estimates of β and φ inEquation (8) and retaining that value of θ that maximizes�(β,φ, θ). We suggest using values of θ in the set [−1, 1]in increments of 0.5. These values include a number of im-portant transformations such as the inverse, inverse square-root, natural logarithm, and square-root transformations,as well as the untransformed case (θ = 1). Values of θ out-side of this range can be more difficult to interpret in prac-tice. For each of the experiments that follow in Section 5,we chose the convergence threshold ϑ = 0.000 001.
4.1.2. REMLThe ML method outlined provides (asymptotically) con-sistent estimators of the variance components (see Hart-ley and Rao (1967)). However, for finite samples, it iswell known that the ML approach produces estimates ofthe variance components that are biased downwards (c.f.Patterson and Thompson (1971) and Corbeil and Searle(1976)). This bias stems from the loss in degrees of freedomas a result of estimating the fixed effects in the model. To il-lustrate this bias, consider a finite sample, X1, X2, . . . , XN,
drawn randomly from a normal population. If these obser-vations are independent and identically distributed withunknown mean µ and variance σ 2
X, then the maximumlikelihood estimator for σ 2
X is
S2X = 1
N
N∑i=1
(Xi − X)2, (9)
where X = (1/N)∑N
i=1 Xi . Applying the expectation oper-ator to Equation (9) we see that:
E(S2
X
) =(
N − 1N
)σ 2
X < σ 2X,
showing that S2X is biased downward. This bias is a direct
result of not accounting for the single degree of freedomloss due to estimating the population mean µ.
In order to remove the bias in the ML estimates of thevariance components, we employ REML as proposed byCorbeil and Searle (1976). The theoretical underpinnings ofthe method involve a factorization of the full log-likelihoodfunction of Equation (5) into two parts, one depending onlyon φ. The maximizer of this “partial” likelihood functionis then used to estimate the variance components. Details ofthe factorization are described in Corbiel and Searle (1976),Harville (1977), and Hocking (2003).
To incorporate the class of power transformations de-fined in Equation (7) for the REML case, we take an ap-proach similar to that described by Gurka et al. (2006). Weseek values of φ1, φ2, and θ that maximize the followingrestricted log-likelihood of the untransformed data:
�R(φ, θ) = (θ − 1)N∑
i=1
mi∑j=1
ni j∑k=1
ln(yi jk)
− ln
∣∣∣∣N∑
i=1
mi∑j=1
zi 1′i j V
−1i j 1i j z
′i
∣∣∣∣−N∑
i=1
mi∑j=1
ln |Vi j |
−N∑
i=1
mi∑j=1
(yi j (θ) − 1ni j z′i β)′V−1
i j (yi j (θ)−1ni j z′i β)
(10)
where yi j (θ) denotes the transformed ni j × 1 observationvector obtained from the j th chip of bar stock i , and
β = β(φ) =⎡⎣ N∑
i=1
mi∑j=1
(zi 1
′ni j
V−1i j 1ni j zi
)⎤⎦−1
×⎡⎣ N∑
i=1
mi∑j=1
zi 1′ni j
V−1i j yi j
⎤⎦ .
Obtaining REML estimates of the variance componentsfor any given value of θ can be accomplished in a waysimilar to the ML approach outlined above. Let Wi j =
Dow
nloa
ded
by [
Uni
vers
ity O
f Pi
ttsbu
rgh]
at 0
4:24
02
Sept
embe
r 20
12
542 Perry et al.
1ni j z′i and define the stacked design matrix W by
W = [W′11, W
′12, . . . , W
′1m1
, . . . , W′N1, W
′N2, . . . , W
′NmN
]′,(11)
with dimensions a × p, where a and p were defined pre-viously. Furthermore, define the a × a block diagonalmatrices
V =
⎡⎢⎢⎢⎢⎣
V11 0 · · · 00 V12 · · · 0...
.... . .
...0 0 · · · VNmN
⎤⎥⎥⎥⎥⎦ , (12)
V1 =
⎡⎢⎢⎢⎢⎣
V111 0 · · · 00 V121 · · · 0...
.... . .
...0 0 · · · VNmN1
⎤⎥⎥⎥⎥⎦ ,
and
V2 =
⎡⎢⎢⎢⎢⎣
V112 0 · · · 00 V122 · · · 0...
.... . .
...0 0 · · · VNmN2
⎤⎥⎥⎥⎥⎦ ,
where, for each i, j , Vi j , Vi j1, and Vi j2 are defined as inEquation (6). Finally, define the stacked a × 1 transformedobservation vector y(θ) as
y(θ) = [y′11(θ), y
′12(θ), . . . , y
′NmN
(θ)]′. (13)
For a given value of the transformation parameter θ ,the methods developed in the last subsection for the MLcase can be applied to maximize the REML log-likelihoodfunction, which under the new parameterization can bewritten as
�R(φ, θ) = (θ − 1)N∑
i=1
mi∑j=1
ni j∑k=1
ln(yi jk)
−N∑
i=1
mi∑j=1
ln |Vi j | − ln |W′V−1W|
− (y(θ) − Wβ)′V−1(y(θ) − Wβ) (14)
where
β = (W′V−1W)−1W′V−1y(θ). (15)
It can be shown that the REML stationary equations forφ are given by
�∗φ = ρ∗(θ)
where �∗ is the 2 × 2 matrix with elements:
ω∗rs = tr(V−1MVr M′V−1Vs)
(r, s ∈ {1, 2}) and ρ∗(θ) is the 2 × 1 vector with elements:
ρ∗r (θ) = y(θ)′V−1MVr M′V−1y(θ),
where
M = Ia − W(W′V−1W)−1W′V−1. (16)
As a result, for a given value of θ , REML estimates for φare obtained iteratively from:
φ = (�∗)−1 ρ∗(θ),
and the estimate for the fixed effects component β is thengiven by (15), where V is evaluated using the REML esti-mate for φ.
Note that for a given value of the transformation pa-rameter θ , the value of φ that maximizes the restrictedlog-likelihood function of Equation (10) can be obtainediteratively by performing the following steps:
Step 1. Choose a value for θ and an initial vector for φ,
say φ(0)
;
Step 2. Use φ(0)
to compute V(0) and M(0) using Equations(12) and (16), respectively.
Step 3. Use V(0) and M(0) to evaluate �∗ and ρ∗(θ), thencompute
φ(1) = (�∗)−1
ρ∗(θ);
Step 4. Return to Step 2 and iterate until ‖φ(c) − φ(c−1)‖ <
ϑ .
The REML estimate for φ obtained from the last itera-tion, say φ, is substituted into Equation (15) to obtain β.In the next section, we discuss the means by which to drawstatistical inference on the fixed-effects parameters of thegrain size model given by Equation (1).
4.2. Model inference
In this section, we discuss the approach to drawing statis-tical inference on the fixed-effects component of the modelin Equation (1). Suppose that, for some fixed effect h, weare interested in testing the hypothesis:
H0 : βh = 0,
H1 : βh �= 0.
A lack of evidence that βh �= 0 suggests that the factorcorresponding to βh is not a significant source of variabilityin the mean grain size. As a result, one can subsequentlypreclude the variable from any further analysis.
Asymptotic theory is typically used to develop statisticaltests for the fixed-effects component of the model. If thevariance components are known, it can easily be shownthat:
Var(β) ≡ D =⎡⎣ N∑
i=1
mi∑j=1
(zi 1
′ni j
V−1i j 1ni j z
′i
)⎤⎦−1
, (17)
Dow
nloa
ded
by [
Uni
vers
ity O
f Pi
ttsbu
rgh]
at 0
4:24
02
Sept
embe
r 20
12
Characterization of nanostructured materials 543
and by substituting estimates of the variance components(i.e., φ) into Vi j , we have the following test statistic:
Z0 = βh√Dhh
(18)
which converges in distribution to the standard normaldistribution under H0 as the number of design replicatesapproaches infinity. Thus, for a given level of significance α
(the Type-I error probability), an approximate test (due to afinite sample size) involves computing |Z0| and comparingits value to the upper α/2 quantile of the standard normaldistribution.
The test described here is reasonable when the experi-menter has a large number of design replicates; however,the experiments used to obtain grain size observations viaelectron microscopy are very expensive and time consum-ing. Therefore, it is unlikely that a large number of replicatesper treatment combination will be available. Consequently,Z0, although still approximately normal with zero meanunder H0, will have a variance that exceeds unity. Hence,the probability of a false alarm is inflated. That is, the testwill more often than expected detect an effect that does notexist.
Rather than relying on asymptotic theory for the per-centiles of the null distribution of Z0, one can rely on thesmall sample approximations to the null distribution sug-gested by Satterthwaite (1941) and Kenward and Roger(1997). However, a simpler alternative is to simulate a largenumber of samples of Z0 under H0, given information re-garding the amount of replication (which is known), anduse these “pseudo-samples” to better approximate the per-centiles of the null distribution. This is a feasible approachsince the expression in Equation (18) is solely a functionof the data. Moreover, ML or REML estimates of σ 2
ν andσ 2
ε can be used when generating the pseudo-samples fromthe null distribution, and if an orthogonal design is used tocollect the data, the null distribution of Equation (18) willbe independent of the other effect estimates (i.e., the βh′
values where h′ �= h). Consequently, critical values againstwhich to compare the test statistic can be better approxi-mated, thereby reducing the probability of a false alarm.We demonstrate this approach to approximating the nulldistribution in Section 5 where the experimental analysisresults are presented.
It is important to note that if standard DOE methods areused to analyze the problem described here (i.e., a problemwith a nested error structure), the effects of treatments ap-plied at the bar stock level may appear to be statisticallysignificant when, in fact, they are not. This is due to the factthat a loss of precision in the estimation of β is incurredas a result of sampling less frequently at the bar-stock levelrelative to the level of chips or grains. When standard DOEmethods are used, the estimated standard errors of the re-sulting β values will be underestimated in this case, and themagnitude of Z0 in Equation (18) will more often than not
be falsely inflated. This result has been well documented byseveral authors (see, for example, Kempthorne (1952), Nel-son (1985), and Box and Jones (1992)) and is demonstratedin Section 5, which presents the results of our analysis.
5. Experimental results
In this section, we implement and validate the model ofEquation (1) to predict mean grain size as a result of twoprimary factors. Recall that the goal of the experiments isto characterize the variability in the mean grain size (y) as afunction of rake angle (factor A) and cutting speed (factorB), as well as their interaction (factor AB). For analysispurposes, it is reasonable to assume that, due to the puritystandards of the experimental material, there is no randomeffect due to bar stock. Thus, we postulate the followingmodel:
yi jk = β0 + β1 A+ β2 B + β12 AB + νi j + εi jk, (19)
where β0, β1, β2, and β12 denote the fixed-effect compo-nents, and νi j and εi jk denote the random components.
An efficient experimental design used to fit the modelof Equation (19) is a two-level, full-factorial design (seeMontgomery (2009)). In such a design, all possible treat-ment combinations of q factors (each at two levels) areperformed for a total of 2q experiments. For our problem,q = 2 experimental factors, resulting in a 22 factorial de-sign. A single replicate of the 22 design is shown in Table 1,with A and B in coded form (i.e., −1 and +1 for low andhigh factor levels, respectively). For example, the first rowin Table 1 represents the experimental run performed withA and B both at their low levels, the second row representsthe experimental run performed with Aat its high level andB at its low level, and so forth.
For the experiments analyzed herein, we have at our dis-posal two replicates of the design in Table 1. Thus, a totalof N = 8 experiments were performed. For each experi-ment, we randomly selected a single chip for microscopyscan (i.e., mi = 1 for all i ). Also, for each chip selected, wesampled 250 grain sizes, thus, ni1 = 250 for all i . There-fore, the total number of observations in the experiment is8 × 250 = 2000. It should be noted that the analysis meth-ods discussed in Section 4 do not impose the requirementni j = n for all i, j . However, since a microscopy scan of anygiven chip can produce well in excess of 1000 observations,
Table 1. Summary of the full-factorial experimental design
Rake angle (A) Cutting speed (B) Interaction (AB)
−1 −1 +1+1 −1 −1−1 +1 −1+1 +1 +1
Dow
nloa
ded
by [
Uni
vers
ity O
f Pi
ttsbu
rgh]
at 0
4:24
02
Sept
embe
r 20
12
544 Perry et al.
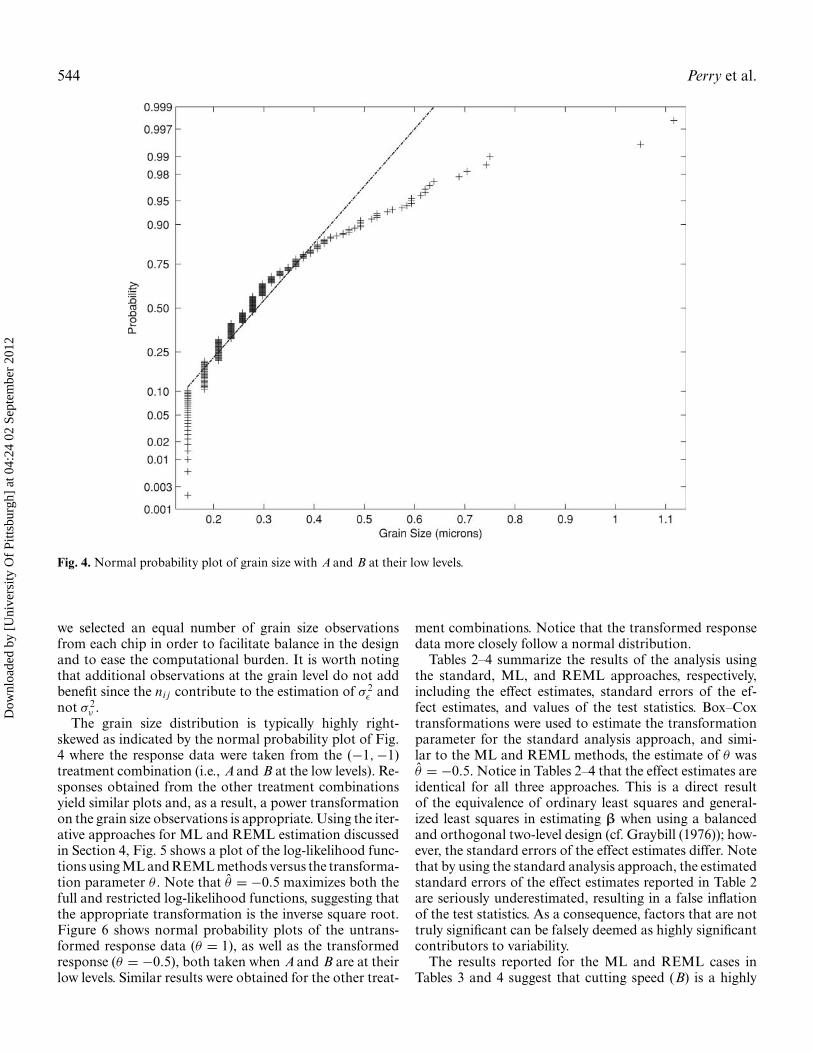
Fig. 4. Normal probability plot of grain size with A and B at their low levels.
we selected an equal number of grain size observationsfrom each chip in order to facilitate balance in the designand to ease the computational burden. It is worth notingthat additional observations at the grain level do not addbenefit since the ni j contribute to the estimation of σ 2
ε andnot σ 2
ν .The grain size distribution is typically highly right-
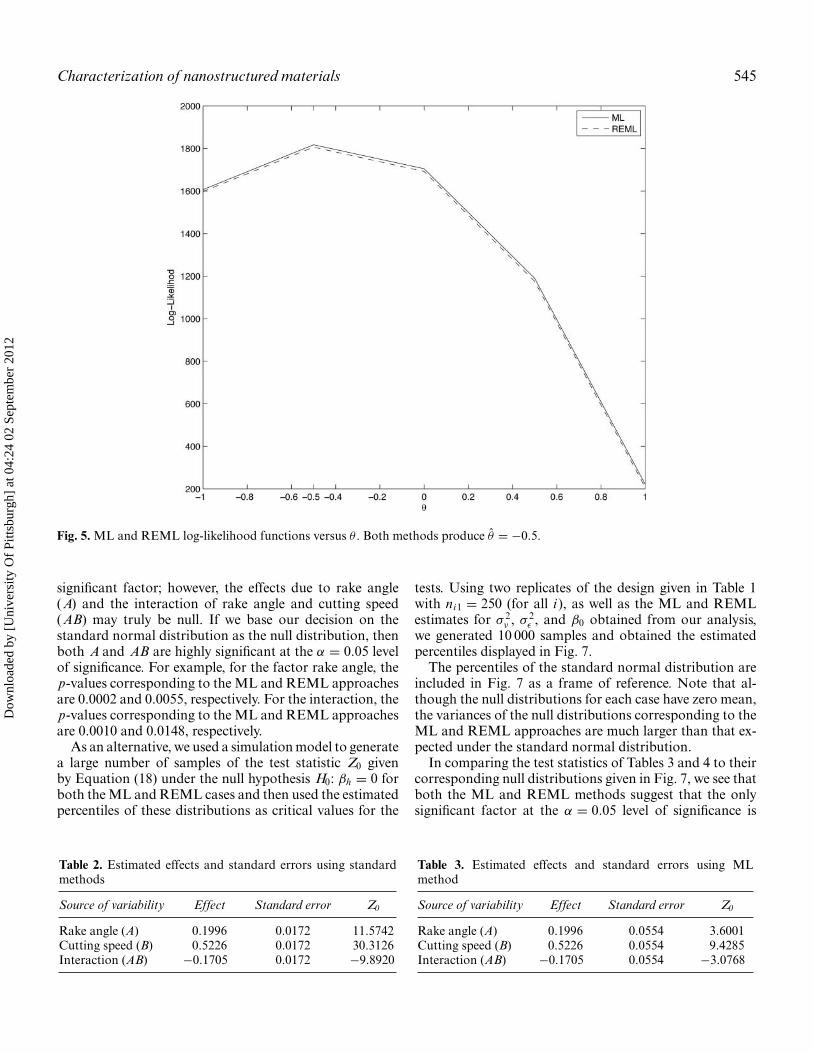
skewed as indicated by the normal probability plot of Fig.4 where the response data were taken from the (−1, −1)treatment combination (i.e., A and B at the low levels). Re-sponses obtained from the other treatment combinationsyield similar plots and, as a result, a power transformationon the grain size observations is appropriate. Using the iter-ative approaches for ML and REML estimation discussedin Section 4, Fig. 5 shows a plot of the log-likelihood func-tions using ML and REML methods versus the transforma-tion parameter θ . Note that θ = −0.5 maximizes both thefull and restricted log-likelihood functions, suggesting thatthe appropriate transformation is the inverse square root.Figure 6 shows normal probability plots of the untrans-formed response data (θ = 1), as well as the transformedresponse (θ = −0.5), both taken when A and B are at theirlow levels. Similar results were obtained for the other treat-
ment combinations. Notice that the transformed responsedata more closely follow a normal distribution.
Tables 2–4 summarize the results of the analysis usingthe standard, ML, and REML approaches, respectively,including the effect estimates, standard errors of the ef-fect estimates, and values of the test statistics. Box–Coxtransformations were used to estimate the transformationparameter for the standard analysis approach, and simi-lar to the ML and REML methods, the estimate of θ wasθ = −0.5. Notice in Tables 2–4 that the effect estimates areidentical for all three approaches. This is a direct resultof the equivalence of ordinary least squares and general-ized least squares in estimating β when using a balancedand orthogonal two-level design (cf. Graybill (1976)); how-ever, the standard errors of the effect estimates differ. Notethat by using the standard analysis approach, the estimatedstandard errors of the effect estimates reported in Table 2are seriously underestimated, resulting in a false inflationof the test statistics. As a consequence, factors that are nottruly significant can be falsely deemed as highly significantcontributors to variability.
The results reported for the ML and REML cases inTables 3 and 4 suggest that cutting speed (B) is a highly
Dow
nloa
ded
by [
Uni
vers
ity O
f Pi
ttsbu
rgh]
at 0
4:24
02
Sept
embe
r 20
12
Characterization of nanostructured materials 545
Fig. 5. ML and REML log-likelihood functions versus θ . Both methods produce θ = −0.5.
significant factor; however, the effects due to rake angle(A) and the interaction of rake angle and cutting speed(AB) may truly be null. If we base our decision on thestandard normal distribution as the null distribution, thenboth A and AB are highly significant at the α = 0.05 levelof significance. For example, for the factor rake angle, thep-values corresponding to the ML and REML approachesare 0.0002 and 0.0055, respectively. For the interaction, thep-values corresponding to the ML and REML approachesare 0.0010 and 0.0148, respectively.
As an alternative, we used a simulation model to generatea large number of samples of the test statistic Z0 givenby Equation (18) under the null hypothesis H0: βh = 0 forboth the ML and REML cases and then used the estimatedpercentiles of these distributions as critical values for the
Table 2. Estimated effects and standard errors using standardmethods
Source of variability Effect Standard error Z0
Rake angle (A) 0.1996 0.0172 11.5742Cutting speed (B) 0.5226 0.0172 30.3126Interaction (AB) −0.1705 0.0172 −9.8920
tests. Using two replicates of the design given in Table 1with ni1 = 250 (for all i ), as well as the ML and REMLestimates for σ 2
ν , σ 2ε , and β0 obtained from our analysis,
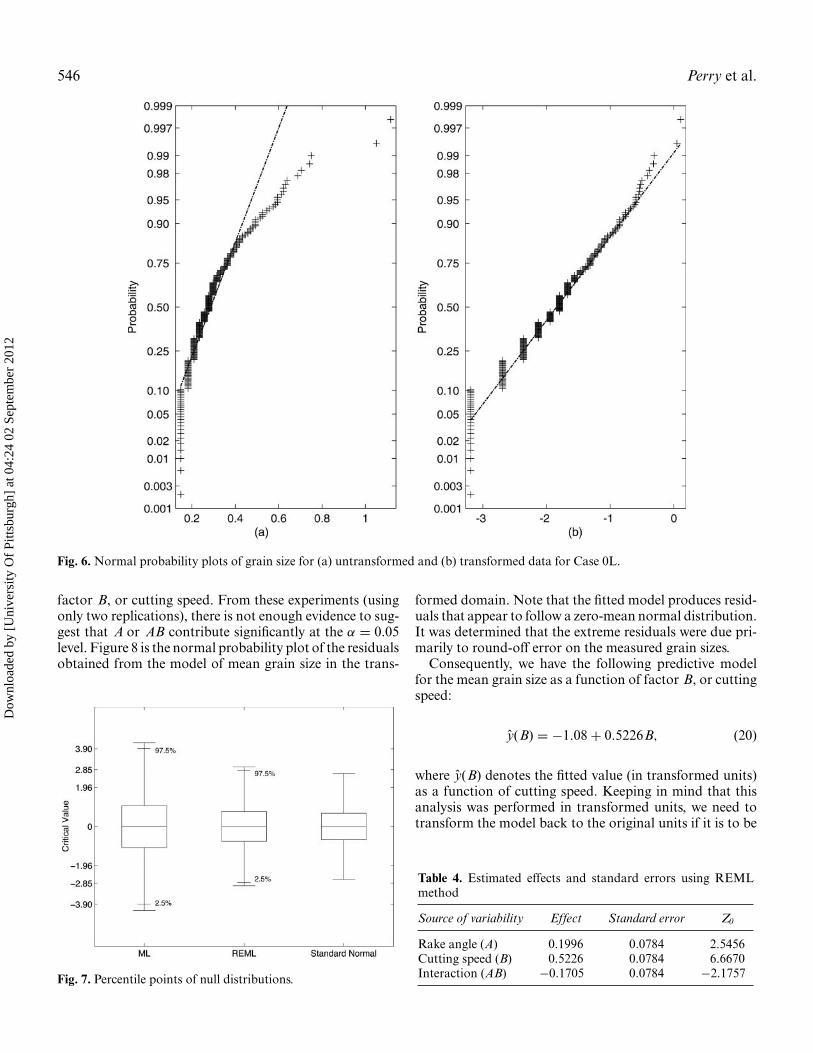
we generated 10 000 samples and obtained the estimatedpercentiles displayed in Fig. 7.
The percentiles of the standard normal distribution areincluded in Fig. 7 as a frame of reference. Note that al-though the null distributions for each case have zero mean,the variances of the null distributions corresponding to theML and REML approaches are much larger than that ex-pected under the standard normal distribution.
In comparing the test statistics of Tables 3 and 4 to theircorresponding null distributions given in Fig. 7, we see thatboth the ML and REML methods suggest that the onlysignificant factor at the α = 0.05 level of significance is
Table 3. Estimated effects and standard errors using MLmethod
Source of variability Effect Standard error Z0
Rake angle (A) 0.1996 0.0554 3.6001Cutting speed (B) 0.5226 0.0554 9.4285Interaction (AB) −0.1705 0.0554 −3.0768
Dow
nloa
ded
by [
Uni
vers
ity O
f Pi
ttsbu
rgh]
at 0
4:24
02
Sept
embe
r 20
12
546 Perry et al.
Fig. 6. Normal probability plots of grain size for (a) untransformed and (b) transformed data for Case 0L.
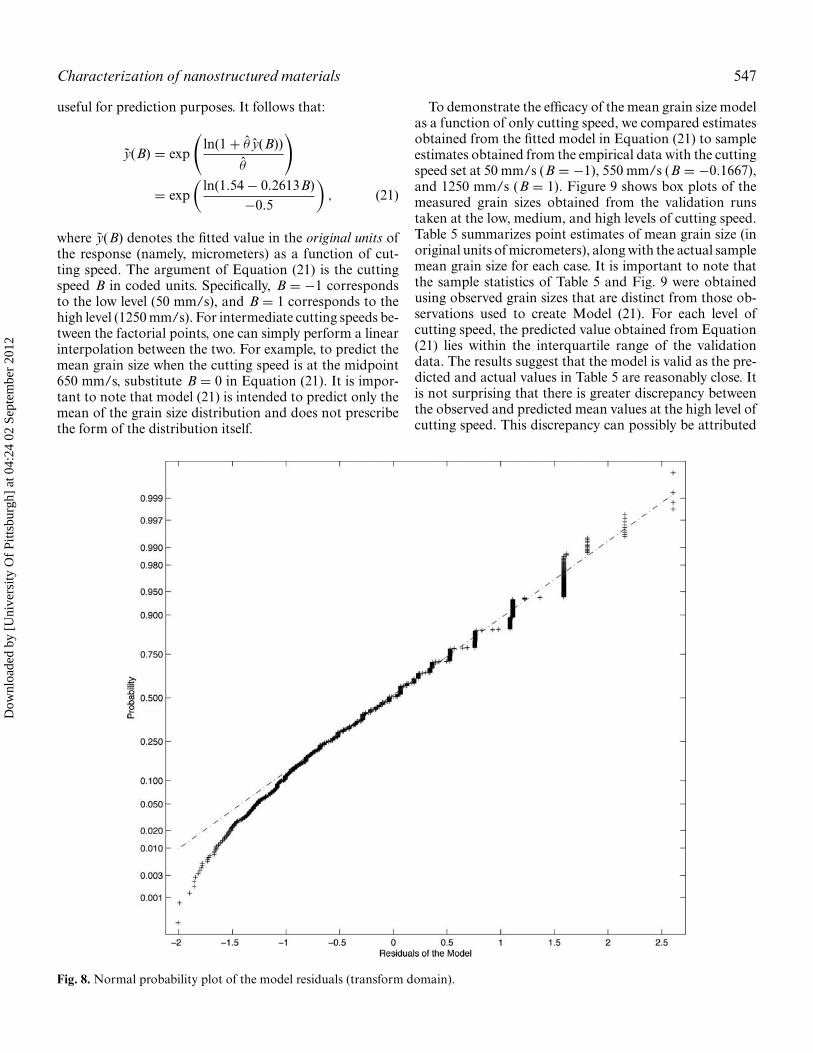
factor B, or cutting speed. From these experiments (usingonly two replications), there is not enough evidence to sug-gest that A or AB contribute significantly at the α = 0.05level. Figure 8 is the normal probability plot of the residualsobtained from the model of mean grain size in the trans-
Fig. 7. Percentile points of null distributions.
formed domain. Note that the fitted model produces resid-uals that appear to follow a zero-mean normal distribution.It was determined that the extreme residuals were due pri-marily to round-off error on the measured grain sizes.
Consequently, we have the following predictive modelfor the mean grain size as a function of factor B, or cuttingspeed:
y(B) = −1.08 + 0.5226B, (20)
where y(B) denotes the fitted value (in transformed units)as a function of cutting speed. Keeping in mind that thisanalysis was performed in transformed units, we need totransform the model back to the original units if it is to be
Table 4. Estimated effects and standard errors using REMLmethod
Source of variability Effect Standard error Z0
Rake angle (A) 0.1996 0.0784 2.5456Cutting speed (B) 0.5226 0.0784 6.6670Interaction (AB) −0.1705 0.0784 −2.1757
Dow
nloa
ded
by [
Uni
vers
ity O
f Pi
ttsbu
rgh]
at 0
4:24
02
Sept
embe
r 20
12
Characterization of nanostructured materials 547
useful for prediction purposes. It follows that:
y(B) = exp
(ln(1 + θ y(B))
θ
)
= exp(
ln(1.54 − 0.2613B)−0.5
), (21)
where y(B) denotes the fitted value in the original units ofthe response (namely, micrometers) as a function of cut-ting speed. The argument of Equation (21) is the cuttingspeed B in coded units. Specifically, B = −1 correspondsto the low level (50 mm/s), and B = 1 corresponds to thehigh level (1250 mm/s). For intermediate cutting speeds be-tween the factorial points, one can simply perform a linearinterpolation between the two. For example, to predict themean grain size when the cutting speed is at the midpoint650 mm/s, substitute B = 0 in Equation (21). It is impor-tant to note that model (21) is intended to predict only themean of the grain size distribution and does not prescribethe form of the distribution itself.
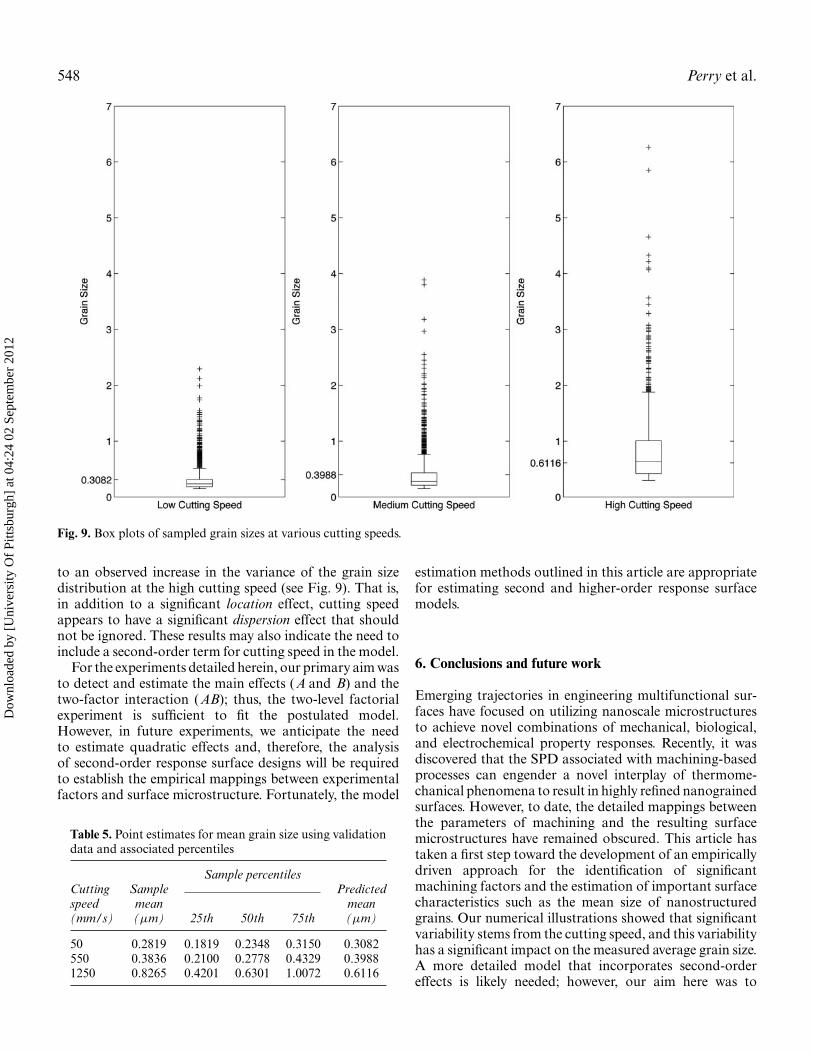
To demonstrate the efficacy of the mean grain size modelas a function of only cutting speed, we compared estimatesobtained from the fitted model in Equation (21) to sampleestimates obtained from the empirical data with the cuttingspeed set at 50 mm/s (B = −1), 550 mm/s (B = −0.1667),and 1250 mm/s (B = 1). Figure 9 shows box plots of themeasured grain sizes obtained from the validation runstaken at the low, medium, and high levels of cutting speed.Table 5 summarizes point estimates of mean grain size (inoriginal units of micrometers), along with the actual samplemean grain size for each case. It is important to note thatthe sample statistics of Table 5 and Fig. 9 were obtainedusing observed grain sizes that are distinct from those ob-servations used to create Model (21). For each level ofcutting speed, the predicted value obtained from Equation(21) lies within the interquartile range of the validationdata. The results suggest that the model is valid as the pre-dicted and actual values in Table 5 are reasonably close. Itis not surprising that there is greater discrepancy betweenthe observed and predicted mean values at the high level ofcutting speed. This discrepancy can possibly be attributed
Fig. 8. Normal probability plot of the model residuals (transform domain).
Dow
nloa
ded
by [
Uni
vers
ity O
f Pi
ttsbu
rgh]
at 0
4:24
02
Sept
embe
r 20
12
548 Perry et al.
Fig. 9. Box plots of sampled grain sizes at various cutting speeds.
to an observed increase in the variance of the grain sizedistribution at the high cutting speed (see Fig. 9). That is,in addition to a significant location effect, cutting speedappears to have a significant dispersion effect that shouldnot be ignored. These results may also indicate the need toinclude a second-order term for cutting speed in the model.
For the experiments detailed herein, our primary aim wasto detect and estimate the main effects (A and B) and thetwo-factor interaction (AB); thus, the two-level factorialexperiment is sufficient to fit the postulated model.However, in future experiments, we anticipate the needto estimate quadratic effects and, therefore, the analysisof second-order response surface designs will be requiredto establish the empirical mappings between experimentalfactors and surface microstructure. Fortunately, the model
Table 5. Point estimates for mean grain size using validationdata and associated percentiles
Sample percentilesCutting Sample Predictedspeed mean mean(mm/s) (µm) 25th 50th 75th (µm)
50 0.2819 0.1819 0.2348 0.3150 0.3082550 0.3836 0.2100 0.2778 0.4329 0.39881250 0.8265 0.4201 0.6301 1.0072 0.6116
estimation methods outlined in this article are appropriatefor estimating second and higher-order response surfacemodels.
6. Conclusions and future work
Emerging trajectories in engineering multifunctional sur-faces have focused on utilizing nanoscale microstructuresto achieve novel combinations of mechanical, biological,and electrochemical property responses. Recently, it wasdiscovered that the SPD associated with machining-basedprocesses can engender a novel interplay of thermome-chanical phenomena to result in highly refined nanograinedsurfaces. However, to date, the detailed mappings betweenthe parameters of machining and the resulting surfacemicrostructures have remained obscured. This article hastaken a first step toward the development of an empiricallydriven approach for the identification of significantmachining factors and the estimation of important surfacecharacteristics such as the mean size of nanostructuredgrains. Our numerical illustrations showed that significantvariability stems from the cutting speed, and this variabilityhas a significant impact on the measured average grain size.A more detailed model that incorporates second-ordereffects is likely needed; however, our aim here was to
Dow
nloa
ded
by [
Uni
vers
ity O
f Pi
ttsbu
rgh]
at 0
4:24
02
Sept
embe
r 20
12
Characterization of nanostructured materials 549
emphasize the need for appropriate statistical techniqueswhen analyzing these complex processes. The ability tointroduce nanograin surfaces on bulk materials directly viamachining-based processes, apart from physical, chemical,or mechanical treatments, has the potential to offer ascalable manufacturing framework for engineering novelsurfaces within existing manufacturing paradigms.
Before such an approach can be realized, manufac-turing engineers must first contend with the costly andtime-consuming process of collecting and analyzing dataoriginating from microscopy scans. In these experiments,non-normality and correlation of the grain size obser-vations are prevalent due to the inherent nested errorstructure of experiments of this kind. Unfortunately, itis still common in practice to apply standard analysismethods (e.g., ANOVA or standard regression techniques)to analyze experimental data with nested error structures.By ignoring the inherent dependence of the grain sizeobservations, the impact of the fixed effects on the meangrain size can be grossly misrepresented. The model wehave presented here provides an appropriate way to analyzedata originating from experiments of this type. Moreover,it lays a foundation for a framework to establish empiricalmappings between important machining conditions andmultiple response characteristics (e.g., the mean, disper-sion, and skewness of the grain size distribution) that canbe used to elucidate the effects of important machiningparameters on the resulting surface microstructure.
Our statistical characterization framework may be appli-cable to an array of other materials science problems wherethe distribution of microstructural characteristics modify,adversely or favorably, the overall material response. Oneexample is the characterization of second phases in metalmatrix composites where the “clumping” of reinforcingparticles surrounded by the metallic phase is known tounexpectedly modify the resulting mechanical behavior.A second example is in the characterization of metallicnanoparticles that are manufactured using chemicalmethods or gas-phase condensation techniques whereintheir coarsening behavior and thermodynamic stability isa function of their size distributions. For such problems,a designed experiments approach can offer a powerfulsolution for capturing critical divergences that may notbe otherwise resolved using conventional characterizations.
Acknowledgements
The authors are grateful to three anonymous refereesand Professor Satish Bukkapatnam for helpful commentsthat have improved the content and presentation ofthis work. M.R. Shankar acknowledges support fromthe National Science Foundation (CMMI-0826010,CMMI-0856626, and CMMI-0927410) and the NuclearRegulatory Commission (Faculty Development Grant).The authors also thank the Department of Mechanical
Engineering and Materials Science at the University ofPittsburgh for providing access to the electron microscopyinstrumentation and for assistance with the execution ofthis component of our research.
References
Al-Ostaz, A., Diwakar, A. and Alzebdeh, K.I. (2007) Statistical modelfor characterizing random microstructure of inclusion-matrix com-posites. Journal of Materials Science, 42, 7016–7030.
Box, G.E.P. and Cox, D.R. (1964) An analysis of transformations. Journalof the Royal Statistical Society B, 26, 211–243.
Box, G.E.P. and Jones, S.P. (1992) Split-plot designs for robust productexperimentation, Journal of Applied Statistics, 19, 3–26.
Cai, J., Shekhar, S., Wang, J. and Shankar M.R. (2009) Nano-twinnedmicrostructures from low stacking fault energy brass by high-ratesevere plastic deformation. Scripta Materialia, 60, 599–602.
Calistes, R., Swaminathan, S., Murthy, T.G., Huang, C., Saldana, C.,Shankar, M.R. and Chandrasekar, S. (2009) Controlling gradationof severe surface strains and nanostructuring by large strain ma-chining. Scripta Materialia, 60, 17–20.
Corbeil, R.R. and Searle, S.R. (1976) Restricted maximum likelihood(REML) estimation of variance components in the mixed model.Technometrics, 18, 31–38.
Di Schino, A., Barteri, M. and Kenny, J.M. (2003) Grain size dependenceof mechanical, corrosion and tribological properties of high nitrogenstainless steels. Journal of Materials Science, 38, 3257–3262.
Graybill, F.A. (1976) Theory and Application of the Linear Model,Duxbury, North Scituate, MA.
Grosselle, F., Timeeli, G. and Bonollo, F. (2010) DOE applied to mi-crostructural and mechanical properties of Al-Si-Cu-Mg casting al-loys for automotive applications. Materials Science and EngineeringA, 527, 3536–3545.
Gurka, M.J., Edwards, L.J., Muller, K.E., and Kupper, L.L. (2006) Ex-tending the Box–Cox transformations to the linear mixed model.Journal of the Royal Statistical Society A, 169, 273–278.
Hartley, H.O. and Rao, J.N.K. (1967) Maximum-likelihood estimationfor the mixed analysis of variance model. Biometrika, 54(1–2), 93–108.
Harville, D.A. (1977) Maximum likelihood approaches to variance com-ponent estimation and to related problems. Journal of the AmericanStatistical Association, 72(358), 320–338.
Hocking, R.R. (2003) Methods and Applications of Linear Models: Re-gression and the Analysis of Variance, John Wiley & Sons, New York,NY.
Hofler, H.J., Averback, R.S., Hahn, H. and Gleiter, H. (1993) Diffusionof bismuth and gold in nanocrystalline copper. Journal of AppliedPhysics, 74, 3382–3389.
Horvath, J. (1990) Diffusion in nanocrystalline materials, in Defect andDiffusion Forum, Kedves, F.J. and Beke, D.L. (eds), Trans Tech S.A.,Zurich, Switzerland, pp. 207–228.
Huang, C., Murthy, T.G., Shankar, M.R., M’Saoubi, R. and Chan-drasekar, S. (2008) Temperature rise in severe plastic deforma-tion of titanium at small strain rates. Scripta Materialia 58(8),663–666.
Iglesias, P., Bermudez, M.D., Moscoso, W., Rao, B.C., Shankar, M.R.and Chandrasekar, S. (2007) Friction and wear of nanostructuredmetals created by large strain extrusion. Machining Wear, 263, 636–642.
Kempthorne, O. (1952) The Design and Analysis of Experiments, JohnWiley & Sons, New York, NY.
Kenward, M.G. and Roger, J.H. (1997) Small sample inference for fixedeffects from restricted maximum likelihood. Biometrics, 53(3), 983–997.
Dow
nloa
ded
by [
Uni
vers
ity O
f Pi
ttsbu
rgh]
at 0
4:24
02
Sept
embe
r 20
12
550 Perry et al.
Mishra, R. and Balasubramaniam, R. (2004) Effect of nanocrystallinegrain size on the electrochemical and corrosion behavior of nickel.Corrosion Science, 46, 3019–3029.
Misra, R.D.K., Thein-Han, W.-W., Pesacreta, T.C., Hasenstein, K.H.,Somani, M.C. and Karjalainen, L.P. (2009a) Cellular response ofpreosteoblasts to nanograined/ultrafine-grained structures. ActaBiomaterialia, 5, 1455–1467.
Misra, R.D.K., Thein-Han, W.-W., Pesacreta, T.C., Hasenstein, K.H.,Somani, M.C. and Karjalainen, L.P. (2009b) Favorable modulationof pre-osteoblast response to nanograined/ultrafine-grained struc-tures in austenitic stainless steel. Advanced Materials, 21, 1280–1285.
Montgomery, D.C. (2009) Design and Analysis of Experiments, John Wi-ley & Sons, New York, NY.
Nelson, L.S. (1985) What do low F ratios tell you? Journal of QualityTechnology, 17, 237–238.
op’t Hoog, C., Birbilis, N. and Estrin, Y. (2008) Corrosion of Pure Mg asa function of grain size and processing route. Advanced EngineeringMaterials, 10, 579–582.
Patterson, H.D. and Thompson, R. (1971) Recovery of inter-blockinformation when block sizes are unequal. Biometrika, 58(3),545–554.
Raman, R.K.S. and Gupta, R.K. (2009) Oxidation resistance ofnanocrystalline vis-a-vis microcrystalline Fe-Cr alloys. CorrosionScience, 51, 316–321.
Roland, T., Retraint, D., Lu, K. and Lu, J. (2006) Fatigue life improve-ment through surface nanostructuring of stainless steel by meansof surface mechanical attrition treatment. Scripta Materialia, 54,1949–1954.
Satterthwaite, F.F. (1941) Synthesis of variance. Psychometrika 6, 309–316.
Sevier, M., Lee, S., Shankar, M.R., Yang, H.T.Y., Chandrasekar, S. andCompton, W.D. (2006) Deformation mechanics associated with for-mation of ultra-fine grained chips in machining. Materials ScienceForum, 503–504, 379–384.
Shankar, M.R., Chandrasekar, S., King, A.H. and Compton, W.D. (2005)Microstructure and stability of nanocrystalline aluminum 6061 cre-ated by large strain machining. Acta Materialia, 53, 4781–4793.
Shankar, M.R.. Rao, B.C., Chandrasekar, S., Compton, W.D. and King,A.H. (2008) Thermally stable nanostructured materials from se-vere plastic deformation of precipitation-treatable Ni-based alloys.Scripta Materialia, 58, 675–678.
Shankar, M.R., Rao, B.C., Lee, S., Chandrasekar, S., King, A.H. andCompton, W.D. (2006) Severe plastic deformation (SPD) of titaniumat near-ambient temperature. Acta Materialia, 54, 3691–3700.
Shankar, M.R., Verma, R., Rao, B.C., Chandrasekar, S., Compton, W.D.,King, A.H. and Trumble, K.P. (2007) Severe plastic deformation ofdifficult-to-deform materials at near-ambiten temperatures. Metal-lurgical and Materials Transactions A, 38, 1899–1905.
Shaw, M.C. (1984) Metal Cutting Principles, Clarendon Press, Oxford,UK.
Shekhar, S., Cai, J., Basu, S., Abolghasem, S. and Shankar, M.R. (2011)Effect of strain-rate in severe plastic deformation on microstructurerefinement and stored energies. Journal of Materials Research, 26,395–406.
Shekhar, S., Cai, J., Wang, J. and Shankar, M.R. (2009) Multimodalultrafine grain size distribution from severe plastic deformation athigh strain rates. Materials Science and Engineering: A 527, 187–191.
Shi, Y.N. and Han, Z. (2008) Tribological behaviors of nanostructuredsurface layer processed by means of surface mechanical attritiontreatment. Key Engineering Materials, 384, 321–334.
Silverman, B.W. (1986) Density Estimation for Statistics and Data Anal-ysis, Chapman and Hall, London, UK.
Tao, K., Choo, H., Li, H., Clausen, B., Jin, J. and Lee, Y. (2007)Transformation-induced plasticity in an ultrafine-grained steel: anin situ neutron diffraction study, Applied Physics Letters, 90, 101911-1–101911-3.
Tao, N., Tong, W., Wang, Z., Wang, W., Sui, M., Lu, J. and Lu, K. (2003)Mechanical and wear properties of nanostructured surface layer iniron induced by severe mechanical attrition treatment. Journal ofMaterials Science and Technology, 19, 563–566.
Torquato, S. (2002) Statistical description of microstructures. AnnualReview of Materials Research, 32, 77–111.
Valiev, R.Z., Alexandrov, I.V., Zhu, Y.T. and Lowe, T.C. (2002)Paradox of strength and ductility in metals processed by se-vere plastic deformation. Journal of Materials Research, 17,5–8.
Valiev, R.Z., Islamgaliev, R.K. and Alexandrov, I.V. (2000) Bulk nanos-tructured materials from severe plastic deformation. Progress in Ma-terials Science, 45(2), 103–189.
Valiev, R.Z., Zehetbauer, M.J., Estrin, Y., Hoppel, H.W., Ivanisenko, Y.,Hahn, H., Wilde, G., Roven, H.J., Sauvage, X. and Langdon, T.G.(2007) The innovation potential of bulk nanostructured materials.Advanced Engineering Materials, 9, 527–533.
Youngdahl, C.J., Weertman, J.R., Hugo, R.C. and Kung, H.H. (2001) De-formation behavior in nanocrystalline copper. Scripta Materialia,44, 1475–1478.
Zhang, Z.F., Wu, S.D., Li, Y.J., Liu, S.M. and Wang, Z.G. (2005) Cyclicdeformation and fatigue properties of Al-0.7 wt.% Cu alloy pro-duced by equal channel angular pressing. Materials Science andEngineering A, 412, 279–286.
Biographies
Marcus B. Perry is an Assistant Professor of Statistics in the Depart-ment of Information Systems, Statistics, and Management Science atthe University of Alabama in Tuscaloosa. His research interests includestatistical process control, design and analysis of experiments, responsesurface methods, applied optimization, regression analysis, and qualitycontrol. He serves on the Editorial Boards of Quality Engineering andQuality and Reliability Engineering International. He is a professionalmember of IIE, ASQ, ASA, and INFORMS.
Jeffrey P. Kharoufeh is an Associate Professor in the Department of In-dustrial Engineering at the University of Pittsburgh. He holds a Ph.D.in Industrial Engineering and Operations Research from the Pennsyl-vania State University. His primary research interest is the modeling,analysis, and control of stochastic systems with applications in reliability,queueing, and communications systems. He is a Senior Member of IIEand a professional member of INFORMS and the Applied ProbabilitySociety.
Shashank Shekhar has recently joined the Indian Institute of Technol-ogy at Kanpur as an Assistant Professor. He was a Visiting ResearchAssistant Professor in the Department of Industrial Engineering at theUniversity of Pittsburgh. He received his Bachelor of Technology degreein Metallurgical Engineering and Materials Science from the Indian In-stitute of Technology–Bombay. He holds a Ph.D. in Materials Sciencefrom Purdue University, West Lafayette.
Jiazhao Cai is a Ph.D. student in the Department of Industrial Engi-neering at the University of Pittsburgh. She received her B.S. and M.S.in Materials Science and Engineering from the Zhejiang University inChina. Her Ph.D. research focuses on manufacture of ductile and ther-mally stable bulk nanomaterials.
M. Ravi Shankar is an Assistant Professor in the Department of In-dustrial Engineering at the University of Pittsburgh. He holds a Ph.D.in Industrial Engineering from Purdue University, West Lafayette. Hisresearch interests include modeling of manufacturing processes, engi-neering nanomaterials, and nanomechanics.
Dow
nloa
ded
by [
Uni
vers
ity O
f Pi
ttsbu
rgh]
at 0
4:24
02
Sept
embe
r 20
12