Embed Size (px)
Citation preview

Synthesis and Characterization of
Nanostructured Catalysts for
Photovoltaic Applications
by
Donald McGillivray
A Thesis Submitted in Partial Fulfilment of the Requirements for the
Degree of Master of Science in Materials Science
Faculty of science
University of Ontario Institute of Technology
July 2013
© Donald McGillivray 2013
ii
Abstract
The objective of this project was to investigate the effect of the morphology of titanium
dioxide (TiO2) nanoparticles on the electron transport properties and light harvesting potential in
a dye sensitized solar cell (DSSC). Particular attention was given to develop synthetic methods
to produce metal oxide photocatalysts with similar crystallite size, with different morphologies
(spheres, fibers, hierarchical spheres, and globular structures) with the aim of studying the
relationship between morphology and photocatalytic activity. The addition of CNTs to the
synthesis showed that they acted as nucleation sites and altered the morphology. Materials were
fully characterized using Raman, SEM, XRD, BET, and FTIR.
The photocatalytic activity of the as-synthesized materials was tested in a DSSC
configuration and characterized using electrochemical impedance spectroscopy. It was found that
the different morphologies had different light scattering properties which influenced the
efficiencies. Based on these preliminary results, the nanofibres prepared in heptane performed
the best, with good dye loading, electron lifetime and diffusion coefficient. The addition of a
scattering layer using hierarchical spheres showed promising results in decreased transparency
and increased efficiency. The addition of CNTs had an adverse effect, this could be due to light
blocking by the black CNTs and increased recombination with the electrolyte.

iii
Acknowledgments
This thesis would not have been possible without the contributions of many colleagues
and friends both at UOIT and elsewhere and I would like to direct my sincere gratitude to them.
To my supervisors Dr. Liliana Trevani and Dr. Franco Gaspari I truly appreciate the amount of
work you have done on behalf of this project and for helping me, supporting me, and
encouraging me the entire time. Your advice and guidance was highly valued, I really enjoyed
my time spent working in the lab and talking in your offices and truly had a good time.
I would very much like to thank my lab mates and good friends Nick Wisdom, and
especially Simone Quaranta for all his help with the DSSCs. He worked tirelessly making sure
the cells were done properly, he was a proficient teacher and was great to work with.
There are many people at UOIT who gave advice and resources to help me succeed. I
would like to especially thank Dr. Brad Easton who is extremely tolerant, always open to
questions and never hesitated to let me use his equipment and tools. Also everyone in his lab has
lent a hand and advice at one point or another and made a great working environment. I would
also like to thank Sergiy Boyko who was very generous with letting me borrow equipment and
offering advice; as well as Genevieve Barnes, whom I was forever borrowing labware from, for
being extremely accommodating.
There were many generous people from outside of the faculty that offered me their
resources without hesitation. I would like to thank Ed Secnik for letting me use his solar
simulator and Tome Kosteski for inviting me to UofT to use their profilometer. I would also like
to thank George Kretschmann for being very accommodating and letting me use their XRD and
SEM and allowing me to explore the limits of those instruments freely and unflinchingly.
For financial support, I would like to acknowledge the Italian Cultural Center of Durham
for their very generous scholarship. I also gratefully acknowledge the Natural Science and
Engineering Research Council of Canada (NCERC) for their financial support and making this
project possible.
Of course whether I was at the school or not there were people that supported and
boosted me and where always very understanding, this is especially true for my girlfriend
Melanie Thomson. Last, but not least I would like to thank my parents who have always been
there for me encouraging me, and loving me unconditionally while asking for nothing in return.

iv
Contents 1 Chapter 1: Introduction ......................................................................................................................... 1
1.1 Dye Sensitized Solar Cells ............................................................................................................... 3
1.2 The TiO2 Film: A Key Element in the Photoanode .......................................................................... 7
1.2.1 Summary of Synthetic Approaches ..................................................................................... 12
1.3 Thesis Objectives ........................................................................................................................... 17
2 Chapter 2: High Pressure System Design ........................................................................................... 18
2.1 Supercritical Fluids and High-Pressure System for Supercritical Drying and Synthesis .............. 18
2.2 Design and Construction of a High Pressure Injection System ..................................................... 19
3 Chapter 3: Synthesis and Characterization of TiO2 and TiO2/CNTs Composites ............................... 23
3.1 Introduction to Sol-Gel Synthesis of Metal Oxide Nanomaterials ................................................ 23
3.1.1 Synthesis of TiO2 Nanomaterials using the Sol-Gel Reactions ........................................... 25
3.2 Experimental .................................................................................................................................. 29
3.2.1 Chemicals and Materials ..................................................................................................... 29
3.2.2 Synthesis of TiO2 Nanomaterials in Heptane and SC-CO2 ................................................. 30
3.2.3 Synthesis of TiO2/CNT Composites in Heptane and SC-CO2............................................. 33
3.2.4 Materials Characterization .................................................................................................. 34
3.3 Results and Discussion .................................................................................................................. 35
3.3.1 Effect of Temperature on Synthesis in SC-CO2 .................................................................. 36
3.3.2 Characterization of TiO2 Materials Obtained in SC-CO2 and Heptane at 60oC .................. 41
3.3.3 Characterization of TiO2/CNT composites ......................................................................... 51
3.4 Conclusions .................................................................................................................................... 53
4 Chapter 4: Photoelectrical Characterization........................................................................................ 55
4.1 Introduction .................................................................................................................................... 55
4.1.1 The I-V Curve ..................................................................................................................... 57
4.1.2 Impedance Spectroscopy ..................................................................................................... 60
4.2 Experimental .................................................................................................................................. 64
4.2.1 Materials and Methods ........................................................................................................ 64
4.2.2 DSSC Fabrication ............................................................................................................... 65
4.2.3 I-V Curves and Impedance Spectroscopy Measurements ................................................... 73
4.3 Results and Discussion: Photovoltaic Properties of a DSSC ......................................................... 74
4.4 Conclusions .................................................................................................................................... 89
5 Conclusions and Future Work ............................................................................................................. 90

v
Table of Figures Figure 1-1: Projections of cost and efficiency for the three solar cell generations. The single bandgap limit pertains to the Shockley-Queisser limit for unconcentrated (31.0%) and concentrated (40.8%) light. The thermodynamic limit is given by the theoretical efficiencies without energy lost for multi-junction solar cells. (Reproduced from ref [2]). .................................................................................................................. 3
Figure 1-2: Schematic of a DSSC showing the main components: the photoanode (FTO/TiO2/Dye), the electrolyte, and the platinum counter-electrode. ........................................................................................... 4
Figure 1-3: Structure of common ruthenium bipyridine complexes, used as sensitizers in DSSCs. ............ 5
Figure 1-4: Absorption spectrum of N719 in 0.1 M NaOH (1:1 ethanol-water) overlapping in the visible region with the solar irradiation on earth. The solar spectrum corresponds to AM 1.5 (solar irradiation at an angle of 48o). From American Society for Testing Materials (ASTM) http://rredc.nrel.gov/solar/spectra/am1.5/. .................................................................................................... 5
Figure 1-5: Schematic diagram of the electron transfer processes in a DSSC: a) Electron transfer band diagram; red arrows show the desired pathway for electron collection and green are the deleterious processes. The redox levels and band positions relative to vacuum level. ................................................... 7
Figure 1-6: Crystal structures of different polymorphs of TiO2. (Reproduced from ref [15]) ...................... 8
Figure 1-7: Raman spectrum of TiO2 anatase from Sigma Aldrich. ............................................................. 9
Figure 1-8: Powder X-ray diffraction spectrum of TiO2 antase from Sigma-Aldrich. ................................ 10
Figure 1-9: Band diagram of the TiO2 /CNT junction showing the bending of the bands of the n-type TiO2 semiconductor and the formation of a Schottky barrier at the junction with the CNT. .............................. 16
Figure 2-1: Pressure vs temperature phase diagram for CO2 (REFPROP Database, NIST). ..................... 18
Figure 2-2: Picture of the high-pressure injection system used for the syntheses in supercritical carbon dioxide. ....................................................................................................................................................... 20
Figure 2-3: Schematic of cell and high-pressure view-cell with sapphire windows. ................................. 20
Figure 2-4: Schematic of the high-pressure injection system and oven used for the synthesis in supercritical carbon dioxide. ....................................................................................................................... 21
Figure 2-5: Pressure transducer calibration (24.7 oC). Left axis: temperature of the cell vs time; right axis: pressure of the cell vs time (from left to right: liquid CO2, vapour pressure of CO2 gas/liquid equilibrium, CO2 gas) ...................................................................................................................................................... 22
Figure 2-6: Calibration of Omega DYNE pressure transducer; blue point at atmospheric pressure from Oshawa municipal airport. (yint=- 0.471; slope =3.533; R2 = 0.99996) ...................................................... 23
Figure 3-1: Schematic of the sol-gel process for the synthesis of aerogels, xerogels and dense ceramic materials. ..................................................................................................................................................... 25
Figure 3-2: a) Molecular structure of titanium tetraisopropoxide; b) Titanium dimer with acetate bridging

vi
ligands in blue. ............................................................................................................................................ 26
Figure 3-3: Hexaprismane shape 6 4 8 8 cluster. Isopropyl groups in the axial direction (red circles) and acetate ligands in the radial direction (blue circles). Figures reproduced from [45]. ............. 27
Figure 3-4: Reaction condensation pathways depending on amount of acetic acid added (from ref [45]). 28
Figure 3-5: Progression of TiO2 synthesis in SC-CO2 a) two phase system before pressurizing; b) liquid phase after pressurizing, but before heating; c) supercritical phase, 60 oC and 23 MPa; d-g) emulsion formation until the window becomes opaque. ............................................................................................ 33
Figure 3-6: SEM images of TiO2 samples synthesized in supercritical CO2: a,b) 60 oC, c) 100 oC, d,e) 150 oC at 22 MPa. All syntheses involved a AcOH/TTIP ratio of 4:1 and an aging time of five days. The images indicate increased nucleation and the formation of smaller particles with increasing temperature. .................................................................................................................................................................... 37
Figure 3-7: Dielectric constant and density of CO2 as a function of temperature at 23 MPa (data obtained from REFPROP). ........................................................................................................................................ 38
Figure 3-8: Raman spectra of TiO2 solid samples obtained at 60, 100, and 150 oC (AcOH/TTIP=4.0). The Raman spectrum of an anatase sample from Sigma-Aldrich (25 nm particle size) is also shown for comparison. Indicates greater crystallinity and the removal of contaminates with increasing temperature. .................................................................................................................................................................... 39
Figure 3-9: Pressure vs density plot for carbon dioxide. Vapour-liquid saturation line (red) and CO2 pressure at 60 oC. The highlighted region represents the pressure range covered in this study. ................ 40
Figure 3-10: SEM images of TiO2: a,b) 3.5 AcOH/TTIP and c,d) 5.5 AcOH/TTIP, both synthesized in heptane at 60 oC for 5 days. ........................................................................................................................ 41
Figure 3-11: TiO2 samples synthesized in SC-CO2 under different AcOH/TTIP ratios: a,b) 3.5, hierarchical spheres; c,d) 5.5, hierarchical spheres and fibers; and c, d) 7.0, fibers. ................................ 42
Figure 3-12: FTIR spectra of TiO2 materials synthesized in SC-CO2 and heptane using different AcOH /TTIP ratios. The spectra support the presence of the hexamer ring structure, and the differences in the degree of hydrolysis with different ratios. .................................................................................................. 44
Figure 3-13: DSC curves of TiO2 materials synthesized in SC-CO2 and heptane using different AcOH /TTIP ratios, offset from each other. The transition from amorphous to anatase is around 450 oC and from anatase to rutile is around 670 oC. ............................................................................................................... 45
Figure 3-14: TGA curves of solid products obtained under different conditions and temperatures. The materials synthesized at higher temperature have fewer impurities, and purging the SC-CO2 system removes some impurities. ........................................................................................................................... 45
Figure 3-15: Morphology of reaction products before and after annealing indicates no change in morphology. a) SC-CO2 4.0 as-synthesized b) after annealing at 500 oC for 90 min. ................................ 46
Figure 3-16: Raman spectra at different annealing temperatures showing the change from amorphous

vii
(bottom) to anatase (top) phase for a sample synthesized in SC-CO2 (AcOH:TTIP = 3.5). ....................... 47
Figure 3-17: Raman spectrum of TiO2 showing the normal vibrational modes of anatase. Inset: small peaks corresponding to the brookite phase. ................................................................................................ 48
Figure 3-18: XRD spectra of TiO2 (anatase) from different syntheses. Inset: A101 and B121 peaks of anatase and bookite respectively. ................................................................................................................ 48
Figure 3-19: Non-linear correlation of Raman peak FWHM (top) and peak position (bottom) of the 141cm-1 Raman band vs crystallite size as determined by XRD. Symbols correspond to anatase samples: SC-CO2 3.5, SC-CO2 5.5, Heptane 5.5, Heptane 3.5. data from different syntheses. The solid line represents the fittings results using equations 3-10 and 3-11. .............................................................. 50
Figure 3-20: SEM images of TiO2/CNT composite material: a,b) Heptane 5.5, c,d) SC-CO2, 5.5, e,f) SC-CO2 3.5. ....................................................................................................................................................... 52
Figure 3-21: Raman shift of TiO2/CNT composites and anatase TiO2 from Sigma-Aldrich. Insert D and G peaks corresponding to carbon nanotubes. ................................................................................................. 53
Figure 4-1: Single diode equivalent circuit model: Iph, photocurrent; the diode represents the recombination of electrons; Rs, series resistance; Rsh, shunt resistance; Vcell, load. ................................... 57
Figure 4-2: I-V curve for a DSSC. Isc: short circuit current, VOC: open circuit voltage, and VMP.JMP: maximum power point. ............................................................................................................................... 58
Figure 4-3: (A) electrode/electrolyte interface, (B) equivalent circuit, and (C) Nyquist plot for the equivalent circuit. The diameter of the semicircle represents the resistance while the capacitance can be obtained from the maximum in the Im Z axis. Increasing frequency is indicated by the symbol ω. .......... 60
Figure 4-4: Transmission line model for a DSSC used in impedance spectroscopy. rt – electron transport resistivity; rr – recombination resistance, Cμ – chemical capacitance at TiO2/electrolyte interface, Rs – series resistance, RDL – double layer resistance at working electrode, CDL- double layer capacitance at working electrode, Rpt – double layer resistance at counter electrode, Cpt – double layer capacitance at counter electrode [2,61,64,65]. ................................................................................................................... 61
Figure 4-5: Different steps involved in the fabrication of a DSSCs. From left to right: TiO2 film, Pt counter-electrode, sensitizer adsorption, and cell assembly. ....................................................................... 65
Figure 4-6: Screen printing paste preparation procedure. ........................................................................... 67
Figure 4-7: TGA and DSC results for a representative screen printing paste prior sinterization in air at a heating rate of 20 oC/min and a 20 mL/min gas flow rate. ......................................................................... 68
Figure 4-8: TGA and DSC runs for pristine and purified CNTs in air at a heating rate of 20 oC/min and a 20 mL/min gas flow rate. The figure shows the change in the decomposition of CNTs with temperature after the purification step. ........................................................................................................................... 69
Figure 4-9: Heating procedure for TiO2/CNT composites in air and argon. Run conditions: 20 oC/min, 30 oC up to 375 oC, then hold for 90 min, followed by 20 oC/min up to 500 oC then hold for 60 min. ........... 70
viii
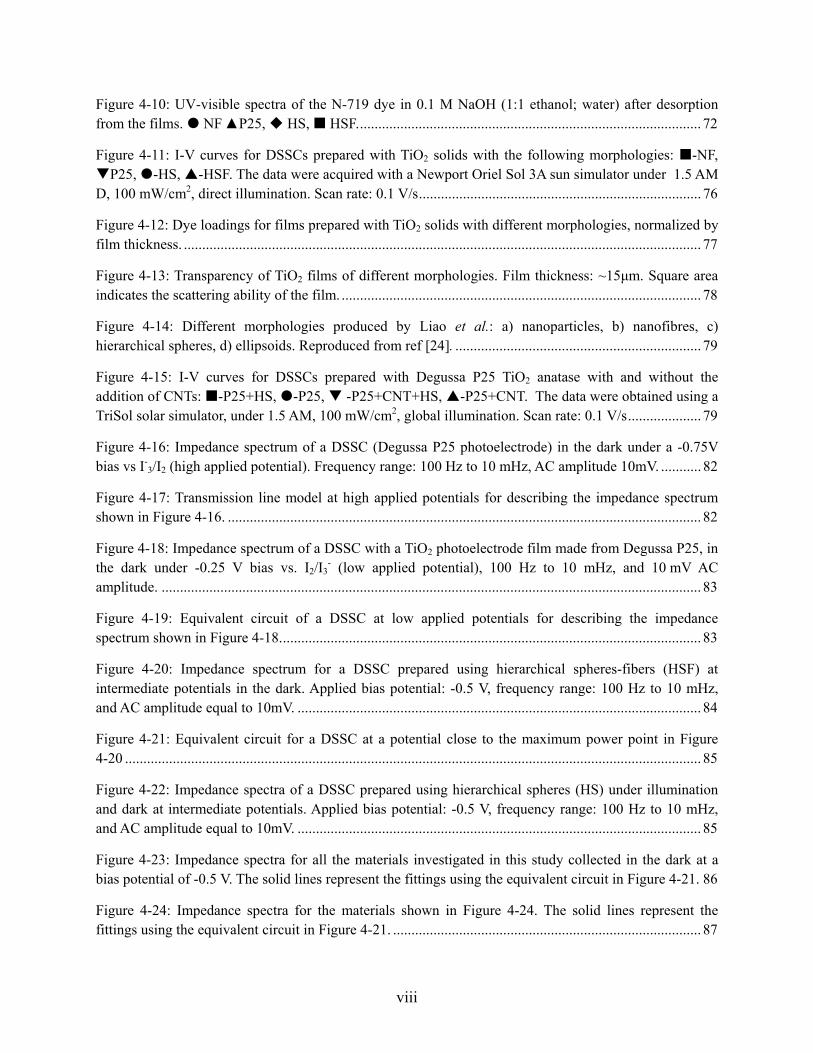
Figure 4-10: UV-visible spectra of the N-719 dye in 0.1 M NaOH (1:1 ethanol; water) after desorption from the films. NF P25, HS, HSF. ............................................................................................. 72
Figure 4-11: I-V curves for DSSCs prepared with TiO2 solids with the following morphologies: -NF, P25, -HS, -HSF. The data were acquired with a Newport Oriel Sol 3A sun simulator under 1.5 AM D, 100 mW/cm2, direct illumination. Scan rate: 0.1 V/s ............................................................................. 76
Figure 4-12: Dye loadings for films prepared with TiO2 solids with different morphologies, normalized by film thickness. ............................................................................................................................................. 77
Figure 4-13: Transparency of TiO2 films of different morphologies. Film thickness: ~15μm. Square area indicates the scattering ability of the film. .................................................................................................. 78
Figure 4-14: Different morphologies produced by Liao et al.: a) nanoparticles, b) nanofibres, c) hierarchical spheres, d) ellipsoids. Reproduced from ref [24]. ................................................................... 79
Figure 4-15: I-V curves for DSSCs prepared with Degussa P25 TiO2 anatase with and without the addition of CNTs: -P25+HS, -P25, -P25+CNT+HS, -P25+CNT. The data were obtained using a TriSol solar simulator, under 1.5 AM, 100 mW/cm2, global illumination. Scan rate: 0.1 V/s .................... 79
Figure 4-16: Impedance spectrum of a DSSC (Degussa P25 photoelectrode) in the dark under a -0.75V bias vs I-
3/I2 (high applied potential). Frequency range: 100 Hz to 10 mHz, AC amplitude 10mV. ........... 82
Figure 4-17: Transmission line model at high applied potentials for describing the impedance spectrum shown in Figure 4-16. ................................................................................................................................. 82
Figure 4-18: Impedance spectrum of a DSSC with a TiO2 photoelectrode film made from Degussa P25, in the dark under -0.25 V bias vs. I2/I3
- (low applied potential), 100 Hz to 10 mHz, and 10 mV AC amplitude. ................................................................................................................................................... 83
Figure 4-19: Equivalent circuit of a DSSC at low applied potentials for describing the impedance spectrum shown in Figure 4-18. .................................................................................................................. 83
Figure 4-20: Impedance spectrum for a DSSC prepared using hierarchical spheres-fibers (HSF) at intermediate potentials in the dark. Applied bias potential: -0.5 V, frequency range: 100 Hz to 10 mHz, and AC amplitude equal to 10mV. .............................................................................................................. 84
Figure 4-21: Equivalent circuit for a DSSC at a potential close to the maximum power point in Figure 4-20 ............................................................................................................................................................. 85
Figure 4-22: Impedance spectra of a DSSC prepared using hierarchical spheres (HS) under illumination and dark at intermediate potentials. Applied bias potential: -0.5 V, frequency range: 100 Hz to 10 mHz, and AC amplitude equal to 10mV. .............................................................................................................. 85
Figure 4-23: Impedance spectra for all the materials investigated in this study collected in the dark at a bias potential of -0.5 V. The solid lines represent the fittings using the equivalent circuit in Figure 4-21. 86
Figure 4-24: Impedance spectra for the materials shown in Figure 4-24. The solid lines represent the fittings using the equivalent circuit in Figure 4-21. .................................................................................... 87
ix
List of Tables
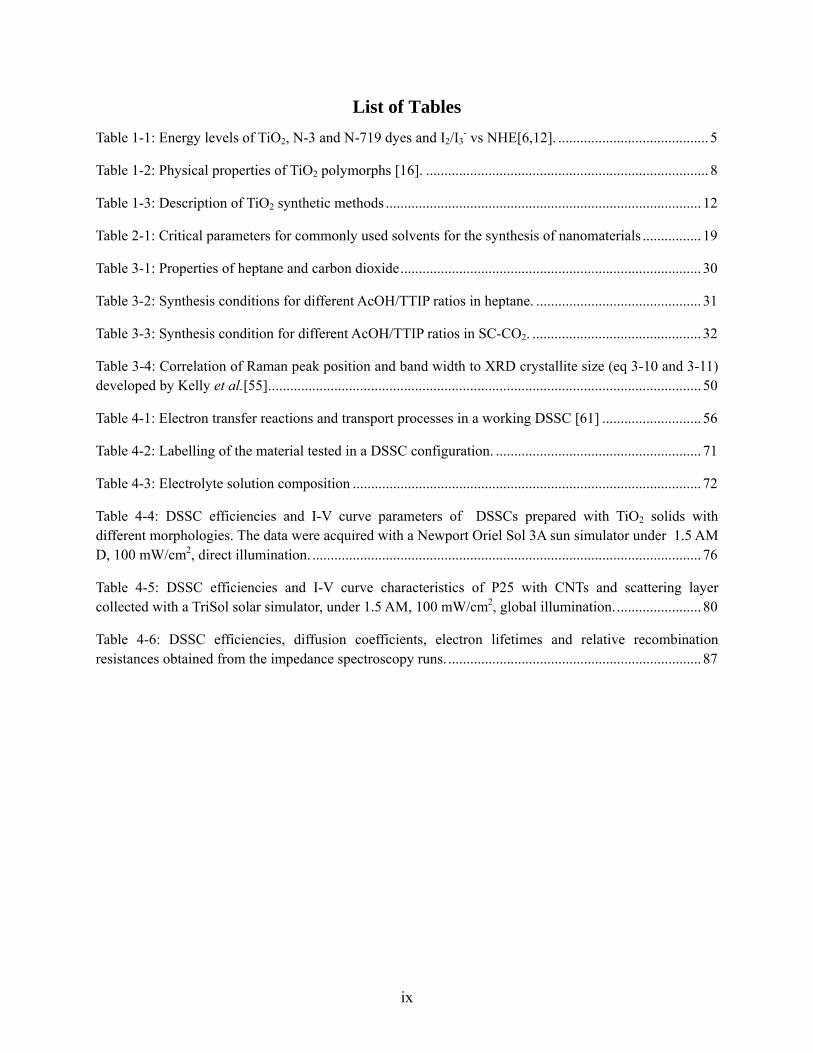
Table 1-1: Energy levels of TiO2, N-3 and N-719 dyes and I2/I3- vs NHE[6,12]. ......................................... 5
Table 1-2: Physical properties of TiO2 polymorphs [16]. ............................................................................. 8
Table 1-3: Description of TiO2 synthetic methods ...................................................................................... 12
Table 2-1: Critical parameters for commonly used solvents for the synthesis of nanomaterials ................ 19
Table 3-1: Properties of heptane and carbon dioxide .................................................................................. 30
Table 3-2: Synthesis conditions for different AcOH/TTIP ratios in heptane. ............................................. 31
Table 3-3: Synthesis condition for different AcOH/TTIP ratios in SC-CO2. .............................................. 32
Table 3-4: Correlation of Raman peak position and band width to XRD crystallite size (eq 3-10 and 3-11) developed by Kelly et al.[55] ...................................................................................................................... 50
Table 4-1: Electron transfer reactions and transport processes in a working DSSC [61] ........................... 56
Table 4-2: Labelling of the material tested in a DSSC configuration. ........................................................ 71
Table 4-3: Electrolyte solution composition ............................................................................................... 72
Table 4-4: DSSC efficiencies and I-V curve parameters of DSSCs prepared with TiO2 solids with different morphologies. The data were acquired with a Newport Oriel Sol 3A sun simulator under 1.5 AM D, 100 mW/cm2, direct illumination. .......................................................................................................... 76
Table 4-5: DSSC efficiencies and I-V curve characteristics of P25 with CNTs and scattering layer collected with a TriSol solar simulator, under 1.5 AM, 100 mW/cm2, global illumination. ....................... 80
Table 4-6: DSSC efficiencies, diffusion coefficients, electron lifetimes and relative recombination resistances obtained from the impedance spectroscopy runs. ..................................................................... 87

x
Abbreviations and Physical Constants
h Planck’s constant 6.620x10⁻³⁴ m2·kg/s e Electron charge 1.602x10⁻¹⁹ C KB Boltzmann constant 1.381x10⁻²³ m2·kg/s·K c Speed of light 2.998x10⁸ m/s
A Photoelectrode area AC Alternating current AcOH Acetic acid B1/2 Full width half maximum of the XRD peaks BET Brunauer-Emmett-Teller BSE Backscatter electron microscopy CB Conduction band Cdl Double layer capacitance CDL Double layer capacitance at working electrode/electrolyte interface CNT/MWCNT Carbon nanotubes/multiwalled carbon nanotubes Cpt Double layer capacitance at counter electrode/electrolyte interface CV Valence band Cμ Chemical capacitance d TiO2 film thickness D TiO2 average crystallite size DC Direct current DSC Scanning differential calorimetry DSSC Dye sensitized solar cells Ef Fermi level FF Fill factor FTIR Fourier transform infrared spectroscopy FTO Fluorine doped tin oxide glass c Charge collection efficiency inj Injection efficiency of the electron from the dye into the TiO2 LHE Light harvesting efficiency IMP Current at the maximum power point IPCE Incident photon-to-current conversion efficiency Iph Photocurrent IS(EIS) Impedance Spectroscopy (Electrochemical impedance spectroscopy) ISC Short circuit current I-V Current-voltage jd Dark reverse current density jsc Short circuit current density k1,k2 Raman-XRD correlation fitting parameters L Electron diffusion length NIST National Institute of Standards and Technology m Ideality factor Pin Total incident solar power to the cell Q Raman wavevector

xi
Rcell Total resistance of a DSSC cell Rct Charge transfer resistance RD Resistance associated with electrolyte diffusion Rpt Counter-electrode resistance rr Recombination resistance Rr Recombination resistance of the film Rs Series resistance Rsh Shunt resistance rt Transport resistance Rt Transport resistance of the film RTiO2 Total resistance of the TiO2 photoelectrode SEM Scanning electron microscopy TGA Thermal gravimetric analysis TTIP titanium tetraisopropoxide VMP Voltage at the maximum power point Voc Open circuit voltage XRD X-Ray diffraction Z Impedance θ Diffraction angle Γ Raman 141 cm-1 FWHM Γo Intrinsic Raman 141 cm-1 FWHM ωo Intrinsic Raman 141 cm-1 peak position ∆ω Raman 141 cm-1 peak position

1
1 Chapter 1: Introduction
It is well known that in order to meet the world’s energy requirements, and maintain a
healthy ecosystem on earth we must find alternatives to conventional fossil fuel energy
resources. There is a growing need to produce alternative forms of fuel and fuel production
technologies that are pollution free, storable, and economical. Solar energy is one of the most
viable solutions, and the development of inexpensive and efficient solar technologies is one of
the primary goals of current research around the world.
The sun continuously irradiates the earth with 120,000 terawatts of energy which
dramatically dwarfs the 13 terawatts of energy we currently consume per day[1,2]. Harnessing a
small fraction of this energy to produce heat or electricity would be enough to meet the world’s
growing energy demands. Sunlight can be converted into energy in numerous ways: concentrated
sunlight can produce heat for use or conversion into electricity; it can produce fuels synthetically
and naturally for the storage of energy, using a photochemical process as in photosynthesis; and
it can be directly converted into electricity by exciting electrons in a photovoltaic device. Since
Einstein's discovery of the photovoltaic effect, there has been significant progress in the field.
The word photovoltaic pertains to a type of material able to convert solar energy into useful
electrical energy. They exploit the capability of semiconductors to excite electrons into a higher
energy state within the material, creating a potential difference when exposed to light. The
excited electrons are delocalized with greater mobility and can be collected by an external circuit
and used for work. Different materials and solar cell configurations have been proposed to
increase the efficiency and reduce their cost. These systems can be divided into three main
groups (as shown in Figure 1-1):
(I) First generation solar cells: composed of mono-crystalline, poly-crystalline silicon
or other homojunction semiconductors. They depend on a p-n junction to create a
depletion region and separate the electron-hole pairs. The disadvantages of the
silicon based photovoltaic are that they cannot absorb radiation with energy below
that of the band gap (1.12 eV for crystalline silicon) [3] and they lose the thermal
energy of photons exceeding the bandgap. Furthermore, there is a theoretical limit
2
for photovoltaic conversion, known as the Shockley-Queisser limit, at 33.7% [4].
These solar cells have been commercially manufactured since the 1950's and have
proven reliable. They are currently the most efficient generation of solar cells and
make up most of the market. To compete with the fossil fuel industry a production
cost of $0.5/W would need to be achieved. Currently crystalline silicon cells are
very energy intensive to produce and have an energy cost of about $3/W[5,6].
(II) Second generation photovoltaic cells: comprised of thin film solar cells made of
CdTe, CIGS, and amorphous silicon (a-Si). They are lighter, more flexible, easier
to manufacture and can be used in multiple junction solar cells. They are less
expensive than silicon based solar cells but are less efficient, ~10%, and in some
cases use more toxic materials [5]. Currently their energy cost is around $1/W[6].
(III) Third generation photovoltaic cells: this group includes a collection of
unconventional systems created with the goal of surpassing the Shockley-Queisser
efficiency limit and lowering production cost. Within this group are tandem and
multi-junction solar cells; nano-crystalline solar cells which use the principle of
quantum dots; organic solar cells or hetero-junction solar cells, which use
photoreactive polymers as electron donors and fullerenes as acceptors; and finally
dye sensitized solar cells (DSSC)[2,5].

3
Figure 1-1: Projections of cost and efficiency for the three solar cell generations. The single bandgap limit pertains to the Shockley-Queisser limit for unconcentrated (31.0%) and concentrated (40.8%) light. The thermodynamic limit is given by the theoretical efficiencies without energy lost for multi-junction solar cells. (Reproduced from ref [2]).
1.1 Dye Sensitized Solar Cells
The framework for DSSCs was set up by Fujishima and Honda in 1972 [7], when they
demonstrated that one could photo-decompose water using a TiO2 electrode. Since then, much
research has gone into understanding the fundamental physical and chemical processes of TiO2
photocatalysts. This lead Brian O’Regan and Michael Grätzel [8], to create a new photo-
electrochemical cell termed the dye sensitized solar cell that used a TiO2 electrode in conjunction
with a dye to harvest visible light and near infrared radiation [8]. In 2010, Michael Grätzel’s
work was recognized with the prestigious Millennium Technology Grand Prize for his
contributions to the field [9].
Dye sensitized solar cells rely on an interpenetration network of chemical junctions
instead of the conventional solid-state homo junction devices. They separate the functions of the

4
absorption of light and the separation of the charge carriers unlike conventional cells that do this
in a single step. As shown in Figure 1-2, DSSCs are comprised of five main components: (i) a
dye, commonly a ruthenium complex (Figure 1-3), adsorbed on a (ii) mesoporous
nanocrystalline semiconducting oxide, commonly TiO2, deposited on to; (iii) a transparent
conductive oxide on a glass substrate, most often fluorinated tin oxide (FTO) which makes up
the photoanode; (iv) a counter electrode, commonly platinum on FTO; and (v) a redox mediator,
conventionally an iodide/tri-iodide couple when using a ruthenium dye [10].
Figure 1-2: Schematic of a DSSC showing the main components: the photoanode (FTO/TiO2/Dye), the electrolyte, and the platinum counter-electrode.
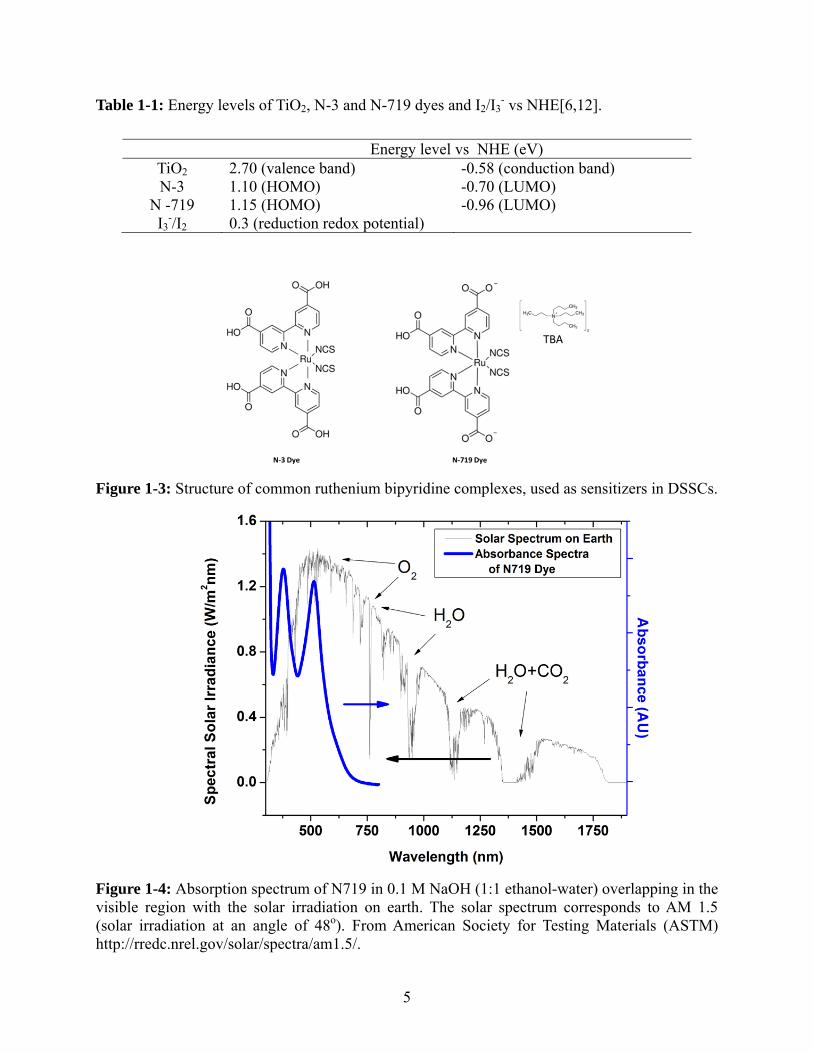
Suitable dyes for this application are ones that have a broad absorption spectrum in the
visible region, the dominant irradiation region on earth (Figure 1-4), as well as a reduction
potential higher than that of TiO2 and an oxidation potential lower than I3-/I2 redox potential
(Table 1-1). Moreover these dyes need to have a high photochemical stability in both the ground
and excited states to allow for millions of turnovers and a long lifetime [11]. The sensitizer dyes
most commonly used are ruthenium based complexes such as N-3 (C26H16N6O8RuS2) and N-719
(C58H86N8O8RuS2) because they possess the above mentioned properties.
5
Table 1-1: Energy levels of TiO2, N-3 and N-719 dyes and I2/I3- vs NHE[6,12].
Energy level vs NHE (eV) TiO2 2.70 (valence band) -0.58 (conduction band) N-3 1.10 (HOMO) -0.70 (LUMO)
N -719 1.15 (HOMO) -0.96 (LUMO) I3
-/I2 0.3 (reduction redox potential)
Figure 1-3: Structure of common ruthenium bipyridine complexes, used as sensitizers in DSSCs.
Figure 1-4: Absorption spectrum of N719 in 0.1 M NaOH (1:1 ethanol-water) overlapping in the visible region with the solar irradiation on earth. The solar spectrum corresponds to AM 1.5 (solar irradiation at an angle of 48o). From American Society for Testing Materials (ASTM) http://rredc.nrel.gov/solar/spectra/am1.5/.

6
In a DSSC, the photocurrent depends on the number of electrons that can be promoted
from the HOMO to the LUMO of the ruthenium complex sensitizer, The percentage transfered to
the conduction band of the TiO2 substrate, and finally to the FTO. As illustrated in Figure 1-5,
the photoelectrons pass through the external circuit to the counterelectrode where the reduction
of iodine (triiodide) to iodide takes place, then iodine will reduce the dye to sustain the cycle [6].
The maximum voltage depends on the potential difference between the Fermi level of TiO2 and
the redox potential of the iodide/triiodide couple [13]. The highest efficiency for a lab size cell
(0.16 cm2) stands at 12.3% under AM 1.5 G irradiation [14]; while for larger modules, 25-
100 cm2, value of about 8.5% is reported [2]. An air mass of 1.5 (AM1.5) is used as a
representative spectrum at Earth’s surface and corresponds to a light path length through the
atmosphere at 48o angle.
Since O’Regan’s and Grätzel’s paper in 1991 [8] DSSC technology has gained a great
deal of attention. The amount of research in the field has grown exponentially, reaching around
2000 publications in 2012. Because of the low fabrication cost, light weight, diversity of colours,
and transparency options, industries such as Dyesol® and Solaronix® have started to produce
modules and cater to research and development in this field. Clearly, the optimization of such
complex system will require the work of chemists, physicists and engineers.

7
Figure 1-5: Schematic diagram of the electron transfer processes in a DSSC: a) Electron transfer band diagram; red arrows show the desired pathway for electron collection and green are the deleterious processes. The redox levels and band positions relative to vacuum level.
1.2 The TiO2 Film: A Key Element in the Photoanode
Titanium dioxide (TiO2) is the most widely used material in dye sensitized solar cells,
mainly due to its photo- and thermal stability, chemical inertness, low cost, and low toxicity. The
TiO2 nanoparticles function as an electron/hole charge separator. Furthermore they form a
mesoporous structure providing a scaffold for the dye, channels for the electrolyte, and a
pathway for electron conduction.
TiO2 has three crystalline phases: brookite, anatase and rutile, with a Ti coordination of 6.
The crystal structures are shown in Figure 1-6 and some physical properties of these phases are
given in Table 1-2.

8
Figure 1-6: Crystal structures of different polymorphs of TiO2. (Reproduced from ref [15])
Table 1-2: Physical properties of TiO2 polymorphs [16].
Rutile Anatase Brookite
Crystal system Tetragonal Tetragonal Rhombohedral
Space group 4 / 4 /
Lattice constants (Å)
a 4.594 3.784 9.166
b 4.594 3.784 5.436
c 2.958 9.515 5.130
Density (kg/m3) 4240 3830 4170
Band gap (eV) 3.0 3.2 -
9
Brookite is the least common form of TiO2 with a rhombohedral crystal structure and a dark
brown colour. Rutile is the most common and the most stable at high temperature and large
crystal sizes [17]. It is tetragonal, with a band gap of 3.0 eV, and is a translucent reddish brown
solid [16]. Anatase stems from the Greek word ‘anatasis’ meaning extension because it resembles
the rutile tetragonal structure only elongated in the “c” direction (Figure 1-6). The physical
properties of these three polymorphs are given in Table 1-2. Anatase is stable at small particle
sizes ~14 nm [18], and has a large band gap of 3.2 eV, that limits the absorbance to the
ultraviolet region, λ < 385 nm, which represents approximately 5-8% of the solar spectrum on
earth. Despite the larger band gap, anatase is the more photocatalytically active, because of its
higher redox potential, high absorbance onto TiO2, better electron mobility, and fewer
occurrences of recombination [19,20]. For this reason it has become a promising photocatalyst
for a wide range of applications, such as: photodecomposition of pollutants, and photo-
superhydrophilicity applications; it is also used in thin films and self-cleaning devices and as
UV-shielding in paints, textiles and sunscreens [16].
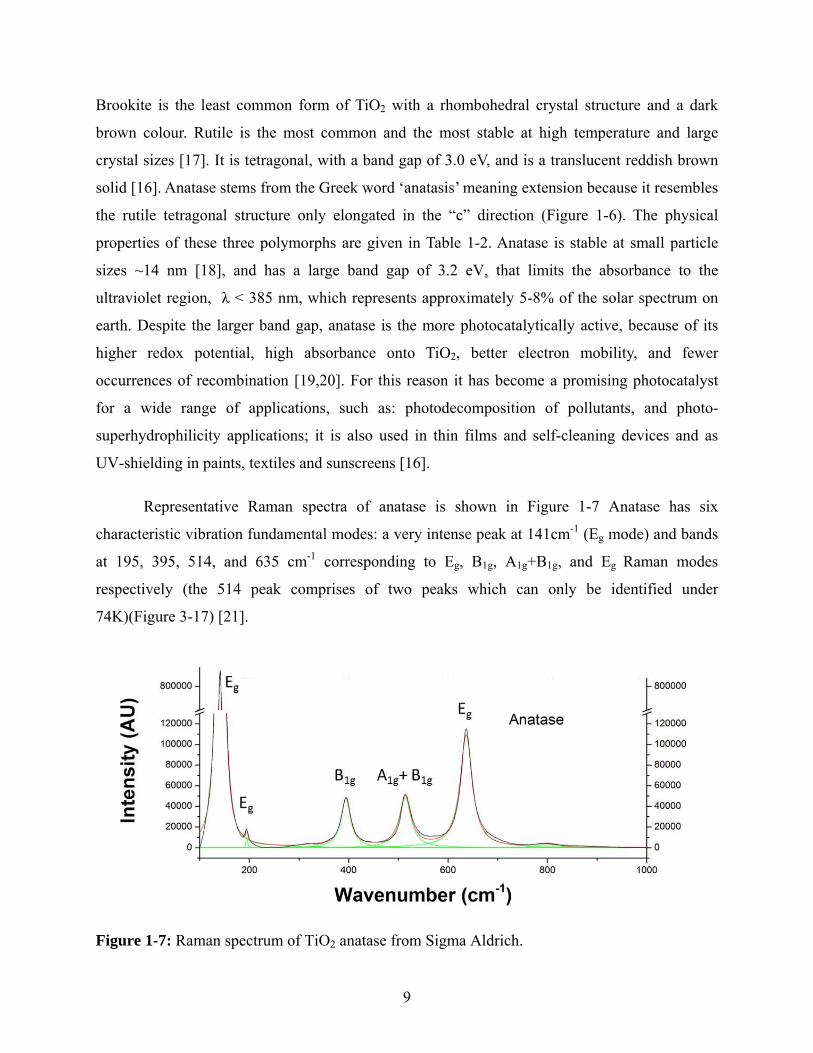
Representative Raman spectra of anatase is shown in Figure 1-7 Anatase has six
characteristic vibration fundamental modes: a very intense peak at 141cm-1 (Eg mode) and bands
at 195, 395, 514, and 635 cm-1 corresponding to Eg, B1g, A1g+B1g, and Eg Raman modes
respectively (the 514 peak comprises of two peaks which can only be identified under
74K)(Figure 3-17) [21].
Figure 1-7: Raman spectrum of TiO2 anatase from Sigma Aldrich.

10
A representative X-ray diffraction spectrum of anatase is shown in Figure 1-8. The planes
in the crystal (Bravais) lattice are given by the Miller indices. The (101) plane is the most stable.
Other peaks correspond to the (103), (004), (112), (200), (105) and (211) surfaces.[18]
Figure 1-8: Powder X-ray diffraction spectrum of TiO2 antase from Sigma-Aldrich.
Anatase TiO2 can absorb ultraviolet radiation, and work as a photocatalyst by itself.
Upon absorption of light an electron is excited from the valence band (highest electron energies
at absolute zero) to the conduction band (minimum electron energy required to free the electron
from its binding atom). The promotion of the electron into the conduction band allows the
electron to move freely and conduct electricity, but it leaves behind a positively charge atom or
“hole”. The oppositely charged electron-hole pair will recombine if the charge carriers are not
removed by other processes, like in a DSSC[16].
The electron-hole pair has a lifetime usually in the nanosecond regime, but if the charge
carriers can migrate to the surface (the holes by diffusion) they can undergo charge transfer to

11
adsorbed species on the TiO2 [20]. As expected, recombination in the semiconductor, or back
transfer from the adsorbed species, lowers the quantum efficiency (IPCE).
Ideal TiO2 crystal lattices are seldom possible in nanoparticles, instead the surface and
bulk are filled with defects occurring from the synthesis. Although anatase is 6-fold coordinated,
it is almost always oxygen-deficient, TiO2-x (x≈0.01) [2]. These deficiencies act as an n-type
dopant (an excess of electrons) [20]. The n-type characteristic causes an accumulation of
electrons at the surface forming a depletion layer and the bands to bend upwards at the interface
between the particle and a metal forming a Schottky barrier [16]. These irregularities also have a
different energy state than the bands and act as trapping sites on the surface helping to suppress
recombination [20]. The smaller the particle the more reactive it is. A small particle size
(~20 nm) is desired not only to increase the surface area, but also to increase surface/volume
ratio and the distance charged carriers need to travel, thus reducing recombination[16,22].
Particle sizes less than 12 nm introduce quantum size effects and increase the band gap [20].
In the nanoporous network of TiO2, an excited electron is subjected to hundreds of
thousands of trapping events caused by isolated nanoparticles, surface states, and defects [23].
Trapping events slow the electron percolation towards the electrode and increase the probability
of recombination. To guarantee that particles are electronically interconnected, a high
temperature sintering step is applied to the TiO2 film before adsorbing the dye [11]. Liao et al.
[24] found that the morphology of the particles can be as important as crystallinity and size due
to light scattering. They showed that TiO2 hierarchical spheres had greater efficiency in the
photoanode of a DSSC due to greater dye loading and light scattering even though the electron
lifetime was greater than in highly crystalline and smaller particle photoanodes. Other methods
of increasing the efficiency include placing a 200-400 nm nanoparticle scattering layer on top of
the smaller particles; this increases the absorbance of light in the red or near-infrared region and
scatters the light back through the photoanode.
The mixture of anatase and rutile has proven to be a better catalyst than any pure phase. It
was proposed that rutile acts as an electron sink because of its lower band energy, thus leading to
greater electron-hole separation and reducing the recombination [25]. However, Hurum et al.
[19] showed that rutile can act as a sensitizer and pass electrons to lower energy anatase lattice
12
trapping sites. This stabilizes the charge separation allowing the charge carriers to move to the
surface for catalysis and reduces recombination. Commercially available Degussa P25® is often
used as a reference because of its excellent photocatalytic activity. It is produced through the
pyrolysis of TiCl4 at high-temperatures, and is a mixture of 80% anatase, 15% rutile, and 5%
amorphous titania [26,27].
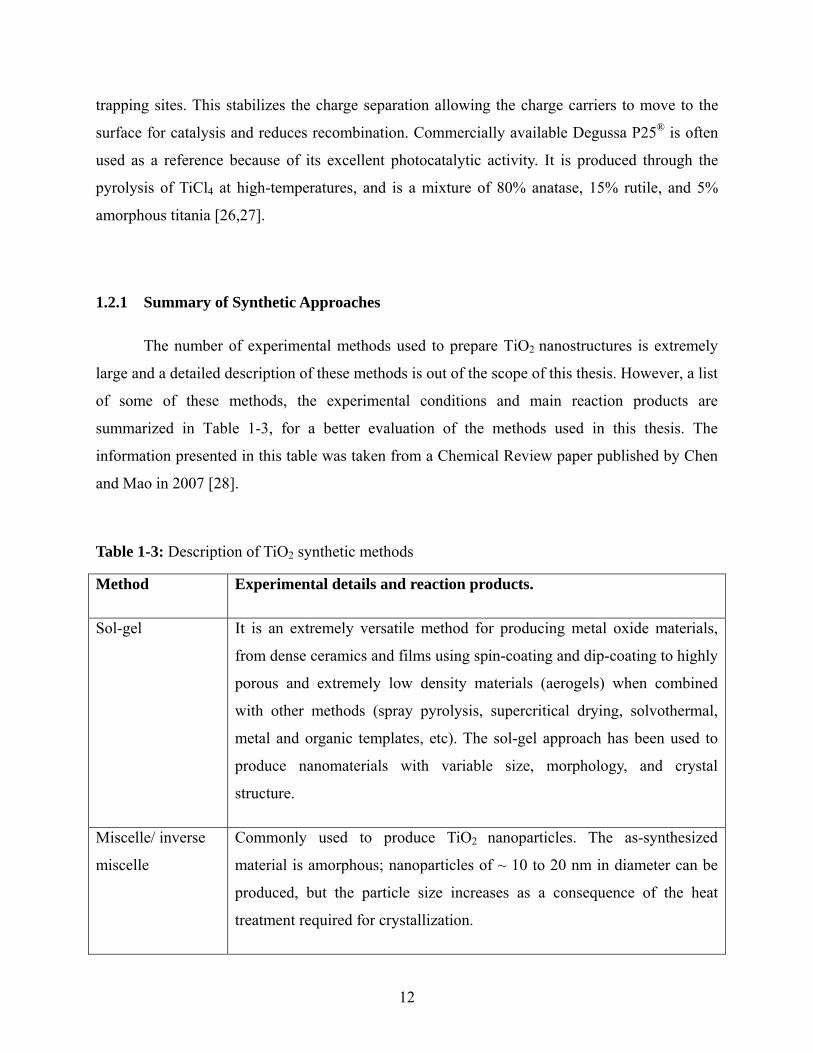
1.2.1 Summary of Synthetic Approaches
The number of experimental methods used to prepare TiO2 nanostructures is extremely
large and a detailed description of these methods is out of the scope of this thesis. However, a list
of some of these methods, the experimental conditions and main reaction products are
summarized in Table 1-3, for a better evaluation of the methods used in this thesis. The
information presented in this table was taken from a Chemical Review paper published by Chen
and Mao in 2007 [28].
Table 1-3: Description of TiO2 synthetic methods
Method Experimental details and reaction products.
Sol-gel It is an extremely versatile method for producing metal oxide materials,
from dense ceramics and films using spin-coating and dip-coating to highly
porous and extremely low density materials (aerogels) when combined
with other methods (spray pyrolysis, supercritical drying, solvothermal,
metal and organic templates, etc). The sol-gel approach has been used to
produce nanomaterials with variable size, morphology, and crystal
structure.
Miscelle/ inverse
miscelle
Commonly used to produce TiO2 nanoparticles. The as-synthesized
material is amorphous; nanoparticles of ~ 10 to 20 nm in diameter can be
produced, but the particle size increases as a consequence of the heat
treatment required for crystallization.

13
Sol Usually it involves the reaction of TiCl4 with an oxygen donor molecule
(titanium alcoxide or organic ether). The condensation reaction between
Ti-Cl and Ti-OR results in the formation of Ti-O-Ti bridges and the
formation of extremely small nanoparticles (1-5 nm). The method can also
be combined with other approaches.
Hydrothermal
It is also highly versatile, but it requires a high pressure vessel (or
autoclave) and controlled pressure and temperature conditions.
Temperatures can be well above the normal boiling point of water, usually
in the 150 to 250 oC range, and pressures between 5 - 20 MPa.
Nanocrystalline materials can be obtained at extremely high temperature,
under supercritical water conditions. Nanoparticles (rods and particles)
between 7-25 nm in diameter were prepared by adjusting the concentration
of the titanium precursor, the composition of the solution, temperature and
reaction time.
Solvothermal Almost identical to the hydrothermal method except that a non-aqueous
solvent is used instead of water. It provides a better control of the size,
shape distribution, and crystallinity at lower temperatures. Common
solvents are ethanol, methanol, etc.
Direct Oxidation The method involves the oxidation of a titanium substrate (anode). For
instance, TiO2 nanotubes (15-120 nm diameter and 20 nm to 10 µm in
length) have been prepared by anodic oxidation of a titanium foil in a
0.5 wt% HF solution under 10-20 V for 10 to 20 min using Pt as the
counter electrode. The product has to be annealed at high temperature
(~ 500 oC for 6 h in oxygen) to obtain crystalline anatase.
Chemical Vapour
Deposition (CVD)
In this approach, TiO2 nanoparticles (and films) are produced by pyrolysis
of a titanium precursor (i.e. titanium tetraisopropoxide, TTIP). It requires a
vacuum chamber.

14
Physical Vapour
Deposition (PVD)
Similar to CVD, but a chemical reaction such pyrolysis is not required.
Electrodeposition TiO2 nanowires have been prepared by electrodeposition of a titanium
metal from a 0.2 M TiCl3 solution at pH=2 using an anodized alumina
template as cathode and a pulse electrodeposition method. After deposition,
the deposited metal/template is heated and kept at 500 oC for a few hours
in oxygen to oxidize the metal and promote the formation of anatase. The
template is removed using a H3PO4 aqueous solution..
Sonochemical Ultrasound can be used to synthesize crystalline nanomaterials taking
advantage of the high temperatures and pressures (up to ~ 5000 K and
100 MPa) that can be achieved by acoustic cavitation (formation, growth,
and implosive collapse of bubbles in a liquid). TiO2 nanoparticles from
5 nm to 300 nm have been prepared with this approach.
Microwave Microwave radiation has been used to prepare different TiO2
nanomaterials. One of the best advantages of this approach is the time
required for the syntheses. Colloidal titanium nanoparticles have been
prepared in 5 to 60 min. The method can be used to produce anatase and
rutile nanoparticles, nanotubes, and nanorods.
Synthesis of TiO2 Aerogels using Supercritical Carbon Dioxide.
The use of supercritical fluids for the synthesis of nanomaterials is an attractive
alternative to vacuum techniques or other solution based methods because nanoparticles with
highly controlled size and morphology can be prepared by changing the metal precursor, the
temperature and/or the pressure of the fluid. In addition, the method is ideal for in-situ surface
modification when used in combination with capping agents, surfactants, or self-assembly
methods.[29]

15
It is particularly useful for preparing composite materials d ue to the excellent conformity
that can be obtained over highly complex topographies because of the low viscosity, high
diffusivity, and zero surface tension of fluids in the supercritical region. P The microscopic
precision of TiOB2 B replicas of materials such cotton and pollen, obtained using a sol-gel method in
supercritical carbon dioxide (SC-COB2 B) was better than the one obtained by a conventional sol-gel
method, P because the titanium precursor, aided by the SCF, can reach the surface of the sample
and react with the -OH groups and HB2 BO adsorbed on the substrate surface. In addition, the low
viscosity of SC-CO2 prevents the collapse of the structure.[29]
TiO2 /CNTs Composites for DSSC Photoanodes
Recently multi-walled carbon nanotubes (MWCNTs) have been added to the TiO2
nanoporous network in order to improve the photodecomposition of organic compounds [30] and
the efficiency of DSSCs [22,31]. Conductive carbon nanotubes act as 1-dimentional nanowires
and have excellent electron mobility along their length [32].
Carbon Nanotubes (CNTs) were first identified by Sumio Iijima’s group in 1991[33];
since then there has been an explosion of research into carbon nanotubes applications because of
their fascinating electronic, mechanical and optical characteristics. Some proposed applications
involve molecular containers for hydrogen and biological substances, nanowires, chemical and
biological sensors, tips in scanning probe microscopy, utilization in flat-panel displays,
photovoltaic devices, etc.
Carbon nanotubes can be described as a sheet of graphene rolled into a tube, where each
carbon atom is connected to three others through strong bonds at 120o (sp2 orbitals). The
remaining π electrons are delocalized over the plane allowing it to be electrically and thermally
conductive [34]. Single walled carbon nanotubes (SWCNT) are classified by length, diameter
and chirality (the orientation of bonds around the circumference). The length of nanotubes ranges
from hundreds of micrometers and even centimetres [35].
Multi-walled nanotubes (MWCNTs) are coaxial layers of single walled nanotubes held
together through van der Waal interactions with an interlayer spacing of about 0.34 nm [34].
They tend to be metallic or semi metallic due to intertube coupling causing electron-hole pairing

16
and the decrease in band gap with increase in diameter. The electrical properties are determined
by the outer most layer of the MWCNT, because the π electrons are more delocalized outside the
tube [34].
Three main proposed mechanisms have been proposed by which CNTs attached to TiO2
nanoparticles can increase the efficiency of DSSCs: i) act as an electron sink by forming a
Schottky barrier at the interface between TiO2 and the CNT, trapping the electron and increasing
its mobility (Figure 1-9); ii) act as a sensitizer absorbing light and exciting electrons to the TiO2
(this method is only possible with single walled nanotubes of semiconducting type); and iii) act
as a general carbonaceous impurity and induce defects into the TiO2 band gap from local lattice
reordering (this adds interstitial points in the band gap and makes it easier to promote an excited
electron) [22,31]. This work is only interested in the first mechanism, using the MWCNT to
decreasing the distance electrons need to percolate through the mesoporous network to enter the
circuit.
Figure 1-9: Band diagram of the TiO2 /CNT junction showing the bending of the bands of the n-type TiO2 semiconductor and the formation of a Schottky barrier at the junction with the CNT.
It is worth noting that the black MWCNTs absorb in a wide spectrum range and
undoubtedly lead to blockage of photons, but there are other deleterious processes. The Schottky
barrier height at the interface between TiO2 and MWCNT limits the charge collection efficiency
by the MWCNTs [31], and in DSSC a naked spot on a MWCNT provides a place for

17
recombination of the photogenerated electrons with the electrolyte, as carbon is a catalyst for the
reduction of the electrolyte [36].
1.3 Thesis Objectives
The main objective of this thesis was to investigate the photocatalytic activity of TiO2
and TiO2/MWCNTs photoanodes prepared with TiO2 nanoparticles of different size and shape.
Special attention was given to the methods used for the synthesis, with the aims of obtaining well
uniform products and enough amount of material for a complete characterization and the
preparation of dye sensitized solar cells.
To achieve this objective the following steps were taken:
1) A high pressure and high temperature system was designed and constructed for synthesis
involving supercritical carbon dioxide. A view-cell (autoclave) with sapphire windows
was used to confirm the presence of more than one phase, and the evolution of the
reactions. The system is described in Chapter 2.
2) Different synthetic approaches were investigated and tested in the laboratory, until a
method able to produce enough amount of material for the preparation of dye sensitized
solar cells could be identified and implemented. The sol-gel approaches used for the
synthesis and the characterization methods (XRD, Raman, FTIR, SEM, etc) are presented
in Chapter 3.
3) A method for screen printing TiO2 films on FTO was implemented to prepare the
photoanodes used in the DSSCs for studying the photoelectrical properties of the cells.
The methods used for the fabrication of DSSCs and the photoelectric properties of the
cells are summarized in Chapter 4.
18
2 Chapter 2: High Pressure System Design
2.1 Supercritical Fluids and High-Pressure System for Supercritical Drying and
Synthesis
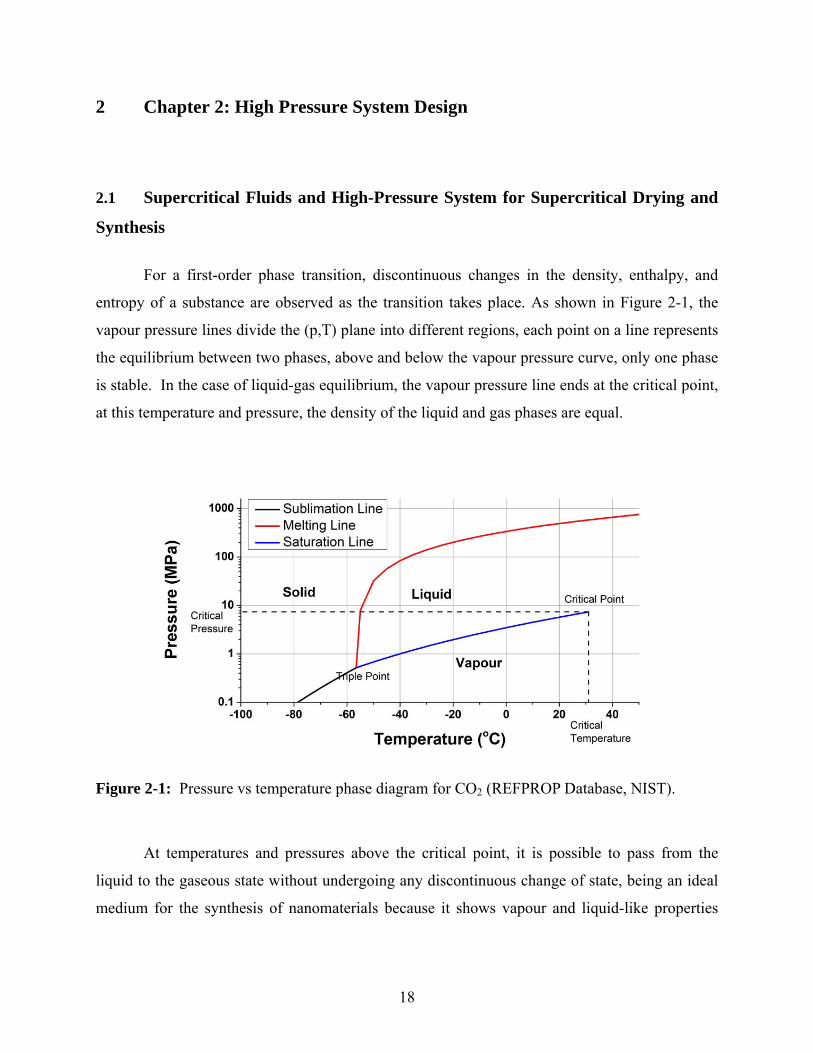
For a first-order phase transition, discontinuous changes in the density, enthalpy, and
entropy of a substance are observed as the transition takes place. As shown in Figure 2-1, the
vapour pressure lines divide the (p,T) plane into different regions, each point on a line represents
the equilibrium between two phases, above and below the vapour pressure curve, only one phase
is stable. In the case of liquid-gas equilibrium, the vapour pressure line ends at the critical point,
at this temperature and pressure, the density of the liquid and gas phases are equal.
Figure 2-1: Pressure vs temperature phase diagram for CO2 (REFPROP Database, NIST).
At temperatures and pressures above the critical point, it is possible to pass from the
liquid to the gaseous state without undergoing any discontinuous change of state, being an ideal
medium for the synthesis of nanomaterials because it shows vapour and liquid-like properties
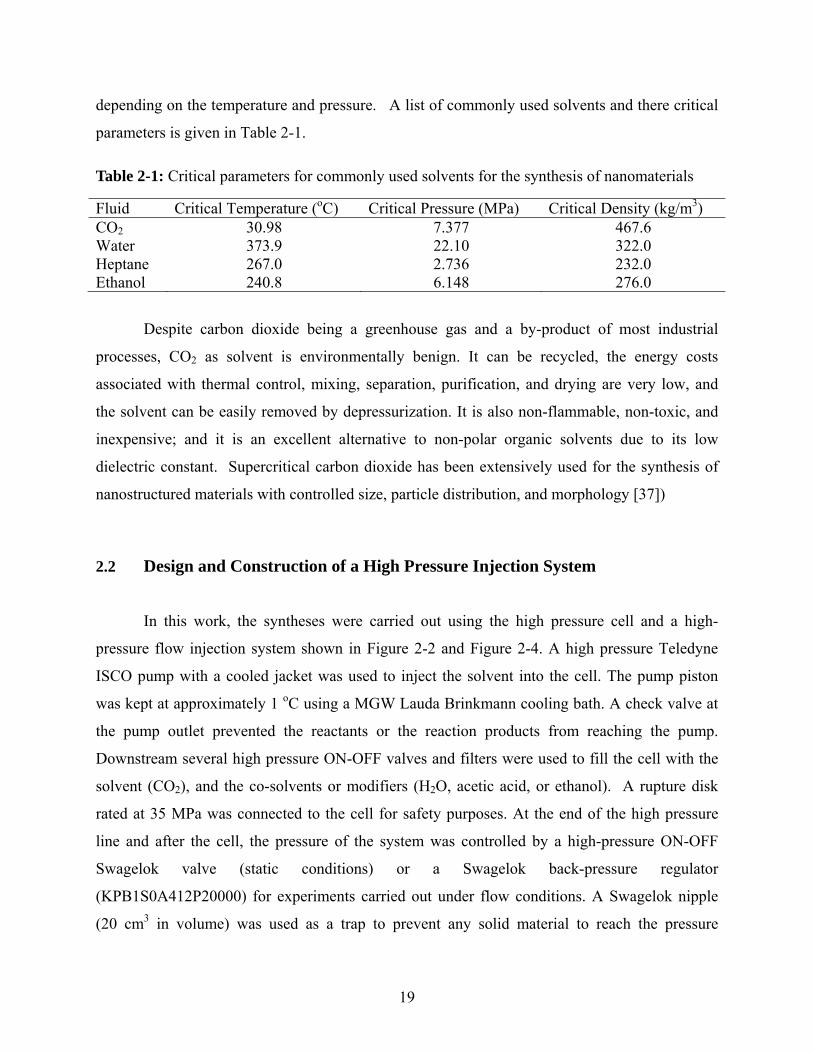
19
depending on the temperature and pressure. A list of commonly used solvents and there critical
parameters is given in Table 2-1.
Table 2-1: Critical parameters for commonly used solvents for the synthesis of nanomaterials
Fluid Critical Temperature (oC) Critical Pressure (MPa) Critical Density (kg/m3) CO2 30.98 7.377 467.6 Water 373.9 22.10 322.0 Heptane 267.0 2.736 232.0 Ethanol 240.8 6.148 276.0
Despite carbon dioxide being a greenhouse gas and a by-product of most industrial
processes, CO2 as solvent is environmentally benign. It can be recycled, the energy costs
associated with thermal control, mixing, separation, purification, and drying are very low, and
the solvent can be easily removed by depressurization. It is also non-flammable, non-toxic, and
inexpensive; and it is an excellent alternative to non-polar organic solvents due to its low
dielectric constant. Supercritical carbon dioxide has been extensively used for the synthesis of
nanostructured materials with controlled size, particle distribution, and morphology [37])
2.2 Design and Construction of a High Pressure Injection System
In this work, the syntheses were carried out using the high pressure cell and a high-
pressure flow injection system shown in Figure 2-2 and Figure 2-4. A high pressure Teledyne
ISCO pump with a cooled jacket was used to inject the solvent into the cell. The pump piston
was kept at approximately 1 oC using a MGW Lauda Brinkmann cooling bath. A check valve at
the pump outlet prevented the reactants or the reaction products from reaching the pump.
Downstream several high pressure ON-OFF valves and filters were used to fill the cell with the
solvent (CO2), and the co-solvents or modifiers (H2O, acetic acid, or ethanol). A rupture disk
rated at 35 MPa was connected to the cell for safety purposes. At the end of the high pressure
line and after the cell, the pressure of the system was controlled by a high-pressure ON-OFF
Swagelok valve (static conditions) or a Swagelok back-pressure regulator
(KPB1S0A412P20000) for experiments carried out under flow conditions. A Swagelok nipple
(20 cm3 in volume) was used as a trap to prevent any solid material to reach the pressure

20
regulator or the ON-OFF Swagelok valve. A schematic of the cell and the heating cradle, along
with a picture of the custom made view-cell (50 mL) used for the syntheses are shown in Figure
2-3.
Figure 2-2: Picture of the high-pressure injection system used for the syntheses in supercritical carbon dioxide.
Figure 2-3: Schematic of cell and high-pressure view-cell with sapphire windows.

21
Figure 2-4: Schematic of the high-pressure injection system and oven used for the synthesis in supercritical carbon dioxide.
Pressure and Temperature Sensors Calibration
The thermocouple and the Pt-RTD 100 sensors used to control and measure the
temperature of the cell were calibrated using the normal freezing and boiling points of water,
0 oC and 100 oC, respectively.
The pressure transducer was calibrated using the vapour pressure of liquid CO2 at five
different temperatures in the range 13.3 to 28.9 oC. The recommended vapour pressures values
for liquid CO2 were taken from REFPROP (REFerence fluid PROPerties), a database developed
by the National Institute of Standards and Technology (NIST). For the pressure transducer
calibration, the cell was filled with liquid CO2, and after equilibration the change in pressure at
constant temperature was recorded as the fluid was allowed to leave the cell. A typical pressure
22
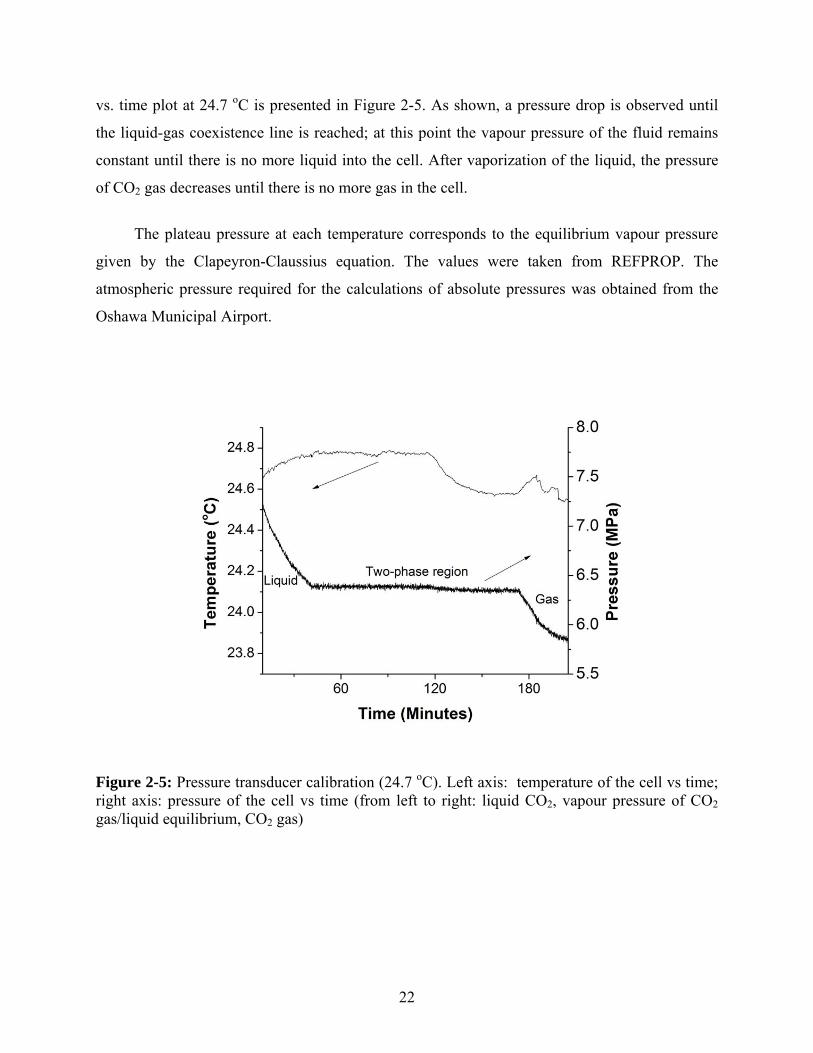
vs. time plot at 24.7 oC is presented in Figure 2-5. As shown, a pressure drop is observed until
the liquid-gas coexistence line is reached; at this point the vapour pressure of the fluid remains
constant until there is no more liquid into the cell. After vaporization of the liquid, the pressure
of CO2 gas decreases until there is no more gas in the cell.
The plateau pressure at each temperature corresponds to the equilibrium vapour pressure
given by the Clapeyron-Claussius equation. The values were taken from REFPROP. The
atmospheric pressure required for the calculations of absolute pressures was obtained from the
Oshawa Municipal Airport.
Figure 2-5: Pressure transducer calibration (24.7 oC). Left axis: temperature of the cell vs time; right axis: pressure of the cell vs time (from left to right: liquid CO2, vapour pressure of CO2 gas/liquid equilibrium, CO2 gas)
23
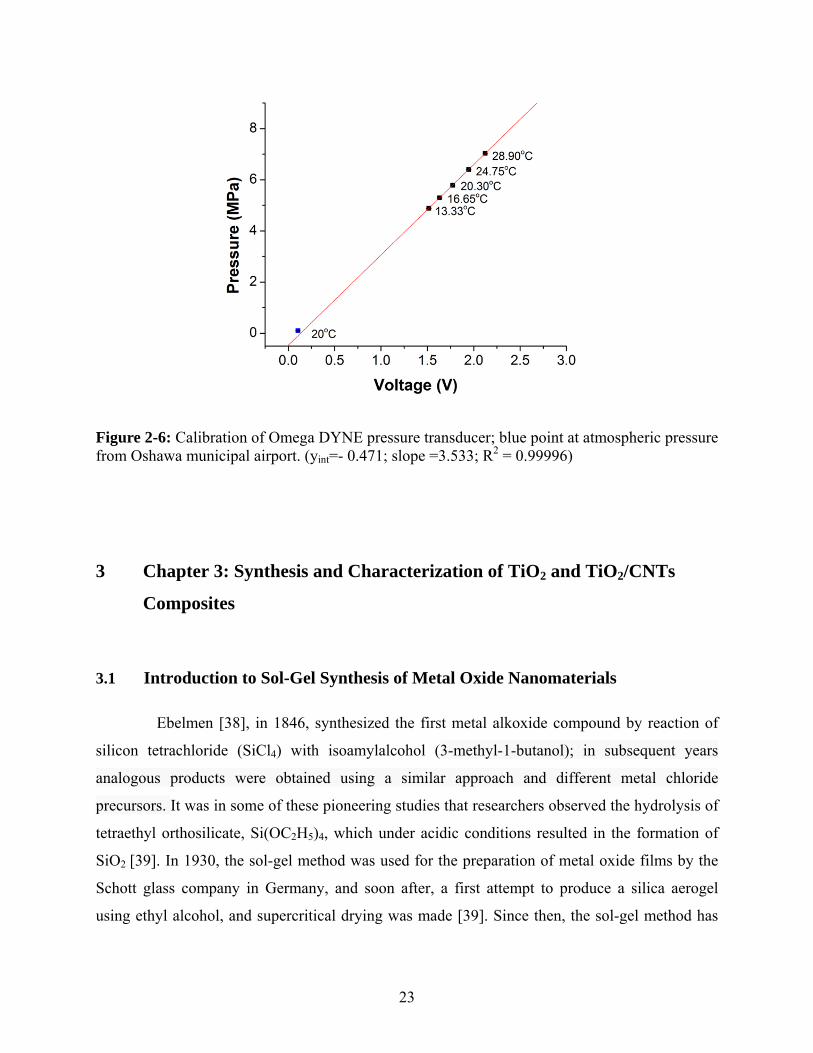
Figure 2-6: Calibration of Omega DYNE pressure transducer; blue point at atmospheric pressure from Oshawa municipal airport. (yint=- 0.471; slope =3.533; R2 = 0.99996)
3 Chapter 3: Synthesis and Characterization of TiO2 and TiO2/CNTs
Composites
3.1 Introduction to Sol-Gel Synthesis of Metal Oxide Nanomaterials
Ebelmen [38], in 1846, synthesized the first metal alkoxide compound by reaction of
silicon tetrachloride (SiCl4) with isoamylalcohol (3-methyl-1-butanol); in subsequent years
analogous products were obtained using a similar approach and different metal chloride
precursors. It was in some of these pioneering studies that researchers observed the hydrolysis of
tetraethyl orthosilicate, Si(OC2H5)4, which under acidic conditions resulted in the formation of
SiO2 [39]. In 1930, the sol-gel method was used for the preparation of metal oxide films by the
Schott glass company in Germany, and soon after, a first attempt to produce a silica aerogel
using ethyl alcohol, and supercritical drying was made [39]. Since then, the sol-gel method has

24
been used to produce radioactive oxide ceramics for use in fuel rods in an effort to avoid harmful
dust, multicomponent glasses, aerogel and dense ceramic materials, and coatings [40].
The Sol-Gel Process
The sol-gel reaction is a solution based synthesis method, which is an easy and
versatile way to make a metal oxide ceramic. It allows for control over stoichiometry, and
morphology, and offers the capability of producing composite materials. The main steps are:
hydrolysis and polycondensation of an alkoxide precursor followed by aging and drying. In
general, a metal precursor reacts with a catalyst to form a colloidal solution termed the sol, which
polymerizes with time forming a gel that matures and hardens upon aging and drying. Metal-
alkoxides are commonly used for these reactions; they belong to the family of metal-organics
and are defined as a metal atom attached to organic ligands through metal-oxygen-carbon
linkages [40]. In the hydrolysis reaction the metal-alkoxide reacts with water to produce a sol:
M OR n+H2O→HO-M OR n-1+ROH (3‐1)
where M represents the metal atom and OR the ligand. The extent of the hydrolysis reaction
depends on the amount of water present in the reaction media. Condensation reactions between
two hydrolysed or partially hydrolysed molecules:
OR nM-OH + HO-M OR n → OR nM-O-M OR n + H2O (3‐2)
or
OR nM-OR + OH-M OR n → OR nM-O-M OR n + ROH (3-3)
can also result in the formation of water (3-2).
The extent of the hydrolysis reaction will depend on the amount of water and it will
determine the gelation time, structure and crystallization temperature. Hydrolysis and
condensation reactions will result in the formation of a gel, a continuous interconnected network
of a porous solid phase, and a liquid dispersed phase. Depending on the method used for

25
removing the liquid from the gel, supercritical drying or drying in ambient conditions, an aerogel
or a xerogel can be obtained, respectively. A schematic of the overall process is shown in Figure
3-1.
Figure 3-1: Schematic of the sol-gel process for the synthesis of aerogels, xerogels and dense ceramic materials.
The sol-gel method offers good control over the chemical and physical properties of a
material and it is an ideal approach for synthesizing nanomaterials tailored towards specific
applications like DSSCs.
3.1.1 Synthesis of TiO2 Nanomaterials using the Sol-Gel Reactions
Titanium tetraisopropoxide, TiOCH(CH3)24 titanium butoxide, TiOC4H94, and
titanium tetrachloride, TiCl4, are the most popular precursors for the synthesis of TiO2
nanoparticles. Compared to silicon alkoxide, titanium alkoxides are orders of magnitude more
reactive [40], and chemical additives need to be incorporated to the reaction media to control
their reactivity. The reaction of Ti(OiPr)4 or Ti(OnBu)4 with water is also very fast and results in
the formation of ill-defined metal oxide products. Acetic acid is commonly used to moderate the
reactivity of titanium alkoxides through a ligand substitution reaction:
26
Ti OR 4 + 2CH COOH → Ti OR 2 CH COO + 2 ROH (3-4)
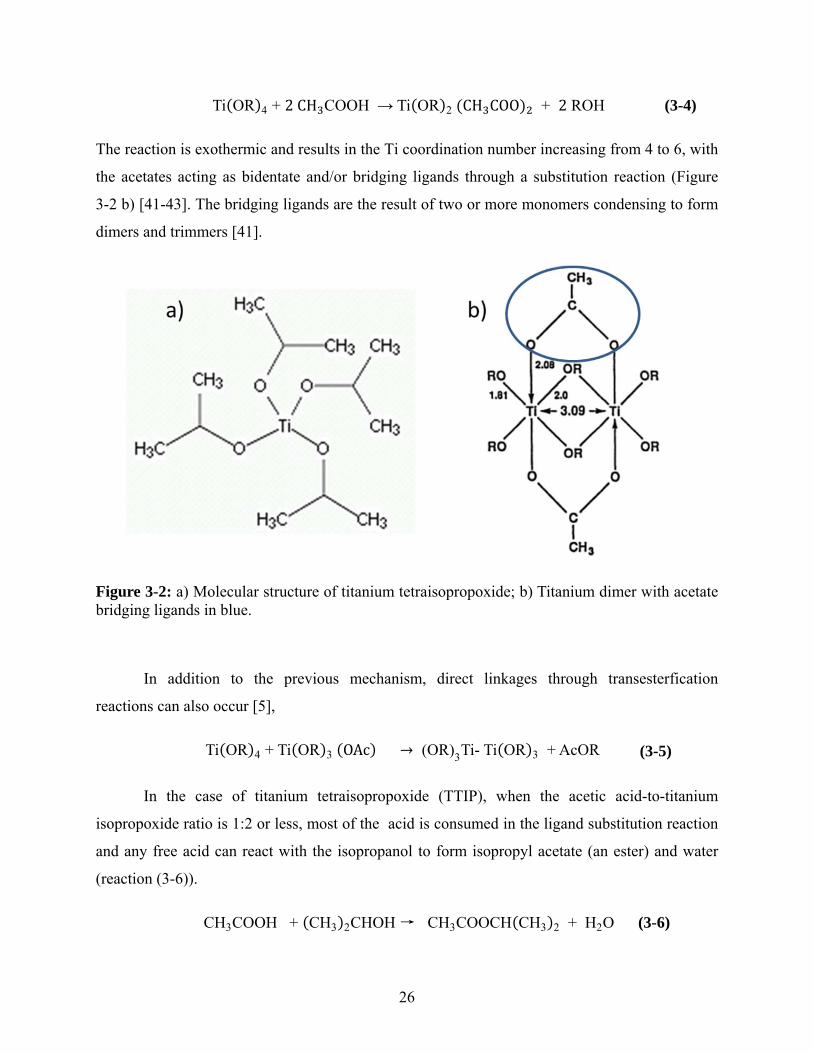
The reaction is exothermic and results in the Ti coordination number increasing from 4 to 6, with
the acetates acting as bidentate and/or bridging ligands through a substitution reaction (Figure
3-2 b) [41-43]. The bridging ligands are the result of two or more monomers condensing to form
dimers and trimmers [41].
Figure 3-2: a) Molecular structure of titanium tetraisopropoxide; b) Titanium dimer with acetate bridging ligands in blue.
In addition to the previous mechanism, direct linkages through transesterfication
reactions can also occur [5],
Ti OR 4 + Ti OR 3 OAc → (OR)3Ti- Ti OR 3 + AcOR (3-5)
In the case of titanium tetraisopropoxide (TTIP), when the acetic acid-to-titanium
isopropoxide ratio is 1:2 or less, most of the acid is consumed in the ligand substitution reaction
and any free acid can react with the isopropanol to form isopropyl acetate (an ester) and water
(reaction (3-6)).
CH3COOH + CH3 2CHOH → CH3COOCH CH3 2 + H2O (3-6)
27
This reaction is inherently slow, but the titanium species formed in the first stages of the
sol-gel reaction act as a Lewis acid catalyst, increasing the rate of the reaction [29,41]. Through
this reaction water is gradually released and allows better control of the reaction rate. Previous
studies have also shown that water reacts more rapidly with the less electronegative isopropyl
groups than the acetate ligands and it is one of the reasons for the different TiO2 morphologies
observed when changing the acetate-to-titanium precursor ratio [42]. These studies have shown
that in the initial stages of the sol-gel process dimers and trimmers form and arrange into the
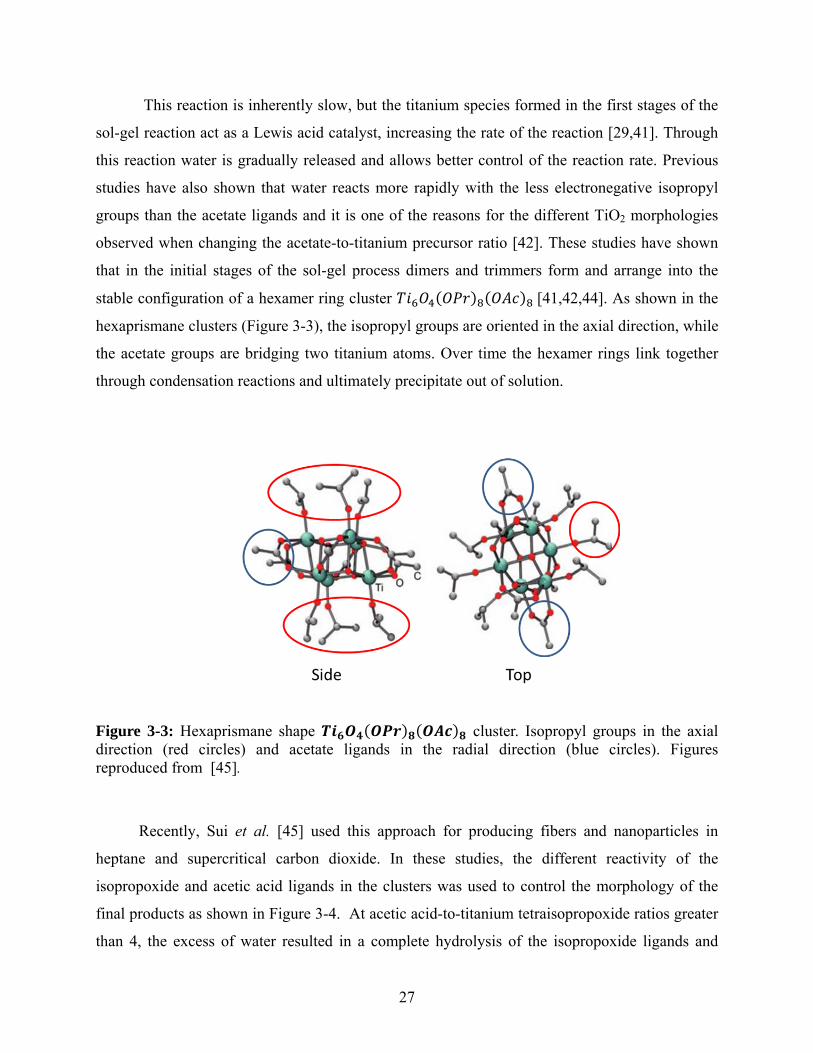
stable configuration of a hexamer ring cluster [41,42,44]. As shown in the
hexaprismane clusters (Figure 3-3), the isopropyl groups are oriented in the axial direction, while
the acetate groups are bridging two titanium atoms. Over time the hexamer rings link together
through condensation reactions and ultimately precipitate out of solution.
Figure 3-3: Hexaprismane shape cluster. Isopropyl groups in the axial direction (red circles) and acetate ligands in the radial direction (blue circles). Figures reproduced from [45].
Recently, Sui et al. [45] used this approach for producing fibers and nanoparticles in
heptane and supercritical carbon dioxide. In these studies, the different reactivity of the
isopropoxide and acetic acid ligands in the clusters was used to control the morphology of the
final products as shown in Figure 3-4. At acetic acid-to-titanium tetraisopropoxide ratios greater
than 4, the excess of water resulted in a complete hydrolysis of the isopropoxide ligands and

28
condensation reactions in a preferred linear orientation takes place and a 1-D and 2-D structures
were obtained. At lower ratios, incomplete hydrolysis of the isopropyl groups will interfere with
how the hexamer rings come together, resulting in condensation reactions in random orientations
depending on the ratio, nanoparticles (3-D) or nanosheets (2-D) were synthesized.
Figure 3-4: Reaction condensation pathways depending on amount of acetic acid added (from ref [45]).
The approach of Sui et al. [45] is particularly attractive for the synthesis of TiO2
nanomaterials for dye sensitized solar cell applications since a change in the morphology of the
TiO2 solid used to prepare the films could improve the electron percolation toward the electrode
and reduce the probability of recombination either with the oxidized dye or with the tri-iodide
(I3-) as it was discussed in section 1.2.
Summarizing, the replacement of a metal alcoxide by a mono- or bidentate ligand such as
acetic acid has several consequences: (i) the degree of crosslinking is reduced because of the

29
reduction in the number of hydrolysable groups per titanium, (ii) the connectivity between
titanium building blocks is lowered and avoids the formation of crystalline materials, (iii) the
complexing ligands can make the hydrolysis and condensation reactions more favourable in one
particular position resulting in the formation of materials with very distinct morphology (fibers
or particles).
Synthesis of TiO2 –MWCNTs Composites
The chemical inertness of CNTs provides a challenge in processing them; they have a
tendency to agglomerate due to van der Waal forces between them and are difficult to keep in
solution. Oxidation, also known as functionalization, is commonly used to increase the reactivity
of the CNTs by adding –COOH and –OH groups at the ends and the outer walls of the tubes. The
process can dramatically change the properties of the material and it should be carefully
monitored [46]. Sinterization of TiO2/CNT composites can strengthen the chemical linkage
between TiO2 and CNTs if functional groups are present [22].
3.2 Experimental
3.2.1 Chemicals and Materials
All starting materials were of analytical reagent grade and used without further
purification. TiO2 and TiO2-MWCNTs composites were synthesized from titanium(IV)
tetraisopropoxide (97%, Sigma-Aldrich) using glacial acetic acid (>99.5%, Sigma-Aldrich) as
chemical additive with/without carbon nanotubes in two alternative reaction media, heptane
(HPLC grade, Fisher Chemical) and supercritical carbon dioxide (CO2, 99.99%, PRAXAIR).
Multiwalled carbon nanotubes were purchased from Bucky USA (BU-200, 95 wt%, 5-15 nm
diameter, 1-10 μm length). The as-purchased carbon nanotubes were purified with a nitric
acid/sulfuric acid mixture (1:3 vol/vol ratio) mixture. Approximately 8 ml of the nitric /sulfuric
acid solution was used to purify 200 mg CNTs. The mixture was sonicated for 30 min and then
refluxed for another 30 min at 120 oC with stirring as described by Fogden et al. [47]. The
30
nitric/sulfuric acid mixture is stronger than its component parts because of the formation of the
strongly oxidizing nitronium ion (NO2+).
H2SO4 + HNO3 HSO4 - + NO2
+ + H2O (3-7)
After that, the mixture is dispersed in 500 ml water and vacuum filtered using a 0.2 μm Teflon
membrane (Millipore) until neutral pH. The CNTs were then re-suspended in 500 ml 0.01 M
sodium hydroxide aqueous solution (50%, Sigma Aldrich), filtered, and then washed with
deionized water (16 M·cm) until neutral pH was achieved. They were collected and dried in a
vacuum oven at 120 oC for 12 hours. Raman and FTIR spectroscopy, along with thermal
gravimetric analysis were used to evaluate the success of the purification procedure.
3.2.2 Synthesis of TiO2 Nanomaterials in Heptane and SC-CO2
Two different synthetic methods were used to produce TiO2 nanomaterials with well-
defined morphology, particle size, and surface area: a sol-gel method in supercritical CO2 to
produce TiO2 aerogels; and a sol-gel method in heptane, also a non-polar solvent, to produce
xerogels. The properties of both solvents are summarized in Table 3-1.
In both cases, the experimental conditions were taken from previous studies. The
synthesis in SC-CO2 was proposed by Charpentier's group at Western University [48], while the
synthesis in heptane was developed by Sui et al. [45] at the University of Calgary. To the best of
our knowledge, this is the first time that any of these materials, with or without CNTs, were used
for a DSSC application.
Table 3-1: Properties of heptane and carbon dioxide
Heptane Carbon dioxide Molar Mass (g·mol-1) 100.21 44.01 Normal sublimation temperature (oC) N/A -78.4 Normal boiling point (oC) 98.4 ---- Critical temperature (oC) 266.98 30.98 Critical pressure (MPa) 2.73 7.37

31
Critical density (kg/m3) 232.0 467.6 Density (kg/m3 at 60oC) 649.41a 764.73b
Viscosity (μPa·s at 60oC) 272a 66.0b
Surface tension (mN/m at 20oC and 0.1 MPa) 20.14a ---- a values at 0.1 MPa (synthesis conditions in heptane) b values at 23 MPa (synthesis conditions in SC-CO2).
The syntheses in heptane were carried out at 60 oC under a nitrogen atmosphere using a
three-neck round-bottom flask, connected to a condenser, in an oil bath. The temperature of the
flask was controlled by a hot plate. The flask was purged with nitrogen for 10 min and then a
nitrogen filled balloon was attached to the condenser to prevent air/moisture to get in contact
with the titanium precursor. Acetic acid and titanium tetraisopropoxide were injected into the
flask through a silicon septum and the stirrer was turned on and kept running until gelation. A
summary of the synthesis conditions is given in Table 3-2.
Table 3-2: Synthesis conditions for different AcOH/TTIP ratios in heptane.
AcOH /TTIP: 3.5 AcOH /TTIP: 5.5 AcOH /TTIP: 7
Heptane 8 mL 8 mL 8 mL
Acetic acid (AcOH) 4.5 mL 7.2 mL 9 mL
Titanium tetraisopropoxide (TTIP) 6.7 mL 6.7 mL 6.7 mL
Temperature 60 oC 60 oC 60 oC
Time 5 d 5 d 5 d
Pressure (heptane) 0.1 MPa 0.1 MPa 0.1 MPa
In all cases, the initial amber colour solution became white and opaque after a few hours,
indicating the formation of colloids, with lower ratios taking much longer. The gelation time of
the reaction also depended upon the AcOH/TTIP mole ratio: 16 h, 1 d, and 2 d, for the 7, 5.5, and
3.5 molar ratios, respectively. In all cases, the gel was collected after a five day period to allow
for adequate aging time and comparison between runs. The solid samples were placed in a
vacuum oven at 80 oC for 12 h to remove heptane and other volatile reaction products.
Subsequently, the material was annealed at 500 oC for 90 min to remove acetate surface groups
32
and to undergo the desired phase transition from amorphous to anatase. XRD and Raman
spectroscopy were used to confirm that the transition was completed after 90 min.
The syntheses in SC-CO2 (Figure 3-3) were carried out under conditions similar to those
for heptane (60 oC for 5 days) except that they were done at high pressure, around 22.5 ±1.5 MPa
using the high pressure system described in Chapter 2.
Table 3-3: Synthesis condition for different AcOH/TTIP ratios in SC-CO2.
AcOH/TTIP 3.5
AcOH /TTIP 4.0
AcOH /TTIP 5.5
AcOH /TTIP 7.0
Acetic acid 7.5 mL 8.7 mL 11.8 mL 9.0 mL
Titanium tetraisopropoxide 11.1 mL 11.1 mL 11.1 mL 11.1 mL
Temperature 60 oC 60 oC 60 oC 60 oC
Pressure (SC-CO2) ~22.5 MPa ~21 MPa ~22 MPa ~23 MPa
Time 5 d 5 d 5 d 5 d
For the syntheses, the reactants were introduced into the stainless steel autoclave in a
glove bag under a nitrogen atmosphere to minimize any possible contact with water. The high
pressure system was purged with CO2 at 3 ml/min for 5 min to remove any moisture, and then
brought to the final pressure at a temperature of 60 oC. As shown in Figure 3-5, the solution
started off the same amber colour as the one in heptane. With time, emulsions started to form and
become thicker until the windows became opaque, about 12 h for the 5.5 ratio, but longer for
lower AcOH/TTIP ratios. In all cases, the reaction mixture was stirred for a day and a half and
left to age for three and a half more days. The system was purged with 500 mL of CO2 at around
5 ml/min at 60 oC and 20 MPa to remove reaction by-products and unreacted acetic acid. When
the autoclave was opened the TiO2 material was a light, airy, white powder encompassing the
entire volume of the cell; very different in texture from the thick gel obtained in heptane. The
TiO2 solid products were collected and annealed at 500 oC in air for 90 min. The syntheses were
repeated several time and the results were reproducible.
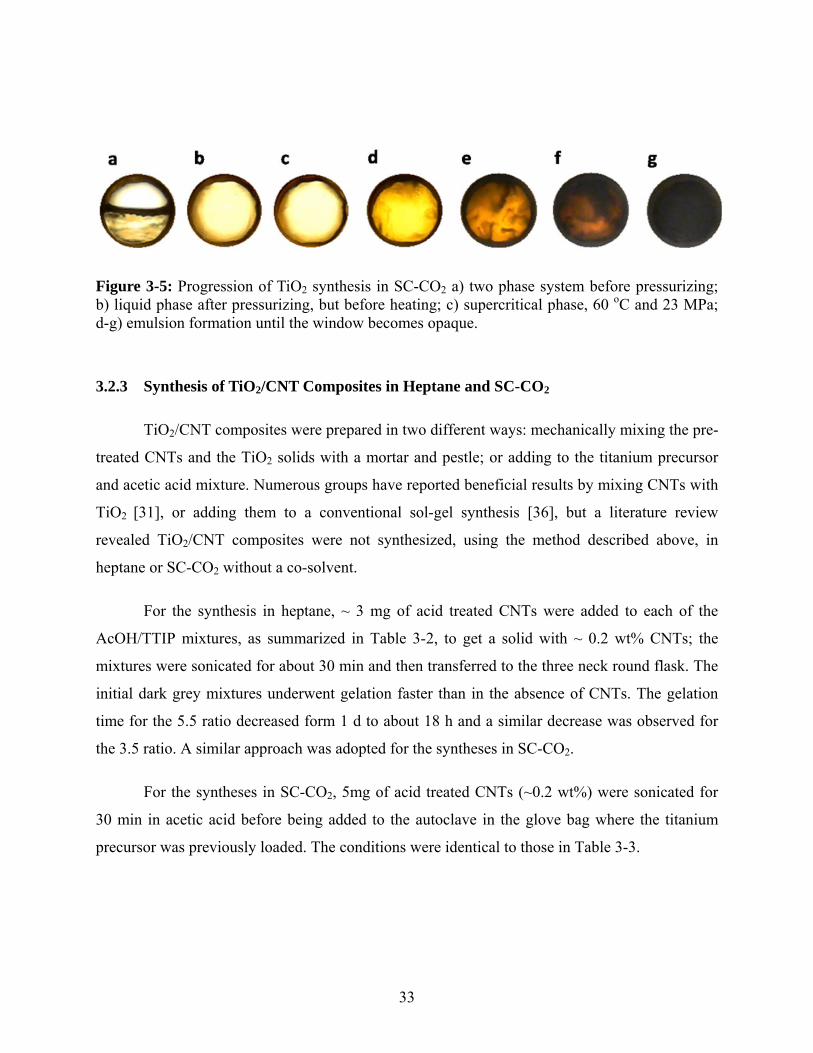
33
Figure 3-5: Progression of TiO2 synthesis in SC-CO2 a) two phase system before pressurizing; b) liquid phase after pressurizing, but before heating; c) supercritical phase, 60 oC and 23 MPa; d-g) emulsion formation until the window becomes opaque.
3.2.3 Synthesis of TiO2/CNT Composites in Heptane and SC-CO2
TiO2/CNT composites were prepared in two different ways: mechanically mixing the pre-
treated CNTs and the TiO2 solids with a mortar and pestle; or adding to the titanium precursor
and acetic acid mixture. Numerous groups have reported beneficial results by mixing CNTs with
TiO2 [31], or adding them to a conventional sol-gel synthesis [36], but a literature review
revealed TiO2/CNT composites were not synthesized, using the method described above, in
heptane or SC-CO2 without a co-solvent.
For the synthesis in heptane, ~ 3 mg of acid treated CNTs were added to each of the
AcOH/TTIP mixtures, as summarized in Table 3-2, to get a solid with ~ 0.2 wt% CNTs; the
mixtures were sonicated for about 30 min and then transferred to the three neck round flask. The
initial dark grey mixtures underwent gelation faster than in the absence of CNTs. The gelation
time for the 5.5 ratio decreased form 1 d to about 18 h and a similar decrease was observed for
the 3.5 ratio. A similar approach was adopted for the syntheses in SC-CO2.
For the syntheses in SC-CO2, 5mg of acid treated CNTs (~0.2 wt%) were sonicated for
30 min in acetic acid before being added to the autoclave in the glove bag where the titanium
precursor was previously loaded. The conditions were identical to those in Table 3-3.

34
3.2.4 Materials Characterization
Powder X-ray diffraction (XRD) analysis was used to characterize the crystal phase and
crystallite size. The experiments were performed with a Philips XRD system with PW 1830 HT
generator, a PW 1050 goniometer, PW3710 control electronics and X-Pert system software. A
Cu K-Alpha 0.154 nm X-ray source was used, scanning from 20o to 60o 2θ with a step size of
0.02o. The average crystallite size was estimated using the Scherrer equation:
(3-8)
where λ is the wavelength of incident X-ray, B1/2 is the full width half maximum of the peak in
radians, θ is the diffraction angle in radians, and k is the Scherrer constant dependent on
instrumental broadening, for the 101 peak which was found to be k = 1.114 for the 101 peak
using 25 nm anatase from Sigma Aldrich. The crystallite size is inversely dependent on the full
width half maximum (FWHM).
Thermal gravimetric analysis (TGA) and differential scanning calorimetry (DSC) was
performed on the samples to identify the elemental mass composition, decomposition
temperatures and phase changes of the materials. Thermal decomposition studies were performed
with an SDT Q600 Thermal Gravimetric Analyzer from TA Instruments under argon (Praxair,
AR5DVH-T, Airgas AR UHP200) and under dry air (Praxair, A10.0 XD-T, Airgas AI UZ200).
Mass and temperature calibrations were conducted periodically, to ensure a reliable comparison
between runs.
Raman measurements were used as the primary characterization method; it provided a
quick and easy way of identifying impurities, crystallinity and particle size. A confocal
Renishaw Raman Imaging Microscope System 2000 was used in this study. Stokes scattering
was collected in the range 4000-100 cm-1 with an argon ion laser at 514 nm at 25 mW output
power. Repeated acquisitions (20 scans) with an acquisition time of 10 s at the highest
magnification (50x), were accumulated to improve the signal-to-noise ratio. The spectrum was
collected for no less than 3 sample locations to ensure uniformity. The Raman peaks become

35
broader and a blue shift can be seen in the 141 cm-1- (Eg) peak when crystallite size becomes
smaller.
The samples were also analysed with a JOEL JSM6610-Lv Scanning Electron Microscope
(SEM); with an Oxford/SDD EDS detector, X-Ray Microanalysis; digital imaging via SE, BSE
and X-ray signals. The samples were mounted using carbon tape sputter coated with a gold film
and examined at 20 kV.
Fourier transform infrared spectroscopy (FTIR) was used to examine the effectiveness of
the purification method used. A Perkin Elmer spectrum 100 attenuated total reflectance (ATR)
was used with powder samples, covering a spectrum from 600 – 4000 cm-1.
The surface area of the TiO2 samples was determined by nitrogen sorption measurements.
The determination of the specific area of the sample using the Brunauer, Emmett and Teller
(BET) theory is based on the phenomenon of the physical adsorption of nitrogen. Even though
several assumptions involved in this model do not necessarily apply for all materials, the BET
model constitutes the standard technique for surface area determinations. The gas adsorption
measurements were made using a Micromeritics 2390a with nitrogen as the adsorbent. The
typical sample mass used was 50 mg. The samples were degassed under nitrogen flow at 50 oC,
for a minimum of 2 h prior to gas adsorption measurements.
3.3 Results and Discussion
As described, the materials were synthesized over a wide range of different conditions:
synthesis medium (liquid vs supercritical fluid), temperature, AcOH/TTIP ratios; and with and
without the addition of carbon nanotubes. This section discusses the results of the different
syntheses and compares the findings with the work of others.
36
3.3.1 Effect of Temperature on Synthesis in SC-CO2
Most syntheses in SC-CO2 (60 oC, ~22.5 MPa) involved three different acetic acid (AcOH) to
titanium tetraisopropoxide (TTIP) molar ratios (Table 3-3). An additional run at a 4.0 ratio was
also carried out in the initial stages of this thesis for BET studies, but it was not used to prepare
any DSSC film.
We have used the view-cell described in Chapter 2 to approximately determine the time
required for the colloidal suspension to become thick enough to block the light coming through
the windows (Figure 3-5). As expected, as the AcOH/TTIP ratio increased, more water was
released by the condensation and esterification reactions and the overall sol-gel process became
faster. For the 3.5 AcOH/TTIP ratio the windows became opaque after about 18 h, 16 h for the
4.0 ratio, while it took only 12 h for the 5.5 ratio to become opaque, in good agreement with
previous studies [41,42].
The effect of temperature on the kinetic of reaction was also investigated with the aim of
speeding up the synthesis time and reducing the particle size. Figure 3-6 shows the reaction
products obtained in three different runs at 60, 100, and 150 oC at 23 MPa and an AcOH/TTIP
ratio equal to 4. In the case of the synthesis at 100 oC, it took only 60 min to completely block
the window; 15 hours less than at 60 oC. The products formed at different temperatures are
shown in Figure 3-6.

37
Figure 3-6: SEM images of TiO2 samples synthesized in supercritical CO2: a,b) 60 oC, c) 100 oC, d,e) 150 oC at 22 MPa. All syntheses involved a AcOH/TTIP ratio of 4:1 and an aging time of five days. The images indicate increased nucleation and the formation of smaller particles with increasing temperature.

38
The SC-CO2 synthesis at a AcOH/TTIP ratio of 4, resulted in the formation of spheres a
few micrometers in diameter (<4 μm) coated with small fibers that gradually decreased in length
and eventually disappear at 150 oC. We attribute these changes in morphology to an increasing
number of nucleation sites due to the pronounced decrease in the density of SC-CO2 as the
temperature is increased from 60 to 150 oC at constant pressure, as illustrated in Figure 3-7. The
greater number of nucleation sites formed at high temperatures is the result of the increase in the
supersaturation degree and precipitation of the product [49]. It can be seen that the large micro-
particles (Figure 3-6e) are made up of many smaller particles; this is not as evident in the other
samples.
Figure 3-7: Dielectric constant and density of CO2 as a function of temperature at 23 MPa (data obtained from REFPROP).
The crystallinity of TiO2 was analysed as the synthesis temperature increased. Figure 3-8
shows the normalized Raman spectrum of TiO2 solid products obtained at three different
temperatures (60, 100, and 150 oC); the spectrum of a commercial anatase (25 nm) sample was
included for comparison. As the temperature increased, there is a significant decrease in the
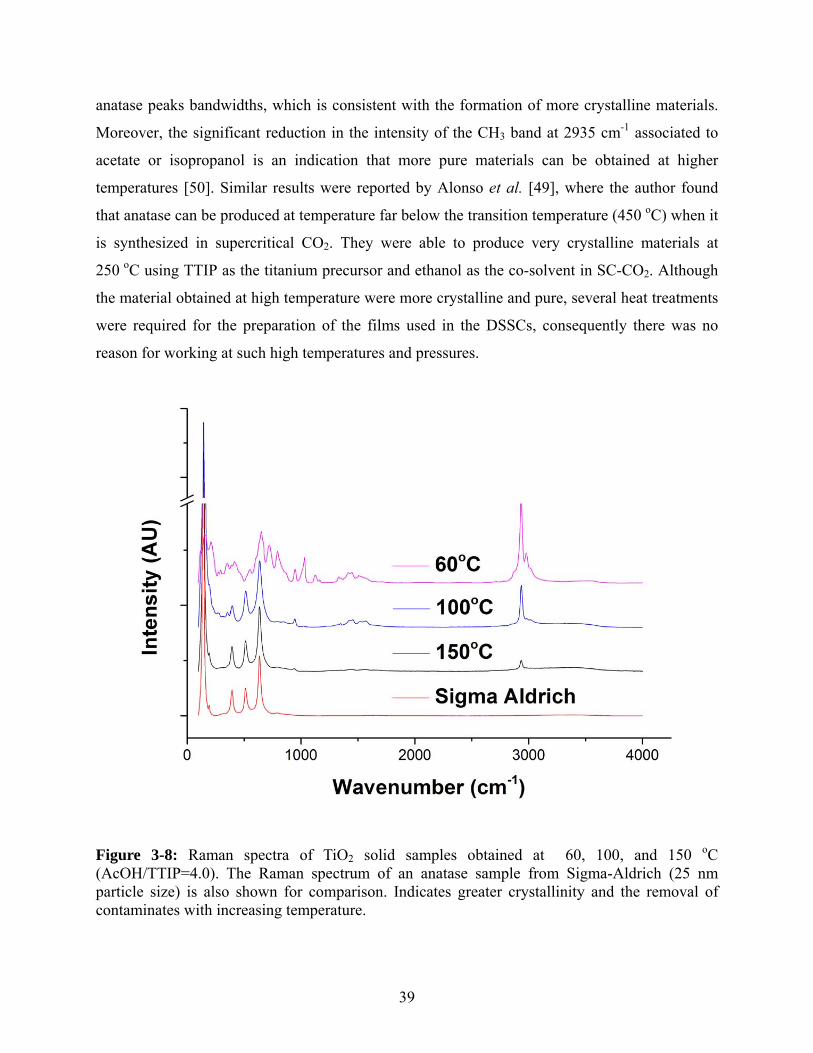
39
anatase peaks bandwidths, which is consistent with the formation of more crystalline materials.
Moreover, the significant reduction in the intensity of the CH3 band at 2935 cm-1 associated to
acetate or isopropanol is an indication that more pure materials can be obtained at higher
temperatures [50]. Similar results were reported by Alonso et al. [49], where the author found
that anatase can be produced at temperature far below the transition temperature (450 oC) when it
is synthesized in supercritical CO2. They were able to produce very crystalline materials at
250 oC using TTIP as the titanium precursor and ethanol as the co-solvent in SC-CO2. Although
the material obtained at high temperature were more crystalline and pure, several heat treatments
were required for the preparation of the films used in the DSSCs, consequently there was no
reason for working at such high temperatures and pressures.
Figure 3-8: Raman spectra of TiO2 solid samples obtained at 60, 100, and 150 oC (AcOH/TTIP=4.0). The Raman spectrum of an anatase sample from Sigma-Aldrich (25 nm particle size) is also shown for comparison. Indicates greater crystallinity and the removal of contaminates with increasing temperature.

40
The effects of pressure on the reaction rate are not as pronounced as that of temperature.
An increase in pressure at constant temperature will result in an increase in density and it will
affect the solubility of the reactants and products (Figure 3-9) [49]. However, this outcome was
not observed. Charpentier et al. did observe that when the pressure surpassed 41.4 MPa the TiO2
particle size distribution became more uniform around 20 nm, but they did not notice any other
change in morphology [48,51]. Because of this and safety reasons, we have not explored the
effect of pressure in this thesis. The pressure was kept in the range between 21 MPa and 24 MPa.
Figure 3-9: Pressure vs density plot for carbon dioxide. Vapour-liquid saturation line (red) and CO2 pressure at 60 oC. The highlighted region represents the pressure range covered in this study.

41
3.3.2 Characterization of TiO2 Materials Obtained in SC-CO2 and Heptane at 60oC
The morphology of the TiO2 nanoparticles is strongly determined by the initial
AcOH/TTIP ratio as indicated in the Introduction.. In heptane, an AcOH/TTIP ratio, lower than
4 resulted in non-uniform spherical nanoparticles, along with platelets, while a ratio greater than
4 resulted in the formation of long nanofibers with average diameters between 10 and 20 nm.
Materials obtained at a 3.5 and 5.5 ratio are shown in Figure 3-10. As shown, the higher ratio
resulted in the formation of “birds nest” like structures, along with a small amount of (< 300 nm)
non-uniform particles.
Figure 3-10: SEM images of TiO2: a,b) 3.5 AcOH/TTIP and c,d) 5.5 AcOH/TTIP, both synthesized in heptane at 60 oC for 5 days.

42
Figure 3-11: TiO2 samples synthesized in SC-CO2 under different AcOH/TTIP ratios: a,b) 3.5, hierarchical spheres; c,d) 5.5, hierarchical spheres and fibers; and c, d) 7.0, fibers.
In SC-CO2 with a 3.5 ratio, the solid products resembled a collection of sea urchins or
round “spiky balls” with diameters from ~ 1 to 5 µm, from here on referred to as hierarchical

43
spheres. As the ratio increased, fibers started to grow out of the hierarchical spheres, and at a
ratio of 7.0 there was no evidence of hierarchical spheres and only fibers were observed.
Scanning electron micrographs of the reaction products are shown in Figure 3-11. Different
magnifications were used to better illustrate the differences between materials.
The morphology of the material synthesised in heptane was significantly different than
those obtained in SC-CO2. Despite this, it is assumed that the same hexamer ring works as the
basic building block in both media. These differences in morphology can be attributed to the
physical properties of the two solvents that introduce differences in solubility, preferred reaction
pathway, rate of esterification, surface tension, and diffusivity. Representative FTIR spectra of
solid materials obtained in both media are shown in Figure 3-12, confirming that the basic
hexamer building block is present in all samples [45]. The material collected from the SC-CO2
synthesis was analysed as is, whereas the material from the heptane synthesis was heated at
80 oC for 12 h to eliminate the solvent.
The small bands around 2975 cm-1 correspond to the C-H stretching mode of bridging
acetates and residual isopropoxide [45]. The band around 1750 cm-1 corresponds to C=O of
carboxylic acid; the 1715 cm-1 band is indicative of H-bonded acid, while the bands at 1028 cm-1
and 1348 cm-1 are associated with Ti-O-C of acetate bonded to Ti [42,45]. Even though these
bands overlap with the isopropyl ligand, there are additional bands around 1120 cm-1 that
confirm the presence of isopropyl groups [42,52]. The intensity of this band for the fibers is
extremely small indicating complete hydrolysis of the hexamer structures and removal of
isopropyl groups. An indication of condensation is given by the ~750 and 650 cm-1 bands
corresponding to Ti-O and Ti-O-Ti vibration respectively [43]. In the case of fibers, a shift in the
Ti-O band from 716 to 755 cm-1 is observed when the acetic acid concentration is increased,
which was attributed to a higher concentration of adjacent isopropyl groups [52] . The strong
bands at 1454 cm-1 (doublet) and 1530 cm-1 belong to the symmetric and asymmetric stretching
modes respectively of carboxylic group coordinated to Ti. For all the materials, the difference
between these two bands is less than 100 cm-1 which is indicative of bidentate bridging acetate
ligands, which are expected in the case of hexamer rings formation, since for monodentate
acetate ligands the difference should be around 150 cm-1. The lack of signals around 1230 cm-1
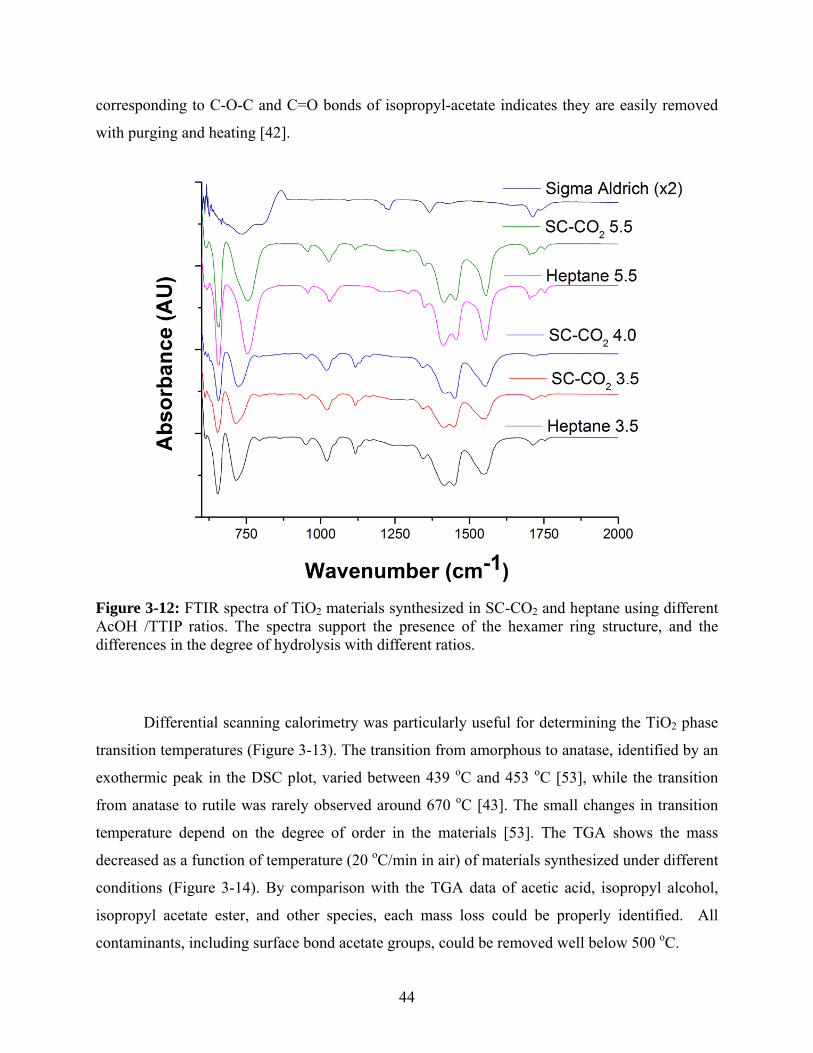
44
corresponding to C-O-C and C=O bonds of isopropyl-acetate indicates they are easily removed
with purging and heating [42].
Figure 3-12: FTIR spectra of TiO2 materials synthesized in SC-CO2 and heptane using different AcOH /TTIP ratios. The spectra support the presence of the hexamer ring structure, and the differences in the degree of hydrolysis with different ratios.
Differential scanning calorimetry was particularly useful for determining the TiO2 phase
transition temperatures (Figure 3-13). The transition from amorphous to anatase, identified by an
exothermic peak in the DSC plot, varied between 439 oC and 453 oC [53], while the transition
from anatase to rutile was rarely observed around 670 oC [43]. The small changes in transition
temperature depend on the degree of order in the materials [53]. The TGA shows the mass
decreased as a function of temperature (20 oC/min in air) of materials synthesized under different
conditions (Figure 3-14). By comparison with the TGA data of acetic acid, isopropyl alcohol,
isopropyl acetate ester, and other species, each mass loss could be properly identified. All
contaminants, including surface bond acetate groups, could be removed well below 500 oC.

45
Figure 3-13: DSC curves of TiO2 materials synthesized in SC-CO2 and heptane using different AcOH /TTIP ratios, offset from each other. The transition from amorphous to anatase is around 450 oC and from anatase to rutile is around 670 oC.
Figure 3-14: TGA curves of solid products obtained under different conditions and temperatures. The materials synthesized at higher temperature have fewer impurities, and purging the SC-CO2 system removes some impurities.
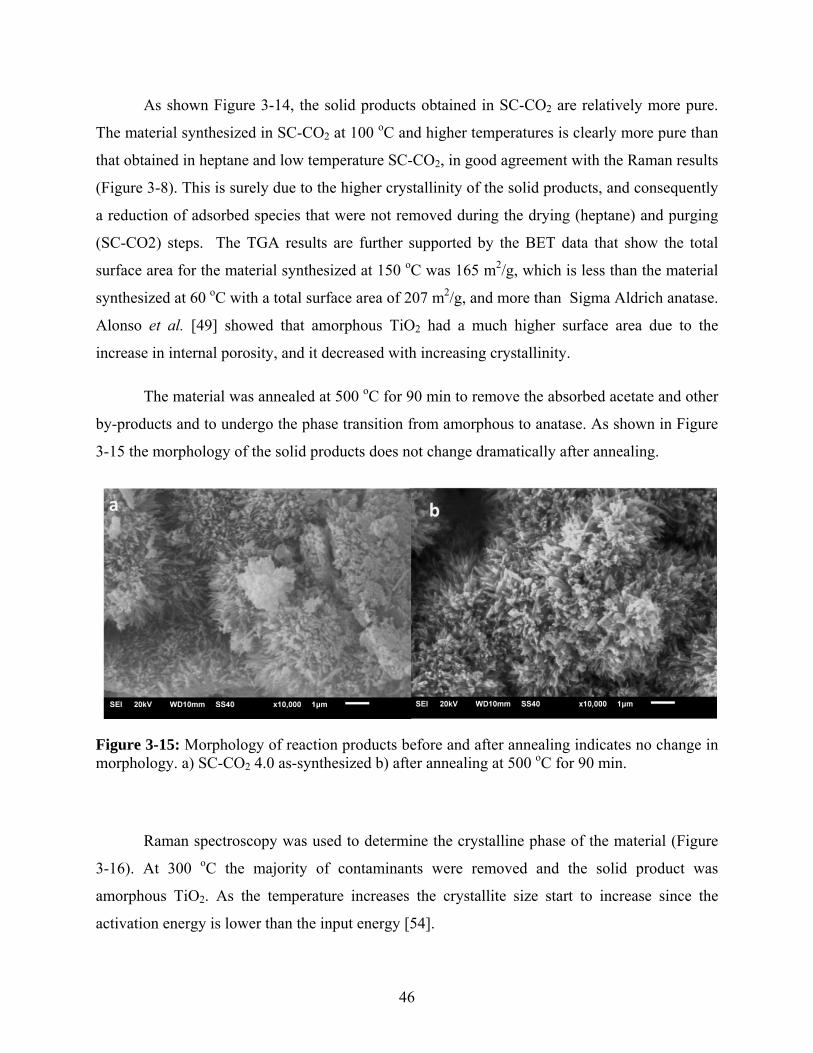
46
As shown Figure 3-14, the solid products obtained in SC-CO2 are relatively more pure.
The material synthesized in SC-CO2 at 100 oC and higher temperatures is clearly more pure than
that obtained in heptane and low temperature SC-CO2, in good agreement with the Raman results
(Figure 3-8). This is surely due to the higher crystallinity of the solid products, and consequently
a reduction of adsorbed species that were not removed during the drying (heptane) and purging
(SC-CO2) steps. The TGA results are further supported by the BET data that show the total
surface area for the material synthesized at 150 oC was 165 m2/g, which is less than the material
synthesized at 60 oC with a total surface area of 207 m2/g, and more than Sigma Aldrich anatase.
Alonso et al. [49] showed that amorphous TiO2 had a much higher surface area due to the
increase in internal porosity, and it decreased with increasing crystallinity.
The material was annealed at 500 oC for 90 min to remove the absorbed acetate and other
by-products and to undergo the phase transition from amorphous to anatase. As shown in Figure
3-15 the morphology of the solid products does not change dramatically after annealing.
Figure 3-15: Morphology of reaction products before and after annealing indicates no change in morphology. a) SC-CO2 4.0 as-synthesized b) after annealing at 500 oC for 90 min.
Raman spectroscopy was used to determine the crystalline phase of the material (Figure
3-16). At 300 oC the majority of contaminants were removed and the solid product was
amorphous TiO2. As the temperature increases the crystallite size start to increase since the
activation energy is lower than the input energy [54].

47
Figure 3-16: Raman spectra at different annealing temperatures showing the change from amorphous (bottom) to anatase (top) phase for a sample synthesized in SC-CO2 (AcOH:TTIP = 3.5).
After annealing at 500 oC, the main crystal phase was anatase as shown in Figure 3-17
although weak peaks corresponding to brookite are also present in all these samples at 245, 322,
and 366 cm-1 [21]. XRD confirmed the formation of anatase and minor amounts of brookite, in
good agreement with the Raman spectrum. An attempt was made to quantify the amount of
brookite in these samples using XRD. The weight fraction of each phase can be determined using
the integrated intensities of the anatase and brookite peaks using the following equation for
brookite [17]:
(3‐9)
where kA=0.886, kB=2.721, and AA, AR, AB are the integrated intensity of the 101, 110, 121 peak
of anatase, rutile, and brookite, respectively. Because of the unfavourable peak signal-to-noise
ratio for brookite (inset in Figure 3-18), that made the fittings difficult, it was assumed that a
negligible amount of brookite was present in all these samples.
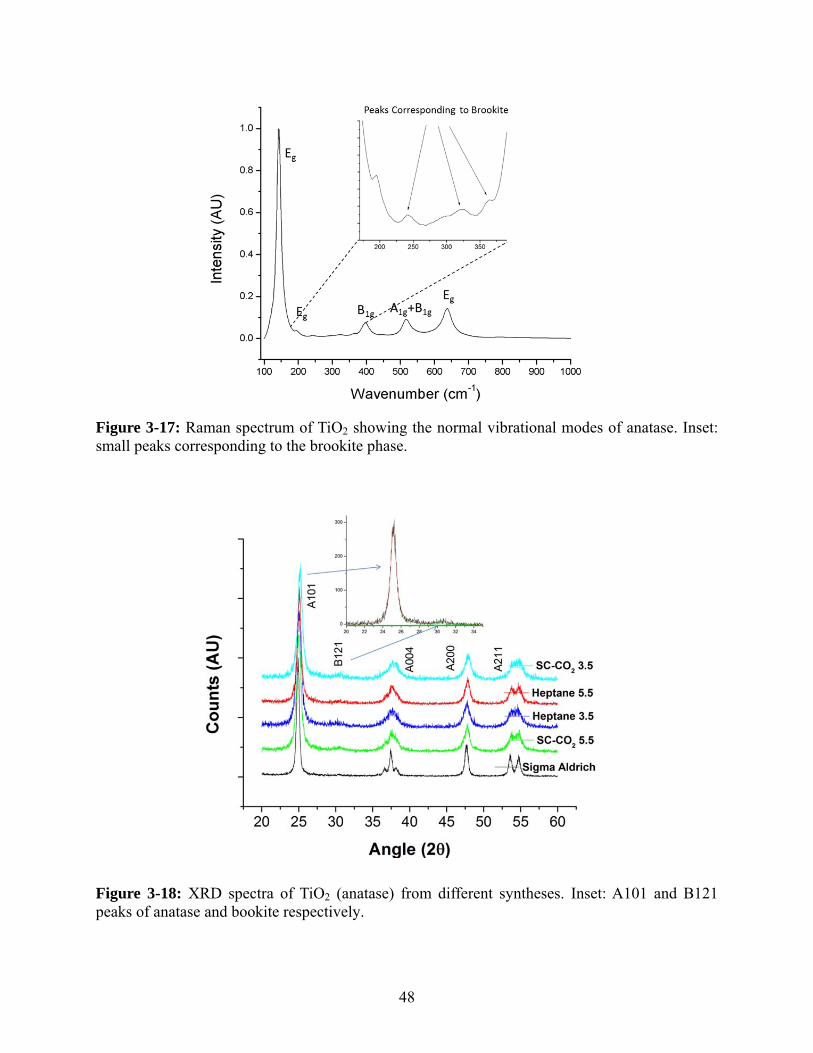
48
Figure 3-17: Raman spectrum of TiO2 showing the normal vibrational modes of anatase. Inset: small peaks corresponding to the brookite phase.
Figure 3-18: XRD spectra of TiO2 (anatase) from different syntheses. Inset: A101 and B121 peaks of anatase and bookite respectively.
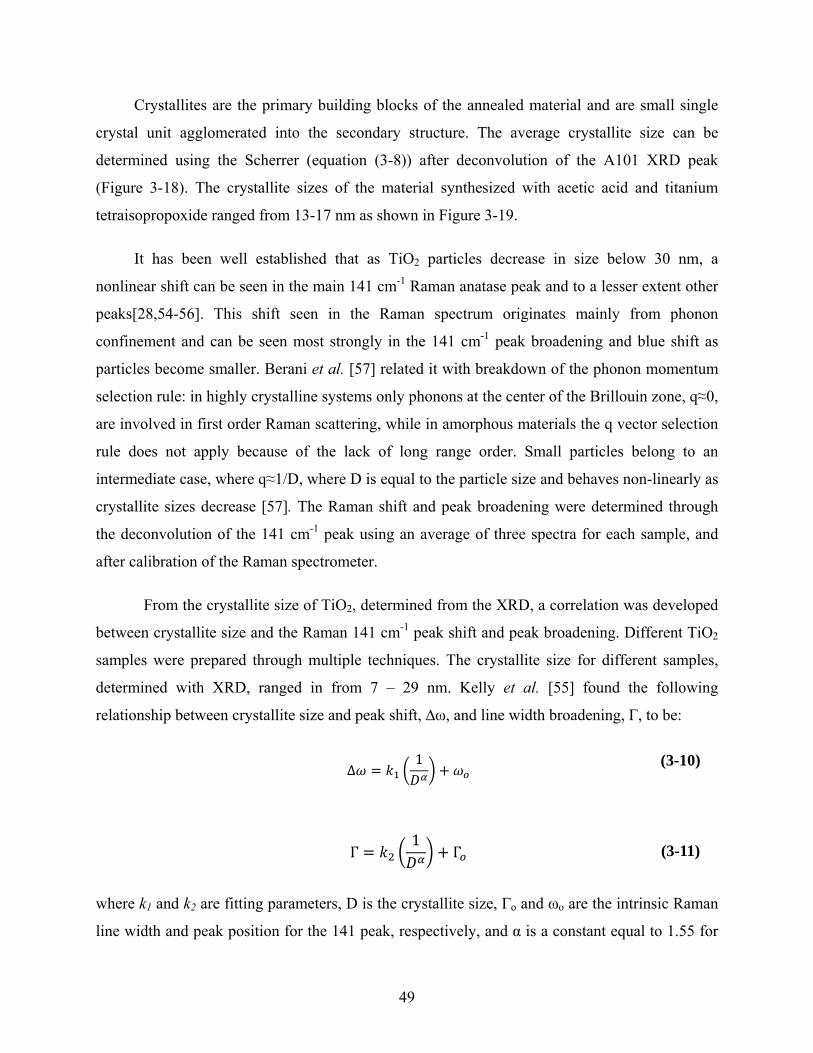
49
Crystallites are the primary building blocks of the annealed material and are small single
crystal unit agglomerated into the secondary structure. The average crystallite size can be
determined using the Scherrer (equation (3-8)) after deconvolution of the A101 XRD peak
(Figure 3-18). The crystallite sizes of the material synthesized with acetic acid and titanium
tetraisopropoxide ranged from 13-17 nm as shown in Figure 3-19.
It has been well established that as TiO2 particles decrease in size below 30 nm, a
nonlinear shift can be seen in the main 141 cm-1 Raman anatase peak and to a lesser extent other
peaks[28,54-56]. This shift seen in the Raman spectrum originates mainly from phonon
confinement and can be seen most strongly in the 141 cm-1 peak broadening and blue shift as
particles become smaller. Berani et al. [57] related it with breakdown of the phonon momentum
selection rule: in highly crystalline systems only phonons at the center of the Brillouin zone, q≈0,
are involved in first order Raman scattering, while in amorphous materials the q vector selection
rule does not apply because of the lack of long range order. Small particles belong to an
intermediate case, where q≈1/D, where D is equal to the particle size and behaves non-linearly as
crystallite sizes decrease [57]. The Raman shift and peak broadening were determined through
the deconvolution of the 141 cm-1 peak using an average of three spectra for each sample, and
after calibration of the Raman spectrometer.
From the crystallite size of TiO2, determined from the XRD, a correlation was developed
between crystallite size and the Raman 141 cm-1 peak shift and peak broadening. Different TiO2
samples were prepared through multiple techniques. The crystallite size for different samples,
determined with XRD, ranged in from 7 – 29 nm. Kelly et al. [55] found the following
relationship between crystallite size and peak shift, ∆ω, and line width broadening, Γ, to be:
Δ
1
(3-10)
Γ
1Γ (3-11)
where k1 and k2 are fitting parameters, D is the crystallite size, Γo and ωo are the intrinsic Raman
line width and peak position for the 141 peak, respectively, and α is a constant equal to 1.55 for
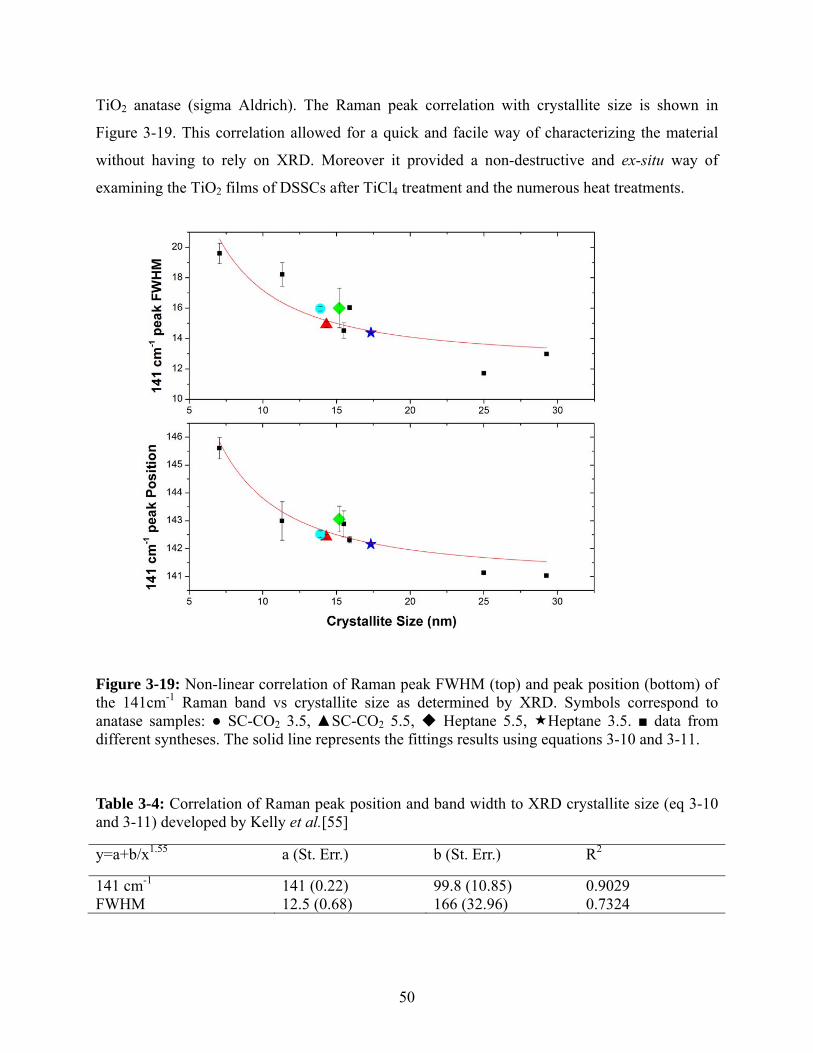
50
TiO2 anatase (sigma Aldrich). The Raman peak correlation with crystallite size is shown in
Figure 3-19. This correlation allowed for a quick and facile way of characterizing the material
without having to rely on XRD. Moreover it provided a non-destructive and ex-situ way of
examining the TiO2 films of DSSCs after TiCl4 treatment and the numerous heat treatments.
Figure 3-19: Non-linear correlation of Raman peak FWHM (top) and peak position (bottom) of the 141cm-1 Raman band vs crystallite size as determined by XRD. Symbols correspond to anatase samples: SC-CO2 3.5, SC-CO2 5.5, Heptane 5.5, Heptane 3.5. data from different syntheses. The solid line represents the fittings results using equations 3-10 and 3-11.
Table 3-4: Correlation of Raman peak position and band width to XRD crystallite size (eq 3-10 and 3-11) developed by Kelly et al.[55]
y=a+b/x1.55 a (St. Err.) b (St. Err.) R2
141 cm-1 141 (0.22) 99.8 (10.85) 0.9029 FWHM 12.5 (0.68) 166 (32.96) 0.7324
51
3.3.3 Characterization of TiO2/CNT composites
Treated carbon nanotubes (0.2 wt%) were mechanically mixed with the TiO2 samples
synthesised in heptane and SC-CO2. The same CNTs were also added in-situ to the synthesis.
With such a small amount of CNTs it was very difficult to quantify the amounts in the final
samples using TGA. Moreover the FTIR bands of CNTs are very week and line up with those of
TiO2 [58]; the same applies to XRD. Despite the difficulties in characterization, the addition of
CNTs had a clear effect on the synthesis of TiO2 and the morphology of the final products. SEM
images of samples obtained in Heptane 5.5, SC-CO2 5.5, and SC-CO2 3.5 are shown in Figure
3-20.
The composites synthesized in SC-CO2 were white with no indication of CNTs. On the
other hand the solids obtained in the synthesis in heptane were gray and it was evident that they
were not uniformly dispersed because of agglomeration, even under stirring. After examination
with SEM, it was observed that the CNTs clearly caused an alteration in the structure. There was
very little resemblance between the material synthesized with CNTs and those without. Yu et al.
[58] showed that using a conventional sol-gel method the addition of CNTs caused TiO2
agglomerates to grow. Moreover, Jensen et al. [59] proposed that addition of CNTs into the
supercritical CO2 increased nucleation of the TiO2 more than the crystal growth rate. They
showed that the addition of small amounts of a seeding material, like natural fibers or
hydrophobic polypropylene, acted as nucleation sites increasing crystallinity and rearranging the
TiO2 crystal. Increased nucleation could also explain the increase in reaction rate described
above.
The increase in crystallinity and the decrease in crystallites size were confirmed using
Raman spectroscopy. Using the correlation between crystallite size and Raman shift (Figure
3-21), the average crystallite size for the composites was estimated to be between 11 and 13 nm.
The characteristic D band (1350 cm-1) and G band (1580 cm-1) corresponding to carbon
nanotubes could not be observed in samples synthesized in SC-CO2 and could be caused by
better wetting and coating (Figure 3-21) [60]. Furthermore, differences in elemental composition
of the sample were examined using back-scattered electrons (BSE), but did not indicate the
presence of carbon.

52
Figure 3-20: SEM images of TiO2/CNT composite material: a,b) Heptane 5.5, c,d) SC-CO2, 5.5, e,f) SC-CO2 3.5.

53
Figure 3-21: Raman shift of TiO2/CNT composites and anatase TiO2 from Sigma-Aldrich. Insert D and G peaks corresponding to carbon nanotubes.
3.4 Conclusions
In summary, TiO2 was synthesized by a sol-gel method in two different solvents, heptane
and supercritical carbon dioxide (SC-CO2). The morphology of the reaction products was
modified by changing the composition of the media, the reaction temperature, or by the addition
of CNTs. The materials were characterized using Raman, FTIR, SEM, XRD, TGA, and BET.
In both media, TTIP was used as metal precursor and acetic acid as an additive to control
the rate of the sol-gel reaction. For synthesis at 60 oC and ~22.5 MPa, changes in the
AcOH/TTIP ratio from 3.5 to 7.0 resulted in very different products. At the lowest ratio,
hierarchical spheres were produced; when the AcOH/TTIP ratio was increased to 5.5, a mixture
of hierarchical spheres and fibers was observed; and finally at a ratio equal to 7.0, solely fibers
were formed (50-200nm in diameter and 6 µm long). In heptane under the same temperature
54
conditions, globular structures were obtained at AcOH/TTIP ratios below 4 and long and thin
nanofibers (10-50 nm in diameter and 2 µm long) were formed over this limit. These results are
in excellent agreement with previous studies by Chapentier and Sui et al.[42].
For all the materials synthesized at 60oC the phase transition temperature from
amorphous to anatase was close to 450 oC, and that between anatase and rutile phase was around
670 oC using DSC. The average crystallite size of the TiO2 samples determined by XRD was
15 nm.
The addition of CNTs caused a change in the morphology of the TiO2 products in both
media. Because of the difficulty in characterizing the composite materials, they were not used in
DSSCs.
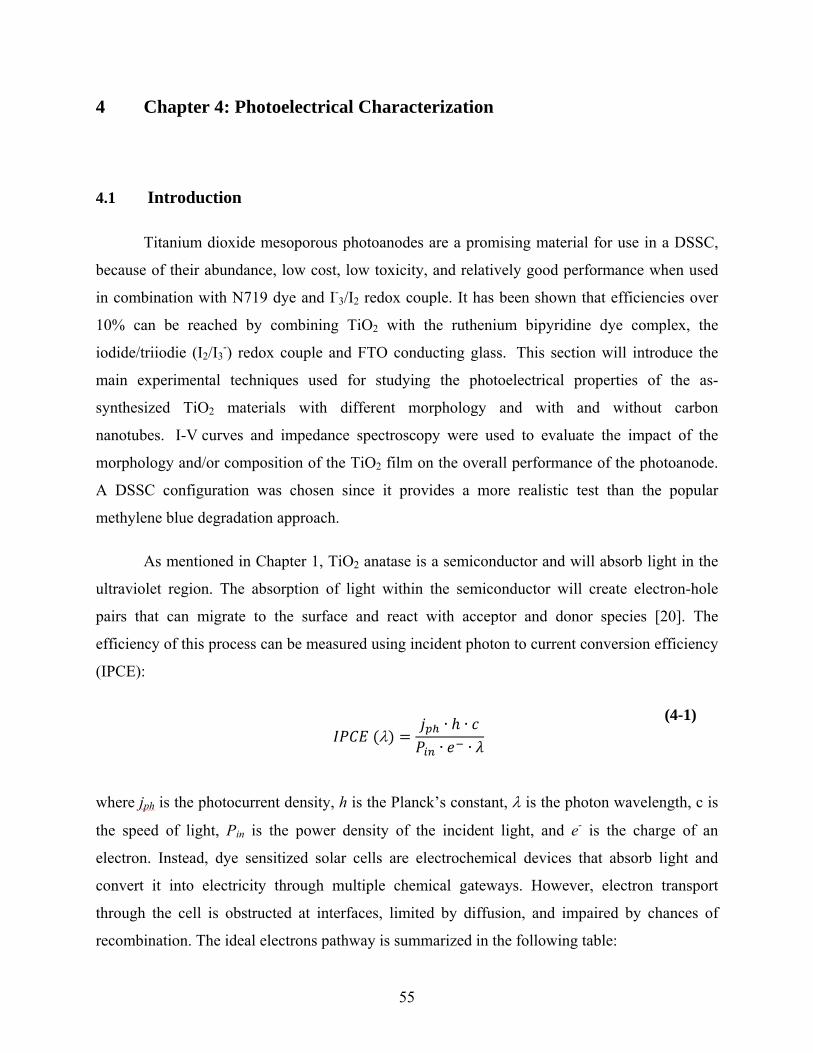
55
4 Chapter 4: Photoelectrical Characterization
4.1 Introduction
Titanium dioxide mesoporous photoanodes are a promising material for use in a DSSC,
because of their abundance, low cost, low toxicity, and relatively good performance when used
in combination with N719 dye and I-3/I2 redox couple. It has been shown that efficiencies over
10% can be reached by combining TiO2 with the ruthenium bipyridine dye complex, the
iodide/triiodie (I2/I3-) redox couple and FTO conducting glass. This section will introduce the
main experimental techniques used for studying the photoelectrical properties of the as-
synthesized TiO2 materials with different morphology and with and without carbon
nanotubes. I-V curves and impedance spectroscopy were used to evaluate the impact of the
morphology and/or composition of the TiO2 film on the overall performance of the photoanode.
A DSSC configuration was chosen since it provides a more realistic test than the popular
methylene blue degradation approach.
As mentioned in Chapter 1, TiO2 anatase is a semiconductor and will absorb light in the
ultraviolet region. The absorption of light within the semiconductor will create electron-hole
pairs that can migrate to the surface and react with acceptor and donor species [20]. The
efficiency of this process can be measured using incident photon to current conversion efficiency
(IPCE):
∙ ∙∙ ∙
(4-1)
where jph is the photocurrent density, h is the Planck’s constant, is the photon wavelength, c is
the speed of light, Pin is the power density of the incident light, and e- is the charge of an
electron. Instead, dye sensitized solar cells are electrochemical devices that absorb light and
convert it into electricity through multiple chemical gateways. However, electron transport
through the cell is obstructed at interfaces, limited by diffusion, and impaired by chances of
recombination. The ideal electrons pathway is summarized in the following table:
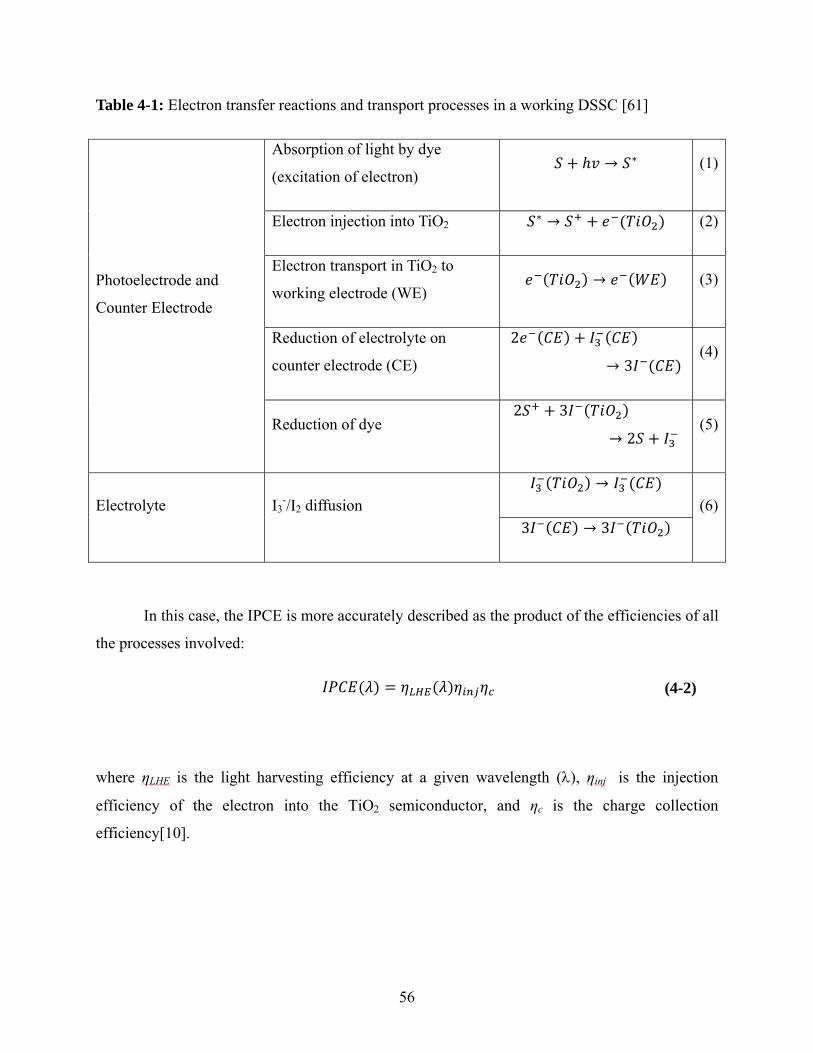
56
Table 4-1: Electron transfer reactions and transport processes in a working DSSC [61]
Photoelectrode and
Counter Electrode
Absorption of light by dye
(excitation of electron) → ∗ (1)
Electron injection into TiO2 ∗ → (2)
Electron transport in TiO2 to
working electrode (WE) → (3)
Reduction of electrolyte on
counter electrode (CE)
2
→ 3 (4)
Reduction of dye 2 3
→ 2 (5)
Electrolyte I3-/I2 diffusion
→
(6)
3 → 3
In this case, the IPCE is more accurately described as the product of the efficiencies of all
the processes involved:
(4-2)
where ηLHE is the light harvesting efficiency at a given wavelength (), ηinj is the injection
efficiency of the electron into the TiO2 semiconductor, and ηc is the charge collection
efficiency[10].

57
4.1.1 The I-V Curve
A single diode model (Figure 4-1) has been used to describe the shape of the current-
voltage (I-V) curve of a DSSC under steady state operating conditions.[3,61]
Figure 4-1: Single diode equivalent circuit model: Iph, photocurrent; the diode represents the recombination of electrons; Rs, series resistance; Rsh, shunt resistance; Vcell, load.
Using this model, the current cell is given by
1 (4‐3)
where jph (= Iph/A) is the photogenerated density current, jd is the dark reverse current density, Rsh
represents the shunt resistance, an alternative pathway for the electrons (for example,
recombination at the working electrode) Rs is the ohmic series resistance which takes into
account sheet resistance of the FTO glasses, resistivity of the electrolyte, electrical contacts and
wiring [61].
A typical a current-voltage (I-V) curve is shown in Figure 4-2. The efficiency of the cell
and other relevant parameters can be obtained from the curve under standardized illumination
conditions.

58
Figure 4-2: I-V curve for a DSSC. Isc: short circuit current, VOC: open circuit voltage, and VMP.JMP: maximum power point.
The current associated with zero applied bias, Isc, in a DSSC is called the short circuit
current, Equation (4-3), and it is the largest current which can be generated from a cell. It is due
to the generation and collection of photoelectrons entering the circuit. As the forward potential
increases it reaches a “forward-voltage-drop” where the recombination term dominates and
bends the I-V curve [3]. The I-V curve is measured in the fourth quadrant, but it is a useful
convention to invert the sign of the current since the cell is generating power instead of using it.
Using the ideal diode equation, the open circuit voltage, Voc, can be deduced [2]:
where jsc and jd were previously defined, m is the ideality factor, usually within the range from 1
to 2 (1 for the ideal diode), T is the absolute temperature, KB is the Boltzmann constant, and e is
the electron charge. It is worth noting that the ideal diode model works better for solid state
ln 1 (4‐4)
59
devices than electrochemical systems like a DSSC, because the model does not take into account
diffusion in the electrolyte solution.
The open circuit voltage is the maximum potential of the cell and occurs at zero current.
Under these conditions, Voc gives the equilibrium values for electron injection and
recombination. The open circuit voltage is given by the difference between the Fermi level
position of the semiconductor (TiO2) and the reduction potential of the I2-/I3
- redox couple, and
its theoretical value is equal to 0.8 eV [2,10]. A greater concentration of electrons in the
conduction band will shift the Fermi level to higher values [3], resulting in a decrease in
recombination [10].
To determine the total solar conversion efficiency (η), the solar radiation to electrical
power output is calculated using the equation [3]:
(4‐5)
where Isc and Voc are the short circuit current and the open circuit photovoltage respectively; Pin
is the total incident solar power to the cell, and FF is the Fill Factor (FF=A/B in, Figure 4-2)
which is defined as the ratio of the theoretical maximum power of the cell, Isc·Voc, to the product
of the current and voltage corresponding to the maximum power point, IMP·VMP,.
(4‐6)
Typical fill factors values for dye sensitized solar cells are in the 0.75 to 0.85 range. [10]
The series resistances, Rs, can be approximated by the slope close to the open circuit
voltage point, using [62]:
1 (4‐7)
Similarly, shunt resistances, Rsh, can be approximated from the slope close to the short circuit
current point:

60
11 (4‐8)
4.1.2 Impedance Spectroscopy
In addition to efficiency measurements from I-V curves, impedance spectroscopy is an
essential characterization technique because it makes it possible to separate the contributions of
the different processes by studying the response of the cell (electrochemical system) to an
applied small amplitude AC signal at different frequencies superimposed on a constant DC
polarization potential. Because impedance spectroscopy measures a phase change in the AC
circuit 0ften the data are represented graphically using a Nyquist plot as shown in Figure 4-3,
where the response of a solid working electrode in a given electrolyte is shown. The resistance is
constant for each component and makes up the real part; the capacitance and inductance on the
other hand causes a shift in the phase angle, to lag or lead the AC current, and are represented by
the imaginary part. In this case, the double layer capacitance for an electrode/electrolyte interface
can be modeled by taking into account the capacitance of the double layer, Cdl, due to the
accumulation of charges at the interface and the charge transfer resistance, Rct, across the
interface.
Figure 4-3: (A) electrode/electrolyte interface, (B) equivalent circuit, and (C) Nyquist plot for the equivalent circuit. The diameter of the semicircle represents the resistance while the capacitance can be obtained from the maximum in the Im Z axis. Increasing frequency is indicated by the symbol ω.

61
The impedance is found by the following equation with the Cdl and Rct in parallel:
1 (4‐9)
Each point in Figure 4-3 (C) corresponds to a frequency, the diameter of the semicircle is
the charge transfer resistance and the capacitance can be found knowing the frequency of the
highest imaginary Z value. As more components are added, the impedance expression becomes
more complicated, and multiple semicircles and other features can be observed.
The diffusion-recombination equivalent circuit model for a DSSC
The model for a DSSC was developed independently by Kern et al [63] and
Bisquert[64], to describe electron transfer and recombination in nanocrystalline TiO2 porous
electrodes and is represented in Figure 4-4.
Figure 4-4: Transmission line model for a DSSC used in impedance spectroscopy. rt – electron transport resistivity; rr – recombination resistance, Cμ – chemical capacitance at TiO2/electrolyte interface, Rs – series resistance, RDL – double layer resistance at working electrode, CDL- double layer capacitance at working electrode, Rpt – double layer resistance at counter electrode, Cpt – double layer capacitance at counter electrode [2,61,64,65].
By measuring the impedance of the cell and fitting it to this equivalent circuit allows for
the evaluation of all the components of the system, because of the very different time constants
or characteristic frequencies of the processes involved. These contributions pertain to: electron
62
transport and charge recombination in the TiO2 film; resistance and capacitance at the interface
of electrolyte/TiO2, electrolyte/Pt electrode, and electrolyte/working electrode; and electrolyte
diffusion [2].
The impedance is related to the slope of the I-V curve (the resistance) for the
corresponding operating point (DC voltage),
,,
(4-10)
by taking the limit at zero frequency,
lim→
(4-11)
the resistance of the cell, Rcell, can be determined. The cell resistance is comprised of several
different contributions: Rs, the ohmic series resistance of the cell (resistance of the FTO
substrate, resistivity of the electrolyte, and cell electrical contacts), the diffusion resistance of the
electrolyte, RD, the resistance of the counter electrode, RPt, and the overall resistance of the TiO2
porous electrode, RTiO2
(4-12)
RTiO2 accounts for the overall resistance of the TiO2 photoelectrode and includes the electron
transport and electron recombination, Rt and Rr, respectively.
The impedance spectrum will depend on the external applied DC potential; a low,
intermediate, or high applied DC voltage (Vapp) will amplify certain characteristics of the cell
and it will make it possible to reduce the number of fitting parameters required to reproduce the
experimental results. Moreover, the impedance spectrum of a cell tested in the dark will be very
different from the spectrum of the same cell under illumination conditions. The definition of low,
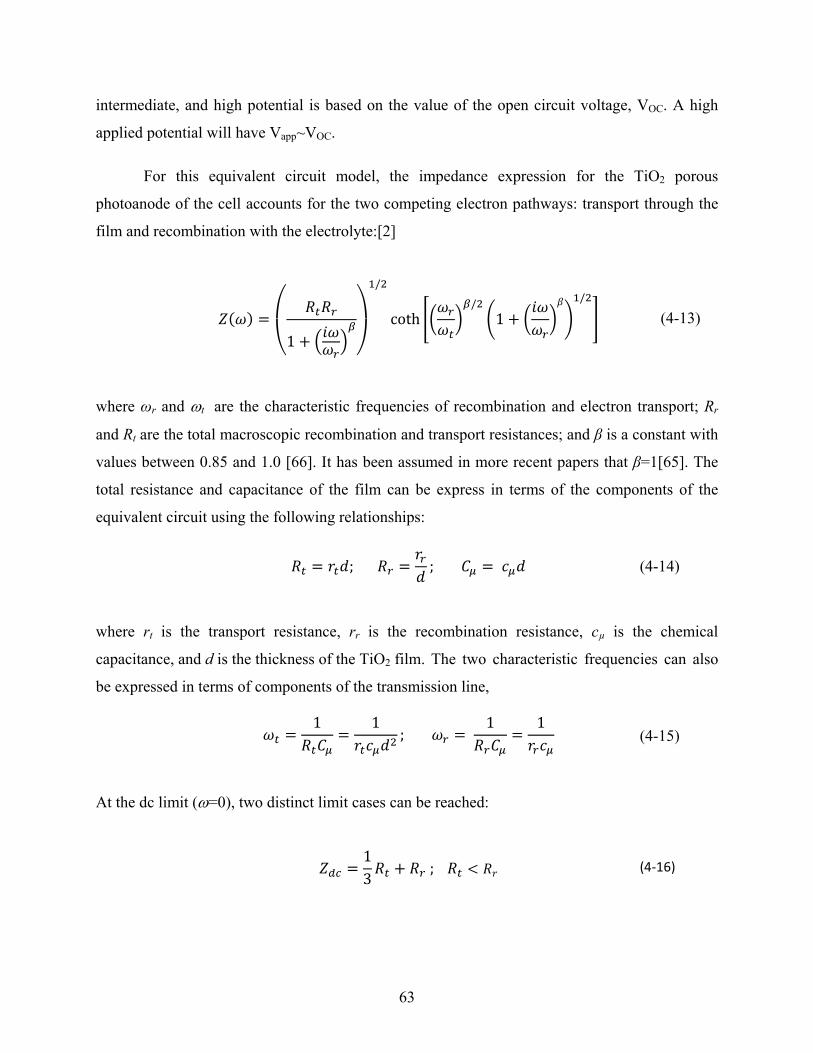
63
intermediate, and high potential is based on the value of the open circuit voltage, VOC. A high
applied potential will have Vapp~VOC.
For this equivalent circuit model, the impedance expression for the TiO2 porous
photoanode of the cell accounts for the two competing electron pathways: transport through the
film and recombination with the electrolyte:[2]
1
/
coth/
1/
(4-13)
where ωr and t are the characteristic frequencies of recombination and electron transport; Rr
and Rt are the total macroscopic recombination and transport resistances; and β is a constant with
values between 0.85 and 1.0 [66]. It has been assumed in more recent papers that β=1[65]. The
total resistance and capacitance of the film can be express in terms of the components of the
equivalent circuit using the following relationships:
; ; (4-14)
where rt is the transport resistance, rr is the recombination resistance, cµ is the chemical
capacitance, and d is the thickness of the TiO2 film. The two characteristic frequencies can also
be expressed in terms of components of the transmission line,
1 1;
1 1 (4-15)
At the dc limit (=0), two distinct limit cases can be reached:
13
; (4‐16)

64
/ ; (4‐17)
The shape of the overall impedance spectrum is modulated by the ratio of the characteristic
frequencies of electron transport and recombination
(4‐18)
where ωd, is the transport characteristic frequency, and L is the diffusion length. The
characteristic frequency for recombination, ωr, for the cells is related to the electron lifetime, n,
through
1 1 (4‐19)
Moreover the transport characteristic frequency, ωd, is related to the diffusion coefficient, Dn,
through
1 (4‐20)
By combining all these equations, three independent parameters can be derived: electron
lifetime, the electron diffusion coefficient, and the ratio between recombination resistance and
transport resistance Rr/Rt. A more detailed description of the impedance model and related
equations can be found in reference [2]
4.2 Experimental
4.2.1 Materials and Methods
The chemicals used for the fabrication of the DSSC were AR grade and used without
further purification. Di-tetrabutylammonium cis-bis(isothiocyanato)bis(2,2’-bipyridyl-4,4’-
dicarboxylato) ruthenium(II) (N-719 dye, 95%, Sigma-Aldrich); acetonitrile (99.8%, Sigma-
Aldrich); tert-Butanol (99.5%, Sigma-Aldrich); lithium iodide (99.99%, Sigma-Aldrich), iodine

65
(99.99%, Sigma-Aldrich); 1,2 dimethyl-3-propylimidazolium iodide (DMP II, TCL America); 4-
ter-butylpyridine (TBP, 96%, Sigma-Aldrich); 3-methoxypropionitrile (MPN, 98%, Sigma-
Aldrich); glacial acetic acid (Sigma-Aldrich) ; hydrochloric acid (HCl, 37%, Sigma-Aldrich);
titanium tetrachloride (TiCl4, 99.995%, Sigma-Aldrich); TiO2 Degussa P25 (Sigma-Aldrich);
silver conductive paste (Sigma-Aldrich); Cerasolzer soldering alloy, α-terpineol (96%, Sigma
Aldrich); ethyl cellulose solution (viscosity 10 cP, 5%, Sigma-Aldrich).
4.2.2 DSSC Fabrication
This section summarizes the different steps involved in the preparation of a DSSC. As
shown, the procedure involved: (a) deposition and syntherization of a TiO2 film (~15 µm in
thickness) and a TiO2 scatter layer on a conductive FTO glass; (b) adsorption of a ruthenium dye
(sensitizer) onto the surface of the TiO2 nanoparticles; (c) cell assembly (sandwich the
photoanode and the Pt counter-electrode together using a polymeric gasket); and (d) filling the
cell with the I-/I3- electrolyte solution.
Figure 4-5: Different steps involved in the fabrication of a DSSCs. From left to right: TiO2 film, Pt counter-electrode, sensitizer adsorption, and cell assembly.
i- Film preparation and film thickness characterization
FTO glasses from MTI (with a sheet resistance of 6-8 Ω/sq) were cleaned using
hydrochloric acid, washed with ultra-pure water (18 MΩ·cm) until neutral pH, and dried in an
66
oven at 120 oC. The clean substrates were treated with a 40 mM TiCl4 solution and dried at 70 oC
for a minimum of 30 min. This very thin layer of TiO2 enhances the adhesion of the TiO2
nanoparticles and acts as a blocking layer, reducing electron recombination from the FTO with
the electrolyte [2].
A couple of experimental procedures were tested for the preparation of the films,
including a doctor blade method and screen printing with multiple paste formulations. The doctor
blade method, which involved spreading the TiO2 paste over a 1 cm2 area onto a FTO glass
masked by scotch tape (3M) using a glass slide, was fast, but it was not reproducible. In addition,
the films did not show a good adherence to the substrate.
The screen printing approach was slow, but it was extremely reproducible and the
adherence of the film was also very good. The main steps of this preparation method are
summarized in the flow chart shown in Figure 4-6. The reasons for such a long procedure was to
produce films with strong adhesion to the FTO substrate, that do not crack when sinterized at
high temperature, and have a uniform distribution of interconnected particles. As in other studies,
acetic acid was used to prevent particle agglomeration due to the strong chemical interaction
between TiO2 and carboxylic acid groups. The subsequent addition of water contributed to the
formation of surface hydroxyl groups (-OH) on the TiO2 particles, allowing chemical bonding
between the particles and the FTO glass through dehydration during sinterization step. The α-
terpineol is less volatile than ethanol and along with ethyl cellulose provided stability to the
mixture paste and an adequate viscosity for screen printing after elimination of other volatile
components.

67
Figure 4-6: Screen printing paste preparation procedure.
A typical TGA run of the paste carried out in air at a gas flow rate of 20 mL/min is shown
in Figure 4-7. It can be seen that very little ethanol (boiling point 78 oC) remains because there is
almost no mass decrease before 140 oC. At that point absorbed water and acetic acid (boiling
point 118 oC) start to leave, as well as α-terpineol (boiling point 217 oC), which constitutes
around 50% of the total mass. The free ethylcellulose decomposes around 360 oC, and the
adsorbed ethylcellulose decomposes at around 400 oC accounting for about 30% of the total
mass. The final 20% is TiO2. These values are in good agreement with other formulations [67].
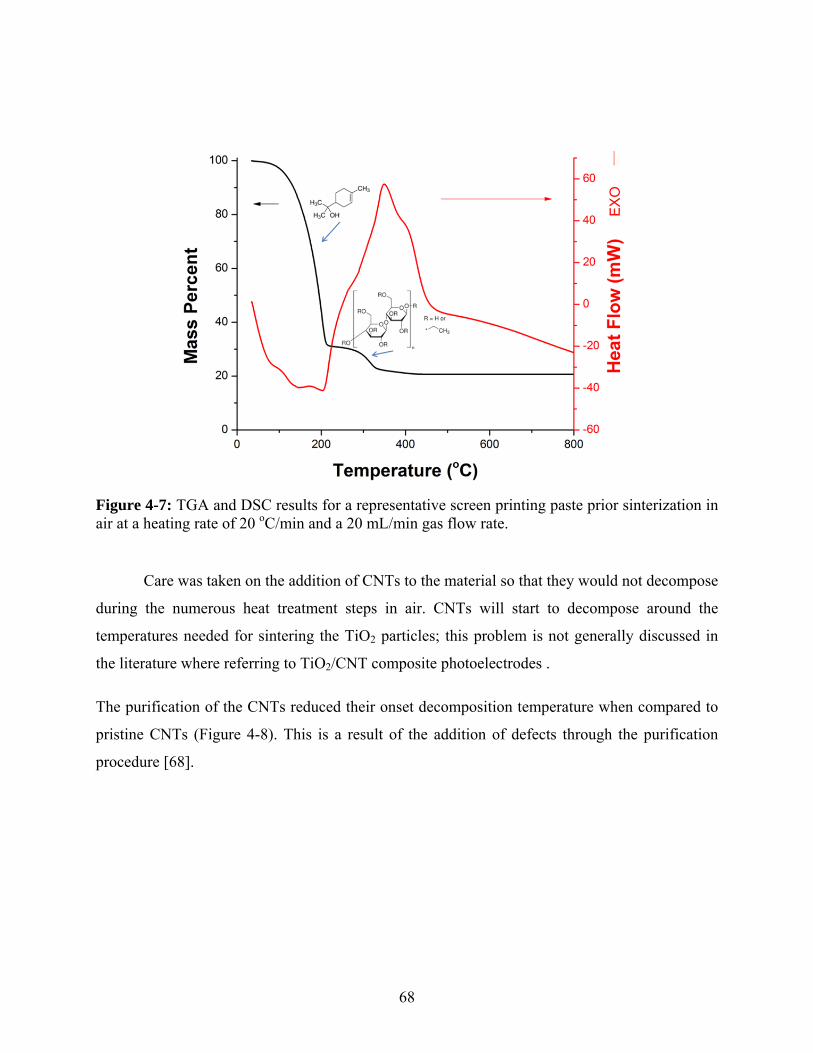
68
Figure 4-7: TGA and DSC results for a representative screen printing paste prior sinterization in air at a heating rate of 20 oC/min and a 20 mL/min gas flow rate.
Care was taken on the addition of CNTs to the material so that they would not decompose
during the numerous heat treatment steps in air. CNTs will start to decompose around the
temperatures needed for sintering the TiO2 particles; this problem is not generally discussed in
the literature where referring to TiO2/CNT composite photoelectrodes .
The purification of the CNTs reduced their onset decomposition temperature when compared to
pristine CNTs (Figure 4-8). This is a result of the addition of defects through the purification
procedure [68].

69
Figure 4-8: TGA and DSC runs for pristine and purified CNTs in air at a heating rate of 20 oC/min and a 20 mL/min gas flow rate. The figure shows the change in the decomposition of CNTs with temperature after the purification step.
The TGA and DSC results shown in Figure 4-7 and 4-8 were used to develop the
following heating procedure. The sample were heated in air up to 375 oC held for 90 min to
insure the additives were removed, then heated to 500 oC under argon and held for another hour,
Figure 4-9.
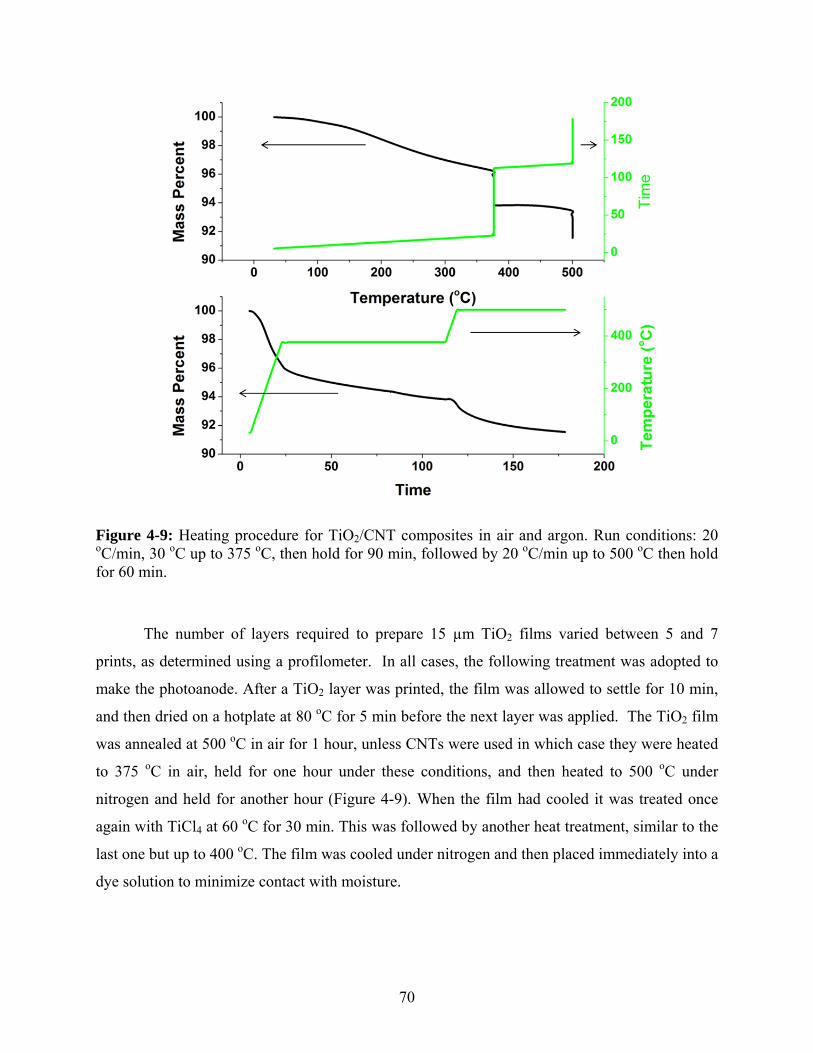
70
Figure 4-9: Heating procedure for TiO2/CNT composites in air and argon. Run conditions: 20 oC/min, 30 oC up to 375 oC, then hold for 90 min, followed by 20 oC/min up to 500 oC then hold for 60 min.
The number of layers required to prepare 15 µm TiO2 films varied between 5 and 7
prints, as determined using a profilometer. In all cases, the following treatment was adopted to
make the photoanode. After a TiO2 layer was printed, the film was allowed to settle for 10 min,
and then dried on a hotplate at 80 oC for 5 min before the next layer was applied. The TiO2 film
was annealed at 500 oC in air for 1 hour, unless CNTs were used in which case they were heated
to 375 oC in air, held for one hour under these conditions, and then heated to 500 oC under
nitrogen and held for another hour (Figure 4-9). When the film had cooled it was treated once
again with TiCl4 at 60 oC for 30 min. This was followed by another heat treatment, similar to the
last one but up to 400 oC. The film was cooled under nitrogen and then placed immediately into a
dye solution to minimize contact with moisture.
71
The TiO2 solids used to prepare the photoanodes along with the synthesis media are
shown in the following table:
Table 4-2: Labelling of the material tested in a DSSC configuration.
ii-Dye Solution Preparation
The 5 mM N-719 dye solution was prepared in a glove bag under nitrogen to minimize
contact with moisture. The solvent was a 1:1 mixture of anhydrous acetonitrile and tert-butanol,
which is used to increase the solubility of the dye and be sure the amount of dye is enough to
saturate the films. The TiO2/FTO glasses were immersed in the dye solution for at least 24 hours
in sealed containers and dark conditions.
Dye loading was determined by desorbing the dye from the photoanode in a solution of
0.1 M NaOH in ethanol and water (1:1) over 3 h. In an alkaline solution the affinity of the dye by
the metal decreases and the dye can be removed from the TiO2 film. The dye concentration in
solution was measured using a Cary 50 UV-visible spectrometer (Figure 4-10) [69].

72
Figure 4-10: UV-visible spectra of the N-719 dye in 0.1 M NaOH (1:1 ethanol; water) after desorption from the films. NF P25, HS, HSF.
iii-Electrolyte Solution
The electrolyte formulation was taken from Chiba Y et al.[70] since I3-/I2 proved to be an
effective mediator and stable under the operation conditions [2]. The electrolyte solution
composition is given below:
Table 4-3: Electrolyte solution composition
Chemical Concentration (mol/L) Lithium iodide (LiI) 0.1 M Iodine (I2) 0.05 M Ter-butylpyridine 0.5 M 1,2 dimethyl-3-propylimidazolium iodide (DMPII) 0.6 M 3-Methoxypropionitrile (MPN). Solvent
73
The additive ter-butylpyridine was added to minimize the reduction of triiodide
(interception) by adsorption onto bare spots on the TiO2 films, while 1,2 dimethyl-3-
propylimidazolium iodide (DMPII) was added to decrease the viscosity of the solution [2].
iv-Preparation of the Platinum Counter-Electrode
Two holes were very carefully drilled into the FTO glass used to prepare the platinum
counter electrodes. The electrodes were cleaned with 0.1 M HCl solution and washed with
ultrapure water. A 1 cm2 area was masked with scotch tape and 5 layers of Plastisol T paint
(Solaronix) were applied to the FTO glasses, waiting a minute for drying before applying each
subsequent layer. The counter electrodes were then heated at 450 oC for 15 min to remove
organic materials and produce the Pt film.
v-DSSC Cells Assembly
In this step the photoanode and the Pt counter-electrode were sandwiched together, using
a 25 μm Meltonix gasket (Solaronix) to keep them from touching and to leave space for the
electrolyte solution. The inner 1 cm2 section was cut away to match the area of the TiO2
photoanode and platinum counter electrode. The gasket was fused to the glasses using a hot press
to form a strong seal. The electrolyte was introduced into the cell through a hole in the counter
electrode and was pulled through by capillary forces. The two holes were then sealed using a
60 μm Meltonix film and a thin glass microscope cover using a soldering iron. The copper wire
connections were made using Cerasolzer soldering alloy, which is designed to adhere to glass,
and coated with silver paste to decrease the contact resistance.
4.2.3 I-V Curves and Impedance Spectroscopy Measurements
The efficiency and other important cell parameters were determined using a solar
simulator under standardized conditions: an air mass of 1.5 (AM1.5); intensities of 100 mW/cm2;
and a cell temperature of 25 oC. The I-V curves corresponding to DSSCs with photoanodes
prepared with TiO2 powders with different morphology were acquired with a Gamry Instruments

74
Reference 600 potentiostat using a Newport Oriel Sol 3A sun simulator under 1.5 AM D,
100 mW/cm2, direct illumination (see Section 1.1). The I-V curves for P25 with and without a
scattering layer and with and without CNTs were collected with a using an Optical Associates
Inc, TriSol solar simulator, under 1.5 AM, 100 mW/cm2, global illumination. Global illumination
takes into account diffuse irradiation caused by the atmosphere [6]. The fill factor and the
efficiencies were calculated using equations (4-5) and (4-6)
The impedance measurements were done on the cells using a Gamry Instruments
Reference 600 potentiostat at different applied voltages, in the dark and under illumination, from
100 Hz to 10 mHz, taking 20 point per decade with a AC amplitude of 10 mV. A two electrode
configuration was used for the measurements with the working and working sense electrodes
both connected to the photoanode, and the reference and counter electrode both connected to the
cathode. The DC applied bias potential for each run was -0.5V vs I2/I-3 unless otherwise stated.
The curve fittings were done with the Gamry Echem Analyst software. The resistance and
chemical capacitance at the platinum counter electrode were found using a blank cell consisting
of two platinum electrodes and I2/I-3 electrolyte; the series resistance was found as the onset
value along the real axis.
4.3 Results and Discussion: Photovoltaic Properties of a DSSC
This is the first study on dye sensitized solar cells in Gaspari`s and Trevani`s research
groups and a systematic procedure for preparing the TiO2 pastes, assembling the cells, and
testing their performance using a solar simulator and impedance spectroscopy was developed as
part of this thesis with the valuable contribution of Simone Quaranta (Dr. Gaspari`s PhD student)
The methodology was used to prepare several DSSCs with the materials synthesized in
Chapter 3. The performance of these cells was studied using I-V curves and impedance
spectroscopy. The reproducibility for a single cell was used as a reference when comparing the
performance of the cells prepared with different TiO2 materials. Ongoing work in our
laboratories will provide the statistical analysis required to confirm and/or improve these initial
findings.

75
In one set of experiments, the performance of cells prepared with TiO2 films comprised
of hierarchical spheres (HS, 3.5 AcOH/TTIP, SCCO2), hierarchical spheres and fibers (HSF,
5.5 AcOH/TTIP, SCCO2), and nanofibres (NF, 5.5 AcOH/TTIP, heptane) were examined. In a
second set of runs, the performance of TiO2 Degussa P25, a commercially available product,
with and without CNTs and scattering layers consisting of hierarchical spheres was investigated.
Efficiency Determination from IV Curve Data
The I-V curves for DSSCs with photoanodes prepared with TiO2 solids with the
morphologies illustrated in Table 4-2 are shown in Figure 4-11. The corresponding values of
efficiency and other cell parameters are summarized in Table 4-4. It can be seen that the open
circuit voltage (Voc) remains constant. The short circuit current is the main difference between
the different cells, with values between 4.46 and 7.50 mA cm-2. The efficiencies for HSF , HS,
and NF are 1.72%, 2.15%, 2.77%, respectively.
The morphologies of solids used to prepare the film would affect the film structure and
the surface area; these two parameters could have a significant impact in dye loading and
electron transfer. The short circuit current, Isc, is dependent on the amount of photogenerated
electrons that can make it into the circuit, meaning it depends on light harvesting capabilities and
rates of electron transfer and recombination [61].

76
Figure 4-11: I-V curves for DSSCs prepared with TiO2 solids with the following morphologies: -NF, P25, -HS, -HSF. The data were acquired with a Newport Oriel Sol 3A sun simulator under 1.5 AM D, 100 mW/cm2, direct illumination. Scan rate: 0.1 V/s
Table 4-4: DSSC efficiencies and I-V curve parameters of DSSCs prepared with TiO2 solids with different morphologies. The data were acquired with a Newport Oriel Sol 3A sun simulator under 1.5 AM D, 100 mW/cm2, direct illumination.
Sample Voc
(V)
Isc
(mA/cm2)
VMP
(V)
IMP
(mA/cm2) FF
Rs
(Ohm)
Rsh
(Ohm)
Efficiency
NF 0.663 7.50 0.43 6.43 0.559 29.67 150.6 2.8% HS 0.652 5.75 0.42 5.11 0.574 35.1 192.2 2.2%
HSF 0.669 4.46 0.46 3.75 0.577 51.7 290.8 1.7% P25a 0.674 6.94 0.44 6.33 0.592 28.1 171.8 2.8%
a Result obtained using global irradiance.
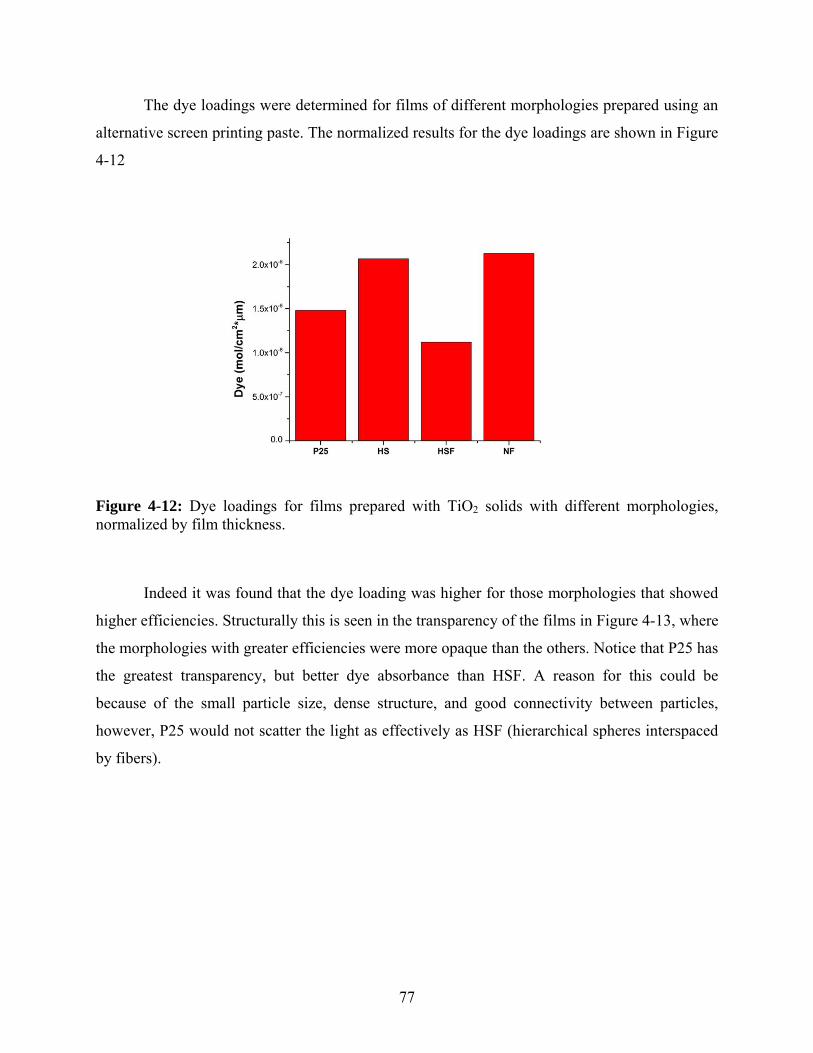
77
The dye loadings were determined for films of different morphologies prepared using an
alternative screen printing paste. The normalized results for the dye loadings are shown in Figure
4-12
Figure 4-12: Dye loadings for films prepared with TiO2 solids with different morphologies, normalized by film thickness.
Indeed it was found that the dye loading was higher for those morphologies that showed
higher efficiencies. Structurally this is seen in the transparency of the films in Figure 4-13, where
the morphologies with greater efficiencies were more opaque than the others. Notice that P25 has
the greatest transparency, but better dye absorbance than HSF. A reason for this could be
because of the small particle size, dense structure, and good connectivity between particles,
however, P25 would not scatter the light as effectively as HSF (hierarchical spheres interspaced
by fibers).

78
Figure 4-13: Transparency of TiO2 films of different morphologies. Film thickness: ~15μm. Square area indicates the scattering ability of the film.
Lee et al. [71] showed that nanofibers performed poorly compared to nanoparticles in
DSSCs and correlated the decrease in efficiency to fibers having less surface area and poorer dye
loading [24]. However, these preliminary results indicate NF performs better than other
morphologies. In the case of HSF, the relatively poor efficiency could be associated to a low dye
loading, as well as, to a reduced transparency compared to the other morphologies. The BET
surface area after sinterization for a synthesis in SC-CO2 with 4.0 AcOH/TTIP (which resembles
HS) was 67 m2/g; for P25 the surface area was 49 m2/g, which is expected to decrease upon
sinterization [71]. The higher dye loading of HSF and HS could also be due to a more optimal
pore size between that of P25 and HSF.
Recently Liao et al. [24] examined fibers, hierarchical spheres, spheres and ellipsoids
synthesized using a solvothermal method. The performance of these matererials were studied in a
DSSC configuration. The authors reported very high efficiencies with their material, but it
should be noted that the cell area was 0.16 cm2. In addition they used a 150 nm sputtered
blocking layer to increase TiO2 particle connectivity with the FTO working electrode and reduce
the shunt resistance. Their different morphologies and efficiencies are shown in Figure 4-14.

79
Figure 4-14: Different morphologies produced by Liao et al.: a) nanoparticles, b) nanofibres, c) hierarchical spheres, d) ellipsoids. Reproduced from ref [24].
A light scattering layer is often used to improve the efficiency of DSSCs; the layer
usually contains larger particles which can scatter the light back into the mesoporous film and
increase the average optical mean path [6]. In this work HS was tested as a scattering layer
because of its good dye loading, and ability to scattering the light. It was tested on P25 and
P25/CNT composites. Figure 4-15 shows the I-V curves of the composite material.
Figure 4-15: I-V curves for DSSCs prepared with Degussa P25 TiO2 anatase with and without the addition of CNTs: -P25+HS, -P25, -P25+CNT+HS, -P25+CNT. The data were obtained using a TriSol solar simulator, under 1.5 AM, 100 mW/cm2, global illumination. Scan rate: 0.1 V/s

80
As shown, the scattering layer increased the efficiency for the P25 and the P25 composite
material by 12.5% and 10% respectively. On the other hand, the open circuit voltage can be seen
to decrease from 0.674 to 0.622V when CNTs were added. The Voc depends on the difference
between the Nernstian potential of the electrolyte, and the Fermi level of the TiO2, with a
theoretical maximum around 0.8 eV for a I-/I3- system [2]. The processes that decrease the Voc
are: increased rates of recombination, and low rates of charge transfer (Equation (4-4)). Carbon
is known as a catalyst in the reduction of triiodie [72], it has been used as a counter electrode
[73], and it has been used in the photodegradation of pollutants such as methylene blue [30]. A
cause of the decrease could be associated to the fact that carbon nanotubes were mechanically
mixed into the paste of TiO2 to make the photoelectrode, they were not added to the synthesis,
thus limiting the intimate contact between TiO2 and the CNTs [74]. The presence of “naked”
carbon nanotubes in the photoanode that are in direct contact with the electrolyte could act as
recombination sites and reduce the open circuit voltage [72].
Table 4-5: DSSC efficiencies and I-V curve characteristics of P25 with CNTs and scattering layer collected with a TriSol solar simulator, under 1.5 AM, 100 mW/cm2, global illumination.
Sample Voc
(V)
Isc
(mA/cm2)
VMP
(V)
IMP
(mA/cm2)
Fill
Factor
Rs
(Ohm)
Rsh
(Ohm)
η%
P25 0.674
(±3.2mV) 6.94
(±2.2mA)
0.44 (±0.2 mA)
6.33 (±2.3mA)
0.592 (±0.23)
28.1 171.8 2.8%
(±0.07)
P25+HS 0.652 7.90 0.45 7.10 0.620 24.1 166.9 3.2% P25 + CNTs 0.622 4.83 0.42 4.27 0.600 39.6 244.0 1.8% P25+CNTs+HS 0.626 4.95 0.46 4.39 0.654 36.5 300.8 2.0%
The short circuit current also decreased with the addition of CNTs, which could be due
competition for light absorbance between the dye and CNTs. Others have reported an increase in
short circuit current with the addition of small amounts of CNTs due to increased electron
mobility, less trapping, and less recombination with the dye due to the Schottky barrier
effect[31,72]. The opposite effect observed in our composite materials could be caused by an
excess of CNTs added and the catalytic effect mentioned above. Because of the complexity of
81
the problem, impedance spectroscopy was used to evaluate the different processes that could
explain the differences. Some preliminary results are presented in the following section.
Impedance Spectroscopy Results
As mentioned in Section 4.2.3, the position of the Fermi level at the interface between the
TCO and TiO2 film can be controlled by an external applied potential. The impedance spectra of
a DSSC with a Degussa P25 TiO2 photoanode in the dark at two different applied potential are
compared in Figure 4-16 and Figure 4-18. At a high applied potential, over the open circuit
voltage, VOC, the Fermi level is close to the TiO2 semiconductor conduction band which
increases the concentration of electrons in the TiO2 network and reduces the transport resistance
of the film (Rr >> Rt). Under this condition, the transmission line required to fit the impedance
data can be simplified to that shown in Figure 4-17.
The impedance spectrum for a DSSC with a TiO2 Degussa P25 photoanode in the dark, at
a high applied potential of -0.7 V (Figure 4-16), shows three distinct regions (semicircles). Based
on the transmission line in Figure 4-17, the low frequency arc is associated to electrolyte
diffusion, the middle arc at intermediate frequencies is linked to electron recombination and
chemical capacitance at the TiO2 surface, and finally the semicircle at high frequency values is
linked to the counter electrode charge transfer resistance and capacitance. [2].

82
Figure 4-16: Impedance spectrum of a DSSC (Degussa P25 photoelectrode) in the dark under a -0.75V bias vs I-
3/I2 (high applied potential). Frequency range: 100 Hz to 10 mHz, AC amplitude 10mV.
Figure 4-17: Transmission line model at high applied potentials for describing the impedance spectrum shown in Figure 4-16.
When operating at low DC applied potentials, the Fermi-level is close to the valence band
and the electrons cannot be injected into the TiO2 due to the extremely high electron transport
resistance (Rt ) and the main contribution to the impedance spectrum in Figure 4-18 is the
parallel combination of the charge transfer resistance of the FTO/electrolyte interface, RDL, at the
bottom of TiO2 film and the CDL , resulting in an open high resistance arc [2].
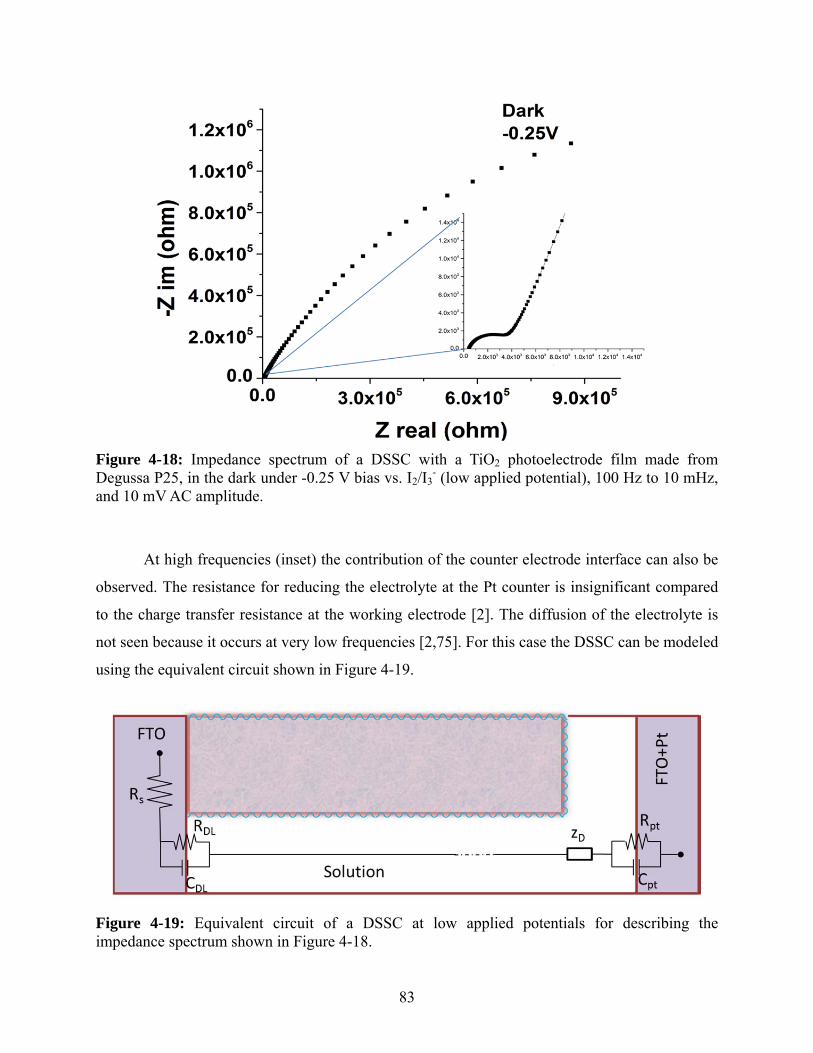
83
Figure 4-18: Impedance spectrum of a DSSC with a TiO2 photoelectrode film made from Degussa P25, in the dark under -0.25 V bias vs. I2/I3
- (low applied potential), 100 Hz to 10 mHz, and 10 mV AC amplitude.
At high frequencies (inset) the contribution of the counter electrode interface can also be
observed. The resistance for reducing the electrolyte at the Pt counter is insignificant compared
to the charge transfer resistance at the working electrode [2]. The diffusion of the electrolyte is
not seen because it occurs at very low frequencies [2,75]. For this case the DSSC can be modeled
using the equivalent circuit shown in Figure 4-19.
Figure 4-19: Equivalent circuit of a DSSC at low applied potentials for describing the impedance spectrum shown in Figure 4-18.
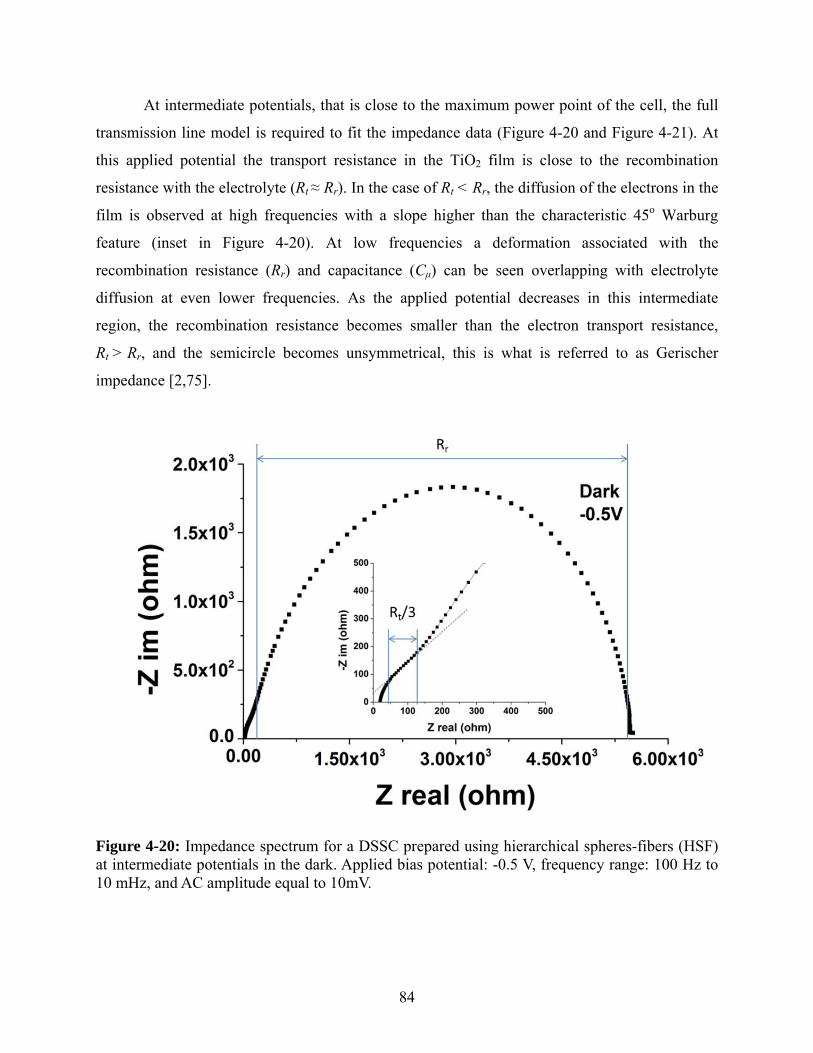
84
At intermediate potentials, that is close to the maximum power point of the cell, the full
transmission line model is required to fit the impedance data (Figure 4-20 and Figure 4-21). At
this applied potential the transport resistance in the TiO2 film is close to the recombination
resistance with the electrolyte (Rt ≈ Rr). In the case of Rt < Rr, the diffusion of the electrons in the
film is observed at high frequencies with a slope higher than the characteristic 45o Warburg
feature (inset in Figure 4-20). At low frequencies a deformation associated with the
recombination resistance (Rr) and capacitance (Cμ) can be seen overlapping with electrolyte
diffusion at even lower frequencies. As the applied potential decreases in this intermediate
region, the recombination resistance becomes smaller than the electron transport resistance,
Rt > Rr, and the semicircle becomes unsymmetrical, this is what is referred to as Gerischer
impedance [2,75].
Figure 4-20: Impedance spectrum for a DSSC prepared using hierarchical spheres-fibers (HSF) at intermediate potentials in the dark. Applied bias potential: -0.5 V, frequency range: 100 Hz to 10 mHz, and AC amplitude equal to 10mV.

85
Figure 4-21: Equivalent circuit for a DSSC at a potential close to the maximum power point in Figure 4-20
Different processes are observed in the dark and under illumination, since in the latter
case, electrons are injected into the TiO2 conduction band and electron transport becomes
negligible like in the case of high applied bias potentials (Figure 4-22).
Figure 4-22: Impedance spectra of a DSSC prepared using hierarchical spheres (HS) under illumination and dark at intermediate potentials. Applied bias potential: -0.5 V, frequency range: 100 Hz to 10 mHz, and AC amplitude equal to 10mV.
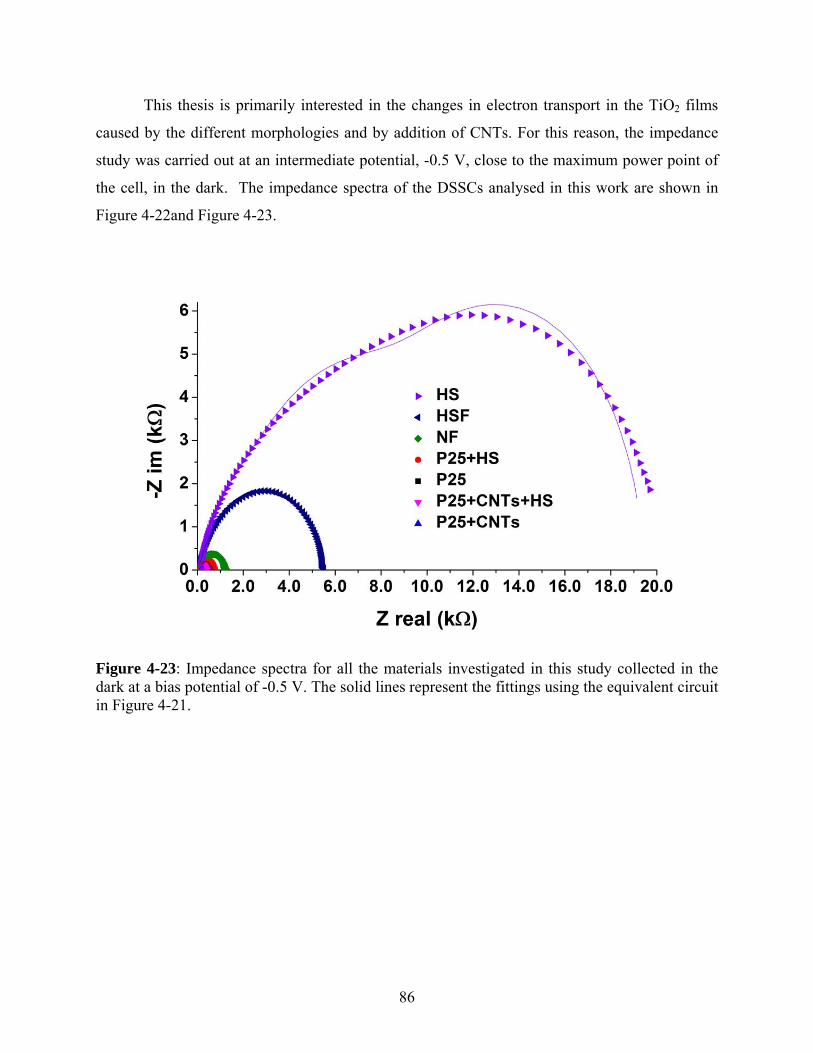
86
This thesis is primarily interested in the changes in electron transport in the TiO2 films
caused by the different morphologies and by addition of CNTs. For this reason, the impedance
study was carried out at an intermediate potential, -0.5 V, close to the maximum power point of
the cell, in the dark. The impedance spectra of the DSSCs analysed in this work are shown in
Figure 4-22and Figure 4-23.
Figure 4-23: Impedance spectra for all the materials investigated in this study collected in the dark at a bias potential of -0.5 V. The solid lines represent the fittings using the equivalent circuit in Figure 4-21.

87
Figure 4-24: Impedance spectra for the materials shown in Figure 4-24. The solid lines represent the fittings using the equivalent circuit in Figure 4-21.
The transmission line in Figure 4-20 was used to fit the IS data. The corresponding
diffusion coefficient, electron lifetime, and Rr/Rt ratio derived from fitting the impedance spectra
are summarized in Table 4-6.
Table 4-6: DSSC efficiencies, diffusion coefficients, electron lifetimes and relative recombination resistances obtained from the impedance spectroscopy runs.
Sample (%) Dn(cm2s-1)
n(s) Rr/Rt
HSF 1.7% 2.6x10⁻⁵
0.05 0.92
HS 2.2% 1.8x10⁻⁶
0.60 0.76
NF 2.8% 2.0x10⁻⁵
0.06 0.89
P25 2.8% (2.5)a 1.7x10
-5 0.05 (0.06)
a 0.89
P25+HS 3.2% 6.0x10⁻⁶
0.20 0.94
P25 + CNTs 1.8% 4.0x10⁻⁵
0.03 0.51
P25+CNTs+HS 2.0% (3.9)a 2.3x10
-5 0.03 (0.04)
a 0.64
a values taken from Quaranta et al. [31]

88
In the impedance spectra of the HS, the central arc corresponding to recombination
resistance is not a true circle, and the linear portion at high frequencies, corresponding to the
transport resistance, is very small indicating strong recombination (Rr<Rt)[2,61]. In this case a
form of Garischer impedance should be used; however, by doing so the diffusion coefficient and
Rr/Rt cannot be determined. As a result the transmission line model in Figure 4-21 was used to fit
the HS data. However, this introduces a greater error in Rr/Rt and the diffusion coefficient when
compared with other samples in Table 4-6[61]. The higher recombination for HS could be
caused by trapping and recombination at the many spiky projections on the particles. The low
diffusion coefficient, almost an order or magnitude lower than the diffusion coefficient for the
other TiO2 morphologies, and the long electron lifetime, which incorporates the transport
lifetime and time stuck at trapping sites, supports this hypothesis.
The diffusion coefficient, electron lifetime, Rr/Rt and efficiencies of HSF and P25 are
very similar even though the transparency of the electrodes is different. The cause of this is
partly due to: the better contacts used for the P25 studies evident in the low series resistance; and
the use of direct light for HSF as opposed to global irradiance for the P25, which increases the
energy input for the later. Unfortunately, the solar simulator used for the initial studies had to be
changed before the work was completed. What is notable about the HSF impedance spectra is
that recombination is relatively low; this could be attributed to one-dimensional semiconductors
theoretically have fewer grain boundaries [72]. The slight decrease in diffusion coefficient for
NF is possibly due to the smaller size of the fibers, but electron lifetime and diffusion coefficient
are close to those of HS. The difference in efficiency must be a result of the morphology. The
shunt resistance for HSF is very high compared to the others morphologies and could be another
indication of the open structure and not many contact sites on the FTO.
Liao et al. [24] used diffuse reflectance spectroscopy and incident-photon-to-current
efficiency (IPCE) to examine light scattering and harvesting abilities of the different
morphologies. They saw that hierarchical spheres had the highest efficiency and performed
better at scattering and harvesting the light. They attributed this result to the larger over all
particle size and better dye loading. On the other hand they saw that the transport and
recombination was better in more crystalline material and nanofibres, concluding that light
harvesting and scattering is one of the key parameters in determining the efficiency.

89
The addition of the scattering layer reduced the diffusion coefficient and increased the
electron lifetime, as expected. The values represent the mixture of poor performance of the HS
and good performance of the P25. In the same respect, the open circuit voltage was lowered
because of increased recombination due to the surface traps from the scattering layer. However
because of the increase in light absorption, a shift in the Fermi level, and shallower electron
trapping/detrapping, the electron transport increased (Rr/Rt) [76].
The CNTs increased the electron diffusion coefficient because of their high conductivity.
On the other hand, electron lifetime was lower and Rr/Rt was low due to increased
recombination, supporting the catalytic effect of the CNTs. With the addition of the scattering
layer, the diffusion decreased and the electron lifetime increased with respect to the P25/CNT
film because of the averaging of the properties of the two different layers.
4.4 Conclusions
In conclusion, a procedure was developed to fabricate DSSCs and characterize in-house
synthesized materials. TiO2 nanofibers produced in heptane performed better than hierarchical
spheres and the mixture of hierarchical spheres and fibers. These results indicate that higher dye
loading, as well as a more efficient light scattering, were crucial in the performance of the cells
and their efficiencies. When CNTs were added to the synthesis, contrary to previous reports a
decrease in efficiency was observed. The reduction in the recombination resistances (Rr/Rt in
Table 4-6) after the addition of carbon nanotubes to Degussa P25 and P25+HS is a major factor
in reducing the efficiency of these cells. Further research needs to be conducted to see if better
efficiencies can be obtained through chemical linkages between the TiO2 network with the
CNTs. The reproducibility of the cells needs to be investigated further for these results to be
statistically relevant.

90
5 Conclusions and Future Work
TiO2 films of different morphologies were synthesized using different reaction media,
supercritical carbon dioxide and heptane. The photoelectrical properties of the materials were
tested using DSSC devices. Furthermore, the impact of carbon nanotubes on the photoelectrical
properties of TiO2 was investigated by mixing CNT’s with Degussa P25 commercial TiO2 films
followed by testing in a DSSC device.
In order to produce nanomaterials in supercritical CO2, a high temperature, high pressure
system was developed, tested and calibrated. It was able to withstand and hold pressures of
24 MPa and temperatures of 150 oC over multiple days. The system contained features such as a
precursor injection system, a temperature range from 0 to 150 oC, capability of recording real-
time temperatures and pressures, could work under flow conditions and had safety features such
as a rupture disk, a materials trap and proper ventilation.
The morphologies of the different films were characterized using FTIR, Raman, XRD,
SEM and TGA. By controlling the ratios of acetic acid-to-titanium tetraisopropoxide, we were
able to obtain a variety of nanostructures in different media, including: globular structures and
fibers in heptane, hierarchical spheres in SC-CO2 and mixtures of nanospheres and fibers.
The synthesised material was tested in DSSCs using a solar simulator to record the I-V
curve and impedance spectroscopy to examine the electron diffusion, lifetime, and
recombination. A procedure to fabricate DSSCs was successfully implemented, and cells with
efficiencies above 3% were created and tested. Impedance spectroscopy showed that at low
potentials the spectrum was dominated by diffusion of the electrolyte; at high potentials all three
components could be clearly seen, that is: the impedance caused by the counter electrode, the
TiO2 film, and the electrolyte; at intermediate potential the impedance due to electron transport
and recombination was dominant. When operated under illumination a reduction in
recombination resistance occurred due to increased electron transfer from the dye to the TiO2
conduction band.
91
The morphologies tested in a DSSC device included: nanofibres synthesised in heptane
(heptane 5.5), hierarchical spheres (SC-CO2 3.5), and hierarchical spheres and fibers (SC-CO2
5.5). It was found that the nanofibres obtained in heptane performed the best (2.77%) due to
higher dye loading, good scattering of the light and good electron diffusion from their 1-D
structures. Hierarchical spheres had a decrease in efficiency (2.17%) because of greater
recombination due to all the spiky projections, but they had good dye loading and light
scattering. The mixture of hierarchical spheres and fibers had the worst performance (1.72%) due
to their open structure causing bad dye loading and scattering. For completeness future work
should test fibers synthesized in SC-CO2 and the globular structures from heptane, and work
should continue to perfect the art of making DSSCs to increase the efficiency.
This work confirms the high impact of different morphologies on the photoelectrical
properties of TiO2, as reported also by Liao et al. [24], but indicates a better performance of
nanofibers with respect to nanospheres, contrary to Liao’s findings. We conclude that the
combination of morphology and relative size of the nanostructures is responsible for the
differences in performance.
It should be noted that, when CNTs were added to the synthesis, there was also a clear
change in morphology. Nanofibers no-longer appeared in synthesis with heptane and large
blocks appeared in the SC-CO2 synthesis. The change in morphology was caused by TiO2
nucleation on the CNTs.
A scattering layer on top of the Degussa P25 sample proved to be effective at increasing
the efficiencies of DSSCs, and the electron transport properties and recombination of the cell
took on properties of both materials. When CNTs were added to these cells, the efficiency was
seen to decrease due to recombination at the interface of the CNT and electrolyte. However, it
was not possible to test similar properties with the different morphologies obtained in this work.
Future work should focus on the types of morphologies that can be obtained in SC-CO2
using AcOH/TTIP as precursors and seeding it with CNTs. Future work should also include
examining the functionalization of CNTs with TiO2, verify that SC-CO2, on achieving better
coatings of CNTs with TiO2, possibly with SC-CO2, and re-examine the quantity of CNTs
needed to increase the efficiency.
92
Reference List
[1] G.W. Crabtree, N.S. Lewis, Solar Energy Conversion, Phys Today. 60 (2007) 37-42.
[2] K. Kalyanasundaram, Dye-Sensitized Solar Cell, First ed., CRC Press, Lausanne, Switzerland, 2010.
[3] J. Nelson, The Physics of Solar Cells, Imperial College Press, London, England, 2009.
[4] W. Shockley, H.J. Queisser, Detailed Balance Limit of Efficiency of p-n Junction Solar Cells, J. Appl. Phys. 32 (1961) 510-519.
[5] G. Conibeer, Third-generation photovoltaics, Materials Today. 10 (2007) 42-50.
[6] A. Hagfeldt, G. Boschloo, L. Sun, L. Kloo, H. Pettersson, Dye-Sensitized Solar Cells, Chem. Rev. 110 (2010) 6595-6663.
[7] A. Fujishima, K. Honda, Electrochemical Photolysis of Water at a Semiconductor Electrode, Nature. 238 (1972) 37-38.
[8] B. O'Regan, M. Grätzel, A low-cost, high-efficiency solar cell based on dye-sensitized colloidal TiO2 films, Nature. 353 (1991) 737-740.
[9] L.M. Peter, The Grätzel Cell: Where Next? J. Phys. Chem. Lett. 2 (2011) 1861-1867.
[10] T.W. Hamann, R.A. Jensen, A.B.F. Martinson, H. Van Ryswyk, J.T. Hupp, Advancing beyond current generation dye-sensitized solar cells, Energy Environ. Sci. 1 (2008) 66-78.
[11] M. Grätzel, Solar Energy Conversion by Dye-Sensitized Photovoltaic Cells, Inorg. Chem. 44 (2005) 6841-6851.
[12] F. De Angelis, S. Fantacci, E. Mosconi, M.K. Nazeeruddin, M. Grätzel, Absorption Spectra and Excited State Energy Levels of the N719 Dye on TiO2 in Dye-Sensitized Solar Cell Models, J. Phys. Chem. C. 115 (2011) 8825-8831.
[13] W.A. Vallejo, C.A. Quinones, j.s. Hernandez, The Chemistry and Physics of Dye-Sensitized Solar Cells, Intechopen , 2011.
[14] A. Yella, H. Lee, H.N. Tsao, C. Yi, A.K. Chandiran, M.K. Nazeeruddin, E.W. Diau, C. Yeh, S.M. Zakeeruddin, M. Grätzel, Porphyrin-Sensitized Solar Cells with Cobalt (II/III)-Based Redox Electrolyte Exceed 12 Percent Efficiency, Science. 334 (2011) 629-634.
[15] M Landmann and E Rauls and,W.G.Schmidt, The electronic structure and optical response of rutile, anatase and brookite TiO2, Journal of Physics: Condensed Matter. 24 (2012) 195503.

93
[16] O. Carp, C.L. Huisman, A. Reller, Photoinduced reactivity of titanium dioxide, Prog. Solid State Chem. 32 (2004) 33-177.
[17] H. Zhang, J.F. Banfield, Understanding Polymorphic Phase Transformation Behavior during Growth of Nanocrystalline Aggregates: Insights from TiO2, J Phys Chem B. 104 (2000) 3481-3487.
[18] H. Zhang, J. F. Banfield, Thermodynamic analysis of phase stability of nanocrystalline titania, J. Mater Chem. 8 (1998) 2073-2076.
[19] D.C. Hurum, A.G. Agrios, K.A. Gray, T. Rajh, M.C. Thurnauer, Explaining the Enhanced Photocatalytic Activity of Degussa P25 Mixed-Phase TiO2 Using EPR, J Phys Chem B. 107 (2003) 4545-4549.
[20] A.L. Linsebigler, G. Lu, J. Yates T., Photocatalysis on TiO2 Surface: Principles, Mechanism, and Selected Results, Chem. Rev. 95 (1995) 735-758.
[21] G.A. Tompsett, G.A. Bowmaker, R.P. Cooney, J.B. Metson, K.A. Rodgers, J.M. Seakins, The Raman spectrum of brookite, TiO2 (Pbca, Z = 8), J. Raman Spectrosc. 26 (1995) 57-62.
[22] R. Leary, A. Westwood, Carbonaceous nanomaterials for the enhancement of TiO2 photocatalysis, Carbon. 49 (2011) 741-772.
[23] K. Yu, J. Chen, Enhancing Solar Cell Efficiencies through 1-D Nanostructures, Nanoscale Res Lett. 4 (2009) 1-10.
[24] J. Liao, J. He, H. Xu, D. Kuang, C. Su, Effect of TiO2 morphology on photovoltaic performance of dye-sensitized solar cells: nanoparticles, nanofibers, hierarchical spheres and ellipsoid spheres, J. Mater. Chem. 22 (2012) 7910-7918.
[25] R.I. Bickley, T. Gonzalez-Carreno, J.S. Lees, L. Palmisano, R.J.D. Tilley, A structural investigation of titanium dioxide photocatalysts, J. Solid State Chem. 92 (1991) 178-190.
[26] R. Su, R. Bechstein, L. SA¸, R.T. Vang, M. Sillassen, B. EsbjArnsson, A. Palmqvist, F. Besenbacher, How the Anatase-to-Rutile Ratio Influences the Photoreactivity of TiO2, J. Phys. Chem. C. 115 (2011) 24287-24292.
[27] R.H. West, G.J.O. Beran, W.H. Green, M. Kraft, First-Principles Thermochemistry for the Production of TiO2 from TiCl4, J Phys Chem A. 111 (2007) 3560-3565.
[28] X. Chen, S.S. Mao, Titanium Dioxide Nanomaterials: Synthesis, Properties, Modifications, and Applications, Chem. Rev. 107 (2007) 2891-2959.
[29] R. Sui, P. Charpentier, Synthesis of Metal Oxide Nanostructures by Direct Sol-Gel Chemistry in Supercritical Fluids, Chem. Rev. 112 (2012) 3057-3082.
94
[30] B. Gao, G.Z. Chen, G. Li Puma, Carbon nanotubes/titanium dioxide (CNTs/TiO2) nanocomposites prepared by conventional and novel surfactant wrapping sol–gel methods exhibiting enhanced photocatalytic activity, Appl. Catal. B: Environmental. 89 (2009) 503-509.
[31] S. Quaranta, D. Gozzi, M. Tucci, L. Lazzarini, A. Latini, Efficiency improvement and full characterization of dye-sensitized solar cells with MWCNT/anatase Schottky junctions, J. Power Sources. 204 (2012) 249-256.
[32] S.V.N.T. Kuchibhatla, A.S. Karakoti, D. Bera, S. Seal, One dimensional nanostructured materials, Prog. Mater. Sci 52 (2007) 699-913.
[33] S. Iijima, Helical microtubules of graphitic carbon, Nature. 354 (1991) 56-58.
[34] M. Meyyappan, Carbon nanotubes: Science and Applications, (2005).
[35] T.W. Odom, J. Huang, P. Kim, C.M. Lieber, Structure and Electronic Properties of Carbon Nanotubes, J Phys Chem B. 104 (2000) 2794.
[36] T.Y. Lee, P.S. Alegaonkar, J. Yoo, Fabrication of dye sensitized solar cell using TiO2 coated carbon nanotubes, Thin Solid Films. 515 (2007) 5131-5135.
[37] Green Chemistry using Liquid and Supercritical Carbon Dioxide, Oxford University Press, New York, 2003.
[38] J. Ebelmen J., Memoire sur de nouvelles combinaisons de l'acide borique avec le ethers, et sur l'ethersurfuranx, Annal. de Chimie. 16 (1846) 331.
[39] L.L. Hench, J.K. West, The sol-gel process, Chem. Rev. 90 (1990) 33-72.
[40] C.J. Brinker, Sol-Gel Science : The Physics and Chemistry of Sol-Gel Processing, Academic Press, Boston, 1990.
[41] D. Birnie, N.J. Bendzko, 1H and 13C NMR observation of the reaction of acetic acid with titanium isopropoxide, Mater. Chem. Phys. 59 (1999) 26-35.
[42] D. Birnie, Esterification kinetics in titanium isopropoxide-acetic acid solutions, J. Mater. Sci. 35 (2000) 367-374.
[43] R. Parra, M.S. Góes, M.S. Castro, E. Longo, P.R. Bueno, J.A. Varela, Reaction Pathway to the Synthesis of Anatase via the Chemical Modification of Titanium Isopropoxide with Acetic Acid, Chem. Mater. 20 (2007) 143-150.
[44] S. Doeuff, M. Henry, C. Sanchez, J. Livage, Hydrolysis of titanium alkoxides: Modification of the molecular precursor by acetic acid, J. Non Cryst. Solids. 89 (1987) 206-216.
95
[45] R. Sui, V. Thangadurai, C.P. Berlinguette, Simple Protocol for Generating TiO2 Nanofibers in Organic Media, Chem. Mater. 20 (2008) 7022-7030.
[46] K. Lee K.-M., C. Hu C.-W., H. Chen H.-W., K. Ho K.C., Incorporating carbon nanotube in a low-temperature fabrication process for dye-sensitized TiO2 solar cells, Solar Energy Mater. Solar Cells. 92 (2008) 1628-1633.
[47] S. Fogden, R. Verdejo, B. Cottam, M. Shaffer, Purification of single walled carbon nanotubes: The problem with oxidation debris, Chem. Phys. Lett. 460 (2008) 162-167.
[48] R. Sui, A.S. Rizkalla, P.A. Charpentier, Formation of Titania Nanofibers: A Direct Sol-Gel Route in Supercritical CO2, Langmuir. 21 (2005) 6150-6153.
[49] E. Alonso, I. Montequi, S. Lucas, M.J. Cocero, Synthesis of titanium oxide particles in supercritical CO2: Effect of operational variables in the characteristics of the final product, J. Supercrit. Fluids. 39 (2007) 453-461.
[50] D. Mayo, Course Notes on the Interpretation of Infrared and Raman Spectra, Wiley-Interscience, Hoboken, N.J, 2004.
[51] R. Sui, A. Rizkalla, P.A. Charpentier, Experimental study on the morphology and porosity of TiO2 aerogels synthesized in supercritical carbon dioxide, Microporous and Mesoporous Mater. 142 (2011) 688-695.
[52] R. Sui, A.S. Rizkalla, P.A. Charpentier, FTIR Study on the Formation of TiO2 Nanostructures in Supercritical CO2, J Phys Chem B. 110 (2006) 16212-16218.
[53] M. Fernandez-Garca, X. Wang, C. Belver, J.C. Hanson, J.A. Rodriguez, Anatase-TiO2 Nanomaterials: Morphological/Size Dependence of the Crystallization and Phase Behavior Phenomena, J. Phys. Chem. C. 111 (2007) 674-682.
[54] W F Zhang and Y L He and M S Zhang and Z Yin and,Q.Chen, Raman scattering study on anatase TiO2 nanocrystals, J. Phys. D. 33 (2000) 912.
[55] S. Kelly, F.H. Pollak, M. Tomkiewicz, Raman Spectroscopy as a Morphological Probe for TiO2 Aerogels, J Phys Chem B. 101 (1997) 2730-2734.
[56] Y. Yu, J.C. Yu, J. Yu, Y. Kwok, Y. Che, J. Zhao, L. Ding, W. Ge, P. Wong, Enhancement of photocatalytic activity of mesoporous TiO2 by using carbon nanotubes, Appl. Catal. A: General. 289 (2005) 186-196.
[57] D. Bersani, P.P. Lottici, X. Ding, Phonon confinement effects in the Raman scattering by TiO2 nanocrystals, Appl. Phys. Lett. 72 (1998) 73-75.

96
[58] Y. Yu, J.C. Yu, J.G. Yu, Y.C. Kwok, Y.K. Che, J.C. Zhao, L. Ding, W.K. Ge, P.K. Wong, Enhancement of photocatalytic activity of mesoporous TiO2 by using carbon nanotubes, Appl. Catal. A. 289 (2005) 186-196.
[59] H. Jensen, K.D. Joensen, S.B. Iversen, E.G. Søgaard, Low Temperature Synthesis of Metal Oxides by a Supercritical Seed Enhanced Crystallization (SSEC) Process, Ind Eng Chem Res. 45 (2006) 3348-3353.
[60] Z. Liu, B. Han, Synthesis of Carbon-Nanotube Composites Using Supercritical Fluids and Their Potential Applications, Adv. Mater. (2009) 825-829.
[61] J. Halme, P. Vahermaa, K. Miettunen, P. Lund, Device Physics of Dye Solar Cells, Adv Mater. 22 (2010) E210-E234.
[62] M.A. Green, Accuracy of analytical expressions for solar cell fill factors, Solar Cells. 7 (1982) 337-340.
[63] R. Kern, R. Sastrawan, J. Ferber, R. Stangl, J. Luther, Modeling and interpretation of electrical impedance spectra of dye solar cells operated under open-circuit conditions, Electrochim. Acta. 47 (2002) 4213-4225.
[64] J. Bisquert, Theory of the Impedance of Electron Diffusion and Recombination in a Thin Layer, J Phys Chem B. 106 (2002) 325-333.
[65] M. Adachi, M. Sakamoto, J. Jiu, Y. Ogata, S. Isoda, Determination of Parameters of Electron Transport in Dye-Sensitized Solar Cells Using Electrochemical Impedance Spectroscopy, The J Phys Chem B. 110 (2006) 13872-13880.
[66] J. Bisquert, G. Garcia-Belmonte, F. Fabregat-Santiago, N.S. Ferriols, P. Bogdanoff, E.C. Pereira, Doubling Exponent Models for the Analysis of Porous Film Electrodes by Impedance. Relaxation of TiO2 Nanoporous in Aqueous Solution, J Phys Chem B. 104 (2000) 2287-2298.
[67] S. Ito, T.N. Murakami, P. Comte, P. Liska, C. Grätzel, M.K. Nazeeruddin, M. Grätzel, Fabrication of thin film dye sensitized solar cells with solar to electric power conversion efficiency over 10%, Thin Solid Films. 516 (2008) 4613-4619.
[68] P. Hou, C. Liu, H. Cheng, Purification of carbon nanotubes, Carbon. 46 (2008) 2003-2025.
[69] E. Dell'Orto, L. Raimondo, A. Sassella, A. Abbotto, Dye-sensitized solar cells: spectroscopic evaluation of dye loading on TiO2 , J. Mater. Chem. 22 (2012) 11364-11369.
[70] Y. Chiba, A. Islam, Y. Watanabe, R. Komiya, N. Koide, L. Han, Dye-Sensitized Solar Cells with Conversion Efficiency of 11.1%, Jpn. J. Appl. Phys. 45 L638.
[71] S. Lee, I. Cho, J.H. Lee, D.H. Kim, D.W. Kim, J.Y. Kim, H. Shin, J. Lee, H.S. Jung, N. Park, K. Kim, M.J. Ko, K.S. Hong, Two-Step Sol-Gel Method-Based TiO2 Nanoparticles with
97
Uniform Morphology and Size for Efficient Photo-Energy Conversion Devices, Chem. Mater. 22 (2010) 1958-1965.
[72] J. Chen, B. Li, J. Zheng, J. Zhao, Z. Zhu, - Role of Carbon Nanotubes in Dye-Sensitized TiO2-Based Solar Cells, - J. Phys. Chem. C. 116 (2012) 14848-14856.
[73] B. Koo, D. Lee, H. Kim, W. Lee, J. Song, H. Kim, Seasoning effect of dye-sensitized solar cells with different counter electrodes, J Electroceram. 17 (2006) 79-82.
[74] H. Yang, S. Wu, Y. Duan, X. Fu, J. Wu, Surface modification of CNTs and enhanced photocatalytic activity of TiO2 coated on hydrophilically modified CNTs, Appl. Surf. Sci. 258 (2012) 3012-3018.
[75] F. Fabregat-Santiago, J. Bisquert, E. Palomares, L. Otero, D. Kuang, S.M. Zakeeruddin, M. Grätzel, Correlation between Photovoltaic Performance and Impedance Spectroscopy of Dye-Sensitized Solar Cells Based on Ionic Liquids, J. Phys. Chem. C. 111 (2007) 6550-6560.
[76] J. Liao, B. Lei, D. Kuang, C. Su, Tri-functional hierarchical TiO2 spheres consisting of anatase nanorods and nanoparticles for high efficiency dye-sensitized solar cells, Energy Environ. Sci. 4 (2011) 4079-4085.