Embed Size (px)
Citation preview

STATE TRENDS IN
EDUCATION FINANCE
2017 NCSL MIDWEST STATES FISCAL LEADERS MEETING
March 10-11, 2017
The James Hotel | Chicago, Illinois
Advancements in State Education
Finance Systems Intergovernmental aid formulas
Cost differentials
National Topography of Education
Finance Trends in current spending
Sources of revenue
Education employment
National Topography of Education
Finance
Trends in current spending
Sources of revenue
Education employment
bit.ly/midwest-state-expenditures
State Expenditures: K-12 vs. Medicaid
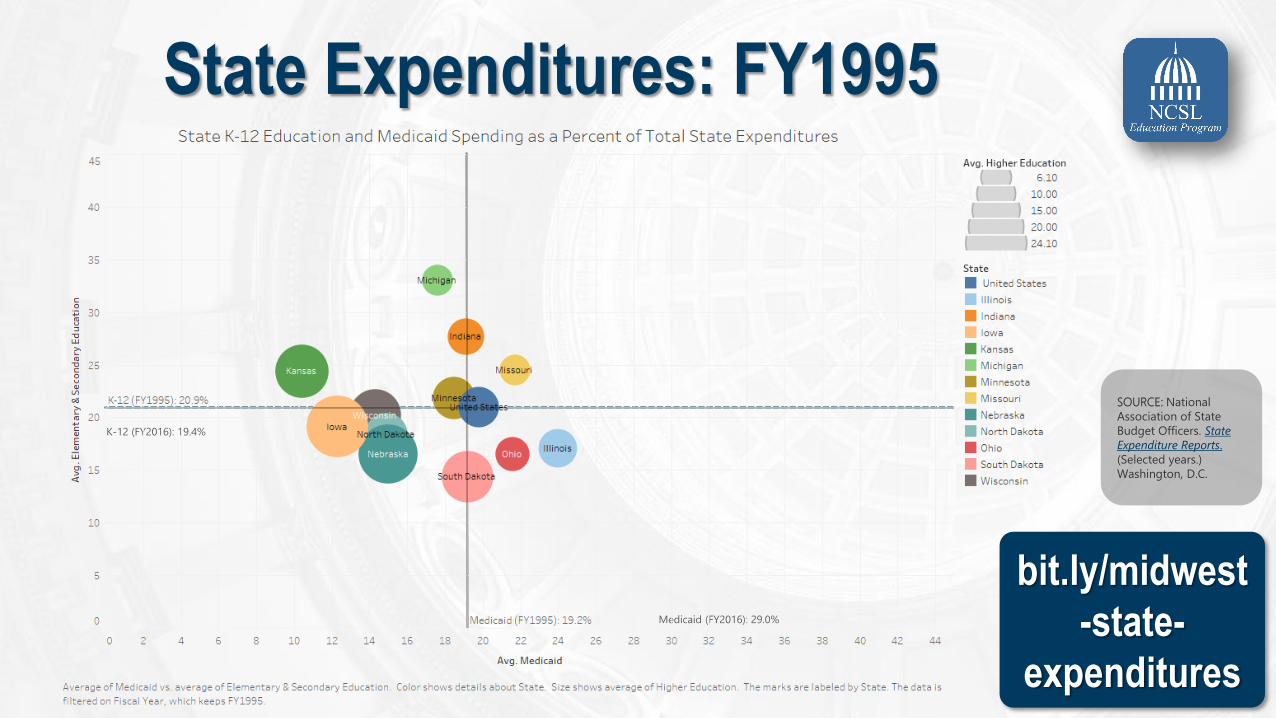
State Expenditures: FY1995
bit.ly/midwest
-state-
expenditures
K-12 (FY2016): 19.4%
Medicaid (FY2016): 29.0%
SOURCE: National
Association of State
Budget Officers. State
Expenditure Reports.
(Selected years.)
Washington, D.C.
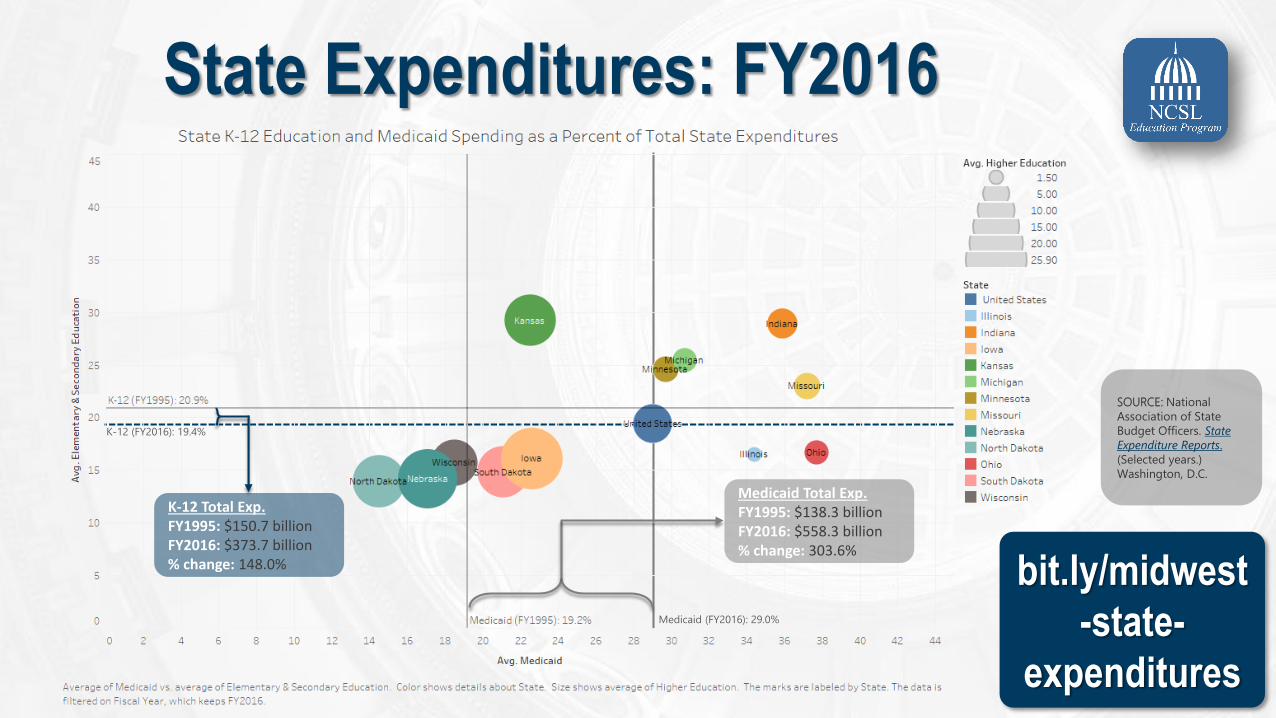
State Expenditures: FY2016
bit.ly/midwest
-state-
expenditures
K-12 (FY2016): 19.4%
Medicaid (FY2016): 29.0%
Medicaid Total Exp.FY1995: $138.3 billionFY2016: $558.3 billion% change: 303.6%
K-12 Total Exp.FY1995: $150.7 billionFY2016: $373.7 billion% change: 148.0%
SOURCE: National
Association of State
Budget Officers. State
Expenditure Reports.
(Selected years.)
Washington, D.C.
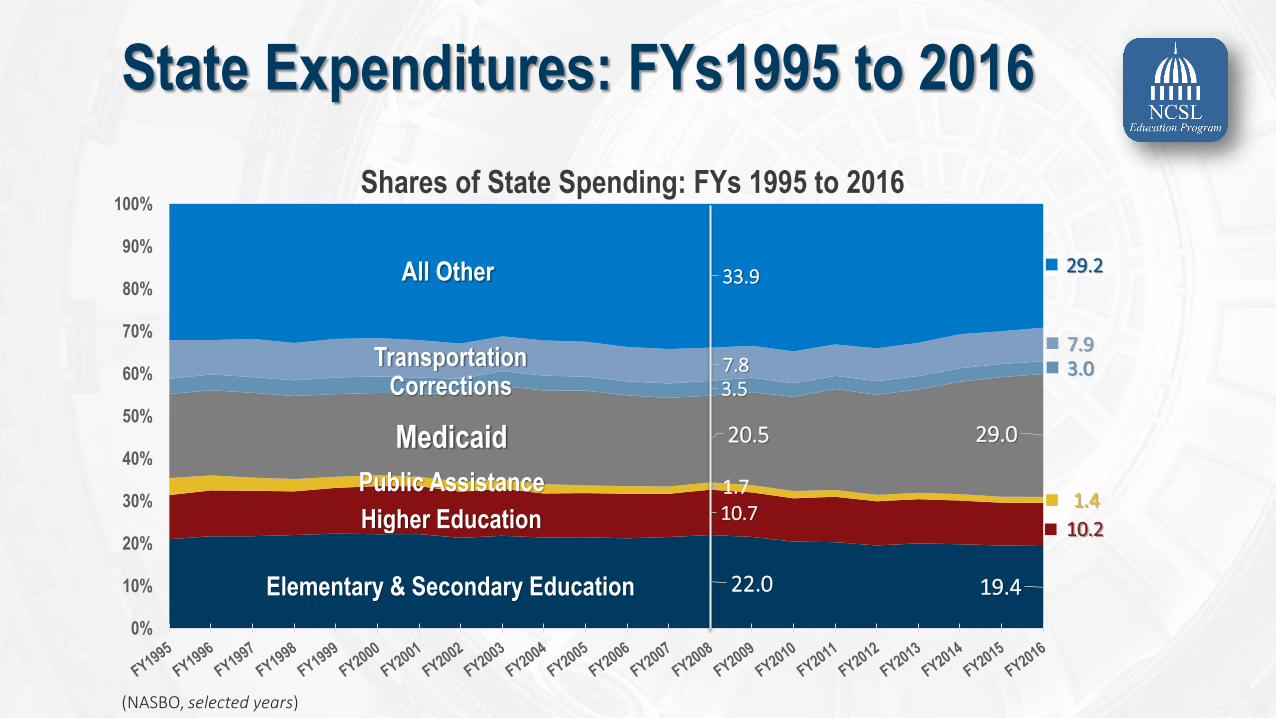
State Expenditures: FYs1995 to 2016
Elementary & Secondary Education 22.0 19.4
Higher Education 10.710.2
Public Assistance 1.71.4
Medicaid 20.5 29.0
Corrections 3.53.0Transportation 7.87.9
All Other 33.929.2
0%
10%
20%
30%
40%
50%
60%
70%
80%
90%
100%Shares of State Spending: FYs 1995 to 2016
(NASBO, selected years)
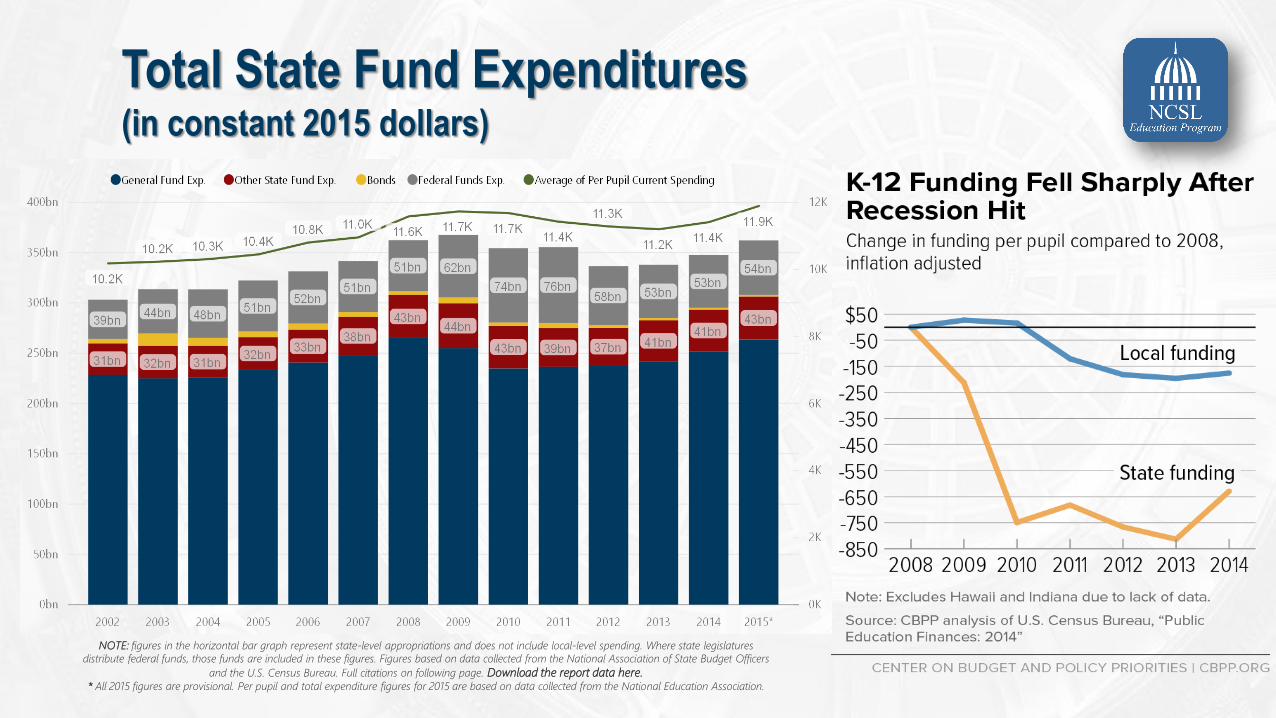
Total State Fund Expenditures(in constant 2015 dollars)
NOTE: figures in the horizontal bar graph represent state-level appropriations and does not include local-level spending. Where state legislatures
distribute federal funds, those funds are included in these figures. Figures based on data collected from the National Association of State Budget Officers
and the U.S. Census Bureau. Full citations on following page. Download the report data here.* All 2015 figures are provisional. Per pupil and total expenditure figures for 2015 are based on data collected from the National Education Association.
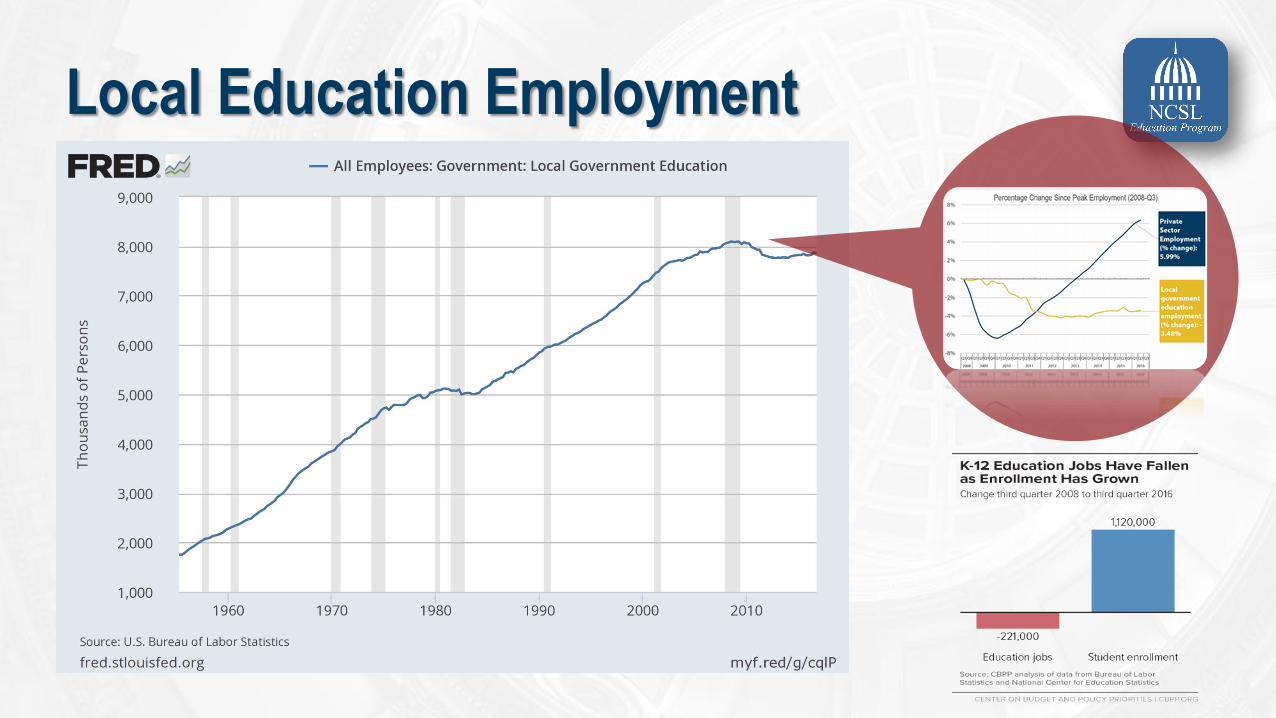
Local Education Employment
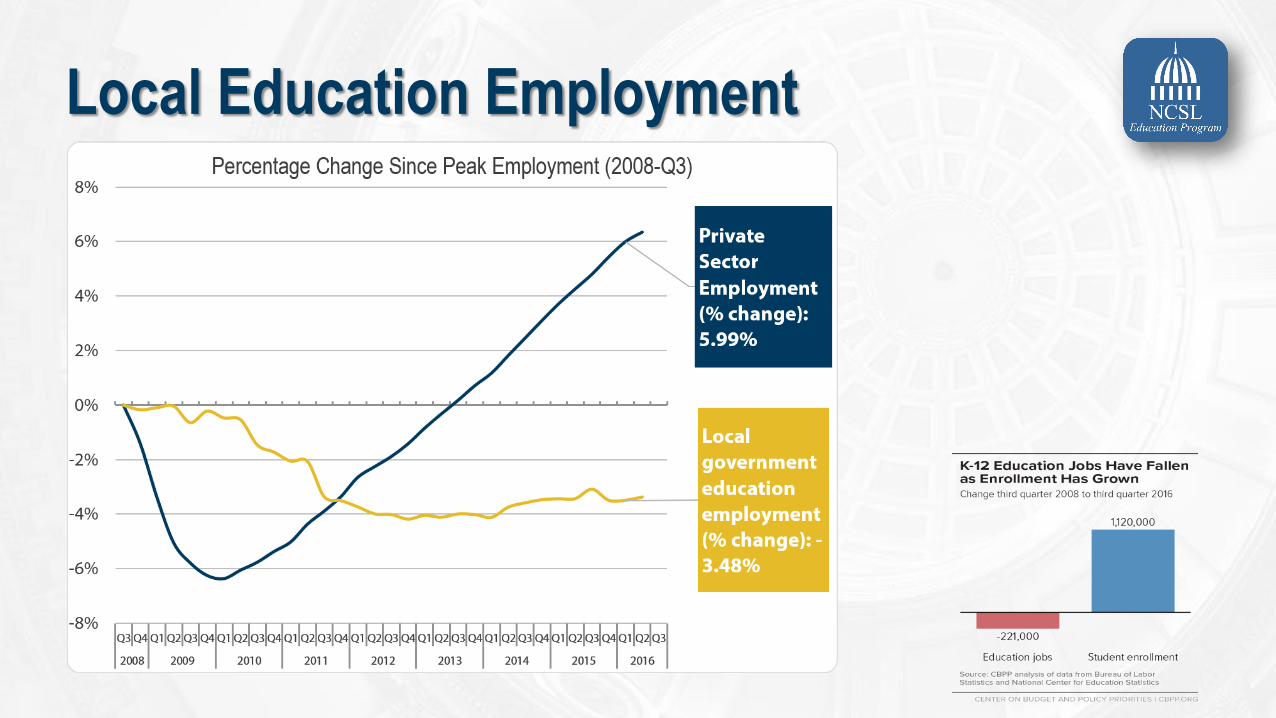
Local Education Employment
Advancements in State
Education Finance Systems
Intergovernmental aid formulas
Cost differentials
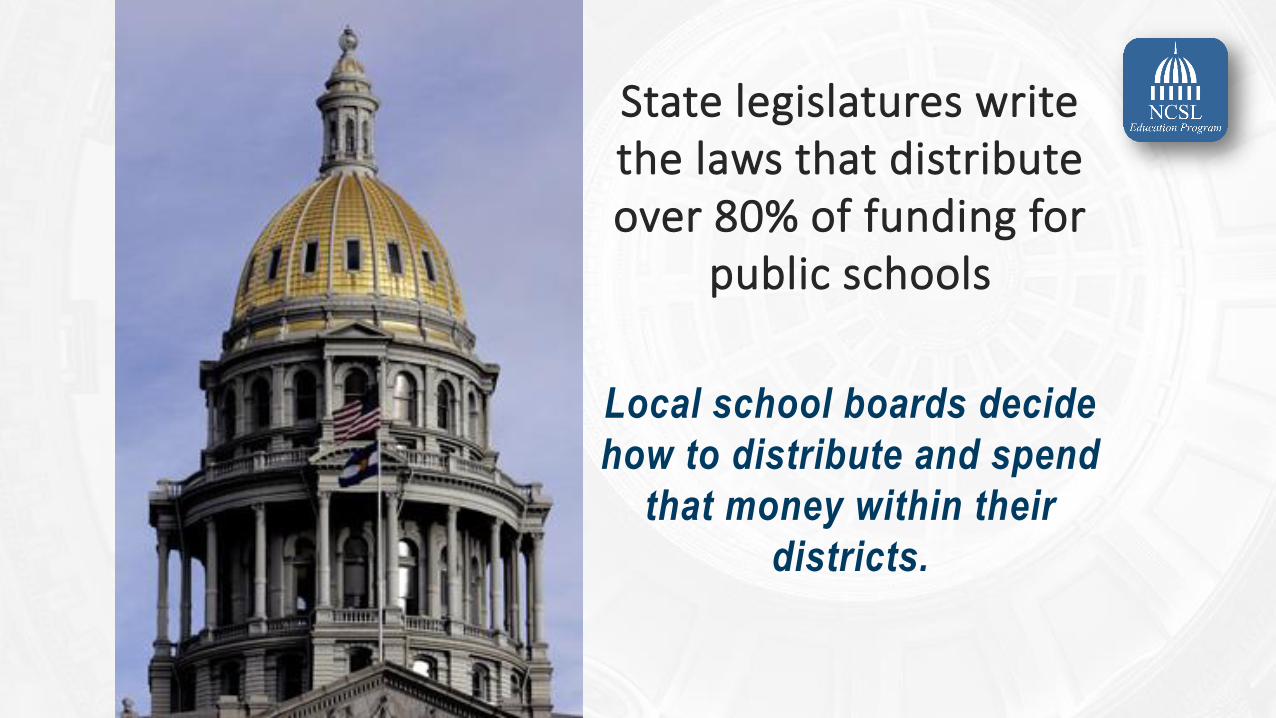
State legislatures write the laws that distribute over 80% of funding for
public schools
Local school boards decide
how to distribute and spend
that money within their
districts.
…while only less than 10% of total funding, enjoy high level of leverage in compelling the adoption of certain policies at the state and local levels
Federal dollars…
(Cunningham, 2014.)
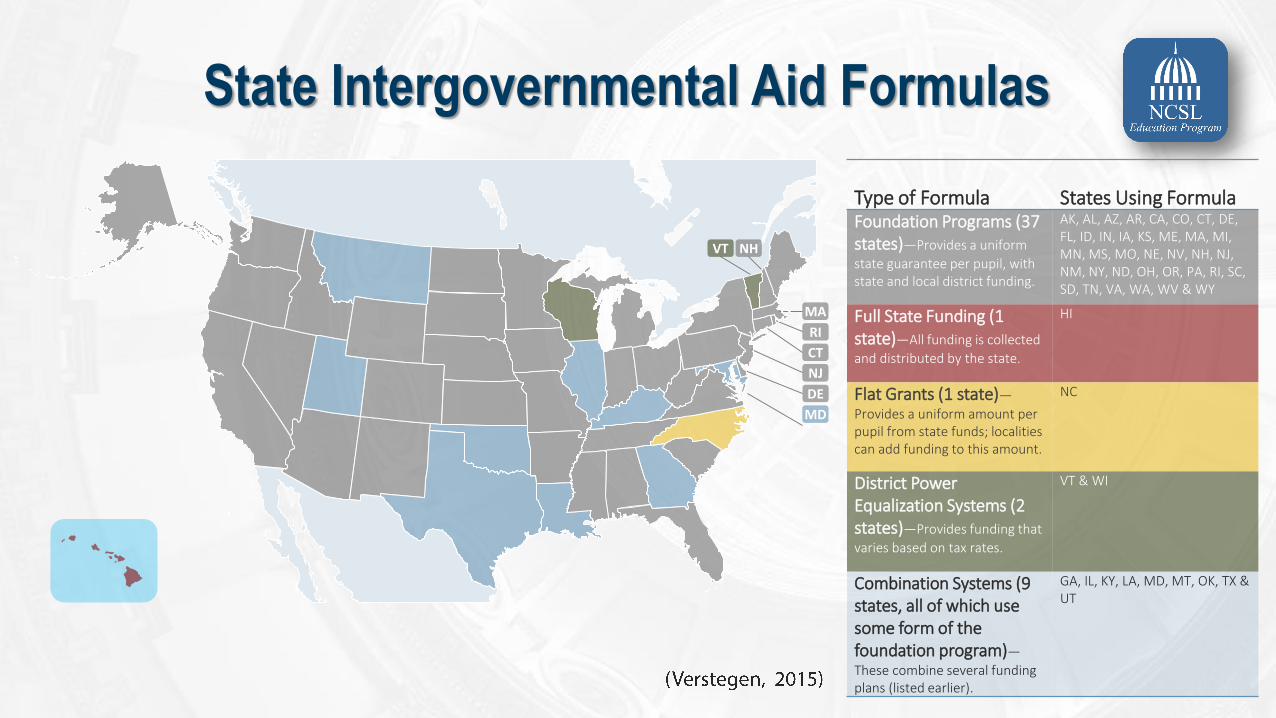
State Intergovernmental Aid Formulas
Type of Formula States Using FormulaFoundation Programs (37 states)—Provides a uniform
state guarantee per pupil, with state and local district funding.
AK, AL, AZ, AR, CA, CO, CT, DE, FL, ID, IN, IA, KS, ME, MA, MI, MN, MS, MO, NE, NV, NH, NJ, NM, NY, ND, OH, OR, PA, RI, SC, SD, TN, VA, WA, WV & WY
Full State Funding (1 state)—All funding is collected
and distributed by the state.
HI
Flat Grants (1 state)—
Provides a uniform amount per pupil from state funds; localities can add funding to this amount.
NC
District Power Equalization Systems (2 states)—Provides funding that
varies based on tax rates.
VT & WI
Combination Systems (9 states, all of which use some form of the foundation program)—
These combine several funding plans (listed earlier).
GA, IL, KY, LA, MD, MT, OK, TX & UT
MD
RI
CT
MA
NJ
NHVT
DE
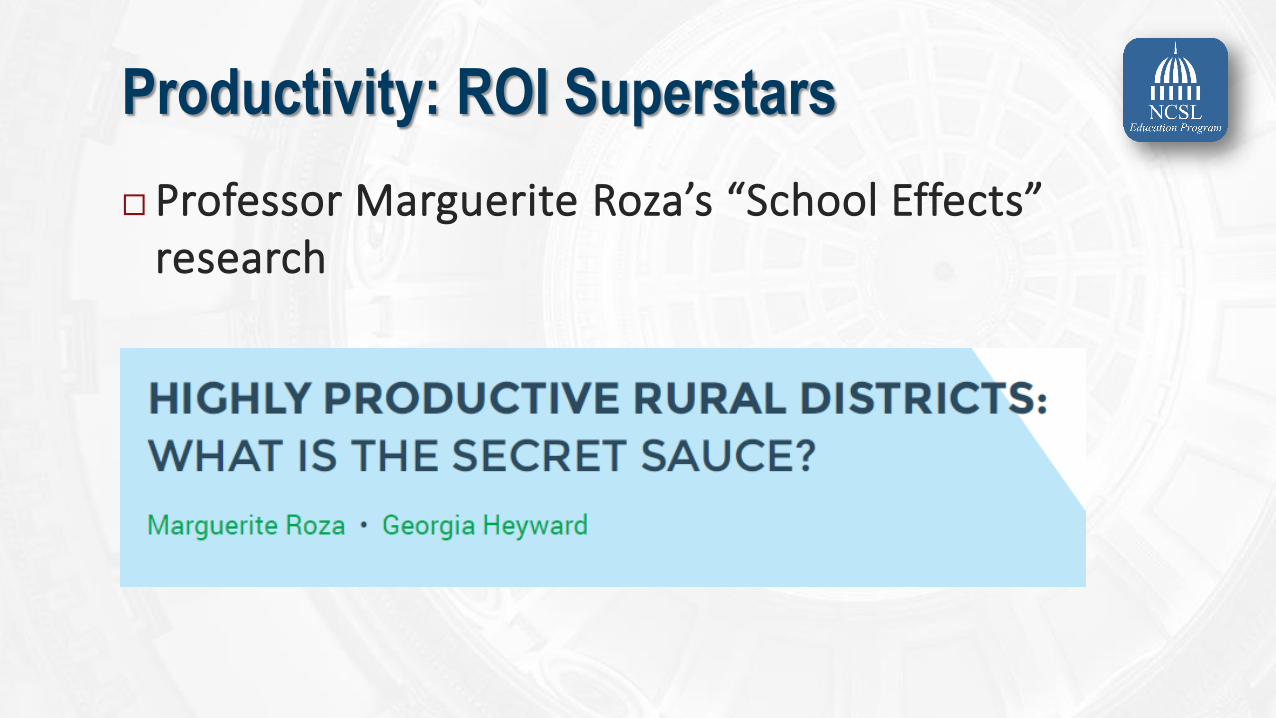
Professor Marguerite Roza’s “School Effects” research
Productivity: ROI Superstars
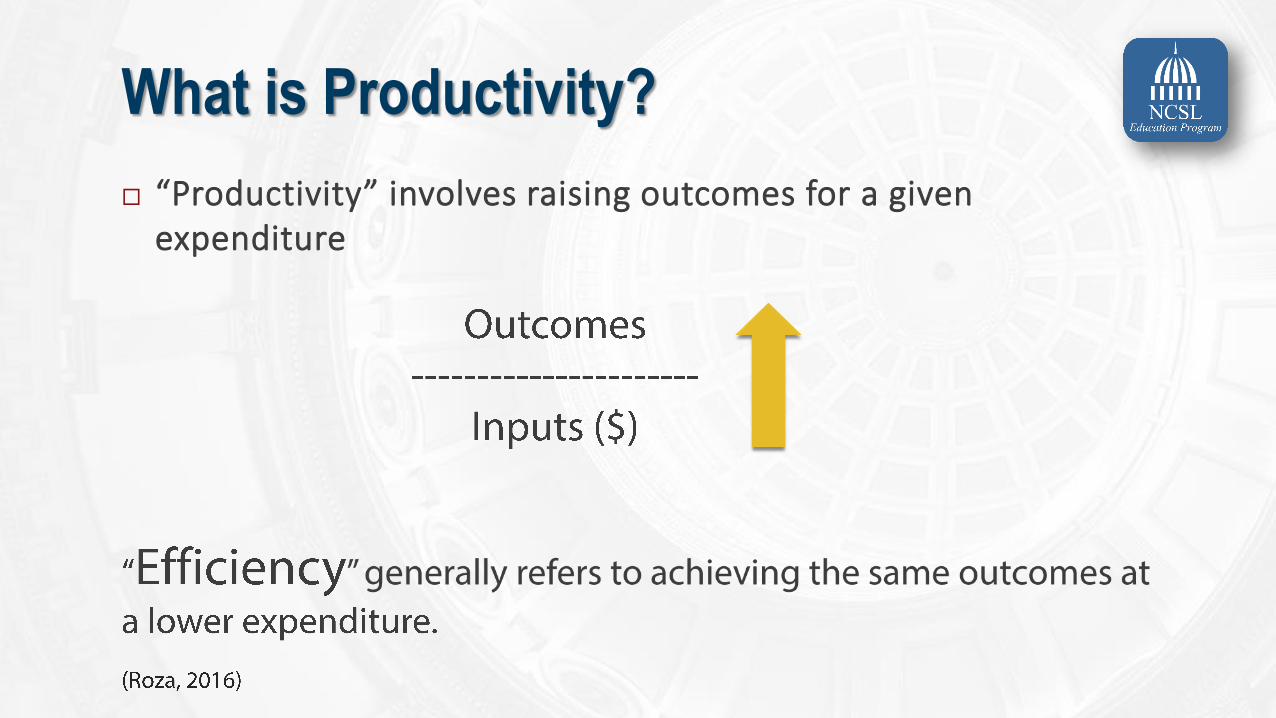
“Productivity” involves raising outcomes for a given expenditure
What is Productivity?
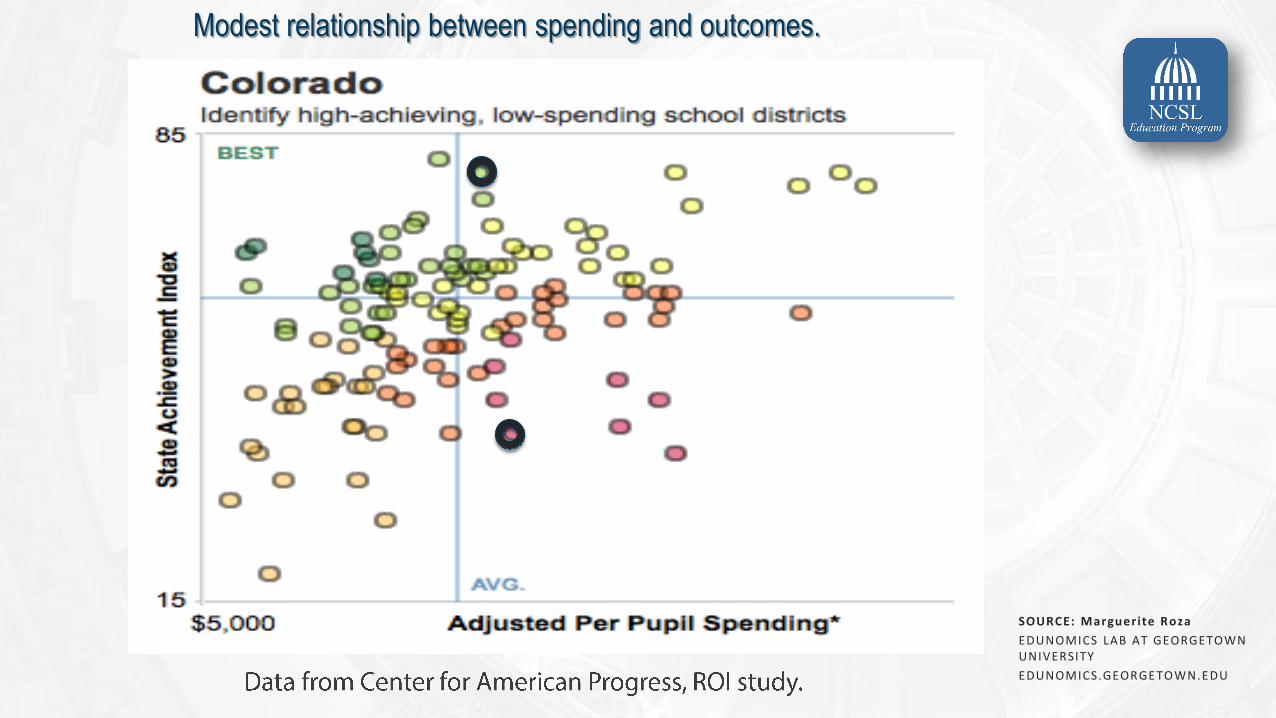
Modest relationship between spending and outcomes.
SOURCE: Marguer ite Roza
EDUNOMICS LAB AT GEORGETOWN UNIVERSITY
EDUNOMICS.GEORGETOWN.EDU
EDUNOMICS LAB AT GEORGETOWN UNIVERSITY
EDUNOMICS.GEORGETOWN.EDU
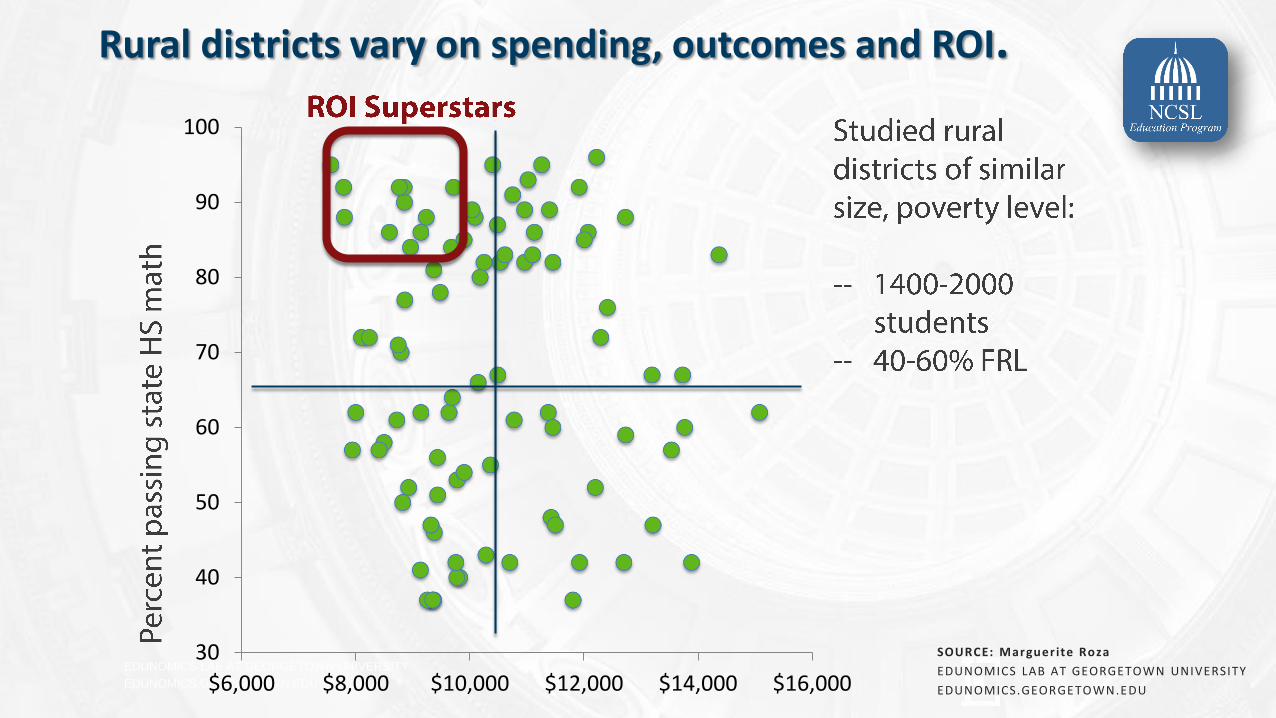
Rural districts vary on spending, outcomes and ROI.
30
40
50
60
70
80
90
100
$6,000 $8,000 $10,000 $12,000 $14,000 $16,000
SOURCE: Marguer ite Roza
EDUNOMICS LAB AT GEORGETOWN UNIVERSITY
EDUNOMICS.GEORGETOWN.EDU
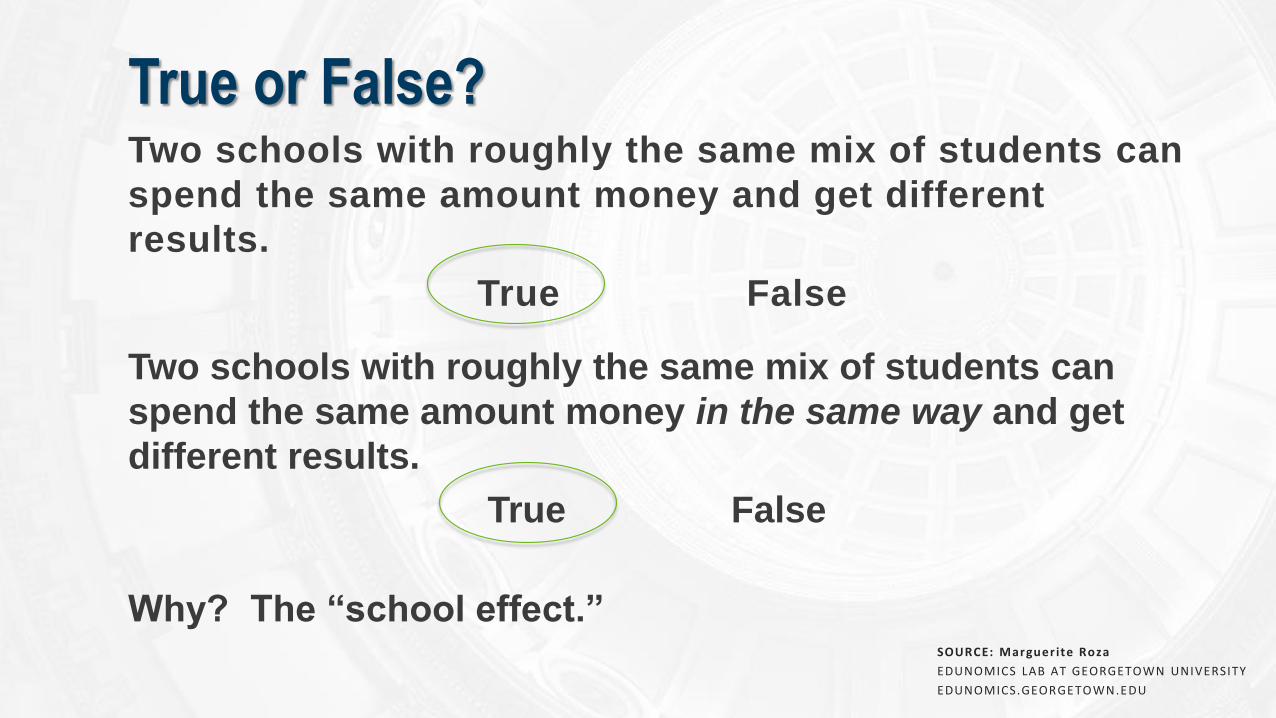
Two schools with roughly the same mix of students can
spend the same amount money and get different
results.
True False
True or False?
Two schools with roughly the same mix of students can
spend the same amount money in the same way and get
different results.
True False
Why? The “school effect.”SOURCE: Marguer ite Roza
EDUNOMICS LAB AT GEORGETOWN UNIVERSITY
EDUNOMICS.GEORGETOWN.EDU
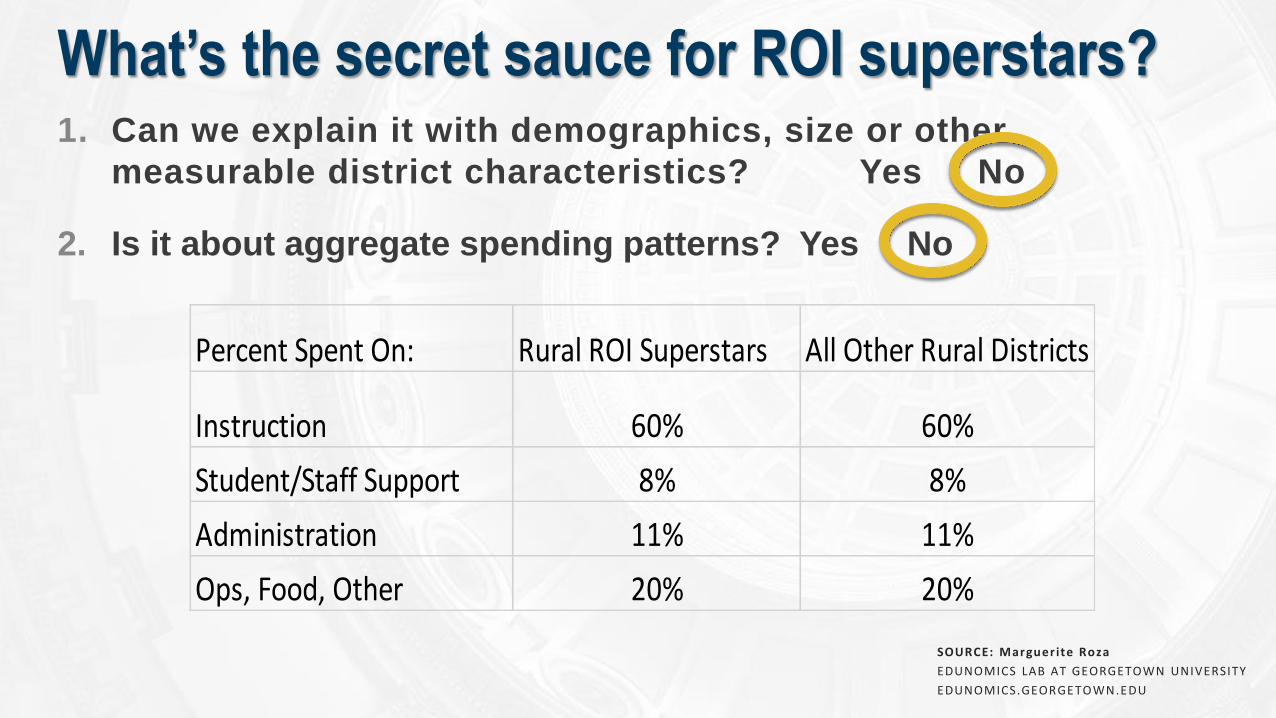
Percent Spent On: Rural ROI Superstars All Other Rural Districts
Instruction 60% 60%
Student/Staff Support 8% 8%
Administration 11% 11%
Ops, Food, Other 20% 20%
1. Can we explain it with demographics, size or other
measurable district characteristics? Yes No
What’s the secret sauce for ROI superstars?
2. Is it about aggregate spending patterns? Yes No
SOURCE: Marguer ite Roza
EDUNOMICS LAB AT GEORGETOWN UNIVERSITY
EDUNOMICS.GEORGETOWN.EDU
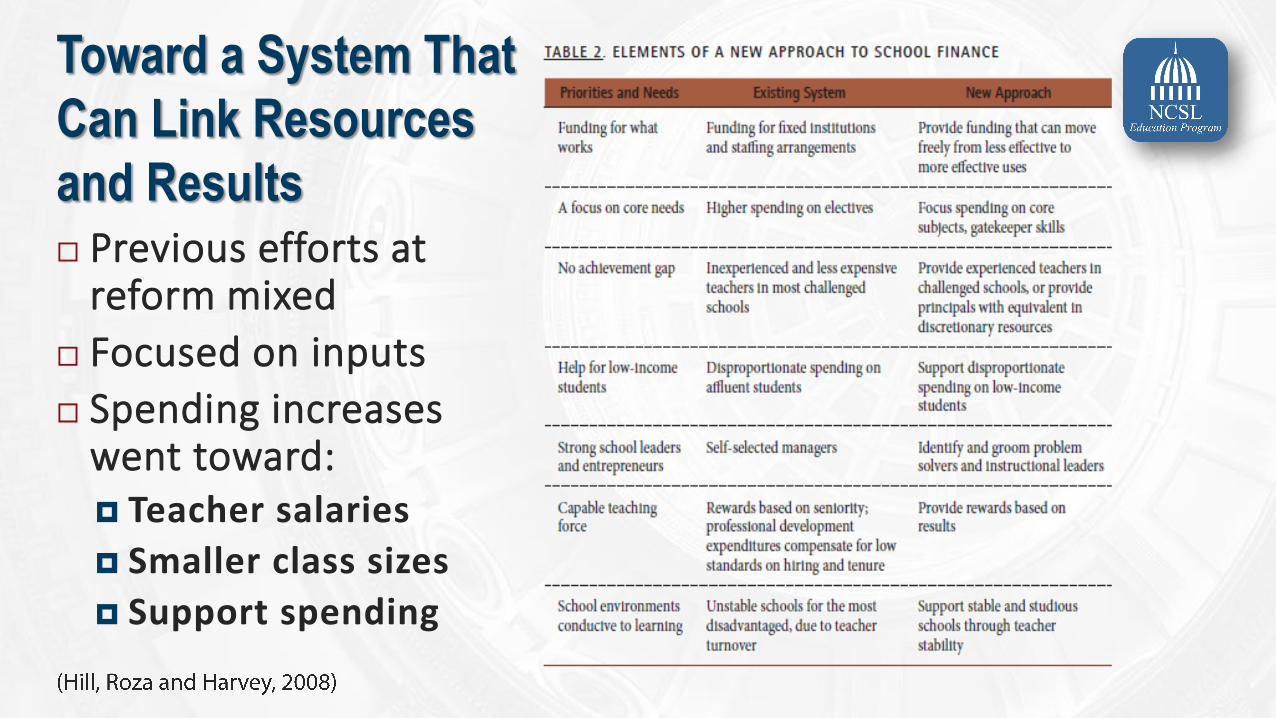
Toward a System That
Can Link Resources
and Results Previous efforts at
reform mixed
Focused on inputs
Spending increases went toward: Teacher salaries
Smaller class sizes
Support spending
Baker, Bruce D. “Wage Adjustments in State School Finance Policy: Do They Improve or Erode School Funding Equity?” Annual Meeting of the American Education Research Association . New York, NY, 2007.
Belfield, Clive R. “Cost-Benefit Analysis and Cost-Effectiveness Analysis.” Chap. 9 in Handbook of Research in Education Finance and Policy , edited by Helen F. Ladd and Margaret E. Goertz, 141–56. Abingdon: Routledge, 2015. 2nd Ed.
Cunningham, Deborah H. “School Finance and Learning: Are We Leveraging State Aid to Get All We Can Out of It?” Education Finance and Policy 9, no. 2 (April 2014): 109–15. doi:10.1162/edfp_a_00126.
Downes, Thomas A. and Leanna Stiefel. “Measuring Equity and Adequacy in School Finance.” Chap. 15 in Handbook of Research in Education Finance and Policy, edited by Helen F. Ladd and Margaret E. Goertz. Abingdon: Routledge, 2015. 2nd Ed.
Duncombe, William D., Phuong Nguyen-Hoang, and John M. Yinger. “Measurement of Cost Differentials.” Chap. 16 in Handbook of Research in Education Finance and Policy , edited by Helen F. Ladd and Margaret E. Goertz, 260–78. Abingdon: Routledge, 2015. 2nd Ed.
Duncombe, William D. and John M. Yinger. “Does
School District Consolidation Cut Costs?” Education Finance and Policy 2, no. 4 (October 2007): 341–75. doi:10.1162/edfp.2007.2.4.341.
———. “School District Consolidation: The Benefits and Costs.” The School Administrator 67, no. 5 (May 2010). Accessed January 20, 2017.
Graves, Bill. “ The Collision of Athletics and Consolidation.” The School Administrator 67, no. 5 (May 2010). Accessed January 23, 2017.
Hill, Paul T., Marguerite Roza, and James Harvey. Facing the Future: Financing Productive Schools. School Finance Redesign Project. Seattle, WA: Center on Reinventing Public Education, 2008.
Howley, Craig, Jerry Johnson, and Jennifer Petrie. Consolidation of Schools and Districts: What the Research Says and What It Means . Boulder, CO: National Education Policy Center, 2011.
Jackson, Kirabo C., Rucker C. Johnson, and Claudia Persico. The Effects of School Spending On Educational and Economic Outcomes: Evidence from School Finance Reforms . n.p.: National Bureau of Economic Research, 2015. doi:10.3386/w20847.
Sources
National Association of State Budget Officers (NASBO). “Elementary and Secondary Education Expenditures.” State Expenditure Report (Selected Years). Washington, D.C.
Picus, Lawrence O., Margaret Goertz, and Allan Odden. “Intergovernmental Aid Formulas and Case Studies.” Chap. 17 in Handbook of Research in Education Finance and Policy , edited by Helen F. Ladd and Margaret E. Goertz. Abingdon: Routledge, 2015. 2nd Ed.
Rice, Jennifer King and Amy Ellen Schwartz. “Toward an Understanding of Productivity in Education.” Chap. 8 in Handbook of Research in Education Finance and Policy , edited by Helen F. Ladd and Margaret E. Goertz, 125–40. Abingdon: Routledge, 2015. 2nd Ed.
Roza, Marguerite and Georgia Heyward. Highly Productive Rural Districts: What Is the Secret Sauce? n.p.: Rural Opportunities Consortium of Idaho, 2015.
Spradlin, Terry E., Fatima R. Carson, Sara E. Hess, and Jonathan A. Plucker. Revisiting School District Consolidation Issues . Vol. 8. Bloomington, IN: Center for Evaluation & Education Policy, 2010.
Taylor, Lori. “Comparable Wage Index
(CWI).” Extending the National Center for Education Statistics CWI . College Station, Tex.: The Bush School of Government and Public Service, Texas A&M University, 2016.
U.S. Bureau of Labor Statistics. “Consumer Price Index (CPI).” July 19, 2008. Accessed July 21, 2016.
U.S. Census Bureau. “State-Level Tables.” Public Elementary–Secondary Education Finance Data (Selected Years) . Washington, D.C.
U.S. Department of Education, National Center for Education Statistics. “Public School Revenue Sources.” May 2013. Last modified April 2016. Accessed June 29, 2016.
———. “Table 203.20. Enrollment in Public Elementary and Secondary Schools, by Region, State, and Jurisdiction: Selected Years, Fall 1990 Through Fall 2025.” Common Core of Data (CCD) . Washington, D.C.: Digest of Education Statistics, 2015.
Verstegen, Deborah A. “A Quick Glance at School Finance: A 50 State Survey of School Finance Policies.” 2015. Accessed June 29, 2016.
Yinger, John, ed. Helping Children Left Behind: State Aid and the Pursuit of Educational Equity . Cambridge, MA: The MIT press, 2004.
Sources
Adams, Jacob E. Funding Student Learning: How to Align Education Resources with Student Learning Goals. National Working Group on Funding Student Learning, edited by Jacob E. Adams, Jr. Seattle, Wash.: School Finance Redesign Project, Center on Reinventing Public Education: University of Washington, 2008.
Boser, Ulrich. Return on Educational Investment: A District-by-District Evaluation of U.S. Educational Productivity .Washington, DC: Center for American Progress, 2011.
Sean P. Corcoran and William N. Evans. (2015) “Equity, Adequacy and the Evolving State Role in Education Finance,” Handbook of Research in Education Finance and Policy,
eds. Helen F. Ladd and Margaret E. Goertz, 365-367.
Lafortune, Julien, Jesse Rothstein, and Diane Whitmore Schanzenbach. School Finance Reform and the Distribution of Student Achievement. Working Paper No. 100-16. Berkeley, CA: Institute for Research on Labor and Employment, 2016.
Hanushek, Eric A., Jens Ruhose, and LudgerWoessmann. Economic Gains for U.S. States from Educational Reform. Working Paper 21770. Cambridge, MA: National Bureau of Economic Research, 2015.
Further Reading