Embed Size (px)
Citation preview
State of the Science: Land Use Modeling in Amazônia
(Accomplishments and Remaining Challenges)
By
R. Walker (MSU) and E. Moran (Indiana University)
with contributions from
Britaldo Soares-Filho, Stephen Walsh, and Peter Deadman
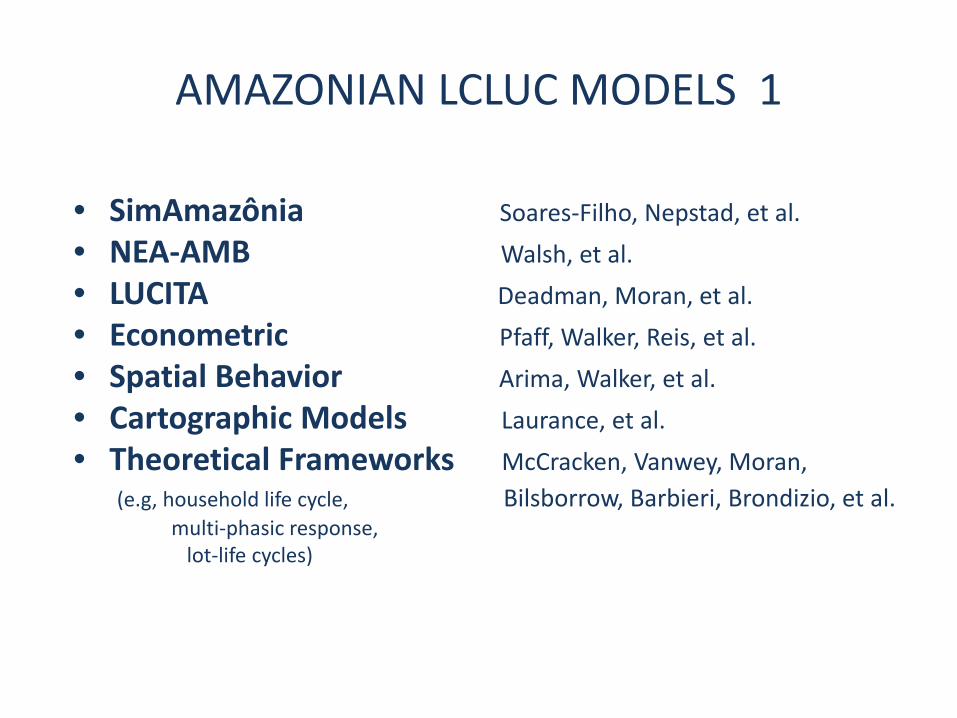
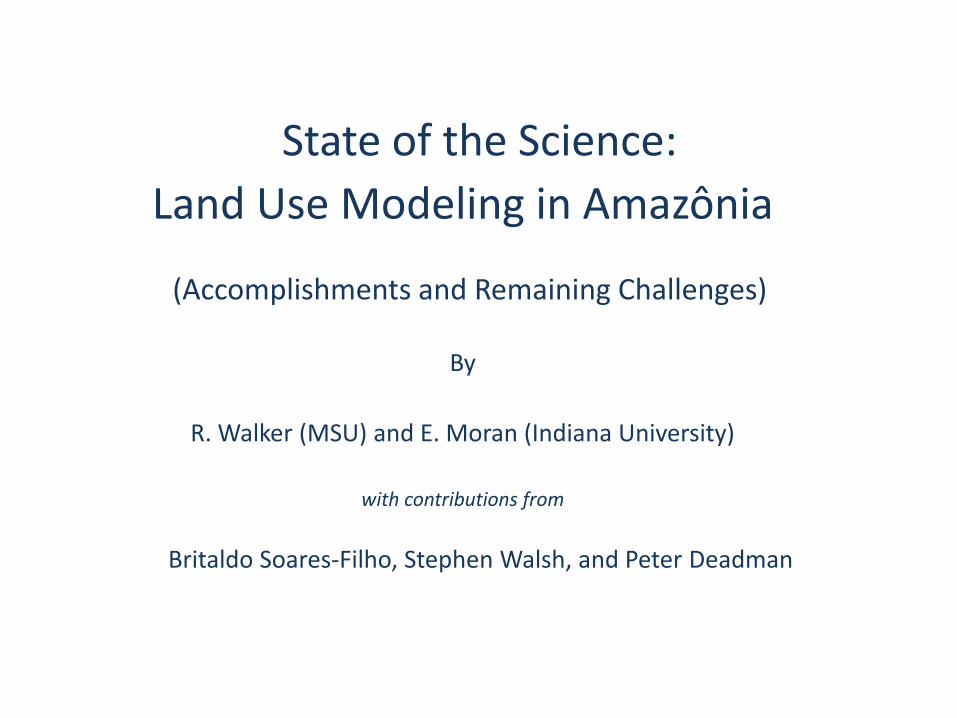
AMAZONIAN LCLUC MODELS 1
• SimAmazônia Soares-Filho, Nepstad, et al.
• NEA-AMB Walsh, et al.
• LUCITA Deadman, Moran, et al.
• Econometric Pfaff, Walker, Reis, et al.
• Spatial Behavior Arima, Walker, et al.
• Cartographic Models Laurance, et al.
• Theoretical Frameworks McCracken, Vanwey, Moran,(e.g, household life cycle, Bilsborrow, Barbieri, Brondizio, et al.
multi-phasic response,lot-life cycles)
MANY DIFFERENT MODELS
• Theoretical model:
may not be at all interested in the future, only the “present.” Theory building
• Projection model:
Not interested in theory,
only in the “future.” Focused on projection.
AMAZONIAN MODELS: the questions asked
Given X, what happens to Y?
projection models:
X is a scenario, and Y is a landscape of significance, e.g., AML
theoretical models:
X a variable setting (e.g, household structure) , and Y is also a landscape, more circumscribed
AMAZONIAN LCLUC MODELS 2
An ability and intention
1) To predict the future (projection)
-- or ---
2) To predict outcomes given specified conditions(sensitivity)
Computationally intensive modelingComputer “modeling”
AMAZONIAN LCLUC MODELS 3
• SimAmazônia Projection
• Econometric Projection
• NEA-AMB and LUCITA Theoretical/ “projection”
• Spatial Behavior Theoretical/ “projection”
Model structure and functionality
Result types
PROJECTION MODELS
1) SimAmazônia
2) Econometrics
SimAmazôniaA Spatially Explicit Simulation Model of Deforestation for the Amazon Basin
Amazon Scenarios Project
Universidade Federal de Minas Gerais
UF GWoods Hole Research Center
IPAM – INSTITUTO DE PESQUISAAMBIENTAL DA AMAZÔNIA
Soares-Filho, Nepstad et al.
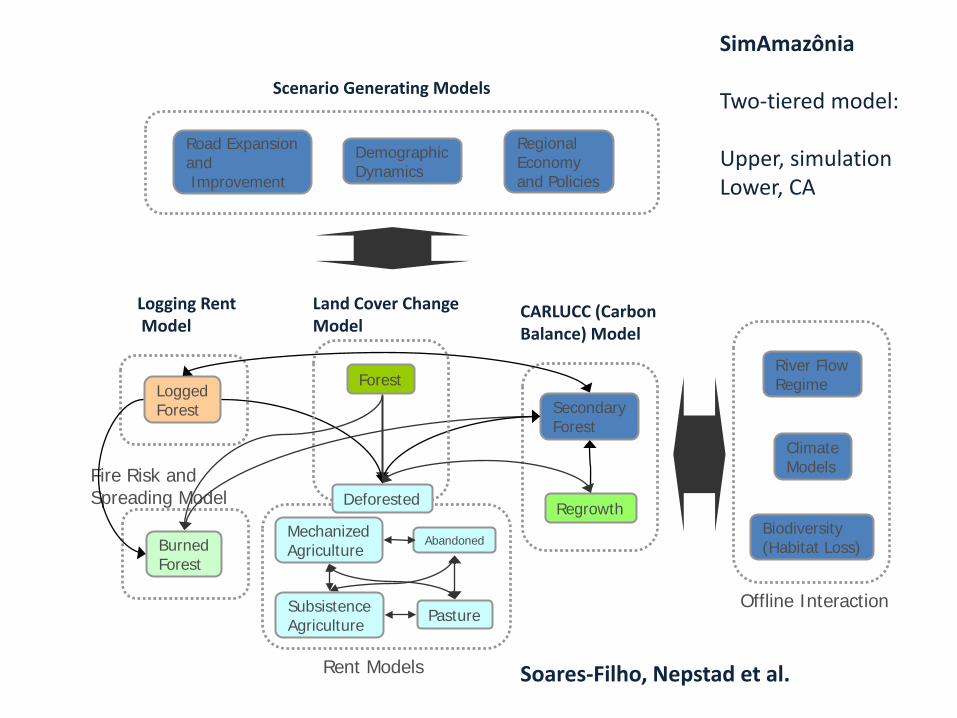
Rent Models
MechanizedAgriculture
SubsistenceAgriculture
Abandoned
PastureOffline Interaction
River FlowRegime
ClimateModels
Biodiversity(Habitat Loss)
Logging RentModel
LoggedForest
Fire Risk and Spreading Model
BurnedForest
SecondaryForest
Regrowth
CARLUCC (Carbon Balance) Model
RegionalEconomyand Policies
DemographicDynamics
Road ExpansionandImprovement
Scenario Generating Models
Forest
Deforested
Land Cover Change Model
Soares-Filho, Nepstad et al.
SimAmazônia
Two-tiered model:
Upper, simulation Lower, CA
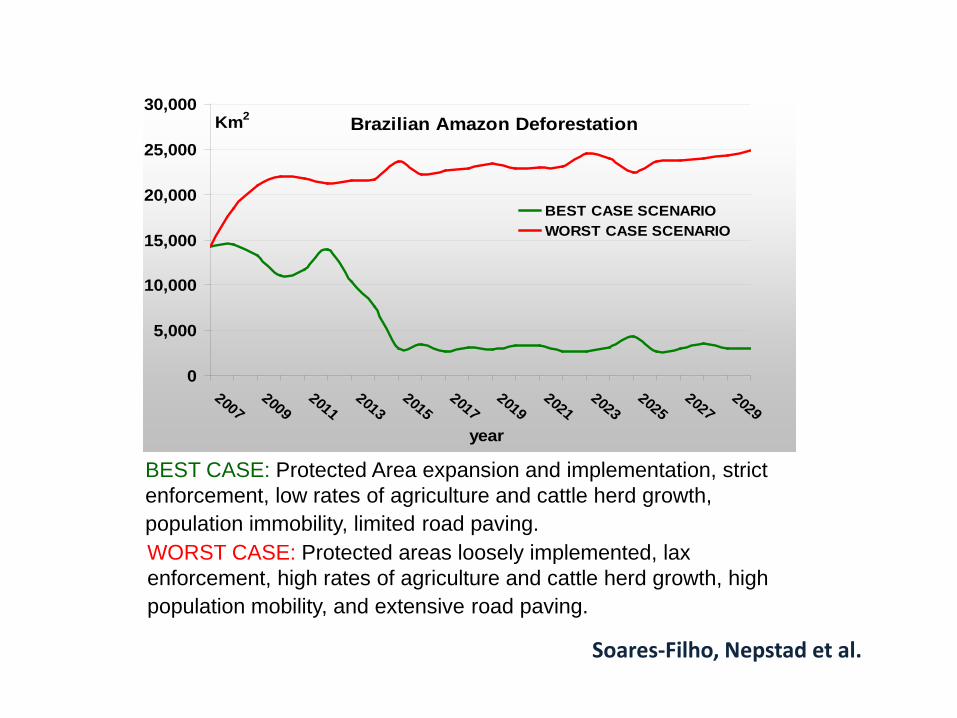
Brazilian Amazon Deforestation
0
5,000
10,000
15,000
20,000
25,000
30,000
20072009
20112013
20152017
20192021
20232025
20272029
year
Km2
BEST CASE SCENARIOWORST CASE SCENARIO
BEST CASE: Protected Area expansion and implementation, strict enforcement, low rates of agriculture and cattle herd growth, population immobility, limited road paving.WORST CASE: Protected areas loosely implemented, lax enforcement, high rates of agriculture and cattle herd growth, high population mobility, and extensive road paving.
Soares-Filho, Nepstad et al.
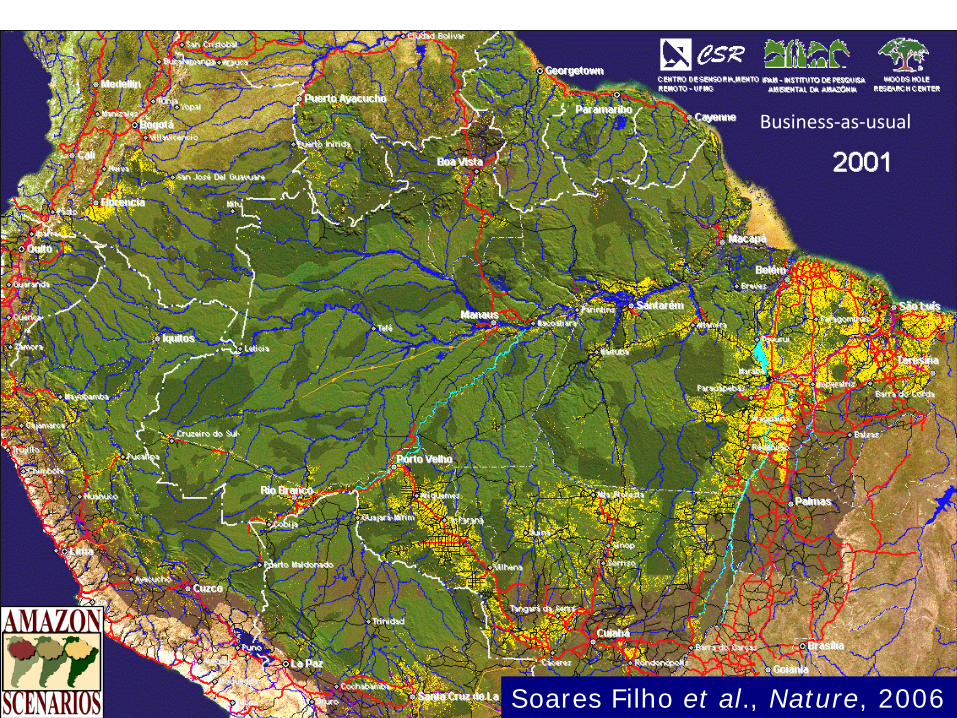
Business-as-usual
Soares Filho et al., Nature, 2006
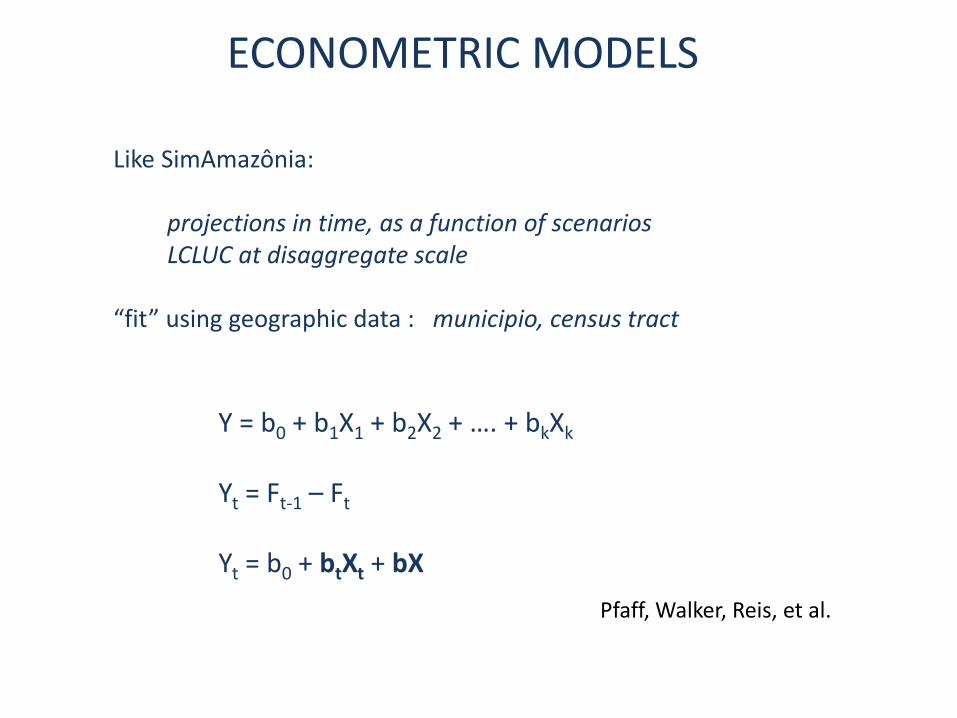
ECONOMETRIC MODELS
Like SimAmazônia:
projections in time, as a function of scenariosLCLUC at disaggregate scale
“fit” using geographic data : municipio, census tract
Y = b0 + b1X1 + b2X2 + …. + bkXk
Yt = Ft-1 – Ft
Yt = b0 + btXt + bX
Pfaff, Walker, Reis, et al.
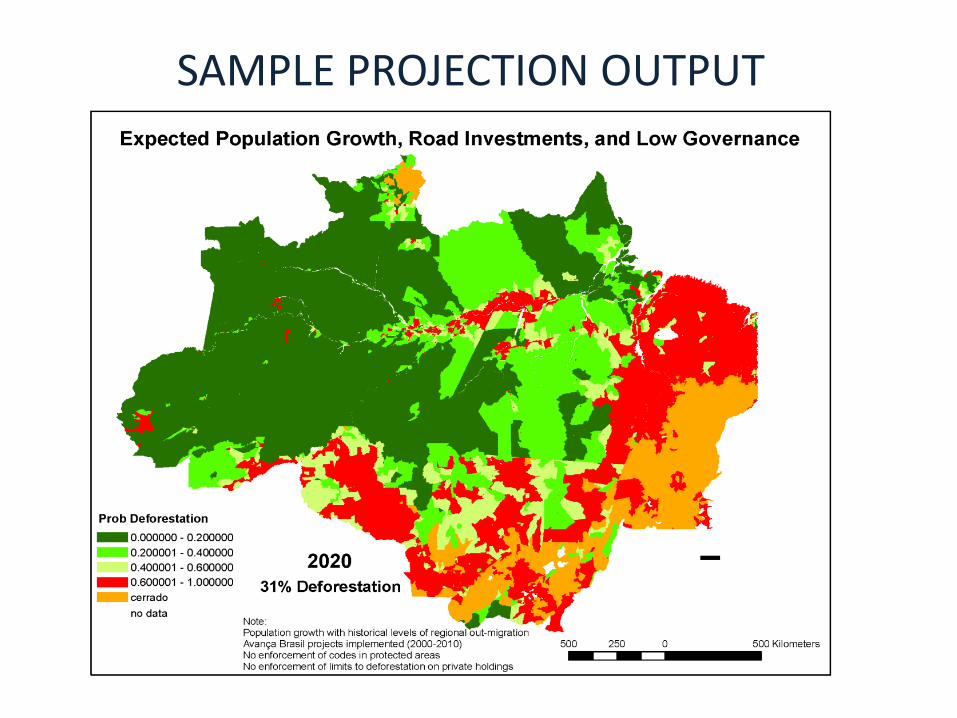
SAMPLE PROJECTION OUTPUT
Theoretical/“projection”
1) NEA-ABM
2) LUCITA
3) Spatial Behavior
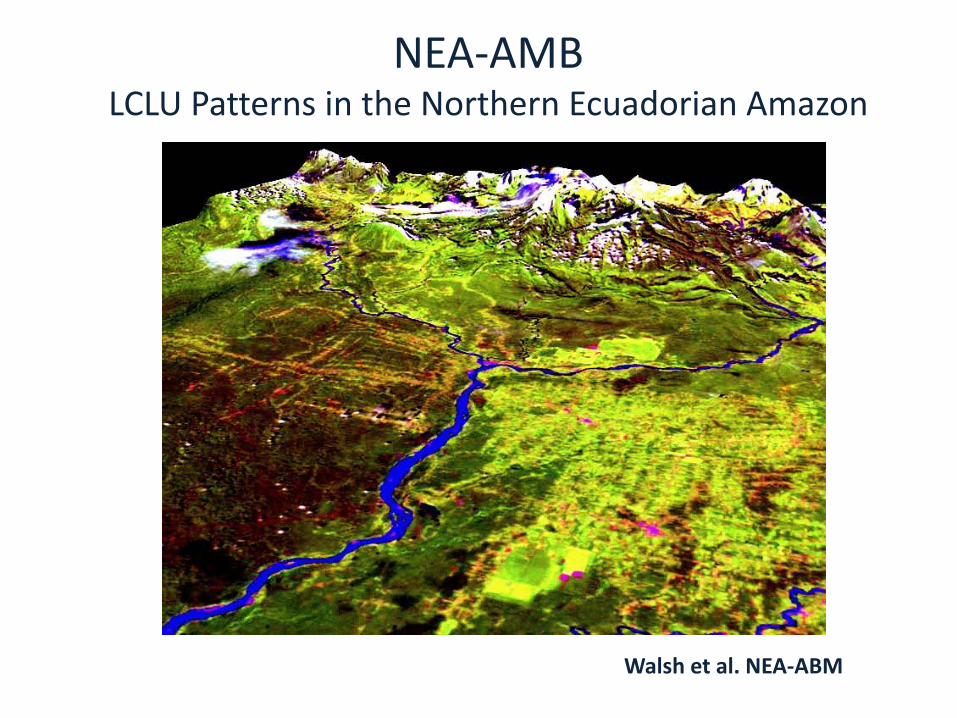
NEA-AMB LCLU Patterns in the Northern Ecuadorian Amazon
Walsh et al. NEA-ABM
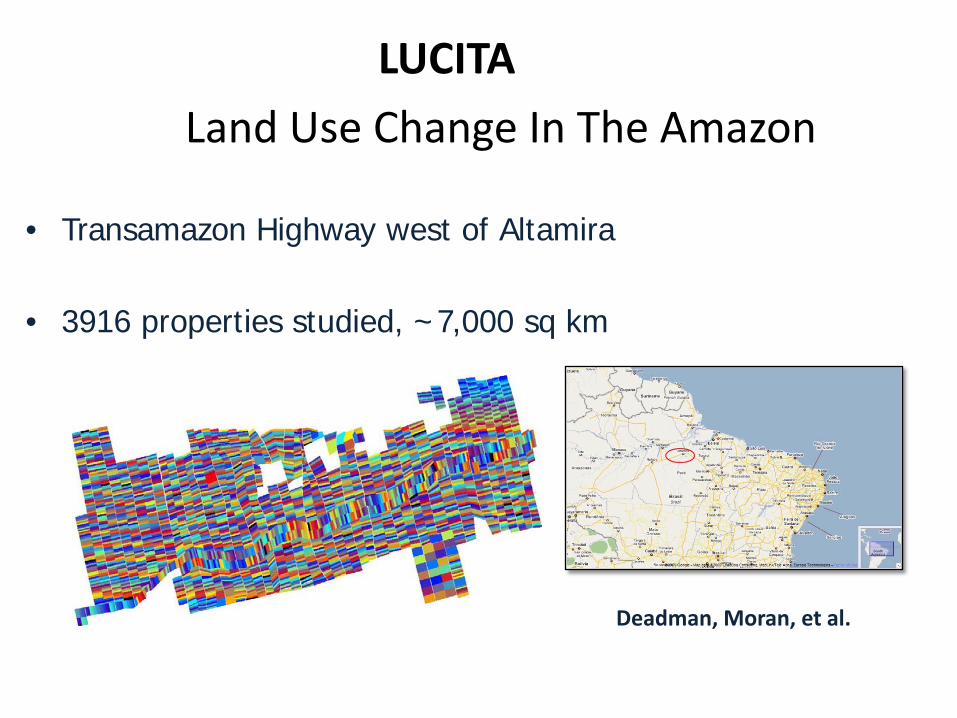
LUCITA
Land Use Change In The Amazon
• Transamazon Highway west of Altamira
• 3916 properties studied, ~7,000 sq km
Deadman, Moran, et al.
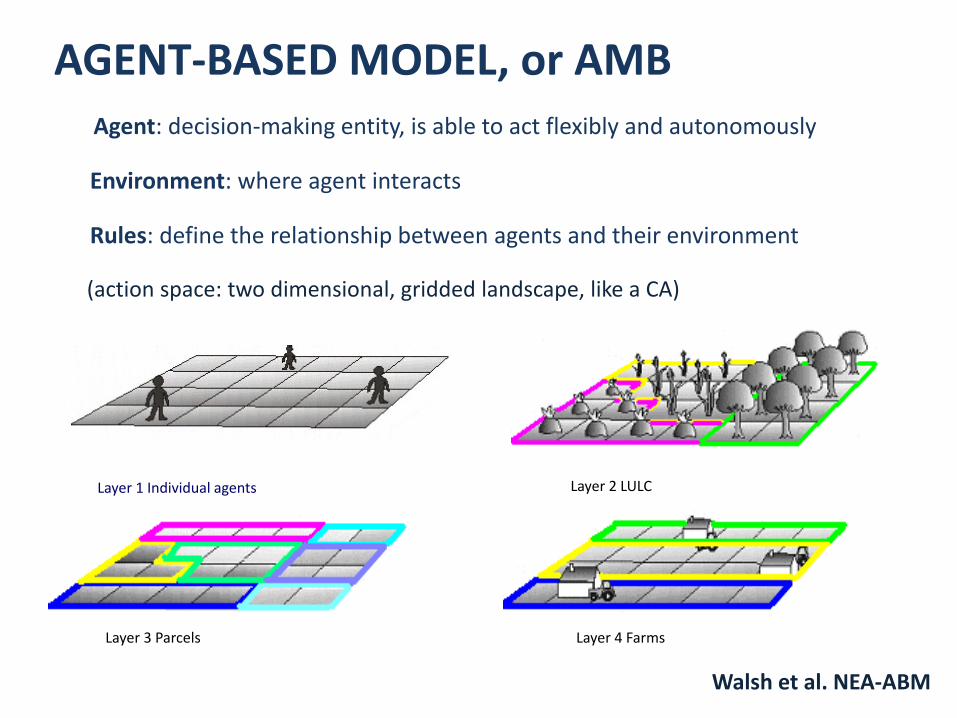
AGENT-BASED MODEL, or AMBAgent: decision-making entity, is able to act flexibly and autonomously
Environment: where agent interacts
Rules: define the relationship between agents and their environment
(action space: two dimensional, gridded landscape, like a CA)
Layer 2 LULCLayer 1 Individual agents
Layer 3 Parcels Layer 4 Farms
Walsh et al. NEA-ABM
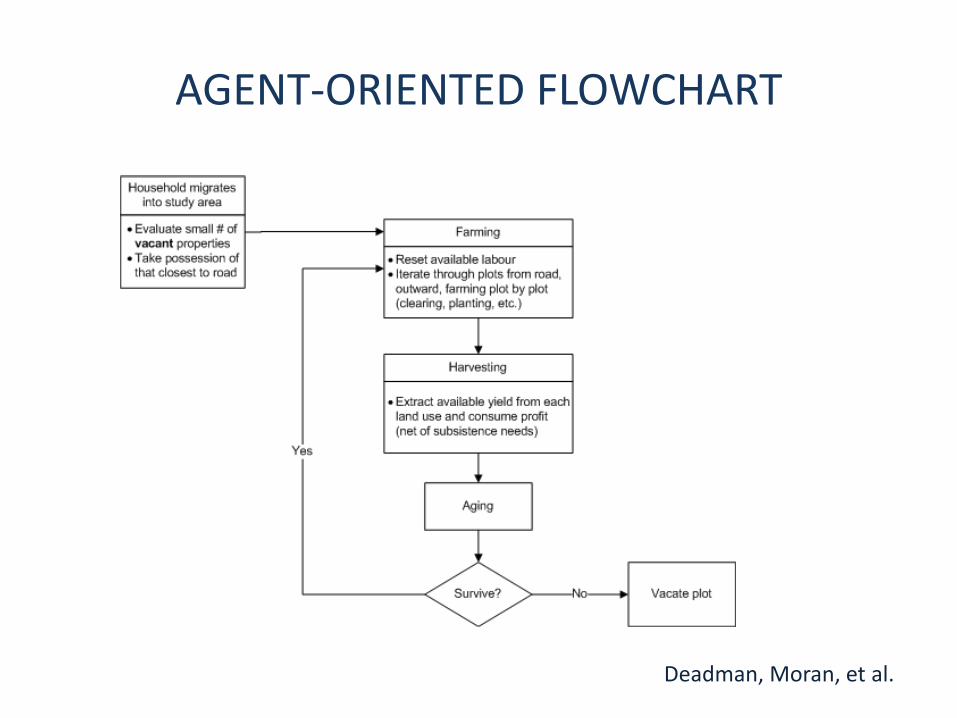
AGENT-ORIENTED FLOWCHART
Deadman, Moran, et al.
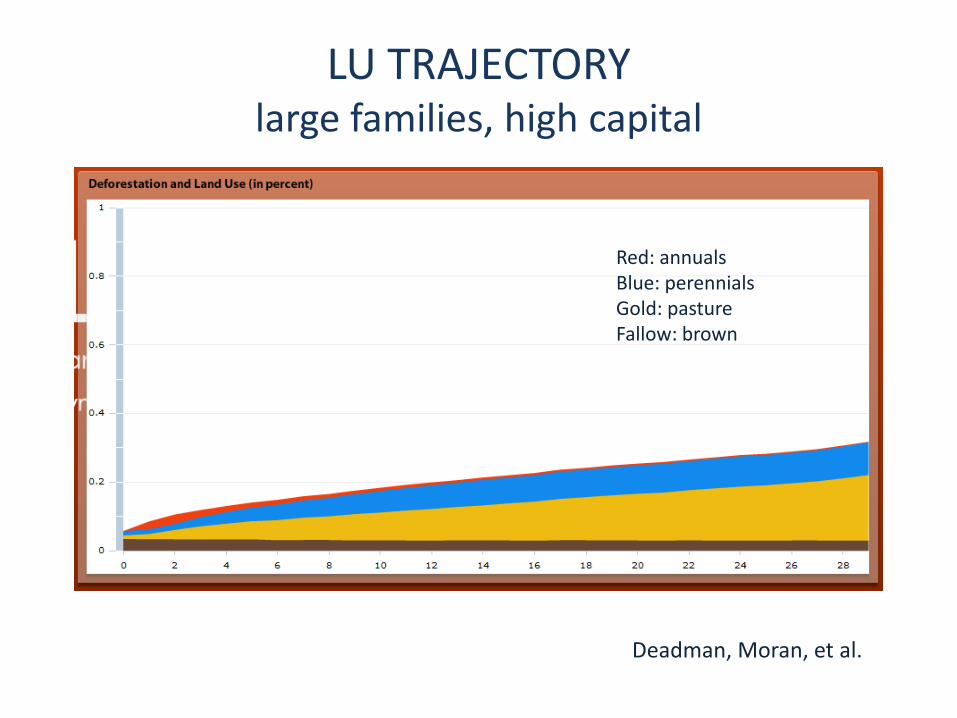
LU TRAJECTORYlarge families, high capital
Red: annualsBlue: perennialsGold: pastureFallow: brown
Deadman, Moran, et al.
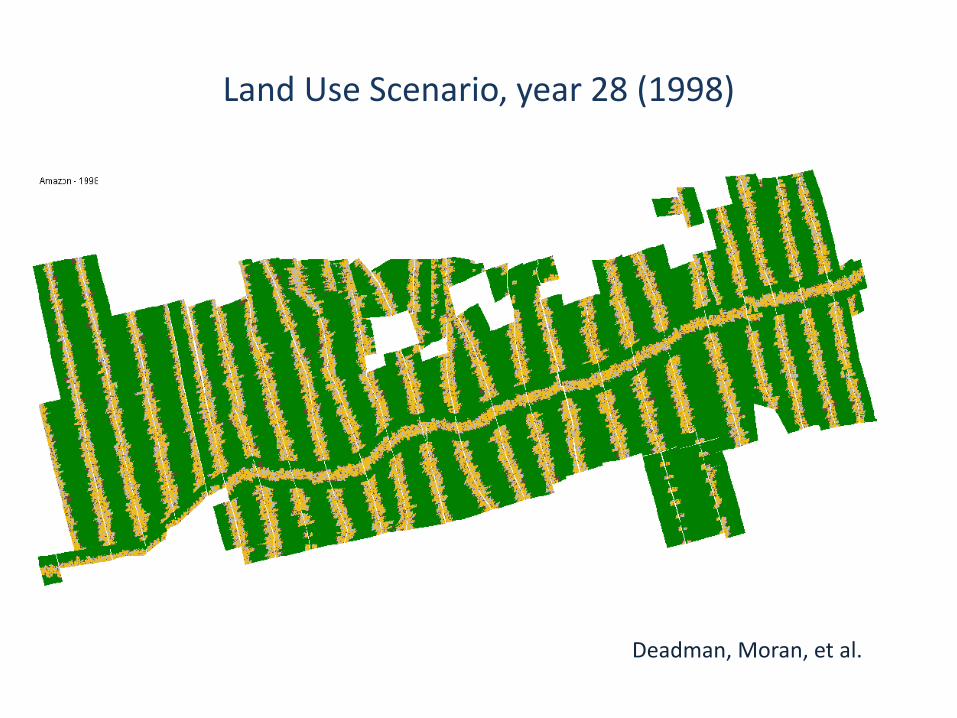
Land Use Scenario, year 28 (1998)
Deadman, Moran, et al.
SELECTED FINDINGS
• Changes in land tenancy ….. can increase deforestation and land fragmentation.
• Forest succession ….. related to off-farm employment, household assets, etc.
• Spatial structure of LCLUC ….. related to household demographics, year of farm establishment, farm size, etc.
Walsh et al. NEA-ABM
SPATIAL BEHAVIOR MODELING
IMAZON product
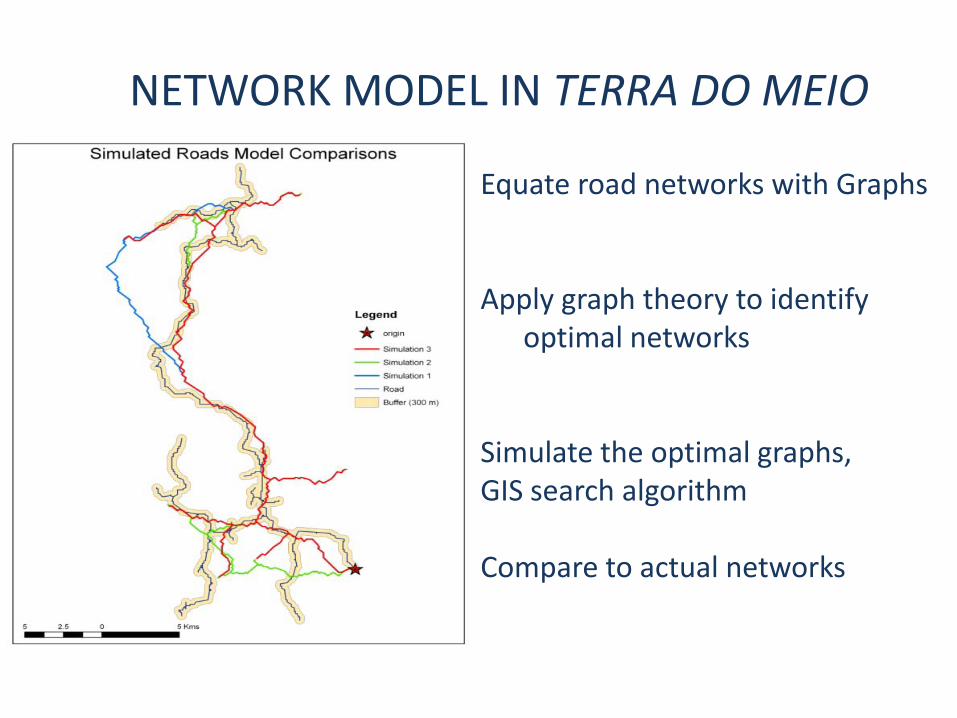
NETWORK MODEL IN TERRA DO MEIO
Equate road networks with Graphs
Apply graph theory to identify optimal networks
Simulate the optimal graphs, GIS search algorithm
Compare to actual networks
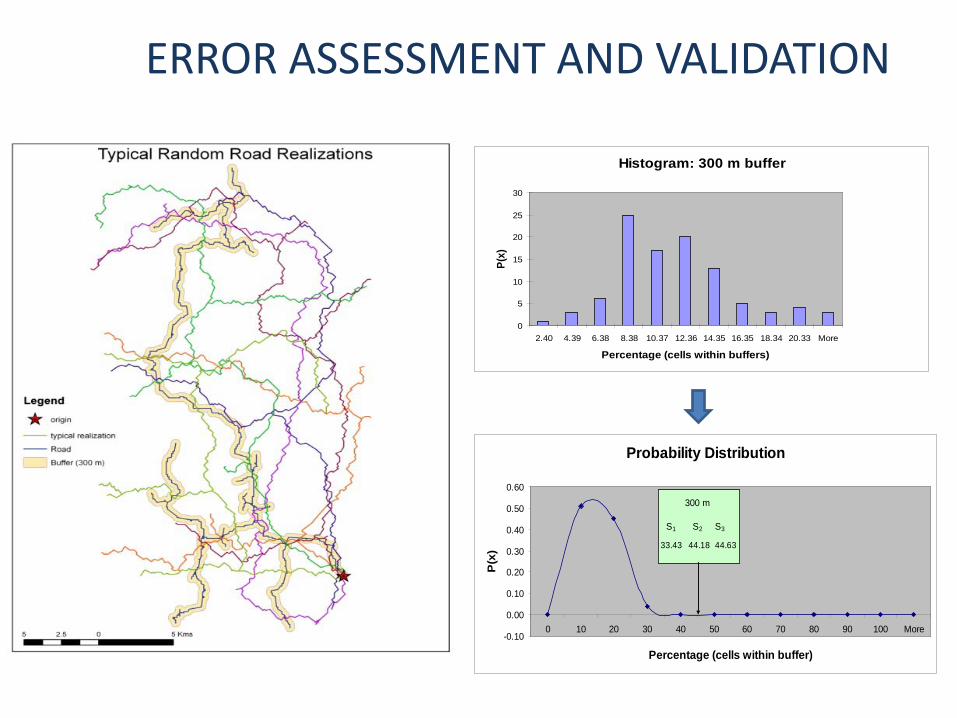
Histogram: 300 m buffer
0
5
10
15
20
25
30
2.40 4.39 6.38 8.38 10.37 12.36 14.35 16.35 18.34 20.33 More
Percentage (cells within buffers)
P(x)
Probability Distribution
-0.10
0.00
0.10
0.20
0.30
0.40
0.50
0.60
0 10 20 30 40 50 60 70 80 90 100 More
Percentage (cells within buffer)
P(x
) 33.43 44.6344.18
S1 S2 S3
300 m
ERROR ASSESSMENT AND VALIDATION

ACCOMPLISHMENTS
• Models of deforestation at multiple scales, with projection capability
• Models that project patterns of deforestation, given a road network
• Models that generate road networks
• Deforestation and Fragmentation

CHALLENGES
1) Goodness-of-fit (Pontius, Arima, Walker)
2) Treatment of Uncertainty (Moore)
3) Forest dynamics, with transition (Moran) (good theory for F → Ag, not from Ag → F Forest Transition Theory)
4) Other agents in ABMs (what about large operators?)
5) General equilibrium, with price signals(Cattaneo)
THANKS TO
NASA LBA
NASA LCLUC
…………NSF
NOAA
NIH
…………….