Embed Size (px)
Citation preview

State of the Art in Sensors, Signals and Signal Processing
Rupert Ortner, Engelbert Grünbacher, Christoph Guger g.tec medical engineering GmbH/Guger Technologies OG, Graz, Austria
1 Introduction
This document presents a state of the art of sensors, signals and signal processing for measuring EEG
and non – EEG data. In the following we will focus on sensors and physiological signals for
Electroenzephalogram (EEG)
Electrocardiogram (ECG)
Respiration
Electromyogram (EMG)
Electrooculogram (EOG)
The first part of the document includes an overview of sensors and sensor types that are applied for
measurements in the above mentioned categories. It is separated into sensors for EEG measurements
and sensors for non-EEG measurements.
The next part contains an overview about hardware issues, about biosignal amplifiers and about their
use. This section will explain the state of the art of hardware and how this hardware can be exploited to
be applied in a research environment. Therefore the biosignals have to be easily measurable and
processable.
The final part of the document contains an overview about the literature in the field of signal
processing algorithms that are applied for analyzing e.g. the ECG or the EEG. The main problem of
signal processing is how to extract the somehow included information from the sensor signals.
2 Sensors for biosignal measurements
Table 1 represents a first overview of sensors for biosignal measurements together with some
important features for use. As shown different types of sensors, among them sintered Ag/AgCl sensors,
sensors using disposable and pre-gelled electrodes, finger electrodes and photoelectric sensors, are
applied at different locations in order to measure different kinds of biosignals. The sampling
frequencies are important to define the requirements of the biosignal amplifier.
Page 2 of 18
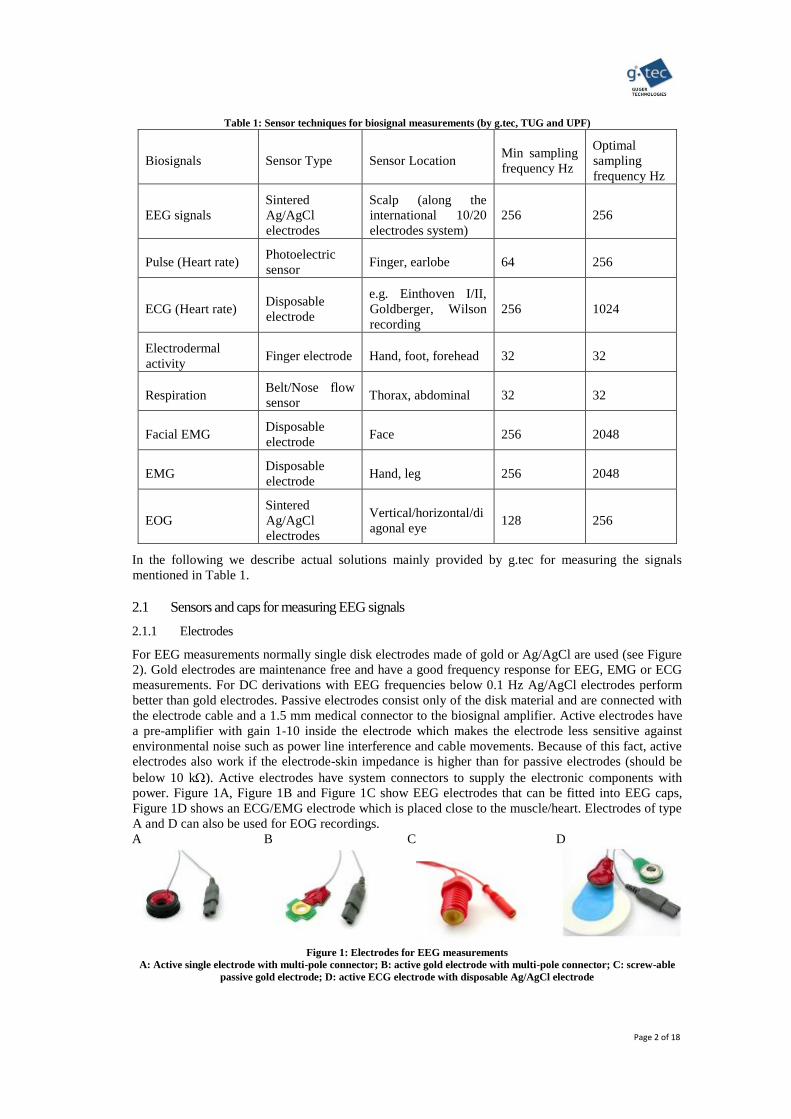
Table 1: Sensor techniques for biosignal measurements (by g.tec, TUG and UPF)
Biosignals Sensor Type Sensor Location Min sampling
frequency Hz
Optimal
sampling
frequency Hz
EEG signals
Sintered
Ag/AgCl
electrodes
Scalp (along the
international 10/20
electrodes system)
256 256
Pulse (Heart rate) Photoelectric
sensor Finger, earlobe 64 256
ECG (Heart rate) Disposable
electrode
e.g. Einthoven I/II,
Goldberger, Wilson
recording
256 1024
Electrodermal
activity Finger electrode Hand, foot, forehead 32 32
Respiration Belt/Nose flow
sensor Thorax, abdominal 32 32
Facial EMG Disposable
electrode Face 256 2048
EMG Disposable
electrode Hand, leg 256 2048
EOG
Sintered
Ag/AgCl
electrodes
Vertical/horizontal/di
agonal eye 128 256
In the following we describe actual solutions mainly provided by g.tec for measuring the signals
mentioned in Table 1.
2.1 Sensors and caps for measuring EEG signals
2.1.1 Electrodes
For EEG measurements normally single disk electrodes made of gold or Ag/AgCl are used (see Figure
2). Gold electrodes are maintenance free and have a good frequency response for EEG, EMG or ECG
measurements. For DC derivations with EEG frequencies below 0.1 Hz Ag/AgCl electrodes perform
better than gold electrodes. Passive electrodes consist only of the disk material and are connected with
the electrode cable and a 1.5 mm medical connector to the biosignal amplifier. Active electrodes have
a pre-amplifier with gain 1-10 inside the electrode which makes the electrode less sensitive against
environmental noise such as power line interference and cable movements. Because of this fact, active
electrodes also work if the electrode-skin impedance is higher than for passive electrodes (should be
below 10 k). Active electrodes have system connectors to supply the electronic components with
power. Figure 1A, Figure 1B and Figure 1C show EEG electrodes that can be fitted into EEG caps,
Figure 1D shows an ECG/EMG electrode which is placed close to the muscle/heart. Electrodes of type
A and D can also be used for EOG recordings.
A
B
C
D
Figure 1: Electrodes for EEG measurements
A: Active single electrode with multi-pole connector; B: active gold electrode with multi-pole connector; C: screw-able
passive gold electrode; D: active ECG electrode with disposable Ag/AgCl electrode
Page 3 of 18
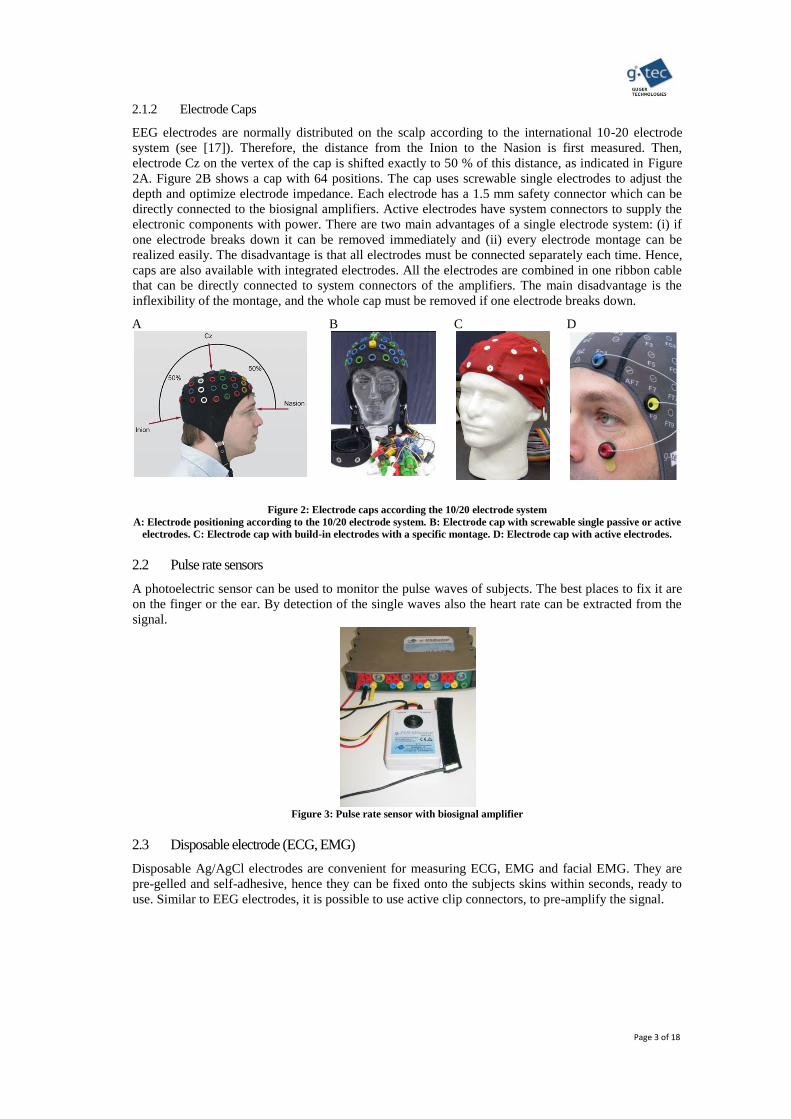
2.1.2 Electrode Caps
EEG electrodes are normally distributed on the scalp according to the international 10-20 electrode
system (see [17]). Therefore, the distance from the Inion to the Nasion is first measured. Then,
electrode Cz on the vertex of the cap is shifted exactly to 50 % of this distance, as indicated in Figure
2A. Figure 2B shows a cap with 64 positions. The cap uses screwable single electrodes to adjust the
depth and optimize electrode impedance. Each electrode has a 1.5 mm safety connector which can be
directly connected to the biosignal amplifiers. Active electrodes have system connectors to supply the
electronic components with power. There are two main advantages of a single electrode system: (i) if
one electrode breaks down it can be removed immediately and (ii) every electrode montage can be
realized easily. The disadvantage is that all electrodes must be connected separately each time. Hence,
caps are also available with integrated electrodes. All the electrodes are combined in one ribbon cable
that can be directly connected to system connectors of the amplifiers. The main disadvantage is the
inflexibility of the montage, and the whole cap must be removed if one electrode breaks down.
A
B
C
D
Figure 2: Electrode caps according the 10/20 electrode system
A: Electrode positioning according to the 10/20 electrode system. B: Electrode cap with screwable single passive or active
electrodes. C: Electrode cap with build-in electrodes with a specific montage. D: Electrode cap with active electrodes.
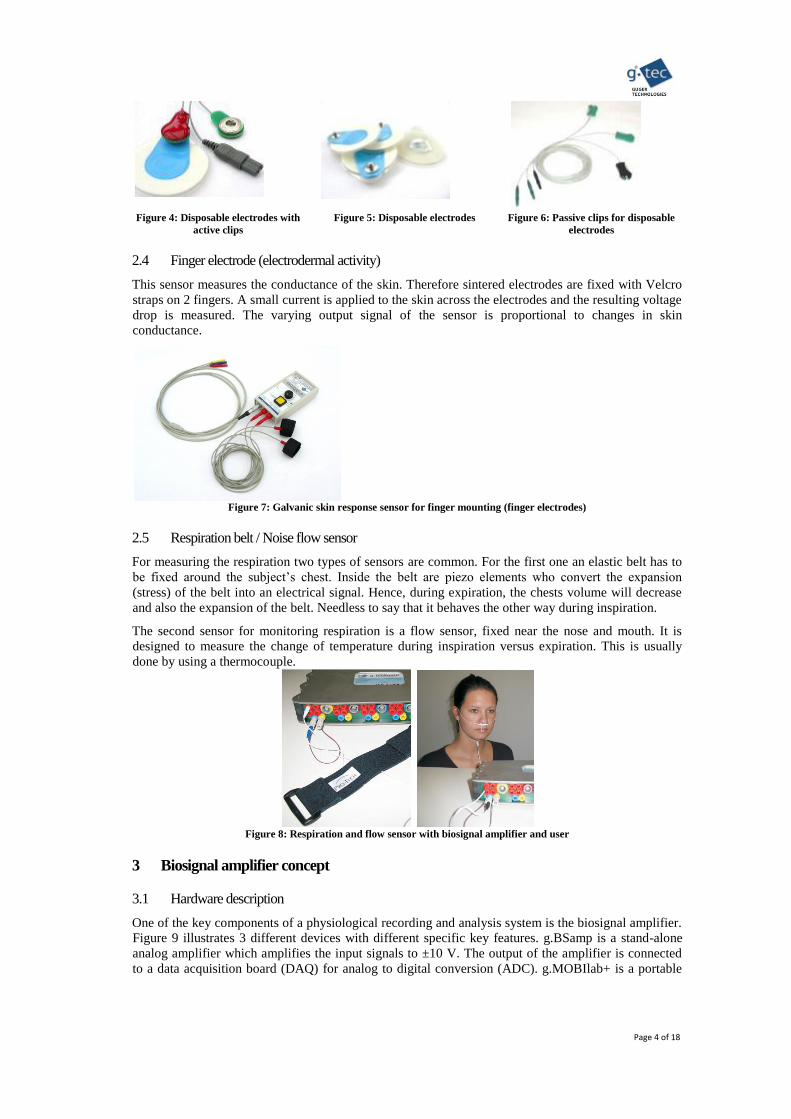
2.2 Pulse rate sensors
A photoelectric sensor can be used to monitor the pulse waves of subjects. The best places to fix it are
on the finger or the ear. By detection of the single waves also the heart rate can be extracted from the
signal.
Figure 3: Pulse rate sensor with biosignal amplifier
2.3 Disposable electrode (ECG, EMG)
Disposable Ag/AgCl electrodes are convenient for measuring ECG, EMG and facial EMG. They are
pre-gelled and self-adhesive, hence they can be fixed onto the subjects skins within seconds, ready to
use. Similar to EEG electrodes, it is possible to use active clip connectors, to pre-amplify the signal.
Page 4 of 18
Figure 4: Disposable electrodes with
active clips
Figure 5: Disposable electrodes Figure 6: Passive clips for disposable
electrodes
2.4 Finger electrode (electrodermal activity)
This sensor measures the conductance of the skin. Therefore sintered electrodes are fixed with Velcro
straps on 2 fingers. A small current is applied to the skin across the electrodes and the resulting voltage
drop is measured. The varying output signal of the sensor is proportional to changes in skin
conductance.
Figure 7: Galvanic skin response sensor for finger mounting (finger electrodes)
2.5 Respiration belt / Noise flow sensor
For measuring the respiration two types of sensors are common. For the first one an elastic belt has to
be fixed around the subject’s chest. Inside the belt are piezo elements who convert the expansion
(stress) of the belt into an electrical signal. Hence, during expiration, the chests volume will decrease
and also the expansion of the belt. Needless to say that it behaves the other way during inspiration.
The second sensor for monitoring respiration is a flow sensor, fixed near the nose and mouth. It is
designed to measure the change of temperature during inspiration versus expiration. This is usually
done by using a thermocouple.
Figure 8: Respiration and flow sensor with biosignal amplifier and user
3 Biosignal amplifier concept
3.1 Hardware description
One of the key components of a physiological recording and analysis system is the biosignal amplifier.
Figure 9 illustrates 3 different devices with different specific key features. g.BSamp is a stand-alone
analog amplifier which amplifies the input signals to ±10 V. The output of the amplifier is connected
to a data acquisition board (DAQ) for analog to digital conversion (ADC). g.MOBIlab+ is a portable
Page 5 of 18
amplifier that transmits already digitized EEG data via Bluetooth to the processing unit. g.USBamp
sends the digitized EEG via USB to the processing unit.
A
B
C
Figure 9: Biosignal amplifiers
A: 16 channel stand-alone amplifier g.BSamp. B: 8 channel wireless amplifier g.MOBIlab+. C: 16 channel amplifier
g.USBamp with USB connection
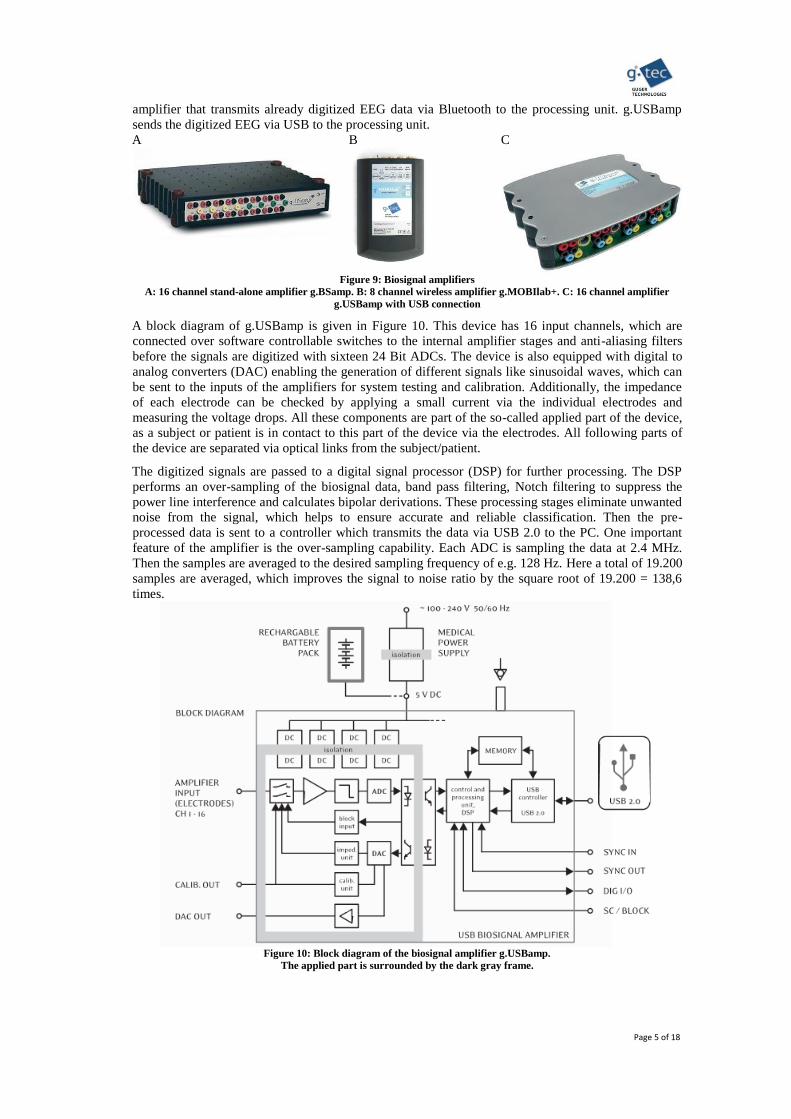
A block diagram of g.USBamp is given in Figure 10. This device has 16 input channels, which are
connected over software controllable switches to the internal amplifier stages and anti-aliasing filters
before the signals are digitized with sixteen 24 Bit ADCs. The device is also equipped with digital to
analog converters (DAC) enabling the generation of different signals like sinusoidal waves, which can
be sent to the inputs of the amplifiers for system testing and calibration. Additionally, the impedance
of each electrode can be checked by applying a small current via the individual electrodes and
measuring the voltage drops. All these components are part of the so-called applied part of the device,
as a subject or patient is in contact to this part of the device via the electrodes. All following parts of
the device are separated via optical links from the subject/patient.
The digitized signals are passed to a digital signal processor (DSP) for further processing. The DSP
performs an over-sampling of the biosignal data, band pass filtering, Notch filtering to suppress the
power line interference and calculates bipolar derivations. These processing stages eliminate unwanted
noise from the signal, which helps to ensure accurate and reliable classification. Then the pre-
processed data is sent to a controller which transmits the data via USB 2.0 to the PC. One important
feature of the amplifier is the over-sampling capability. Each ADC is sampling the data at 2.4 MHz.
Then the samples are averaged to the desired sampling frequency of e.g. 128 Hz. Here a total of 19.200
samples are averaged, which improves the signal to noise ratio by the square root of 19.200 = 138,6
times.
Figure 10: Block diagram of the biosignal amplifier g.USBamp.
The applied part is surrounded by the dark gray frame.

Page 6 of 18
For EEG or ECoG recordings with many channels, multiple devices can be daisy chained. One
common synchronization signal is utilized for all ADCs, yielding a perfect non delayed acquisition of
all connected amplifiers. This is especially important for evoked potential recordings or recordings
with many EEG channels. If only one ADC with a specific conversion time is used for many channels,
then a time lag between the first channel and the last channel could be the result (e.g. 100 channels *
10 µs = 1 ms). Important is also that biosignal acquisition systems provide trigger inputs and outputs to
log external events in synchrony to the data or to send trigger information to other external devices
such as a visual flash lamp. Digital outputs can also be used to control external devices such as a
prosthetic hand or a wheelchair. An advantage here is to scan the digital inputs together with the
biosignals to avoid time-shifts between events and physiological data. A medical power supply that
works with 220 and 110 V is required for physiological recording systems that are used mainly in the
lab. For mobile applications like the controlling a wheelchair, amplifiers which run on battery power
are also useful.
Table 2 compares key technical properties of the 3 amplifiers shown in Figure 3 (g.BSamp,
g.MOBIlab+ and g.USBamp). The most important factor in selecting an appropriate amplifier is
whether non-invasive or invasive data should be processed. For invasive recordings, only devices with
an applied part of type CF are allowed. For EEG measurements, both BF and CF type devices can be
used. The difference here is the maximum allowed leakage current. Leakage current refers to electric
current that is lost from the hardware, and could be dangerous for people or equipment. For both
systems, the character F indicates that the applied part is isolated from the other parts of the amplifier.
This isolation is typically done based on opto-couplers or isolation amplifiers. For a BF device, the
ground leakage current and the patient leakage current must be ≤100 µA according to the medical
device requirements, such as IEC 60601 or EN 60601. These refer to widely recognized standards that
specify details of how much leakage current is allowed, among other details. For a CF device, the rules
are more stringent. The ground leakage current can also be ≤100µA, but the patient leakage current
must be ≤10 µA only.
Table 2: Technical key properties of biosignal amplifiers for BCI operation.
g.BSamp g.MOBIlab+ g.USBamp
Signal type EEG/EP/EXG EEG/EP/EXG EEG/EP/EXG/ECoG
Channels number N 8/16 8 16
Stackable 32-80 - 32-256
Sampling rate [Hz] 250kHz/N 256 64-38.4 k
Simultaneous sample and
hold
No No Yes
ADC inside amplifier No Yes Yes
#ADCs 1 1 16
ADC resolution [Bit] 16 16 24
Over sampling - - 19.400 at 128 Hz
Conversion time [µs] 4 µs 43 µs 26 µs
Time delay between 1st
and last channel
Conversion time * N Conversion time * 8 Conversion time
Interface PCI/PCMCIA Bluetooth USB 2.0
Range [m] 2 30 3
Power supply 12 V medical power
supply or battery
4 AA batteries 5 V medical power
supply or battery
Operation time on battery
[h]
8 36 8
Page 7 of 18
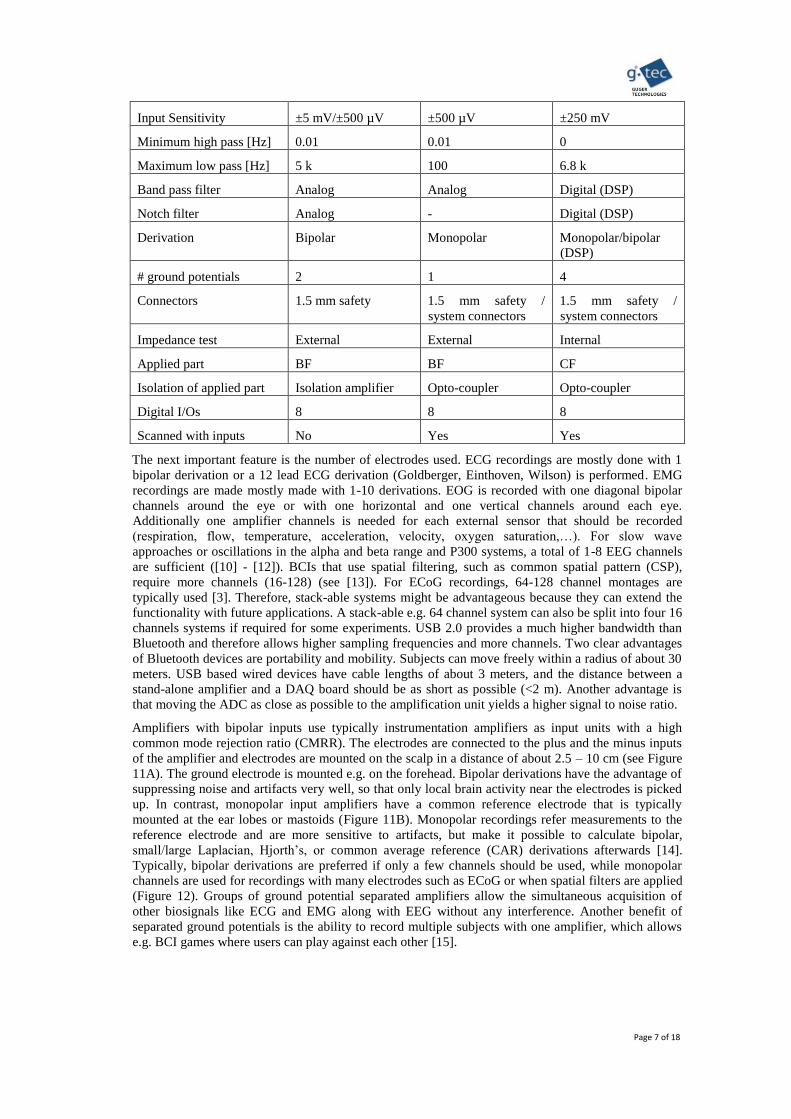
Input Sensitivity ±5 mV/±500 µV ±500 µV ±250 mV
Minimum high pass [Hz] 0.01 0.01 0
Maximum low pass [Hz] 5 k 100 6.8 k
Band pass filter Analog Analog Digital (DSP)
Notch filter Analog - Digital (DSP)
Derivation Bipolar Monopolar Monopolar/bipolar
(DSP)
# ground potentials 2 1 4
Connectors 1.5 mm safety 1.5 mm safety /
system connectors
1.5 mm safety /
system connectors
Impedance test External External Internal
Applied part BF BF CF
Isolation of applied part Isolation amplifier Opto-coupler Opto-coupler
Digital I/Os 8 8 8
Scanned with inputs No Yes Yes
The next important feature is the number of electrodes used. ECG recordings are mostly done with 1
bipolar derivation or a 12 lead ECG derivation (Goldberger, Einthoven, Wilson) is performed. EMG
recordings are made mostly made with 1-10 derivations. EOG is recorded with one diagonal bipolar
channels around the eye or with one horizontal and one vertical channels around each eye.
Additionally one amplifier channels is needed for each external sensor that should be recorded
(respiration, flow, temperature, acceleration, velocity, oxygen saturation,…). For slow wave
approaches or oscillations in the alpha and beta range and P300 systems, a total of 1-8 EEG channels
are sufficient ([10] - [12]). BCIs that use spatial filtering, such as common spatial pattern (CSP),
require more channels (16-128) (see [13]). For ECoG recordings, 64-128 channel montages are
typically used [3]. Therefore, stack-able systems might be advantageous because they can extend the
functionality with future applications. A stack-able e.g. 64 channel system can also be split into four 16
channels systems if required for some experiments. USB 2.0 provides a much higher bandwidth than
Bluetooth and therefore allows higher sampling frequencies and more channels. Two clear advantages
of Bluetooth devices are portability and mobility. Subjects can move freely within a radius of about 30
meters. USB based wired devices have cable lengths of about 3 meters, and the distance between a
stand-alone amplifier and a DAQ board should be as short as possible (<2 m). Another advantage is
that moving the ADC as close as possible to the amplification unit yields a higher signal to noise ratio.
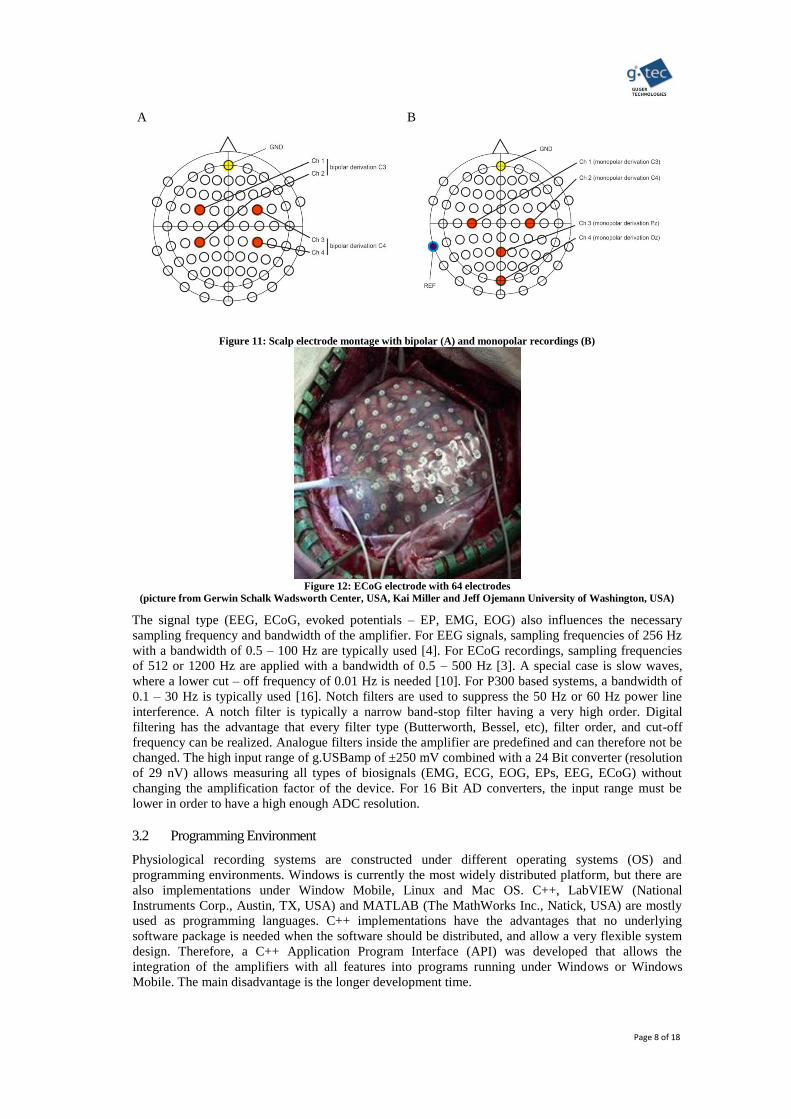
Amplifiers with bipolar inputs use typically instrumentation amplifiers as input units with a high
common mode rejection ratio (CMRR). The electrodes are connected to the plus and the minus inputs
of the amplifier and electrodes are mounted on the scalp in a distance of about 2.5 – 10 cm (see Figure
11A). The ground electrode is mounted e.g. on the forehead. Bipolar derivations have the advantage of
suppressing noise and artifacts very well, so that only local brain activity near the electrodes is picked
up. In contrast, monopolar input amplifiers have a common reference electrode that is typically
mounted at the ear lobes or mastoids (Figure 11B). Monopolar recordings refer measurements to the
reference electrode and are more sensitive to artifacts, but make it possible to calculate bipolar,
small/large Laplacian, Hjorth’s, or common average reference (CAR) derivations afterwards [14].
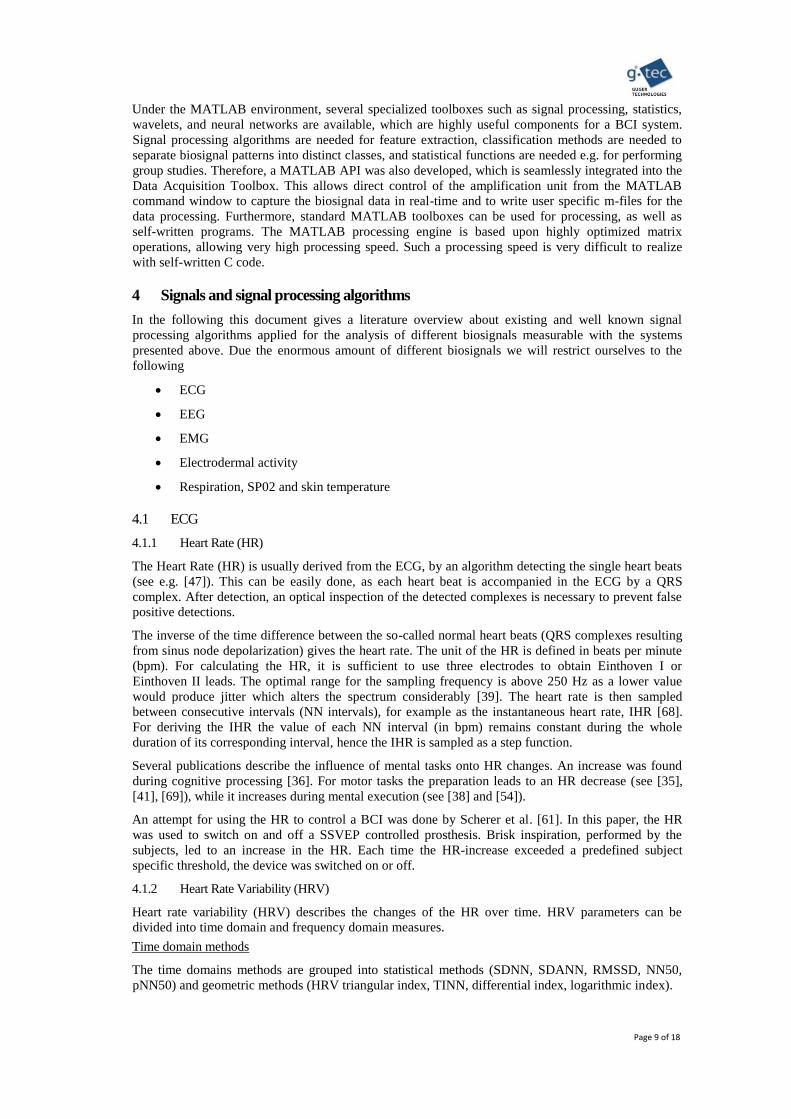
Typically, bipolar derivations are preferred if only a few channels should be used, while monopolar
channels are used for recordings with many electrodes such as ECoG or when spatial filters are applied
(Figure 12). Groups of ground potential separated amplifiers allow the simultaneous acquisition of
other biosignals like ECG and EMG along with EEG without any interference. Another benefit of
separated ground potentials is the ability to record multiple subjects with one amplifier, which allows
e.g. BCI games where users can play against each other [15].
Page 8 of 18
A
B
Figure 11: Scalp electrode montage with bipolar (A) and monopolar recordings (B)
Figure 12: ECoG electrode with 64 electrodes
(picture from Gerwin Schalk Wadsworth Center, USA, Kai Miller and Jeff Ojemann University of Washington, USA)
The signal type (EEG, ECoG, evoked potentials – EP, EMG, EOG) also influences the necessary
sampling frequency and bandwidth of the amplifier. For EEG signals, sampling frequencies of 256 Hz
with a bandwidth of 0.5 – 100 Hz are typically used [4]. For ECoG recordings, sampling frequencies
of 512 or 1200 Hz are applied with a bandwidth of 0.5 – 500 Hz [3]. A special case is slow waves,
where a lower cut – off frequency of 0.01 Hz is needed [10]. For P300 based systems, a bandwidth of
0.1 – 30 Hz is typically used [16]. Notch filters are used to suppress the 50 Hz or 60 Hz power line
interference. A notch filter is typically a narrow band-stop filter having a very high order. Digital
filtering has the advantage that every filter type (Butterworth, Bessel, etc), filter order, and cut-off
frequency can be realized. Analogue filters inside the amplifier are predefined and can therefore not be
changed. The high input range of g.USBamp of ±250 mV combined with a 24 Bit converter (resolution
of 29 nV) allows measuring all types of biosignals (EMG, ECG, EOG, EPs, EEG, ECoG) without
changing the amplification factor of the device. For 16 Bit AD converters, the input range must be
lower in order to have a high enough ADC resolution.
3.2 Programming Environment
Physiological recording systems are constructed under different operating systems (OS) and
programming environments. Windows is currently the most widely distributed platform, but there are
also implementations under Window Mobile, Linux and Mac OS. C++, LabVIEW (National
Instruments Corp., Austin, TX, USA) and MATLAB (The MathWorks Inc., Natick, USA) are mostly
used as programming languages. C++ implementations have the advantages that no underlying
software package is needed when the software should be distributed, and allow a very flexible system
design. Therefore, a C++ Application Program Interface (API) was developed that allows the
integration of the amplifiers with all features into programs running under Windows or Windows
Mobile. The main disadvantage is the longer development time.
Page 9 of 18
Under the MATLAB environment, several specialized toolboxes such as signal processing, statistics,
wavelets, and neural networks are available, which are highly useful components for a BCI system.
Signal processing algorithms are needed for feature extraction, classification methods are needed to
separate biosignal patterns into distinct classes, and statistical functions are needed e.g. for performing
group studies. Therefore, a MATLAB API was also developed, which is seamlessly integrated into the
Data Acquisition Toolbox. This allows direct control of the amplification unit from the MATLAB
command window to capture the biosignal data in real-time and to write user specific m-files for the
data processing. Furthermore, standard MATLAB toolboxes can be used for processing, as well as
self-written programs. The MATLAB processing engine is based upon highly optimized matrix
operations, allowing very high processing speed. Such a processing speed is very difficult to realize
with self-written C code.
4 Signals and signal processing algorithms
In the following this document gives a literature overview about existing and well known signal
processing algorithms applied for the analysis of different biosignals measurable with the systems
presented above. Due the enormous amount of different biosignals we will restrict ourselves to the
following
ECG
EEG
EMG
Electrodermal activity
Respiration, SP02 and skin temperature
4.1 ECG
4.1.1 Heart Rate (HR)
The Heart Rate (HR) is usually derived from the ECG, by an algorithm detecting the single heart beats
(see e.g. [47]). This can be easily done, as each heart beat is accompanied in the ECG by a QRS
complex. After detection, an optical inspection of the detected complexes is necessary to prevent false
positive detections.
The inverse of the time difference between the so-called normal heart beats (QRS complexes resulting
from sinus node depolarization) gives the heart rate. The unit of the HR is defined in beats per minute
(bpm). For calculating the HR, it is sufficient to use three electrodes to obtain Einthoven I or
Einthoven II leads. The optimal range for the sampling frequency is above 250 Hz as a lower value
would produce jitter which alters the spectrum considerably [39]. The heart rate is then sampled
between consecutive intervals (NN intervals), for example as the instantaneous heart rate, IHR [68].
For deriving the IHR the value of each NN interval (in bpm) remains constant during the whole
duration of its corresponding interval, hence the IHR is sampled as a step function.
Several publications describe the influence of mental tasks onto HR changes. An increase was found
during cognitive processing [36]. For motor tasks the preparation leads to an HR decrease (see [35],
[41], [69]), while it increases during mental execution (see [38] and [54]).
An attempt for using the HR to control a BCI was done by Scherer et al. [61]. In this paper, the HR
was used to switch on and off a SSVEP controlled prosthesis. Brisk inspiration, performed by the
subjects, led to an increase in the HR. Each time the HR-increase exceeded a predefined subject
specific threshold, the device was switched on or off.
4.1.2 Heart Rate Variability (HRV)
Heart rate variability (HRV) describes the changes of the HR over time. HRV parameters can be
divided into time domain and frequency domain measures.
Time domain methods
The time domains methods are grouped into statistical methods (SDNN, SDANN, RMSSD, NN50,
pNN50) and geometric methods (HRV triangular index, TINN, differential index, logarithmic index).
Page 10 of 18
Statistical method:
The SDNN is the standard deviation of the NN intervals, and is calculated in many studies over for a
24h period. Comparison of SDNN, derived from measurements of different duration is not suitable.
When evaluating short periods (usually 5 min.) of one measurement, the SDANN gives the standard
deviation of the average NN intervals, and the SDNN index the mean of the standard deviations. Also
measured are the square root of the mean squared differences of successive NN intervals (RMSSD),
and the number of interval differences of successive NN intervals greater than 50 ms (NN50). The
latter one depends on the length of the measured data, therefore the pNN50 is better comparable, as it
is calculated by dividing the NN50 by the total number of NN intervals.
Geometric methods
The HRV triangular index and the triangular interpolation of NN (TINN) are both based on the sample
density distribution D. It assigns the number of equally long NN intervals to each value of their
lengths. Now, the HRV triangular index is calculated by dividing the area of D by the maximum of the
distribution. The triangular interpolation of NN (TINN) is the baseline width of the minimum square
difference triangular interpolation of the highest peak of the histogram of all NN intervals.
The differential index is defined as the difference between the widths of the histogram of differences
between adjacent NN intervals measured at selected heights (e.g., at the levels of 1000 and 10 000
samples) [29] and the logarithmic index is the coefficient φ of the negative exponential curve k-eφt
,
which is the best approximation of the histogram of absolute differences between adjacent NN
intervals [60].
Frequency domain methods
The frequency domain parameters are all derived from an estimation of the power spectral density
(PSD). This estimation can be done via FFT or parametric methods like an autoregressive model.
Following this calculation one can extract several power components out of this estimation.
Ultra low frequency (ULF): 0 Hz – 0.0033 Hz
Very low frequency (VLF): 0.0033 Hz – 0.04 Hz
Low frequency (LF): 0.04 Hz – 0.15 Hz
High frequency (HF): 0.15 Hz – 0.4 Hz.
LF/HF
The ULF is only used when recording 24-hour data. The VLF is influenced by parasympathetic
activity [64], while the LF is driven by both, the sympathetic and parasysmpathetic system. HR
oscillations within this band are most likely a baroreflex response to the 10-s blood pressure
oscillations (see [32] and [31]). The HF band obtains its influence by the respiratory sinus arrhythmia
(RSA) that is a heart rate oscillation driven by respiration ([70], [71], [44]). The ratio LF/HF describes
the balanced behavior of the sympathetic and parasympathetic systems and is therefore an indicator to
see which of the two systems is actually the dominant one. When the LF component is increased and
the HF component is decreased the subject is suffering mental stress or is e.g. at high altitude.
Even with little subjective awareness of the reduced amount of oxygen at an altitude of 2700 m, the
cardiovascular and central nervous system are already affected. A study on the Dachstein showed that
the HR increased from 990m altitude to 2700m altitude in a group of 10 subjects. Additionally, heart-
rate variability (HRV) parameters were decreased significantly. Furthermore, with the increase in
altitude, the sympathetic system becomes more active compared to the parasympathetic system [72].
The HR, the HRV and the event-related heart rate changes were calculated from the acquired ECG
data in social interaction VR simulations [73]. The study shows that the HR and HRV parameters vary
significantly between the baseline and social interaction experiments. Event-related HR changes show
the occurrence of breaks in presence (VR projection switched off) and also signified the virtual
character utterances.
Page 11 of 18
4.2 EEG
The so called ongoing EEG including brain waves or oscillations categorized into different frequency
bands can be seen as a common activity of a large population of neurons in the neocortex.
Amplitudes of the ongoing EEG are in the range of 50 – 100 µV. The amplitudes depend on the type of
EEG derivation (bipolar derivation yields smaller amplitudes compared to monopolar derivations) and
on the location of electrode placement. The interesting frequency ranges are between 0 – 40 Hz.
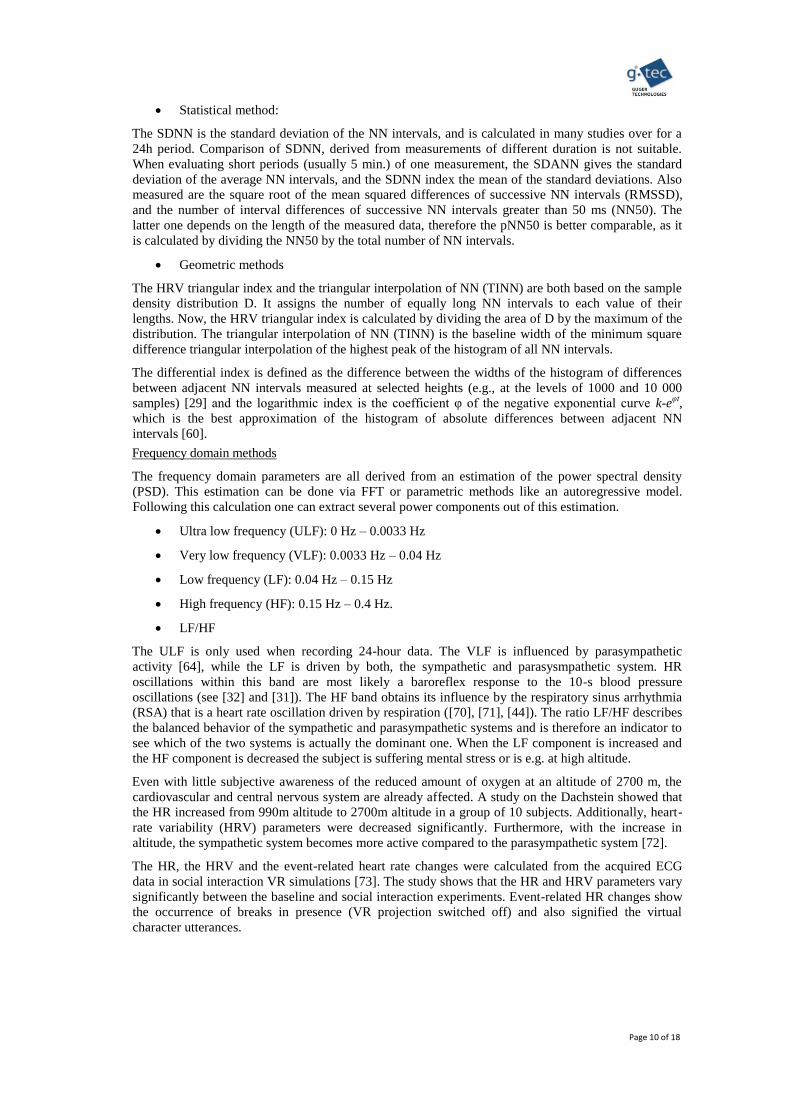
Sometimes components up to 80 Hz are investigated. Table 3 gives an overview over the used
frequency bands in EEG analysis. Figure 13 displays an example of typical EEG traces in different
frequency ranges. Table 3: Frequency range of the different EEG bands
EEG band Frequency range [Hz]
Delta 0.5 – 4
Theta 4 – 8
Alpha Lower alpha 8 –10
Upper alpha 10 – 13
Beta 13 –30
Gamma > 30
Beta
13 – 30 Hz
Alpha 8 – 13 Hz
Theta 4 – 8 Hz
Delta 0.5 – 4 Hz
Figure 13: Typical EEG traces for oscillatory components
in different frequency bands.
Theta activity occurs in children and sleeping adults and delta activity in infants and sleeping adults.
Alpha activity is best observed in occipital regions and beta activity can be seen if alpha rhythmic
activity disappears mainly in parietal and frontal areas in adults.
BCI system can be realized with slow waves [6], motor imagery [6], SSVEP ([28], [53]) or the P300
evoked potential [16].
4.2.1 Slow Cortical Potentials
Potential shift of the scalp EEG over 0.5 – 10 s are called slow cortical potentials. Reduced cortical
activation goes ahead with positive SCPs, while negative SCPs are associated with movement and
other functions involving cortical activation [74]. People are able to learn how to control these
potentials, hence it is possible to use them for BCIs as Birbaumer and his colleagues did ([6], [10],
Page 12 of 18
[88]). The main disadvantage of this method is the extensive training time to learn how to control the
SCPs. Users need to train in several 1-2 h sessions/week over weeks or months [74].
4.2.2 P300
The P300 wave was first discovered by Sutton [63]. It elicits when an unlikely event occurs randomly
between events with high probability. In the EEG signal the P 300 appears as a positive wave 300 ms
after stimulus onset. The electrodes are placed over the posterior scalp.
Its main usage in BCIs is for spelling devices, but one can also use it for control tasks (for example
games [40] or navigation (e.g. to move a computer-mouse [33]). When using P300 as a spelling
device, a matrix of characters is shown to the subject. Now the rows and columns (or in some
paradigms the single characters) of the matrix are flashing in random order, while the person
concentrates only on the character he wants to spell. For better concentrating, it is recommended to
count how many times the character flashes. Every time the desired character flashes, a P300 wave
occurs. As the detection of one single event would be imprecise, more than one trial (flashing of each
character) has to be carried out to achieve a proper accuracy.
Krusienki et al. [48] evaluated different classification techniques for the P300 speller, wherein the
stepwise linear discriminant analysis (SWLDA) and the Fisher’s linear discriminant analysis provided
the best overall performance and implementation characteristics.
A recent study [43], performed on 100 subjects, revealed an average accuracy level of 91.1%, with a
spelling time of 28.8 s for one single character. Each character was selected out of a matrix of 36
characters.
4.2.3 SSVEP
Steady state visual evoked potentials (SSVEP)-based BCIs use several stationary flashing sources (e.g.
flickering LEDs, or phase-reversing checkerboards), each of them flashing with another constant
frequency. When a person gazes at one of these sources, the specific frequency component will
increase in the measured EEG, over the occipital lobe. Hence, when using different light sources, each
of them representing a predefined command, the person gives this command via gazing onto the
source. The classification is either done by FFT-based spectrum comparison, preferably including also
the harmonics [53], or via the canonical correlation analysis (CCA) (see [49]). A third possibility is via
the minimum energy approach which was published by O. Friman et.al. in 2007 [75] and requires no
training.
Typical SSVEP applications are made for navigation, for example Middendorf et al. [52] used SSVEPs
to control the roll position of a flight simulator. The number of classes varies between two and eight,
although Gao et al. [42] established an experiment with even 48 targets, but in this experiment they
had only one subject. Bakardijan et al. [26] investigated SSVEP responses for frequencies between 5
and 84 Hz to finding the strongest response between 5.6 Hz and 15.3 Hz peaking at 12 Hz. With their
frequency-optimized-eight-command BCI they achieved a mean success rate of 98 % and an
information transfer rate (ITR) of 50 bits/min. Bin et al. [28] reports of a six-target BCI with an
average accuracy of 95.3% and an information transfer rate of 58 ± 9.6 bits/min.
Although most SSVEP-based BCIs work with gaze shifting towards a source, recent studies ([25],
[67]) proofed that only selective attention onto a pattern alone is sufficient for control. The latter paper
achieved an overall classification accuracy of 72.6 +/- 16.1% after 3 training days. Therefore also
severely disabled people, who are not able to move their eyes, can control an SSVEP-based BCI.
4.2.4 Motor imagery
When subjects perform or only imagine motor tasks, an event related desynchronization (ERD) ([57],
[58]) and an event related synchronization (ERS) is detectable by changes of EEG rhythms on
positions close to the respective sensorimotor areas. The ERD is indicated by a decrease of power in
the upper alpha band and lower beta band, starting 2 seconds before movement onset on the
contralateral hemisphere and becomes bilaterally symmetrical immediately before execution of
movement [56]. An ERS appears either after termination of the movement, or simultaneously to the
ERD, but in other areas of the cortex. The decrease/increase is always measured in comparison to the
power in a reference interval, for example a few seconds before the movement occurs. For
classification there are several approaches used. The simplest one is by calculating the bandpower in a
specific frequency band and consecutive discrimination via a Fisher linear discriminant analysis. Other
Page 13 of 18
classification strategies are support vector machines (SVM) (e.g. [80]), principal component analysis
(PCA) [76], or common spatial patterns (CSP) [77]
4.3 EOG and eye movements
The human eye acts as a dipole (the cornea is positive, the fundus negative). Hence it is simple to
measure eye-movements by placing a pair of electrodes on the left and right side of the eye (near the
external canthus) and another pair closely below and above it. Following an eye movement a DC shift
will occur between the electrodes. The EOG has amplitude of about 20μV per degree of rotation. A
frequency response of up to 30 Hz is adequate [78]. Beneath eye movement, also blinking causes a DC
shift in the signal.
The EOG is used in behavioral studies (e.g. sleep research), or in EEG measurements to identify eye
movement artifacts. The importance of measuring and dealing correctly with EOG artifacts was carried
out by Fatourechi et al. [81] when they analyzed more than 250 papers, and revealed weaknesses of
these studies, considering EOG and EMG artifacts. The ways of dealing with artifacts are either a
manual or automatic rejection of the data, or automatic removal of the artifact with filtering, PCA, ICA
or regression [81].
Eye movements can also be recorded with video eye-trackers where the cameras are positioned close
to the eye. The advantage is that no electrodes must be assembled onto the subject, but the eyes must
be visible by the camera. Eye tracking was recently used to control the movement of a car and for
spelling devices that allows selecting characters on the screen.
4.4 EMG
The EMG can be easily recorded by means of either surface electrodes, placed on the skin, or needle
electrodes inserted into the muscle [78]. The frequency response has a wide range, being maximal at
frequencies higher than 30 Hz ([82], [83]). The EMG can be used to monitor motor activities, such as
voluntary foot movement and also spasm or epileptic seizures. Difficult tasks may cause an increase in
EMG activity related to the movement of facial muscles ([84], [85]). Fatigue can be detected by the
degradation of the facial muscle activity ([90], [91]), moreover facial EMG can recognize the facial
expression, such as pleasure, anger and sorrow [91].
When measuring EEG it is important, to remove EMG related artifacts, for example McFarland et al.
examined the presence and characteristics of EMG contamination during new users' initial brain-
computer interface (BCI) training sessions [83]. The methods for dealing with artifacts are the same as
for removing EOG artifacts [81]. EMG can also be used as an input device for human computer
interaction allowing to control prosthetics, and orthotic devices.
4.5 Electrodermal activity (EDA)
There are two parameters that can be monitored with the EDA ([30], [65]), the Skin conductance level
(SCL) and the Skin Conductance Response (SCR).
The range of the skin resistance among subjects is from k to M. Transient responses, related to
sudden changes in psychological state are on the order of 100 [78].
The SCL describes the overall amount of sympathetic arousal, while the SCR reflects transient changes
in conductance [73]. A sampling frequency of 32 Hz is sufficient. Because of the inter-individual
variation of conductance a baseline recording needs to be done before each measurement.
Slater [73] used GSR (Galvanic Skin Response is another wording for SCR) and HR to quantify
breaks-in presence (shut off of the VR simulation during the experiment). The frequency response of
the GSR signal was calculated with a wavelet analysis. GSR parameters and event-related heart rate
changes show the occurrence of breaks in presence. There were also differences in response observed
participants who reported more or less social anxiety.
4.6 Respiration
Persons perform respiration by either using the rib cage or by abdominal movement. Therefore, when
using an elastic belt for recording, it is important to place it according to each person, or to use two

Page 14 of 18
belts to measure both movements. When the signal is measured with a thermal sensor, it has to be
placed that way to measure the airflow from both, the nose and the mouth.
5 Conclusion
In this state of the art document different types of sensors and signals and different kinds of signal
processing has been discussed. As this field is quite huge, the presented signals is just a sketch of what
is available and ready for use in biomedical research and for biomedical applications. Based on the
state of the art sensors will be further developed and signal processing algorithms will be further
improved in order to improve the output of biomedical research and to the usability for medical
diagnosis.
6 References
[1] G. Pfurtscheller, C. Neuper, D. Flotzinger, and M. Pregenzer, EEG-based discrimination between imagination of right
and left hand movement. Electroenceph. clin. Neurophysiol., 1997. 103: p. 642-651.
[2] C. Guger, H. Ramoser, and G. Pfurtscheller, Real-time EEG analysis with subject-specific spatial patterns for a Brain
Computer Interface (BCI). IEEE Trans Neural Syst Rehabil Eng., 2000. 8: p. 447-456.
[3] E.C. Leuthardt, G. Schalk, J.R. Wolpaw, J.G. Ojemann, and D.W. Moran, A brain-computer interface using
electrocorticographic signals in humans. J. Neural Eng., 2004. 1: p. 63-71.
[4] C. Guger, A. Schlögl, C. Neuper, D. Walterspacher, T. Strein, and G. Pfurtscheller, Rapid prototyping of an EEG-based
brain-computer interface (BCI). IEEE Trans. Rehab. Engng., 2001. vol. 9 (1): p. 49-58.
[5] G.R. Muller-Putz, R. Scherer, C. Brauneis, and G. Pfurtscheller, Steady-state visual evoked potential (SSVEP)-based
communication: impact of harmonic frequency components. J.Neural Eng, 2005. 2(4): p. 123-130.
[6] N. Birbaumer, N. Ghanayim, T. Hinterberger, I. Iversen, B. Kotchoubey, A. Kubler, J. Perelmouter, E. Taub, and H.
Flor, A spelling device for the paralysed. Nature, 1999. 398(6725): p. 297-298.
[7] M. Thulasidas, G. Cuntai, and W. Jiankang, Robust classification of EEG signal for brain-computer interface. IEEE
Trans Neural Syst Rehabil Eng., 2006. 14(1): p. 24-29.
[8] G. Pfurtscheller, C. Neuper, C. Guger, B. Obermaier, M. Pregenzer, H. Ramoser, and A. Schlögl, Current trends in Graz
brain-computer interface (BCI) research. IEEE Trans. Rehab. Engng., 2000. vol. 8: p. 216-219.
[9] C. Guger, Real-time data processing under Windows for an EEG-based brain-computer interface. Dissertation,
University of Technology Graz, 1999.
[10] N. Birbaumer, A. Kubler, N. Ghanayim, T. Hinterberger, J. Perelmouter, J. Kaiser, I. Iversen, B. Kotchoubey, N.
Neumann, and H. Flor, The thought translation device (TTD) for completely paralyzed patients. IEEE
Trans.Rehabil.Eng, 2000. 8(2): p. 190-193.
[11] D.J. Krusienski, E.W. Sellers, F. Cabestaing, S. Bayoudh, D.J. McFarland, T.M. Vaughan, and J.R. Wolpaw, A
comparison of classification techniques for the P300 Speller. J.Neural Eng, 2006. 3(4): p. 299-305.
[12] C. Guger, G. Edlinger, W. Harkam, I. Niedermayer, and G. Pfurtscheller, How many people are able to operate an
EEG-based brain computer interface? IEEE Trans. Rehab. Engng., 2003. vol. 11: p. 145-147.
[13] H. Ramoser, J. Muller-Gerking, and G. Pfurtscheller, Optimal spatial filtering of single trial EEG during imagined hand
movement. IEEE Trans Neural Syst Rehabil Eng., 2000. 8(4): p. 441-446.
[14] D.J. McFarland, W.A. Sarnacki, and J.R. Wolpaw, Brain-computer interface (BCI) operation: optimizing information
transfer rates. Biol.Psychol., 2003. 63(3): p. 237-251.
[15] G. Edlinger, G. Krausz, F. Laundl, I. Niedermayer, C. Guger, Architectures of laboratory-PC and mobile pocket PC
brain-computer interfaces. 2nd International IEEE EMBS Conference on Neural Engng, 2005. p. 120 - 123.
[16] E.W. Sellers, D.J. Krusienski, D.J. McFarland, T.M. Vaughan, and J.R. Wolpaw, A P300 event-related potential brain-
computer interface (BCI): the effects of matrix size and inter stimulus interval on performance. Biol.Psychol., 2006.
73(3): p. 242-252.

Page 15 of 18
[17] G. Klem, H. Lüders, H. Jasper, and C. Elger, The ten-twenty electrode system of the International Federation. The
International Federation of Clinical Neurophysiology. Cleveland Clinic Foundation, 1999. 52: p. 3-6.
[18] B. Obermaier, C. Guger, C. Neuper, and G. Pfurtscheller, Hidden Markov Models for online classification of single trial
EEG data. Pattern recognition letters 22, 2001: p. 1299-1309.
[19] C.Neuper, G. Pfurtscheller, C. Guger, B. Obermaier, M. Pregenzer, H. Ramoser, and A. Schlögl, Current trends in Graz
brain-computer interface (BCI) research. IEEE Trans. Rehab. Engng., 2000. vol. 8: p. 216-219.
[20] G. Cuntai, M. Thulasidas, and W. Jiankang. High performance P300 speller for brain-computer interface.
[21] M. Waldhauser, Offline and online processing of evoked potentials. Master thesis, FH Linz, 2006.
[22] E.W. Sellers and E. Donchin, A P300-based brain-computer interface: initial tests by ALS patients. Clin.Neurophysiol.,
2006. 117(3): p. 538-548.
[23] C. Guger, C. Groenegress, C. Holzner, G. Edlinger, and M. Slater. Brain-computer interface for controlling Virtual
Environments. in 2nd international conference on applied human factors and ergonomics. 2008. Las Vegas, USA.
[24] Akselrod. (1981). Akselrod S, Gordon D, Ubel FA, Shannon DC, Barger AC, Cohen RJ. Science , 220--222.
[25] Allison, B. Z., McFarland, J., D., Schalk, G., Zheng, S. D., M., J. M., et al. (2008). Towards an independent brain-
computer interface using steady state visual evoked potentials. Clin Neurophysiol , 399-408.
[26] Bakardjian, H., Tanaka, T., & Cichocki, A. (2010). Optimization of SSVEP brain responses with application to eight-
command Brain–Computer Interface. Neurosci. Lett. , 34-8.
[27] Bigger JT, F. J. (1992). Frequency domain measures of heart period variability and mortality after myocardial
infarction. Circulation , 85:164.
[28] Bin, G., Gao, X., Yan, Z., Hong, B., & Gao, S. (2009). An online multi-channel SSVEP-based brain–computer interface
using a canonical correlation analysis method. Journal of Neural Engineering , 6pp.
[29] Bjökander I, H. C. (1992). Heart rate variability in patients with stable angina pectoris. Eur Heart J. , 379.
[30] Boucsein, W. (1992). Electrodermal Activity. New York: Plenum Press.
[31] C., J. (2006). The enigma of Mayer waves: facts and models. Cardiovasc. Res. , 12-21.
[32] Cevese A., G. G. (2001). Baroreflex and oscillation of heart period at 0.1 Hz studied by alpha-blockade and cross-
spectral analysis in healthy humans. J. Physiol , 235–244.
[33] Citi, L., Poli, R., Cinel, C., & Sepulveda, F. (2008). P300-based BCI mouse with genetically-optimized analogue
control. IEEE Transactions on Neural Systems and Rehabilitation Engineering , 51-61.
[34] Dale R., R. J. (2008). Exploring Action Dynamics as an Index of Paired-Associate Learning. PLoS ONE 3(3) , e1728.
[35] Damen, E., & Brunia, C. (1987). Changes in heart rate and slow brain potentials related to motor preparation and
stimulus anticipation in a time estimation task. Psychophysiology , 700-713.
[36] Danilova, N., Korshunova, S., & Sokolov, E. (1994). Indexes of heart-rate during solving arithmetical tasks in humans.
Zh. Vyssh. Nerv. Deyat , 932-943.
[37] DarwiinRemote. (n.d.). Retrieved from http://sourceforge.net/projects/darwiin-remote/
[38] Decety, J., Jeannerod, M., Germain, M., & Pastene, J. (1991). Vegetative response during imagined movement is
proportional to mental effort. Behav. Brain Res. , 1-5.
[39] Electrophysiology, T. F. (1996). Heart rate variability: standards of measurement, physiological interpretation and
clinical use. Task Force of the European Society of Cardiology and the North American Society of Pacing and
Electrophysiology. Circulation , 1043--1065.
[40] Finkea, A., Lenhardt, A., & Ritter, H. (2009). The MindGame: a P300-based brain-computer interface game. Neural
Networks , 1329-1333.
[41] Florian, G., Stancak, A., & Pfurtscheller, G. (1998). Cardiac response induced by voluntary self-paced finger
movement. International Journal of Psychophysiology , 209-222.
[42] Gao, X., Xu, D., Cheng, M., & S., G. (2003). A BCI-Based Environmental Controller for the Motion-Disabled. IEEE
Trans. Neural Sys. and Rehab. Eng. , 137-140.
[43] Guger, C., Daban, S., Sellers, E., Holzner, C., Krausz, G., Carabalona, R., et al. (2009). How many people are able to
control a P300-based brain-computer interface (BCI)? Neuroscience Letters , 94-98.

Page 16 of 18
[44] Hirsh JA, B. B. (1981). Respiratory sinus arrhythmia in humans: how breathing pattern modulates heart rate. Am J
Physiol , H620-H629.
[45] Hon EH, L. S. (1965). Electronic evaluations of the fetal heart rate patterns preceding fetal death: further observations.
Am J Obstet Gynecol , 814-826.
[46] Kleiger RE, M. J.-I. (1987). Decreased heart rate variability and its association with increased mortality after acute
myocardial infarction. Am J Cardiol , 256-262.
[47] Köhler BU, H. C. (2002). The principles of software QRS detection. IEEE Eng Med Biol Mag. , 42-57.
[48] Krusienski, D., Sellers, E., Cabestaing, F., Bayoudh, S., McFarland, D., Vaughan, T., et al. (2006). A comparison of
classification techniques for the P300 Speller. Journal of Neural Engineering , 299-305.
[49] Lin Z., Zhang C., Wu W., & X., G. (2006). Frequency recognition based on canonical correlation analysis for SSVEP-
based BCIs. IEEE Trans Biomed Eng. , 2610-2614.
[50] Luczak H, L. W. (1973). An analysis of heart rate variability. Ergonomics , 85-97.
[51] Malik M, F. T. (1989). Camm AJ. Heart rate variability in relation to prognosis after myocardial infarction: selection of
optimal processing techniques. Eur Heart J. , 1060-1074.
[52] Middendorf, M., McMillan, G., Calhoun, G., & Jones, K. S. (2000). Brain-computer interfaces based on the steady-state
visual-evoked response. IEEE Transactions on Rehabilitation Engineering , 211-214.
[53] Müller-Putz, G. R., Scherer, R., Brauneis, C., & Pfurtscheller, G. (2005). Steady-state visual evoked potential (SSVEP)-
based communication: impact of harmonic frequency components. Journal of Neural Engineering , 1-8.
[54] Oishi, K., Kasai, T., & Maeshima, T. (2000). Autonomic response specificity during motor imagery. J. Physiol.
Anthropol. Appl. Hum. Sci. , 255-261.
[55] Penaz J, R. J. (1968). Spectral Analysis of Some Spontaneous Rhythms in the Circulation. Leipzig: Biokybernetik, Karl
Marx University.
[56] Pfurtscheller G., L. d. (1999). Event-related EEG/MEG synchronization and desynchronization: basic priciples. Clinical
Neurophysiology , 1842-1857.
[57] Pfurtscheller, G., & Aranibar, A. (1977). Event-related cortical desynchronization detected by power measurements of
scalp EEG. Clinical Neurophysiology , 817-826.
[58] Pfurtscheller, G., & Neuper, C. (1997). Motor imagery activates primary sensorimotor area in humans. Neuroscience
Letters , 65-68.
[59] Sayers, B. (1973). Analysis of heart rate variability. Ergonomics , 17-32.
[60] Scherer P, O. J.-W. (1993). Definition of a new beat-to-beat parameter of heart rate variability. PACE Pacing Clin
Electrophysiol , 16:939.
[61] Scherer, R., Müller-Putz, G. R., & Pfurtscheller, G. (2007). Self-initiation of EEG-based brain-computer
communication using the heart rate response. Journal of Neural Engineering , L23-L29.
[62] Slater, M., Antley, A., Davison, A., Swapp, D., Guger, C., Barker, C., et al. (2006). A Virtual Reprise of the Stanley
Milgram Obedience Experiments. PLoS ONE , e39.
[63] Sutton, S., Braren, M., Zubin, J., & John, E. R. (1965). Evoked-Potential Correlates of Stimulus Uncertainty. Science ,
1187-1188.
[64] Taylor J.A., C. D. (1998). Mechanisms underlying very-low-frequency RR-interval oscillations in humans. Circulation ,
547–555.
[65] Venables, P. (1978). Psychophysiology and Psychometrics. Psychophysiology , 302-315.
[66] WiinRemote. (n.d.). Retrieved from http://onakasuita.org/wii/index-e.html
[67] Zhang, D., Maye, A., Gao, X., B., H., Engel, A. K., & Gao, S. (2010). An independent brain-computer interface using
covert non-spatial visual selective attention. J Neural Eng. , 16010. Epub 2010 Jan 19.
[68] de Boer RW, Karemaker JM, Strackee J 1985 Description of heart rate variability data in accordance with a
physiological model for the genesis of heartbeats. Psychophysiology 22:147-155
[69] Pfurtscheller, G., Leeb, R. and Slater, M. (2006) Cardiac responses induced during thought-based control of a virtual
environment, International Journal of Psychophysiology 62(1), 134-140

Page 17 of 18
[70] Einbrodt, Über den Einfluß der Atembewegung auf Herzschlag und Blutdruck, Sber. Akad. Wiss. Wien; Math. Nat. Kl.,
2. Abt., 40 (1860), S. 361-418
[71] Eckberg DL. Human sinus arrhythmia as an index of vagal cardiac outflow. J Appl Physiol. 1983;54:961–966.
[72] Guger C., Krausert S., Domej W., Edlinger G., Tannheimer M., "EEG, ECG and oxygen concentration changes from
sea level to a simulated altitude of 4000m and back to sea level" Neuroscience Letters, 2008 , Volume 442, Issue 2: pp
123-127
[73] Slater M., Guger C., Edlinger G., Leeb R., Pfurtscheller G., Antley A., Garau M., Brogni A., Friedman D., "Analysis of
Physiological Responses to a Social Situation in an Immersive Virtual Environment", Presence: Teleoperators & Virtual
Environments October 2006, Vol. 15, No. 5: 553-569.
[74] Wolpaw J. R., Birbaumer N., McFarlanda D.J., Pfurtscheller G., Vaughan T. M.,” Brain–computer interfaces for
communication and control”, Clinical Neurophysiology, Volume 113, Issue 6, Pages 767-791 (June 2002)
[75] Friman, O., Volosyak, I., Graser, A.: Multiple channel detection of Steady-State Visual Evoked Potentials for brain-
Computer interfaces. IEEE Transactions on Biomedical Engineering, 54, 742--750, (2007).
[76] Vallabhaneni A., “Motor imagery task classification for brain computer interface applications using spatiotemporal
principle component analysis”. Neurol Res. 2004 Apr ;26 (3):282-7 15142321 Cit:5
[77] Müller-Gerking, J., Pfurtscheller, G., Flyvbjerg, H. (1999). „Designing optimal spatial filtering of single trial EEG
classification in a movement task”. Clinical Neurophysiology, 110:787–798, 1999.
[78] Kamp, A., Pfurtscheller, G. Polygraphy. In: Niedermeyer, E., Lopes da Silva, F. (eds.). Electroencephalography Basic
Principles, Clinical Applications, and Related Fields. Third Edition, 1993, Williams and Wilkins, Baltimore, Maryland.
[79] Boucsein, W. Electrodermal Activity. New York: Plenum Press, 1992
[80] Solis-Escalante T, Müller-Putz G, Pfurtscheller G. Overt foot movement detection in one single Laplacian EEG
derivation. J. Neurosci Methods 2008 175(1):148-53
[81] Fatourechi M, Bashashati A, Ward RK, Birch GE. EMG and EOG artifacts in brain computer interface systems: A
survey. Clin Neurophysiol. 2007 Mar;118(3):480-94
[82] Anderer P, Roberts S, Schlogl A, Gruber G, Klosch G, Herrmann W, et al. Artifact processing in computerized analysis
of sleep EEG – a review. Neuropsychobiology 1999;40:150–7.
[83] McFarland DJ, McCane LM, David SV, Wolpaw JR. Spatial filter selection for EEG-based communication.
Electroencephalogr Clin Neurophysiol 1997;103:386–94.
[84] Cohen BH, Davidson RJ, Senulis JA, Saron CD, Weisman DR. Muscle tension patterns during auditory attention. Biol
Psychol, 1992;33:133–56.
[85] Waterink W, van Boxtel A. Facial and jaw-elevator EMG activity in relation to changes in performance level during a
sustained information processing task. Biol Psychol 1994;37:183–98.
[86] Venables, P. "Psychophysiology and Psychometrics." Psychophysiology, 1978: 302-315.
[87] McFarland DJ, Sarnacki WA, Vaughan TM, Wolpaw JR. Brain–computer interface (BCI) operation: signal and noise
during early training sessions. Clin Neurophysiol 2005;116:56–62.
[88] Elbert T, Rockstroh B, Lutzenberger W, Birbaumer N. Biofeedback of slow cortical potentials. Electroenceph clin
Neurophysiol 1980;48:293–301.
[89] Pfurtscheller, G. & Neuper, C. Motor imagery and direct brain-computer communication Proceedings of the IEEE,
2001, 89, 1123-1134
[90] Veldhuizen, I. J. T., Gaillard, A. W. K., and de Vries, J., "The influence of mental fatigue on facial EMG activity during
a simulated workday," Biological Psychology, 63(1): 59-78, 2003.
[91] Huang, C.N., Chen, C. H., Chung, H. Y., The Review of Applications and Measurements in Facial Electromyography,
Journal of Medical and Biological Engineering, 25(1): 15-20, 2004.
[92] Camurri, A., Mazzarino, B., Ricchetti, M., Timmers, R., & Volpe, G. (2004). Multimodal analysis of expressive gesture
in music and dance performances. Lecture Notes in Computer Science, 20–39.
[93] Camurri, A., Volpe, G., De Poli, G., & Leman, M. (2005). Communicating expressiveness and affect in multimodal
interactive systems. IEEE Multimedia, 12(1), 43–53.
Page 18 of 18
[94] Benford, S., Greenhalgh, C., Reynard, G., Brown, C., & Koleva, B. (1998). Understanding and constructing shared
spaces with mixed-reality boundaries. ACM Transactions on Computer-Human Interaction (TOCHI), 5(3), 185–223.
[95] Tang, A., Biocca, F., & Lim, L. (2004). Comparing differences in presence during social interaction in augmented
reality versus virtual reality environments: An exploratory study. Paper presented at the 7th Annual International
Workshop on Presence, Valencia, Spain.
[96] Maes, P., Darrell, T., Blumberg, B., & Pentland, A. (1997). The ALIVE system: Wireless, full-body interaction with
autonomous agents. ACM Multimedia Systems, 5(2), 105–112.
[97] Modler, P., Myatt, T., & Saup, M. (2003). An experimental set of hand gestures for expressive control of musical
parameters in real time. Paper presented at the 2003 Conference on New Interfaces for Musical Expression, Montreal,
Quebec, Canada.
[98] Mathews Z, Bermúdez i Badia S, Verschure PFMJ. A Novel Brain-Based Approach for Multi-Modal Multi-Target
Tracking in a Mixed Reality Space. INTUITION - International Conference and Workshop on Virtual Reality 2007.
Athens, Greece 2007.